Abstract
Surface pitting is a key postharvest disorder in sweet cherries (Prunus avium L.) that reduces visual quality and shortens shelf life. A three-year study evaluated 35 sweet cherry accessions (32 breeding lines, 3 cultivars) to assess the role of genotype, fruit quality traits, and storage treatments in minimizing pitting damage. Mechanical damage-induced surface pitting was quantified using a resistance index (RI), which ranged from 1.31 ± 0.26 (‘10072’) to 2.72 ± 0.45 (‘16806’), highlighting strong genotypic differences. Fruit firmness showed a strong negative correlation with the resistance index (RI) (r = −0.606). In contrast, soluble solids content (SSC) and fruit size had weak or non-significant correlations with RI, with correlation coefficients of r = −0.022 and r = −0.070, respectively. Only in the second harvest, ultra-low oxygen (ULO) storage resulted in the lowest RI (2.35 ± 0.13). Pre- and post-treatment with 1-methylcyclopropene (1-MCP) gave similar results (2.50 ± 0.06 and 2.50 ± 0.15). Ozone pre-treatment was moderately effective (2.66 ± 0.14). Ozone post-treatment had the highest RI (2.85 ± 0.08). The results emphasize the importance of applying protective treatments prior to mechanical damage-induced surface pitting and selecting genotypes with high firmness and storage stability. This study provides a comprehensive framework for breeding and storage conditions aimed at reducing surface pitting in sweet cherries.
1. Introduction
Sweet cherry (Prunus avium L.) is a high-value fruit crop with increasing global relevance due to consumer demand for fresh produce with attractive appearance, firmness, and flavor. However, its short marketing window and highly perishable nature make postharvest handling particularly challenging. Sweet cherries exhibit high respiration rates and are sensitive to both microbial spoilage and mechanical damage, which often occur during harvest, transport, or distribution chains [1,2].
One of the most important postharvest disorders affecting sweet cherry marketability is surface pitting—a physiological defect characterized by small indentations on the fruit surface. These symptoms not only reduce visual quality but also accelerate decay by facilitating microbial entry and moisture imbalance, thereby shortening shelf life [3,4,5,6,7,8,9,10,11]. In commercial supply chains, pitting affects up to 80% of transported fruit and frequently exceeds the incidence of fungal infections such as Penicillium rot, leading to significant economic losses [5].
Surface pitting usually occurs when cherries are exposed to mechanical stress, such as impact or compression during harvest and handling [12,13,14,15,16]. These stresses can cause microcracks and disrupt cell structure, which leads to tissue collapse. The risk of pitting also depends on the thickness and firmness of the skin and on environmental factors, such as temperature changes or heat during distribution [17,18,19,20,21,22,23,24,25,26,27,28]. At the cellular level, surface pitting is associated with water loss, membrane degradation, and the enzymatic breakdown of pectin and other structural polysaccharides, driven by enzymes such as pectin methylesterase and polygalacturonase [29,30,31]. Abiotic stress factors such as osmotic imbalance and ethylene accumulation following injury further compromise membrane integrity and accelerate senescence [32,33,34,35,36,37].
Postharvest management strategies are key to mitigating surface pitting and preserving fruit quality. Although refrigeration slows senescence, excessively low temperatures can increase tissue sensitivity to mechanical stress [24,25,26]. Humidity must be carefully regulated to reduce dehydration while avoiding microbial proliferation [38,39]. Modified atmosphere packaging (MAP) and ultra-low oxygen (ULO) storage reduce oxygen availability and increase carbon dioxide concentrations, thereby suppressing respiration and ethylene activity [40,41,42,43,44,45,46]. Specific gas combinations, such as 10% CO2 with 5% O2, have shown efficacy in preserving firmness and reducing decay during long-term storage [47,48].
In addition to environmental control, both pre- and postharvest treatments are increasingly used to enhance fruit resilience. Preharvest applications of calcium, GABA, and growth regulators have been shown to strengthen tissue structure and reduce pitting incidence [49,50]. Hydrogen sulfide or melatonin can mitigate oxidative stress and improve cell wall integrity [51,52]. Promising results have also been obtained with ozone and 1-methylcyclopropene (1-MCP), which act by inhibiting microbial growth and ethylene sensitivity, respectively [53,54,55]. The protective effect of these treatments is influenced by packaging type, with modified atmosphere packaging (MAP) offering additional buffering against mechanical damage [56,57].
Although recent studies have advanced the understanding of sweet cherry surface pitting, they typically focus on a limited number of cultivars or specific aspects of the disorder. For example, Ponce [20] characterized biochemical changes following induced pitting in a few cultivars but did not address practical storage scenarios or varietal breadth. Similarly, Nuñez-Lillo [58] used proteomic tools to analyze pitting susceptibility, yet evaluated only two contrasting genotypes and did not test storage treatments or preharvest quality factors. Lahaye [59] compared cell wall evolution in cherries versus apples but did not assess storage performance or mechanical injury. These studies contributed important physiological insights but lacked integration of treatment efficacy across a genetically diverse population under commercial-like conditions.
This study expands on prior work by performing a three-year analysis across 35 sweet cherries with diverse genetic backgrounds and evaluating the combined influence of genotype, harvest maturity, fruit quality parameters, and multiple postharvest storage conditions (MAP, ULO, ozone, and 1-MCP). By analyzing interactions between intrinsic fruit traits (firmness, size, soluble solids) and environmental treatments, the study offers an applied framework to optimize cultivar-specific postharvest strategies. This integrative approach provides a novel contribution by bridging the gap between physiological susceptibility and practical storage responses, a dimension largely absent from earlier research.
2. Materials and Methods
2.1. Plant Material and Site Description
The study was conducted over three seasons (2019–2021) in an experimental sweet cherry orchard located in Holovousy, Eastern Bohemia, Czech Republic (50.383629° N, 15.576902° E, 360 m a.s.l.). The site has a long-term mean annual temperature of 8.4 °C and average precipitation of 663.5 mm [60]. The orchard lies within a moderately warm and moderately humid agro-climatic zone on a gentle south-facing slope. Trees were grafted on Gisela 5 rootstock and planted in 2008 at a spacing of 5 × 1.5 m. Trees were trained as free spindles and managed without covering systems or irrigation.
2.2. Orchard Management and Fertilization
Conventional horticultural practices were used throughout the orchard. Inter-row spaces were managed as permanent grass strips, mowed or mulched periodically. Tree rows were kept weed-free with herbicides. Trees were pruned annually before flowering. Fertilization included annual application of LAV 27 (1.1 q/ha) and foliar treatments with DAM 390 (3 L/ha twice, 4.7 L/ha three times) and STOPIT (10 L/ha twice) during fruit ripening.
2.3. Experimental Design and Genotypes
The experiment aimed to evaluate the effect of storage conditions and fruit quality parameters on surface pitting across 32 sweet cherry accessions from the VSUO Holovousy breeding program. The breeding accessions were selected based on multi-year evaluations of key fruit quality parameters (size, soluble solids content, firmness, color) and preliminary data on postharvest performance, including susceptibility or resistance to surface pitting observed in small-scale storage trials. Selection was further informed by feedback and requirements from commercial growers, who tested certain genotypes in regional plantings for potential market introduction. The resulting set represents a broad spectrum of phenotypic diversity and commercial potential across different climatic zones. The primary aim was to compare this diverse set of genotypes under standardized postharvest conditions with recognized commercial standards. Additionally, three well-established cultivars—‘Van’, ‘Regina’, and ‘Sweetheart’—were included as reference genotypes due to their known contrasting susceptibility to surface pitting [5]. ‘Van’ was used as a resistant control, while ‘Regina’ and ‘Sweetheart’ represented susceptible standards. Over three seasons, surface pitting incidence was assessed in all accessions. In the final year, four accessions (‘13804’, ‘16732’, ‘Sweetheart’, ‘Regina’) were selected for detailed evaluation of storage effects. Ultimately ‘13804’ was selected because it is among the highly sensitive genotypes to surface pitting. Accession ‘16732’ was selected as the representative bicolored genotype due to its demonstrated resistance to surface pitting in preliminary trials and its unique commercial potential as the only bicolored cultivar from the VSUO program. Its inclusion was further supported by the interest of international growers in testing its postharvest performance, ensuring that the results address both breeding objectives and global industry needs for optimized handling of bicolored sweet cherry cultivars. For ‘Tamara’, the comparison of ozone and 1-MCP (pre- and post-treatment) with ULO was performed after induced mechanical damage-induced surface pitting during the second harvest period. ‘Tamara’ was selected for this comparison because it is the most widely cultivated cultivar from the VSUO breeding program and is commonly used for long-distance transport and commercial storage worldwide.
2.4. Harvest Periods and Maturity Assessment
Fruits were harvested during two harvest periods, evaluated visually using the PNW Dark Sweet Cherry Development Index (Oregon State University, USA). The first harvest period, three days before estimated commercial maturity, represented fruit that was already marketable but still physiologically active, allowing for the assessment of treatment efficacy under more sensitive conditions. The second harvest period corresponded to commercial harvest maturity, representing the typical ripening stage used in practice. In the first period, fruits reached a shade of 2–3, while in the second, they reached 4–6. Color varied across genotypes, including one with bicolored fruit.
The use of two distinct harvest periods allowed us to investigate how physiological maturity at harvest affects fruit sensitivity to surface pitting and responsiveness to postharvest treatments. This approach reflects real-world variation in harvest period and its practical implications for maintaining fruit quality during transport and storage.
2.5. Sample Selection and Fruit Preparation
To evaluate fruit quality and storage condition effects, separate samples were collected. Three biological replicates of 50 fruits each were harvested for each storage condition. Additionally, one set of 50 fruits per accession was harvested immediately after picking to assess initial fruit quality. Only visually defect-free fruit of uniform size were selected to minimize bias associated with size-dependent variation in firmness and physiological response. All samples were pre-cooled at 4 °C and 85% RH for 4 h prior to experimentation.
2.6. Fruit Quality Measurements
Soluble solids content (SSC) (°Brix), fruit firmness (g/mm), and fruit size (mm) were measured at 20 ± 2 °C on 50 fruits per accession immediately after harvest. A digital refractometer (HI 96801, Hanna Instruments, Woonsocket, RI, USA) was used for SSC. Firmness and size (equatorial diameter) were measured on the cheek of the fruit, on the right side of the suture, using a penetrometer (Winterwood Instruments, Agro Technologie, Saint-Jean-de-Braye, Loiret (FR-45), France) with a 6 mm tip applied to the right cheek of the fruit.
2.7. Induction of Mechanical Damage-Induced Surface Pitting
Mechanical injury was simulated using a digital force gauge (ZTA 20N, Northbrook, IL, IMADA, USA) with a 5 mm tip. The 5 mm probe diameter was selected as it represents the industry-standard tip size for texture analysis in sweet cherry research, consistent with common penetrometer configurations for fruit firmness testing. A constant force of 0.5 N was applied manually to the right cheek of each fruit, pressing the fruit against the fixed probe. The 0.5 N force was empirically determined through preliminary trials to induce subcritical mechanical stress—sufficient to initiate surface pitting while avoiding cuticular rupture in even the softest genotypes. The application rate was not standardized, as the method focused on consistent pressure. The test was performed on 50 fruits per treatment and repeated in three biological replicates per condition. This method mimicked realistic mechanical stresses during commercial handling and was chosen for its reproducibility.
2.8. Storage Condition
Following damage induction, fruits were stored at 1.5 °C and 85% RH for 21 days under the following conditions:
MAP: X-tend bags (StePac, Tefen, Northern District, Israel) creating low O2/high CO2 atmosphere (17% O2/3% CO2), as per manufacturer’s certification for sweet cherry.
ULO: 1% O2 and 2% CO2 in controlled atmosphere boxes.
Ozone and 1-MCP Treatments: Fruits were exposed to ozone (0.2 ppm) or 1-MCP (0.0016 g/m3) for 8 h either before or after mechanical damage-induced surface pitting, then stored under MAP conditions. The 1-MCP concentration corresponds to commercial protocols for Prunus species (0.5–1.0 ppm). These are referred to as pre-treatment or post-treatment, respectively.
2.9. Damage Assessment and Resistance Index
After storage, fruits were visually scored for surface pitting using a 4-point scale (1: no visible damage, 4: severe damage) as described by Kappel et al. [5] (Figure 1). Fruits with no visible damage were scored as 1, those with mild surface indentations as 2, moderate pitting as 3, and extensive or deep pitting as 4. A trained assessor evaluated all the fruits. Based on this classification, a resistance index was calculated as
where n1 to n4 are the number of fruits in each damage category, and P is the total number of fruits assessed. This index served as the main indicator of resistance to surface pitting [61].
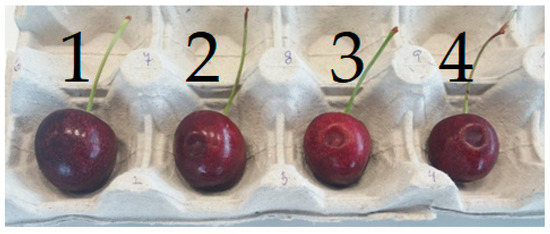
Figure 1.
Classification of fruits into categories 1–4 (from left to right) according to the degree of damage during the evaluation.
2.10. Statistical Analysis
All statistical analyses were conducted using Python 3.11.4 within the IDLE development environment, utilizing libraries such as NumPy, SciPy, pandas, and statsmodels. Data visualization was performed using seaborn and matplotlib to ensure clear representation of results.
Descriptive statistics were calculated for all variables, including means, medians, standard deviations, minimums, maximums, and quartiles. These statistics were stratified by accession, harvest period, and year to provide an overview of data distribution and variability.
To evaluate the effects of accession, harvest period, fruit quality parameters, and storage condition on surface pitting resistance, a mixed linear model (LMM) was employed. The dependent variable was the resistance index, calculated based on visual assessments of surface pitting severity. Fixed effects included harvest period, fruit firmness, fruit size, and soluble solids content. Random effects accounted for variability between accessions and across years.
Model diagnostics were performed to validate the assumptions of the LMM:
Normality of residuals was assessed using the Shapiro–Wilk test.
Homoscedasticity (constant variance) was evaluated using Levene’s test.
Multicollinearity among predictors was examined using variance inflation factors (VIFs).
Influential observations were identified using Cook’s distance.
Spearman’s rank correlation coefficients were calculated to assess relationships between fruit quality parameters (firmness, size, SSC) and the resistance index. Correlation heatmaps with significance levels (p < 0.05) were generated to visualize these relationships.
Non-parametric tests were used where appropriate:
The Mann–Whitney U test was applied to compare fruit composition between harvest periods.
Kruskal–Wallis tests were conducted to assess differences among accessions, followed by post hoc pairwise comparisons with Bonferroni correction to account for multiple testing.
3. Results
3.1. Genotypic Variability
Fruit firmness exhibited substantial variation across the evaluated sweet cherry accessions (p < 0.001). The mean firmness ranged from 177.14 ± 10.16 g/mm in accession ‘16692’—the softest—to 239.85 ± 7.16 g/mm in ‘10072’, which also showed the highest resistance to pitting (Figure 2). Several accessions consistently displayed firm texture, including ‘16805’ (228.47 ± 34.03 g/mm), ‘13467’ (227.52 ± 10.79 g/mm), and ‘16797’ (224.39 ± 33.51 g/mm). In contrast, among the least firm were accessions ‘12769’ (184.26 ± 8.01 g/mm), ‘16678’ (185.98 ± 13.00 g/mm), and ‘16700’ (186.58 ± 19.66 g/mm).
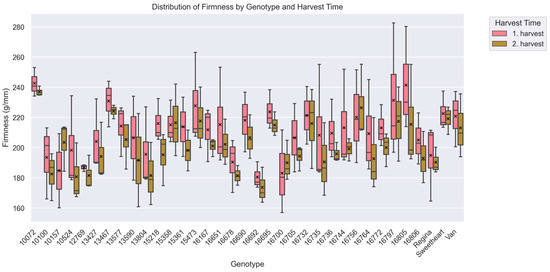
Figure 2.
Distribution of fruit firmness (g/mm) across cherry accessions and harvest periods (Kruskal–Wallis analysis of variance; p < 0.05). The x-axis represents individual accessions, while the y-axis shows median of fruit firmness. Boxplots are grouped by harvest period, with pink representing the 1st harvest and green representing the 2nd harvest. Over 1700 data points were used to generate the box plot. The boxes represent the interquartile range (IQR), which includes 50% of the values between the first quartile (Q1) and the third quartile (Q3). The median is shown as a horizontal line within the box. Data range: Whiskers extend from the lower quartile (Q1) to the lowest value that is not considered an outlier, and from the upper quartile (Q3) to the highest value that is not considered an outlier. This typically includes values within 1.5 times the IQR. Individual points outside the whiskers are outliers that are more than 1.5 times the IQR of the lower or upper quartile. These values are considered to be unusual or extreme. Mean values are indicated by a black “x” symbol.
When compared with reference cultivars, these genotypic differences remained evident. ‘Regina’ exhibited a firmness of 192.65 ± 17.62 g/mm, while ‘Sweetheart’ and ‘Van’ recorded values of 220.92 ± 10.30 g/mm and 217.00 ± 18.27 g/mm, respectively. A total of six accessions surpassed ‘Sweetheart’ in firmness, nine outperformed ‘Van’, and 27 outperformed ‘Regina’. Notably, accession ‘10072’ exceeded all three cultivars in both firmness and resistance, with the Tukey HSD test (p < 0.05) confirming its superiority in each evaluated year.
Following this, fruit size also demonstrated substantial variation among the 35 accessions (p < 0.001). Mean fruit diameter ranged from 23.58 ± 2.50 mm in accession ‘16772’ (RI = 2.28)—the smallest—to 27.40 ± 1.36 mm in accession ‘10524’ (RI = 2.17) (Figure 3). Genotypes such as ‘16735’ (27.33 ± 1.62 mm, RI = 2.09), ‘10100’ (27.25 ± 2.22 mm, RI = 2.20), and ‘16805’ (26.90 ± 4.06 mm, RI = 1.76) consistently produced larger fruit. In contrast, smaller fruit were observed in genotypes including ‘13590’ (24.01 ± 2.17 mm, RI = 2.53), ‘Van’ (23.74 ± 2.36 mm, RI = 2.07), and again ‘16772’ (23.58 ± 2.50 mm, RI = 2.28).
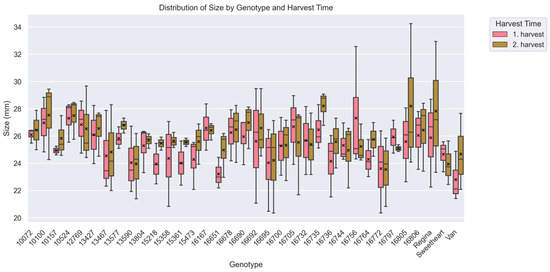
Figure 3.
Distribution of fruit size (mm) across cherry accessions and harvest periods (Kruskal–Wallis analysis of variance; p < 0.05). The x-axis represents individual accessions, while the y-axis shows median of fruit size. Boxplots are grouped by harvest period, with pink representing the 1st harvest and green representing the 2nd harvest. Over 1700 data points were used to generate the box plot. Each boxplot displays the median, interquartile range (IQR), and variability within each accession for both harvest periods. Mean values are indicated by a black “x” symbol. For a description of how the box plot was generated see Figure 2.
The reference cultivars positioned within the mid-range of size variation, with ‘Regina’ averaging 26.85 ± 3.85 mm (RI = 2.37), ‘Sweetheart’ at 24.31 ± 1.31 mm (RI = 2.14), and ‘Van’ at 23.74 ± 2.36 mm (RI = 2.07). A total of 29 accessions exceeded the size of ‘Sweetheart’, and four were larger than ‘Regina’. Accession ‘10072’ (RI = 1.31) also ranked high in this parameter, significantly surpassing both ‘Sweetheart’ and ‘Van’ in size (26.27 ± 0.99 mm; p < 0.05).
Subsequent analysis of soluble solids content (SSC) revealed further genotypic variation (H = 568.89, p < 0.001). The mean SSC values ranged from 12.44 ± 1.58 in accession ‘15218’ (RI = 2.21)—the lowest—to 16.23 ± 4.42 in ‘16732’ (RI = 1.80), which also exhibited the highest variability (Figure 4). Genotypes with high SSC values included ‘Sweetheart’ (15.85 ± 2.28, RI = 2.14), ‘10100’ (15.67 ± 2.57, RI = 2.20), and ‘Regina’ (15.57 ± 4.22, RI = 2.37). On the opposite end, ‘13467’ (12.87 ± 2.00, RI = 1.87), ‘13590’ (12.47 ± 2.34, RI = 2.53), and ‘15218’ (12.44 ± 1.58, RI = 2.21) were among those with the lowest SSC levels.
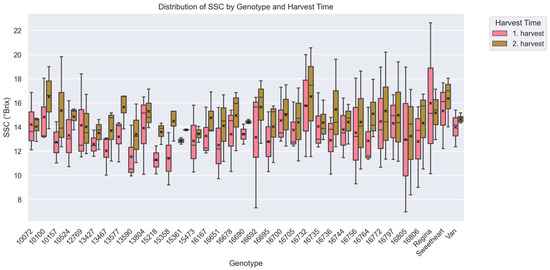
Figure 4.
Soluble solids content distribution (°Brix) across cherry accessions and harvest periods (Kruskal–Wallis analysis of variance; p < 0.05). The x-axis represents individual accessions, while the y-axis shows the median of soluble solids content. Boxplots are grouped by harvest period, with pink representing the 1st harvest and green representing the 2nd harvest. Over 1700 data points were used to generate the box plot. Each boxplot displays the median, interquartile range (IQR), and variability within each accession for both harvest periods. Mean values are indicated by a black “x” symbol. For a description of how the box plot was generated see Figure 2.
Accession ‘10072’ had the highest firmness and resistance, but its SSC was moderate (14.13 ± 1.68). This value was lower than in ‘Sweetheart’, ‘Regina’, ‘Van’, and ‘10100’ (Figure 4). Only ‘16732’ had a higher SSC than ‘Sweetheart’. Three accessions—‘16732’, ‘10100’, and ‘Sweetheart’—had higher SSC than ‘Regina’. Ten accessions had higher SSC than ‘Van’. These results show the wide range of SSC values in the population.
3.2. Harvest Period Dynamics
Harvest periods influenced several fruit quality traits across accessions. Overall, the average fruit firmness declined from 210.11 ± 25.46 g/mm in the first harvest to 201.31 ± 20.99 g/mm in the second (p < 0.001), indicating a softening trend with advanced maturity (Table 1). While some genotypes exhibited notable stability—such as ‘13577’, which maintained firmness from 214.33 ± 26.80 g/mm to 205.38 ± 31.94 g/mm (p > 0.05)—others displayed larger declines (Figure 2). For example, accession ‘16805’ showed a marked reduction from 241.47 ± 38.45 g/mm to 215.46 ± 37.94 g/mm (p > 0.05). Among reference cultivars, firmness consistently decreased across harvests: ‘Van’ dropped from 220.88 ± 26.92 g/mm to 213.13 ± 26.84 g/mm, ‘Regina’ from 194.89 ± 30.28 g/mm to 190.42 ± 20.42 g/mm, and ‘Sweetheart’ from 223.32 ± 30.50 g/mm to 219.04 ± 35.28 g/mm (all p > 0.05). Accession ‘16806’, the softest overall, declined significantly (p < 0.05) from 205.08 ± 21.23 g/mm to 193.12 ± 21.72 g/mm. In contrast, ‘10072’ retained the highest firmness across both harvests (241.98 ± 31.03 g/mm and 236.97 ± 27.96 g/mm, p > 0.05), closely followed by ‘13467’, which also remained firm (230.67 ± 26.26 g/mm and 223.92 ± 21.47 g/mm, p > 0.05).

Table 1.
Comparison of key qualitative parameters in sweet cherry fruits across two harvest periods. The table summarizes mean values and standard deviations (SD) for fruit firmness, fruit size, soluble solids content (SSC), and resistance index. Statistical significance between harvests was evaluated using Mann–Whitney tests, with p-values provided for each parameter (p < 0.05 indicates significant differences).
Fruit size trends showed an inverse pattern. The average size across all accessions increased slightly from 25.32 ± 2.22 mm to 25.86 ± 2.23 mm between the first and second harvests (p < 0.001) (Table 1). Certain accessions such as ‘16700’ exhibited high size consistency (25.27 ± 2.43 mm vs. 25.33 ± 2.26 mm, p > 0.05). Conversely, ‘16805’ experienced a statistically significant enlargement from 25.59 ± 2.71 mm to 28.20 ± 4.67 mm (p < 0.001). Among reference cultivars, ‘Van’ increased from 22.81 ± 2.18 mm to 24.68 ± 2.86 mm (p < 0.001), ‘Regina’ from 25.88 ± 3.13 mm to 27.83 ± 4.23 mm (p < 0.001), while ‘Sweetheart’ remained stable, showing only a minor decline from 24.64 ± 1.63 mm to 24.50 ± 3.57 mm (Figure 3). Accession ‘10072’ consistently ranked among the largest, with values of 26.07 ± 1.74 mm and 26.44 ± 3.53 mm, respectively.
Soluble solids content (SSC) exhibited an overall increasing trend between harvests. The mean SSC rose significantly from 13.44 ± 2.77 °Brix to 14.67 ± 2.32 °Brix (p < 0.001) (Table 1). Accessions such as ‘16700’ showed notable stability, with values of 14.56 ± 2.43 °Brix and 14.73 ± 1.99 °Brix (p > 0.05), while ‘16805’ displayed a marked increase from 11.34 ± 4.48 °Brix to 13.11 ± 4.28 °Brix (p < 0.001). Similar increases were recorded among reference cultivars: ‘Van’ from 13.58 ± 1.96 °Brix to 14.75 ± 1.44 °Brix (p < 0.05), ‘Regina’ from 14.17 ± 4.55 °Brix to 15.14 ± 2.09 °Brix (p < 0.001), and ‘Sweetheart’ from 14.24 ± 2.75 °Brix to 16.10 ± 2.03 °Brix (p < 0.01). In contrast, accession ‘10072’ showed relatively stable but lower SSC values (13.82 ± 12.47 °Brix and 13.96 ± 1.51 °Brix, p > 0.05), ranking among the least sweet genotypes evaluated (Figure 4).
3.3. Interannual Stability
Temporal comparisons across growing seasons revealed substantial interannual variation in fruit firmness among the evaluated accessions (p < 0.001). The average firmness in 2019 was 194.77 ± 17.81 g/mm, which increased markedly in 2020 to 224.59 ± 21.89 g/mm, before decreasing again in 2021 to 198.90 ± 19.58 g/mm (Table 2). Despite this variation, several accessions maintained consistent firmness levels. For example, accession ‘10072’ showed stable firmness values of 237.51 ± 5.87 g/mm in 2019, 243.21 ± 6.29 g/mm in 2020, and 237.82 ± 6.29 g/mm in 2021, with a resistance index of 1.31 ± 0.26—the lowest in the dataset. In contrast, accession ‘16805’ exhibited a more pronounced change in firmness, with values of 206.22 ± 14.62 g/mm in 2019, peaking at 267.74 ± 11.45 g/mm in 2020, and decreasing to 211.44 ± 13.28 g/mm in 2021; its resistance index averaged 1.76 ± 0.73.
Table 2.
Comparison of key qualitative parameters in sweet cherry fruits across three years. The table summarizes mean values and standard deviations (SD) for fruit firmness, fruit size, soluble solids content (SSC) and resistance index. Statistical significance between years was evaluated using Mann–Whitney tests, with p-values provided for each parameter (p < 0.05 indicates significant differences).
Standard cultivars showed variable trends: ‘Sweetheart’ maintained moderately stable firmness levels ranging from 213.74 ± 9.56 g/mm (2019), 226.14 ± 11.10 g/mm (2020), to 222.88 ± 10.33 g/mm (2021) (mean RI = 2.14 ± 0.35), while ‘Van’ increased from 204.13 ± 11.83 g/mm to 229.67 ± 12.01 g/mm in 2020, then dropped to 217.20 ± 13.94 g/mm in 2021 (RI = 2.07 ± 0.22). ‘Regina’, by contrast, exhibited greater variability, with firmness values fluctuating from 176.63 ± 15.44 g/mm (2019) to 206.84 ± 17.90 g/mm (2020), and 194.47 ± 13.51 g/mm (2021) (RI = 2.37 ± 0.51). Accession ‘16806’, the most susceptible genotype based on RI (2.72 ± 0.45), also showed wide firmness variation—from 192.70 ± 17.34 g/mm in 2019 to a peak of 280.32 ± 18.72 g/mm in 2020, followed by a decline to 212.18 ± 20.21 g/mm in 2021. Although this accession did not differ significantly from ‘Regina’ in any year, it consistently displayed significantly lower firmness than ‘10072’ (p < 0.001), and was also significantly softer than ‘Sweetheart’ and ‘Van’ in 2019 and 2021 (p < 0.01).
Fruit size also varied significantly between years (p < 0.001). The average fruit size across accessions was 26.66 ± 2.17 mm in 2019, decreased slightly to 26.33 ± 1.55 mm in 2020, and then declined more markedly to 23.76 ± 1.71 mm in 2021 (Table 2). Genotypes such as ‘10157’ (25.01 ± 1.47 mm in 2019, 27.50 ± 1.42 mm in 2020, and 24.92 ± 1.81 mm in 2021), ‘16700’ (25.70 ± 1.24 mm, 27.26 ± 1.22 mm, and 22.93 ± 1.97 mm), and ‘16772’ (26.11 ± 1.07 mm, 24.03 ± 1.26 mm, and 20.60 ± 1.52 mm) demonstrated high interannual consistency. In contrast, accession ‘10072’ (26.41 ± 3.84 mm in 2019, 27.23 ± 1.87 mm in 2020, and 25.24 ± 1.81 mm in 2021) and particularly ‘16756’ (29.72 ± 3.63 mm in 2019 to 24.83 ± 1.90 mm in 2021) showed substantial fluctuations. Among the standard cultivars, ‘Sweetheart’ exhibited a progressive decline from 26.24 ± 2.11 mm in 2019 to 24.33 ± 2.01 mm in 2020 and 22.35 ± 1.79 mm in 2021. ‘Van’ decreased from 25.11 ± 2.24 mm to 23.95 ± 2.18 mm to 22.15 ± 2.67 mm. ‘Regina’ was more variable, with values of 28.33 ± 2.67 mm in 2019, 26.25 ± 2.81 mm in 2020, and 25.56 ± 2.92 mm in 2021. Accession ‘16806’, despite its high susceptibility, consistently matched or exceeded the size of ‘Sweetheart’ and ‘Van’ in all three seasons and was only significantly smaller than ‘10072’ in 2021 (p < 0.01).
Soluble solids content (SSC) also showed marked interannual differences (p < 0.001), with mean values declining from 16.17 ± 2.07 °Brix in 2019 to 14.36 ± 1.74 °Brix in 2020 and further to 11.62 ± 1.63 °Brix in 2021 (Table 2). Genotypes such as ‘16690’ (14.54 ± 1.01, 14.29 ± 1.26, and 13.49 ± 1.54), ‘15361’ (13.64 ± 0.97 in 2019 and 13.02 ± 1.00 in 2020), and ‘16772’ (19.87 ± 1.44, 14.02 ± 1.14, and 11.02 ± 0.92) exhibited relatively consistent SSC levels. In contrast, genotypes such as ‘10072’ (14.46 ± 1.47, 15.72 ± 15.73, and 12.46 ± 1.22), ‘16678’ (16.25 ± 1.61, 15.62 ± 14.08, and 11.18 ± 1.47), and ‘16744’ (15.26 ± 1.82, 15.70 ± 14.77, and 12.04 ± 1.57) showed pronounced year-to-year variation. Among standard cultivars, ‘Sweetheart’ recorded SSC values of 15.43 ± 1.48 °Brix in 2019, 15.18 ± 1.57 in 2020, and 14.94 ± 1.63 in 2021 (RI = 2.14 ± 0.35). ‘Van’ showed values of 14.27 ± 1.42, 13.54 ± 1.51, and 13.22 ± 1.41, respectively (RI = 2.07 ± 0.22), while ‘Regina’ exhibited 14.85 ± 1.66, 14.36 ± 1.58, and 13.86 ± 1.62 across the three years (RI = 2.37 ± 0.51). Accession ‘16806’—the most susceptible according to resistance index (2.72 ± 0.45)—also showed variable SSC: 14.63 ± 1.56 °Brix in 2019, 13.68 ± 1.77 in 2020, and 12.94 ± 1.53 in 2021. It showed comparable SSC levels to ‘Sweetheart’ and ‘Van’ in all years and differed significantly only from ‘10072’ in 2021 (p < 0.01).
3.4. The Influence of Fruit Firmness, Size, and SSC on Resistance Index
We found a strong negative correlation between fruit firmness and the resistance index (r = −0.606, p < 0.001) (Table 3). Firmer cherries were less susceptible to surface pitting. This result was consistent in all the seasons. Accession ‘10072’ exhibited the highest firmness (239.85 ± 7.16 g/mm) and the lowest RI (1.31 ± 0.25), while accession ‘16692’ showed both low firmness (177.14 ± 10.16 g/mm) and high susceptibility (RI = 2.50 ± 0.39).
Table 3.
Correlation matrix showing Spearman correlation coefficients and p-values (* p < 0.05) for the relationships between fruit firmness, fruit size, soluble solids content, and *resistance index.
Soluble solids content (SSC) correlated moderately negatively with firmness (r = −0.304, p < 0.01) and was weakly and non-significantly associated with RI (r = −0.022, p > 0.05) (Table 3). Fruit size also demonstrated weak negative correlations with firmness (r = −0.365, p < 0.01) and RI (r = −0.070, p > 0.05).
Correlations among the parameters revealed that firmness was negatively associated with both SSC and size. A significant positive correlation was found between SSC and size (r = 0.258, p < 0.05), indicating that larger fruits tended to be sweeter (Table 3).
3.5. Variation in Surface Pitting Resistance Across Accessions
Differences (p < 0.001) in surface pitting resistance were observed among the 35 sweet cherry accessions evaluated, indicating substantial phenotypic variation across the breeding material. The resistance index, reflecting the average severity of pitting damage, ranged from 1.31 ± 0.26 for accession ‘10072’—the most resistant—to 2.72 ± 0.45 for accession ‘16806’, which was the most susceptible (Figure 5). Accessions such as ‘13577’ (1.49 ± 0.11) and ‘13467’ (1.87 ± 0.31) also demonstrated strong resistance, with consistently low index values across replicates. Conversely, accessions including ‘13804’ (2.68 ± 0.44) and ‘16692’ (2.51 ± 0.39) exhibited high susceptibility, showing RI similar to or worse than those of the most vulnerable standard cultivars (Figure 5). Analysis revealed significant genotypic differences for fruit firmness (H = 2159.25, p < 0.001). Post hoc pairwise comparisons identified 383 distinct accession pairs (p < 0.05, Figure 6).
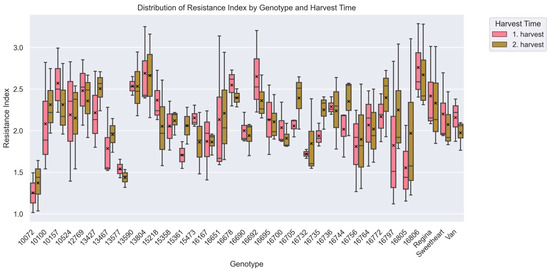
Figure 5.
Analysis of the variability in the resistance index of cherry genotypes against surface pitting (Kruskal–Wallis analysis of variance; p < 0.05). Cherry accessions (x-axis) are compared based on their resistance index values for surface pitting (y-axis). Boxplots are grouped by harvest period, with pink representing the 1st harvest and green representing the 2nd harvest. A total of 150 data points per accession were used to generate the box plot. Each boxplot displays the median, interquartile range (IQR), and variability within each accession for both harvest periods. Mean values are indicated by a black “x” symbol. For a description of how the box plot was generated see Figure 2.
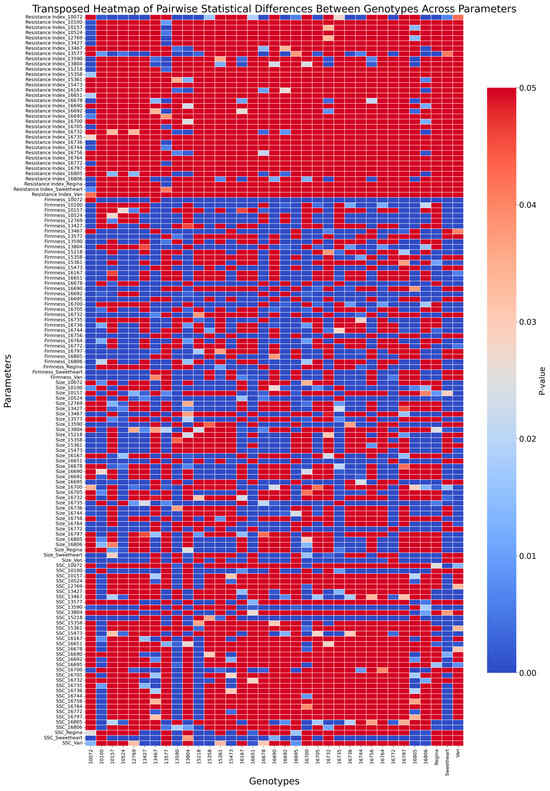
Figure 6.
Heatmap of pairwise statistical differences (p-values) between cherry accessions across multiple parameters. The x-axis represents accessions, while the y-axis represents parameters such as resistance index, fruit firmness, fruit size, and soluble solids content (SSC). The color intensity corresponds to the p-value range (0 to 0.05), with darker blue indicating stronger statistical significance (p closer to 0) and red indicating weaker significance (p closer to 0.05). Non-significant comparisons are represented by uniform red shading.
The comparison with established reference cultivars further highlights the distribution of resistance index. Out of the 35 evaluated accessions, 27 had lower mean resistance index values than ‘Regina’ (2.37 ± 0.51), confirming its high susceptibility to pitting under mechanical stress. Eighteen accessions scored lower than ‘Sweetheart’ (2.14 ± 0.35), while 17 scored higher, placing this cultivar near the median of the tested population. For ‘Van’ (2.07 ± 0.22), which is considered moderately tolerant, 13 accessions exhibited better resistance and 21 had higher resistance index.
Yearly trends in resistance index values revealed clear differences in phenotypic stability among accessions. Across all accessions, the average resistance index was 2.04 ± 0.35 in 2019, slightly decreasing to 1.95 ± 0.40 in 2020, and finally rise up to 2.41 ± 0.51 in 2021 (p < 0.05) (Table 2). Accession ‘10072’ demonstrated exceptional consistency, with resistance indices of 1.57 (±0.24) in 2019, 1.34 (±0.16) in 2020, and 1.02 (±0.03) in 2021, showing minimal variation across years (p > 0.05). Similarly, ‘10524’ exhibited values of 1.86 (±0.17) in 2019, 1.47 (±0.15) in 2020, and 2.68 (±0.22) in 2021, with variation that was not statistically significant (p > 0.05). Accession ‘12769’ also maintained moderate consistency, with indices of 2.76 (±0.16) in 2019, 1.99 (±0.16) in 2020, and 2.01 (±0.15) in 2021 (p > 0.05).
In contrast, certain accessions exhibited substantial interannual variability. For example, ‘16797’ showed marked differences in resistance indices, rising from 1.52 (±0.44) in 2019 to 2.94 (±0.22) in 2021 (p < 0.01), confirming significant year-to-year variability. Accession ‘16700’ varied from 1.85 (±0.33) in 2019 to 2.09 (±0.34) in 2021 (p > 0.05), and ‘16651’ fluctuated from 2.04 (±0.31) in 2019 to 2.62 (±0.48) in 2021 (p < 0.05).
Across all accessions, the average resistance index during the first harvest was 2.12 (±0.48), while the second harvest showed a slightly lower average of 2.14 (±0.45) (Table 1). This small difference was not statistically significant (p > 0.05), indicating minimal variation in resistance between harvest periods. Accession ‘13590’, for instance, demonstrated stable performance across both harvests, with resistance indices of 2.54 (±0.12) during the first harvest and 2.53 (±0.35) during the second harvest (Figure 6). In contrast, accession ‘16797’ showed a marked increase in its resistance index from 1.82 (±0.74) in the first harvest to 2.24 (±0.59) in the second harvest, with higher susceptibility observed at later harvest maturity.
3.6. Effect of Storage Conditions on Resistance Index
Resistance index (RI) was evaluated under four postharvest storage conditions: 1-MCP postharvest treatment, ozone postharvest treatment, ULO, and MAP. RI values varied across storage conditions in both harvest periods. In the first harvest, the lowest average RI was observed under MAP storage (2.68), followed by ozone postharvest treatment (2.69), 1-MCP postharvest treatment (2.70), and ULO (2.77) (p > 0.05). In the second harvest, ULO showed the lowest RI (2.46), followed by ozone postharvest treatment (2.65), MAP (2.75), and 1-MCP postharvest treatment (2.81) (p > 0.05) (Figure 7).
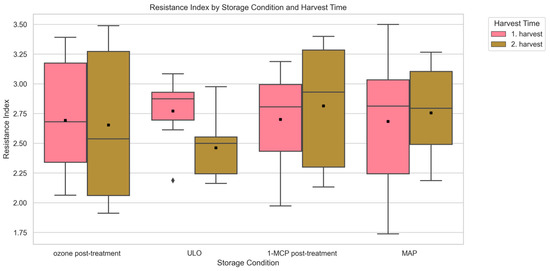
Figure 7.
Analysis of the relationship between the storage condition type and resistance index of sweet cherry accessions (Kruskal–Wallis analysis of variance; p < 0.05). Storage condition types (x-axis) are compared based on the resistance index value against surface pitting (y-axis). Boxplots are grouped by harvest period, with pink representing the 1st harvest and green representing the 2nd harvest. A total of 600 data points per storage condition were used to generate each box plot. Each boxplot displays the median, interquartile range (IQR), and variability within each accession for both harvest periods. Mean values are indicated by a black “x” symbol. For a description of how the box plot was generated see Figure 2.
3.7. Effect of Storage Conditions on Resistance Index Prior to Induced Damage
The impact of five storage conditions on the resistance index (RI) of the cultivar ‘Tamara’ was evaluated following induced mechanical damage-induced surface pitting during the second harvest period. The tested treatments included ozone and 1-MCP applied both pre- and post-treatment, as well as ULO storage. The lowest RI was observed under ULO storage (2.35 ± 0.13), followed by both 1-MCP treatments (2.50 ± 0.06 and 2.50 ± 0.15 for post- and pre-treatment, respectively). Ozone pre-treatment resulted in a mean RI of 2.66 ± 0.14, while the highest value was recorded after ozone post-treatment (2.85 ± 0.08) (Figure 8).
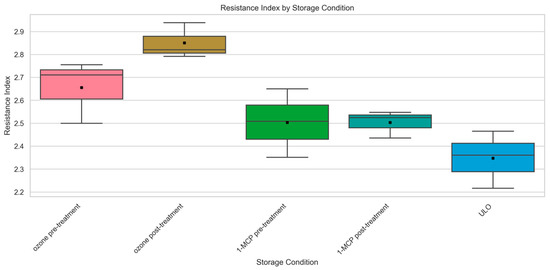
Figure 8.
Analysis of the relationship between the storage condition type and resistance index of sweet cherry ‘Tamara’ (Kruskal–Wallis analysis of variance; p < 0.05). Storage condition types (x-axis) are compared based on the resistance index value against surface pitting (y-axis) in second harvest. A total of 150 data points per storage condition were used to generate each box plot. Each boxplot displays the median, interquartile range (IQR), and variability within each accession for both harvest periods. Mean values are indicated by a black “x” symbol. For a description of how the box plot was generated see Figure 2.
4. Discussion
This study comprehensively evaluated surface pitting susceptibility in 32 sweet cherry accessions from the VSUO Holovousy breeding program, supplemented by three commercial cultivars (‘Van’, ‘Regina’, and ‘Sweetheart’) representing contrasting levels of resistance. The three-season evaluation revealed substantial genotypic differences in the resistance index (RI), ranging from 1.31 (0.26) in ‘10072’ to 2.72 (±0.45) in ‘16806’. These findings support the hypothesis that resistance to mechanical stress is under strong genetic control, as previously reported [5,9,21]. The consistently low RI values observed in genotypes such as ‘10072’, ‘10524’, and ‘13467’ reinforce the relevance of genetic stability in postharvest resilience.
Differences in RI among accessions are likely driven by multiple anatomical and physiological traits. Firmness is an important indicator of tissue strength and showed a negative correlation with RI (r = −0.606). This means that firmer fruit are generally less prone to pitting [25,62,63]. Three main structural features explain this: turgor pressure (which supports cell shape), cell wall thickness (which increases tissue strength), and intercellular adhesion (which keeps cells together under pressure). Together, these features allow the fruit to dissipate mechanical energy more effectively and reduce the incidence of localized tissue collapse that leads to surface pitting. However, the case of accession ‘12769’, which exhibited moderate RI despite low firmness, suggests that additional factors such as epidermal elasticity or cuticle integrity contribute to mechanical resistance [14,21]. The elasticity of epidermal cells allows the outer tissue layers to absorb and redistribute mechanical stress without cracking, while the structural integrity and thickness of the cuticle influence the fruit’s ability to resist fracture initiation and moisture loss. A more elastic or thicker cuticle has been linked to improved tolerance to microcracking and increased resistance to surface deformation during handling [64,65].
In addition to the firmness–resistance relationship, correlation analysis also revealed that the resistance index was only weakly associated with soluble solids content (SSC; r = −0.022) and fruit size (r = −0.070). These low coefficients suggest that SSC and size are poor standalone predictors of mechanical resistance in sweet cherries. This aligns with previous findings indicating that larger or sweeter fruit are not necessarily more susceptible to surface pitting, as their tissue structure and epidermal characteristics may play a more decisive role [66,67]. Moreover, the positive correlation between SSC and size (r = 0.258) is consistent with developmental studies showing that sugar accumulation is closely linked to fruit expansion, though not directly to resilience [68]. These observations reinforce the idea that breeding programs should prioritize structural and mechanical traits over purely biochemical ones when aiming to improve postharvest quality.
Year-to-year variation further revealed genotype × environment interactions, where accessions like ‘16797’ showed significant interannual RI fluctuation, in contrast to stable genotypes like ‘10072’. This highlights the need for multi-seasonal screening to identify robust phenotypes for commercial deployment, as supported by previous studies that demonstrated variability in fruit firmness, soluble solids content, and susceptibility to pitting and cracking across growing seasons and climatic conditions [32,37]. Additionally, standard cultivars exhibited expected behavior: ‘Sweetheart’ and ‘Regina’ confirmed their high susceptibility (RI = 2.14 and 2.37), whereas ‘Van’ (RI = 2.07) showed moderate resistance. These findings are consistent with earlier reports that classify ‘Sweetheart’ and ‘Regina’ as highly sensitive to postharvest pitting, while ‘Van’ has been identified as moderately tolerant [5,69,70]. These reference genotypes validated the spectrum of performance observed among new accessions.
Moving beyond genetic variation, the analysis of storage conditions provided insights into performance under commercial storage conditions. Although no significant difference in average RI was observed between storage conditions, fruit stored under ULO tended to exhibit slightly better resistance in the second harvest (RI = 2.43 vs. 2.57). This may be due to the ability of ULO to create a hypoxic environment that slows down respiration and overall metabolic activity, thereby conserving energy reserves and delaying senescence [71]. Low oxygen concentrations suppress ethylene biosynthesis by inhibiting ACC oxidase activity and reduce ethylene perception by altering receptor sensitivity [72], which in turn downregulates the activity of pectin-degrading enzymes such as polygalacturonase and pectin methylesterase, thereby preserving cell wall integrity [73]. Furthermore, ULO conditions reduce oxidative stress by limiting reactive oxygen species (ROS) accumulation, which helps minimize membrane lipid peroxidation and maintains cellular compartmentalization [73]. These combined effects have been associated with improved structural preservation and reduced susceptibility to surface pitting during storage.
In contrast, MAP more effectively preserved firmness, likely due to its moisture-retaining capacity and suppression of ethylene sensitivity and respiration rates [65,71,73]. This makes MAP a valuable strategy for preserving visual and textural quality in cherries destined for shorter storage periods or local markets. Additionally, earlier findings [53] support the role of MAP in reducing weight loss and chilling injury during storage. These insights highlight that postharvest storage conditions should be selected based not only on cultivar sensitivity but also on the intended distribution chain and market timeline.
Interestingly, the second harvest resulted in slightly higher RI (2.14) compared to the first (2.12), contrary to earlier findings suggesting that riper fruit should be more resilient due to increased flexibility and viscoelastic behavior [25,74]. This discrepancy may be explained by the structural weakening associated with ripening, including cell wall softening, increased enzymatic activity, and reduced cuticle cohesion. Increased turgor pressure in mature fruit may also elevate internal stress under compression. These effects have been described in detail for softening fruit such as tomatoes and stone fruit, where advanced ripening stages lead to elevated susceptibility to mechanical damage and increased metabolic activity [75,76]. Similar mechanisms have been described in apples and plums, where over-maturity increases susceptibility to cracking and bruising [77,78,79].
The influence of four storage conditions—ULO, MAP, 1-MCP post-treatment, and ozone post-treatment—on pitting susceptibility was assessed using the resistance index (RI). ULO storage resulted in the lowest average RI value (2.54), which supports its known role in slowing metabolic activity and ethylene biosynthesis via hypoxic conditions, thus reducing softening and oxidative damage [43,80]. MAP produced a slightly higher RI (2.72), but its moisture retention and control over gas exchange helped preserve firmness through reduced transpiration and suppressed enzymatic activity [71]. Ozone post-treatment resulted in a similar RI (2.71), consistent with studies showing its capacity to limit microbial growth and delay senescence, although its effectiveness is strongly dependent on dosage and preconditioning [81,82]. 1-MCP post-treatment showed the highest RI (2.76), suggesting that while ethylene inhibition can be beneficial in some fruit, it may negatively affect stress responses in cherries and limit natural softening pathways [71,83]. These results emphasize that no single storage condition universally optimizes pitting resistance. Instead, postharvest outcomes depend on the physiological compatibility of storage conditions with fruit maturity and cultivar-specific traits.
Cherry ‘Tamara’ was evaluated under induced mechanical stress and five storage conditions: ULO, ozone pre-treatment, ozone post-treatment, 1-MCP pre-treatment, and 1-MCP post-treatment. In this context, “pre-treatment” refers to applications made prior to the onset of mechanical damage-induced surface pitting, such as that occurring during sorting, handling, and transportation, while “post-treatment” followed induced stress. The lowest RI value was observed under ULO storage (2.35 ± 0.13), consistent with its effect in reducing respiration and ethylene biosynthesis via hypoxic conditions [73,80]. Both 1-MCP treatments yielded similar RI values (2.50 ± 0.06 and 2.50 ± 0.15), with pre-treatment showing slightly more consistent results. This supports earlier findings that 1-MCP is most effective when applied before physiological or mechanical stress is initiated, allowing timely inhibition of ethylene perception [71,83].
In contrast, ozone post-treatment produced the highest RI (2.85 ± 0.08), while ozone pre-treatment resulted in a moderately lower RI (2.66 ± 0.14). This suggests that applying ozone after tissue injury may exacerbate oxidative stress and membrane damage, whereas pre-treatment can precondition the fruit and enhance tolerance. Ozone may act as a double-edged sword, providing antimicrobial and senescence-delaying benefits, but only when applied under controlled conditions and before injury events [81,82]. These findings underscore that the physiological context—particularly whether tissues have already been damaged—plays a critical role in determining treatment efficacy. In sweet cherries, applying protective technologies before stress events may offer superior results compared to reactive approaches.
5. Conclusions
Surface pitting resistance in sweet cherries was evaluated across three seasons and 35 genotypes (32 breeding accessions and three standard cultivars), confirming that the resistance index (RI) is predominantly genotype-dependent. The most resistant genotype, ‘10072’, achieved an RI of 1.31 ± 0.26, while the most susceptible, ‘16806’, reached 2.72 ± 0.45. Genotypes such as ‘10072’, ‘10524’, and ‘13467’ consistently exhibited low RI values and high interannual stability, whereas accessions like ‘16797’ showed considerable year-to-year variability (RI from 1.52 ± 0.44 to 2.94 ± 0.22). Firmness was the most reliable phenotypic marker (r = −0.606), with mean values ranging from 177.14 ± 10.16 g/mm (‘16692’) to 239.85 ± 7.16 g/mm (‘10072’). Soluble solids content (12.44 ± 1.58 to 16.23 ± 4.42 °Brix) and fruit size (23.58 ± 2.50 to 27.40 ± 1.36 mm) showed only weak or non-significant correlations with RI. Harvest maturity had a minor effect, with average RI values of 2.12 ± 0.48 (first harvest) and 2.14 ± 0.45 (second harvest).
Among storage treatments, ULO yielded the lowest RI (2.54), followed by MAP (2.72), ozone post-treatment (2.71), and 1-MCP post-treatment (2.76). In ‘Tamara’ under induced mechanical stress, ULO again provided the lowest RI (2.35 ± 0.13), while 1-MCP pre- and post-treatments were similar (2.50 ± 0.06 and 2.50 ± 0.15), ozone pre-treatment was moderately effective (2.66 ± 0.14), and ozone post-treatment was least effective (2.85 ± 0.08). These results confirm that both genetic background and the physiological timing of postharvest interventions are critical for minimizing surface pitting. The identification of stable, low-RI genotypes such as ‘10072’, ‘13467’, and ‘13577’ provides valuable candidates for commercial use, and the RI metric is recommended for breeding programs targeting improved postharvest performance.
Supplementary Materials
The following supporting information can be downloaded at https://www.mdpi.com/article/10.3390/horticulturae11070716/s1. Table S1: Genotype parameters; Table S2: Index vs. Storage Condition; Table S3: Pre and Post Treatment.
Author Contributions
Conceptualization, P.S. and T.N.; methodology, P.S. and P.K.; software, P.S.; validation, P.K. and P.S.; investigation, data curation, formal analysis, writing—original draft, P.S., V.D. and L.P.; Supervision, writing original draft—review and editing, T.N. and P.S.; visualization, P.S.; supervision, T.N. All authors have read and agreed to the published version of the manuscript.
Funding
This research was funded by the Ministry of Agriculture Czech Republic, grant number RO1525.
Data Availability Statement
Data are contained within the article or Supplementary Materials.
Acknowledgments
The authors are grateful for the infrastructure and logistical support provided by the VSUO HOLOVOUSY Ltd.
Conflicts of Interest
Authors Pavol Suran, Veronika Danková, Pavlína Knapová, and Lucie Plecitá were employed by the company VYZKUMNY A SLECHTITELSKY USTAV OVOCNARSKY HOLOVOUSY Ltd. The remaining author declare that the research was conducted in the absence of any commercial or financial relationships that could be construed as a potential conflict of interest.
References
- Kader, A.A. Postharvest technology of horticultural crops—An overview from farm to fork. Ethiop. J. Appl. Sci. Technol. 2013, 1, 1–8. [Google Scholar]
- Zoffoli, J.P.; Latorre, B.A.; Naranjo, P. Preharvest applications of growth regulators and their effect on postharvest quality of table grapes during cold storage. Postharvest Biol. Technol. 2009, 51, 183–192. [Google Scholar] [CrossRef]
- Stan, A.; Mareși, E.; Chivu, M.; Butac, M. Fruits quality of some sweet cherry cultivars in correlation with consumer preferences. Fruit. Grow. Res. 2023, 39, 54–61. [Google Scholar] [CrossRef]
- González, M.E.; Valderrama, N.F.; Bastías, R.M.; Baeza, R.; Valdebenito, A.M.; Díaz, G.; Shackel, K.A. Evaluation of induced pitting damage of late season cherries ‘Regina’ and ‘Sweetheart’ using an impact energy method. Chil. J. Agric. Res. 2016, 76, 471–478. [Google Scholar] [CrossRef][Green Version]
- Kappel, F.; Toivonen, P.; Stan, S.; Mckenzie, D.L. Resistance of sweet cherry cultivars to fruit surface pitting. Can. J. Plant Sci. 2006, 86, 1197–1202. [Google Scholar] [CrossRef]
- Usenik, V.; Kastelec, D.; Štampar, F. Physicochemical changes of sweet cherry fruits related to application of gibberellic acid. Food Chem. 2005, 90, 663–671. [Google Scholar] [CrossRef]
- Taylor, S. Advances in Food and Nutrition Research: Cumulative Index; Gulf Professional Publishing: Waltham, MA, USA, 2003; Volume 1–46. [Google Scholar]
- Adaskaveg, J.E.; Förster, H.; Thompson, D.F. Identification and etiology of visible quiescent infections of Monilinia fructicola and Botrytis cinerea in sweet cherry fruit. Plant Dis. 2000, 84, 328–333. [Google Scholar] [CrossRef]
- Grimm, E.; Peschel, S.; Becker, T.; Knoche, M. Stress and strain in the sweet cherry skin. J. Am. Soc. Hortic. Sci. 2012, 137, 383–390. [Google Scholar] [CrossRef]
- Lara, I.; García, P.; Vendrell, M. Modifications in cell wall composition after cold storage of calcium-treated strawberry (Fragaria × ananassa Duch.). Fruit Postharvest Biol. Technol. 2004, 34, 331–339. [Google Scholar] [CrossRef]
- Fonseca, S.C.; Oliveira, F.A.; Brecht, J.K. Modelling respiration rate of fresh fruits and vegetables for modified atmosphere packages: A review. J. Food Eng. 2002, 52, 99–119. [Google Scholar] [CrossRef]
- Li, Z.; Thomas, C. Quantitative evaluation of mechanical damage to fresh fruits. Trends Food Sci. Technol. 2014, 35, 138–150. [Google Scholar] [CrossRef]
- Zeebroeck, M.; Linden, V.; Ramon, H.; Baerdemaeker, J.; Nicolai, B.; Tijskens, E. Impact damage of apples during transport and handling. Postharvest Biol. Technol. 2007, 45, 157–167. [Google Scholar] [CrossRef]
- Wang, Z.-W. Study of mechanisms of mechanical damage and transport packaging in fruits transportation. Packag. Eng. 2004, 25, 131–134. [Google Scholar]
- Crisosto, C.H.; Garner, D.; Doyle, J.; Day, K.R. Relationship between fruit respiration, bruising susceptibility, and temperature in sweet cherries. HortScience 1993, 28, 132–135. [Google Scholar] [CrossRef]
- Sediqi, A.G.; Kramchote, S.; Itamura, H.; Esumi, T. Physiological changes in sweet cherry fruit in response to physical damage. In Proceedings of the VIII International Cherry Symposium, Yamagata, Japan, 5–9 June 2017; Volume 1235, pp. 495–502. [Google Scholar] [CrossRef]
- Candan, A.P.; Raffo, M.D.; Calvo, G.; Gomila, T. Study of the main points of impact during cherry handling and factors affecting pitting sensitivity. Acta Hortic. 2014, 1020, 137–141. [Google Scholar] [CrossRef]
- Wang, Y.; Xie, X.; Long, L. The effect of postharvest calcium application in hydro-cooling water on tissue calcium content, biochemical changes, and quality attributes of sweet cherry fruit. Food Chem. 2014, 160, 22–30. [Google Scholar] [CrossRef]
- Lin, M.; Fawole, O.A.; Saeys, W.; Wu, D.; Wang, J.; Opara, U.L.; Chen, K. Mechanical damages and packaging methods along the fresh fruit supply chain: A review. Crit. Rev. Food Sci. Nutr. 2023, 63, 10283–10302. [Google Scholar] [CrossRef]
- Ponce, E.; Alzola, B.; Cáceres, N.; Gas, M.; Ferreira, C.; Vidal, J.; Chirinos, R.; Campos, D.; Rubilar, M.; Campos-Vargas, R.; et al. Biochemical and phenotypic characterization of sweet cherry (Prunus avium L.) cultivars with induced surface pitting. Postharvest Biol. Technol. 2021, 175, 111494. [Google Scholar] [CrossRef]
- Fuentealba, C.; Ejsmentewicz, T.; Campos-Vargas, R.; Saa, S.; Aliaga, O.; Chirinos, R.; Campos, D.; Pedreschi, R. Cell wall and metabolite composition of sweet cherry fruits from two cultivars with contrasting susceptibility to surface pitting during storage. Food Chem. 2020, 342, 128307. [Google Scholar] [CrossRef]
- Cronjé, P.J.; Zacarías, L.; Alférez, F. Susceptibility to postharvest peel pitting in citrus fruits as related to albedo thickness, water loss and phospholipase activity. Postharvest Biol. Technol. 2017, 123, 77–82. [Google Scholar] [CrossRef]
- Brüggenwirth, M.; Knoche, M. Cell wall swelling, fracture mode, and the mechanical properties of cherry fruit skins are closely related. Planta 2017, 245, 765–777. [Google Scholar] [CrossRef]
- Wade, N.; Bain, J. Physiological and anatomical studies of surface pitting of sweet cherry fruit in relation to bruising, chemical treatments, and storage conditions. J. Hortic. Sci. 1980, 55, 375–384. [Google Scholar] [CrossRef]
- Lidster, P.; Tung, M. Effects of fruit temperatures at time of impact damage and subsequent storage temperature and duration on the development of surface disorders in sweet cherries. Can. J. Plant Sci. 1980, 60, 555–559. [Google Scholar] [CrossRef]
- Zoffoli, J.; Rodríguez, J. Fruit temperature affects physical injury sensitivity of sweet cherry during postharvest handling. Acta Hortic. 2014, 1020, 111–114. [Google Scholar] [CrossRef]
- Verma, L.R.; Joshi, V.K. Post-harvest technology of fruits and vegetables. Post. Harvest. Technol. Fruits Veg. 2000, 1, 1–76. [Google Scholar]
- Mishra, V.K.; Gamage, T.V. Postharvest handling and treatments of fruits and vegetables. In Handbook of Food Preservation; CRC Press: Boca Raton, FL, USA, 2007; pp. 67–90. [Google Scholar]
- Martinez-Romero, D.; Serrano, M.; Carbonell, A.; Castillo, S.; Riquelme, F.; Valero, D. Mechanical damage during fruit post-harvest handling: Technical and physiological implications. In Production Practices and Quality Assessment of Food Crops: Quality Handling and Evaluation; Springer: Dordrecht, The Netherlands, 2004; pp. 233–252. [Google Scholar]
- Arancibia, R.; Motsenbocker, C. Pectin methylesterase activity in vivo differs from activity in vitro and enhances polygalacturonase-mediated pectin degradation in tabasco pepper. J. Plant Physiol. 2006, 163, 488–496. [Google Scholar] [CrossRef]
- Micheli, F. Pectin methylesterases: Cell wall enzymes with important roles in plant physiology. Trends Plant Sci. 2001, 6, 414–419. [Google Scholar] [CrossRef]
- Correia, S.; Schouten, R.; Silva, A.P.; Gonçalves, B. Factors affecting quality and health promoting compounds during growth and postharvest life of sweet cherry (Prunus avium L.). Front. Plant Sci. 2017, 8, 2166. [Google Scholar] [CrossRef]
- Brüggenwirth, M.; Knoche, M. Factors affecting mechanical properties of the skin of sweet cherry fruit. J. Am. Soc. Hortic. Sci. 2016, 141, 45–53. [Google Scholar] [CrossRef]
- Hasanuzzaman, M.; Nahar, K.; Alam, M.; Roychowdhury, R.; Fujita, M. Physiological, biochemical, and molecular mechanisms of heat stress tolerance in plants. Int. J. Mol. Sci. 2013, 14, 9643–9684. [Google Scholar] [CrossRef]
- Kovács, E.; Kristóf, Z.; Perlaki, R.; Szőllősi, D. Cell wall metabolism during ripening and storage of nonclimacteric sour cherry (Prunus cerasus L., cv. Kántorjánosi). Acta Aliment. 2008, 37, 415–426. [Google Scholar] [CrossRef]
- Cai, C.; Xu, C.; Li, X.; Ferguson, I.; Chen, K. Accumulation of lignin in relation to change in activities of lignification enzymes in loquat fruit flesh after harvest. Postharvest Biol. Technol. 2006, 40, 163–169. [Google Scholar] [CrossRef]
- Tarara, J.M.; Ferguson, J.C.; Spayd, S.E. A chamber-free method of heating and cooling grape clusters in the vineyard. Am. J. Enol. Vitic. 2000, 51, 182–188. [Google Scholar] [CrossRef]
- Crisosto, C.H.; Crisosto, G.M.; Echeverria, G. Segregation of plum and pluot cultivars according to their organoleptic characteristics. Postharvest Biol. Technol. 2007, 44, 271–276. [Google Scholar] [CrossRef]
- Toivonen, P.M.A.; Hampson, C.R. Respiration rates of sweet cherry cultivars at optimal and abusive temperatures over three growing seasons. In Proceedings of the VII International Cherry Symposium, Plasencia, Spain, 23–27 June 2013; Volume 1161, pp. 575–580. [Google Scholar]
- Beaudry, R.M. Effect of O2 and CO2 partial pressure on selected phenomena affecting fruit and vegetable quality. Postharvest Biol. Technol. 1999, 15, 293–303. [Google Scholar] [CrossRef]
- Kupferman, E.; Sanderson, P. Temperature management and modified atmosphere packing to preserve sweet cherry quality. Acta Hortic. 2005, 667, 523–528. [Google Scholar] [CrossRef]
- Serradilla, M.J.; Martín, A.; Ruiz-Moyano, S.; Hernández, A.; López-Corrales, M.; Córdoba, M.d.G. Physicochemical and sensorial characterisation of four sweet cherry cultivars grown in Jerte Valley (Spain). Food Chem. 2012, 133, 1551–1559. [Google Scholar] [CrossRef]
- Wang, L.; Vestrheim, S. Controlled atmosphere storage of sweet cherries (Prunus avium L.). Acta Agric. Scand. Sect. B Soil Plant Sci. 2002, 52, 136–142. [Google Scholar] [CrossRef]
- Spotts, R.A.; Cervantes, L.A.; Facteau, T.J. Integrated control of brown rot of sweet cherry with a preharvest fungicide, a postharvest yeast, modified atmosphere packaging, and cold storage temperature. Postharvest Biol. Technol. 2002, 24, 251–257. [Google Scholar] [CrossRef]
- Karabulut, O.A.; Lurie, S.; Droby, S. Evaluation of the use of sodium bicarbonate, potassium sorbate, and yeast antagonists for decreasing postharvest decay of sweet cherries. Postharvest Biol. Technol. 2001, 23, 233–236. [Google Scholar] [CrossRef]
- Meheriuk, M.; Girard, B.; Moyls, L.; Beveridge, H.J.T.; Mckenzie, D.L.; Harrison, J.; Weintraub, S.; Hocking, R. Modified atmosphere packaging of ‘Lapins’ sweet cherry. Food Res. Int. 1995, 28, 239–244. [Google Scholar] [CrossRef]
- Güneyli, A.; Onursal, C.E.; Seçmen, T.; Sevinç Üzümcü, S.; Koyuncu, M.A.; Erbaş, D. The use of controlled atmosphere box in sweet cherry storage. Hortic. Stud. 2022, 39, 33–40. [Google Scholar] [CrossRef]
- Xing, S.H.; Zhang, X.S.; Gong, H.S. The effect of CO2 concentration on sweet cherry preservation in modified atmosphere packaging. Czech J. Food Sci. 2020, 38, 103–108. [Google Scholar] [CrossRef]
- Carrión-Antolí, A.; Badiche-EL Hilali, F.; Lorente-Mento, J.M.; Diaz-Mula, H.M.; Serrano, M.; Valero, D. Antioxidant Systems and Quality in Sweet Cherries Are Improved by Preharvest GABA Treatments Leading to Delay Postharvest Senescence. Int. J. Mol. Sci. 2023, 25, 260. [Google Scholar] [CrossRef]
- Correia, S.; Queiros, F.; Ribeiro, C.; Vilela, A.; Aires, A.; Barros, A.I.; Gonçalves, B. Effects of calcium and growth regulators on sweet cherry (Prunus avium L.) quality and sensory attributes at harvest. Sci. Hortic. 2019, 248, 231–240. [Google Scholar] [CrossRef]
- Zhi, H.; Dong, Y. Effect of hydrogen sulfide on surface pitting and related cell wall metabolism in sweet cherry during cold storage. J. Appl. Bot. Food Qual. 2018, 91, 109–113. [Google Scholar] [CrossRef]
- Hernandéz, I.; Ponce, E.; Vidal, J.; Chirinos, R.; Campos, D.; Pedreschi, R.; Fuentealba, C. Metabolomics Reveals Specific Metabolic Changes in Sweet Cherries (Prunus avium L.) Subjected to Postharvest Treatment with Melatonin after Mechanical Stress. Horticulturae 2023, 9, 940. [Google Scholar] [CrossRef]
- Serradilla, M.; Falagán, N.; Bohmer, B.; Terry, L.; Alamar, M. The role of ethylene and 1-MCP in early-season sweet cherry ‘Burlat’ storage life. Sci. Hortic. 2019, 258, 108787. [Google Scholar] [CrossRef]
- Romanazzi, G.; Nigro, F.; Ippolito, A. Short hypobaric treatments potentiate the effect of chitosan in reducing storage decay of sweet cherries. Postharvest Biol. Technol. 2003, 29, 73–80. [Google Scholar] [CrossRef]
- Maryam, A.; Anwar, R.; Malik, A.; Raheem, M.; Khan, A.; Hasan, M.; Hussain, Z.; Siddique, Z. Combined aqueous ozone and ultrasound application inhibits microbial spoilage, reduces pesticide residues and maintains storage quality of strawberry fruits. J. Food Meas. Charact. 2020, 15, 1437–1451. [Google Scholar] [CrossRef]
- Sharifi-Sangdeh, S.; Mohammad, H.A. Investigation of the mechanical properties of cherry fruit (Prunus cerasus L.) in order to achieve optimum height of fruit storage box. Agric. Res. Tech. Open Access J. 2018, 16, 555996. [Google Scholar] [CrossRef]
- Valero, D.; Valverde, J.M.; Martínez-Romero, D.; Guillén, F.; Castillo, S.; Serrano, M. The combination of modified atmosphere packaging with eugenol or thymol to maintain quality, safety, and functional properties of table grapes. Postharvest Biol. Technol. 2006, 41, 317–327. [Google Scholar] [CrossRef]
- Nuñez-Lillo, G.; Ponce, E.; Alvaro, J.E.; Campos, D.; Meneses, C.; Campos-Vargas, R.; Pedreschi, R. Proteomics analysis reveals new insights into surface pitting of sweet cherry cultivars displaying contrasting susceptibility. J. Hortic. Sci. Biotechnol. 2022, 97, 615–625. [Google Scholar] [CrossRef]
- Lahaye, M.; Tabi, W.; Bot, L.; Delaire, M.; Orsel, M.; Campoy, J.; Garcia, J.; Gall, L. Comparison of cell wall chemical evolution during the development of fruits of two contrasting quality from two members of the Rosaceae family: Apple and sweet cherry. Plant Physiol. Biochem. PPB 2021, 168, 93–104. [Google Scholar] [CrossRef]
- Prskavec, K.; Sedlák, J.; Paprštein, F.; Mrkvica, L.; Metelka, L. Padesát pět let meteorologických pozorování v Holovousích (1955–2009); Výzkumný a šlechtitelský ústav ovocnářský Holovousy s.r.o.: Holovousy, Czech Republic, 2010; ISBN 978-80-87030-17-2. [Google Scholar]
- Param, N.; Zoffoli, J. Genotypic differences in sweet cherries are associated with the susceptibility to mechanical damage. Sci. Hortic. 2016, 211, 410–419. [Google Scholar] [CrossRef]
- Zerbini, P. Role of Maturity for Improved Flavour; Woodhead Publishing: Cambridge, UK, 2008; pp. 180–199. [Google Scholar] [CrossRef]
- Crisosto, C.; Andris, H.; Day, K.; Garner, D. Cold ‘Brooks’ cherries suffer more pitting and bruising. Calif. Agric. 1994, 48, 18–19. [Google Scholar] [CrossRef]
- Balbontín, C.; Ayala, H.; Bastías, R.; Hinrichsen, P. Fruit cuticle properties and their association with resistance to cracking in sweet cherry. Sci. Hortic. 2019, 255, 91–97. [Google Scholar] [CrossRef]
- Bvenura, C.; Hermaan, N.N.P.; Chen, L.; Sivakumar, D. Nutritional and health benefits of temperate fruits. In Postharvest Biology and Technology of Temperate Fruits; Mir, S.A., Shah, M.A., Mir, M.M., Eds.; Springer: Cham, Switzerland, 2018. [Google Scholar] [CrossRef]
- Kappel, F.; Fisher-Fleming, B.; Hogue, E.J. Fruit characteristics and sensory attributes of selected sweet cherry cultivars. HortScience 1996, 31, 443–446. [Google Scholar] [CrossRef]
- Toivonen, P.M.A.; Brummell, D.A. Biochemical bases of appearance and texture changes in fresh-cut fruit and vegetables. Postharvest Biol. Technol. 2008, 48, 1–14. [Google Scholar] [CrossRef]
- Johnson, L.K.; Malladi, A.; Nesmith, D.S. Differences in cell number facilitate fruit size variation in rabbiteye blueberry genotypes. J. Am. Soc. Hortic. Sci. 2011, 136, 10–15. [Google Scholar] [CrossRef]
- Toivonen, P.M.; Kappel, F.; Stan, S.; Mckenzie, D.L.; Hocking, R. Firmness, respiration, and weight loss of ‘Bing’, ‘Lapins’ and ‘Sweetheart’ cherries in relation to fruit maturity and susceptibility to surface pitting. HortScience 2004, 39, 1066–1069. [Google Scholar] [CrossRef]
- Wang, Y.; Einhorn, T. Harvest timing, crop load, and preharvest GA (3) application affect postharvest quality of ‘Lapins’ and ‘Sweetheart’ sweet cherries. Amer Soc. Hortic. Sci. 2013, 48, S399. [Google Scholar]
- Watkins, C.B. Advances in Postharvest Management of Horticultural Produce; Burleigh Dodds Science Publishing: Cambridge, UK, 2020. [Google Scholar] [CrossRef]
- Kumar, R.; Sharma, A.K. Ethylene perception and signalling in ripening fruit. In The Molecular Biology and Biochemistry of Fruit Ripening; Nath, P., Bouzayen, M., Mattoo, A.K., Pech, J.C., Eds.; CABI: Delémont, Switzerland, 2014; pp. 193–201. [Google Scholar] [CrossRef]
- Liu, M.; Wang, C.; Ji, H.; Sun, M.; Liu, T.; Wang, J.; Cao, H.; Zhu, Q. Ethylene biosynthesis and signal transduction during ripening and softening in non-climacteric fruits: An overview. Front. Plant Sci. 2024, 15, 1368692. [Google Scholar] [CrossRef] [PubMed]
- Carrion-Antoli, A.; Zoffoli, J.P.; Serrano, M.; Valero, D.; Naranjo, P. Preharvest Gibberellic Acid Treatment Increases Both Modulus of Elasticity and Resistance in Sweet Cherry Fruit (cv. ‘Bing’ and ‘Lapins’) at Harvest and Postharvest During Storage at 0 °C. Agronomy 2024, 14, 2738. [Google Scholar] [CrossRef]
- Brummell, D.A. Cell wall disassembly in ripening fruit. Funct. Plant Biol. 2006, 33, 103–119. [Google Scholar] [CrossRef]
- Shani, E.; Burko, Y.; Ben-Yaakov, L.; Berger, Y.; Amsellem, Z.; Goldshmidt, A.; Sharon, E.; Ori, N. Stage-specific regulation of Solanum lycopersicum leaf maturation by class 1 KNOTTED1-like homeobox proteins. Plant Cell 2009, 21, 3078–3092. [Google Scholar] [CrossRef] [PubMed]
- Knoche, M.; Winkler, A. The mechanism of rain cracking of sweet cherry fruit. Italus Hortus 2019, 26, 59–65. [Google Scholar] [CrossRef]
- Knoche, M.; Peschel, S. Water on the surface aggravates microscopic cracking of the sweet cherry fruit cuticle. J. Am. Soc. Hortic. Sci. 2006, 131, 192–200. [Google Scholar] [CrossRef]
- Grimm, E.; Pflugfelder, D.; Van Dusschoten, D.; Knoche, M. Physical rupture of the xylem in developing sweet cherry fruit causes progressive decline in xylem sap inflow rate. Planta 2017, 246, 659–672. [Google Scholar] [CrossRef]
- Kader, A.A. A perspective on postharvest horticulture (1978–2003). HortScience 2003, 38, 1004–1008. [Google Scholar] [CrossRef]
- Tzortzakis, N.; Chrysargyris, A. Postharvest ozone application for the preservation of fruits and vegetables. Food Rev. Int. 2016, 33, 270–315. [Google Scholar] [CrossRef]
- Karaca, H.; Velioglu, Y.S. Ozone applications in fruit and vegetable processing. Food Rev. Int. 2007, 23, 91–106. [Google Scholar] [CrossRef]
- Sisler, E.C.; Serek, M. Inhibitors of ethylene responses in plants at the receptor level: Recent developments. Physiol. Plant. 2006, 100, 577–582. [Google Scholar] [CrossRef]
Disclaimer/Publisher’s Note: The statements, opinions and data contained in all publications are solely those of the individual author(s) and contributor(s) and not of MDPI and/or the editor(s). MDPI and/or the editor(s) disclaim responsibility for any injury to people or property resulting from any ideas, methods, instructions or products referred to in the content. |
© 2025 by the authors. Licensee MDPI, Basel, Switzerland. This article is an open access article distributed under the terms and conditions of the Creative Commons Attribution (CC BY) license (https://creativecommons.org/licenses/by/4.0/).