Article

Responses of Biomass and Allometric Growth Equations of Juvenile Mangrove Plants to Salinity, Flooding, and Aboveground Competition

State Key Laboratory of Wetland Conservation and Restoration, Hainan Dongzhaigang Mangrove Wetland Ecosystem Research Station, Research Institute of Tropical Forestry, Chinese Academy of Forestry, Guangzhou 510520, China
*
Author to whom correspondence should be addressed.
Horticulturae 2025, 11(7), 712; https://doi.org/10.3390/horticulturae11070712
Submission received: 22 May 2025 / Revised: 7 June 2025 / Accepted: 19 June 2025 / Published: 20 June 2025
(This article belongs to the Section Biotic and Abiotic Stress)

Abstract

:
China has implemented large-scale mangrove restoration and afforestation initiatives in recent years. However, there has been a paucity of research on the growth of mangrove seedlings in a composite stress environment and the allometric growth equation of mangrove seedlings. To enhance juvenile mangrove survival rates and develop precise carbon sequestration models, this study examines biomass accumulation patterns and allometric equation development under diverse environmental and biological conditions. A manipulative field experiment employed a three-factor full factorial design using seedlings from eight mangrove species. The experimental design incorporated three variables: salinity, flooding (environmental stressors), and aboveground interspecific competition (a biological factor). Following a two-year growth period, measurements of surviving seedlings’ basal diameter, plant height, and above- and belowground biomass were collected to assess growth responses and construct allometric models. Results indicated that high salinity reduced total mangrove biomass, whereas prolonged flooding increased tree height. Interspecific competition favored fast-growing species (e.g., Sonneratia caseolaris) while suppressing slow-growing counterparts (e.g., Avicennia marina). Synergistic effects between salinity and flooding influenced biomass and basal diameter, whereas salinity–flooding and salinity–competition interactions demonstrated antagonistic effects on tree height. High salinity, prolonged flooding, and competition elevated the proportion of aboveground biomass allocation. The results suggest that salinity stress and flooding stress were major growth-limiting factors for juvenile mangroves. Slow-growing species are not suitable to be mixed with fast-growing species in mangrove afforestation projects. Allometric models fitting for juvenile mangroves growing under different environmental factors were also developed. This study deepens our understanding of the growth of mangrove seedlings under composite stress conditions, provides effective tools for assessing the carbon sink potential of mangrove seedlings, and provides scientific guidance for future mangrove restoration projects.

1. Introduction

Mangrove forests represent a highly productive type of coastal blue carbon ecosystem, and are considered to be the most carbon-rich tropical forests on the planet [1]. They also provide a rich biodiversity in the coastal zone [2], and have been shown to play a significant role in disaster prevention and mitigation [3]. In recent years, China has incorporated mangrove restoration into both the Wetland Protection Law of the People’s Republic of China (PRC) and the twin goals of carbon peak and carbon neutrality. By the end of 2024, China’s mangrove area has grown to 30,300,000 hectares [4]. According to the Special Action Plan for the Protection and Restoration of Mangrove Forests (2020–2025), China plans to create and restore 18,800 hectares of mangrove forests by 2025, 9050 of which will be newly created [5]. Consequently, the study of the growth response mechanisms of juvenile mangrove plants to biotic and abiotic factors after planting, as well as the provision of more accurate carbon sink accounting tools for juvenile mangrove plants, are pivotal issues that need to be addressed.
Understanding how juvenile mangrove plants respond to environmental and biological factors can provide theoretical guidance for mangrove restoration projects, improving their success and effectiveness. Environmental factors of stress include salt ion toxicity, flooding [6,7] and metabolic inhibition [8]. Meanwhile, biological factors involve interspecific competition (e.g., light resource competition, root competition) [9] and predation by phytofauna [10]. The survival and growth performance of juvenile mangroves is contingent upon the manifestation of phenotypic plasticity [11]. A review of the extant literature reveals a preponderance of single-factor studies in the context of mangrove ecosystems under the influence of abiotic factors (e.g., salinity, inundation, etc.) [6,12]. Nevertheless, the extant literature on multifactor interactions remains relatively limited [13]. Concurrently, while researchers have acknowledged the significance of examining combined stresses on mangrove ecosystems, there remains a paucity of empirical studies to quantitatively ascertain the magnitude and extent of these stresses. In earlier research, the exploration of abiotic factor stress has predominantly been conducted through the utilization of greenhouse culture experiments [14,15]. Nevertheless, the paucity of studies on field sample plot experiments may compromise the accuracy of their reflection of real-world conditions.
The allometric growth equation is a core tool for mangrove carbon sink monitoring, the purpose of which is to estimate biomass through morphological parameters (e.g., basal diameter, tree height). This is particularly pertinent in the context of large-scale mangrove creation and restoration projects undertaken in recent years. Accurate assessment of the biomass of young mangrove trees is therefore a necessary tool for providing carbon sink accounting for mangrove restoration projects. Presently, the study of the allometric growth equation of adult mangrove plant has been more extensively researched [16,17,18]. However, there is a paucity of research conducted on the application of allometric growth equations to juvenile mangroves [19]. This area of research remains uncertain due to variations in tree species and geographical location [20], as well as interactive stresses from complex environmental factors.
It is evident that biomass allocation patterns (e.g., root-crown ratio, biomass trade-offs between photosynthetic and non-photosynthetic organs) serve as key adaptive strategies in juvenile mangroves, enabling them to achieve ecological trade-offs between survival, defense and growth and reproduction. This is achieved by regulating the proportion of resources invested in organs such as roots, stems and leaves [21]. Current research has proposed two key theories to explain biomass partitioning patterns between organs: the Optimal Partitioning Theory (OPT) and the Allometric biomass Partitioning Theory (APT). OPT posits that plants undergo dynamic adjustments to their biomass allocation in order to optimize their fitness in heterogeneous habitats [22,23]. The APT asserts that the allocation of resources among organs is contingent on changes in plant size during the developmental process. It is further posited that the growth ratios among organs adhere to a predetermined mathematical relationship, which is widely regarded as being genetically and developmentally regulated and conserved [24,25]. However, in intertidal habitats, the stresses of biotic and environmental factors, and their multidimensional interactions (e.g., salinity–flooding synergies) have the potential to significantly alter resource allocation to young mangrove trees. Consequently, the complexity of their adaptive strategies may be far greater than theoretically predicted under a single abiotic factor stress or competition scenario.
This study aims to experimentally investigate the effects of salinity levels, flooding regimes, and aboveground interspecific competition—as well as their interactions—on two key aspects of juvenile mangrove growth across eight species: (1) growth traits and biomass allocation patterns, and (2) parameters of allometric growth equations.

2. Materials and Methods

2.1. Test Site and Materials

Field control experiments were conducted in Dongzhaigang Mangrove National Nature Reserve, Hainan, China (N 19°55′, E 110°36′, Figure 1A), which is one of the richest sites for mangrove tree species in China. At the same time, the area is a harbor-type lagoon, showing a clear natural salinity gradient along the northern end of the lagoon (outer bay, high salinity area, Figure 1B) towards the southern end of the lagoon (inner bay, low salinity area, Figure 1C) [7], which facilitates the layout of experimental sample sites. A plethora of studies have previously been conducted on the climatic and hydrological conditions of the region [26]. In the present study, juvenile mangrove specimens of eight prevalent species were designated as Aegiceras corniculatum, Avicennia marina, Bruguiera gymnorhiza, Ceriops tagal, Kandelia obovata, Lumnitzera racemosa, Rhizophora stylosa, and Sonneratia caseolaris. Among them, A. marina is typically observed to manifest as a shrub. A. corniculatum, B. gymnorhiza, C. tagal, K. obovata, L. racemosa, and R. stylosa growth form are susceptible to influence from environmental factors and can develop into shrubs or small trees. And the S. caseolaris is a typical tree.

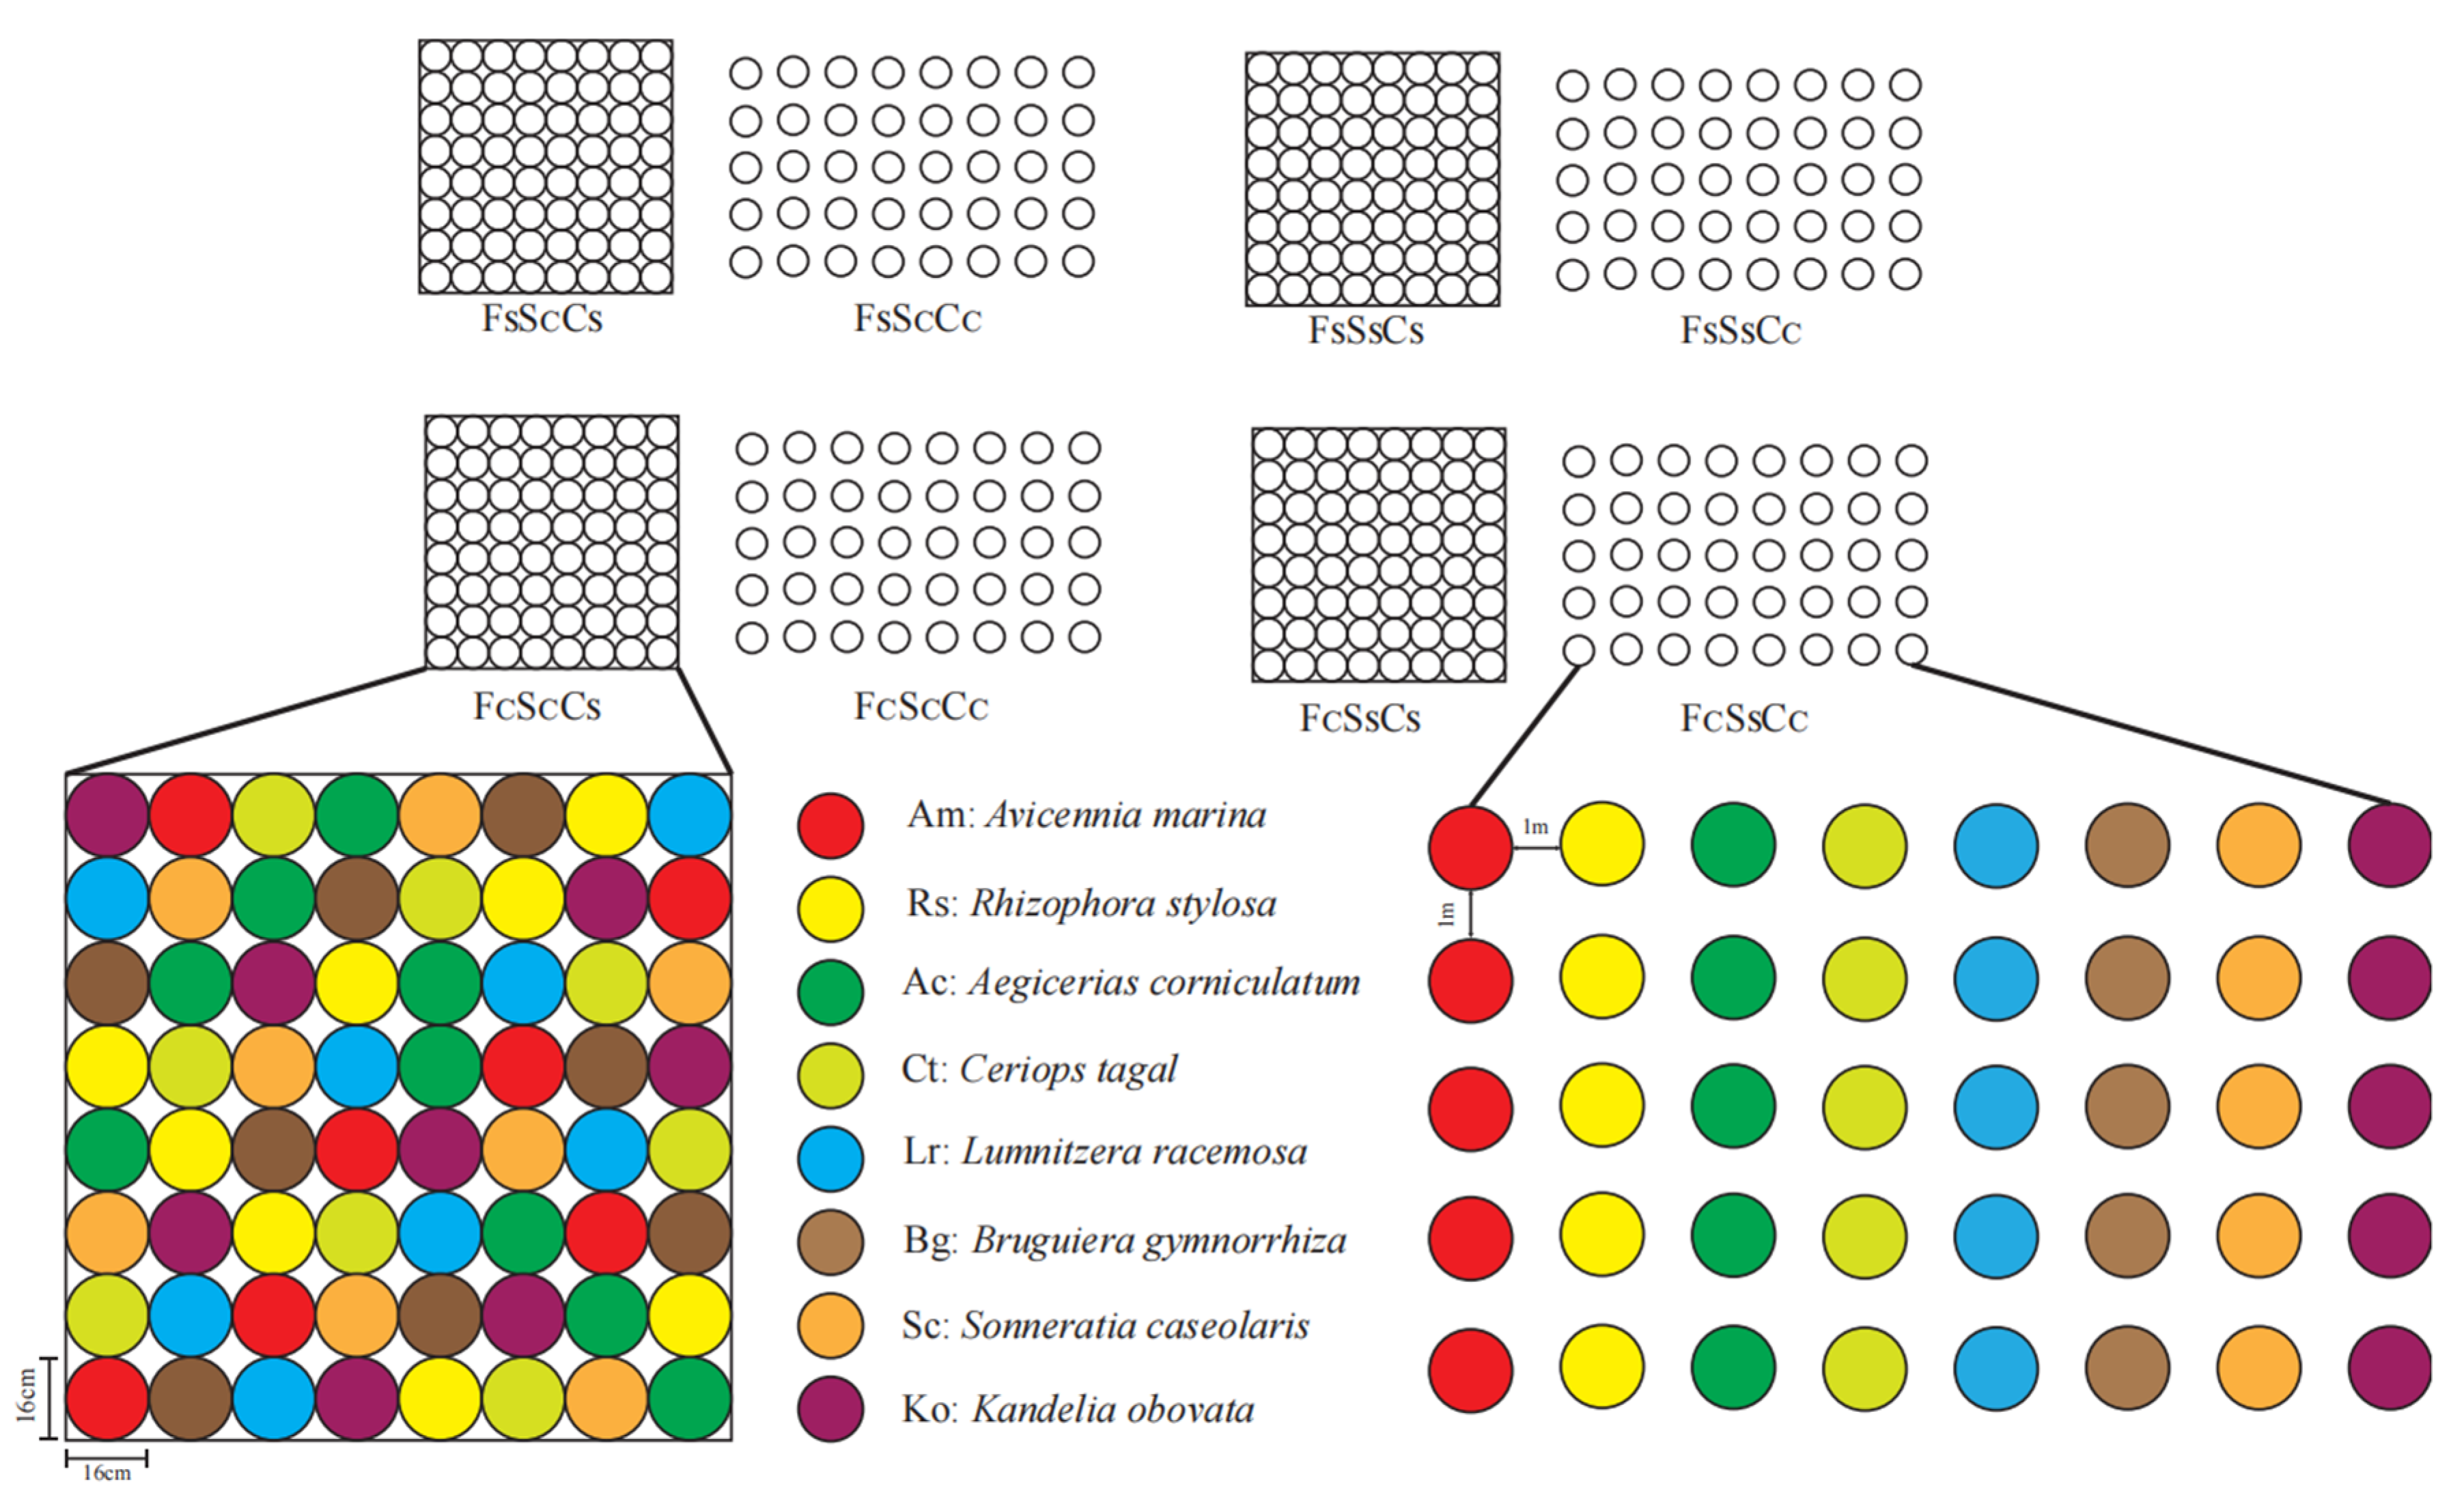
2.2. Field Plot Experiment Design

In this study, a three-factor (flooding, salinity, interspecific aboveground competition) and two-level (Control CK and Stressed) complete combination design was used to form a total of eight treatments (Figure 2). The two salinity levels were achieved by establishing plots in different locations in Dongzhai Bay. The estuary of the Sanjiang River, located in the inner bay, constituted a low-salinity environment with a water column salinity of 4.95‰ and a soil pore water salinity of 19.00‰, which represents the salt control (SC), because most mangrove plant species grow best under this salinity condition. Tashi, located in the outer bay, is a high salinity environment with a water salinity of 18.22‰ and a soil pore water salinity of 30.38‰, representing high salt stress (SS). In each plot, mangrove plants were planted in 16 cm diameter PVC pipes, and the top of pipes were set at two elevations to represent two inundation levels: the inundation control, Fc, was set at 40 cm above mean sea level (mid-tide) because most mangrove plant species grow best at the mid-tide level; and the flooding stress, Fs, was set at mean sea level (low tide). Two aboveground competition levels were set up for each flooding level in each plot: the no competition treatment (CC) was set up by arranging plants (planted in pipes) with 1 m spacing (n = 5 per species), and the competition treatment (CS) was set up by arranging plants with 0.16 m spacing (n = 8 per species, with the position of each species randomized in each column, Figure 2). Following the observation of aboveground competition within the plots, intervention was ceased in plots where aboveground interspecific competition existed, thus allowing the mangrove saplings within the plots to grow naturally until the conclusion of the experiment.
The eight treatment combinations included FCSCCC (CK); FSSCCC (Flooding stress); FCSSCC (Salinity stress); FCSCCS (Interspecific aboveground competition); FSSCCS (Flooding stress + Interspecific aboveground competition); FCSSCS (Salinity stress + Interspecific aboveground competition); FSSSCC (Flooding stress + Salinity stress); and FSSSCS (Flooding stress + Salinity stress + Interspecific aboveground competition). The experiment started in June 2022 and ended in July 2024. Following the transplantation of 6-month-old seedlings, competition was observed in treatments of FCSCCS, FSSCCS, FCSSCS and FSSSCS in September 2022. Survival rate was measured during the experiment period (Table S1).

2.3. Measurement of Plant Biomass and Fitting of Allometric Growth Equation

Following a period of two years, the plants were harvested to determine the basal diameter (D), tree height (H), aboveground biomass (AGB), belowground biomass (BGB) and total biomass (TB). The biomass samples of the aboveground part (including tree trunk, branches, and leaves) and the underground part were divided and bagged, put into an oven, and dried to a constant weight at 85 °C, and the mass of the aboveground part and the underground part was weighed separately. The constant weight of each plant individual was thus obtained as biomass. In this study, allometric growth models of mangrove species were constructed using a single basal diameter (D), a single tree height (H) and their combined parameters (DH, D2H, DH2) as predictor variables. The linear and exponential models employed are delineated in Equations (1) and (2), respectively. A natural logarithmic transformation (ln) was also performed simultaneously on the left and right sides of Equation (2) to ensure a linear relationship between the variables and to satisfy the heteroskedasticity requirement [27] to obtain Equation (3). Model fitting was based on Equations (1) and (3).
TB = a + bX,
TB = aXb,
ln(TB) = ln(a) + bln(X),
Among them, TB represents the biomass of mangrove vegetation (kg); X represents the predicted variables, including D, H, DH, D2H and DH2; a and b are model coefficients; D represents the basal diameter of plants (cm); H represents the plant height (m).

2.4. Data Analysis

The analysis of the biomass data (TB, AGB/TB) from this study was conducted using the “stats” “broom” “dplyr” packages of R (v4.4.2). A three-way analysis of variance (ANOVA) was performed to ascertain the primary effects of salinity, inundation, and aboveground interspecific competition, as well as their interaction effects. A two-factor (tree species and stressor) ANOVA was additionally conducted to clearly present the role of tree species in stress response. The allometric growth equation model was fitted using the “dplyr”, “tidyr”, and “Metrics” packages of R (v4.4.2) and the model was calculated. The coefficient of determination (R2) and the significance level of the regression test (p-value) were utilized to evaluate the model effect. In the preceding statistical analysis, the significance level was set at p = 0.05.

3. Results

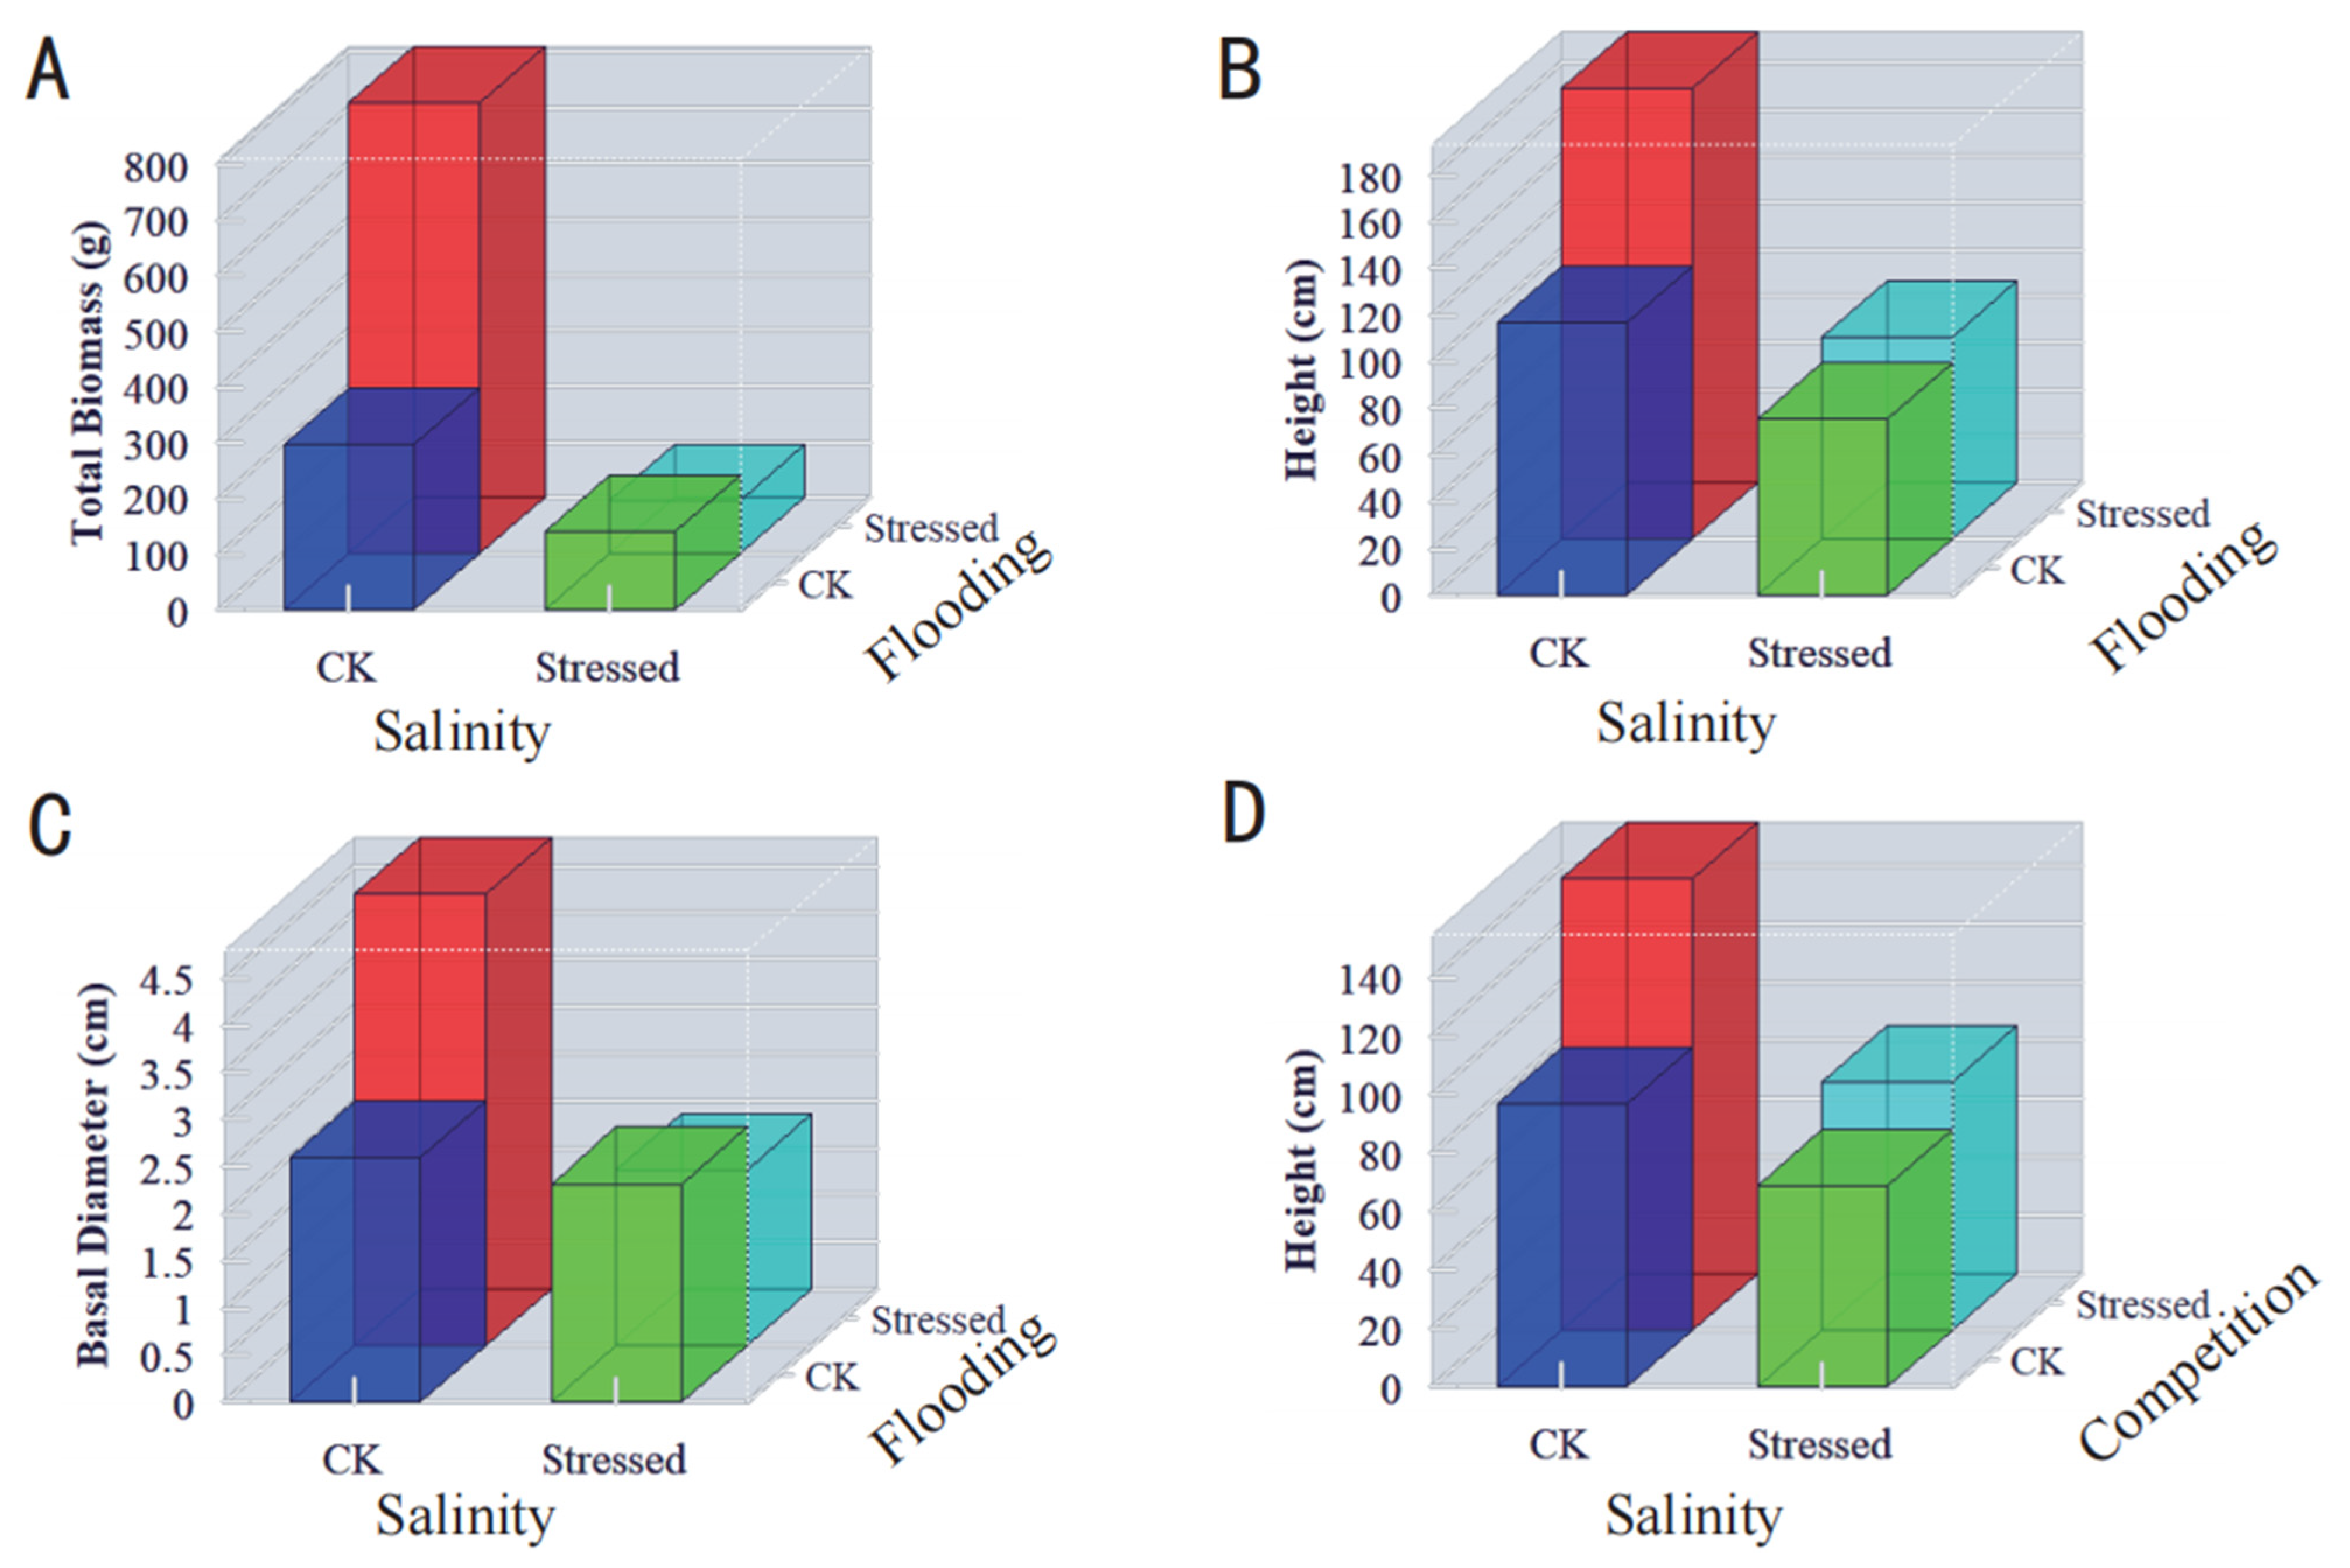
3.1. Effects of Environmental and Biotic Stresses and Their Interactive Effects on Growth and Biomass of Juvenile Mangrove Plants

Three-way ANOVA showed that salinity and inundation had a significant effect on total biomass, plant height, and basal diameter of juvenile mangroves (p < 0.01, Table 1). Salinity stress induced a 112.30% decrease in total biomass, an 84.61% decrease in basal diameter, and a 64.04% decrease in tree height in mangrove saplings. Flooding stress caused a 170.90% surge in total biomass, an 84.61% surge in basal diameter, and a 64.04% surge in tree height in mangrove saplings. The presence of aboveground interspecific competition resulted in a 60.36% increase in tree height in mangrove saplings (p < 0.01, Table 1, Figure 3).
The interaction effect of salinity and flooding significantly affected total biomass, plant height and basal diameter of young mangrove trees (p < 0.01, Table 1). Total biomass and basal diameter were lower under dual stresses of salinity and flooding than under single stress, indicating that salinity stress and flooding stress had additive or synergistic effects on total biomass and basal diameter of mangrove plants. Salinity stress and flooding stress had antagonistic effects on the tree height of mangrove plants, with tree height being higher under dual stress than under single salt stress (Figure 3A–C).
The interaction effect of salinity and interspecific aboveground competition significantly affected plant height of juvenile mangroves (p < 0.01, Table 1). Tree height was higher under dual stress of salinity and interspecific aboveground competition than under single salinity stress, indicating that salinity and interspecific aboveground competition stresses had antagonistic effects on tree height in juvenile mangroves (Figure 3D).
A two-way ANOVA analysis of salinity and tree species showed that salinity, tree species and their interaction effects significantly affected the total biomass of juvenile mangrove plants (p < 0.001, Figure 4A). Overall, the total biomass of juvenile mangrove plants was significantly higher in low-salinity than in high-salinity environments (p < 0.001, Figure 4A). However, there was a significant interaction effect between salinity and tree species, with salinity inhibiting the total biomass of some tree species, such as A. corniculatum, B. gymnorhiza, K. obovata, L. racemosa and S. caseolaris. The effect on the total biomass of some other tree species was not significant, such as A. marina, C. tagal and R. stylosa.
A two-way ANOVA of flooding and tree species showed that the effect of flooding on total biomass was not significant (p > 0.05, Figure 4B), whereas tree species and the interaction effect of flooding and tree species significantly affected the total biomass of mangrove plants (p < 0.001, Figure 4B). Flooding stress had an inhibitory effect on the total biomass of some tree species, such as A. corniculatum, A. marina, B. gymnorhiza and K. obovata, while contributing to the accumulation of total biomass of S. caseolaris.
A two-way ANOVA of aboveground interspecific competition and tree species showed that the effect of aboveground interspecific competition on total biomass was not significant (p > 0.05, Figure 4C). Whereas tree species and the interaction effects of aboveground interspecific competition and tree species significantly affected the total biomass of juvenile mangrove plants (p < 0.001, Figure 4C). Interspecific competition on the ground had an insignificant effect on the total biomass of some tree species, such as B. gymnorhiza, C. tagal, K. obovata and R. stylosa, whereas it had an inhibitory effect on the total biomass of A. marina and promoted the accumulation of total biomass of S. caseolaris.

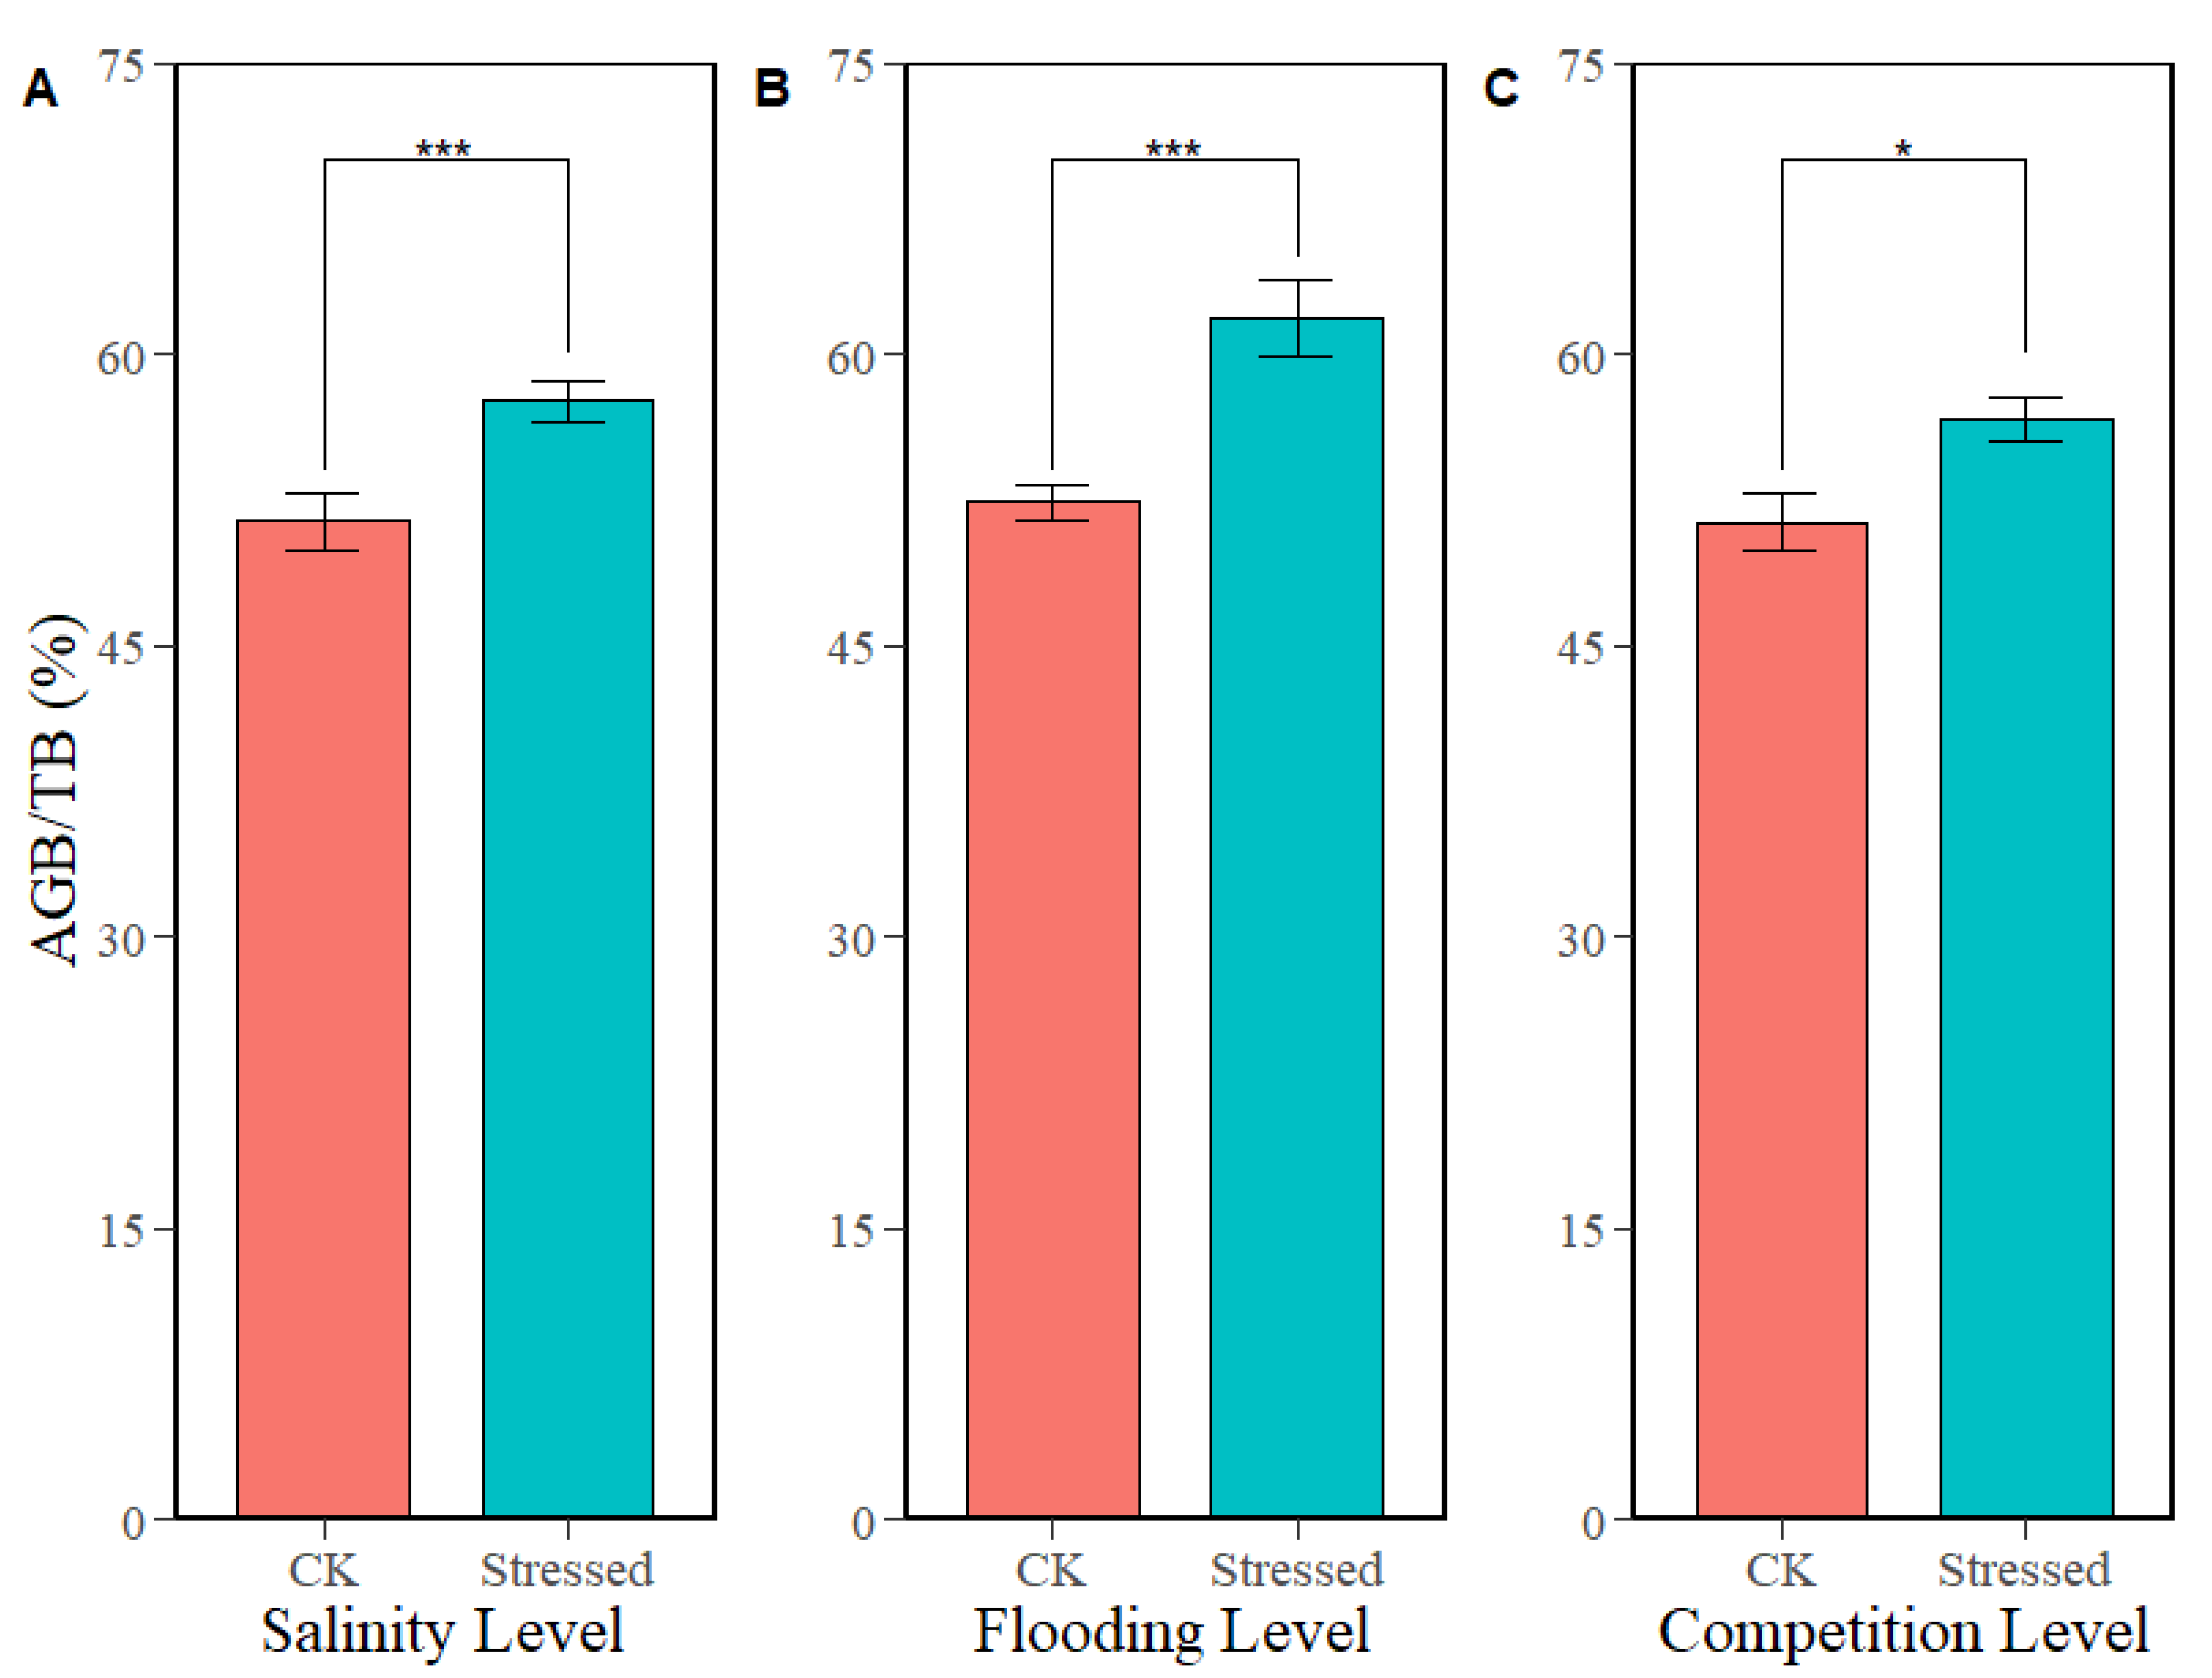
3.2. Effects of Environmental and Biotic Stresses and Their Interactive Effects on Biomass Allocation of Juvenile Mangrove Plants

A three-way ANOVA showed that salinity, flooding, and aboveground interspecific competition all affected biomass allocation of juvenile mangrove plants (p < 0.001 or p < 0.05, Table 2, Figure 5). High salinity levels, low tide level habitat and the presence of interspecific competition all increased proportion of aboveground biomass (AGB/TB) of young mangrove trees.
The results of two-way ANOVA with salinity and tree species showed that salinity significantly affected the AGB/TB of juvenile mangrove plants, and the AGB/TB of juvenile mangrove plants grown in a high salinity environment was significantly higher than that in a low salinity environment (p = 0.003, Figure 6A). The results of the two-way ANOVA of inundation and tree species showed that inundation significantly affected the AGB/TB of juvenile mangrove plants, and the AGB/TB of juvenile mangrove plants grown at low tide was significantly lower than that of juvenile mangrove plants grown at mid-tide (p < 0.001, Figure 6B). The results of two-way ANOVA of aboveground interspecific competition and tree species showed that aboveground interspecific competition significantly affected AGB/TB of juvenile mangrove plants (p = 0.002, Figure 6C). However, there was a significant interaction effect between aboveground interspecific competition and tree species, with aboveground interspecific competition causing a decrease in AGB/TB for R. stylosa and no effect on AGB/TB for A. corniculatum and C. tagal.

3.3. The Allometric Growth Equation of Juvenile Mangrove Was Fitted Under Different Environmental and Biological Factors

The allometric growth equation fitted using Equations (1) and (3) have more consistent R2 and p values, and the data structure of Equation (1) is relatively simple, so the results of Equation (1)’s fit are used for presentation.
A range of allometric growth equation were fitted to juvenile mangrove at varying levels of salinity, flooding and competition levels (Tables S2–S4). B. gymnorhiza, C. tagal and L. racemosa can successfully fit the allometric growth equation only at low salinities (p < 0.05), while A. marina, K. obovata and R. stylosa were only able to successfully fit the allometric growth equation at high salinity levels (p < 0.05). A. corniculatum (Figure 7A–C) and S. caseolaris (Figure 7D–F) successfully fitted the allometric growth equation at both salinity levels (p < 0.05, Table S2). Various mangroves at different tide levels and different levels of competition were not able to successfully fit the allometric growth equation (p > 0.05). The results of the study showed that the slopes of the allometric growth equation for total biomass of A. corniculatum and S. caseolaris presented higher values in low salinity environments compared to high salinity environments (Figure 7).
For each tree species, an allometric growth equation was successfully fitted by combining all treatments. In addition, a total allometric growth equation for juvenile mangrove was also successfully fitted by combining all treatments for all tree species (p < 0.001, Table 3).

4. Discussion

The combined stress of high salinity and low tide level exerted a synergistic effect on the inhibition of biomass and growth of juvenile mangrove trees. The results obtained in this study are analogous to those reported in earlier research [28]. It is important to consider the potential interaction between these two abiotic factors and its subsequent effect on the growth and development of juvenile mangrove trees. For instance, research has demonstrated that the flooding tolerance threshold of mangrove plants is influenced by salinity levels [29,30]. Such outcomes could also be attributed to the synergistic effect of elevated salinity levels and protracted periods of inundation, resulting in the suppression of biomass and the growth of juvenile mangrove trees. An elevated salt environment has been demonstrated to engender an increase in the osmotic pressure external to the plant cells. This, in turn, precipitates the osmosis of water from the inside of the plant cells to the outside, resulting in the loss of cellular water. Consequently, this engenders an insufficiency of water supply within the plant, which in turn exerts an effect on the physiological activities of the plant, including, but not limited to, photosynthesis, respiration, and transpiration [31,32,33]. Elevated salinity levels in the soil result in augmented Na+ and Cl concentrations, thereby inducing secondary stresses such as ionic stress, hyper-osmotic stress, and oxidative damage in plants. In conditions of elevated environmental salinity, there is a rapid decline in the transpiration rate of plants, which can result in premature senescence of leaves, a reduction in the photosynthetic area, and a decrease in the activity of carboxylase in the chloroplasts. This, in turn, can lead to a reduction in the photosynthetic rate [34,35]. At the same time, high salinity levels encourage the production of phytohormones in juvenile trees [36], but tend to hinder the growth of young mangrove trees. Concurrently, elevated salinity levels impede microbial activity [37], thereby constraining nutrient release [38]. This, in turn, precipitates a decline in the quality of mangrove stand habitats [39], consequently diminishing the efficiency of nutrient acquisition by mangrove plants. This in turn has an impact on the growth of juvenile mangrove trees. Physiological functions such as respiration, photosynthesis, and leaf flesh conductivity of mangrove plants will be weakened under hypoxic conditions caused by prolonged flooding [40,41,42], which will result in a decrease in the amount of energy used for nutrient growth. Therefore, in the process of mangrove restoration, the selection of tree species should be informed by considerations such as the local elevation of tidal flat and the salinity, thereby ensuring the optimal growth of juvenile mangrove trees.
Salinity and aboveground interspecific competition have antagonistic effects on the height of juvenile mangroves. Consequently, there was no significant difference in height between juvenile mangrove trees grown in a low-salinity, non-competitive environment and those grown in a high-salinity, competitive environment. This may be because shade avoidance syndrome, which is caused by ground competition, tends to encourage the upward growth of various juvenile trees [43,44]. Shade avoidance syndrome is a morphological response produced by plants when they perceive a decrease in the ratio of red light to far-red light through photosensitive pigments [45]. In this study, leaf shading caused by interspecific aboveground competition was the direct cause of this phenomenon. Genetic analysis of the model plant Arabidopsis thaliana revealed that the photoreceptor phyB plays a crucial role in regulating the shade-avoidance response in plants. Following shading, it detects changes in the ratio of red to far-red light and interacts with photoreceptor-interacting factors (PIFs). This activates auxin synthesis genes and promotes stem elongation [46]. However, more research is needed to understand how this physiological phenomenon affects young mangrove trees.
This study also found that, in stressful environments such as high salt levels, prolonged flooding or the presence of interspecific aboveground competition, juvenile mangrove trees preferred to allocate biomass to their aboveground parts (Figure 5). The finding that juvenile mangrove trees allocated more biomass to their aboveground parts under salt stress was consistent with the results of previous studies on coastal saline plants [47]. As the primary tissue exposed to salt stress, the root system is more sensitive than the aboveground parts. Therefore, when plants are under salt stress, they reduce the allocation of biomass to the root system. This results in lower salt uptake by the root system and reduced salinity transport to the aboveground parts, thus enhancing the plant’s salt tolerance [48]. It may also be due to the fact that, under conditions of high salinity, mangrove plants increase the formation and function of structures such as the cuticle and salt glands in order to enhance their resilience [49], thereby increasing the biomass of the aboveground portion. The present study found that, under prolonged flooding stress, the biomass of mangrove plants was distributed to the aboveground part. This may be because, under flooding stress, there is insufficient oxygen in the soil portion, which suppresses the respiration of the plant’s root system [50]. In order to maintain normal physiological functions, plants will allocate more biomass to aboveground parts to enhance respiration in the aboveground parts and improve the plants’ ability to acquire and utilize oxygen, thus adapting to the hypoxic environment. Concurrently, waterlogging imposes constraints on root development, thereby diminishing the crop’s capacity to absorb nutrients and water [51]. This phenomenon compels mangrove plants to allocate a greater proportion of their biomass to the aboveground portion.
In the context of aboveground interspecific competition, juvenile mangrove trees exhibited a higher percentage of aboveground biomass compared to their counterparts that were not subjected to such competition. However, the biomass of the remaining mangrove species was unaffected by the increase in plant height, with the exception of S. caseolaris, where the total biomass of A. marina was significantly reduced. This phenomenon may be attributable to the observation that interspecific competition in the aboveground portion of the plant results in a relative increase in its height. However, this increase may be accompanied by a reduction in the aboveground portion of the young mangrove, manifested as a decrease in stem thickness or the number of lateral branches [52]. Such results also suggest that aboveground interspecific competition is not a major factor influencing the growth of young mangrove trees. We suggest that some plants may be able to exploit competitive advantages through more efficient resource acquisition strategies, thereby influencing the relative biomass between tree species [53]. Consequently, in mangrove restoration initiatives, it is imperative to consider not only the functions of wind protection and wave reduction, but also to devise a mixing ratio that aligns with the competitive characteristics of the tree species. This approach is pivotal in averting the monopolization of resources by a single tree species, thereby ensuring the resilience of the ecosystem.
The findings of this study are in accordance with the optimal partitioning theory (OPT). In this study, the hypothesis that mangrove plants grown under conditions of high salt stress would allocate more biomass to the ground in response to salt stress was tested. The results demonstrated that this was the case (Figure 5). The hypothesis that mangrove plants grown under conditions of low tide would allocate more biomass in response to flooding stress was also tested, and the results confirmed this. Finally, the hypothesis that mangrove plants grown under an aboveground interspecific competition environment would allocate more biomass to the ground in response to aboveground interspecific competition was tested, and this hypothesis was also confirmed (Figure 5). It is evident that such a biomass allocation pattern is consistent with the survival prioritization strategy of the OPT [54]. However, these results deviate from the anisotropic growth theory (APT). This phenomenon may be attributed to the anisotropic growth theory, which posits that the development of an organism’s organs follows a predetermined proportionality (e.g., the distribution ratio of roots, stems, and leaves). This ratio is primarily governed by genetic and developmental mechanisms, resulting in a conserved and predictable pattern [55]. In contrast, the stresses of abiotic and biotic factors in this study resulted in the need for mangrove plants to prioritize their own survival, thus disrupting the original heterochronous growth equilibrium. This phenomenon suggests that under extreme environmental stresses, mangrove plants may achieve dynamic optimization of resource allocation through phenotypic plasticity, thus achieving the goal of survival under extreme environmental conditions. Unfortunately, there are currently limited studies that directly validate or compare OPT or APT in saline–alkali or mangrove ecosystems, and those that are highly similar to our research are scarce, making it difficult to conduct a comparative analysis with the results of this study. It is recommended that future research focus on conducting more validation studies on OPT and APT in different ecological environments, particularly in saline–alkali and mangrove environments, to further refine and deepen our understanding of the theoretical and practical aspects of this field.
In the present study, allometric growth equations were found to be incompatible with various mangroves at different tide levels and varying levels of competition. This outcome may be attributable to inadequate sample size and suboptimal heterogeneity within the study. This phenomenon may also be attributed to the influence of environmental factors, particularly flooding. This forces seedlings to undergo non-equilibrium resource allocation and morphological adjustments, which fundamentally alter the quantitative relationship between their structure (size) and function (biomass accumulation), i.e., allometric relationships. Based on the findings of this study, we recommend including at least 15 samples in the statistical analysis for each stress condition to improve the accuracy of the results, and to fully consider the mortality of mangrove seedlings during cultivation. To avoid issues of weak data heterogeneity, subsequent researchers should avoid harvesting biomass from all mangrove seedlings at once and instead conduct harvests in batches every six months or annually. Furthermore, we recommend incorporating nonlinear models combined with long-term observations in future studies to examine the growth patterns of young mangrove plants more thoroughly.

5. Conclusions

In this study, we systematically analyzed the effects of salinity, flooding, and interspecific competition on the biomass of juvenile mangrove trees, their allocation patterns and allometric growth equation. This analysis was conducted to support intertidal ecological restoration projects. Salinity and flooding stresses significantly elevated the aboveground biomass allocation ratio of juvenile mangrove trees. And salinity stresses suppressed total biomass accumulation. Interspecific competition exerted a differentiating effect: A. marina biomass was significantly lower and S. caseolaris biomass was significantly higher in the presence of aboveground interspecific competition compared to the absence of aboveground interspecific competition. This suggests that fast-growing mangrove species have a significant competitive advantage in young mixed forests, and that abiotic factors dominate the early growth stage of mangrove plants. Concurrently, the present study ascertained that the interaction between salinity and flooding stress exerted synergistic effects on total biomass and basal diameter of juvenile mangrove trees. The interaction between salinity and flooding stress, in conjunction with the interaction between salinity and aboveground interspecific competition, engendered antagonistic effects on plant height. This study validates the extension of the optimal partitioning theory (OPT), which states that under abiotic stress, mangrove plants prioritize survival through a “stem conservation strategy” that prioritizes biomass partitioning to aboveground parts. At the same time, silvicultural practices involving the cultivation of S. caseolaris and A. marina in combination with A. corniculatum, B. gymnorhiza, C. tagal, K. obovata, L. racemosa, R. stylosa, and other species are strongly discouraged. Furthermore, in this study, eight species of juvenile mangrove trees and their combined data were fitted with allometric growth equations in order to provide a more accurate tool for the measurement of carbon sinks in juvenile mangrove trees.

Supplementary Materials

The following supporting information can be downloaded at https://www.mdpi.com/article/10.3390/horticulturae11070712/s1. There are Supplementary data and Supplementary Tables. The Supplementary tables include Table S1: Survival rates of various mangrove plant seedlings under different stress environments; Table S2: Allometric growth equation fitting model of mangrove plants grown at different salinity levels in this study; Table S3: Allometric growth equation fitting model of mangrove plants grown at different flooding levels in this study; Table S4: Allometric growth equation fitting model of mangrove plants grown at different competition levels in this study; Table S5: Allometric growth equation fitting model for all mangrove plants in this study. The title of Supplementary data is Supplementary Data.

Author Contributions

Conceptualization, Y.X.; methodology, Y.X.; formal analysis, K.H.; investigation, K.H., W.W., W.Q., N.S. and J.C.; resources, Y.X.; data curation, K.H. and W.W.; writing—original draft preparation, K.H.; writing—review and editing, Y.X. All authors have read and agreed to the published version of the manuscript.

Funding

This research was funded by Guangdong basic and applied basic research foundation, grant number 2022A1515010550, and Fundamental Research Funds of CAF, grant number CAFYBB2024QF043.

Data Availability Statement

The original contributions presented in this study are included in the article/supplementary material. Further inquiries can be directed to the corresponding author(s).

Conflicts of Interest

The authors declare no conflicts of interest.

Abbreviations

The following abbreviations are used in this manuscript:
TBTotal Biomass
AGBAboveground Biomass
BGBBelowground biomass
HHeight
DBasal Diameter
AcAegiceras corniculatum
AmAvicennia marina
BgBruguiera gymnorhiza
CtCeriops tagal
KoKandelia obovata
LrLumnitzera racemosa
RsRhizophora stylosa
ScSonneratia caseolaris

References

  1. Donato, D.C.; Kauffman, J.B.; Murdiyarso, D.; Kurnianto, S.; Stidham, M.; Kanninen, M. Mangroves among the Most Carbon-Rich Forests in the Tropics. Nat. Geosci. 2011, 4, 293–297. [Google Scholar] [CrossRef]
  2. Sandilyan, S.; Kathiresan, K. Mangrove Conservation: A Global Perspective. Biodivers. Conserv. 2012, 21, 3523–3542. [Google Scholar] [CrossRef]
  3. Xu, X.; Fu, D.; Su, F.; Lyne, V.; Yu, H.; Tang, J.; Hong, X.; Wang, J. Global Distribution and Decline of Mangrove Coastal Protection Extends Far beyond Area Loss. Nat. Commun. 2024, 15, 10267. [Google Scholar] [CrossRef] [PubMed]
  4. Ministry of Natural Resources, PRC. 2024 China Natural Resources Bulletin; Ministry of Natural Resources, PRC: Beijing, China, 2025.
  5. Ministry of Natural Resources, PRC; National Forestry and Grassland Administration, PRC Special Action Plan for Mangrove Protection and Restoration (2020–2025). Available online: https://www.gov.cn/zhengce/zhengceku/2020-08/29/content_5538354.htm (accessed on 23 April 2025).
  6. Arachchilage, S.; Pulukkutige, P.; Ranasinghe, P.; Madarasinghe, S.; Dahdouh-Guebas, F.; Koedam, N. Stress-Induced Carbon Starvation in Rhizophora mucronata Lam. Seedlings under Conditions of Prolonged Submergence and Water Deficiency: Survive or Succumb. Bot. Serbica 2020, 44, 149–162. [Google Scholar] [CrossRef]
  7. Wang, W.; Xin, K.; Chen, Y.; Chen, Y.; Jiang, Z.; Sheng, N.; Liao, B.; Xiong, Y. Spatio-Temporal Variation of Water Salinity in Mangroves Revealed by Continuous Monitoring and Its Relationship to Floristic Diversity. Plant Divers. 2024, 46, 134–143. [Google Scholar] [CrossRef]
  8. Servais, S.; Kominoski, J.; Davis, S.; Gaiser, E.; Pachón, J.; Troxler, T. Effects of Nutrient-Limitation on Disturbance Recovery in Experimental Mangrove Wetlands. Wetlands 2019, 39, 337–347. [Google Scholar] [CrossRef]
  9. Liang, F.; Hu, J.; Lin, Y.; Li, L.; Yu, Y.; Liu, B.; Meng, Z.; Xiang, Z.; Tan, X. Interspecific Competition and Survival Pressures in Endangered Barringtonia Racemosa Populations of Mainland China. Sci. Rep. 2024, 14, 31190. [Google Scholar] [CrossRef]
  10. Ahouangan, B.S.C.M.; Koura, B.I.; Sèwadé, C.; Toyi, M.S.; Lesse, A.D.P.; Houinato, M.R.B. Ruminant Keeping around Mangrove Forests in Benin (West Africa): Herders’ Perceptions of Threats and Opportunities for Conservation of Mangroves. Discov. Sustain. 2022, 3, 13. [Google Scholar] [CrossRef]
  11. Saintilan, N.; Khan, N.S.; Ashe, E.; Kelleway, J.J.; Rogers, K.; Woodroffe, C.D.; Horton, B.P. Thresholds of Mangrove Survival under Rapid Sea Level Rise. Science 2020, 368, 1118–1121. [Google Scholar] [CrossRef]
  12. Chatting, M.; LeVay, L.; Walton, M.; Skov, M.W.; Kennedy, H.; Wilson, S.; Al-Maslamani, I. Mangrove Carbon Stocks and Biomass Partitioning in an Extreme Environment. Estuar. Coast. Shelf Sci. 2020, 244, 106940. [Google Scholar] [CrossRef]
  13. Zhu, G.; Huang, A.; Qin, Y. Analysis of Development Trend of International Mangrove Research Based on Web of Science. J. Guangxi Norm. Univ. Sci. Ed. 2024, 42, 1–12. [Google Scholar]
  14. Gillis, L.G.; Hortua, D.A.S.; Zimmer, M.; Jennerjahn, T.C.; Herbeck, L.S. Interactive Effects of Temperature and Nutrients on Mangrove Seedling Growth and Implications for Establishment. Mar. Environ. Res. 2019, 151, 104750. [Google Scholar] [CrossRef] [PubMed]
  15. Kimera, F.; Sobhi, B.; Omara, M.; Sewilam, H. Impact of Salinity Gradients on Seed Germination, Establishment, and Growth of Two Dominant Mangrove Species Along the Red Sea Coastline. Plants 2024, 13, 3471. [Google Scholar] [CrossRef]
  16. Abdul-Hamid, H.; Mohamed, J.; Abiri, R.; Naji, H.; Jalil, M. Allometric Equation for Aboveground Biomass Estimation of Mangroves Mixed Mature Mangrove Forest. Forests 2022, 13, 325. [Google Scholar] [CrossRef]
  17. Komiyama, A.; Ong, J.E.; Poungparn, S. Allometry, Biomass, and Productivity of Mangrove Forests: A Review. Aquat. Bot. 2008, 89, 128–137. [Google Scholar] [CrossRef]
  18. Kusmana, C.; Hidayat, T.; Tiryana, T.; Rusdiana, O. Istomo Allometric Models for Above- and below-Ground Biomass of Sonneratia Spp. Glob. Ecol. Conserv. 2018, 15, e00417. [Google Scholar] [CrossRef]
  19. Hu, X.; Xiong, L.; CHEN, S.; Zhang, H.; Zou, Y.; Zhang, J.; Liu, D.; He, J.; Wu, Y.; Zhu, Z. Study on Biomass Models of Juvenile Mangroves and Carbon Storage of Young Mangrove Ecosystem. J. Trop. Oceanogr. 2024. Available online: https://www.jto.ac.cn/CN/10.11978/2024141 (accessed on 23 April 2025).
  20. Smith, T.J.; Whelan, K.R.T. Development of Allometric Relations for Three Mangrove Species in South Florida for Use in the Greater Everglades Ecosystem Restoration. Wetl. Ecol. Manag. 2006, 14, 409–419. [Google Scholar] [CrossRef]
  21. Ball, M.C. Ecophysiology of Mangroves. Trees 1988, 2, 129–142. [Google Scholar] [CrossRef]
  22. Bloom, A.J.; Chapin, F.S.; Mooney, H.A. Resource Limitation in Plants-An Economic Analogy. Annu. Rev. Ecol. Evol. Syst. 1985, 16, 363–392. [Google Scholar] [CrossRef]
  23. Thornley, J.H.M. A Balanced Quantitative Model for Root: Shoot Ratios in Vegetative Plants. Ann. Bot. 1972, 36, 431–441. [Google Scholar] [CrossRef]
  24. Enquist, B.J.; Niklas, K.J. Global Allocation Rules for Patterns of Biomass Partitioning in Seed Plants. Science 2002, 295, 1517–1520. [Google Scholar] [CrossRef] [PubMed]
  25. Falster, D.S.; Duursma, R.A.; Ishihara, M.I.; Barneche, D.R.; FitzJohn, R.G.; Vårhammar, A.; Aiba, M.; Ando, M.; Anten, N.; Aspinwall, M.J.; et al. BAAD: A Biomass And Allometry Database for Woody Plants. Ecology 2015, 96, 1445. [Google Scholar] [CrossRef]
  26. Xiong, Y.; Liao, B.; Proffitt, E.; Guan, W.; Sun, Y.; Wang, F.; Liu, X. Soil Carbon Storage in Mangroves Is Primarily Controlled by Soil Properties: A Study at Dongzhai Bay, China. Sci. Total Environ. 2018, 619, 1226–1235. [Google Scholar] [CrossRef]
  27. Picard, N.; Saint-André, L.; Henry, M. Manual for Building Tree Volume and Biomass Allometric Equations: From Field Measurement to Prediction; CIRAD: Paris, France, 2012. [Google Scholar]
  28. Ye, Y.; Gu, Y.T.; Gao, H.Y.; Lu, C.Y. Combined Effects of Simulated Tidal Sea-Level Rise and Salinity on Seedlings of a Mangrove Species, Kandelia candel (L.) Druce. Hydrobiologia 2010, 641, 287–300. [Google Scholar] [CrossRef]
  29. Yang, S.; Shih, S.; Hwang, G.; Adams, J.B.; Lee, H.; Chen, C. The Salinity Gradient Influences on the Inundation Tolerance Thresholds of Mangrove Forests. Ecol. Eng. 2013, 51, 59–65. [Google Scholar] [CrossRef]
  30. Chen, L.; Wang, W. Ecophysiological Responses of Viviparous Mangrove Rhizophora stylosa Seedlings to Simulated Sea-Level Rise. J. Coast. Res. 2016, 33, 1333–1340. [Google Scholar] [CrossRef]
  31. Hassan, N. Salinity Stress in Plants: Growth, Photosynthesis and Adaptation Review. GSC Adv. Res. Rev. 2024, 20, 231–243. [Google Scholar] [CrossRef]
  32. Miyama, M.; Tada, Y. Transcriptional and Physiological Study of the Response of Burma Mangrove (Bruguiera gymnorhiza) to Salt and Osmotic Stress. Plant Mol. Biol. 2008, 68, 119–129. [Google Scholar] [CrossRef]
  33. Wang, B.; Zhang, H.; Huai, J.; Peng, F.; Wu, J.; Lin, R.; Fang, X. Condensation of SEUSS Promotes Hyperosmotic Stress Tolerance in Arabidopsis. Nat. Chem. Biol. 2022, 18, 1361–1369. [Google Scholar] [CrossRef]
  34. Liu, C.; Jiang, X.; Yuan, Z. Plant Responses and Adaptations to Salt Stress: A Review. Horticulturae 2024, 10, 1221. [Google Scholar] [CrossRef]
  35. Zhu, J. Salt and Drought Stress Signal Transduction in Plants. Annu. Rev. Plant Biol. 2002, 53, 247–273. [Google Scholar] [CrossRef] [PubMed]
  36. Segarra-Medina, C.; Alseekh, S.; Fernie, A.R.; Rambla, J.L.; Pérez-Clemente, R.M.; Gómez-Cádenas, A.; Zandalinas, S.I. Abscisic Acid Promotes Plant Acclimation to the Combination of Salinity and High Light Stress. Plant Physiol. Biochem. 2023, 203, 108008. [Google Scholar] [CrossRef]
  37. Rath, K.M.; Maheshwari, A.; Bengtson, P.; Rousk, J. Comparative Toxicities of Salts on Microbial Processes in Soil. Appl. Environ. Microbiol. 2016, 82, 2012–2020. [Google Scholar] [CrossRef]
  38. Zhang, W.; Wang, C.; Xue, R.; Wang, L. Effects of Salinity on the Soil Microbial Community and Soil Fertility. J. Integr. Agric. 2019, 18, 1360–1368. [Google Scholar] [CrossRef]
  39. Alongi, D.M. Impact of Global Change on Nutrient Dynamics in Mangrove Forests. Forests 2018, 9, 596. [Google Scholar] [CrossRef]
  40. Xiao, Y.; Jie, Z.; Wang, M.; Lin, G.; Wang, W. Leaf and Stem Anatomical Responses to Periodical Waterlogging in Simulated Tidal Floods in Mangrove Avicennia marina Seedlings. Aquat. Bot. 2009, 91, 231–237. [Google Scholar] [CrossRef]
  41. Zhang, Y.; Chen, X.; Geng, S.; Zhang, X. A Review of Soil Waterlogging Impacts, Mechanisms, and Adaptive Strategies. Front. Plant Sci. 2025, 16, 1545912. [Google Scholar] [CrossRef] [PubMed]
  42. Zhou, C.; Bai, T.; Wang, Y.; Wu, T.; Zhang, X.; Xu, X.; Han, Z. Morpholoical and Enzymatic Responses to Waterlogging in Three Prunus Species. Sci. Hortic. 2017, 221, 62–67. [Google Scholar] [CrossRef]
  43. Liu, Y.; Jafari, F.; Wang, H. Integration of Light and Hormone Signaling Pathways in the Regulation of Plant Shade Avoidance Syndrome. aBIOTECH 2021, 2, 131–145. [Google Scholar] [CrossRef]
  44. Pierik, R.; Ballaré, C.L. Control of Plant Growth and Defense by Photoreceptors: From Mechanisms to Opportunities in Agriculture. Mol. Plant 2021, 14, 61–76. [Google Scholar] [CrossRef] [PubMed]
  45. Bell, G.E.; Danneberger, T.K.; McMahon, M.J. Spectral Irradiance Available for Turfgrass Growth in Sun and Shade. Crop Sci. 2000, 40, 189–195. [Google Scholar] [CrossRef]
  46. Fraser, D.P.; Hayes, S.; Franklin, K.A. Photoreceptor Crosstalk in Shade Avoidance. Curr. Opin. Plant Biol. 2016, 33, 1–7. [Google Scholar] [CrossRef] [PubMed]
  47. Yi, L.; Wang, Z. Root System Characters in Growth and Distribution Among Three Littoral Halophytes. Acta Ecol. Sin. 2011, 31, 1195–1202. [Google Scholar]
  48. Guo, W.; Wang, G.; Gou, Q. Effects of Sodium Salt Stress on the Growth and Biomass Allocation of Chenopodiaceae annuals. Acta Ecol. Sin. 2020, 41, 6633–6643. [Google Scholar]
  49. Wei, M.; Li, H.; Zhang, L.; Guo, Z.; Liu, J.; Ding, Q.; Zhong, Y.; Li, J.; Ma, D.; Zheng, H. Exogenous Hydrogen Sulfide Mediates Na+ and K+ Fluxes of Salt Gland in Salt-Secreting Mangrove Plant Avicennia Marina. Tree Physiol. 2022, 42, 1812–1826. [Google Scholar] [CrossRef] [PubMed]
  50. Tewari, S.; Mishra, A. Chapter 18—Flooding Stress in Plants and Approaches to Overcome. In Plant Metabolites and Regulation Under Environmental Stress; Ahmad, P., Ahanger, M.A., Singh, V.P., Tripathi, D.K., Alam, P., Alyemeni, M.N., Eds.; Academic Press: Cambridge, MA, USA, 2018; pp. 355–366. ISBN 978-0-12-812689-9. [Google Scholar]
  51. Setter, T.L.; Waters, I. Review of Prospects for Germplasm Improvement for Waterlogging Tolerance in Wheat, Barley and Oats. Plant Soil 2003, 253, 1–34. [Google Scholar] [CrossRef]
  52. Silvestro, R.; Deslauriers, A.; Prislan, P.; Rademacher, T.; Rezaie, N.; Richardson, A.D.; Vitasse, Y.; Rossi, S. From Roots to Leaves: Tree Growth Phenology in Forest Ecosystems. Curr. For. Rep. 2025, 11, 12. [Google Scholar] [CrossRef]
  53. Liu, N.; Li, Y.; Wang, Q.; Zhou, R.; Gaffney, P.P.J.; Liu, M.; Shi, R.; Gao, Z.; Chu, H.; Niu, S.; et al. Restoration Recovers Plant Diversity but Changes Species Composition and Biomass Allocation in an Alpine Peatland. Ecol. Process. 2025, 14, 24. [Google Scholar] [CrossRef]
  54. Yang, P.; Niu, M.; Fu, Q.; Qian, L.; Huang, M.; Li, Z.; Sun, H.; Chen, J. Ecosystem Engineers Can Regulate Resource Allocation Strategies in Associated Plant Species. Front. Plant Sci. 2024, 15, 1387951. [Google Scholar] [CrossRef]
  55. Mccarthy, M.C.; Enquist, B.J. Consistency between an Allometric Approach and Optimal Partitioning Theory in Global Patterns of Plant Biomass Allocation. Funct. Ecol. 2007, 21, 713–720. [Google Scholar] [CrossRef]
Figure 1. Schematic representation of the location of the study plots. Among them, the map of Hainan Province is derived from the standard map service of Hainan Province (https://hism.mnr.gov.cn/sjkf/hndt/), accessed on 23 April 2025 and the review number is Qiong S(2024)106. (A) Schematic diagram of the location of the Dongzhai Bay experimental sample site; (B) Tashi sample plot overlooking figure; (C) Sanjiang sample plot overlooking figure. In Figure (B,C), “F” represents flooding, “S” represents salinity, and “C” represents interspecific aboveground competition; subscript “C” represent CK and “S” represent stressed.
Horticulturae 11 00712 g001
Figure 2. The design of field sample plots and configuration pattern of eight mangrove plant species. Configuration pattern of eight mangrove plant species within a non-competitive sample plot, with each mangrove plant separated by 1 m horizontally and longitudinally. Individual mangrove species replicated five times due to limited site area. Configuration pattern of eight mangrove plant species within a competitive sample plot, the positions of each tree species in each column are randomly arranged, with the outer black boxed line indicating a high-density low-pressure polyethylene (PE) plastic flat mesh to simulate critical competition and ensure consistent competition intensity between the inner and the boundary.
Horticulturae 11 00712 g002
Figure 3. Biomass and growth of juvenile mangrove plants under different stress conditions and their interactions. (A) Total biomass of mangrove seedlings under different salinity and flooding stress; (B) Tree height of mangrove seedlings under different salinity and flooding stress; (C) Base diameter of mangrove seedlings under different salinity and flooding stress; (D) Tree height of mangrove seedlings under different salinity and competition stress. In this figure, CK represents seedlings that are not subjected to salt stress, flooding stress or interspecific competition stress, respectively, while Stressed represents seedlings that are subjected to corresponding stress.
Horticulturae 11 00712 g003
Figure 4. Total biomass of various juvenile mangrove plants at different salt levels (A), flooding levels (B) and aboveground competition levels (C). Data in the figure are the mean values ± standard error. The abbreviations and Latin names of mangrove species in the figure are compared as follows: Aegiceras corniculatum (Ac), Avicennia marina (Am), Bruguiera gymnorhiza (Bg), Ceriops tagal (Ct), Kandelia obovata (Ko), Lumnitzera racemosa (Lr), Rhizophora stylosa (Rs), and Sonneratia caseolaris (Sc). In this figure, “CK” represents seedlings that are not subjected to salt stress, flooding stress, or interspecific competition stress, respectively, while “Stressed” represents seedlings that are subjected to corresponding stress. The figure below is the same.
Horticulturae 11 00712 g004
Figure 5. The biomass allocation of juvenile mangrove plants were measured at different salt levels, flooding levels and aboveground competition levels. In the figure, (A) Biomass allocation of mangrove seedlings under different salinity levels; (B) Biomass allocation of mangrove seedlings under different flooding levels; (C) Biomass allocation of mangrove seedlings under different competition levels. In the figure, AGB represents aboveground biomass and TB represents total biomass. “***” indicates a p value < 0.001 for between-group differences, and “*” indicates a p value < 0.05 for between-group differences.
Horticulturae 11 00712 g005
Figure 6. AGB/TB of various mangrove plants at different salt levels (A), flooding levels (B) and aboveground competition levels (C). The meaning of the remaining abbreviations and letter labels is the same as in Figure 4 and Figure 5. Because all the seedlings planted at low intertidal zone with Ct and Rs died, there is no data in the figure (B).
Horticulturae 11 00712 g006
Figure 7. The results of fitting the allometric equation of A. corniculatum (AC) and S. caseolaris (DF) with different variables at different salinity levels. In this figure, CK represents seedlings that are not subjected to salt stress, while Stressed represents seedlings that are subjected to salt stress.
Horticulturae 11 00712 g007
Table 1. p-value of three-way ANOVA of the effects of salinity, flooding, competition, and their interactions on total biomass, and growth of juvenile mangrove plants.
TBHD
Salinity<0.001<0.001<0.001
Flooding<0.001<0.001<0.001
Competition0.360<0.0010.271
Salinity × Flooding<0.001<0.001<0.001
Salinity × Competition0.1670.0020.732
Flooding × Competition0.3210.5860.909
Salinity × Flooding × Competition0.4530.3740.257
Note: Bold in the table indicates that the effect in the first column is significant (p < 0.05) for TB/D/H.
Table 2. p-value of three-way ANOVA of the effects of salinity, flooding, competition and their interactions on biomass allocation of juvenile mangrove plants.
AGB/TB
Salinity<0.001
Flooding<0.001
Competition0.034
Salinity × Flooding0.330
Salinity × Competition0.258
Flooding × Competition0.740
Salinity × Flooding × Competition0.533
Note: The abbreviations in the table have the same meaning as those in Figure 5. Bold in the table indicates that the effect in the first column is significant (p < 0.05) for AGB/TB.
Table 3. The allometric equation of models of different mangrove plants.
SpeciesFitting ModelXabR2p ValueSample Number
A. corniculatumTB = aX + bD2H0.05840.02300.4855<0.00143
A. marinaTB = aX + bH0.4059−0.24870.1842<0.00125
B. gymnorhizaTB = aX + bDH20.01320.10680.3153<0.00125
C. tagalTB = aX + bD2H0.03710.02560.7127<0.00118
K. obovataTB = aX + bD0.05750.04390.1307<0.00132
L. racemosaTB = aX + bD2H0.04430.03510.6460<0.00125
R. stylosaTB = aX + bD0.02100.04960.1108<0.00136
S. caseolarisTB = aX + bD2H0.29730.00670.9252<0.00130
All SpeciesTB = aX + bD2H0.05840.02300.4855<0.001234
Note: The abbreviations in the table have the same meaning as those in Figure 4. The equations with the highest R2 are shown in the table. See Table S5 for the rest of the equations. TB represents the biomass of mangrove vegetation (kg); X represents the predicted variables, including D, H, DH, D2H and DH2; a and b are model coefficients; D represents the basal diameter of plants (cm); H represents the plant height (m).
Disclaimer/Publisher’s Note: The statements, opinions and data contained in all publications are solely those of the individual author(s) and contributor(s) and not of MDPI and/or the editor(s). MDPI and/or the editor(s) disclaim responsibility for any injury to people or property resulting from any ideas, methods, instructions or products referred to in the content.

