

PavSPL Expression Dynamics in Fruits and Seeds and in Relation to Endocarp Lignification Status During the Transition from Development to Ripening in Sweet Cherry

 , ,
, ,  , and
, and 
Abstract
1. Introduction
2. Methods
2.1. Plant Material
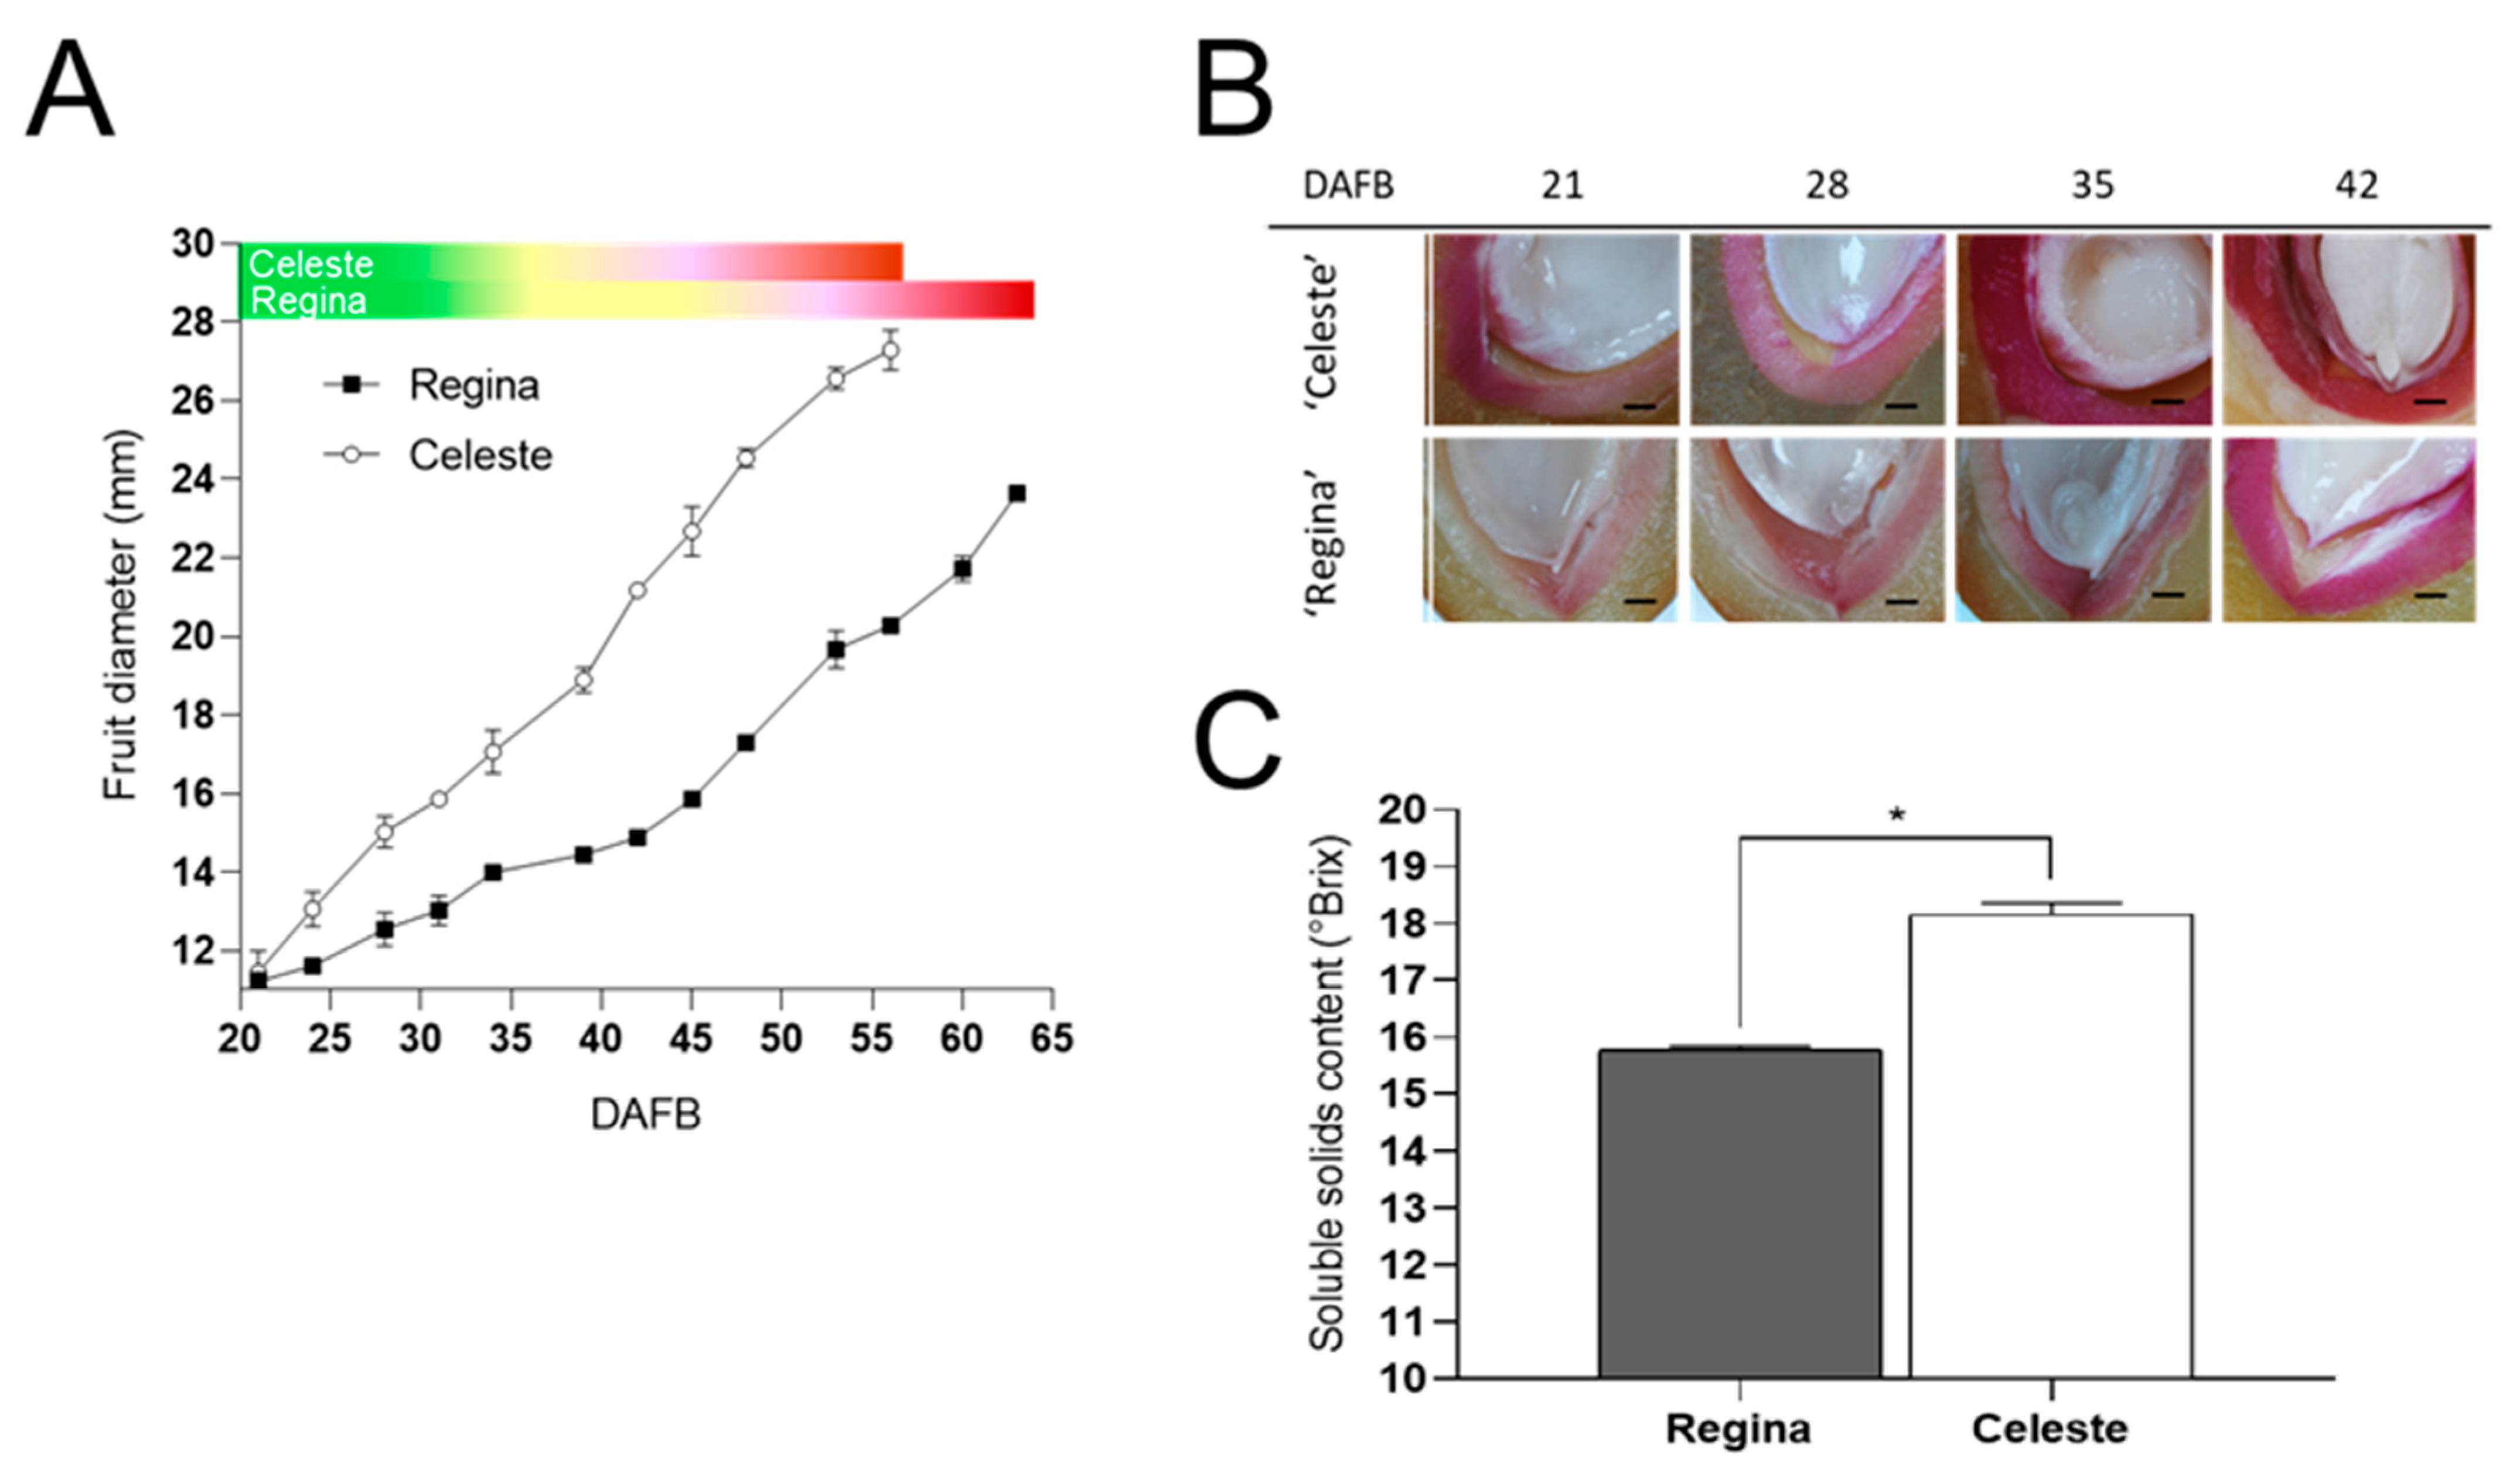
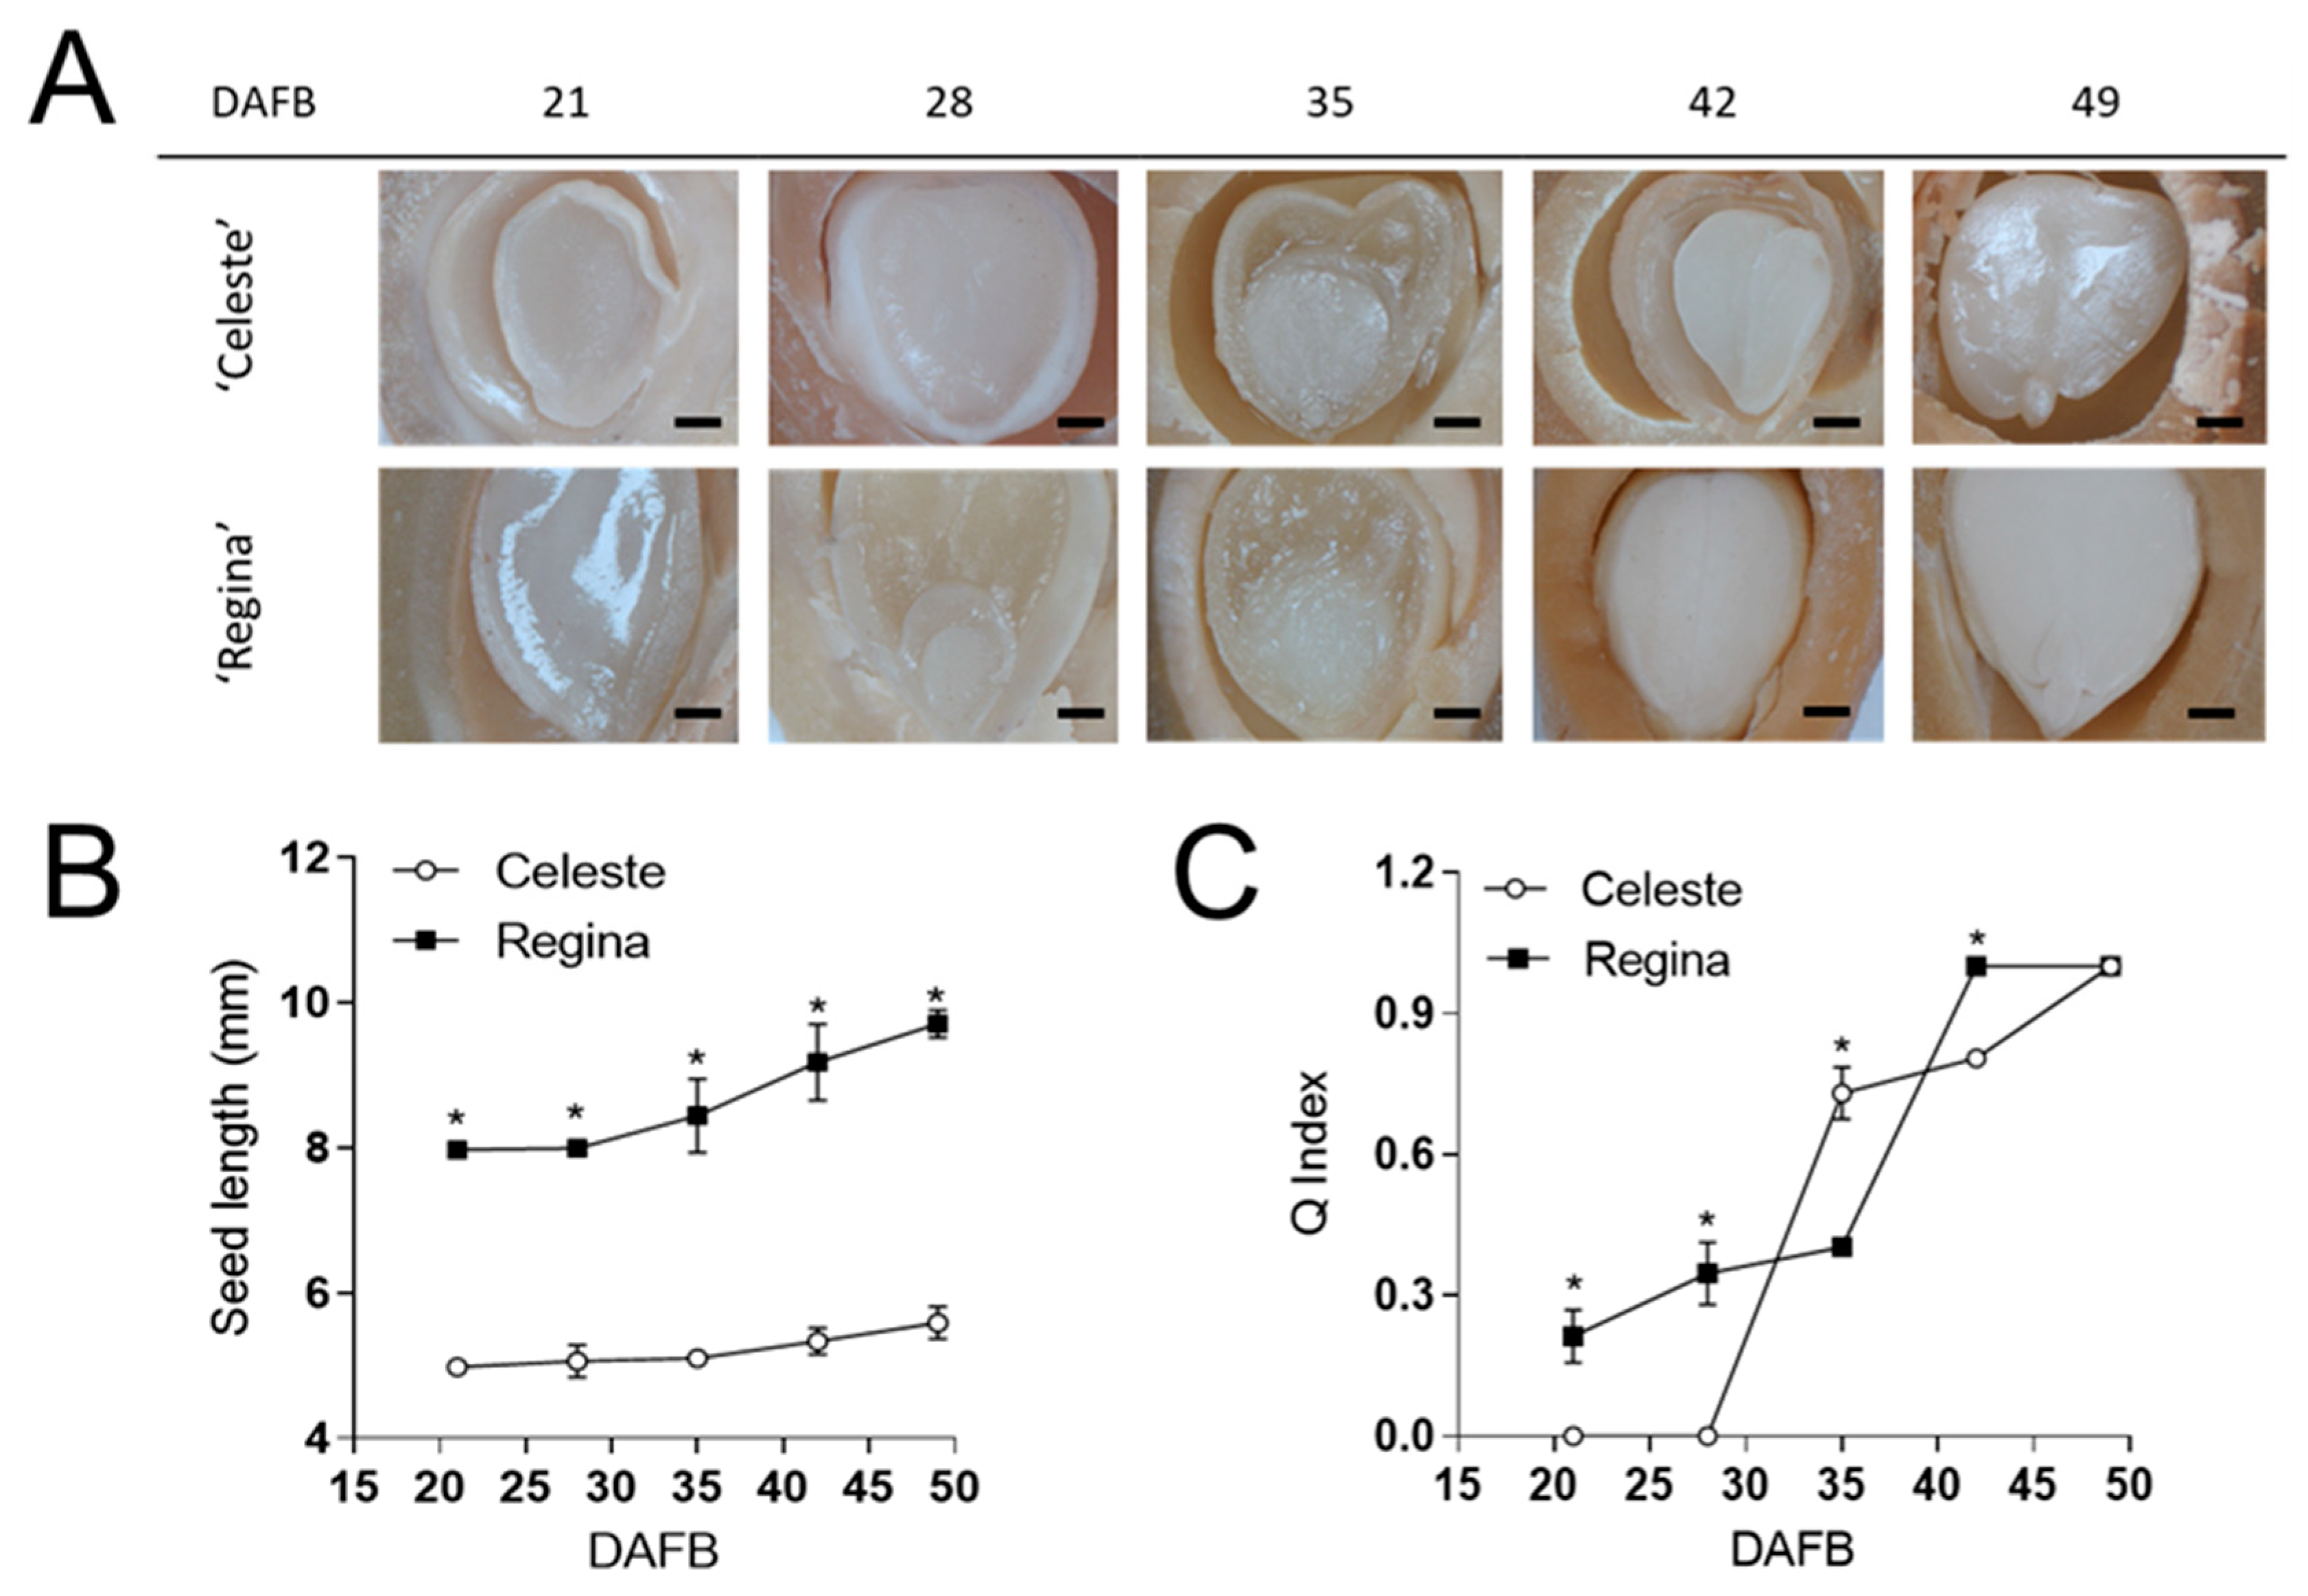
2.1.1. Plant Material for Early- and Late-Season Cultivar Characterization
2.1.2. Plant Material for Mid-Season Cultivar Characterization
2.2. Experimental Design
2.2.1. Experimental Design for Early- and Late-Season Cultivar Characterization in the 2022–2023 Season
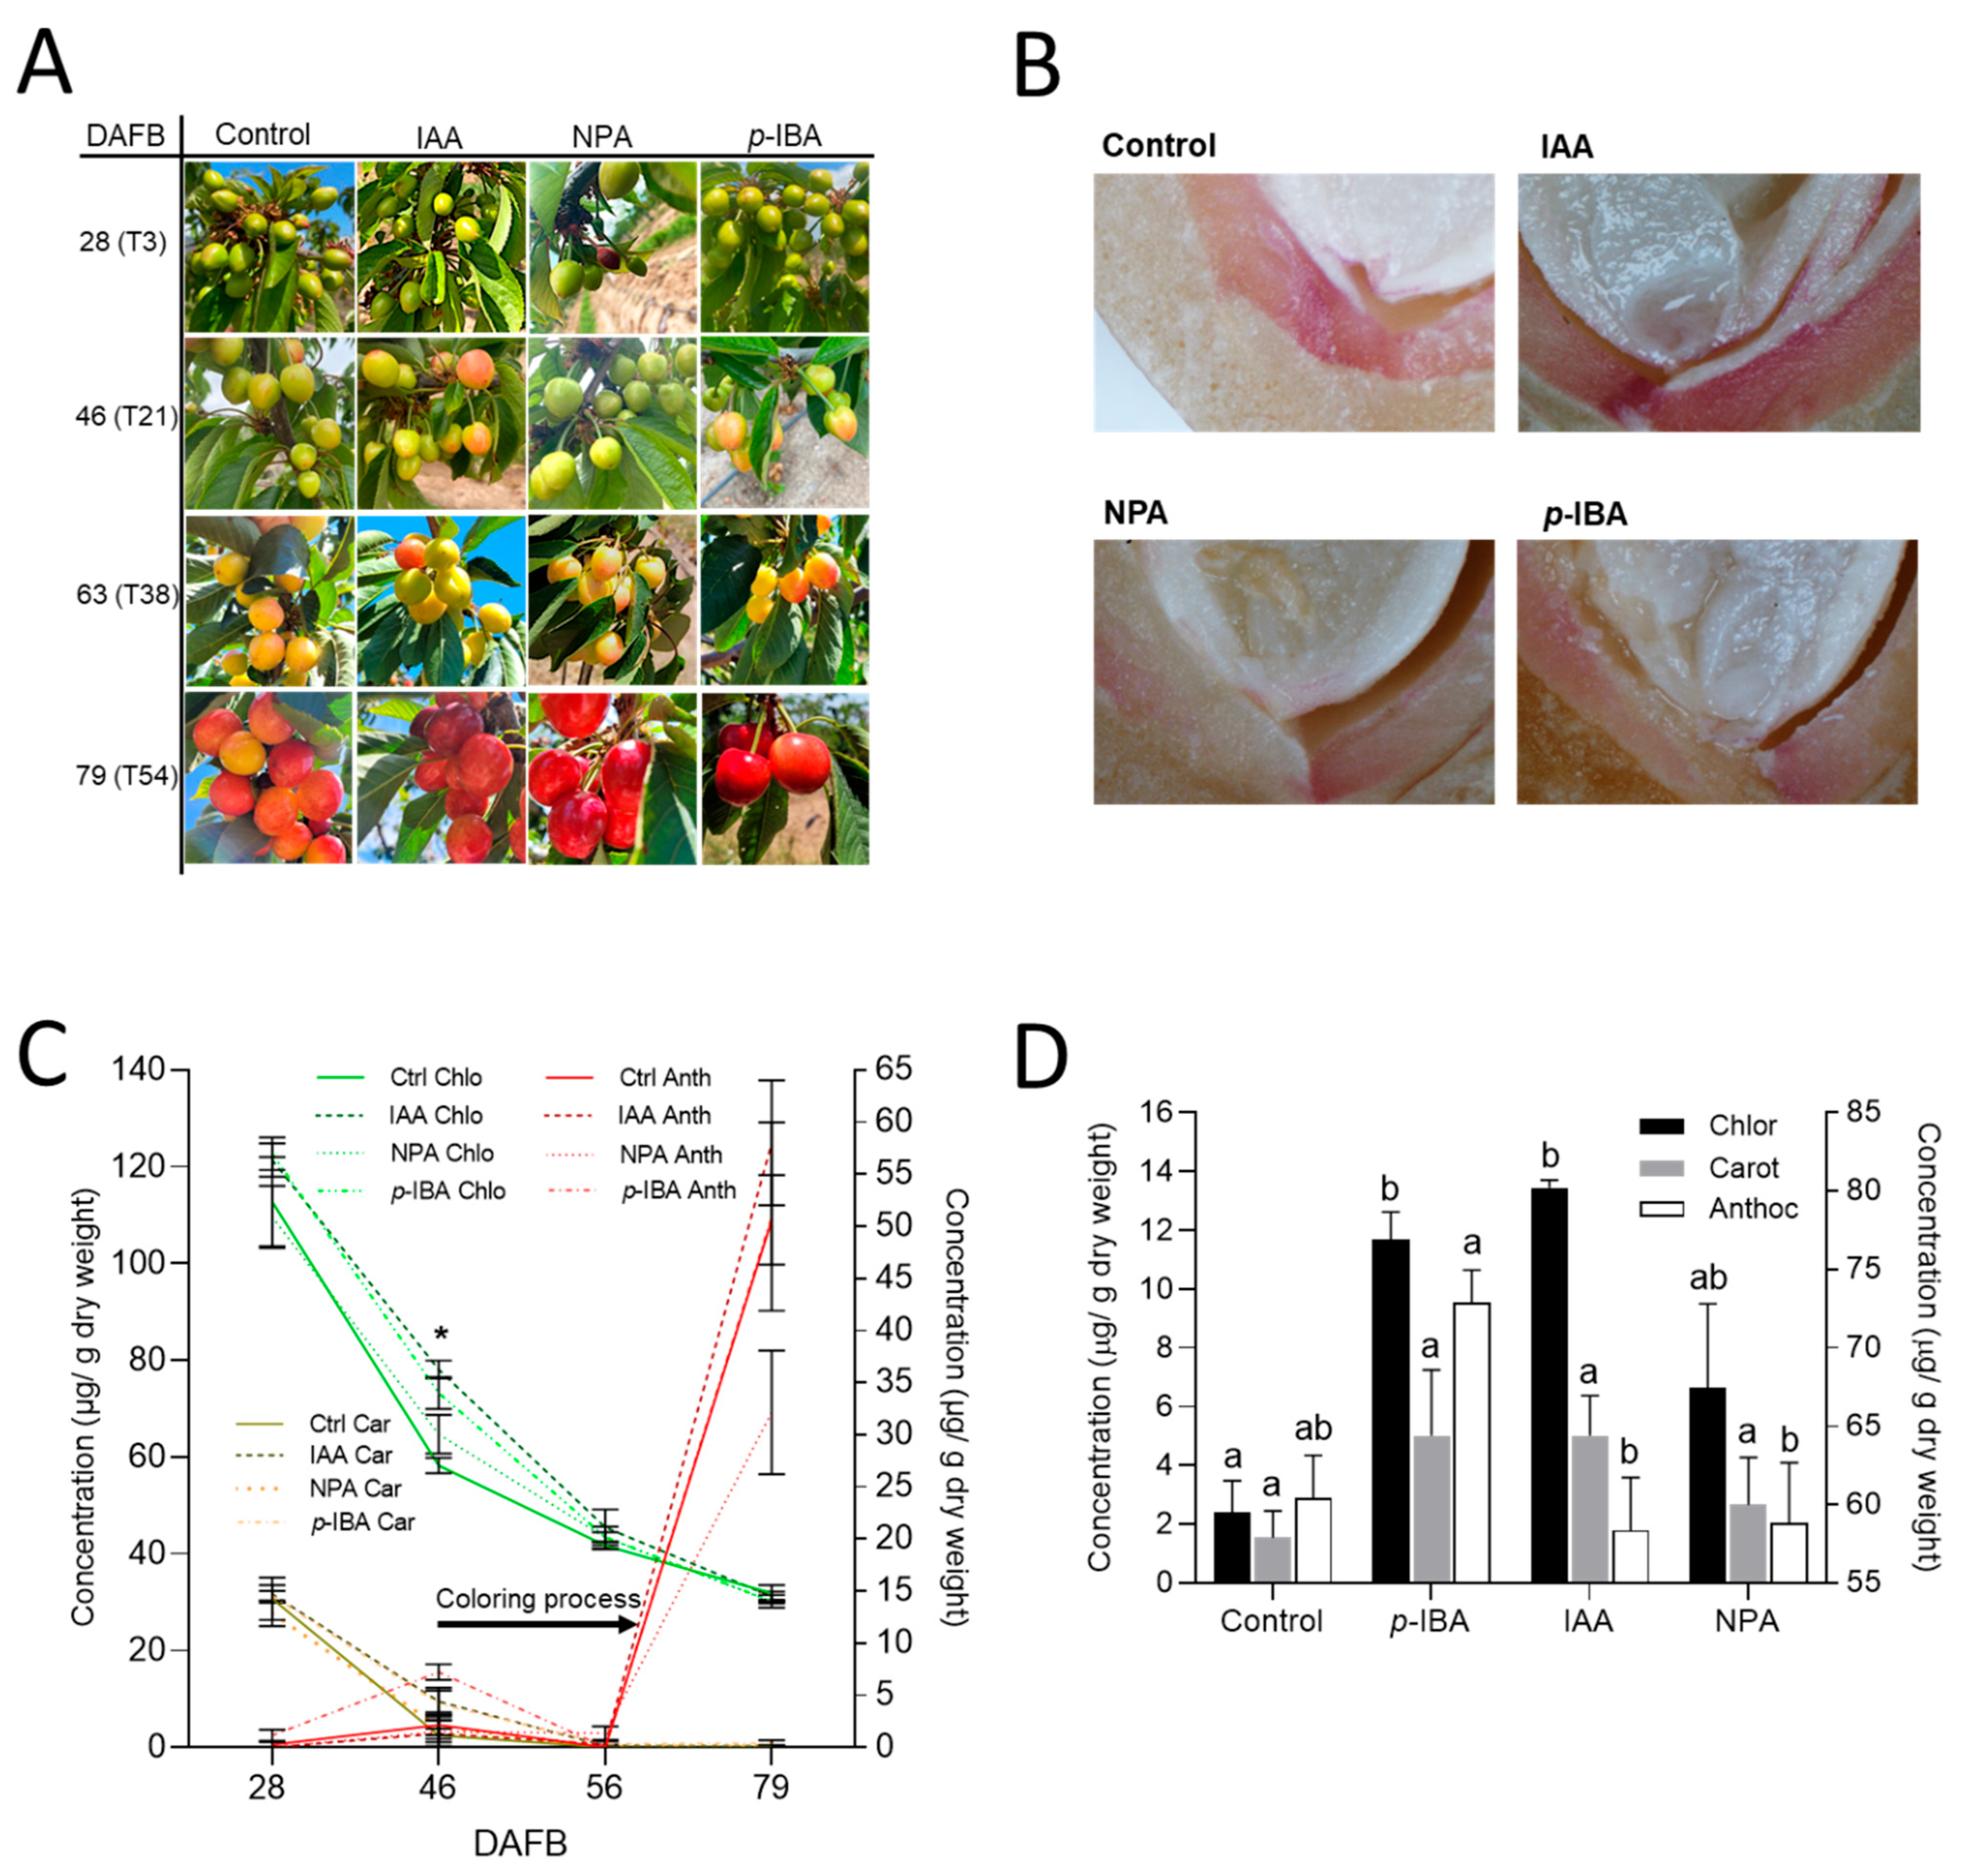
2.2.2. Experimental Design for the Treatments with Lignification Modulators in the 2023–2024 Season in the Mid-Season Cultivar ‘Lapins’
2.2.3. Experimental Design for the Treatments with Lignification Modulators in the 2024–2025 Season in the Mid-Season Cultivar ‘Lapins’
2.3. Growth and Ripening Parameters Assessment
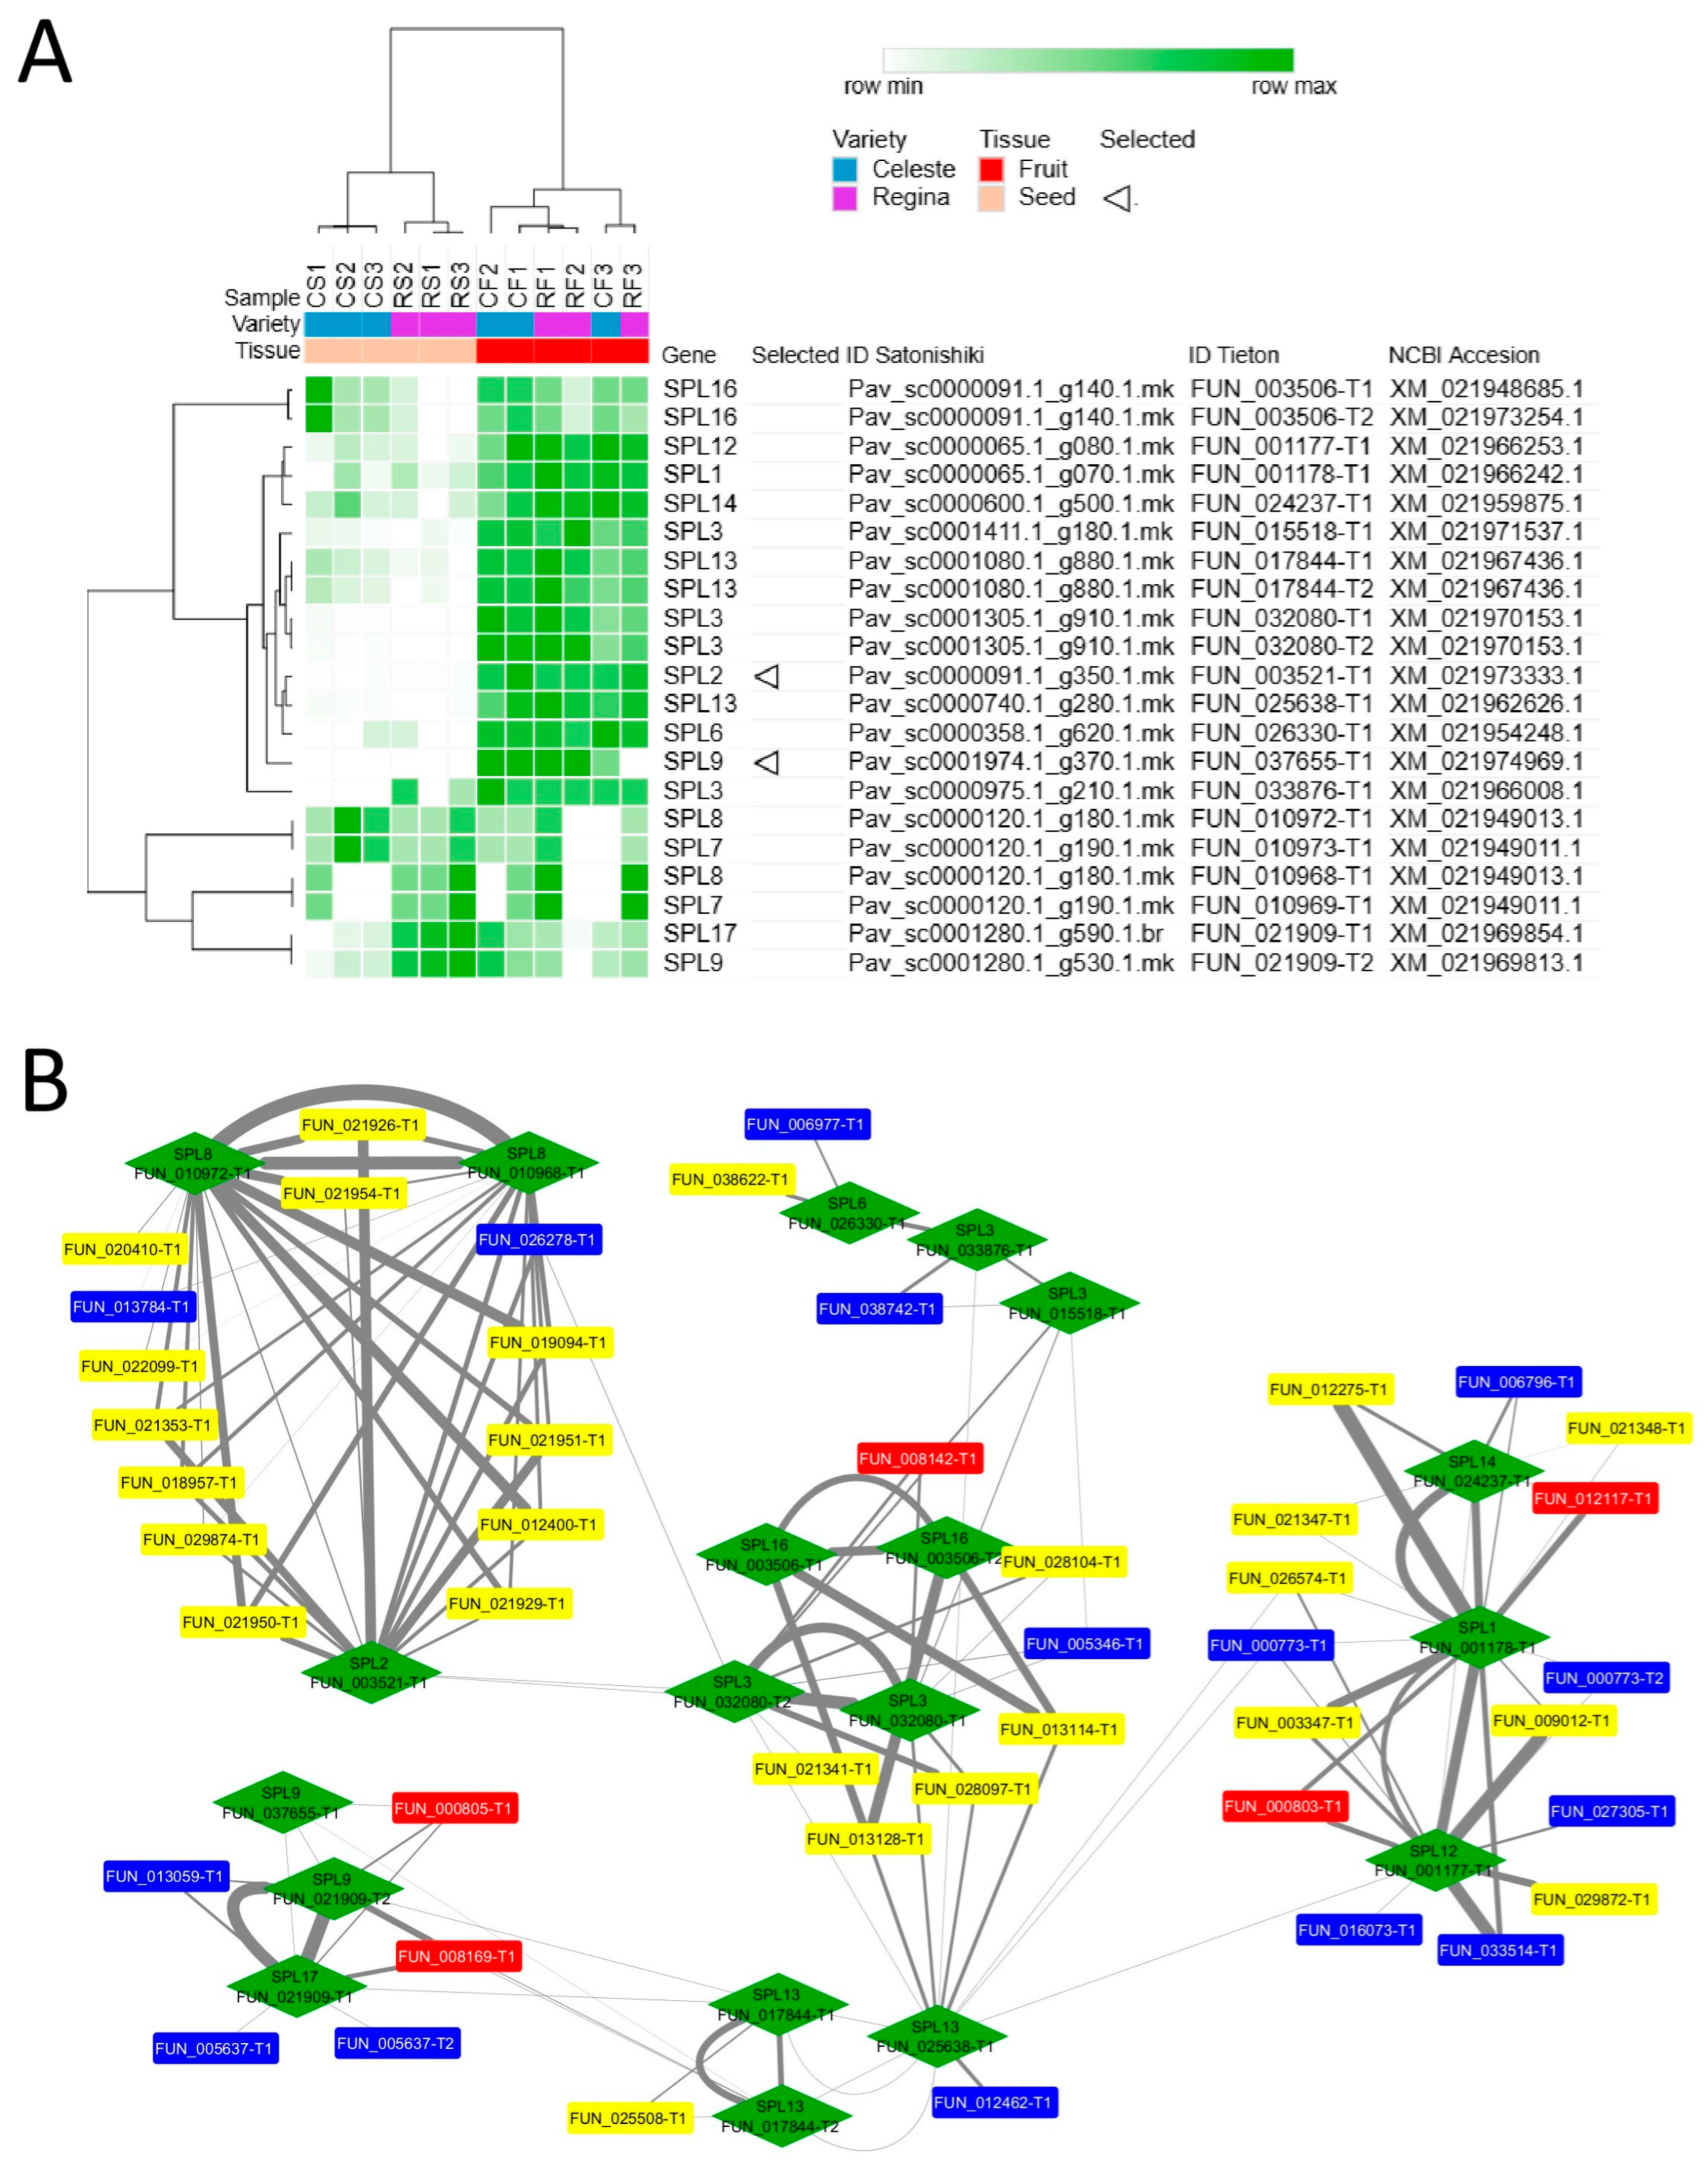
2.4. RNA-Seq Expression Levels of PavSPL Genes and Gene Co-Expression Network Analysis
2.5. RNA Extraction
2.6. cDNA Synthesis
2.7. Selection of Candidate Genes for qPCR Expression Analyses
2.8. Phylogenetic Tree and Motif Discovery
2.9. Primer Design for Gene Expression Analyses
2.10. Quantification of Relative Gene Expression by qPCR
2.11. Endocarp Lignification Assessment
2.12. Pigment Concentration Estimation
2.13. Statistical Analysis
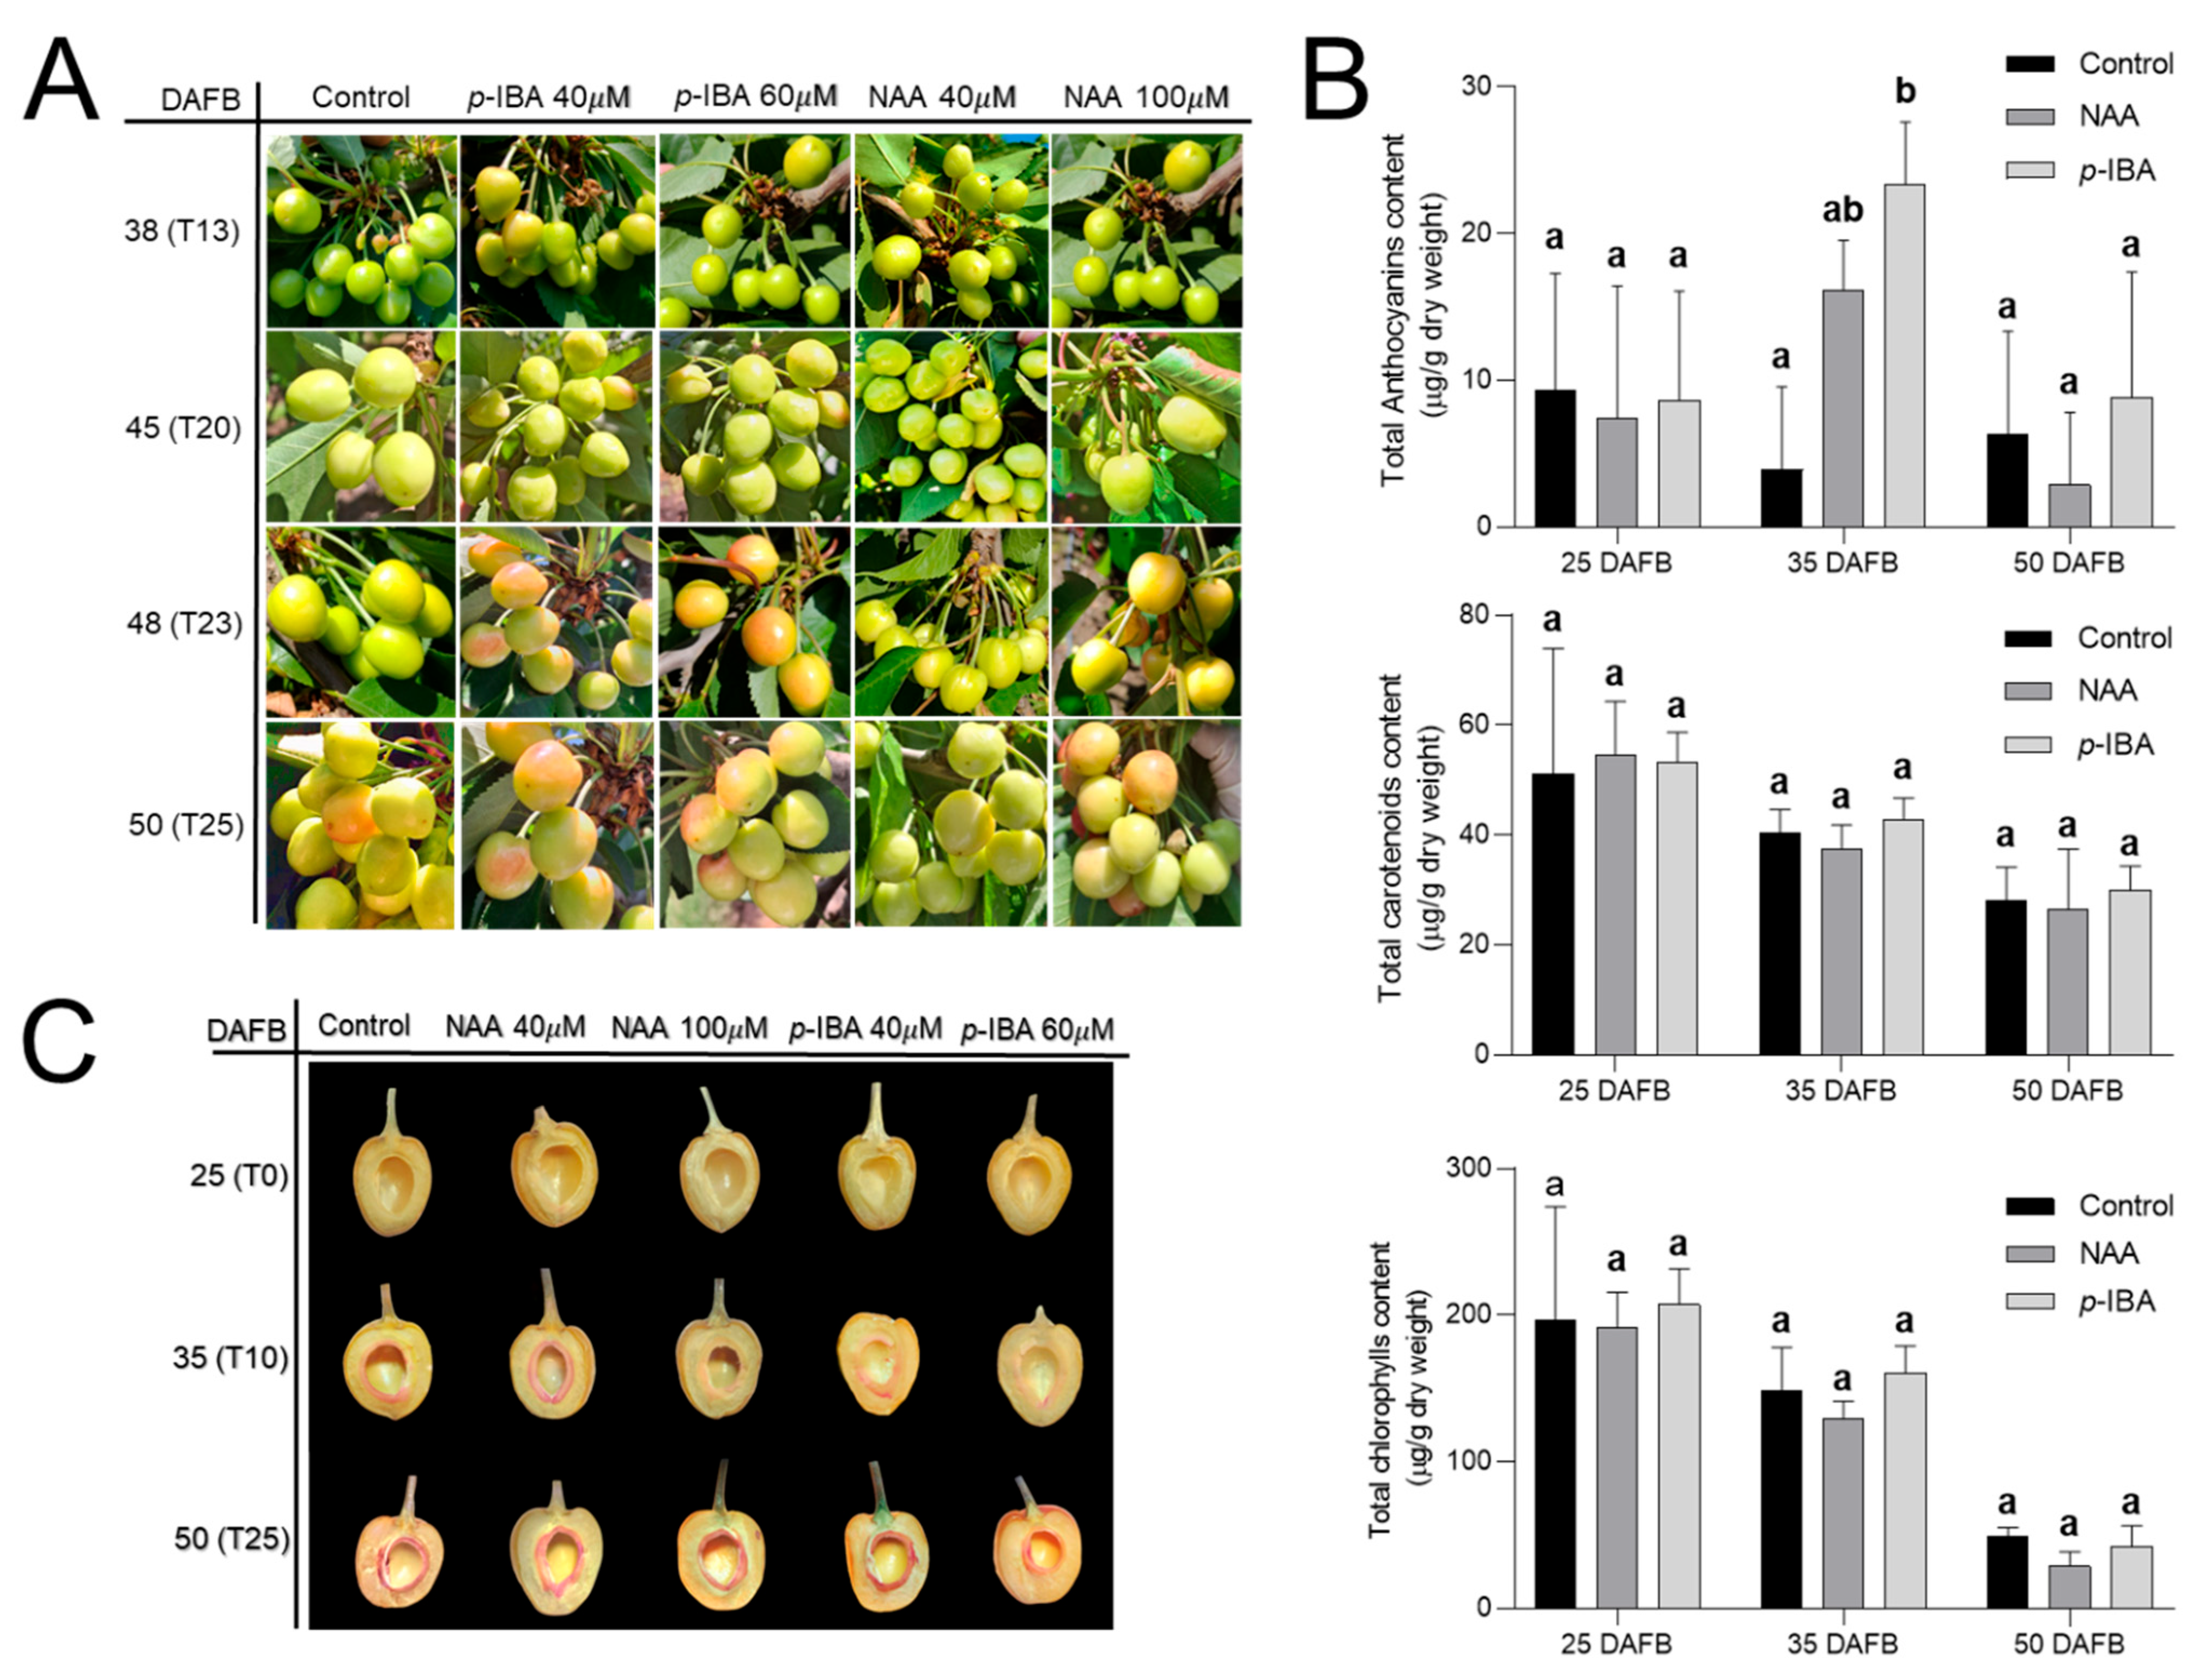
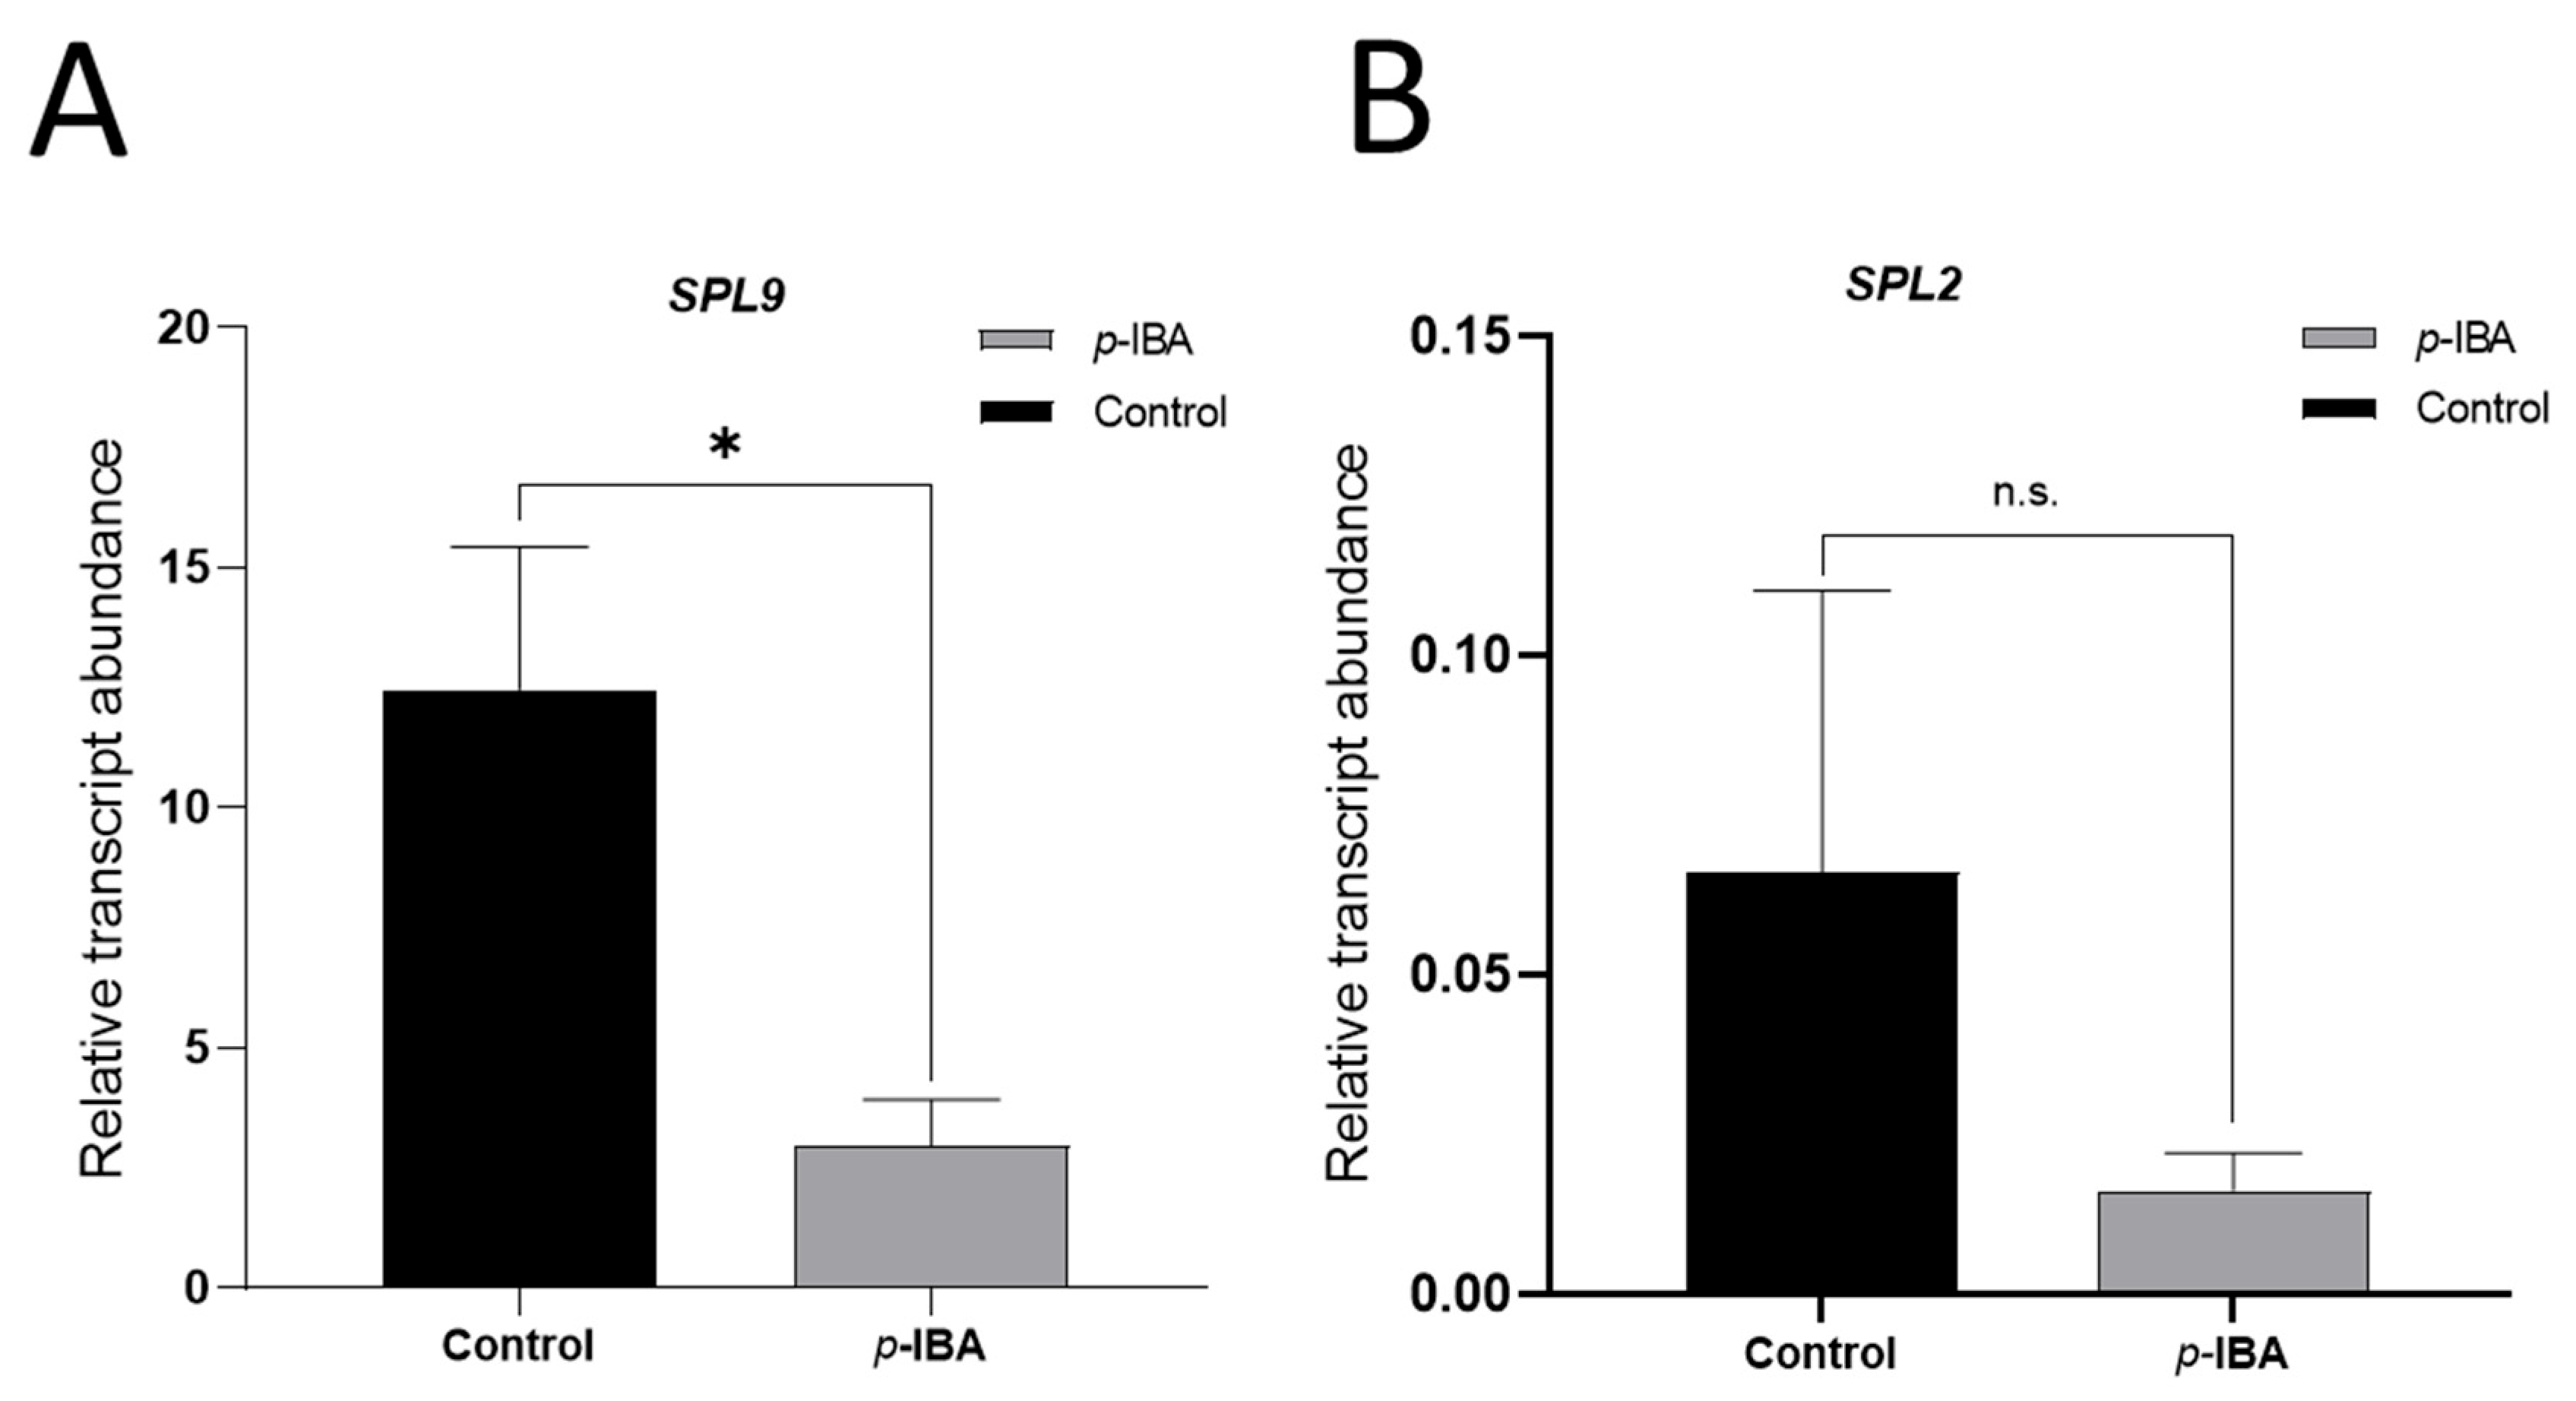
3. Results
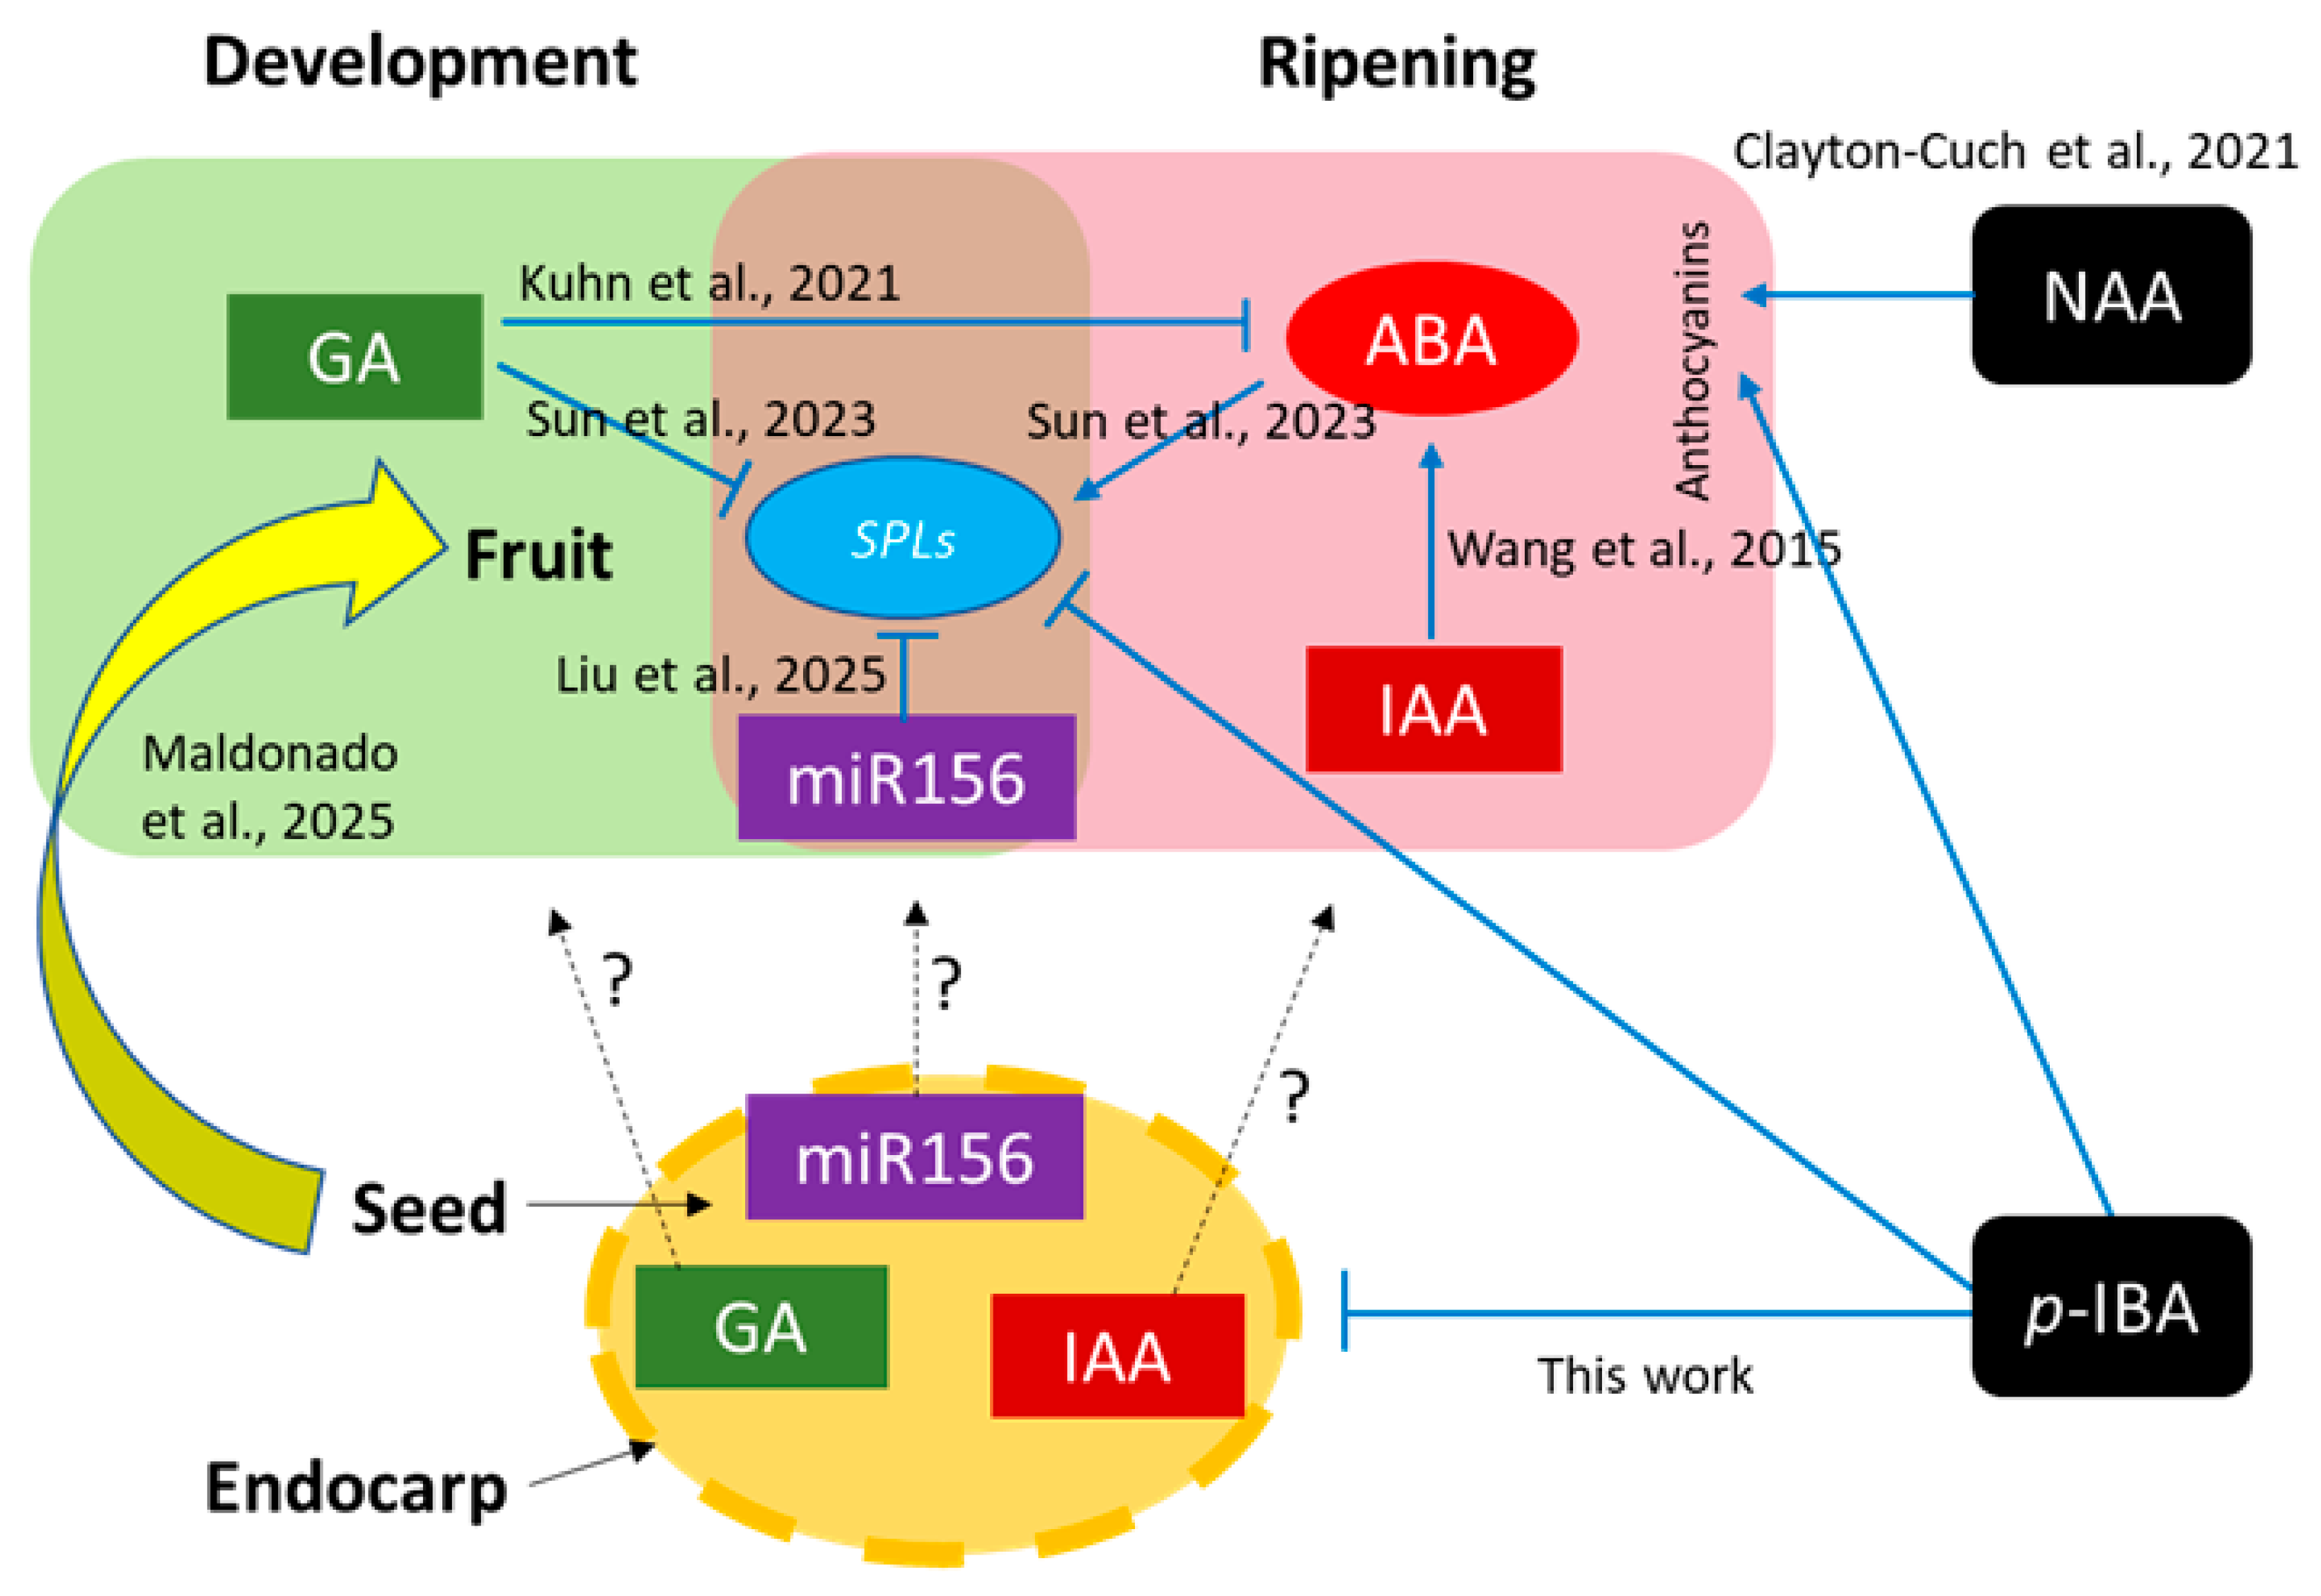
4. Discussion
5. Conclusions
Supplementary Materials
Author Contributions
Funding
Data Availability Statement
Conflicts of Interest
Abbreviations
References
- Statista. Available online: https://www.statista.com/statistics/577489/world-cherry-production/ (accessed on 19 March 2025).
- Vignati, E.; Lipska, M.; Dunwell, J.M.; Caccamo, M.; Simkin, A.J. Fruit development in sweet cherry. Plants 2022, 11, 1531. [Google Scholar] [CrossRef] [PubMed]
- Dirlewanger, E.; Quero-Garcia, J.; Le Dantec, L.; Lambert, P.; Ruiz, D.; Dondini, L.; Arús, P. Comparison of the genetic determinism of two key phenological traits, flowering and maturity dates, in three Prunus species: Peach, apricot and sweet cherry. Heredity 2012, 109, 280–292. [Google Scholar] [CrossRef]
- Kuhn, N.; Ponce, C.; Arellano, M.; Time, A.; Multari, S.; Martens, S.; Meisel, L.A. ABA influences color initiation timing in P. avium L. fruits by sequentially modulating the transcript levels of ABA and anthocyanin-related genes. Tree Genet. Genomes 2021, 17, 20. [Google Scholar] [CrossRef]
- Luo, H.; Dai, S.; Ren, J.; Zhang, C.; Ding, Y.; Li, Z.; Leng, P. The role of ABA in the maturation and postharvest life of a nonclimacteric sweet cherry fruit. J. Plant Growth Regul. 2014, 33, 373–383. [Google Scholar] [CrossRef]
- Ren, J.; Chen, P.; Dai, S.J.; Li, P.; Li, Q.; Ji, K.; Leng, P. Role of abscisic acid and ethylene in sweet cherry fruit maturation: Molecular aspects. N. Z. J. Crop Hortic. Sci. 2011, 39, 161–174. [Google Scholar] [CrossRef]
- Wang, Y.; Chen, P.; Sun, L.; Li, Q.; Dai, S.; Sun, Y.; Ji, K.; Li, Q.; Leng, P. Transcriptional regulation of PaPYLs, PaPP2Cs and PaSnRK2s during sweet cherry fruit development and in response to abscisic acid and auxin at onset of fruit ripening. Plant Growth Regul. 2015, 75, 455–464. [Google Scholar] [CrossRef]
- Medina-Puche, L.; Blanco-Portales, R.; Molina-Hidalgo, F.J.; Cumplido-Laso, G.; García-Caparrós, N.; Moyano-Cañete, E.; Rodríguez-Franco, A. Extensive transcriptomic studies on the roles played by abscisic acid and auxins in the development and ripening of strawberry fruits. Funct. Integr. Genom. 2016, 16, 671–692. [Google Scholar] [CrossRef] [PubMed]
- Wheeler, S.; Loveys, B.; Ford, C.; Davies, C. The relationship between the expression of abscisic acid biosynthesis genes, accumulation of abscisic acid and the promotion of Vitis vinifera L. berry ripening by abscisic acid. Aust. J. Grape Wine Res. 2009, 15, 195–204. [Google Scholar] [CrossRef]
- Gouthu, S.; Deluc, L.G. Timing of ripening initiation in grape berries and its relationship to seed content and pericarp auxin levels. BMC Plant Biol. 2015, 15, 46. [Google Scholar] [CrossRef]
- Clayton-Cuch, D.; Yu, L.; Shirley, N.; Bradley, D.; Bulone, V.; Böttcher, C. Auxin treatment enhances anthocyanin production in the non-climacteric sweet cherry (Prunus avium L.). Int. J. Mol. Sci. 2021, 22, 10760. [Google Scholar] [CrossRef]
- Zhang, C.; Whiting, M.D. Improving ‘Bing’ sweet cherry fruit quality with plant growth regulators. Sci. Hortic. 2011, 127, 341–346. [Google Scholar] [CrossRef]
- Kuhn, N.; Arellano, M.; Ponce, C.; Hodar, C.; Correa, F.; Multari, S.; Meisel, L.A. RNA-seq and WGBS analyses during fruit ripening and in response to ABA in sweet cherry (Prunus avium) reveal genetic and epigenetic modulation of auxin and cytokinin genes. J. Plant Growth Regul. 2025, 44, 1165–1187. [Google Scholar] [CrossRef]
- Kappel, F.; MacDonald, R.A. Gibberellic acid increases fruit firmness, fruit size, and delays maturity of ‘Sweetheart’ sweet cherry. J. Am. Pomol. Soc. 2002, 56, 219–222. [Google Scholar]
- Kuhn, N.; Ponce, C.; Arellano, M.; Time, A.; Sagredo, B.; Donoso, J.M.; Meisel, L.A. Gibberellic acid modifies the transcript abundance of ABA pathway orthologs and modulates sweet cherry (Prunus avium) fruit ripening in early- and mid-season varieties. Plants 2020, 9, 1796. [Google Scholar] [CrossRef] [PubMed]
- Kuhn, N.; Maldonado, J.; Ponce, C.; Arellano, M.; Time, A.; Multari, S.; Meisel, L.A. RNAseq reveals different transcriptomic responses to GA3 in early and midseason varieties before ripening initiation in sweet cherry fruits. Sci. Rep. 2021, 11, 13075. [Google Scholar] [CrossRef]
- Ponce, C.; Kuhn, N.; Arellano, M.; Time, A.; Multari, S.; Martens, S.; Meisel, L.A. Differential phenolic compounds and hormone accumulation patterns between early-and mid-maturing sweet cherry (Prunus avium L.) cultivars during fruit development and ripening. J. Agric. Food Chem. 2021, 69, 8850–8860. [Google Scholar] [CrossRef] [PubMed]
- Gibeaut, D.M.; Whiting, M.D.; Einhorn, T. Time indices of multiphasic development in genotypes of sweet cherry are similar from dormancy to cessation of pit growth. Ann. Bot. 2017, 119, 465–475. [Google Scholar] [CrossRef]
- Zhang, C.; Whiting, M.D. Plant growth regulators improve sweet cherry fruit quality without reducing endocarp growth. Sci. Hortic. 2013, 150, 73–79. [Google Scholar] [CrossRef]
- Alkio, M.; Jonas, U.; Declercq, M.; Van Nocker, S.; Knoche, M. Transcriptional dynamics of the developing sweet cherry (Prunus avium L.) fruit: Sequencing, annotation and expression profiling of exocarp-associated genes. Hortic. Res. 2014, 1, 11. [Google Scholar] [CrossRef]
- Shen, X.; Zhao, K.; Liu, L.; Zhang, K.; Yuan, H.; Liao, X.; Li, T. A role for PacMYBA in ABA-regulated anthocyanin biosynthesis in red-colored sweet cherry cv. Hong Deng (Prunus avium L.). Plant Cell Physiol. 2014, 55, 862–880. [Google Scholar] [CrossRef]
- Dardick, C.; Callahan, A.M. Evolution of the fruit endocarp: Molecular mechanisms underlying adaptations in seed protection and dispersal strategies. Front. Plant Sci. 2014, 5, 284. [Google Scholar] [CrossRef]
- Qu, G.; Peng, D.; Yu, Z.; Chen, X.; Cheng, X.; Yang, Y.; Zhou, B. Advances in the role of auxin for transcriptional regulation of lignin biosynthesis. Funct. Plant Biol. 2021, 48, 743–754. [Google Scholar] [PubMed]
- Wang, Y.; Wang, Q.; Zhang, F.; Han, C.; Li, W.; Ren, M.; Hou, C.; Tao, S. PbARF19-mediated auxin signaling regulates lignification in pear fruit stone cells. Plant Sci. 2024, 344, 112103. [Google Scholar] [CrossRef] [PubMed]
- Braak, J.P. The effect of flowering date and temperature on embryo development in sweet cherry (Prunus avium L.). Neth. J. Agric. Sci. 1978, 26, 13–30. [Google Scholar]
- Kondo, S.; Hayata, Y.; Iwasaki, N. Effects of indole-3-acetic acid and gibberellins on fruit development and maturation of sweet cherry. Acta Hortic. 2000, 514, 75–82. [Google Scholar] [CrossRef]
- Bonghi, C.; Trainotti, L.; Botton, A.; Tadiello, A.; Rasori, A.; Ziliotto, F.; Ramina, A. A microarray approach to identify genes involved in seed-pericarp cross-talk and development in peach. BMC Plant Biol. 2011, 11, 107. [Google Scholar] [CrossRef]
- Yamaguchi, A.; Wu, M.F.; Yang, L.; Wu, G.; Poethig, R.S.; Wagner, D. The microRNA-regulated SBP-box transcription factor SPL3 is a direct upstream activator of LEAFY, FRUITFULL, and APETALA1. Dev. Cell 2009, 17, 268–278. [Google Scholar] [CrossRef]
- Liu, X.; Sun, W.; Liu, H.; Wang, L.; Manzoor, M.A.; Wang, J.; Zhang, C. PavSPLs are key regulators of growth, development, and stress response in sweet cherry. Plant Sci. 2025, 350, 112279. [Google Scholar]
- Gou, J.Y.; Felippes, F.F.; Liu, C.J.; Weigel, D.; Wang, J.W. Negative regulation of anthocyanin biosynthesis in Arabidopsis by a miR156-targeted SPL transcription factor. Plant Cell 2011, 23, 1512–1522. [Google Scholar] [CrossRef]
- Wang, J.W.; Czech, B.; Weigel, D. miR156-regulated SPL transcription factors define an endogenous flowering pathway in Arabidopsis thaliana. Cell 2009, 138, 738–749. [Google Scholar] [CrossRef]
- Wu, G.; Poethig, R.S. Temporal regulation of shoot development in Arabidopsis thaliana by miR156 and its target SPL3. Development 2006, 133, 3539–3547. [Google Scholar] [CrossRef] [PubMed]
- Wang, Y.; Luo, Z.; Zhao, X.; Cao, H.; Wang, L.; Liu, S.; Liu, Z. Superstar microRNA, miR156, involved in plant biological processes and stress response: A review. Sci. Hortic. 2023, 316, 112010. [Google Scholar] [CrossRef]
- Duan, Z.; Qin, Y.; Xia, X.; Yin, W. Overexpression of Populus euphratica peu-MIR156j gene enhancing salt tolerance in Arabidopsis thaliana. J. Beijing For. Univ. 2011, 33, 1–7. [Google Scholar]
- Sun, C.; Zhao, Q.; Liu, D.D.; You, C.X.; Hao, Y.J. Ectopic expression of the apple Md-miRNA156h gene regulates flower and fruit development in Arabidopsis. Plant Cell Tissue Organ Cult. 2013, 112, 343–351. [Google Scholar] [CrossRef]
- Song, M.; Wang, R.; Zhou, F.; Wang, R.; Zhang, S.; Li, D.; Yang, Y. SPLs-mediated flowering regulation and hormone biosynthesis and signaling accompany juvenile-adult phase transition in Pyrus. Sci. Hortic. 2020, 272, 109584. [Google Scholar] [CrossRef]
- Liu, H.; Yu, H.; Tang, G.; Huang, T. Small but powerful: Function of microRNAs in plant development. Plant Cell Rep. 2018, 37, 515–528. [Google Scholar] [CrossRef]
- Soto, E.; Sanchez, E.; Nuñez, C.; Montes, C.; Rothkegel, K.; Andrade, P.; Almeida, A.M. Small RNA differential expression analysis reveals miRNAs involved in dormancy progression in sweet cherry floral buds. Plants 2022, 11, 2396. [Google Scholar] [CrossRef]
- Qian, M.; Ni, J.; Niu, Q.; Bai, S.; Bao, L.; Li, J.; Teng, Y. Response of miR156-SPL module during the red peel coloration of bagging-treated Chinese sand pear (Pyrus pyrifolia Nakai). Front. Physiol. 2017, 8, 550. [Google Scholar] [CrossRef]
- Mohorianu, I.; Schwach, F.; Jing, R.; Lopez-Gomollon, S.; Moxon, S.; Szittya, G.; Dalmay, T. Profiling of short RNAs during fleshy fruit development reveals stage-specific sRNAome expression patterns. Plant J. 2011, 67, 232–246. [Google Scholar] [CrossRef]
- Li, H.; Wang, S.; Zhai, L.; Cui, Y.; Tang, G.; Huo, J.; Bian, S. The miR156/SPL12 module orchestrates fruit colour change through directly regulating ethylene production pathway in blueberry. Plant Biotechnol. J. 2024, 22, 386–400. [Google Scholar] [CrossRef]
- Wang, Y.; Li, W.; Chang, H.; Zhou, J.; Luo, Y.; Zhang, K.; Wang, B. Sweet cherry fruit miRNAs and effect of high CO₂ on the profile associated with ripening. Planta 2019, 249, 1799–1810. [Google Scholar] [CrossRef] [PubMed]
- Sun, Y.; Wang, Y.; Xiao, Y.; Zhang, X.; Du, B.; Turupu, M.; Li, T. Genome-wide identification of the SQUAMOSA promoter-binding protein-like (SPL) transcription factor family in sweet cherry fruit. Int. J. Mol. Sci. 2023, 24, 2880. [Google Scholar] [CrossRef]
- Maldonado, J.E.; Acevedo, O.; Melo, M.; Núñez, C.; Zavala, M.; Menares, M.; Kuhn, N. Seed-fruit multiomics integration of sweet cherry cultivars with different maturity time shows alternative molecular landscapes at the transition from development to ripening, unveiling a role of small RNAs, SPLs, lignin and inositol pathways. Sci. Hortic. 2025, 343, 114099. [Google Scholar]
- Marín-González, E.; Suárez-López, P. “And yet it moves”: Cell-to-cell and long-distance signaling by plant microRNAs. Plant Sci. 2012, 196, 18–30. [Google Scholar]
- San Martino, L.; Manavella, F.A.; García, D.A.; Salato, G. Phenology and fruit quality of nine sweet cherry cultivars in South Patagonia. In V International Cherry Symposium; ISHS: Leuven, Belgium, 2008; Volume 795, pp. 841–848. [Google Scholar]
- Hesse, C.O.; Kester, D.E. Germination of embryos of Prunus related to degree of embryo development and method of handling. Proc. Am. Soc. Hortic. Sci. 1955, 65, 251–264. [Google Scholar]
- Wang, J.; Liu, W.; Zhu, D.; Hong, P.; Zhang, S.; Xiao, S.; Wang, L.; Liu, Q. Chromosome-scale genome assembly of sweet cherry (Prunus avium L.) cv. Tieton obtained using long-read and Hi-C sequencing. Hortic. Res. 2020, 7, 36. [Google Scholar] [CrossRef]
- Huynh-Thu, V.A.; Irrthum, A.; Wehenkel, L.; Geurts, P. Inferring regulatory networks from expression data using tree-based methods. PLoS ONE 2010, 5, e12776. [Google Scholar] [CrossRef]
- Núñez-Lillo, G.; Ponce, E.; Arancibia-Guerra, C.; Carpentier, S.; Carrasco-Pancorbo, A.; Olmo-García, L.; Pedreschi, R. A multiomics integrative analysis of color de-synchronization with softening of ‘Hass’ avocado fruit: A first insight into a complex physiological disorder. Food Chem. 2023, 408, 135215. [Google Scholar] [CrossRef]
- Shannon, P.; Markiel, A.; Ozier, O.; Baliga, N.S.; Wang, J.T.; Ramage, D.; Ideker, T. Cytoscape: A software environment for integrated models of biomolecular interaction networks. Genome Res. 2003, 13, 2498–2504. [Google Scholar] [CrossRef]
- Meisel, L.; Fonseca, B.; González, S.; Baeza-Yates, R.; Cambiazo, V.; Campos, R.; Silva, H. A rapid and efficient method for purifying high quality total RNA from peaches (Prunus persica) for functional genomics analyses. Biol. Res. 2005, 38, 83–88. [Google Scholar]
- Griffiths-Jones, S. miRBase: The microRNA sequence database. In MicroRNA Protocols; Humana Press: Totowa, NJ, USA, 2006; pp. 129–138. [Google Scholar]
- Dai, X.; Zhuang, Z.; Zhao, P.X. psRNATarget: A plant small RNA target analysis server. Nucleic Acids Res. 2018, 46, W49–W54. [Google Scholar] [CrossRef] [PubMed]
- Kumar, S.; Stecher, G.; Suleski, M.; Sanderford, M.; Sharma, S.; Tamura, K. MEGA12: Molecular Evolutionary Genetics Analysis Version 12 for adaptive and green computing. Mol. Biol. Evol. 2024, 41, msae263. [Google Scholar] [CrossRef] [PubMed]
- Tong, Z.; Gao, Z.; Wang, F.; Zhou, J.; Zhang, Z. Selection of reliable reference genes for gene expression studies in peach using real-time PCR. BMC Mol. Biol. 2009, 10, 71. [Google Scholar] [CrossRef]
- Ruijter, J.M.; Ramakers, C.; Hoogaars, W.M.H.; Karlen, Y.; Bakker, O.; Van den Hoff, M.J.B.; Moorman, A. Amplification efficiency: Linking baseline and bias in the analysis of quantitative PCR data. Nucleic Acids Res. 2009, 37, e45. [Google Scholar] [CrossRef]
- Pfaffl, M.W. A new mathematical model for relative quantification in real-time RT–PCR. Nucleic Acids Res. 2001, 29, e45. [Google Scholar] [CrossRef] [PubMed]
- Bustin, S.A.; Benes, V.; Garson, J.A.; Hellemans, J.; Huggett, J.; Kubista, M.; Mueller, R.; Nolan, T.; Pfaffl, M.W.; Shipley, G.L.; et al. The MIQE guidelines: Minimum information for publication of quantitative real-time PCR experiments. Clin. Chem. 2009, 55, 611–622. [Google Scholar] [CrossRef]
- Udvardi, M.K.; Czechowski, T.; Scheible, W.R. Eleven golden rules of quantitative RT-PCR. Plant Cell 2008, 20, 1736–1737. [Google Scholar] [CrossRef]
- Mitra, P.P.; Loqué, D. Histochemical staining of Arabidopsis thaliana secondary cell wall elements. J. Vis. Exp. 2014, 87, 51381. [Google Scholar] [CrossRef]
- Lichtenthaler, H.K. Chlorophylls and carotenoids: Pigments of photosynthetic biomembranes. In Methods Enzymology; Academic Press: Cambridge, MA, USA, 1987; Volume 148, pp. 350–382. [Google Scholar]
- Giusti, M.M.; Wrolstad, R.E. Characterization and measurement of anthocyanins by UV-visible spectroscopy. Curr. Protoc. Food Anal. Chem. 2001, 1, F1.2.1–F1.2.13. [Google Scholar] [CrossRef]
- Dyankova, S.; Doneva, M. Extraction and characterization of anthocyanin colorants from plant sources. Agric. Sci. Technol. 2016, 8, 85–89. [Google Scholar] [CrossRef]
- Jung, S.; Bassett, C.; Bielenberg, D.G.; Cheng, C.H.; Dardick, C.; Main, D.; Schaffer, R.J. A standard nomenclature for gene designation in the Rosaceae. Tree Genet. Genomes 2015, 11, 108. [Google Scholar] [CrossRef]
- Else, M.A.; Stankiewicz-Davies, A.P.; Crisp, C.M.; Atkinson, C.J. The role of polar auxin transport through pedicels of Prunus avium L. in relation to fruit development and retention. J. Exp. Bot. 2004, 55, 2099–2109. [Google Scholar] [CrossRef] [PubMed]
- Xu, Z.; Wu, J.; Jing, X.; Khan, F.S.; Chen, Y.; Chen, Z.; Zhao, X.; Wei, Y. Genome-wide identification of litchi SPL gene family and expression analysis in pericarp anthocyanin biosynthesis. Horticulturae 2024, 10, 762. [Google Scholar] [CrossRef]
- Van de Wouwer, D.; Vanholme, R.; Decou, R.; Goeminne, G.; Audenaert, D.; Nguyen, L.; Morsa, S.; Lammertyn, F.; Van Doorsselaere, J.; Boerjan, W. Chemical genetics uncovers novel inhibitors of lignification, including p-iodobenzoic acid targeting CINNAMATE-4-HYDROXYLASE. Plant Physiol. 2016, 172, 198–220. [Google Scholar] [CrossRef]
- Serrani, J.C.; Carrera, E.; Ruiz-Rivero, O.; Gallego-Giraldo, L.; Peres, L.E.P.; García-Martínez, J.L. Inhibition of auxin transport from the ovary or from the apical shoot induces parthenocarpic fruit-set in tomato mediated by gibberellins. Plant Physiol. 2010, 153, 851–862. [Google Scholar] [CrossRef]
- Serrano, A.; Kuhn, N.; Restovic, F.; Meyer-Regueiro, C.; Madariaga, M.; Arce-Johnson, P. The glucose-related decrease in polar auxin transport during ripening and its possible role in grapevine berry coloring. J. Plant Growth Regul. 2023, 42, 365–375. [Google Scholar] [CrossRef]
- Arancibia-Guerra, C.; Núñez-Lillo, G.; Cáceres-Mella, A.; Carrera, E.; Meneses, C.; Kuhn, N.; Pedreschi, R. Color desynchronization with softening of ‘Hass’ avocado: Targeted pigment, hormone and gene expression analysis. Postharvest Biol. Technol. 2022, 194, 112067. [Google Scholar] [CrossRef]


| miRNA | Target | miRNA Aligned Fragment | Alignment | Target-Aligned Fragment | Expectation | Target Start | Target End | Inhibition |
|---|---|---|---|---|---|---|---|---|
| miR156f | PavSPL9 | UUGACAGAAGAGAGAGAGCACA | :::::::::::::::::::::: | UGUGCUCUCUCUCUUCUGUCAA | 0.0 | 784 | 805 | Cleavage |
| miR156f | PavSPL2 | UUGACAGAAGAGAGAGAGCACA | ::::::::::::::::::::: | CGUGCUCUCUCUCUUCUGUCAA | 0.0 | 1150 | 1171 | Cleavage |
| miR156a | PavSPL9 | UGACAGAAGAGAGAGAGCACA | ::::::::::::::::::::: | UGUGCUCUCUCUCUUCUGUCA | 0.0 | 784 | 804 | Cleavage |
| miR156a | PavSPL2 | UGACAGAAGAGAGAGAGCACA | :::::::::::::::::::: | CGUGCUCUCUCUCUUCUGUCA | 0.0 | 1150 | 1170 | Cleavage |
Disclaimer/Publisher’s Note: The statements, opinions and data contained in all publications are solely those of the individual author(s) and contributor(s) and not of MDPI and/or the editor(s). MDPI and/or the editor(s) disclaim responsibility for any injury to people or property resulting from any ideas, methods, instructions or products referred to in the content. |
© 2025 by the authors. Licensee MDPI, Basel, Switzerland. This article is an open access article distributed under the terms and conditions of the Creative Commons Attribution (CC BY) license (https://creativecommons.org/licenses/by/4.0/).
Share and Cite
Zavala, M.; Menares, M.; Acevedo, O.; Melo, M.; Nuñez, C.; Arancibia, C.; Pedreschi, R.; Donoso, J.M.; Meisel, L.A.; Maldonado, J.E.; et al. PavSPL Expression Dynamics in Fruits and Seeds and in Relation to Endocarp Lignification Status During the Transition from Development to Ripening in Sweet Cherry. Horticulturae 2025, 11, 706. https://doi.org/10.3390/horticulturae11060706
Zavala M, Menares M, Acevedo O, Melo M, Nuñez C, Arancibia C, Pedreschi R, Donoso JM, Meisel LA, Maldonado JE, et al. PavSPL Expression Dynamics in Fruits and Seeds and in Relation to Endocarp Lignification Status During the Transition from Development to Ripening in Sweet Cherry. Horticulturae. 2025; 11(6):706. https://doi.org/10.3390/horticulturae11060706
Chicago/Turabian StyleZavala, Matías, Marcela Menares, Orlando Acevedo, Mirna Melo, Carlos Nuñez, Camila Arancibia, Romina Pedreschi, José Manuel Donoso, Lee A. Meisel, Jonathan E. Maldonado, and et al. 2025. "PavSPL Expression Dynamics in Fruits and Seeds and in Relation to Endocarp Lignification Status During the Transition from Development to Ripening in Sweet Cherry" Horticulturae 11, no. 6: 706. https://doi.org/10.3390/horticulturae11060706
APA StyleZavala, M., Menares, M., Acevedo, O., Melo, M., Nuñez, C., Arancibia, C., Pedreschi, R., Donoso, J. M., Meisel, L. A., Maldonado, J. E., & Kuhn, N. (2025). PavSPL Expression Dynamics in Fruits and Seeds and in Relation to Endocarp Lignification Status During the Transition from Development to Ripening in Sweet Cherry. Horticulturae, 11(6), 706. https://doi.org/10.3390/horticulturae11060706