Article

Networking 13 Berry Minerals to Sustain a High Yield of Firm Cranberry Fruits

by
Leon Etienne Parent
1,2
1
Cranberry Research and Innovation Center (CRIC), Notre-Dame-de-Lourdes, QUE G0S 1T0, Canada
2
Department of Soils and Agrifood Engineering, Laval University, Quebec, QUE G1V 0A6, Canada
Horticulturae 2025, 11(6), 705; https://doi.org/10.3390/horticulturae11060705
Submission received: 12 May 2025 / Revised: 13 June 2025 / Accepted: 17 June 2025 / Published: 18 June 2025
(This article belongs to the Special Issue Mineral Nutrition of Plants)

Abstract

:
The N fertilization to reach high cranberry (Vaccinium macrocarpon) yields resulted in high proportions of soft berries. Our objective was to define the mineral nutrient balance of cranberry to reach a high yield of firm berries. The database comprised 393 observations on cv. ‘Stevens’. Berries were analyzed for total S, N, P, K, Ca, Mg, B, Cu, Zn, Mn, Fe, Al, and Si. Random Forest and XGBoost machine learning models were run to predict yield and firmness classes using raw concentrations, centered log ratios (clr) accounting for nutrient interactions, and weighted log ratios (wlr) that also considered the importance of each dual interaction. The wlr returned the most accurate models. The wlr standards elaborated from the high-yielding and nutritionally balanced subpopulation most often differed between the high-yield class and the high-firmness class. The wlr Cu level was significantly (p ≤ 0.01) too high to reach the high-yielding class in the nutritionally imbalanced subpopulation. There was excessive Al and shortage of Si and Mg to reach high berry firmness in the nutritionally imbalanced subpopulation (p ≤ 0.01), indicating the large influence of soil genesis on berry firmness. Despite statistical evidence, cranberry response to Al and Si corrective measures should be tested to elaborate site-specific recommendations based on soil and tissue tests.

1. Introduction

Cranberry is a domesticated perennial fruit crop grown on acid sandy or peaty soils at low landscape positions to facilitate water transfer for irrigation and flooding [1]. The greater dependence of cranberry crops on pesticides under climate change requires combining genetic and nutritional strategies. The most desired traits for the release of new cranberry cultivar are those impacting firmness, fruit size, anthocyanin content, and resistance to fruit rot [2]. Cell wall structure, turgor, cuticle properties, and biochemical constitution are of utmost importance for fruit firmness, resistance to pests and diseases, handling, storage, and shipping [3,4,5]. Mineral concentrations are generally lower in cultivars bred for higher yields due in part to the dilution effect of carbohydrates on minerals [6]. Systemic-induced resistance (SIR) acquired through balanced plant nutrition is a complementary strategy to promote plant resistance mechanisms, reduce the severity of disease and pest damage and reduce fertilizer and pesticide applications in sustainable agriculture production systems [7].
The status of N, K, P, Mn, Zn, B, Cl, and Si impacts fruit firmness and plant resistance to diseases [8]. N increases crop yield but, applied in excess, increases plants’ attractiveness for pests and pathogens, and weakens fruit firmness [9,10] and plant defense mechanisms [11]. Excess N produces succulent cranberry plants with long uprights, many more runners, and fewer fruits, higher plant density and susceptibility to disease, spring frost, insect feeding, poor fruit quality, delayed color development, and adverse carry-over effects in the following years [12]. Fruit skin is softened by excess N [9] but strengthened by Ca [13] and B [14,15]. The K deficiency impairs protein synthesis, increasing the amount of soluble N compounds made available to pathogens [8].
The Si plays a central role in pest and disease control [16,17,18,19,20,21,22,23,24] and promotes nutrient acquisition by plants [25]. On the other hand, soil acidity is maintained low in cranberry soils by applying elemental sulfur [26,27]. Soil acidity increases the availability of Al, Mn, Fe, and Si in the soil [28]. The Al is toxic to most cultivated plants at pH < 5.5 [29,30]. Al impacts the physiology of highbush blueberry (Vaccinium corymbosum) [31] grown under conditions of acidity that resemble those of cranberry.
While the mineral analysis of a plant or one of its parts is thought to integrate all factors impacting plant growth [32] its interpretation is made difficult due to multiple nutrient interactions [33,34,35,36,37] and combinations of related genetic, environmental, and managerial factors [38,39,40]. Because N, P, K, Ca, Mg, and B interact to reach high fruit quality [38], this raises the question of how to integrate the combined effects of nutrients and analyze them statistically [33,34,35,36,37,41,42,43,44]. The Diagnosis and Recommendation Integrated System (DRIS) [41] was the first model to integrate nutrients as dual ratios [38]. Computational flaws in DRIS were corrected as Compositional Nutrient Diagnosis [42] in conformity with the theory of Compositional Data Analysis [45].
Dual ratios are physiologically meaningful expressions reflecting dual interactions [34]. Log-transformed dual ratios (dlr) are more appropriate expressions for conducting statistical analyses [46]. The dlr’s are additive as centered log ratios (clr) [47,48]. Although meaningful interactions have been documented [36,49], the agronomic importance of each interaction varies widely across agroecosystems [48,50]. Each dlr should thus be assigned a weighting coefficient before their integration into weighted log ratios (wlr) to elaborate agronomically meaningful regional nutrient standards [48,50]. The gain ratio weights each dlr for its capacity to discriminate between low- and high-performing crops about the selected cutoff values using machine learning classification models.
It was hypothesized that cranberry mineral composition differs between high-performing crops regarding yield or firmness. The objective of this paper is to provide mineral diagnostic tools to reach a high yield of firm berries.

2. Materials and Methods
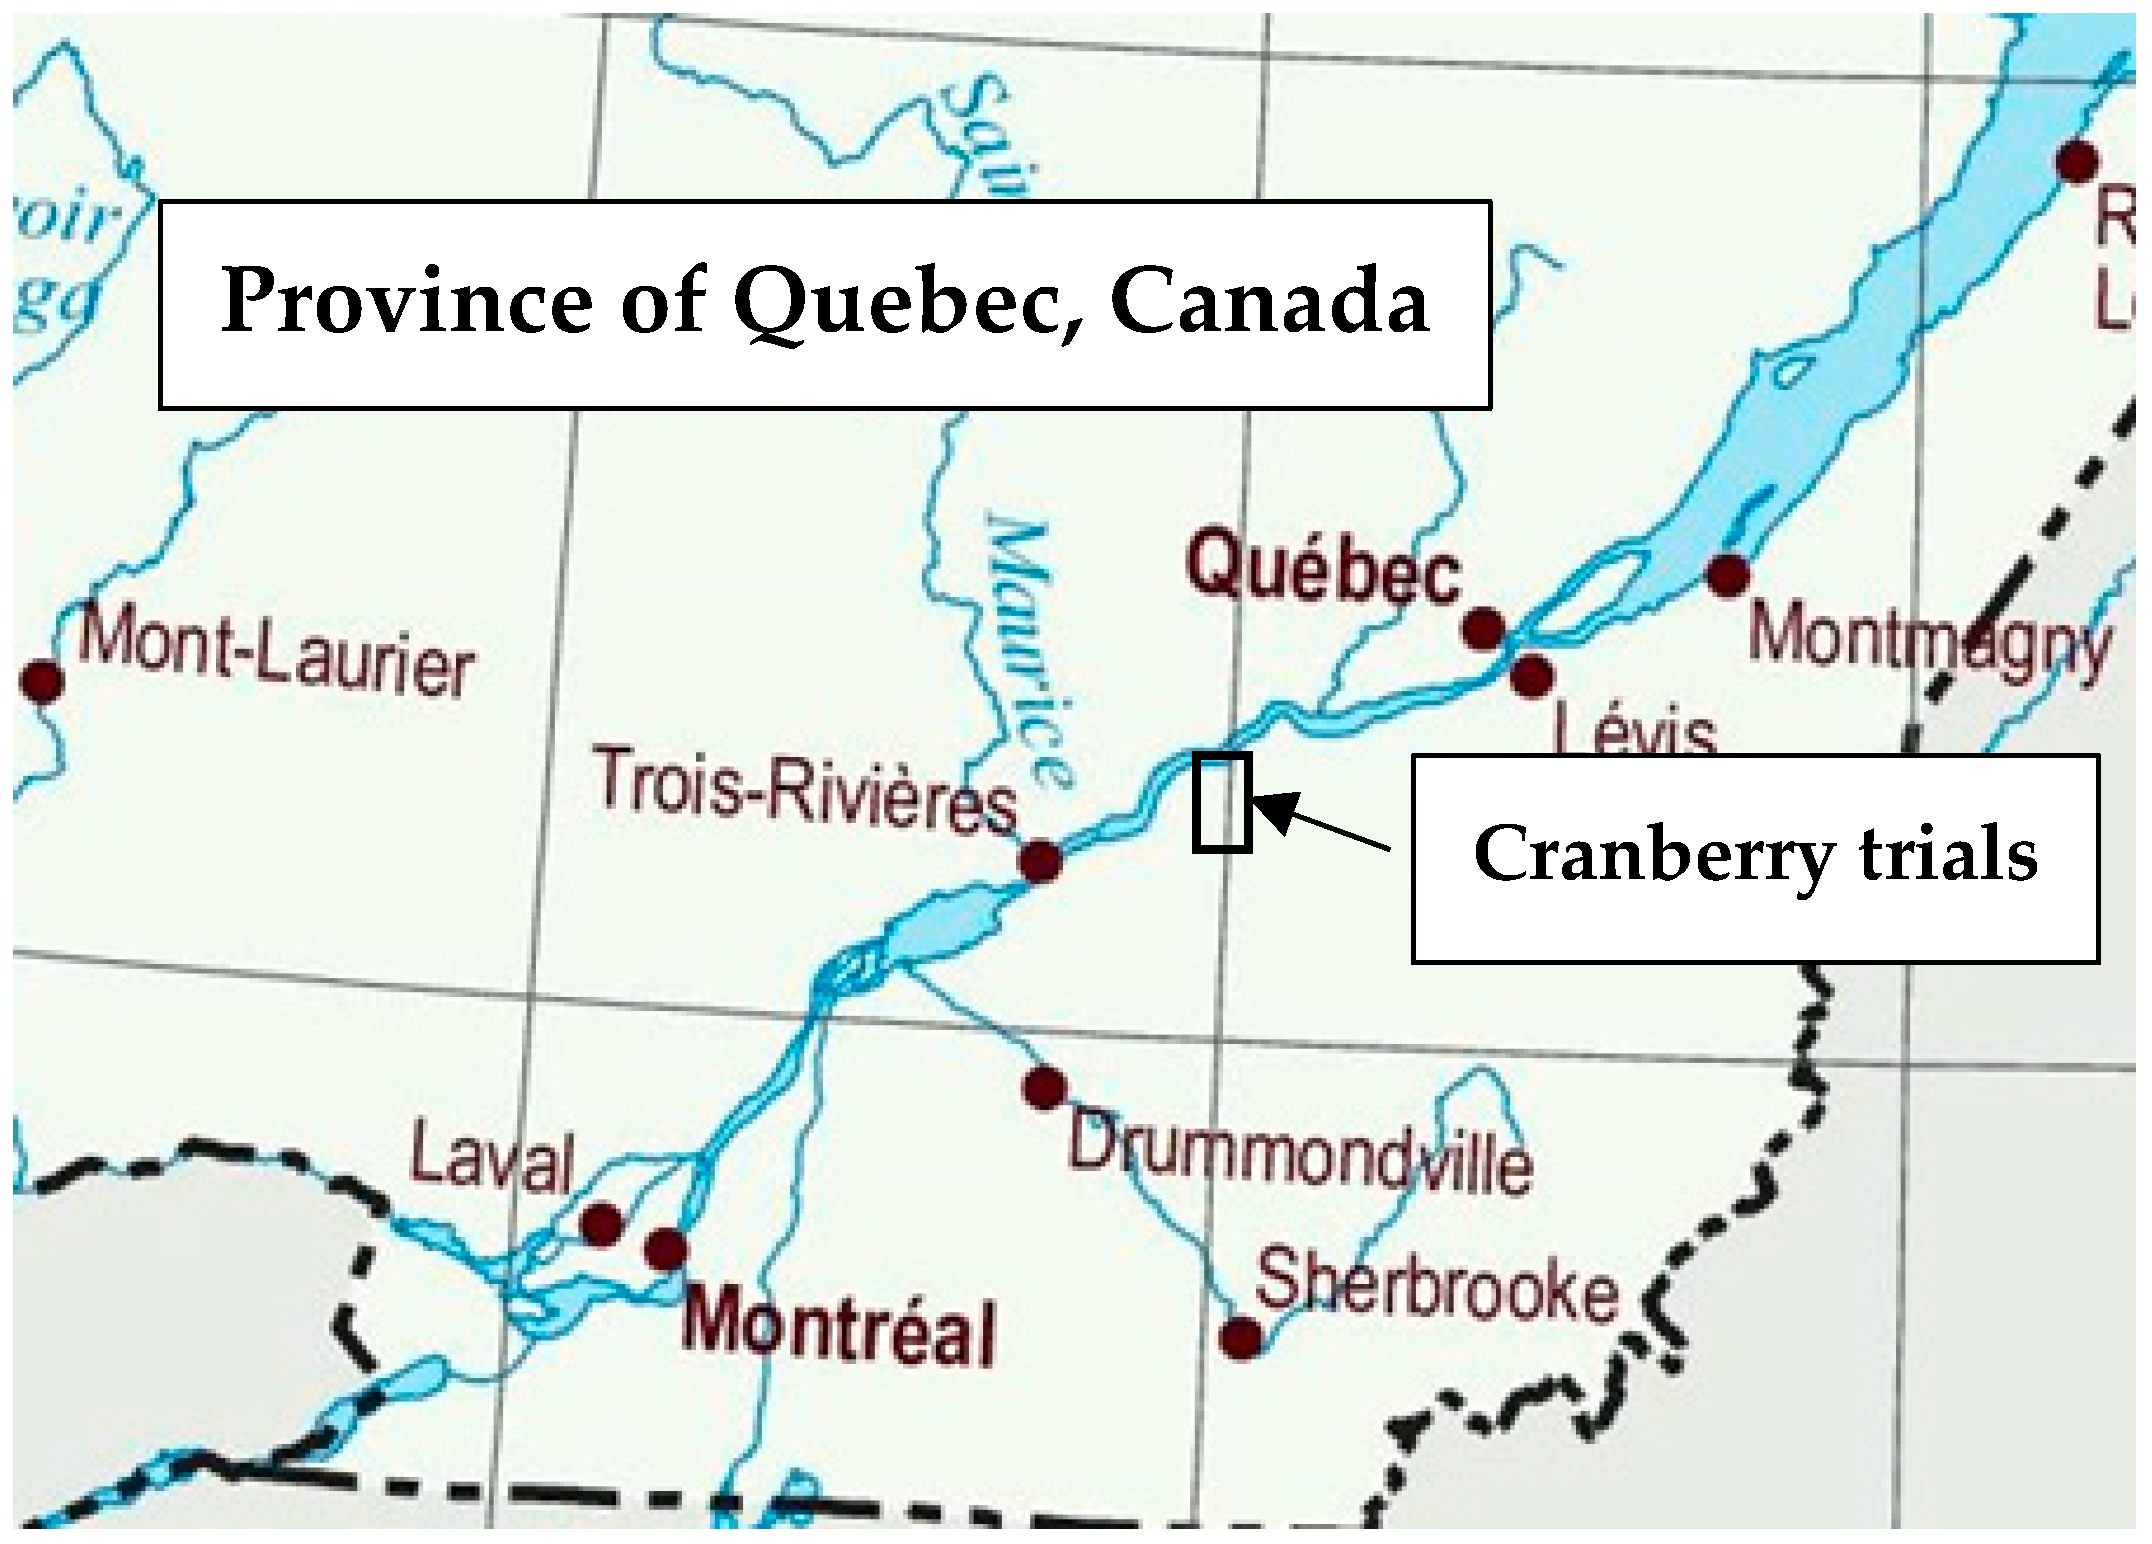
2.1. Database

Statistical compositional tools were elaborated using a dataset on berry mineral composition, yield, and firmness collected at plot scale in fertilizer trials during three consecutive years. The cranberry database comprised 393 observations collected between 2014 and 2018 on cv. ‘Stevens’ in permanent plots at four sites in south-central Quebec (Figure 1). Acid cranberry soils were classified as Spodosols and Inceptisols. Soil pHwater in the 0–15 cm layer varied between 4.16 and 5.58 across years with a median value of 4.68.
Fertilizer treatments were duplicated. There were five N rates (0, 15, 30, 45, 60 kg N ha−1) applied as ammonium sulfate (21% N), sulfur-coated urea (24% N, 2% P, 9% K, 5% S), or organic fertilizers (8% N as amino acids; 6% N, 0.4%P, and 0.8% K as fish emulsions) and four K rates (0, 40, 80, 120 kg K ha−1) applied as potassium sulfate (0% K, 14% S) or Sul-Po-Mag (18% K, 9% Mg, 18%S). The P, Mg, Cu, and B treatments were applied together with 45 kg N ha−1 and 80 kg K ha−1 at rates of 0–15–30 kg P ha−1 as triple super-phosphate (conventional sites) or bone meal (organic site), 0 or 12 kg Mg ha−1 as Epsom salt, 0 or 2 kg Cu ha−1 as copper sulfate, and 0 or 1 kg B ha−1 as Solubor. The P, Mg, Cu, and B treatments were replaced at three sites in 2016 and 2017 to test N sources (SCU and organic fertilizers) and elemental sulfur (effect of 0–250–500–1000 kg S ha−1 on soil acidification). Rates of 15 kg P ha−1, 12 kg Mg ha−1, 2 kg Cu ha−1, and 1 kg B ha−1 as Solubor were applied on those plots. Treatments were broadcast-applied manually on four occasions during the season as follows: 15% at early flowering (29 June to 2 July), 35% at 50% flowering (July 8 to 11), 35% at 50% fruit set (July 16 to 19) and 15%, 1–2 weeks after the last application.
Stands were irrigated to prevent early frost damage and maintain soil matric potential between −4 and −7 kPa [51]. Berries were hand-picked in four 30 cm × 30 cm quadrats per 4 m × 3 m plot approximately two weeks before mechanical harvesting. Berry firmness was quantified using the TA.TX2 Texture Analyzer (Texture Technologies Inc., Scarsdale, NY, USA) [10].

2.2. Tissue Analyses

One hundred berries were collected randomly in each plot, composited, oven-dried at 65 °C for 24 h to 36 h, ground to pass through a 1-mm sieve, acid-digested [52], and analyzed for total S, N, P, K, Ca, Mg, B, Cu, Zn, Mn, Fe, Al, and Si by plasma emission spectroscopy (ICP-OES). Total N was quantified by Dumas combustion (Leco-2000 instrument, St-Louis, MO, USA).

2.3. Data Transformation

The compositional space of berry dry matter comprised 13 elements (S, N, P, K, Ca, Mg, B, Cu, Zn, Mn, Fe, Al, and Si) and x D , the filling value between the measurement unit and the sum of quantified elements, closing the simplex to 1000   g   kg 1 , as follows:
S D = { ( S ,   N ,   P ,   K ,   C a ,   M g ,   B ,   C u ,   Z n ,   M n ,   F e ,   A l ,   S i ,   x D : S x D > 0 ;   S + N + P + K + C a + M g + B + C u + Z n + M n , + F e + A l + S i + x D = 1000   g   k g 1 }
There are D × D 1 / 2 dual log ratios in a D-parts composition, hence 91 dual log ratios for D = 14 including x D . The x D is a catchall feature representing the concentrations of O, H, and elements not documented in the database. Dual ratios were log-transformed to support additivity [31]. The clr is the average of the D × D 1 / 2 dual log ratios as follows [47,48]:
c l r i = l n x i / g x = l n x i x 1 × x i x 2 × × x i S D 1 D = 1 D l n x i x 1 + l n x i x 2 + + l n x i S D    
where g x = x 1 x 2 x D 1 D is the geometric mean across components. To avoid including zeroes in the logarithmic expressions, concentration values below detection limits were replaced by 2/3 times the detection limit [47]. Including data that are below the detection limit but informative contributes to solving complex compositional problems [53].
Although mathematically sound, the clr expression assigns an equal weight ( 1 D ) to every dual log ratio. However, the diagnostic importance of dual log ratios regarding the target variable varies widely among species, growing conditions, and growth stages [54]. Each dual log ratio can be weighted by its gain ratio regarding the target variable in binary classification models [48,50]. The gain ratio is an unbiased metric of information gain to measure how effective a predictor is in classifying data about the selected cutoff value. The higher the gain ratio, the more important is the predictor regarding the classification of the target variable, making the gain ratio useful for diagnostic purposes. The weighted log ratio (wlr) is a clr expression where every dual log ratio is weighted for its importance using the corresponding gain ratio φ as follows [48]:
w l r x i = 1 D φ 1 l n x i x 1 + φ 2 l n x i x 2 + + φ D l n x i x D
where D is the number of dual ratios involving x i , and x ’s are the components of the simplex. If all φ k = 1 , w l r x i = c l r x i . To compute the wlr of the element x i , x i is maintained at the numerator as is the case for calculating DRIS indices [55]. If x i is at the denominator in the dual log ratio reflecting a given dual interaction [49], it is moved at the numerator by multiplying the dual log ratio by −1, i.e., l n x j x i = l n x i x j . The wlr expression retains the properties of clr, as follows:
i = 1 D w l r x i = 0
ε = i = 1 D w l r x i w l r x i * 2
where ε is the Euclidean distance between two equal-length compositions and w l r x i * is the reference wlr value. The Euclidean distance is a useful metric to compare unhealthy to healthy plants under the ceteris paribus assumption. The elemental distances can be displayed on a histogram to identify the most limiting elements.
Like the clr index, the wlr index is computed as follows given the normal variation of wlr values in a subpopulation [42]:
I n d e x   w l r x i = w l r x i w l r x i * s w l r x i *
where w l r x i * and s w l r x i * are means and standard deviations of wlr values for a subpopulation of nutritionally balanced specimens. The w l r x i * and s w l r x i * are nutrient standards. I n d e x   w l r x i is a standardized variable.

2.4. Statistical Analysis

Classification variables were berry yield and firmness. Yield and firmness data were split into two classes as low- and high-performing specimens split about the upper quartile. Cutoff values were 6253 g of compression force for berry firmness and 42.7 Mg ha−1 for berry yield. In comparison, cranberry firmness was found to vary from 5000 to more than 8000 g during the ripening period, depending on the cultivar, including ‘Stevens’ [3]. The cutoff yield for hand-picked berries is higher compared to the mechanically harvested berries averaging 32 Mg ha−1 in Quebec.
Random Forest and Extreme Gradient Boosting (XGBoost) are decision-tree ML models. Random Forest is the classical reference model. Gradient Boosting combines weak learners into a stronger learner by minimizing the loss function. Classification models were run in cross-validation (10 folds) using the Orange Data Mining freeware vs. 3.37 (University of Ljubljana, Slovenia).
Machine Learning (ML) models classify specimens into four categories in a confusion matrix (Figure 2), as follows:
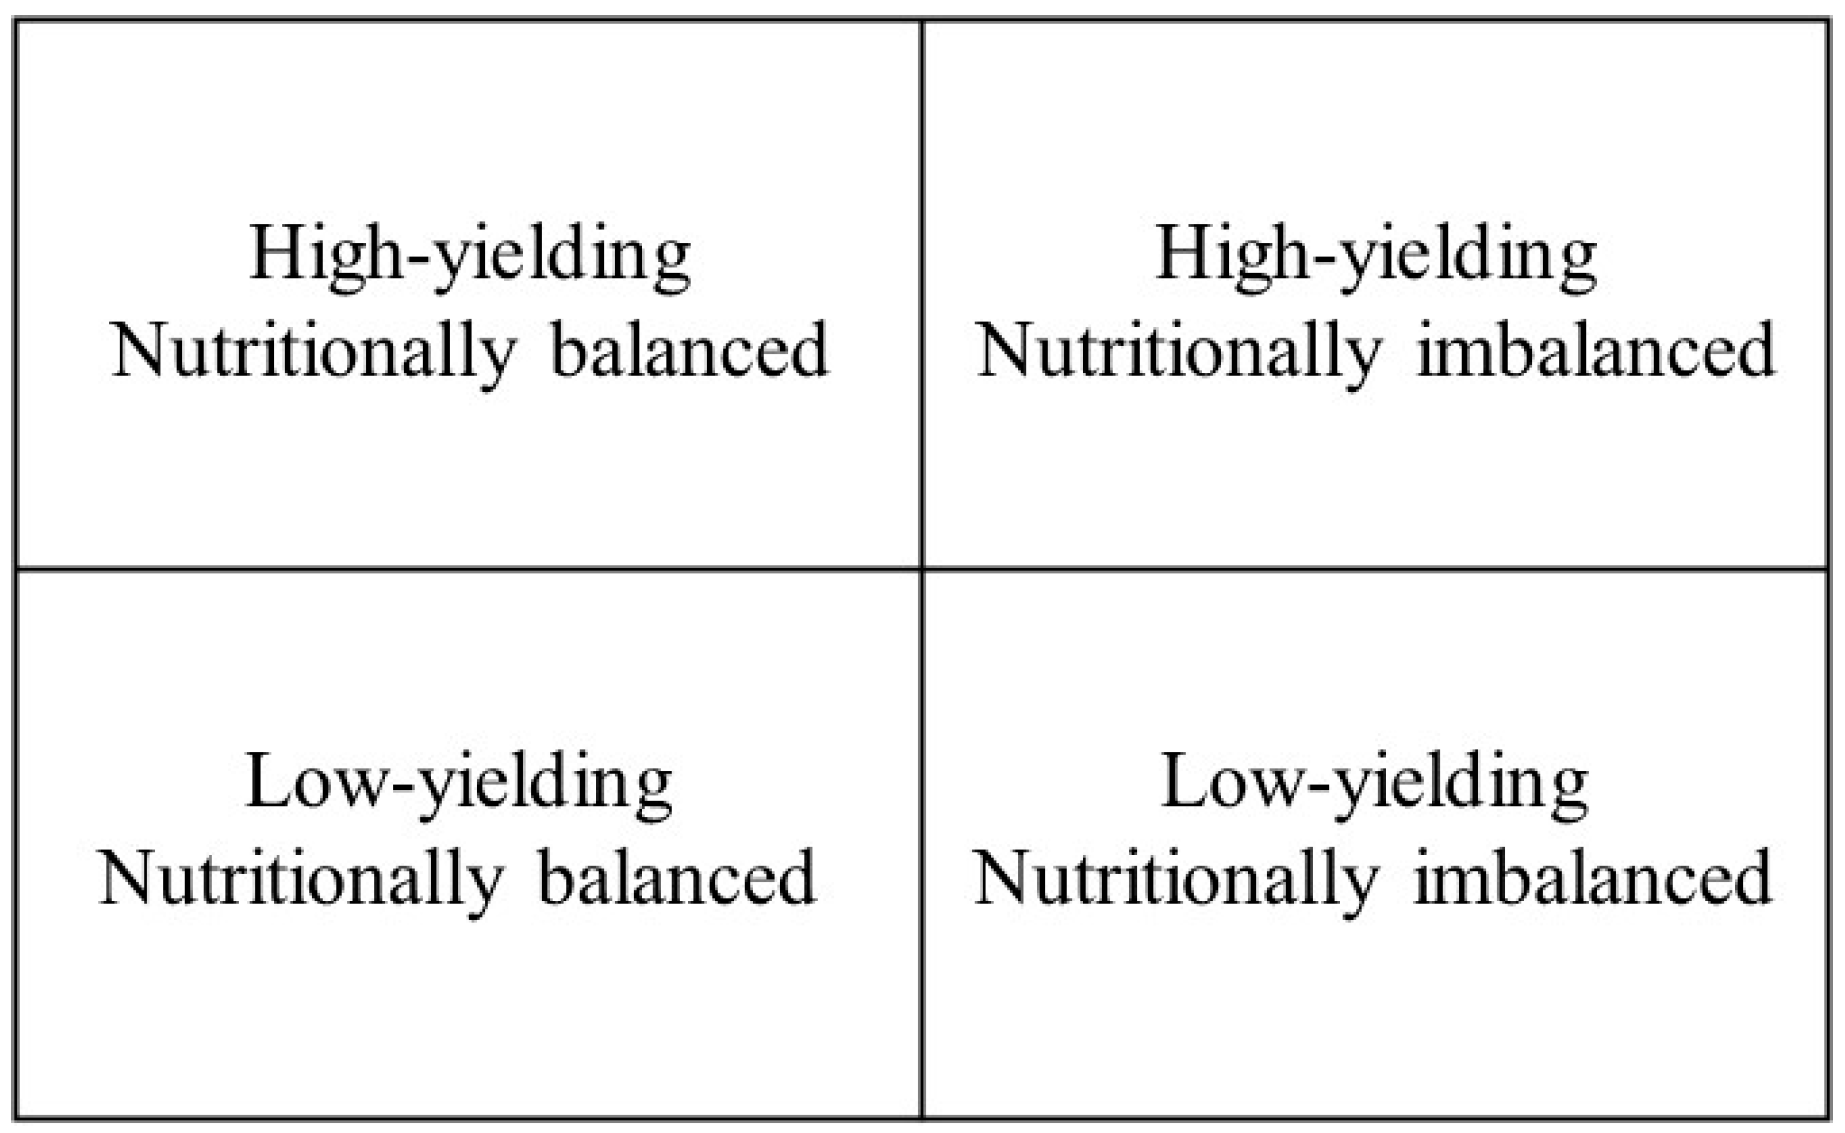
  • High-yielding and nutritionally balanced specimens.
  • Low-yielding and nutritionally balanced specimens where features other than the ones included in the model limit berry yield or quality.
  • High-yielding and nutritionally imbalanced specimens due to luxury consumption, suboptimal concentration, or contamination.
  • Low-yielding and nutritionally imbalanced specimens.
Model accuracy is computed as follows:
Accuracy = ( Number   of   high   yielding   and   nutritionally   balanced ) + ( number   of   l ow   yielding   and   nutritionally   imbalanced   specimens ) Total   number   of   specimens
The area under the curve (AUC) separates signal from noise in binary classification models.

3. Results

3.1. Berry Composition, Yield, and Quality
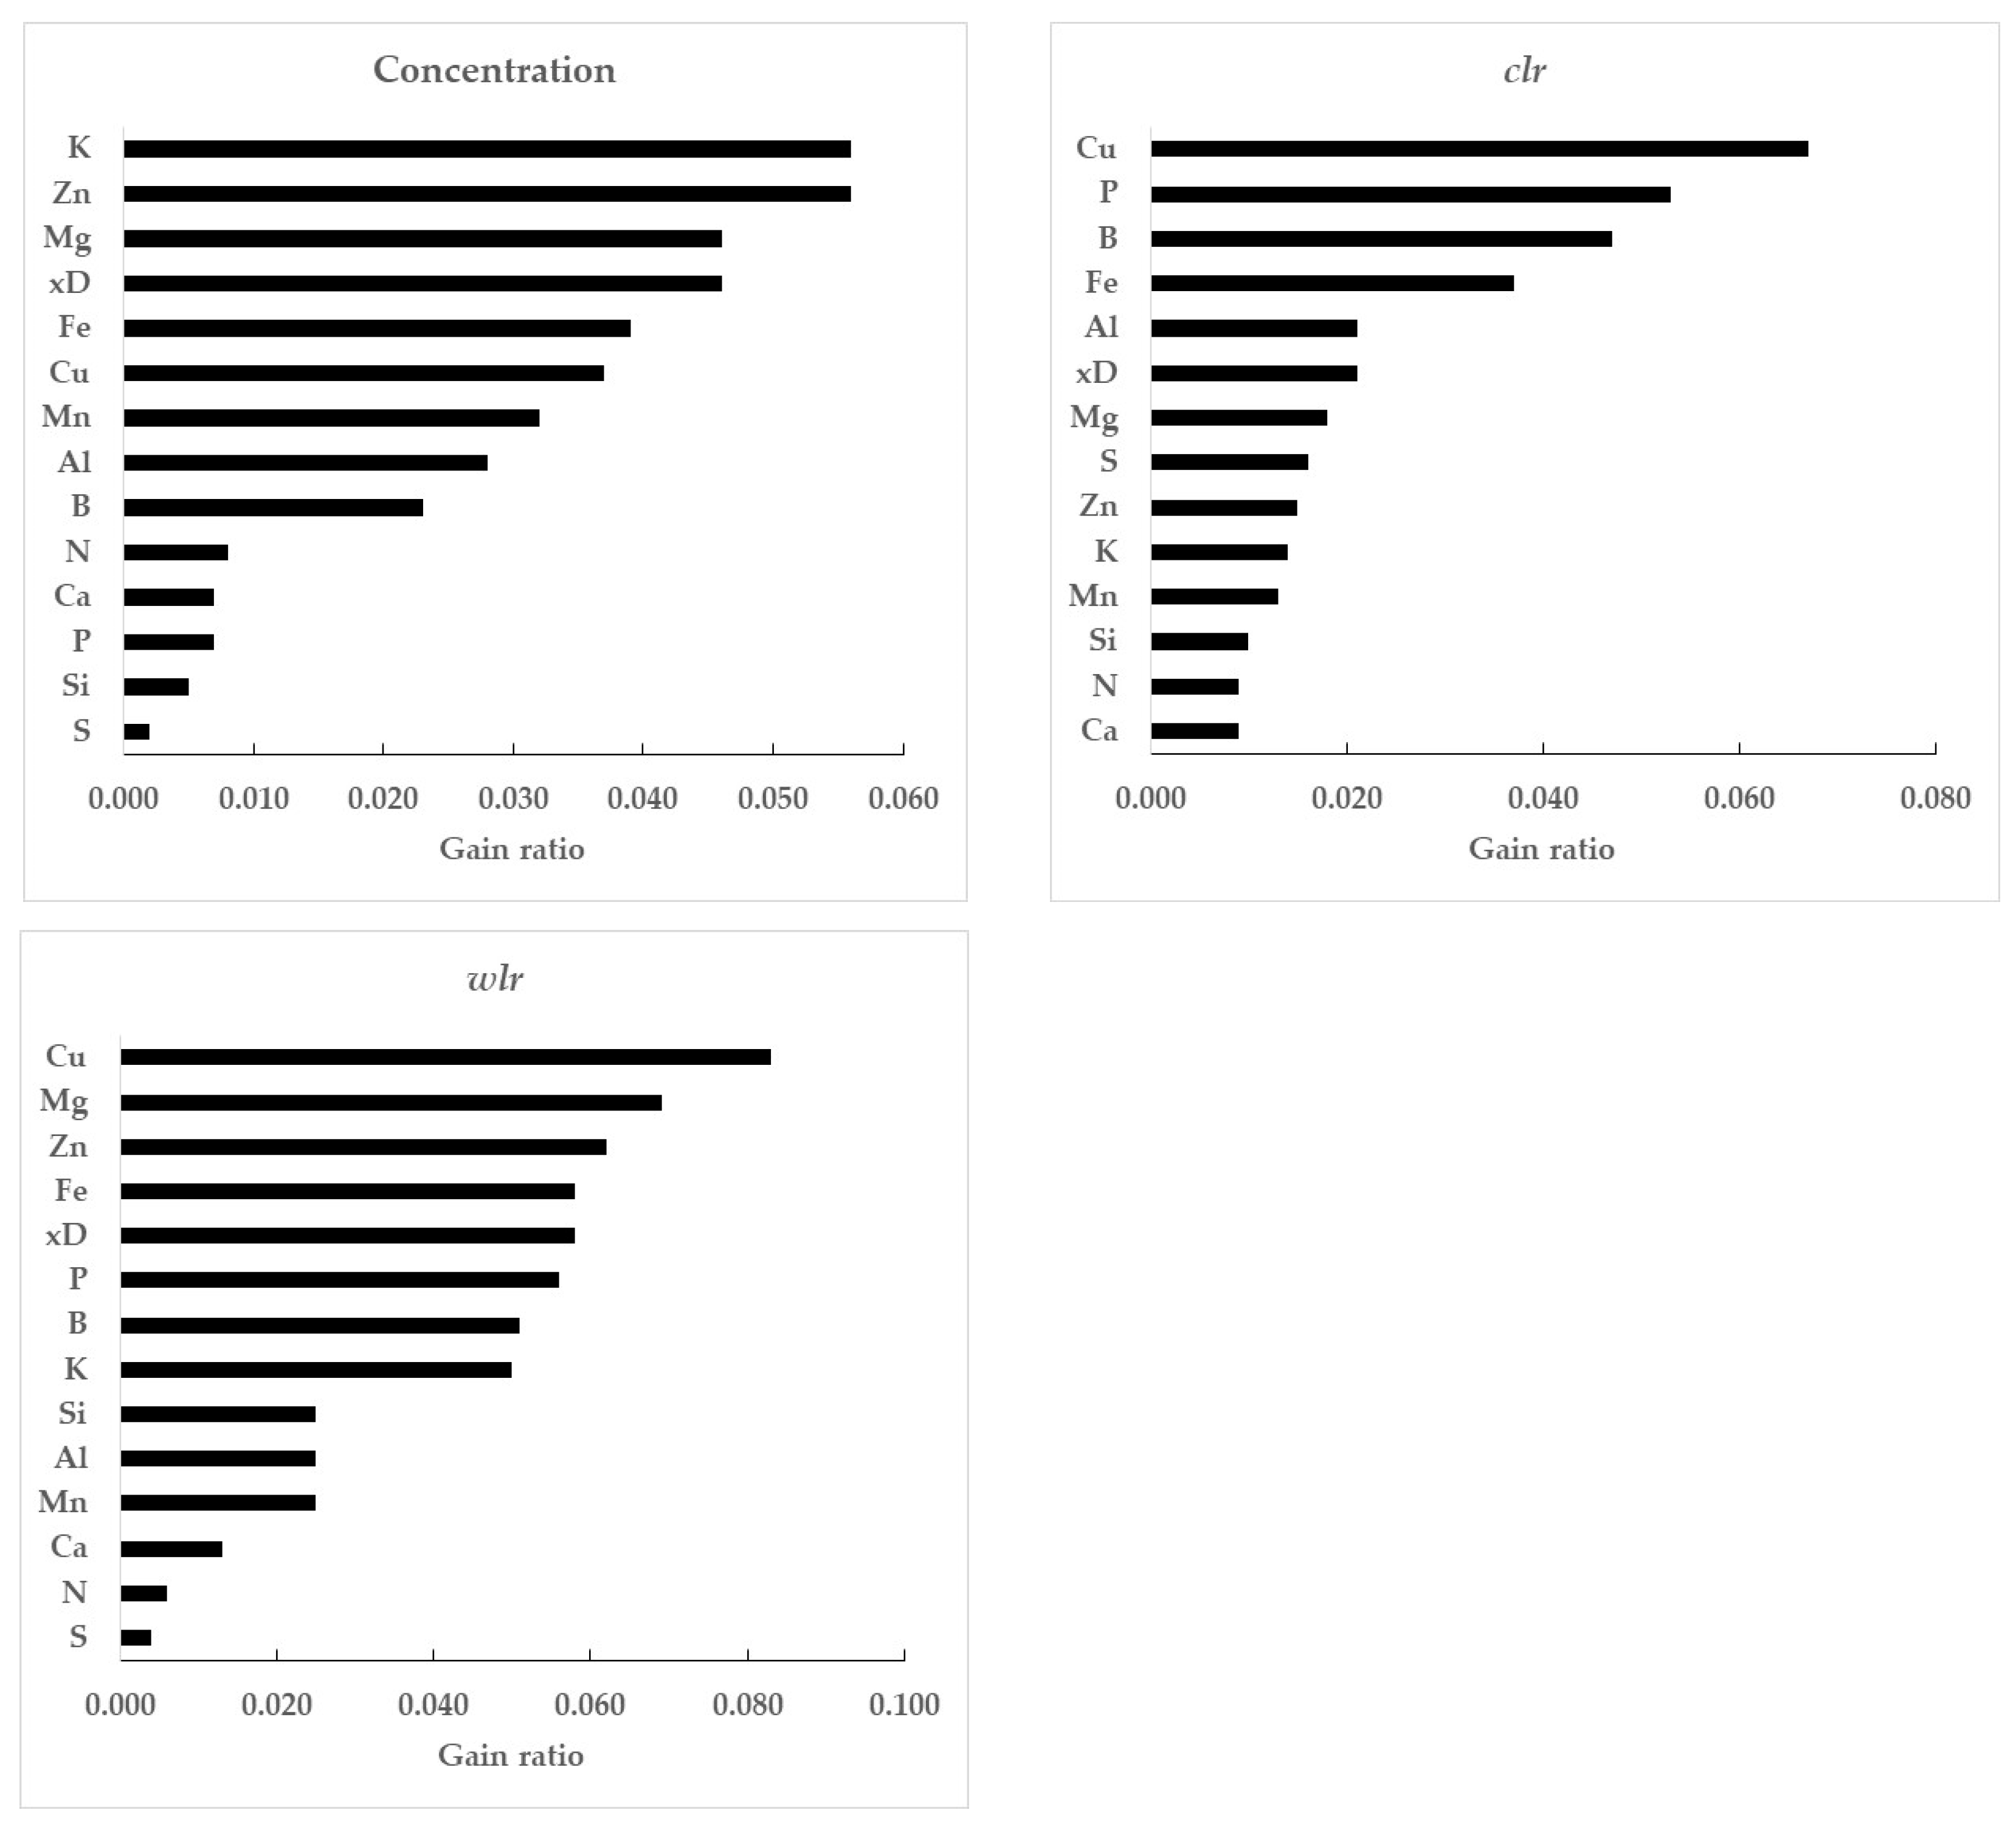
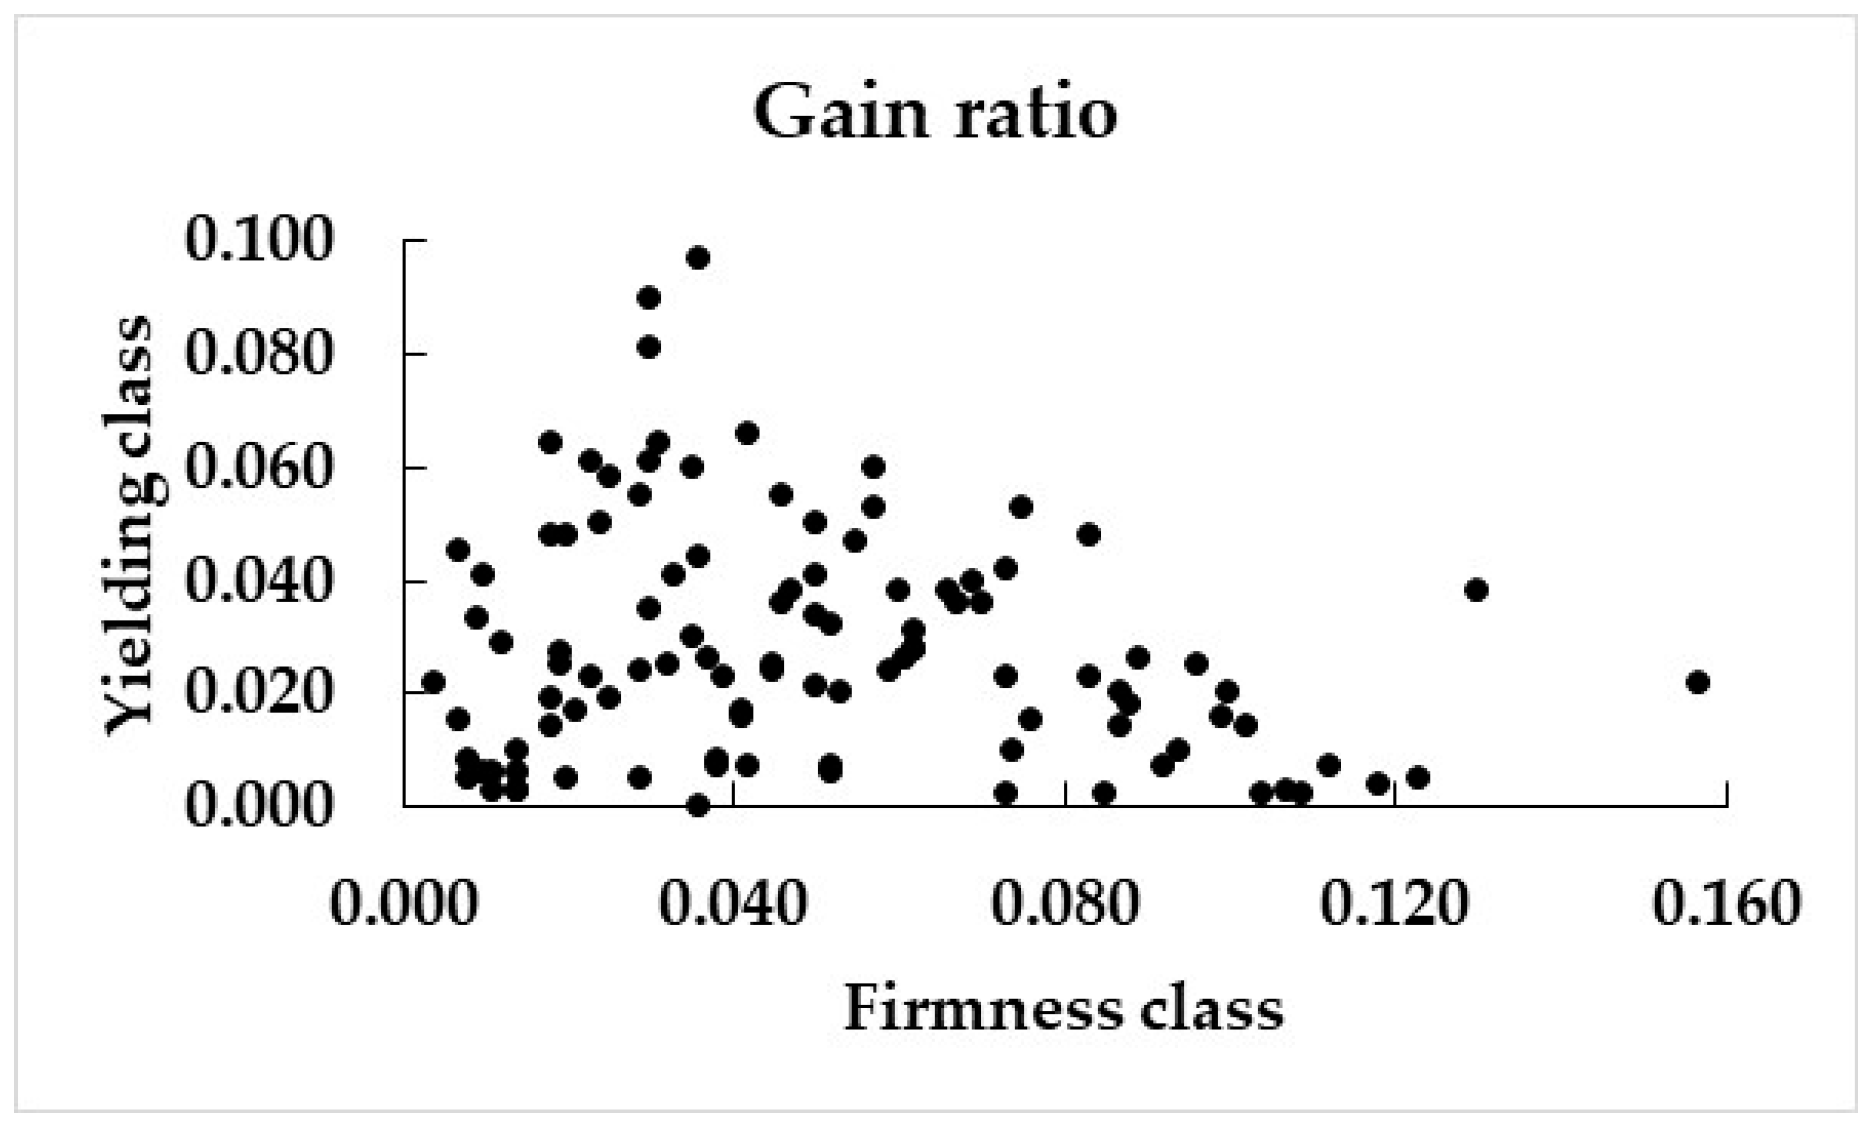
There were wide ranges of berry elemental composition, yield, and firmness over the years (Table 1). Berry Al mean and standard deviation were the highest in 2016, when the S treatments were initiated to acidify the soil. Berry Si was the highest in 2018. The average berry yield was lowest in 2017. Berry firmness was the highest in 2018.

3.2. Gain Ratios

The top three gain ratios for yield classification were K, Zn, and Mg for raw concentrations, Cu, P, and B for clr, and Cu, Mg, and Zn for wlr (Figure 3), highlighting the importance of considering nutrient interactions for the classification. The top gain ratios regarding firmness classes were Si, Fe, Ca, and Al for raw concentrations, and Si, Al, Fe, and B for clr and wlr (Figure 4), indicating the great importance of soil weathering (Si, Al, Fe) for berry firmness.
The gain ratios of dlr’s ranged from 0.004 to 0.097 for berry yield and from 0.000 to 0.157 for berry firmness. There was no significant correlation between the gain ratios of dlr variables regarding berry yield or firmness (Figure 5), implying that cranberry nutrition should be addressed differently depending on the target variable (yield or firmness).

3.3. Classification Models

Area under the curve (AUC), model accuracy, and numbers of high-yielding and nutritionally balanced specimens and low-yielding and nutritionally imbalanced specimens are presented in Table 2 for the two ML classification models. Classification models performed reasonably well. XGBoost performed slightly better than Random Forest. Models were more accurate for berry firmness than berry yield, indicating more genetic control on berry firmness.
The XGBoost model was selected to derive statistics for the high-yielding and nutritionally balanced subpopulations (Table 3). The standard deviation of wlr variables was higher across the yield than the firmness performing classes. The Al level at high berry firmness was lower and less variable than the Al level at high berry yield, indicating that firmness was more sensitive than yield to Al. The Si level at high berry firmness was much higher and less variable than the Si level at high berry yield, indicating that firmness was more sensitive than yield to Si. Si showed the second most important difference between the firmness and yield classes, followed by B. The B level at high berry firmness was higher and less variable than the B level at high berry yield, indicating that firmness was more sensitive than yield to B. The reference wlr standards depended on the target variable.

3.4. Diagnosis of Nutritionally Imbalanced and Low-Yielding Specimens

The wlr means of low-yielding and nutritionally imbalanced specimens were diagnosed against wlr standards (wlr means and standard deviations for nutritionally balanced specimens) and displayed in a histogram (Figure 6). The wlr indices for firmness showed significance (p ≤ 0.01) for Mg, Al, and Si imbalance, indicating relative Mg and Si shortage and relative Al excess. Only the wlr Cu index was significant (p ≤ 0.01) for the yielding class, indicating Cu excess in the average low-yielding and nutritionally imbalanced specimen. Cranberry nutrition is thus a compromise to reach the elemental balance needed to produce high yields of firm berries.

4. Discussion

4.1. The wlr Expression

The agronomic level is the one at which fertilization decisions are taken. However, the interpretation of interactions among elements poses a great challenge [48,50]. Interactions alter concentration ranges used for diagnostic purposes [33]. The clr transformation integrates dual log ratios, removing noise attributable to interactions. The wlr transformation that considers the importance of dlr’s for the target variable adjusts mineral standards to the information provided by the database. Accuracy and AUC of ML classification models were improved using wlr to predict berry yield and firmness.
Plants react to the availability of elements through “signaling” and “crosstalk” [35,36]. Sulfur interacts with metals, N, P, K, Mo, and B at agronomic, physiological, biochemical, metabolomics, and transcriptomics levels [56,57,58,59]. While the number of binary interactions in plants is large, the molecular mechanisms and physiological signaling pathways in plants remain poorly understood. The wlr expression integrates all dual interactions in the multivariate system under study after weighting them in conformity with the information available in the dataset and the selected cutoff value. The analysis of cranberry fruit composition showed that wlr expressions for Al and Si impacted berry firmness significantly. Those results are supported by a body of literature.

4.2. Plant Elemental Composition

Excess N reduces tissue Si content the activity of key enzymes involved in phenol metabolism, weakening the structural and biochemical defense mechanisms against pests and pathogens [8,11]. Silicium enhances the lignification, strengthens physical barriers and activates antioxidant systems [60]. Excess N stimulates vegetative growth [61] and decreases lignification [62] and the concentration of insecticidal phenolics like triterpenes [63,64] that also varies with cranberry source [65]. In the present study, N, K, Ca, and B, known to impact berry firmness [14,15,16,66], were not found to be the most discriminating elements between berry firmness classes. Low firmness was associated with lower S, N, P, K, Ca, Mg, B, Cu, Zn, and Si and higher levels of Mn, Fe, and Al, indicating that growers had little control over elements like Al, Fe, Mn, and Si. Si is a key element for controlling biotic stresses [17,18,19,20,21,22,23,24,25].

4.3. Soil Quality

As shown by wlr indices (Figure 6), berry firmness appeared to be more sensitive than berry yields to Al excess and Si shortage. Spodosols and acidic Inceptisols, where cranberries are grown, are subject to the podzolization process, where Al-, Fe- and Si-containing minerals undergo profound transformations [67,68]. The hardpans frequently formed in cranberry soils contain variable proportions of organic matter, Al, Fe, and Si [69,70,71,72]. Reactive Si, dissolved silicic acid, and uncharged amorphous silica contribute to soil health [73]. Si varies widely from less than 1 to more than 20 mg L−1 in the soil solution [74], likely explaining the large variation in berry Si content. The adsorption of silicate onto hydrous oxides in acid soils, the importance of phytogenic Si in agricultural soils, crop removal of Si, and pH-dependent Si availability [75,76] require further investigations.
The impact of Al on plant growth and development depends on growing conditions, Al3+ concentration, duration of exposure, and plant species [77]. Low soil acidity increases plant availability of Al, Fe, and Si in the soil [28]. However, soil pH was reported to vary seasonally [78] by 0.8 units [79]. Acid soil pH is currently maintained or lowered in cranberry soils using ammonium sulfate and elemental sulfur, which causes even more seasonal variation in pH, as ammonium contributes to supplying protons to the soil–plant system, and S is oxidized into sulfuric acid at site-specific rates depending on the activity and amounts of S-oxidizing microbes. Soil pH may also vary periodically in the 0–15 cm layer following irrigation, flooding, and sanding, influencing the availability of Al. The Al is toxic to most cultivated plants at pH < 5.5 [29,30]. Excess Al appeared to impact berry firmness negatively in the present study. Excess Al is known to inhibit cranberry root growth more than shoot growth [80]. Indeed, there is a limit to cranberry tolerance for Al stress [80], as is the case for highbush blueberries (Vaccinium corymbosum) [81].

4.4. Suggestive Corrective Measures

The wlr diagnosis suggested that lowering Al levels and increasing Si levels in the berry could improve berry firmness without impairing berry yield. However, those results were obtained statistically. The next step is to evaluate whether corrective measures are effective. Can elements supplied by fertilizers and amendments increase berry firmness to reach an acceptable level, or at least to a level at which other cultural practices or biocides are less expensive and more successful?
Si can be supplied as diatomaceous earth [82] and silicate slag [83], as well as Ca, potassium, and sodium silicates [84,85] and other sources [86]. Silicates are alkaline products that should be tested for their effects on the pH of cranberry soil. Sanding the cranberry beds is a practice that stimulates plant growth and provides temporary protection against pests and diseases [1]. Sand contains Al and Si. The Al3+ can be detoxified through reactions with sulfate in the solution of acid soils after adding gypsum [87]. Gypsum tackles soil Al3+ and supplies Ca and S to the plant. Given the potential effect of Mg on berry firmness, Mg fertilizers could also be considered to detoxify Al [88] and supply Mg to the plant. Soil testing for Si, Al, Mg, and S would be complementary to berry tissue tests. Soil Al, S, Mg, and Si availability can be tested using the Mehlich-3 method and then quantified by high-throughput ICP spectroscopy [89,90,91,92,93,94].

4.5. Limitations of This Study

The mycorrhizal associations [95] that could impact Al and Si acquisition by cranberries have not been quantified in the present study. The contribution of genetic, managerial, pedological, and meteorological factors to the variation in wlr values could be considered in future models using a larger and more diversified database. The statistical results presented in this paper are provisionary diagnostic tools. They require calibrating soil and tissue tests against corrective measures before making recommendations to growers [75,76].

5. Conclusions

The wlr expression integrates interactions among elements and their importance regarding the target variable, two useful concepts to diagnose nutrients. The provisionary wlr standards to network berry mineral composition most often differed between berry yield and berry firmness, showing that the action to reach a high yield of firm berries would involve the right combination of nutrients.
The challenge for sustainable cranberry production is to use fewer chemicals and provide economic and environmental benefits. To increase cranberry defense mechanisms, secure yields and minimize pesticide applications, the relationship between fertilization and pest and disease management must be clarified in future research to meet the objectives of less pesticide use and higher fertilizer-use efficiency. Correction measures are proposed to alleviate the potential Al and Si imbalances in cranberries. Soil and tissue tests could be calibrated against plant response to Al and Si corrective measures by conducting field trials in cranberry-producing areas. Critical levels of pH, Al, Si, and S in cranberry soils should be developed before elaborating recommendations to growers.
The berry database could grow rapidly with the collaboration of researchers, growers, crop advisers, and food processors. While berries were hand-picked in the present study, cranberry firmness decreases during mechanical harvesting. Berry variables could be evaluated following truck unloading to enhance the database rapidly.

Funding

The project was supported in parft by Les Atocas de l’Érable Inc., Les Atocas Blandford Inc., La Cannebergière Inc., and the Natural Sciences and by Engineering Research Council of Canada grant (RDCPJ-469358-14. Berry mineral analysis was supported by the Natural Sciences and Engineering Research Council of Canada grant NSERC-2254.

Data Availability Statement

Raw data are available upon request.

Conflicts of Interest

The author declares no competing interests.

References

  1. Sandler, H.; DeMoranville, C. Cranberry Production: A Guide for Massachusetts—Summary Edition; UMass-Amherst College of Natural Resources and the Environment: Amherst, MA, USA, 2008; Available online: https://hdl.handle.net/20.500.14394/9230 (accessed on 13 May 2025).
  2. Gallardo, R.K.; Klingthong, P.; Zhang, Q.; Polashok, J.; Atucha, A.; Zalapa, J.; Rodriguez-Saona, C.; Vorsa, N.; Iorizzo, M. Breeding Trait Priorities of the Cranberry Industry in the United States and Canada. HortScience 2018, 53, 1467–1474. [Google Scholar] [CrossRef]
  3. Diaz-Garcia, L.; Rodriguez-Bonilla, L.; Phillips, M.; Lopez-Hernandez, A.; Grygleski, E.; Atucha, A.; Zalapa, J.; Ezura, H. Comprehensive analysis of the internal structure and firmness in American cranberry (Vaccinium macrocarpon Ait.) fruit. PLoS ONE 2019, 14, e0222451. [Google Scholar] [CrossRef] [PubMed]
  4. Lasa, R.; Tadeo, E.; Dinorin, L.A.; Lime, I.; Williams, T. Fruit firmness, superficial damage, and location modulate infestation by Drosophila suzukii and Zaprionus indianus: The case of guava in Veracruz, Mexico. Entomoligia Expir. Et Appl. 2017, 162, 4–12. [Google Scholar] [CrossRef]
  5. Weißinger, L.; Arand, K.; Bieler, E.; Kassemeyer, H.H.; Breuer, M.; Müller, C. Physical and Chemical Traits of Grape Varieties Influence Drosophila suzukii Preferences and Performance. Front. Plant Sci. 2021, 12, 664636. [Google Scholar] [CrossRef]
  6. Marles, R. Mineral nutrient composition of vegetables, fruits and grains: The context of reports of apparent historical declines. J. Food Compos. Anal. 2017, 56, 93–103. [Google Scholar] [CrossRef]
  7. Sharma, J.; Dua, V.K.; Sharma, S.; Choudhary, A.K.; Kumar, P.; Sharma, A. Role of Plant Nutrition in Disease Development and Management. In Sustainable Management of Potato Pests and Diseases; Chakrabarti, S.K., Sharma, S., Shah, M.A., Eds.; Springer: Singapore, 2022. [Google Scholar] [CrossRef]
  8. Dordas, C. Role of nutrients in controlling plant diseases in sustainable agriculture. A review. Agron. Sustain. Agric. Dev. 2008, 28, 33–46. [Google Scholar] [CrossRef]
  9. Jamaly, R.; Parent, S.-É.; Parent, L.E. Fertilization and Soil Nutrients Impact Differentially Cranberry Yield and Quality in Eastern Canada. Horticulturae 2021, 7, 191. [Google Scholar] [CrossRef]
  10. Chawla, R.; Sharma, S.K. Nitrogen fertilization of stone fruits: A comprehensive review. J. Plant Nutr. 2025, 48, 445–485. [Google Scholar] [CrossRef]
  11. Martinez, D.A.; Loening, U.E.; Graham, M.C.; Gathorne-Hardy, A. When the Medicine Feeds the Problem; Do Nitrogen Fertilizers and Pesticides Enhance the Nutritional Quality of Crops for Their Pests and Pathogens? Front. Sustain. Food Syst. 2021, 5, 701310. [Google Scholar] [CrossRef]
  12. Davenport, J.; DeMoranville, C. Best Management Practices. Nitrogen Management in Cranberry Systems; University of Massachusetts Cranberry Experimental Station: Amherst, MA, USA, 1997; Available online: https://hdl.handle.net/20.500.14394/9267 (accessed on 16 June 2025).
  13. Jaime, M.; Fischer, G.; Alvarez-Herrera, J.G. Effect of calcium on fruit quality: A review. Agron. Colomb. 2024, 42, e112026. [Google Scholar] [CrossRef]
  14. Wójcik, P.; Mika, A.; Cieslinski, G. Effect of boron fertilization on the storage ability of apples (Malus domestica Borth.). Acta Hort. 1999, 485, 393–398. [Google Scholar] [CrossRef]
  15. Thomidis, T.; Karagiannidis, N.; Stefanou, S.; Paresidou, M.; Prodromou, I. Influence of boron applications on preharvest and postharvest nectarine fruit rot caused by brown rot. Australas. Plant Pathol. 2017, 46, 177–181. [Google Scholar] [CrossRef]
  16. Reynolds, O.L.; Padula, M.P.; Zeng, R.; Gurr, G.M. Silicon: Potential to Promote Direct and Indirect Effects on Plant Defense Against Arthropod Pests in Agriculture. Front. Plant Sci. 2016, 7, 744. [Google Scholar] [CrossRef] [PubMed]
  17. Frew, A.; Weston, L.A.; Reynolds, O.L.; Gurr, G.M. The role of silicon in plant biology: A paradigm shift in research approach. Ann. Bot. 2018, 121, 1265–1273. [Google Scholar] [CrossRef]
  18. Laing, M.D.; Gatarayiha, M.C.; Adandonon, A. Silicon use for pest control in agriculture: A review. Proc. S. Afr. Sug. Technol. Ass. 2006, 80, 278–286. [Google Scholar]
  19. Yang, L.; Han, Y.; Li, P.; Ali, S.; Hou, M. Silicon amendment is involved in the induction of plant defense responses to a phloem feeder. Scientif. Rep. 2017, 7, 4232. [Google Scholar] [CrossRef]
  20. Coskun, D.; Deshmukh, R.; Sonah, H.; Menzies, J.G.; Reynolds, O.; Ma, J.F.; Kronzicker, H.J.; Bélanger, R.R. The controversies of silicon’s role in plant biology. New Phytol. 2019, 221, 67–85. [Google Scholar] [CrossRef]
  21. Deshmukh, R.; Ma, J.F.; Bélanger, R.R. Editorial: Role of Silicon in Plants. Front. Plant Sci. 2017, 8, 1858. [Google Scholar] [CrossRef]
  22. França, L.L.; Dierings, C.A.; Almeida, A.C.D.S.; Aráujo, M.D.S.; Heinrichs, E.A.; Silva, A.R.D.; Barrigossi, J.A.F.; Jedsus, F.F.D. Resistance in rice to Tibraca limbativentris (Hemiptera: Pentatomidae) influenced by plant silicon content. Fla. Entomol. 2018, 101, 587–591. [Google Scholar] [CrossRef]
  23. Bakhat, H.F.; Bibi, N.; Zia, Z.; Abbas, S.; Hammad, H.M.; Fahad, S.; Ashraf, M.r.; Shah, G.M.; Rabbani, F.; Saeed, S. Silicon mitigates biotic stresses in crop plants: A review. Crop Prot. 2018, 104, 21–34. [Google Scholar] [CrossRef]
  24. Xue, X.; Geng, T.; Liu, H.; Yang, W.; Zhong, W.; Zhang, Z.; Zhu, C.; Chu, Z. Foliar Application of Silicon Enhances Resistance Against Phytophthora infestans Through the ET/JA- and NPR1-Dependent Signaling Pathways in Potato. Front. Plant Sci. 2012, 12, 609870. [Google Scholar] [CrossRef] [PubMed]
  25. Pavlovic, J.; Kostic, L.; Bosnic, P.; Kirkby, E.A.; Nikolic, M. Interactions of Silicon with Essential and Beneficial Elements in Plants. Front. Plant Sci. 2021, 12, 697592. [Google Scholar] [CrossRef] [PubMed]
  26. Zebarth, B.J.; Forge, T.A.; Goyer, C.; Brin, L.D. Effect of soil acidification on nitrification in soil. Can. J. Soil Sci. 2015, 95, 359–363. [Google Scholar] [CrossRef]
  27. Jamaly, R.; Parent, S.E.; Ziadi, N.; Parent, L.E. Short-Term Impact of Elemental Sulfur on Cranberry Nutrition and Crop Performance. Open J. Soil Sci. 2023, 13, 83–96. [Google Scholar] [CrossRef]
  28. O’Kennedy, S.O. Soil pH and its impact on nutrient availability and crop growth. Interational J. Geogr. Geol. Environ. 2022, 4, 236–238. [Google Scholar]
  29. Rout, G.R.; Samantaray, S.; Das, P. Aluminium Toxicity in Plants: A Review. Agronomie 2001, 21, 3–21. [Google Scholar] [CrossRef]
  30. Vardar, F.; Unal, M. Aluminum Toxicity and Resistance in Higher Plants. Adv. Mol. Biol. 2007, 1, 1–12. [Google Scholar]
  31. Cárcamo, M.P.; Reyes-Diaz, M.; Rengel, Z.; Alberdi, M.; Omena-Garcia, R.P.; Nunes-Nesi, A.; Inostroza-Blancheteau, C. Aluminum stress differentially affects physiological performance and metabolic compounds in cultivars of highbush blueberry. Sci. Rep. 2019, 9, 11275. [Google Scholar] [CrossRef]
  32. Munson, R.D.; Nelson, W.L. Principles and Practices in Plant Analysis. In Soil Testing and Plant Analysis; Westerman, R.L., Ed.; Soil Science Society of America, Inc.: Madison, WI, USA, 1990; pp. 359–387. [Google Scholar]
  33. Bates, T.E. Factors affecting critical nutrient concentrations in plants and their environment: A review. Soil Sci. 1971, 112, 116–130. [Google Scholar] [CrossRef]
  34. Sumner, M.E. Interpretation of nutrient ratios in plant tissue. Commun. Soil Sci. Plant Anal. 1978, 9, 335–345. [Google Scholar] [CrossRef]
  35. Courbet, G.; Gallardo, K.; Vigani, G.; Brunel-Muguet, S.; Trouverie, J.; Salon, C.; Ourry, A. Disentangling the complexity and diversity of crosstalk between sulfur and other mineral nutrients in cultivated plants. J. Exp. Bot. 2019, 70, 4183–4196. [Google Scholar] [CrossRef] [PubMed]
  36. Fan, X.; Zhou, X.; Chen, H.; Tang, M.; Xie, X. Cross-Talks Between Macro- and Micronutrient Uptake and Signaling in Plants. Front. Plant Sci. 2021, 12, 663477. [Google Scholar] [CrossRef] [PubMed]
  37. Jarrell, W.M.; Beverly, R.B. The Dilution Effect in Plant Nutrition Studies. Adv. Agron. 1981, 34, 197–224. [Google Scholar] [CrossRef]
  38. Righetti, T.L.; Wilder, K.L.; Cummings, G.A. Plant Analysis as an aid in fertilizing orchards. In Soil Testing and Plant Analysis; Westerman, R.L., Ed.; Soil Science Society of America, Inc.: Madison, WI, USA, 1990; pp. 563–601. [Google Scholar]
  39. Baxter, I. Ionomics: Studying the Social Network of Mineral Nutrients. Curr. Opin. Plant Biol. 2009, 12, 381–386. [Google Scholar] [CrossRef]
  40. Salt, D.E.; Baxter, I.; Lahner, B. Ionomics and the Study of the Plant Ionome. Annu. Rev. Plant Biol. 2008, 59, 709–733. [Google Scholar] [CrossRef]
  41. Beaufils, E.R. Diagnosis and recommendation integrated system (DRIS). In Soil Science Bulletin 132; University of Natal: Pietermaritzburg, South Africa, 1973. [Google Scholar]
  42. Parent, L.E.; Dafir, M. A theoretical concept of compositional nutrient diagnosis. J. Am. Soc. Hortic. Sci. 1992, 117, 239–242. [Google Scholar] [CrossRef]
  43. Parent, E. Why we should use balances and machine learning to diagnose ionomes. Authorea 2020, 1, 20. [Google Scholar] [CrossRef]
  44. Baxter, I. Should we treat the ionome as a combination of individual elements, or should we be deriving novel combined traits? J. Exp. Bot. 2015, 66, 2127–2131. [Google Scholar] [CrossRef]
  45. Aitchison, J. The Statistical Analysis of Compositional Data; Chapman and Hall: London, UK, 1986. [Google Scholar]
  46. Steel, R.G.D.; Torrie, J.H. Principles and Procedures of Statistics. A Biometricla Approach; McGraw-Hill: New-York, NY, USA, 1996. [Google Scholar]
  47. Greenacre, M.; Gunsky, E.; Bacon-Shone, J.; Erb, I.; Quinn, T. Aitchison’s Compositional Data Analysis 40 Years On: A Reappraisal. Stat. Sci. 2023, 38, 386–410. [Google Scholar] [CrossRef]
  48. Parent, L.E. Compositional and machine learning tools to model plant nutrition: Overview and perspectives. Horticulturae 2025, 11, 161. [Google Scholar] [CrossRef]
  49. Wilkinson, S.R.; Grunes, D.L.; Sumner, M.E. Nutrient interactions in soil and plant nutrition. In Handbook of Soil Science; Sumner, M.E., Ed.; CRC Press: Boca Raton, FL, USA, 2000; pp. D89–D112. [Google Scholar]
  50. Srivastava, A.K.; Huchche, A.D.; Parent, L.E.; Malhotra, S.K.; Ziogas Vasileios, Z.; Baishya, L.K. Mineral nutrition of Citrus across the mandrain belts of India. Horticulturae 2025, 11, 254. [Google Scholar] [CrossRef]
  51. Caron, J.; Pelletier, V.; Kennedy, C.D.; Gallichand, J.; Gumiere, S.; Bonin, S.; Bland, W.L.; Pepin, S. Guidelines of irrigation and drainage management strategies to enhance cranberry production and optimize water use in North America. Can. J. Soil Sci. 2017, 97, 82–91. [Google Scholar] [CrossRef]
  52. Barnhisel, R.; Bertsch, P.M. Digestion with Perchloric and Nitric Acids. In Methods of Soil Analysis; Page, A., Ed.; American Society of Agronomy: Madison, WI, USA, 1982; pp. 279–280. [Google Scholar]
  53. Mert, M.C.; Filzmoser, P.; Hron, K. Error Propagation in Isometric Log-ratio Coordinates for Compositional Data: Theoretical and Practical Considerations. Math. Geosci. 2016, 48, 941–961. [Google Scholar] [CrossRef] [PubMed]
  54. Kenworthy, A.L. Plant analysis and interpretation of analysis for horticultural crops. In Soil Testing and Plant Analysis, Part II; Stelly, M., Hamilton, H., Eds.; Soil Science Society of America: Madison, WI, USA, 1967; pp. 59–75. [Google Scholar]
  55. Walworth, J.L.; Sumner, M.E. The Diagnosis and Recommendation Integrated System (DRIS). Adv. Soil Sci. 1987, 6, 149–188. [Google Scholar] [CrossRef]
  56. Alarcón-Poblete, E.; Inostroza-Blancheteau, C.; Alberdi, M.; Rengel, Z.; Reyes-Díaz, M. Molecular regulation of aluminum resistance and sulfur nutrition during root growth. Planta 2018, 247, 27–39. [Google Scholar] [CrossRef]
  57. Couturier, J.; Touraine, B.; Briat, J.F.; Gaymard, F.; Rouhier, N. The iron-sulfur cluster assembly machineries in plants: Current knowledge and open questions. Front. Plant Sci. 2013, 4, 259. [Google Scholar] [CrossRef]
  58. Zuchi, S.; Watanabe, M.; Hubberten, H.M.; Bromke, M.; Osorio, S.; Fernie, A.R.; Celletti, S.; Paolacci, A.R.; Catarcione, G.; Ciaffi, M.; et al. The interplay between sulfur and iron nutrition in tomato. Plant Physiol. 2015, 169, 2624–2639. [Google Scholar] [CrossRef]
  59. Astolfi, S.; Celletti, S.; Vigani, G.; Mimmo, T.; Cesco, S. Interaction Between Sulfur and Iron in Plants. Front. Plant Sci. 2021, 12, 670308. [Google Scholar] [CrossRef]
  60. Pandey, R.; Singh, C.; Mishra, S.; Abdulraheem, M.I.; Vyas, D. Silicon uptake and transport mechanisms in plants: Processes, applications and challenges in sustainable plant management. Biol. Futur. 2024, 76, 19–31. [Google Scholar] [CrossRef]
  61. Davenport, J.R.; Vorsa, N. Cultivar Fruiting and Vegetative Response to Nitrogen Fertilizer in Cranberry. J. Amer. Soc. Hort. Sci. 1999, 124, 90–93. [Google Scholar] [CrossRef]
  62. Peng, Q.; Shrestha, A.; Zhang, Y.; Fan, J.; Yu, F.; Wang, G. How lignin biosynthesis responds to nitrogen in plants: A scoping review. Plant Biol. 2024, 26, 881–895. [Google Scholar] [CrossRef]
  63. Lin, M.; Yang, S.; Huang, J.; Zhou, L. Insecticidal Triterpenes in Meliaceae: Plant Species, Molecules and Activities: Part I (Aphanamixis-Chukrasia). Int. J. Mol. Sci. 2021, 22, 13262. [Google Scholar] [CrossRef] [PubMed]
  64. Ninkuu, V.; Zhang, L.; Yan, J.; Fu, Z.; Yang, T.; Zeng, H. Biochemistry of Terpenes and Recent Advances in Plant Protection. Int. J. Mol. Sci. 2021, 22, 5710. [Google Scholar] [CrossRef] [PubMed]
  65. Xue, L.; Carreiro, B.; Mia, M.S.; Paetau-Robinson, I.; Khoo, C.; Neto, C. Pentacyclic Triterpenoid Content in Cranberry Raw Materials and Products. Foods 2024, 13, 3136. [Google Scholar] [CrossRef] [PubMed]
  66. Xu, Y.; Liu, J.; Zang, N.; Yin, Z.; Wang, A. Effects of calcium application on apple fruit softening during storage revealed by proteomics and phosphoproteomics. Hortic. Plant J. 2022, 8, 408–422. [Google Scholar] [CrossRef]
  67. Gustafson, J.P.; Bhattacharya, P.; Bain, D.C.; Fraser, A.R.; McHardy, W.J. Podzolisation mechanisms and the synthesis of imogolite in northern Scandinavia. Geoderma 1995, 66, 167–184. [Google Scholar] [CrossRef]
  68. Lundström, U.S.; van Breemen, N.; Bain, D. The podzolization process. A review. Geoderma 2000, 94, 91–107. [Google Scholar] [CrossRef]
  69. Sanborn, P.; Lamontagne, L.; Hendershot, W. Podzolic soils of Canada: Genesis, distribution, and classification. Can. J. Soil Sci. 2011, 91, 843880. [Google Scholar] [CrossRef]
  70. Sommer, M.; Kaczorek, D.; Kuzyakov, J.; Breuer, J. Silicon pools and fluxes in soils and landscapes—A review. J. Plant Nutr. Soil Sci. 2006, 169, 310–329. [Google Scholar] [CrossRef]
  71. Elgagawhary, S.M.; Lindsay, W.L. Solubility of silica in soils. Soil Sci. Soc. Amer. Proc. 1972, 36, 439–442. [Google Scholar] [CrossRef]
  72. Jones, L.H.P.; Handreck, K.A. Effects of iron & aluminum oxides on silica in solution in soils. Nature 1963, 198, 852–853. [Google Scholar]
  73. Schaller, J.; Kleber, M.; Puppe, D.; Stein, M.; Sommer, M.; Rillig, M. The importance of reactive silica for maintaining soil health. Plant Soil 2025, 1–12. [Google Scholar] [CrossRef]
  74. McKeague, J.A.; Cline, M.G. Silica in soil solutions. 1. The form and concentration of dissolved silica in aqueous extracts of some soils. Can. J. Soil Sci. 1963, 43, 70–82. [Google Scholar] [CrossRef]
  75. Tubana, B.S. Dynamics of Silicon in Soil and Plant to Establish Silicate Fertilization. In Benefits of Silicon in the Nutrition of Plants; de Mello Prado, R., Ed.; Springer Nature: Cham, Switzerland, 2023; pp. 57–73. [Google Scholar] [CrossRef]
  76. Haynes, R.J. A contemporary overview of silicon availability in agricultural soils. J. Plant Nutr. Soil Sci. 2014, 177, 831–844. [Google Scholar] [CrossRef]
  77. Ofoe, R.; Thomas, R.H.; Asiedu, S.K.; Wang-Pruski, G.; Fofana, B.; Abbey, L. Aluminum in plant: Benefits, toxicity and tolerance mechanisms. Front. Plant Sci. 2023, 13, 1085998. [Google Scholar] [CrossRef]
  78. Van der Paauw, F. Periodic fluctuations of soil fertility, crop yields and of response to fertilization effected by alternating of low and high rainfall. Plant Soil 1962, 17, 154–182. [Google Scholar] [CrossRef]
  79. Collins, J.B.; Whiteside, E.P.; Cress, C.E. Seasonal variability of pH and lime requirements in several southern Michigan soils when measured in different ways. Soil Sci. Soc. Am. Proc. 1970, 34, 56–61. [Google Scholar] [CrossRef]
  80. Medappa, K.C.; Dana, M.N. Tolerance of Cranberry Plants to Manganese, Iron and Aluminum. J. Amer. Soc. Hort. Sci. 1970, 95, 107–110. [Google Scholar] [CrossRef]
  81. Reyes-Diaz, M.; Blancheteau, C.I.; Millaleo, R.; Cruces, E.; Zottele, C.W.; Alberdi, M.; dela Kuz Mora, M. Long-term Aluminum Exposure Effects on Physiological and Biochemical Features of Highbush Blueberry Cultivars. J. Amer. Soc. Hort. Sci. 2010, 135, 212–222. [Google Scholar] [CrossRef]
  82. Sandhya, K.; Prakash, N.B.; Meunier, J.D. Diatomaceous earth as source of silicon on the growth and yield of rice in contrasted soils of Southern India. J. Soil Sci. Plant Nutr. 2018, 18, 344–360. [Google Scholar] [CrossRef]
  83. Savant, N.K.; Korndörfer, G.H.; Datnoff, L.E.; Snyder, G.H. Silicon Nutrition and Sugarcane Production: A Review. J. Plant Nutr. 1999, 22, 1853–1903. [Google Scholar] [CrossRef]
  84. USDA. National Organic Program. Potassium Silicate for Use in Crop Production; University of California, Sustainable Agriculture Research and Education Program (UC SAREP): Davis, CA, USA, 2003. Available online: https://www.ams.usda.gov/sites/default/files/media/Pot%20sil%20technical%20advisory%20panel%20report%202003.pdf (accessed on 4 April 2025).
  85. USEPA. Potassium Silicate. Biopesticides Registration Action Document; PC Code 072606; Office of Pesticide Programs, United State Environmental Protection Agency: Washington DC, USA, 2007. Available online: https://www3.epa.gov/pesticides/chem_search/reg_actions/registration/decision_PC-072606_7-Oct-07.pdf (accessed on 4 April 2025).
  86. Thakral, V.; Raturi, G.; Sudhakaran, S.; Mandlik, R.; Sharma, Y.; Shivaraj, S.M.; Tripathi, D.K.; Sonah, H.; Deshmukh, R. Silicon, a quasi-essential element: Availability in soil, fertilizer regime, optimum dosage, and uptake in plants. Plant Physiol. Biochem. 2024, 208, 108459. [Google Scholar] [CrossRef] [PubMed]
  87. Sumner, M.E. Gypsum and Acid Soils. The World Scene. Adv. Agron. 1993, 51, 1–32. [Google Scholar]
  88. Liu, H.; Ma, M.; Huang, H.; Shaikh, A.S.; Bai, R.; Yang, Y.; Liu, Y.; Han, X. Research progress on the mechanism of magnesium nutrition alleviating aluminum toxicity in plants. J. Plant Nutr. Fertil. 2025, 31, 810–818. [Google Scholar] [CrossRef]
  89. Mehlich, A. Mehlich-3 soil test extractant: A modification of Mehlich-2 extractant. Commun. Soil Sci. Plant Anal. 1984, 15, 1409–1416. [Google Scholar] [CrossRef]
  90. Snyder, G.H. Methods for silicon analysis in plants, soils, and fertilizers. Stud. Plant Sci. 2011, 8, 185–196. [Google Scholar] [CrossRef]
  91. Wang, J.J.; Dodla, S.K.; Henderson, R.E. Soil silicon extractability with seven selected extractants in relation to colorimetric and ICP determination. Soil Sci. 2004, 169, 861–870. [Google Scholar] [CrossRef]
  92. Parent, L.E.; Marchand, S. Response to Phosphorus of Cranberry on High Phosphorus Testing Acid Sandy Soils. Soil Sci. Soc. Am. J. 2006, 70, 1914–1921. [Google Scholar] [CrossRef]
  93. Ketterings, Q.; Miyamoto, C.; Mathur, R.R.; Dietzel, K.; Gami, S. A Comparison of Soil Sulfur Extraction Methods. Soil Sci. Soc. Am. J. 2011, 75940, 1578–1583. [Google Scholar] [CrossRef]
  94. Zbíral, J.; Smatanová, M.; Němec, P. Sulphur status in agricultural soils determined using the Mehlich 3 method. Plant Soil Environ. 2018, 64, 255–259. [Google Scholar] [CrossRef]
  95. Kosola, K.R.; Workmaster, B.A.A. Mycorrhizal Colonization of Cranberry: Effects of Cultivar, Soil Type, and Leaf Litter Composition. J. Amer. Soc. Hort. Sci. 2007, 132, 134–141. [Google Scholar] [CrossRef]
Figure 1. Location of cranberry fields (black rectangle) in Québec, Canada (461610 to 461417.2 N, 715127 to 720211.7 W) [3].
Horticulturae 11 00705 g001
Figure 2. Confusion matrix to set apart the performing crops of high-yielding and nutritionally balanced and the low-yielding and nutritionally imbalanced specimens.
Horticulturae 11 00705 g002
Figure 3. Gain ratios of mineral expressions regarding berry yield. Raw concentrations that do not consider nutrient interactions produce distorted nutrient rankings. The clr and wlr expressions account for nutrient interactions as dual log ratios. The wlr expression further accounts for the importance of each dual ratio as gain ratio, modifying nutrient rankings compared to clr. Cu ranked first for both clr and wlr.
Horticulturae 11 00705 g003
Figure 4. Gain ratios of mineral expressions regarding berry firmness. Raw concentrations that do not consider nutrient interactions produce distorted nutrient rankings. The clr and wlr expressions account for nutrient interactions as dual log ratios. The wlr expression further accounts for the importance of each dual ratio as a gain ratio, modifying nutrient ranking compared to clr. Si ranked first for the three expressions.
Horticulturae 11 00705 g004
Figure 5. The relationship between gain ratios of dual log ratios regarding berry yielding and firmness classes. The correlation coefficient was 0.190 (p ≥ 0.05).
Horticulturae 11 00705 g005
Figure 6. Diagnosis of the wlr means of low-yielding and nutritionally imbalanced specimens against wlr standards (means and standard deviations of the nutritionally balanced subpopulation in Table 3). Yellow bars indicate that differences are highly significant (p ≤ 0.01). Positive wlr indices indicate relative excess and negative wlr indices indicate relative shortage in the low-yielding and nutritionally imbalanced subpopulation.
Horticulturae 11 00705 g006
Table 1. Statistics of berry elemental composition, yield, and firmness (sd = standard deviation).
Element201620172018
meansdmeansdmeansd
S0.3800.0640.4350.0530.4810.104
N3.3001.6023.5670.4253.5130.720
P0.7150.1220.9140.1160.8340.152
K8.3721.2685.7910.4957.8601.217
Ca0.5590.1820.5180.0990.6270.201
Mg0.4750.0550.3270.0450.5420.087
B0.0060.0040.0070.0020.0060.001
Cu0.0030.0010.0050.0010.0040.001
Zn0.0060.0010.0050.0000.0070.001
Mn0.0180.0070.0110.0050.0210.007
Fe0.0200.0060.0110.0040.0270.010
Al0.2480.3550.0150.0070.0180.006
Si0.0600.0320.0460.0130.1950.032
Mg ha−1
Yield38.612.220.111.037.110.3
g (compression force)
Firmness539034755214676333533
Table 2. Performance of ML classification models as area under the curve (AUC) and accuracy using the wlr expression.
ClassMachine Learning Model Relating the Target Class to wlr Values
Random ForestXGBoost
AUCAccuracyHYNBLYNIAUCAccuracyHYNBLYNI
Yielding0.8320.791472640.8510.79647266
Firmness0.9170.873672760.9260.89172279
HYNB = high-yielding nutritionally balanced subpopulation. LYNI = low-yielding nutritionally imbalanced subpopulation.
Table 3. Statistics for wlrfirmness and wlryield (sd = standard deviation) for the high-yielding nutritionally balanced subpopulation in the yielding (n = 47) and firmness (n = 72) classes.
ElementFirmnessYieldMean Differencet-Test §
wlr meanwlr sdwlr meanwlr sdwlrfirmnesswlryieldBilateral
S0.0593120.0032250.0564390.004698+0.002874***
N0.0895630.0028880.0871080.006188+0.002455*
P0.0723440.0032660.0672120.006429+0.005132***
K0.0776130.0025700.0825490.004216−0.004936***
Ca0.0560790.0033970.0528580.004714+0.003221***
Mg0.0342840.0022470.0342090.003444+0.000075ns
B−0.1193890.004682−0.1380390.017744+0.018650***
Cu−0.2225930.005790−0.2324930.008016+0.009900***
Zn−0.1138970.002938−0.1112810.003733−0.002616***
Mn−0.0433080.005606−0.0403800.006240−0.002928*
Fe−0.0657530.008715−0.0694540.006994+0.003701*
Al−0.0682270.008426−0.0109060.036754−0.057321***
Si0.0151770.002899−0.0052330.010066+0.020410***
xD0.2230280.0032150.2218000.003634+0.001227
§ ns, †, *,***: non-significant and significant at the 0.10, 0.05, and 0.001 levels, respectively.
Disclaimer/Publisher’s Note: The statements, opinions and data contained in all publications are solely those of the individual author(s) and contributor(s) and not of MDPI and/or the editor(s). MDPI and/or the editor(s) disclaim responsibility for any injury to people or property resulting from any ideas, methods, instructions or products referred to in the content.

