Article

Balanced Fertilization with Nitrogen, Molybdenum, and Zinc: Key to Optimizing Pecan Tree Yield and Quality of Western Schley Pecan Tree

by
Laura R. Orozco-Meléndez
,
Linda C. Noperi-Mosqueda
,
Julio C. Oviedo-Mireles
,
Nubia G. Torres-Beltrán
,
Rosa M. Yáñez-Muñoz
and
Juan M. Soto-Parra
*
Faculty of Agrotechnological Sciences, Autonomous University of Chihuahua, University City, s/n, C.P. Chihuahua 31160, Mexico
*
Author to whom correspondence should be addressed.
Horticulturae 2025, 11(7), 741; https://doi.org/10.3390/horticulturae11070741
Submission received: 20 May 2025 / Revised: 24 June 2025 / Accepted: 25 June 2025 / Published: 27 June 2025
(This article belongs to the Special Issue Mineral Nutrition of Plants)

Abstract

This study evaluated the effect of soil and foliar fertilization with nitrogen (N), molybdenum (Mo), zinc (Zn), and their combination (Zn-Mo) on nutrition, enzymatic activity, photosynthetic pigments, and productive parameters in the Western Schley pecan tree. An orthogonal Taguchi L16 design was used with differentiated soil and foliar nitrate concentrations, reaching an average of 1557.7 mg kg−1, and increasing up to 1907 mg kg−1 depending on the fertilization dose. Nitrate reductase activity (NRNO3) significantly increased with N and Mo applications, reaching a maximum of 13.62 µmol. Among photosynthetic pigments, chlorophyll a was the only variable with a significant response, highlighting the role of Mo in its enhancement. Positive effects were also observed on pomological traits such as yield (up to 425 kg ha−1), nut weight, and kernel percentage with increased doses of N and Mo. In conclusion, combined fertilization improved the nutritional status, physiological responses, and productivity of pecan trees, emphasizing the importance of balanced nutrient management to avoid nutritional antagonisms and to optimize both yield and fruit quality.

1. Introduction

The pecan tree (Carya illinoensis [Wangenh.] K. Koch) is one of the most in-demand fruit species globally due to the high nutritional value of its nuts, its widespread acceptance in the human diet, and its socioeconomic impact through job creation in rural areas [1]. In 2023, Mexico ranked among the top five global producers, reaching a production of 174,736 tons, with a value of 59,883,831 MXN. Consequently, agronomic management practices that support this crop are of great relevance [2].
One of the key factors for sustaining crop productivity is the proper management of mineral nutrition, which directly influences yield and nut quality [3]. Various studies have shown that fertilization with nitrogen and zinc is essential for optimal crop development [4]. Nitrogen is a critical element involved in vegetative growth, nut production, and quality [1,5]. For instance, in the Pawnee cultivar, nitrogen fertilization improved vegetative growth by increasing enzymatic activity, which resulted in greater shoot and root biomass accumulation [6]. Similarly, in the Desirable cultivar, nitrogen application led to increases in foliar N concentration, chlorophyll content, trunk growth, and overall yield [3].
Zn plays both structural and catalytic roles in plants, being involved in biomass accumulation, enzymatic reactions, regulation of photosynthate metabolism, and protein synthesis [7]. Recent studies have confirmed that Zn fertilization promotes both growth and yield in pecan trees [8], and a significant increase in nut production has also been reported [9].
Molybdenum is another essential micronutrient for plant metabolism, acting as a cofactor of the enzyme nitrate reductase, which is critical for nitrogen assimilation. Although information on Mo fertilization in fruit crops is limited, studies on legumes such as beans have demonstrated that Mo application increases biomass accumulation and crop yield [10,11,12].
Another important aspect to consider is the method of nutrient application, whether via soil or foliar routes [13]. The efficiency of soil fertilization depends on several factors, including soil texture, structure, temperature, moisture, pH, and chemical properties [14]. In contrast, the effectiveness of foliar fertilization is influenced by environmental conditions (relative humidity, temperature, light) and plant physiological traits (phenological stage, leaf morphology, cuticle composition, etc.) [15].
Rather than comparing the two methods, a more strategic approach is to combine soil and foliar fertilization to optimize nutrient uptake by the plant [16]. Therefore, it is crucial to determine whether soil and foliar fertilization with N, Zn, and Mo has an effect on foliar nutrient concentration and the visual expression of deficiency symptoms in pecan trees of the “Western Schley” cultivar.

2. Materials and Methods

2.1. Study Area and Location

The study was conducted at the “La Esperanza” orchard, located in the municipality of Aldama, Chihuahua, Mexico, during the 2020 growing season. Five-year-old "Western Schley" pecan trees (fifth leaf) were used, with a planting spacing of 10 m × 6 m and a density of 169 trees ha−1.
The orchard is situated at 28°26′17.5″ N and a longitude of 106°53′40.3″ W, at an altitude of 2048 m above sea level. The region has an average annual temperature of 20.8 °C and an average annual precipitation of 429.4 mm.
The soil in the area is classified as loam–clay in texture, with 0.65% organic matter, a pH of 7.7, 0.31% carbonate content, and an electrical conductivity of 0.66 dS m−1. The chemical analysis revealed the following concentrations of macronutrients (g kg−1) and micronutrients (mg kg−1): 135 NO3, 0.0274 P, 3.66 K, 4.37 Ca, 0.59 Mg, 0.51 Fe, 121 Mn, 14 Zn, and 0.44 Cu. Soil nutrient quantification was performed using the triacid digestion method, while phosphorus was determined using the Olsen method. Previous foliar analysis reported the following nutrient concentrations (g kg−1): 22 N, 13.80 K, 12.10 Ca, 3.80 Mg, 0.10 Na, 2.00 P, and 383 NO3 and the following micronutrients (mg kg−1): 4.88 Cu, 215.75 Fe, 190.38 Mn, and 73 Zn. The methodologies employed included the brucine method for NO3, the Micro-Kjeldahl method for total N, and the ammonium metavanadate molybdate method for P. The determination of micro and macro elements was performed by a triadic digester and atomic absorption spectrophotometry analyses were performed using Perkin Elmer equipment (PerkinElmer Inc., Waltham, MA, USA).

2.2. Experimental Design and Treatments

To evaluate the effects of soil and foliar fertilization on various physiological and productive variables, a reduced 44-factorial design was employed using the Taguchi L16 orthogonal array (Table 1). This approach allowed for the simultaneous assessment of four factors at four levels, generating only 16 experimental combinations (Table 2 and Table 3), representing a substantial reduction compared to a full factorial design (256 treatments). This reduction enabled the optimization of resources without compromising the analytical capacity of the study. The design allowed for the efficient identification of main effects and some interactions, which is particularly useful in studies where the behavior of response variables may be influenced by multiple agricultural management factors. Seven fertilization applications were carried out, with 67% applied to the soil and 33% as foliar fertilization. The selected doses were based on a combination of previous field studies, local agronomic recommendations, and an additional 10 years of trials in commercial pecan orchards in northern Mexico.
Fertilizers were applied using the following sources: Urea [CO(NH2)2 (N 46%], Prosimol [Mo 39.0%], Maximum Zinc Sulfate [Zn 35.5%, S 7.0%], and Broacare [Zn 35%, Mo 3.3%]. Soil fertilization was applied in a basin around the trunk with a diameter of 1.6 m, while foliar fertilization was carried out using a 15 L manual sprayer. Seven applications were performed on both soil and foliage on the following dates: 29 April, 6, 13, and 27 May, and 3, 10, and 17 June. To facilitate the solubility of the different sources used, stock solutions were prepared prior to application.

2.3. Foliar Nutrition

Foliar samples were collected at the end of June (during the shoot and fruit growth stage) following the established methodology, which specifies selecting leaflets from the middle part of the tree and the middle section of the compound leaf, with approximately 40 leaflets per sample.
The analysis was conducted in the soil laboratory of the Faculty of Agrotechnological Sciences at the Autonomous University of Chihuahua. The samples underwent a triple wash with tap water, hydrochloric acid (HCl) 4N, and finally, deionized water. They were then dried at a temperature below 60 °C for 72 h in a HerathermTM VCA 230 oven (Thermo ScientificTM, Waltham, MA, USA). Subsequently, they were homogenized using a Wiley® mill (Thomas Scientific, Swedesboro, NJ, USA) with a 1 mm mesh. For the chemical analysis, the total concentrations of N and P were determined using the Kjeldahl method (Novatech®, Houston,TX, USA; Micro Kjeldahl apparatus Labconco®, Kansas, MO, USA) and the ammonium metavanadate (NH4VO3) method, respectively. The determination of macronutrients and micronutrients [calcium (Ca), potassium (K), magnesium (Mg), sodium (Na), iron (Fe), manganese (Mn), zinc (Zn), and copper (Cu)] was performed using triacid digestion (HNO3:HClO4:H2SO4, 10:10:25 v:v:v); 25 mL of the acid mixture was applied on a hot plate under a fume hood. The quantification of analytes was carried out using atomic absorption spectrophotometry with an Analyst 100® spectrometer (PerkinElmer®, Waltham, MA, USA) [16].
For nitrate (NO3) determination, 0.2 g of the sample was weighed and transferred into an Erlenmeyer flask. Subsequently, 25 mL of distilled water was added, and the mixture was stirred for 10 min using an orbital shaker. The solution was then filtered into 125 mL beakers. From the filtrate, 5 mL was transferred into a new beaker, followed by the addition of 2 mL of calcium carbonate and 1 mL of 30% hydrogen peroxide. The mixture was placed in an oven at 30° C for 24 h. After the incubation period, 3 mL of phenoldisulfonic acid, 50 mL of distilled water, and 20 mL of ammonium hydroxide (1:1) were added. The final volume was adjusted to 100 mL with distilled water. Absorbance was then measured at 425 nm using a spectrophotometer (Thermo Scientific, Waltham, MA, USA). To calibrate the spectrophotometer, a blank sample was prepared containing 5 mL of distilled water, 2 mL of calcium carbonate, and 1 mL of 30% hydrogen peroxide [17]. The nitrate content was calculated using the following formula:
NO3 (ppm = mg kg−1) = (−0.000847459) − absorbance)/0.093220338 × 2500
where −0.000847459, 0.093220338, and 2500 are constants determined from the standard curve and the calibration of the solutions. Absorbance: Spectrophotometric reading at 425 nm [18].

2.4. Enzymatic Activity

Foliar samples for enzymatic activity analysis were collected at the end of June (during the shoot and fruit growth stage), using the following methodology.
Between 0.125 and 0.150 g of fresh leaf blade segments were weighed and placed in a test tube containing 10 mL of the infiltration medium, which varied depending on the nitrate reductase (NR) activity evaluated:
  • Endogenous NR: 100 mM potassium phosphate buffer (pH 7.5) + 1% propanol (J.T.Baker, Mexico City, State of Mexico, Mexico).
  • NR + NO3: 100 mM potassium phosphate buffer (pH 7.5) with 50 mM potassium nitrate (KNO3) + 1% propanol.
  • NR + Mo: 100 mM potassium phosphate buffer (pH 7.5) with 50 mM sodium molybdate (NaMoO4) + 1% propanol.
  • NR + NO3 + Mo: 100 mM potassium phosphate buffer (pH 7.5) with 50 mM potassium nitrate (KNO3) and 50 mM sodium molybdate (NaMoO4) + 1% propanol.
Subsequently, the samples were subjected to vacuum (0.8 bar) in a vacuum oven (FerlisaTM, Feligneo, Zapopan, Jalisco, México) for 10 min. The vacuum was then released, and the samples were incubated at 30 °C for 60 min in the darkness (this is to avoid interference with nitrogen metabolism, particularly nitrate reduction, as light can induce the activity of the other enzymes and generate reactive compounds, thereby affecting the accuracy of enzymatic activity measurements [18]) using a Wise Cube® incubator (Wiser laboratory Instrument, DAIHAN Scientific Co., Seoul, Republic of Korea). After one hour of incubation, the samples were placed in a water bath at 100 °C for 15 min to stop NR activity. For the in vivo determination of nitrate reductase activity, 1 mL of the sample extract was placed into a test tube, to which 2 mL of 1% sulfanilamide in 1.5 N HCl and 2 mL of NNEDA (0.02% N-1-naphthyl-ethylenediamine in 2.0 N HCl) were added. The mixture was vortexed (VWR® International, Thorofare, El Segundo, NJ, USA) and left to stand for 20 min at room temperature. Finally, absorbance was measured at 540 nm using a UV/Vis spectrophotometer (Genesys 10S, Thermo Scientific® Corporation, Cambridge, UK). The results were expressed as μmol of NO2 formed per mg of protein per hour (μmol NO2·gpf−1·h−1) [12].

2.5. Photosynthetic Pigments

As with the other variables, folia samples were collected at the end of June during the shoot and fruit growth stage. Fresh plant materials were cut into 7 mm diameter discs and weighed until reaching 0.125 g. The samples were then placed in test tubes, and 10 mL of concentrated methanol (CH3OH) (J.T.Baker, Mexico City, State of Mexico, Mexico) was added. The samples were vortexed (VWR® International, Thorofare, El Segundo, NJ, USA) and left to rest in darkness at room temperature for 24 h. After this period, the samples were analyzed using a UV/Vis spectrophotometer (Genesys 10S, Thermo Scientific® Corporation, Cambridge, UK) at the following wavelengths:
  • 470 nm (carotenoids)
  • 653 nm (chlorophyll b)
  • 666 nm (chlorophyll a)
For the measurements, a blank containing only methanol was used. Pigment concentrations were calculated using the following equations:
C h l   a = 13.95   A 666 6.68   A 653
C h l   b = 24.96   A 653 7.32   A 666
C x = 1000   A 470 2.05   C h l   a 114.8   C h l   b 245
where A470, A653, and A666 represent absorbances at 470, 653, and 666 nm, respectively. Chl a: Chlorophyll a concentration (µg cm−2). Chl b: Chlorophyll b concentration (µg cm−2). Cx: Carotenoids concentration (µg cm−2).
Additionally, the Chl a/Chl b ratio was calculated. The sum of Chl a and Chl b concentrations was considered as total chlorophyll, expressed in μg cm2 [12,19].

2.6. Pomological Parameters

2.6.1. Yield

To estimate yield during harvest (18 November 2020), trees were harvested manually. The collected pecans were weighed, and the yield was calculated in kg per tree.

2.6.2. Number of Pecans per Kilogram

The number of pecans was counted in a 300 g sample and extrapolated to 1 kg. According to Mexican Standard FF-084-SCFI-2009, size classification is based on the numbers of pecans per kilogram:
  • Giant: 122 pecans or fewer per kilogram.
  • Extra-large: 123–139 pecans per kilogram.
  • Large: 140–170 pecans per kilogram.
  • Medium: 171–210 pecans per kilogram.
  • Small: 211 or more pecans per kilogram.

2.6.3. Kernel Percentage

A 300 g sample was taken to determine the edible nut content. The shell was separated from the edible portion and weighed separately, and the kernel percentage was calculated, representing the proportion of edible product relative to the total weight. According to the Mexican Standard FF-084-SCFI-2009, edible pecans are classified into two categories based on kernel percentage:
  • Quality I: Kernel percentage greater than 54%.
  • Quality II: Kernel percentage between 50% and 54%.
The three parameters mentioned above were determined in accordance with the Mexican Standard FF-084-SCFI-2009 [20].

2.7. Symptomatology and Foliar Development

For the evaluation of symptomatology and foliar development parameters, a prior training protocol was implemented to standardize observation criteria among evaluators. Before data collection, a group of evaluators was trained in the identification and classification of foliar symptoms associated with nutritional deficiencies and in the characterization of vegetative development. Subsequently, evaluations were conducted blindly by at least two independent evaluators to minimize the subjective bias inherent to visual assessments. Discrepancies between evaluation were discussed, and, if necessary, a joint re-evaluation was performed to ensure the consistency and reliability of the data obtained. Symptomatology and foliar development were evaluated visually and directly in the field in early October 2020 (during the shuck split stage). Scores were assigned to each parameter according to the criteria specified in Table 4.

2.8. Statistical Analysis

Although the Taguchi design primarily assumes additive effects, in this study it was used solely to generate the treatment combinations. The statistical analysis was conducted through response surface methodology (both linear and quadratic), by fitting the surface to determine the factor levels that maximize the response. The response surface analysis was estimated using regression by the least squares method with the SAS software package (SAS Institute Inc., SAS/STAT Software: Usage and reference, Version 6, First Edition, Cary, NC, USA: SAS Institute Inc., 1989).
The statistical analysis was structured in three stages: (1) Multiple regression: The contribution of each factor (linear effects, quadratic effects, and interactions) to the behavior of the response variables was estimated. (2) Canonical response surface analysis: The shape of the curve was determined for those factors that showed significant effects (linear, quadratic, or interaction). (3) Optimization: Predicted values (minima or maxima) within the original data range were calculated [20].
Subsequently, the behavior of the response variables was synthesized in a general matrix. The most influential factors were identified through eigenvalues (accumulated variability ≥70%), and eigenvectors were classified according to their intensity: ±1 (0.375–0.500), ±2 (0.500–0.626), ±3 (0.625–0.875), and ±4 (0.875–1.000). Factors with a weight of ≥20% and variables with a loading of ≥10% of the total positive contribution were considered thresholds of statistical influence.
Based on these criteria, the optimal application doses for the most relevant factors were selected, prioritizing those with the greatest impact on the largest number of variables. In a case of equal weighting, prioritization was based on the response range and mean. Representative graphs of the main effects and the most relevant interactions—both linear and quadratic—were generated. Finally, an integrative metasummary of all analyzed categories was developed, allowing for the derivation of solid and well-supported conclusions to guide agronomic decision-making [21,22].

3. Results

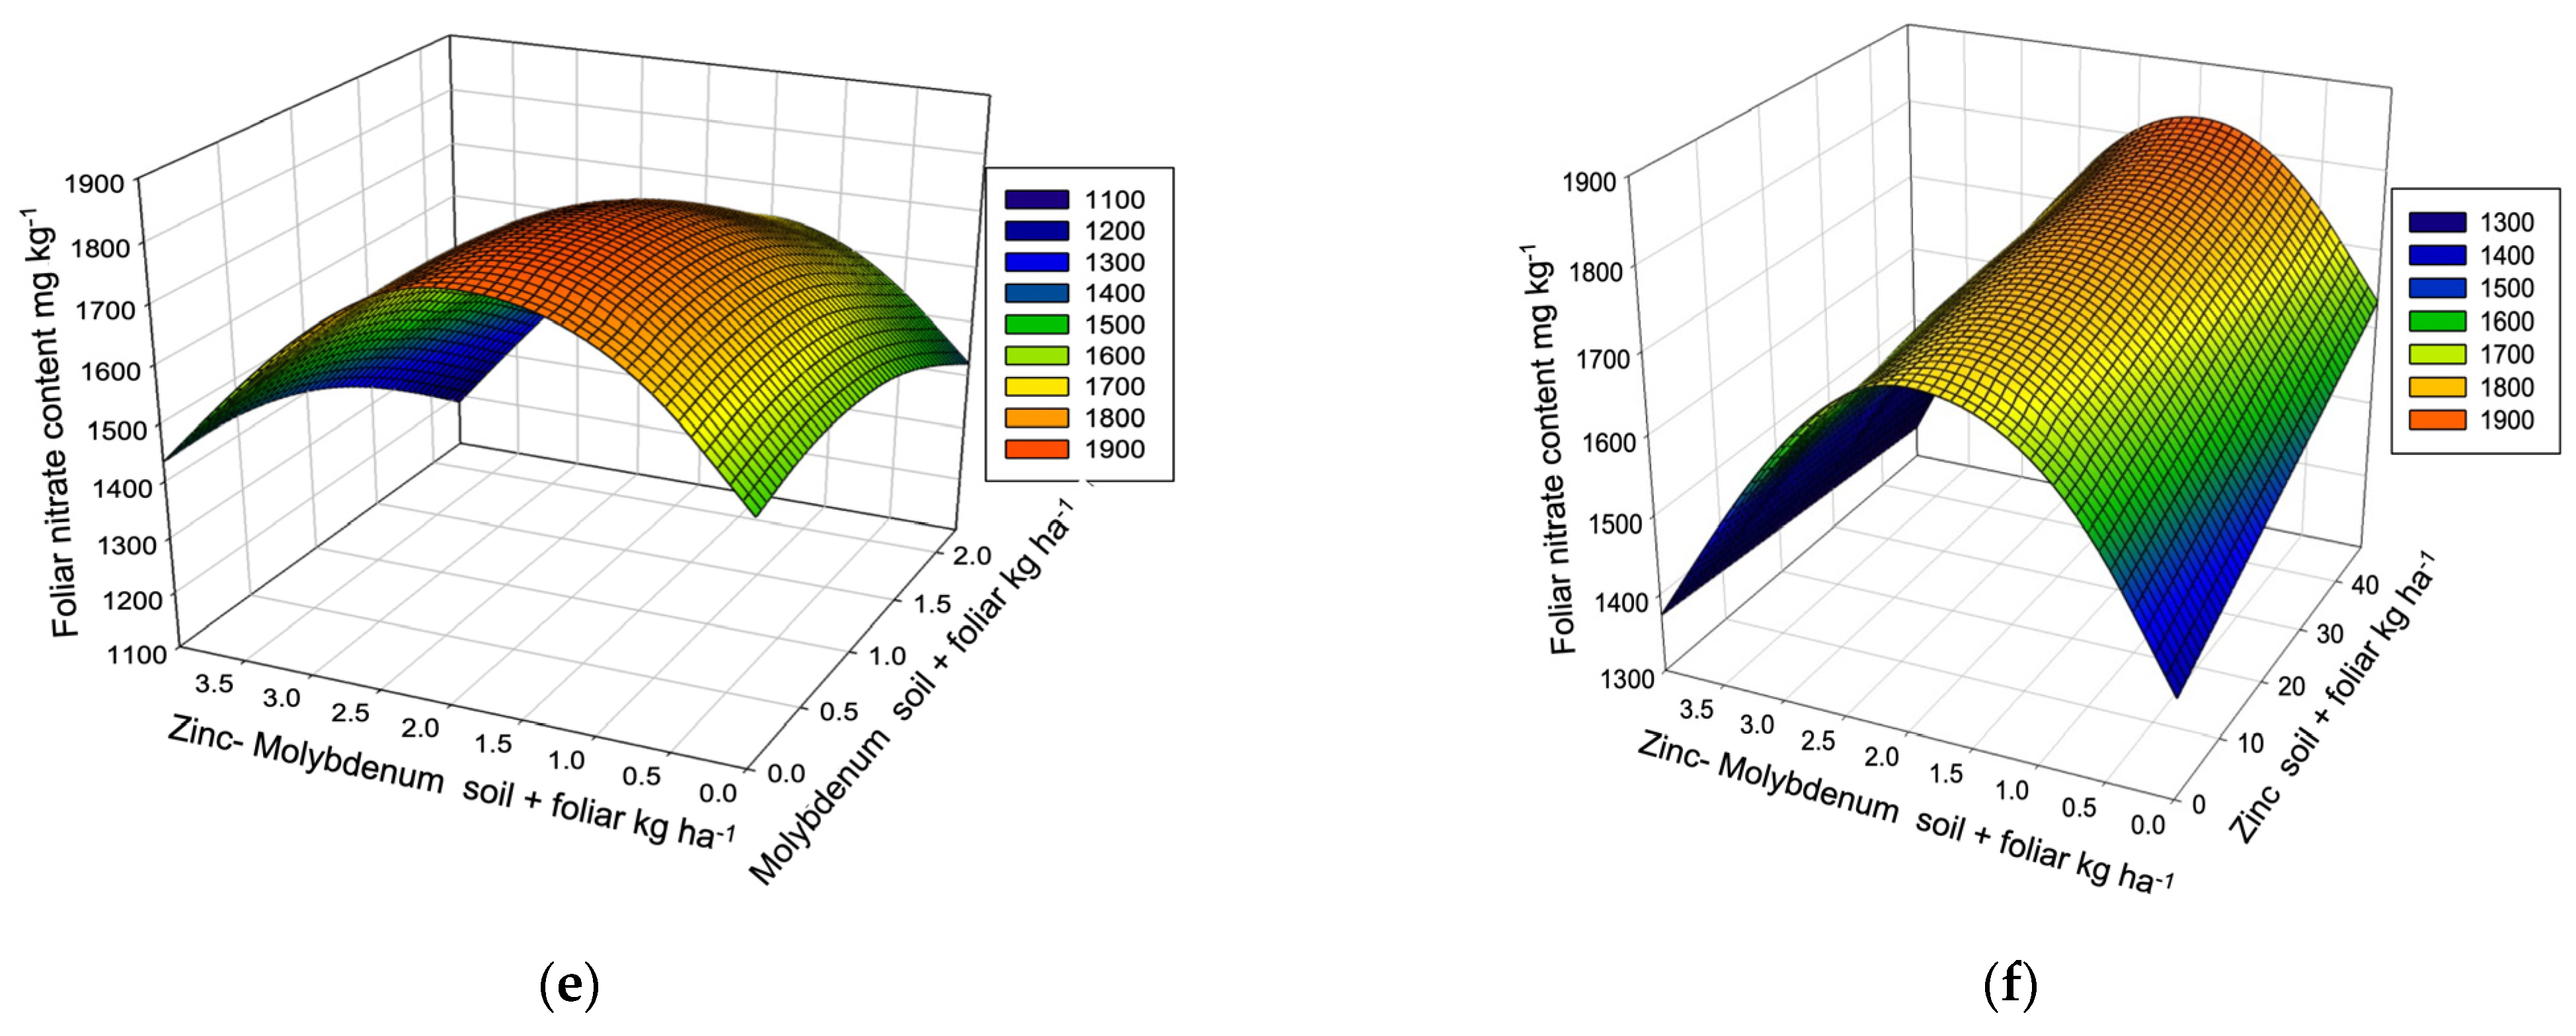
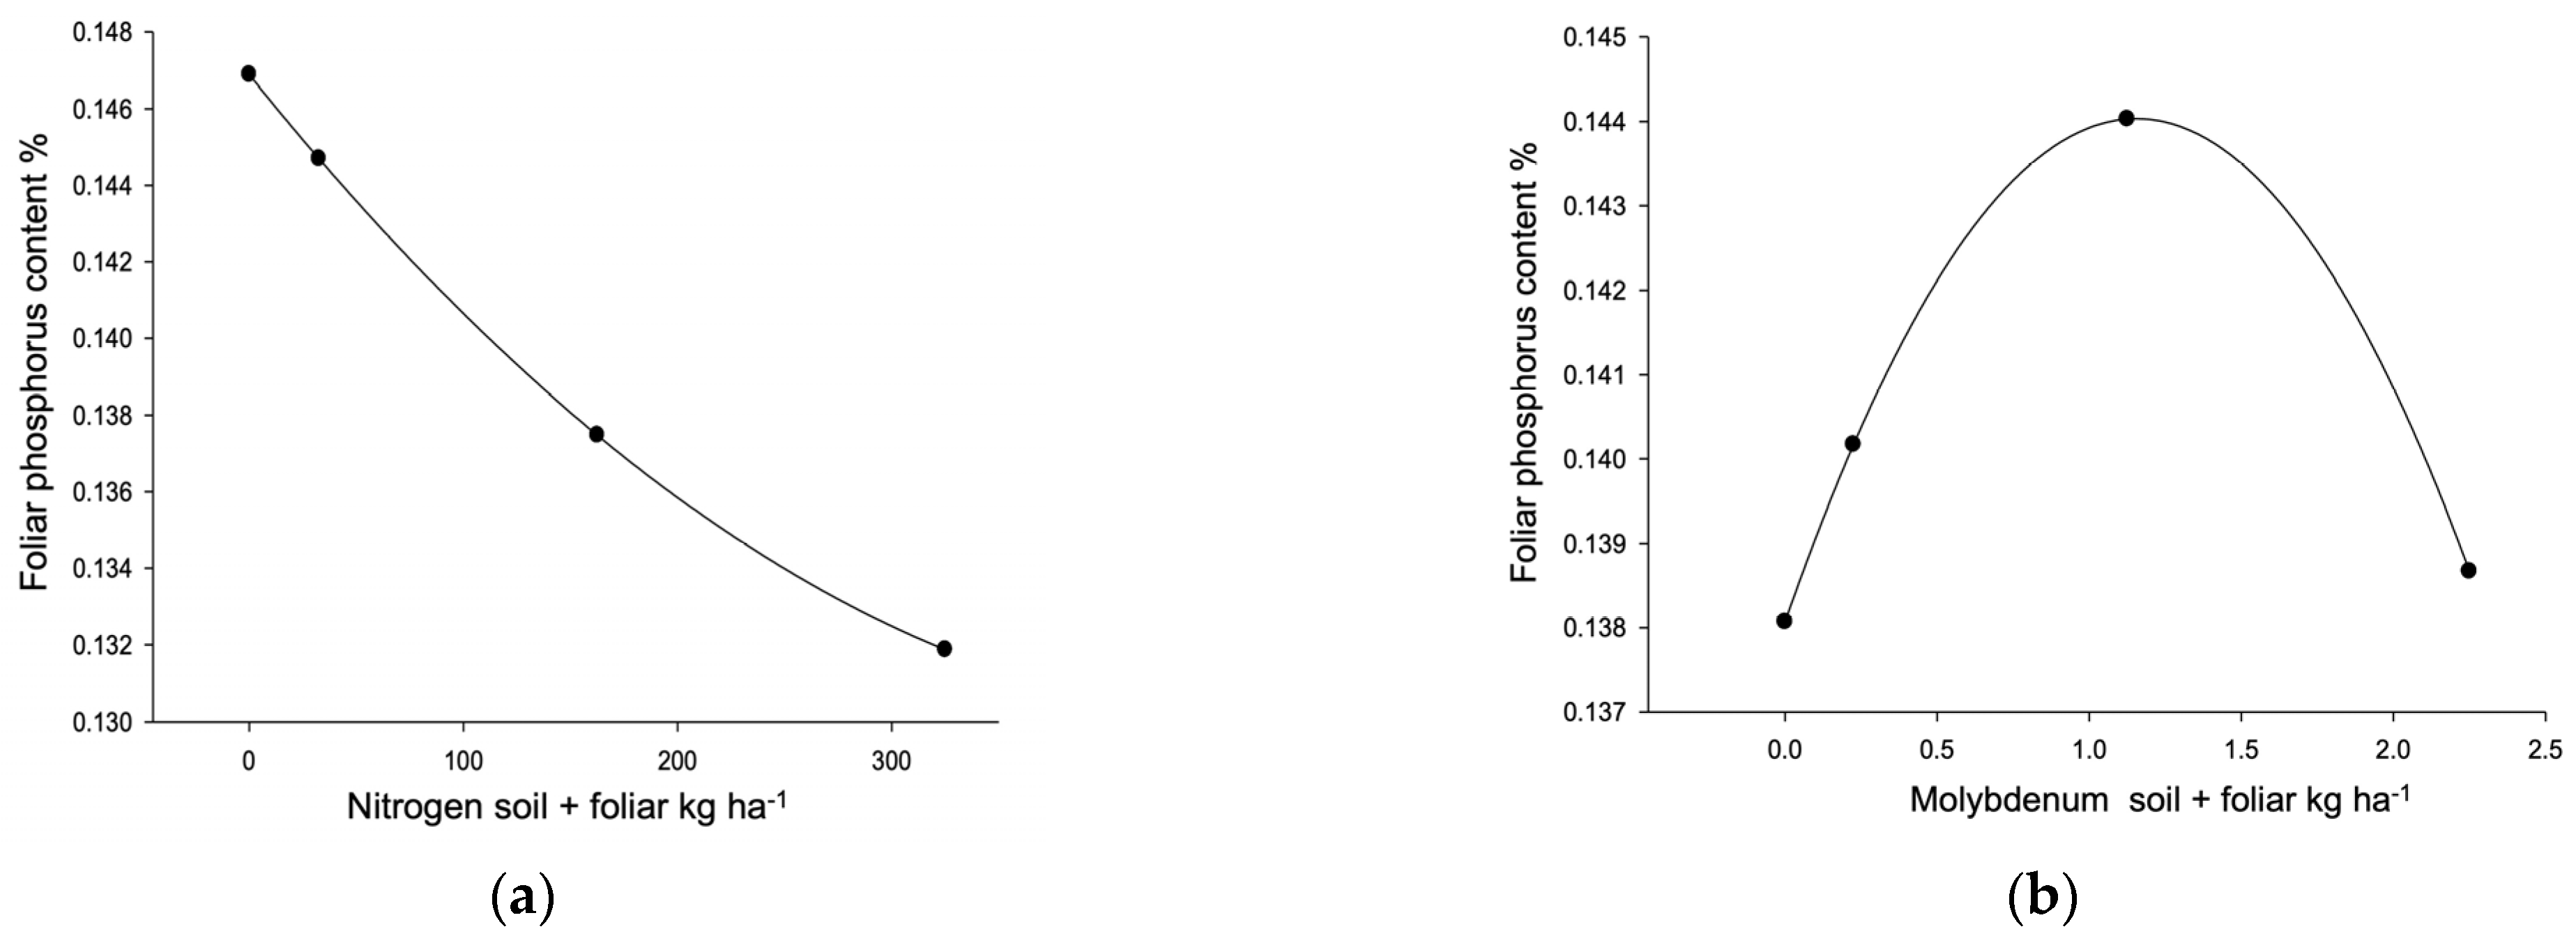
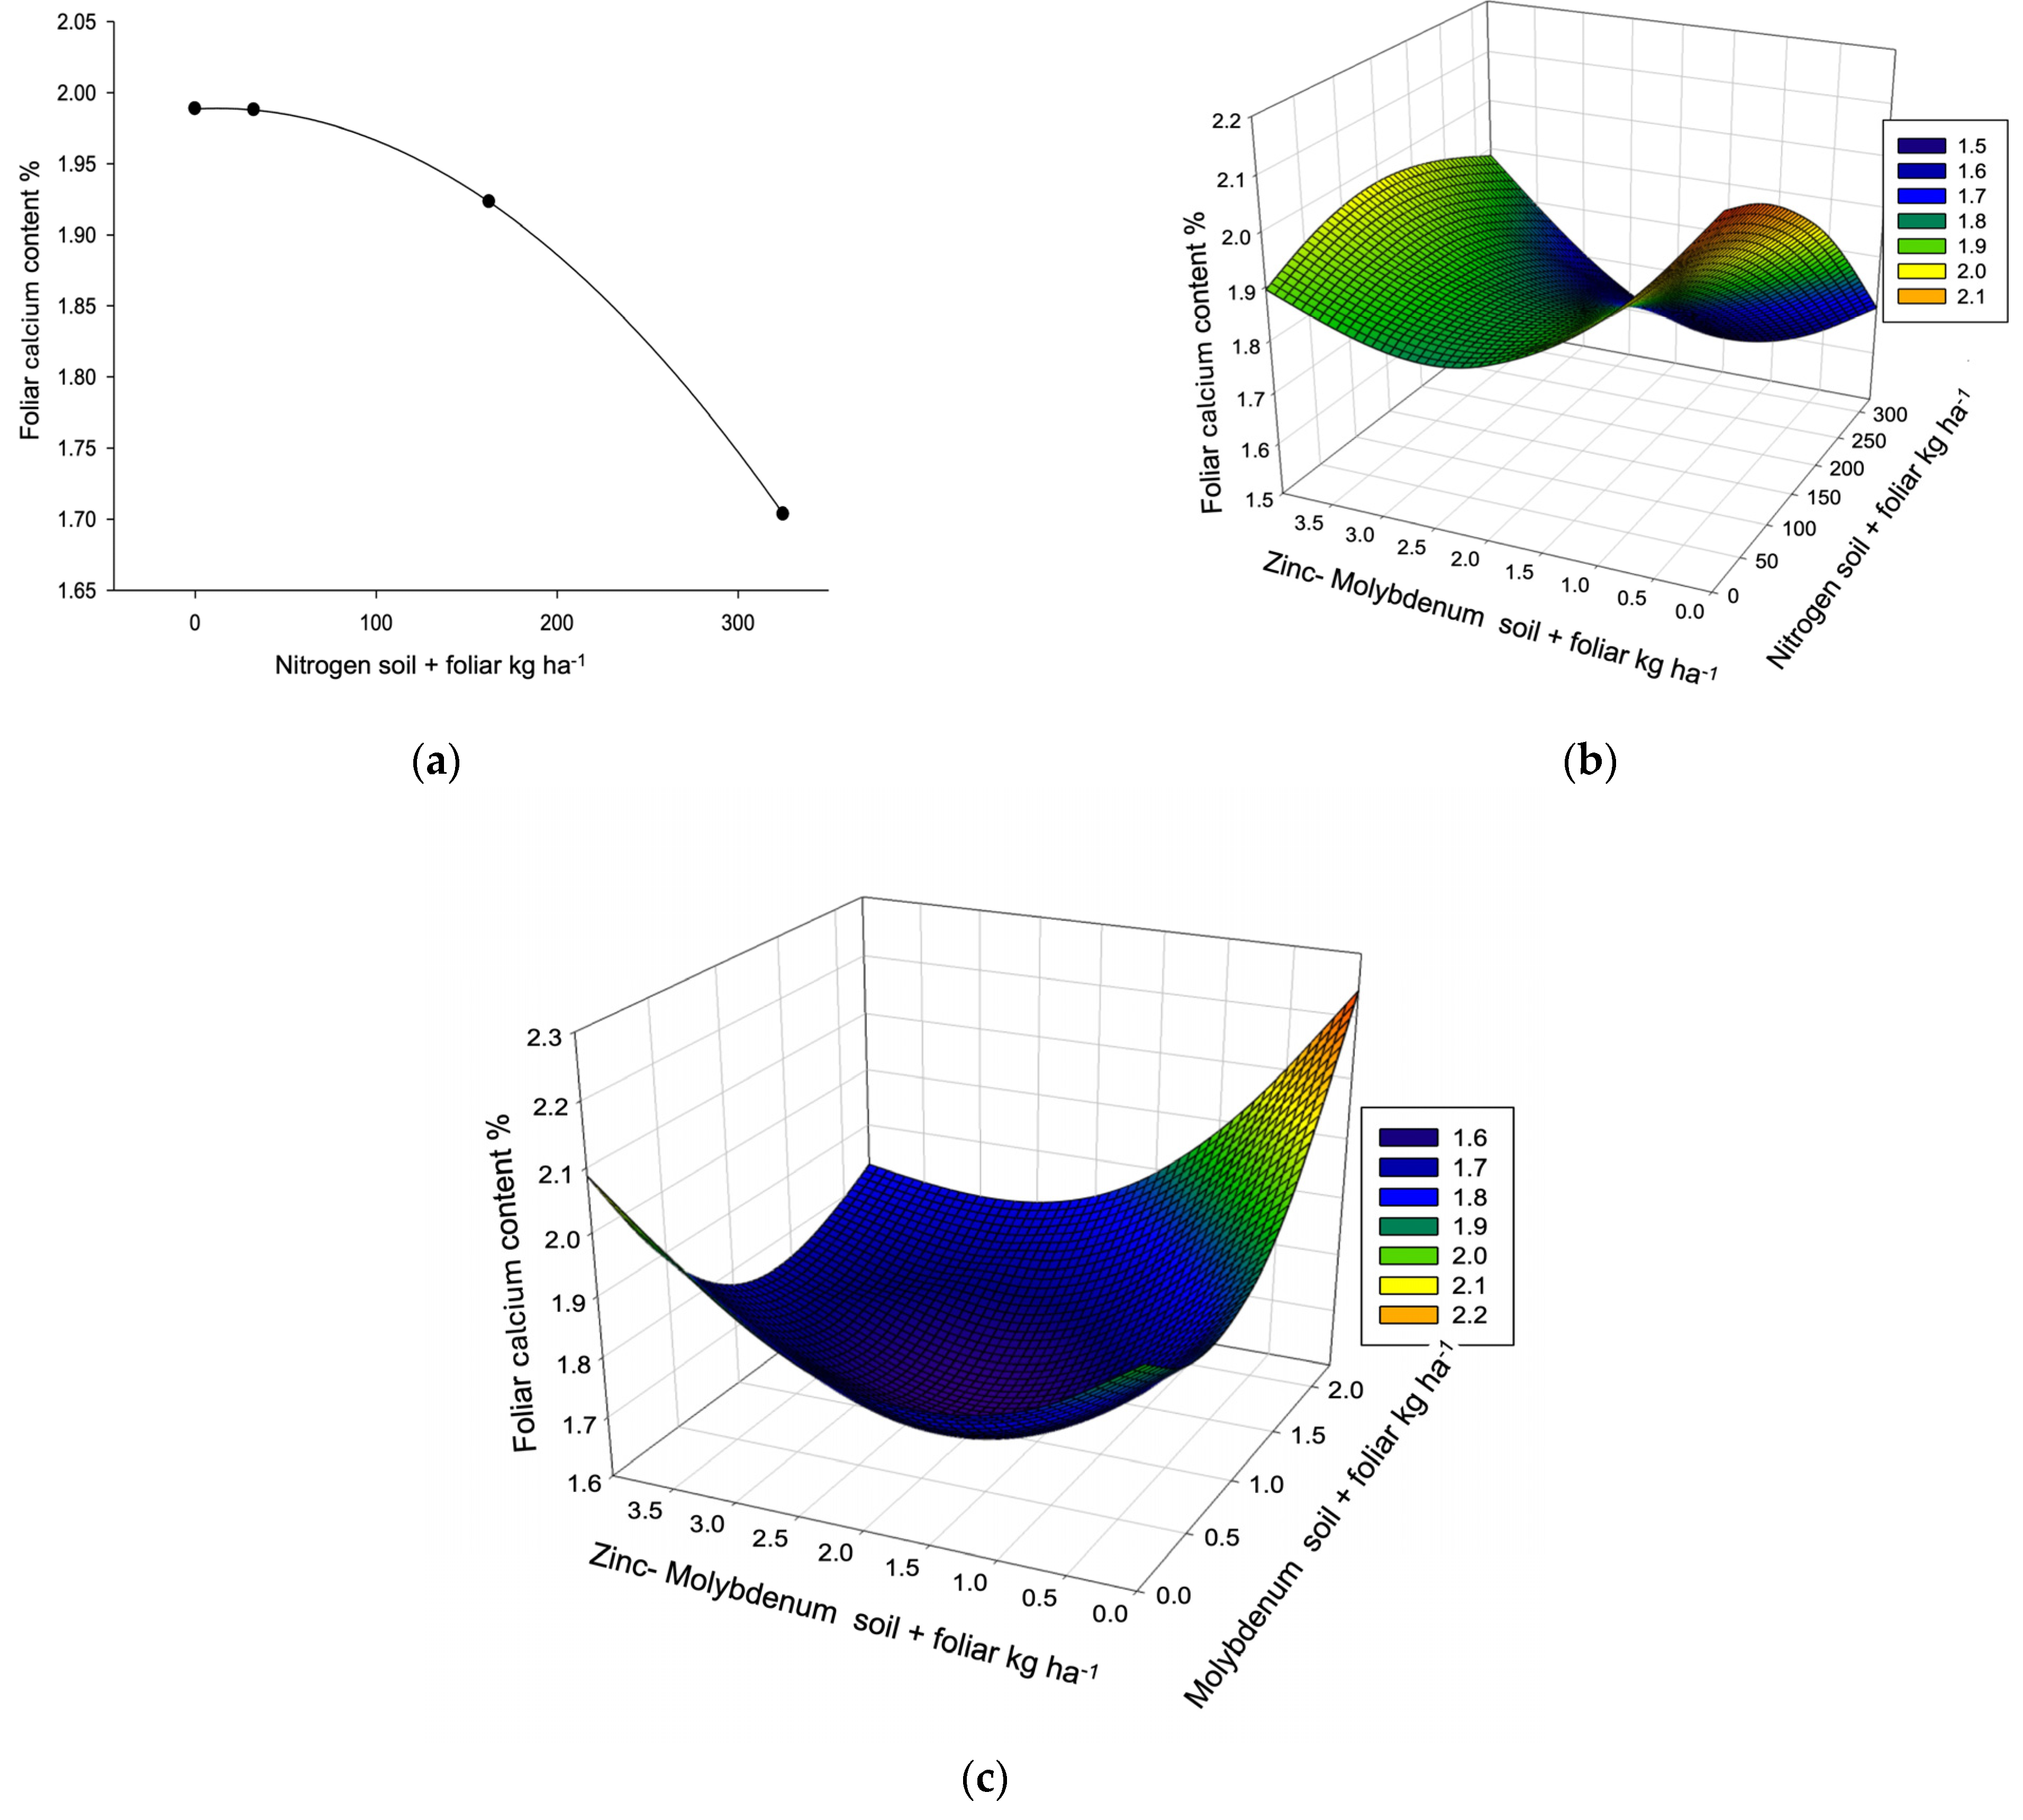
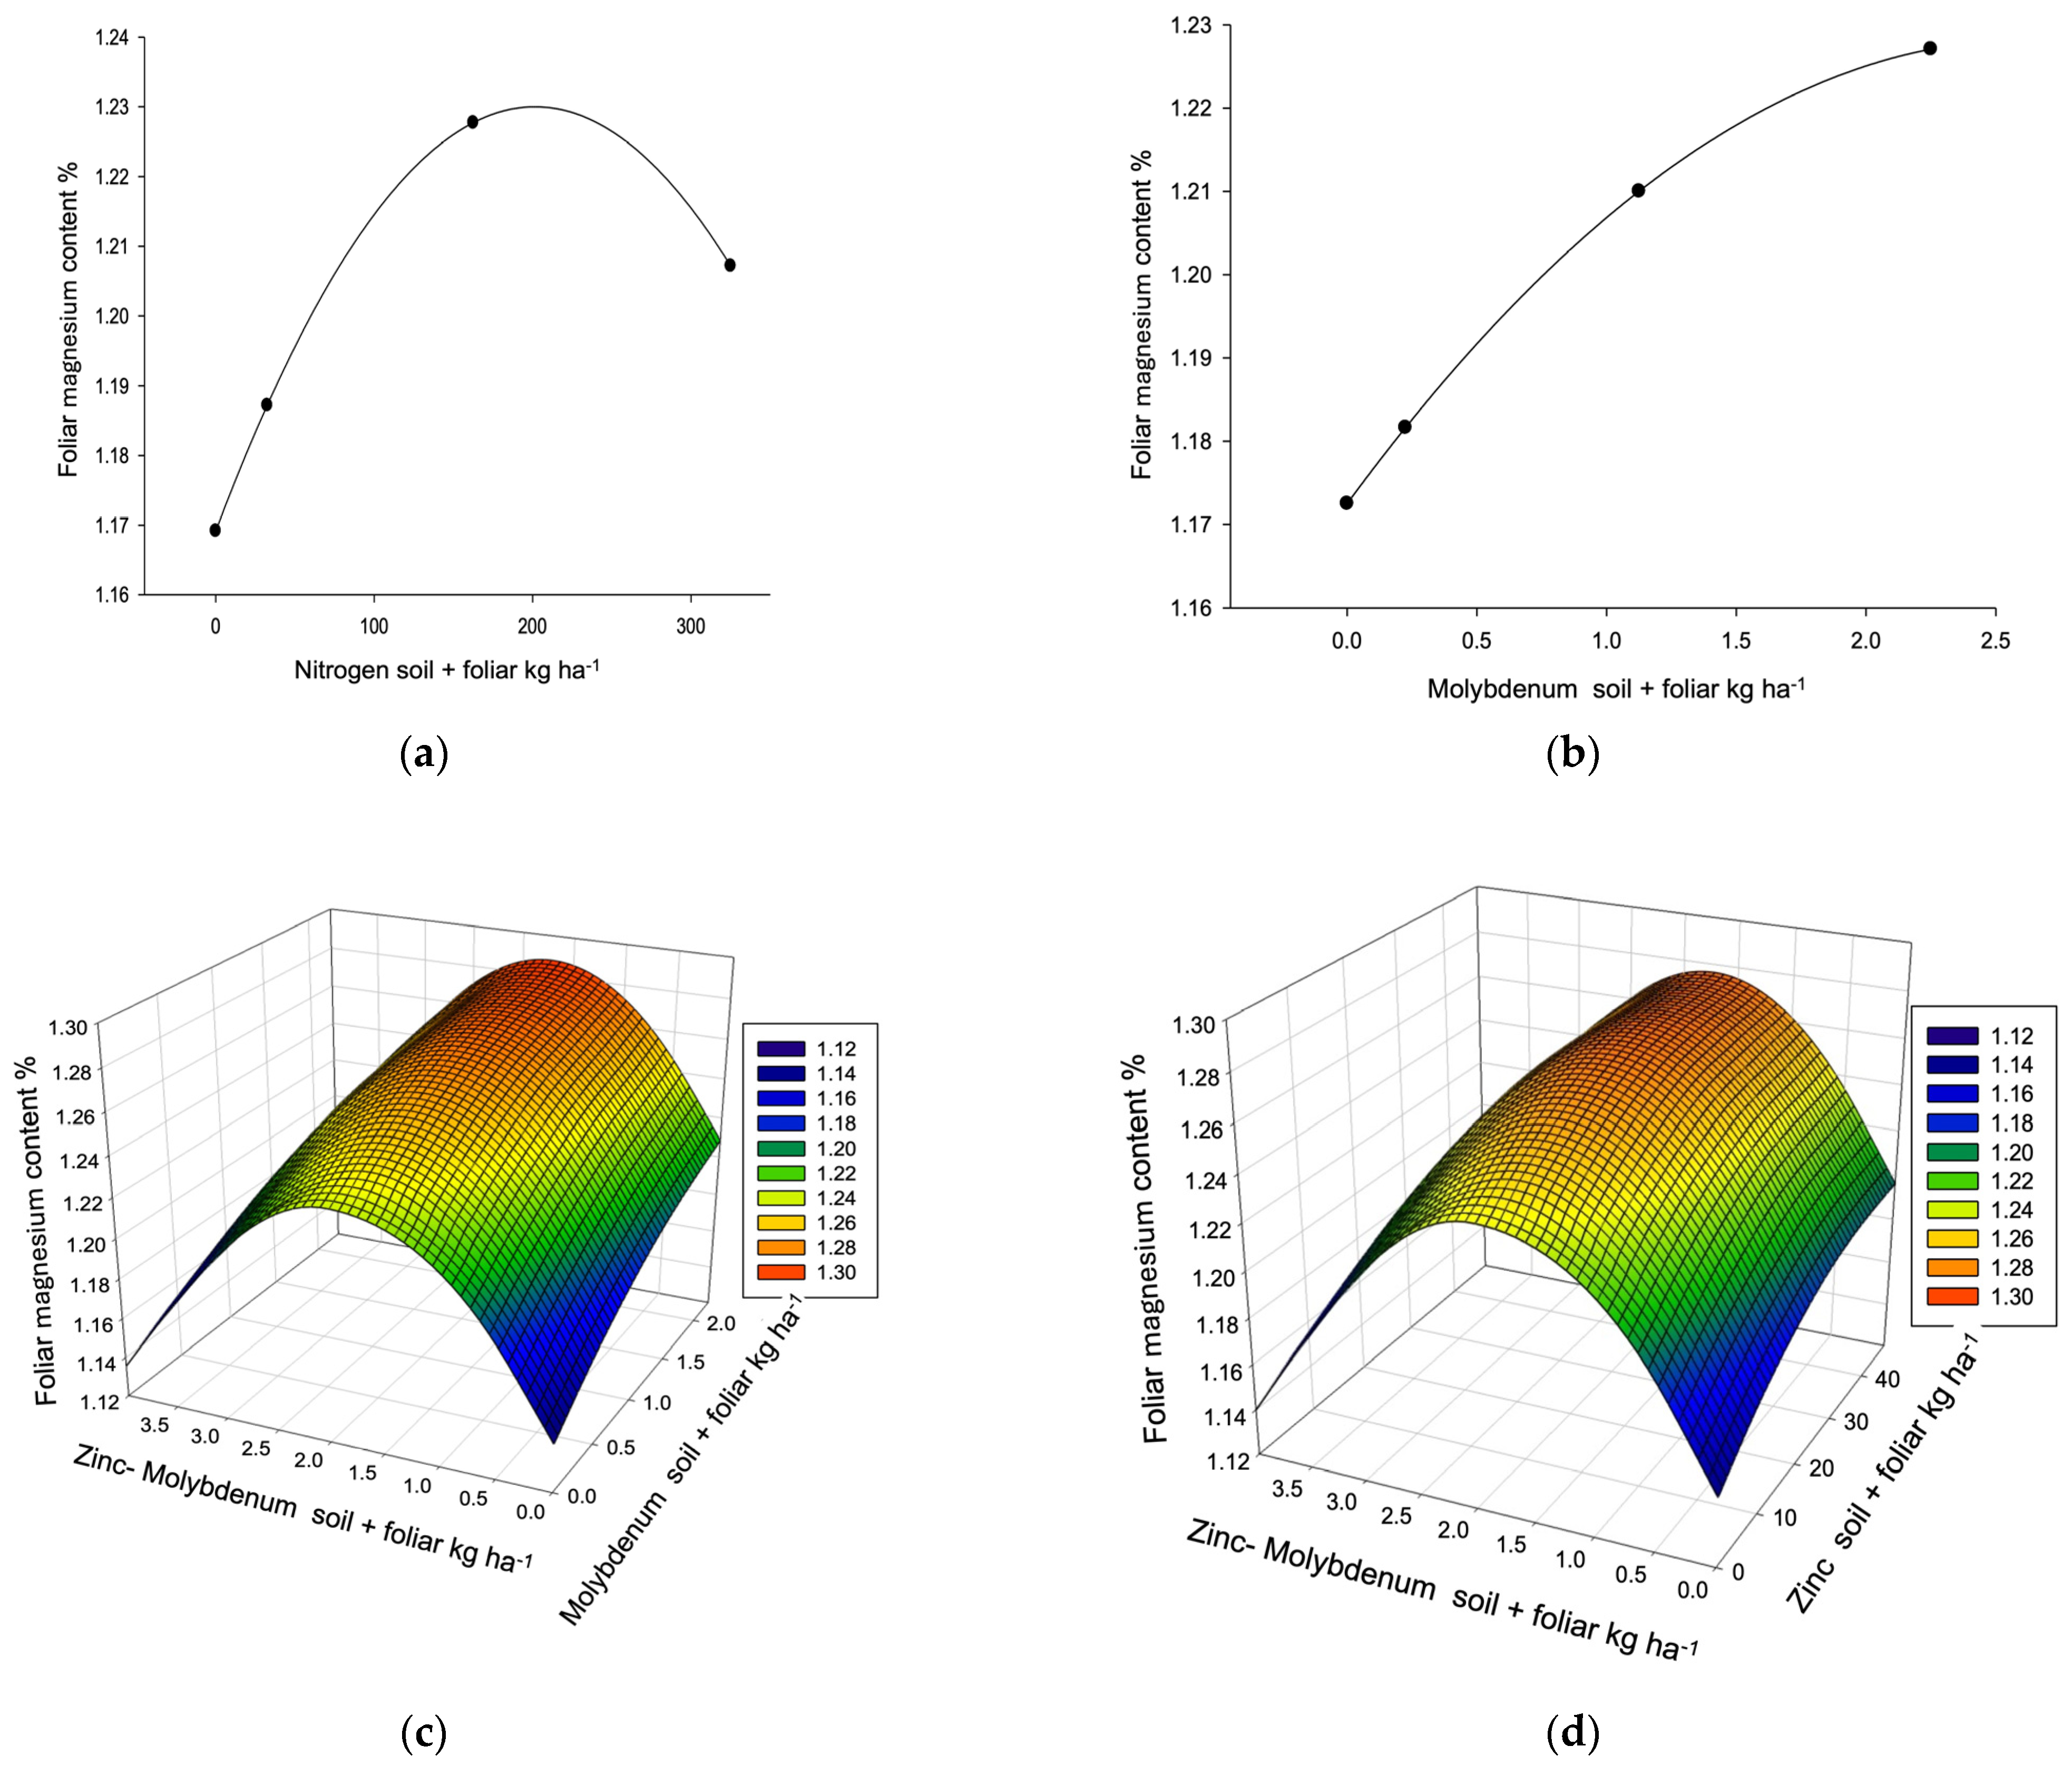
3.1. Foliar Nutrition

The nutrient content was evaluated (Table 5 and Table 6), which reveals that all factors influenced the results, as their eigenvalues were ≥22, representing 20% of the positive eigenvalues (118). The variables selected were those with eigenvectors ≥11. The factor with the greatest influence was nitrogen (N), with a value of 43, affecting 7 out of 11 variables, followed by molybdenum (Mo), with a value of 27, and zinc plus molybdenum (Zn-Mo) and Zinc (Zn), both with a value of 24; the latter showed an effect in 4 out of 11 variables.
Among the variables, those with the highest values were NO3, P, Ca, Mn, and Cu, all with values of 12. Conversely, the least affected variables were N, Ca, and Mg, with values of 11. Of the variables that showed a response, only NO3, P, Ca, Mg, and Co presented general regression and factor regression and were found to be significant factors.
In the case of nitrogen, it showed a variability of 20.2% (R2 = 0.2019), with a mean concentration of 1.97% (observed range: 1.69–2.31%) and reference values between 1.7 and 2.49%. The maximum value was 2.47%, which lies within the expected range. The nitrogen response dose was 96.46 mM ha−1, lower than the overall mean of this study (162.5 mM ha−1), representing a 40.7% reduction. Molybdenum exhibited a 28.9% decrease, while Zn and Zn-Mo showed increases of 5.8% and 2%, respectively. No significant linear, quadratic, or interaction effects were detected for nitrogen.
Nitrates displayed high variability (high R2). The overall mean was 1557.7 mg kg−1, exceeding the established reference ranges for this study (1907.1 mg kg−1). The response doses for the factors increased by 25% (N), 2.2 (Mo), and 16% (Z and Zn-MO). Significant linear, quadratic, and interaction effects among Mo, Zn, and Zn-Mo were identified (Table 5 and Table 6).
As illustrated in Figure 1a,b,d, the NO3 content increases with the applied dose of each factor until an inflection point, after which it begins to decline. In Figure 1a, the maximum is reached at approximately 100 kg ha−1 of N, corresponding to around 100 mg kg−1 of NO3; higher doses result in a decrease in concentration. For Zn (Figure 1c), a linear trend was observed: as the Zn dose increases, the NO3 content increases, surpassing 1600 mg kg−1. In the three-dimensional response surface models (Figure 1e,f), a synergistic interaction between Mo and Zn-Mo is evident: when both factors are applied at rates between 1 and 1.5 kg ha−1 of Mo and 2.3 and 3 kg ha−1 of ZnMo, levels approach 1900 mg kg−1. A similar pattern can be observed for the interaction between Zn and Zn-Mo.
Phosphorus (P) exhibited a mean value at the upper limit of the reference range (µ 0.14%). Regarding the response doses, increases were 75.8% for N, 3.1% for Mo, and 25% for Zn. Figure 2a,c show that high doses of N and Zn tend to decrease foliar P concentration, a pattern also observed in the antagonistic interaction between Zn-Mo and Zn (Figure 2e,g). Conversely, the applications of Mo and Zn show an inflection point: one increases and the other decreases the P concentration (Figure 2b and Figure 2d, respectively). The P concentration decreased at intermediate levels of both fertilizers; however, a significant increase was observed when Zn-Mo doses exceeded 3.5 kg ha−1. Similarly, a higher P concentration was detected under the interaction of high Zn-Mo doses combined with low Mo levels. (Figure 2f).
The calcium (Ca) content in the leaves was primarily influenced by the application of N, Mo, and the combination of Zn and Mo; it reached an average of 1.90%, which falls within the established reference ranges. It was observed that high doses of N resulted in a decrease in Ca concentration, with values below the average concentration when N doses exceeded 223.80 kg ha−1 (Figure 3a,b). Regarding the interaction between Zn-Mo and Mo, an antagonistic effect was observed at the highest Ca concentrations, reaching up to 2.2% with high doses of Mo and Zn-Mo (Figure 3c).
Regarding magnesium (Mg), the average concentration was 1.20%, showing a positive correlation with increased application of N, Mo, and Zn-Mo (Table 5 and Table 6). The response dose increased relative to the overall mean for each factor. As shown in Figure 4a,b, increasing the doses of N and M also increases the Mg concentration. However, an inflection point can be observed with N when doses exceed 200 kg ha−1. The effects of the interactions between Mo and Zn-Mo and Zn and Zn-Mo are similar, as high doses applied with the addition of 2.0 kg ha−1 of Zn-Mo increase the Mg content (Figure 4c,d).
Copper (Cu) content was influenced by all factors, with N eliciting the most pronounced response (frequency = 4); however, Zn-Mo exhibited a linear regression, shown in Table 5.

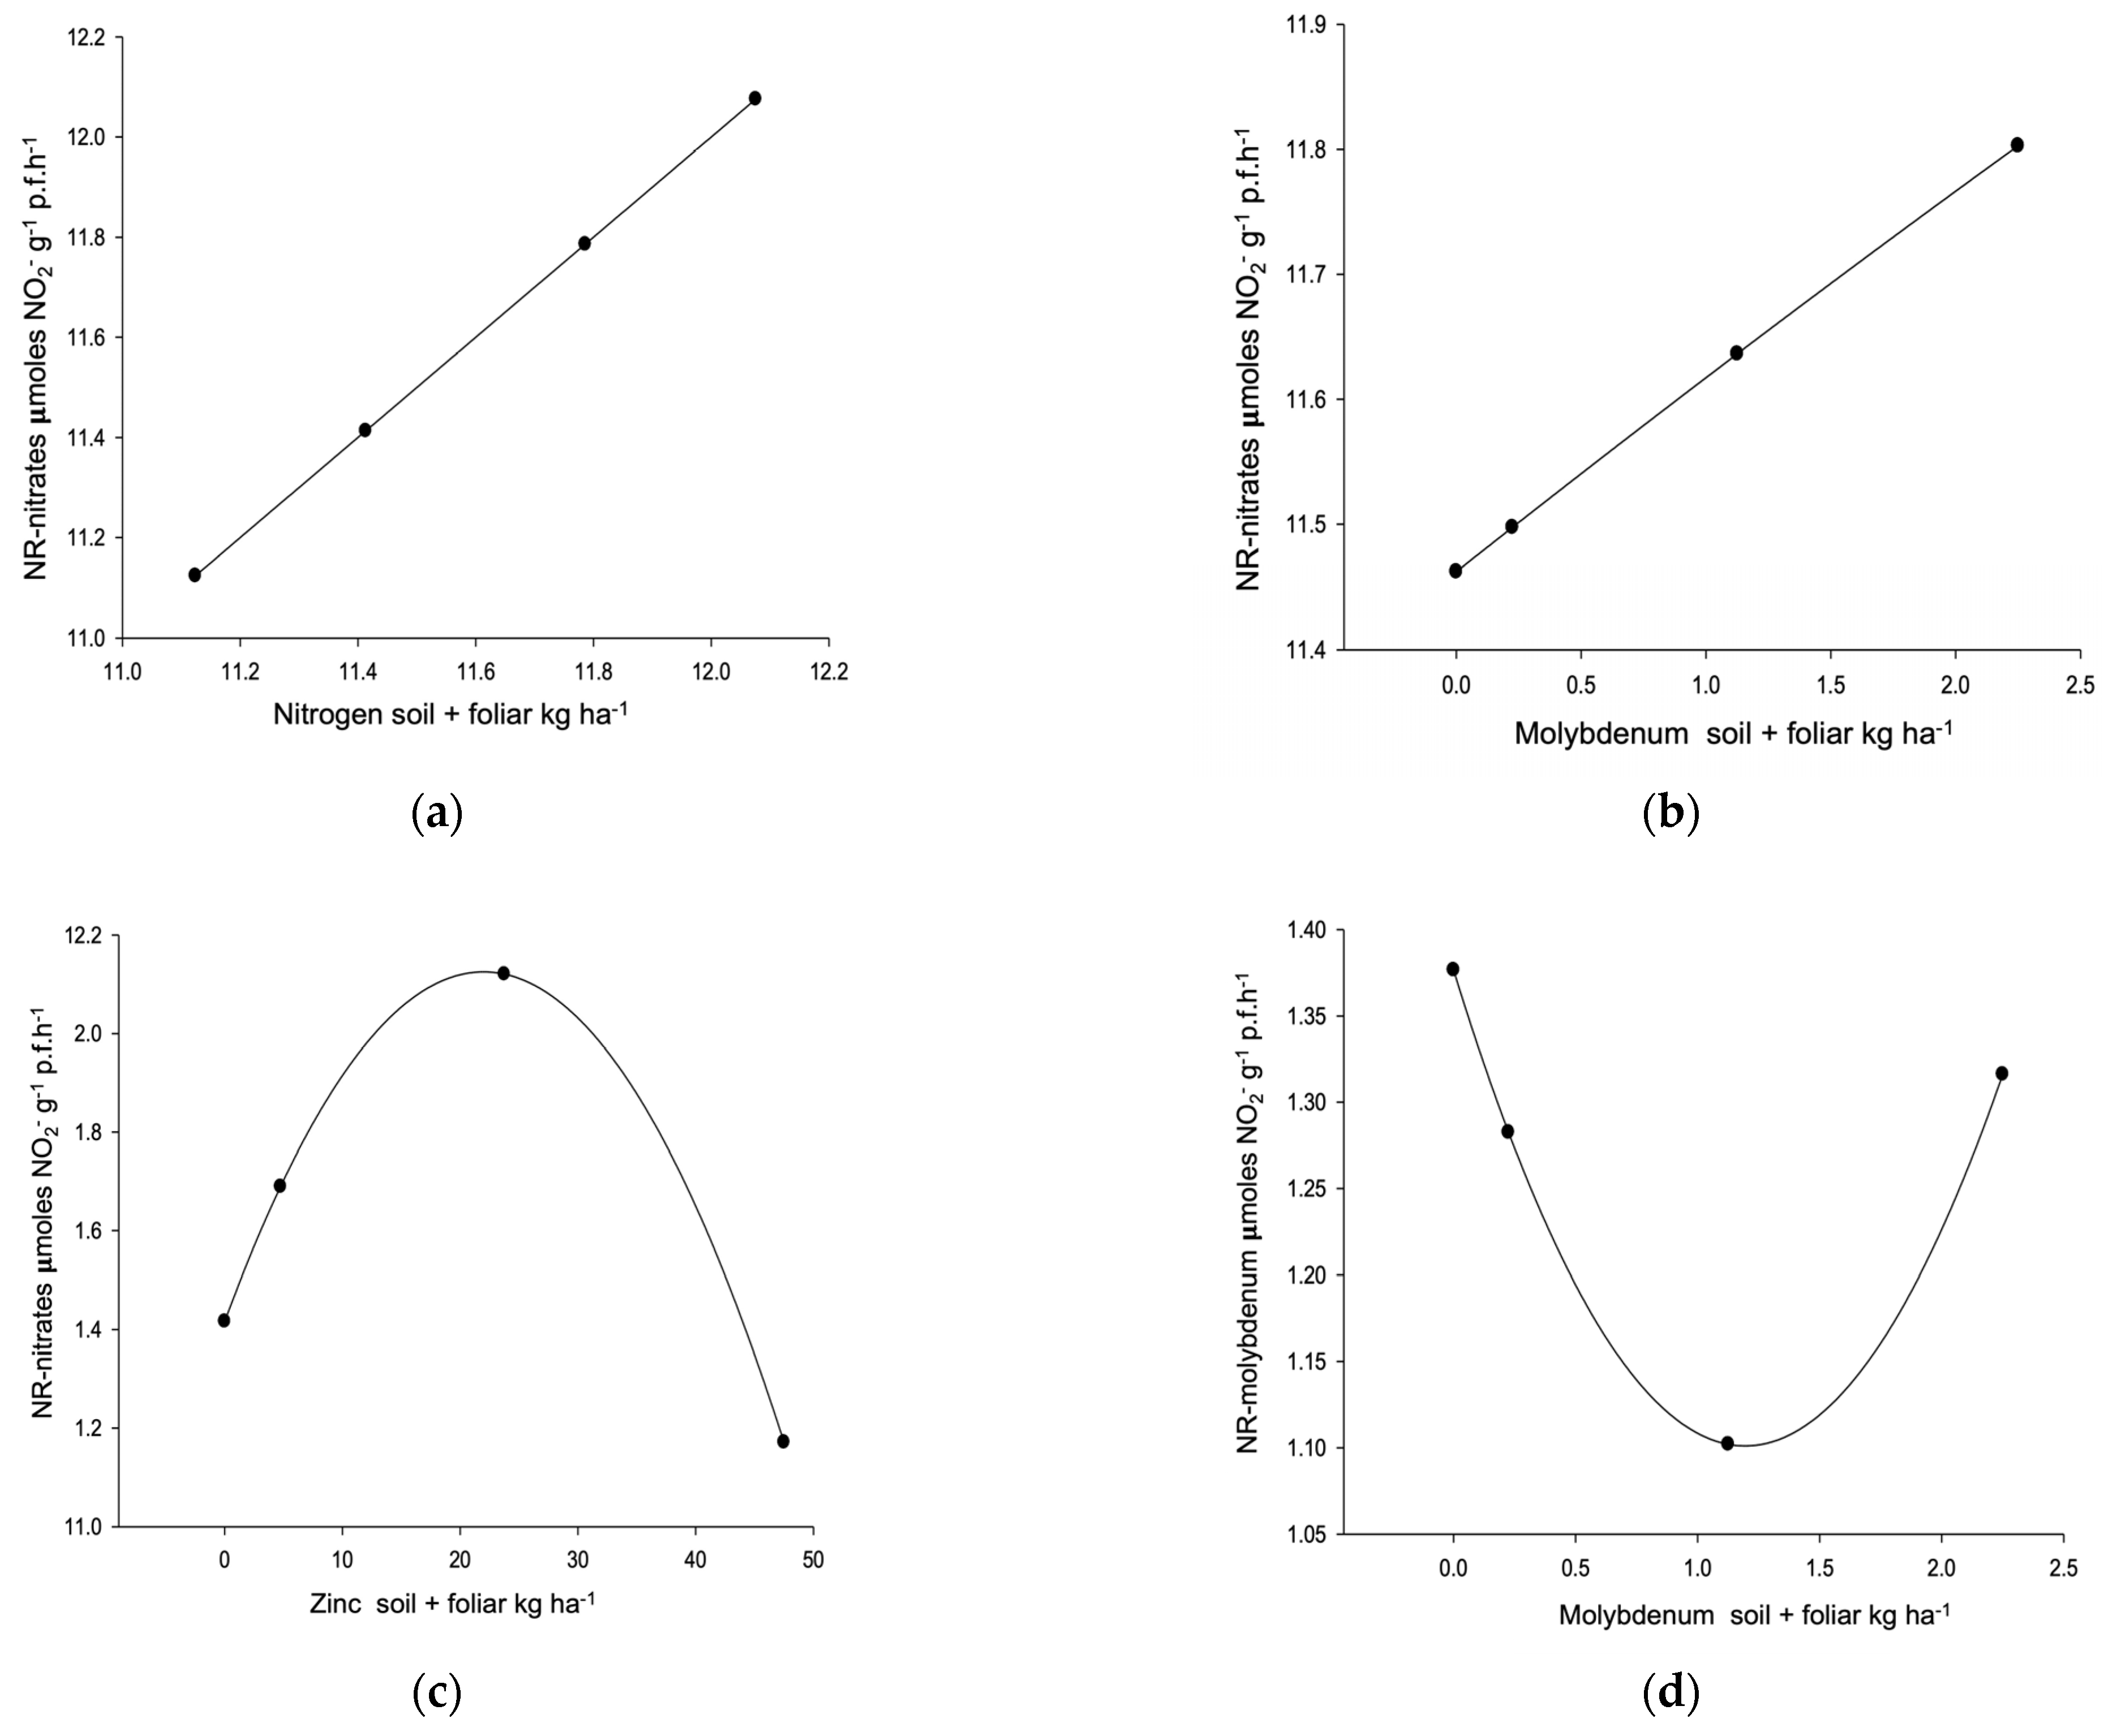
3.2. Enzymatic Activity

To assess the impact of soil and foliar fertilization with N, Mo, and Zn on the enzymatic activity of leaflets from "Western Schley" pecan trees, a total of 114 observations were analyzed. From these, the top 20% of positive values were selected, focusing on those factors with a subtotal ≥18. For the variables, a 10% threshold was applied, including only those whose eigenvector values were ≥9. As a result of this procedure, N (49), Mo (39), and Zn (26) emerged as the selected factors, and all associated variables met the defined selection criteria (Table 7 and Table 8). However, the most representative variables—each exhibiting significant linear and quadratic regression as well as interaction effects—were the following: nitrate reductase induced by nitrates (NRNO3), nitrate reductase induced by molybdenum (NRMo), and nitrate reductase induced by nitrates and molybdenum (NRNO3Mo) (Table 7).
The result demonstrated that NRNO3 activity was significantly influenced by applications of N, Mo, and Z, reaching a maximum concentration of 13.62 μmoles (Table 7). This effect is clearly depicted in the figures, which show a positive response to increasing N and Mo dosages (Figure 5a,b). In the case of Zn, enzymatic activity peaked at a dosage of 20 kg ha−1, suggesting that this concentration optimizes enzyme performance (Figure 5c).
On the other hand, NRMo activity, with an average value of 1.27 μmoles, was predominantly influenced by the N factor (frequency 4) (Table 7). Although Mo and Zn also influenced the concentration, they did so differently. Both presented an infection point: when high doses of Mo were applied, the NRMo concentration increased, while for Zn, the opposite occurred, and concentrations decreased (Figure 5d,e). Additionally, interactions between the factors were observed: N with Mo showed an antagonism, while N with Zn presented a synergism (Figure 5f,g). From a minimum dose of 1.0 kg ha−1 of Mo and with high doses of N, the NR-Mo concentration increased significantly. In contrast, Zn required a maximum dose of 25 kg ha−1 to increase the NRMo content. The interaction between Mo and Zn confirmed these results, showing the highest NRMo levels. For Mo, doses were between 0 and 1.0 kg ha−1, and Zn doses were between 20 and 40 kg ha−1 (Figure 5h).

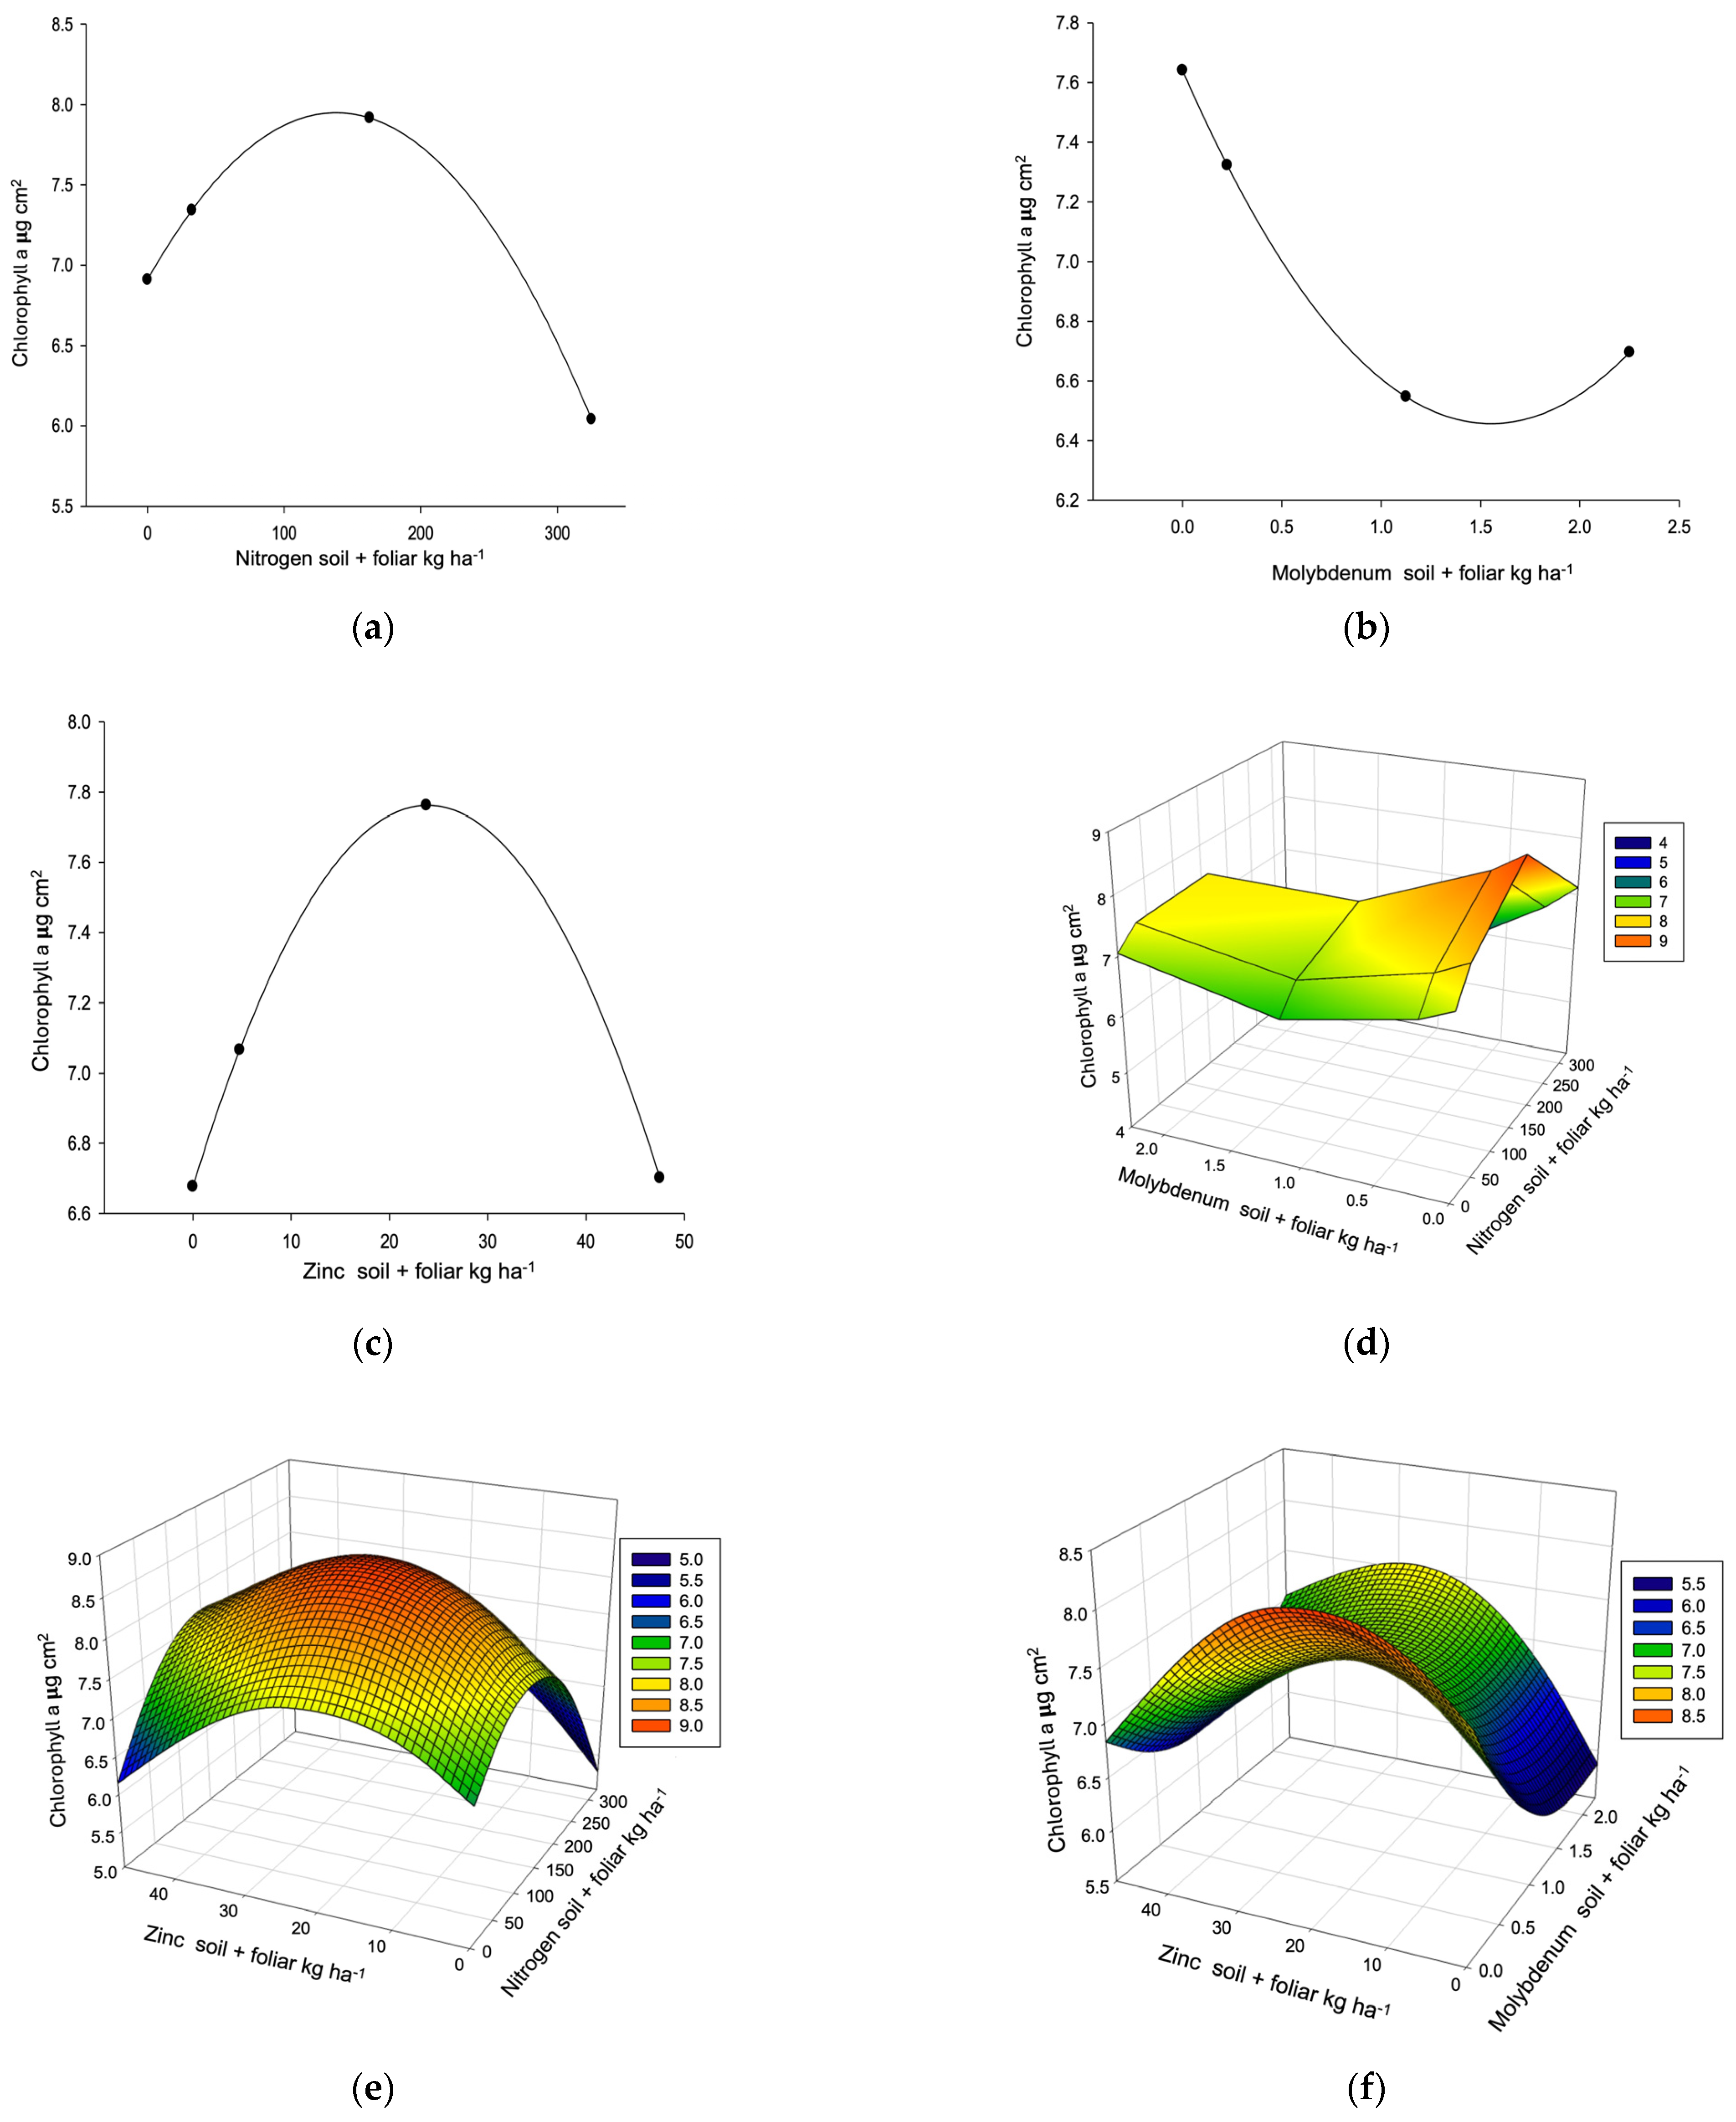
3.3. Photosynthetic Pigments

Since these parameters were evaluated concurrently with enzymatic activity, the factors that responded significantly were again N, Mo, and Zn (Table 7 and Table 8). All variables corresponding to photosynthetic pigments were selected; however, the only one that exhibited significant linear and quadratic regressions as well as interaction effects was chlorophyll a (Chl a). For this variable, the factor exerting the greatest effect was Mo, with a response frequency of 4.
As observed in Figure 6a,c, N and Zn reached an inflection point: as the doses of these fertilizers increased, the concentration of Chl a decreased. In contrast, increasing Mo doses led to an increase in the Chl a content (Figure 6b). These trends were also observed in the interactions, with antagonism between N and Mo (Figure 6d) and synergy between N and Zn and Mo and Zn (Figure 6e,f).

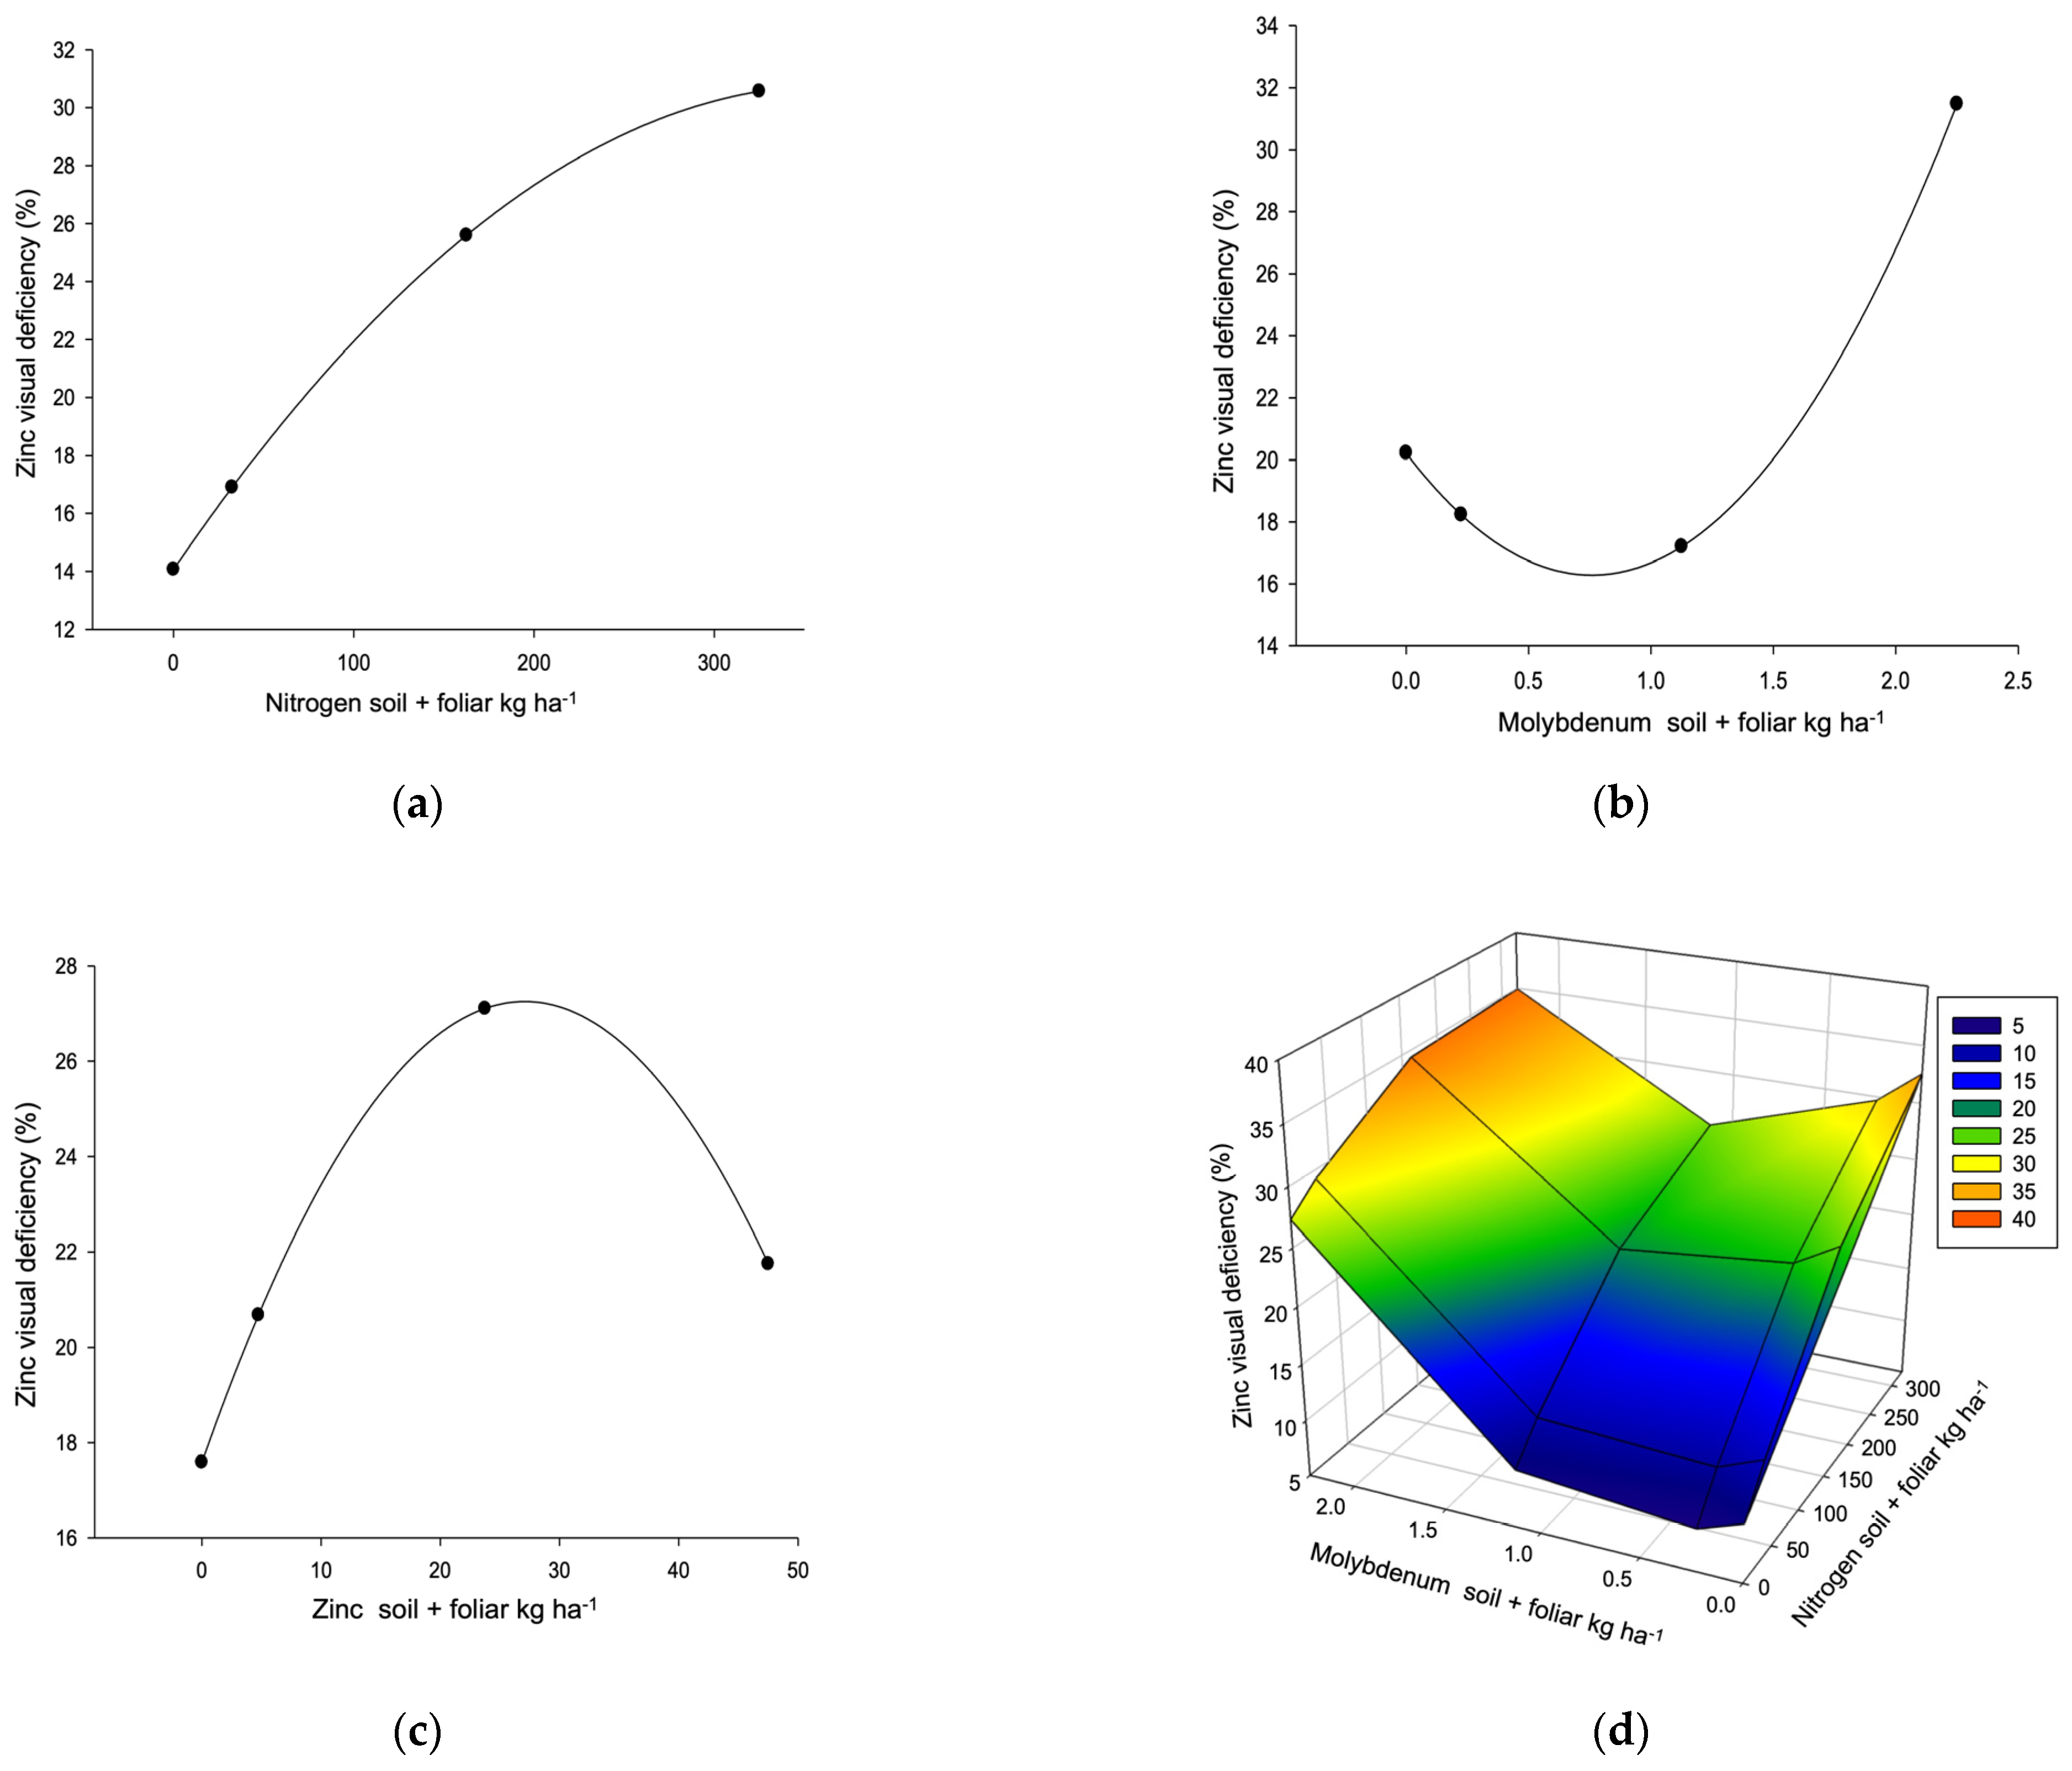
3.4. Pomological Parameters

In Table 9, the factors N, Mo, and Zn that were significant are shown in order of influence (eigenvalues ≥ 14). Additionally, all variables were influenced (with eigenvectors ≥ 7). However, the variables that presented general regression, factor regression, and significance were the deficiency of Zn, nuts per kilogram, and nut weight. In the case of Zn deficiency, the application of N and Mo showed greater deficiency: as the N dose increased, the deficiency increased, while Mo presented an inflection point, where higher doses of Mo also increased the deficiency (Figure 7a,b). It is important to note that there is an antagonism between N and Mo regarding Zn, as both reduce the availability of Zn. It is important to highlight the values obtained in this study. The maximum response doses were as follows (Table 9): 323.38 mM ha−1 for N, 1.73 mM ha−1 for Mo, and 28.61 mM ha−1 for Zn. When expressed per hectare, these correspond to 16.3, 0.28, and 2.06 kg ha−1, respectively, which were associated with the lowest visually observed zinc deficiency.
As seen in Figure 7a,b, the application of N and Mo in low doses reduces Zn deficiency. However, with the interaction of N and Mo, high doses of these fertilizers increase the deficiency of Zn (Figure 7d,e). On the other hand, with the application of Zn, an inflection point is reached: as Zn doses increase, the deficiency increases; however, it reaches a point where applying higher Zn doses decreases the deficiency (Figure 7c). In the interaction between Mo and Zn, an antagonism is observed, as high Mo doses increase the deficiency, and the Zn response is like what was previously mentioned (Figure 7f).
The number of nuts showed a linear response and interaction between the factors. As seen in Figure 7g, the number of nuts decreases as the nitrogen dose increases. In the interaction between Mo and Zn-Mo, a synergy is observed, as increasing the doses of both sources decreases the number of nuts (Figure 7h).On the other hand, the interaction between Zn and Zn-Mo shows an antagonism: the application of Zn yields the same result at any dose, with high Zn-Mo doses resulting in fewer nuts (Figure 7i).
It is important to emphasize that the trees used in this study were five years old and still in a developmental stage. As shown in Table 9 and Table 10, the application of N, Mo, and Zn significantly influenced growth-related variables such as leaf size, canopy coverage, fruitful shoots, kernel percentage, nut weight, nuts per kilogram, and overall yield (the observed yield ranged from 7.9 to 425 kg ha−1). The previous responses may be attributed to the fact that the tree is still in its growth stage.
Based on the result, shown in Table 11, of the metasummary, the followings findings are synthetized: fertilization with nitrogen, molybdenum, and zinc has a differential impact on foliar nutritional content, enzymatic activity, and the pomological parameters of the evaluated plants. In general terms, nitrogen was identified as the most relevant factor, followed by molybdenum and zinc. These results highlight the importance of an adequate combination of fertilizers to optimize both foliar quality and crop yields. The highest overall response doses (covering all response variables) were 319.6 mM ha−1 for N, 1.73 mM ha−1 for Mo, 31.45 mM ha−1 for Zn, and 2.37 mM ha−1 for the Zn-Mo combination. These concentrations correspond to 116.34 kg ha−1, 1.99 kg ha−1, 15.85 kg ha−1, and 10.87 kg ha−1, respectively. They were distributed across different applications from April to mid-June, covering the stages of bud break, flowering, shoot growth, and fruit growth and development in pecan trees.

4. Discussion

4.1. Foliar Nutrition

The application of various fertilization sources is of great importance for the growth, development, and production of pecan trees [3]. Knowledge of nutrient concentration in fruit leaves is used as a tool to assess nutrient availability and guide fertilization programs, and nitrate is one of the main sources of nitrogen available to plants, which is reflected in the significant increase of nitrates in leaflets [23]. This study presents a NO3 concentration (1557.7 ppm) in the leaves, and the values increased with the applications of the four fertilizers (Table 4). These findings align with those of previous studies, which emphasize the frequent use of N in fruit tree fertilization [3].
These findings are consistent with previous studies, such as those by Muñoz-Márquez et al. [24], which highlight the role of Mo in the metabolism of N and the role of Zn in optimizing N use in plants. Likewise, the work of Hounnou et al. [6] suggests that Zn does not directly participate in NO3 assimilation, but it improves the overall health of the plants and is deficient when N is used. It is also important to emphasize that proper fertilizer management, particularly using lower doses of N in fertilization, reduces soil contamination [25] and increases profits for producers due to the decreased use of fertilizer [3]. The application of N showed the greatest impact on P concentration; other studies indicated that high doses of N can affect the absorption and balance of P in plants [26]. This may be due to competition for P absorption, as mentioned in other studies on pecan trees and fruit crops [8]. It reached an average of 1.90%, which exceeds reference ranges established for the crop [23] or is a value that falls within the upper range of reference levels for pecan tree crops [3].
In this work, the application of N showed the greatest impact on the P concentration. P imbalance in plants is affected by poor uptake due to high doses of N [1,26]. This phenomenon may be related to the nutrient balance and competition for P absorption, as mentioned in other studies on pecan trees and fruit crops [8].
In this study, it was observed that high doses of N resulted in a decrease in Ca concentration; this was when the average concentration of N doses exceeded 223.80 kg ha−1. This behavior is reported in the literature, where it is noted that high doses of N can affect the assimilation of other nutrients such as Ca. Therefore, it is essential not to exceed the recommended nitrogen doses to avoid interference with the absorption of the other essential elements like Ca [27,28,29]. The decrease in Ca concentration may be attributed to a dilution effect caused by vegetative growth simulated by N [30]. Excess Ca can exhibit antagonism with other nutrients, adversely affecting plant growth and development; it may also disrupt osmotic regulation, reproductive processes, and fruit quality [31]. On the other hand, with Mo application, the results are consistent with previous studies, such as those in apple crops, which did not report direct effects of Mo on Ca content [32], although an increase in Ca levels has been observed with Zn application in pecan crops [8]. It reached an average of 1.90%, which exceeds the reference ranges established for the crop [23]. Other studies report that high doses of N affect the assimilation of other nutrients, such as Ca; therefore, it is important not to exceed the dose of N [27,28,29].
A different result was observed in the case of Mg and Cu, whose concentrations were within the sufficiency range [8,23,24]. Mg is important in multiple processes vital for plant growth and development; it plays a key role in chlorophyll synthesis, protein synthesis, carbohydrate metabolism, and energy metabolism [33]. One of the main functions of Cu is to serve as a cofactor in the formation of antioxidant enzymes, protecting plants against abiotic stress [34]. Mg and Cu did not show antagonism with N, which had the greatest effect on the concentration of these variables. This is suggested by the literature; high doses of N may contribute to reductions in foliar concentrations of various elements [3]. Likewise, an excess of N may induce deficiencies by inhibiting the transport of other elements within the plant [35]. In this study, not having deficiencies of these elements may indicate that the N doses applied were adequate.
Optimal fertilization rates vary depending on the nutrients required to maintain a desirable nutritional status. For N, the recommended rate range is 168 to 224 kg ha−1 [29], although a rate of 100 kg ha−1 has been recommended in studies on various fruit species [36]. For Zn, the recommended application rates range from 2.24 to 6.73 kg ha−1 [37].

4.2. Enzymatic Activity

Nitrate reductase is a key enzyme in nitrogen metabolism that catalyzes the reduction of NO3 to nitrite (NO2) [11,31,33,34]. The result of this study is consistent with other studies that highlight the direct relationship between N availability and NR activity [30,38,39,40]; its activity reflects the plant’s capacity to convert soil nitrates into utilizable forms such as proteins, thereby enhancing nitrogen use efficiency (NUE) and promoting crop growth and yield [41]. The literature mentions that Mo demonstrates an essential role as a cofactor for NR, enhancing its activity [11], which also agrees with this study, which demonstrated that Mo-induced NR was one of the variables with the greatest response. Agronomically, the combination of high nitrate reductase (NR) activity and an optimal Mo supply optimizes NUE, reduces nitrogen losses through leaching, improves crop quality, and diminishes the environmental impact of nitrogen fertilization [42]. Furthermore, it has been demonstrated that NR activity is correlated with auxin biosynthesis and transport, which regulates root growth and supports NUE [43]. NR, acting as a signaling molecule, activates enzymes involved in the drought stress response, such as superoxide dismutase [44], and promotes the accumulation of osmoprotectants and antioxidants, contributing to the mitigation of salt stress [45].
Therefore, NR activity is directly associated with improved NUE, as reflected in the NO3 content, enhanced chlorophyll synthesis, and overall promotion of plant growth [46]. This aligns with our results, where N positively influenced NO3 content, chlorophyll concentration, leaf size, canopy coverage, and the percentage of fruitful shoots.

4.3. Photosynthetic Pigments

Photosynthesis directly depends on the amount of photosynthetic pigment present, and inadequate fertilization can reduce pigments, affecting the process. A lower pigment concentration is associated with fertilization deficiencies, reinforcing the importance of correct mineral nutrition to optimize photosynthesis [11].
Chlorophyll is an essential component in the photosynthetic process of plants [36]. In experiments with pecan trees, it was found that higher nitrogen doses significantly increased the contents of Chl a and Chl b [47]. Additionally, in sorghum crops, Chl a, Chl b, and Cx contents were higher with the application of 15 kg ha−1 of N, which aligns with the maximum doses identified in this work [38]. It should be noted that the results of this study indicate that high doses of N can decrease chlorophyll content. Under certain conditions, its application may reduce chlorophyll levels due to factors such as physiological stress [35].
In another study, conducted on cherries, similar effects on the contents of Cl a, Cl b, and Cx with different doses of N (0, 60, and 120 kg ha−1) were observed, suggesting consistency in the response of different species to nitrogen fertilization [48]. Likewise, application of Mo in apple trees increased chlorophyll concentration compared to control treatments; this result was also reflected in this research [32].
Regarding zinc, its crucial role in chlorophyll synthesis is highlighted, emphasizing that its proper application is key to promoting the content of photosynthetic pigments [26]. However, as in this study, high doses of N can reduce chlorophyll levels, so it is recommended not to exceed 25 kg ha−1. Negative effects on chlorophyll concentration have been reported with high doses of Zn in tomato and beans, which reinforces the importance of optimal doses of this micronutrient [38,39].

4.4. Pomological Parameters

Previous studies indicate that low Zn availability in alkaline and calcareous soil directly affects the growth and development of pecan trees, which is consistent with the results of this study [49,50]. These findings also align with what Wells [3] found, that is, the use of high doses of N in that study in the form of ammonium sulfate decreased Zn concentration because it promoted vegetative growth. It is noteworthy that, in this study, the maximum nitrogen doses that elicited the greatest response did not negatively impact Zn concentration nor induce visible deficiency symptoms of this micronutrient.
It is important to note that fewer nuts per kilogram indicate large nuts. This means smaller nuts are lower-quality nuts [51]. In this study, the resulting nut size was large, with an average of 166.
As previously mentioned in the results, the doses that generally resulted in the highest overall response for each factor were 116.34 kg ha−1 for N, 1.99 kg ha−1 for Mo, 15.85 kg ha−1 for Zn, and 10.87 kg ha−1 for the Zn-Mo combination. This is consistent with the finding of Wells (2021) [3], who emphasizes that achieving a favorable cost–benefit ratio for N application requires consideration of multiple factors, including environmental conditions and the source and efficiency of the fertilizer used. The literature also indicates that an average of 100 kg ha−1 of N is required to achieve a yield of one ton of nuts [52], which aligns with the doses recommended in this study (100.72 kg ha−1). Although the expected fruit yield was not reached, this is attributed to the fact that the evaluated trees are still in an active developmental phase and have not yet reached full productive maturity. Nevertheless, N fertilization promoted a positive response in vegetative growth, as evidenced by increased leaf size, greater canopy coverage, and a higher percentage of fruiting shoots.
In the case of Zn, the literature indicates that the recommended application ranges from 23 to 114 kg ha−1. However, some studies report that doses below 44 kg ha−1 may be sufficient to achieve an adequate foliar Zn concentration. These findings are consistent with the result of the present study, in which the maximum effective dose was 15.85 kg ha−1 [53].
Regarding Mo, information on optimal doses for the pecan tree is limited. Nevertheless, it has been reported that for other fruit trees, such as 10-year-old apple trees, a total dose of 1.7 Kg ha−1 is recommended [32]. This is comparable to the maximum dose evaluated in this study (1.99 kg ha−1).

5. Conclusions

Based on the results obtained from the study on the application of N, Mo, Zn, and Zn-Mo in pecan trees, the following conclusions can be drawn. Fertilization with these sources was effective in increasing the concentration of N, P, Ca, Mg, and Cu in the leaflets of pecan trees. The application of N showed a notable effect on nutrient concentration, confirming its essential role in plant growth and development, as well as the importance of nitrogen in nitrate availability and its influence on nutrient assimilation.
Enzymatic activity and photosynthetic pigments were affected, showing an increase in enzymes and pigments, with N and M application showing the greatest response. These fertilization sources play a key role in activating enzymes involved in nitrogen metabolism and other physiological processes of the plant.
Pomological parameters were also influenced by the application of the fertilization sources, with N having the most significant effect, followed by Mo and then Zn. Zinc deficiency in the leaves was observed and was related to increased doses of N and Mo. Although not statistically significant, the application of N had an effect on the development and growth of the plants (leaf size, leaf coverage, and percentage of fruiting shoots).
The quality and production of the nuts remained within acceptable parameters, with an effect from the application of fertilization source, primarily from N.
In summary, the study highlights the importance of balanced and well-managed fertilization to optimize pecan tree nutrition. The results suggest that the proper application of nitrogen, molybdenum, and zinc can significantly improve crop health and productivity, while careful management is necessary to avoid deficiencies and excesses that could negatively affect fruit quality and yield.

Author Contributions

J.M.S.-P. played a key role in data curation, performing the annotation, cleaning, and initial organization of the information generated in the study; he also applied statistical and computational formal analysis to the data and actively participated in the methodological design of the study. J.C.O.-M. contributed to the design of the study and the development methodology and was responsible for validation, ensuring the coherence and reproducibility of the results. R.M.Y.-M. contributed to data curation by organizing the information derived from the analyses and conducted laboratory tests, ensuring the accuracy and reliability of the experimental data. N.G.T.-B. was responsible for the investigation, participating in data collection and conducting experiments. L.C.N.-M. managed the project, coordinating team activities and ensuring the fulfillment of the established objectives. L.R.O.-M. actively participated in the investigation by supporting data collection and experimental procedures; in addition, she carried out the final validation of the results and oversaw the drafting of the original version of the manuscript, coherently and systematically integrating the contributions of the entire team. All authors have read and agreed to the published version of the manuscript.

Funding

This research received no external funding.

Data Availability Statement

The original contributions presented in the study are included in the article, further inquiries can be directed to the corresponding author.

Acknowledgments

We would like to thank the engineer Jorge Cuesta Manjarrez for the facilities necessary to conduct the experiment in the Esperanza orchard. In addition, we also thank the Faculty of Agricultural Technology for their support in conducting laboratory analyses.

Conflicts of Interest

The authors declare no conflicts of interest.

References

  1. Moran-Duran, S.A.; Flynn, R.P.; Heerema, R.; VanLeeuwen, D. Leaf net photosynthesis, leaf greenness, and shoot lignin content of nonbearing pecan trees at two nitrogen and nickel application rates. HortScience 2020, 55, 231–236. [Google Scholar] [CrossRef]
  2. Servicio de Información Agroalimentaria y Pesquera. Producción Agrícola. Historico de Siembra y Cosecha. Available online: https://nube.agricultura.gob.mx/cierre_agricola/ (accessed on 22 September 2024).
  3. Wells, M.L. Pecan Response to Nitrogen Fertilizer Source. HortScience 2021, 56, 368–373. [Google Scholar] [CrossRef]
  4. Balandran-Valladares, M.I.; Cruz-Alvarez, O.; Jacobo-Cuellar, J.L.; Hernandez-Rodriguez, O.A.; Flores-Cordova, M.A.; Parra-Quezada, R.A.; Sanchez-Chavez, E.; Ojeda-Barrios, D.L. Changes in nutrient concentration and oxidative metabolism in pecan leaflets at different doses of zinc. Plant. Soil Environ. 2021, 67, 33–39. [Google Scholar] [CrossRef]
  5. Núñez-Moreno, J.H.; Walworth, J.; Pond, A.; Kilby, M. Effect of nitrogen rates on ‘Western’ pecan tree development. Acta Hortic 2019, 1217, 103–110. [Google Scholar] [CrossRef]
  6. Hounnou, L.; Wade-Brorsen, B.; Biermacher, J.T.; Rohla, C.T. Foliar applied zinc and the performance of pecan trees. J. Plant Nutr. 2019, 42, 512–516. [Google Scholar] [CrossRef]
  7. Walworth, J.L.; White, S.A.; Comeau, M.J.; Heerema, R.J. Soil-applied ZnEDTA: Vegetative growth, nut production, and nutrient acquisition of immature pecan trees grown in an alkaline, calcareous soil. HortScience 2017, 52, 301–305. [Google Scholar] [CrossRef]
  8. Ortega-Montes, F.I.; Rubio-Arias, H.O.; Clemente-Sanchez, F.; Uranga-Valencia, L.P. Cost-benefit analysis of the best combination of organic and inorganic sources to supply zinc deficiency in pecan (Carya illinoinensis [wangenh] k. Koch). ECORFAN J. 2023, 14, 55–59. [Google Scholar] [CrossRef]
  9. Dos Santos, A.J.; Confortin, T.C.; Todero, I.; Rodrigues, A.S.; Ribeiro, S.R.; Sasso, S.R.; Canabarro, N.I.; Wnager, R.; Cichoski, A.J.; Mazutti, M.A.; et al. Use of compressed fluids in the recovery of pecan nut cake oil: Influence of extraction conditions on yield and extract quality. J. Supercrit. Fluids 2020, 161, 104820. [Google Scholar] [CrossRef]
  10. Rana, M.S.; Bhantana, P.; Imran, M.; Saleem, M.H.; Moussa, M.G.; Khan, Z.; Imran, K.; Alam, M.; Abbas, M.; Binyamin, R.; et al. Molybdenum potential vital role in plants metabolism for optimizing the growth and development. Ann. Environ. Sci. Toxicol. 2020, 4, 32–44. [Google Scholar]
  11. Muñoz-Márquez, E.; Soto-Parra, J.M.; Noperi-Mosqueda, L.C.; Sánchez, E. Application of molybdenum nanofertilizer on the nitrogen use efficiency, growth and yield in green beans. Agronomy 2022, 12, 3163. [Google Scholar] [CrossRef]
  12. Fageria, N.K.; Filho, M.B.; Moreira, A.; Guimarães, C.M. Foliar fertilization of crop plants. J. Plant Nutr. 2009, 32, 1044–1064. [Google Scholar] [CrossRef]
  13. Dincă, L.C.; Grenni, P.; Onet, C.; Onet, A. Fertilization and soil microbial community: A review. Appl. Sci. 2022, 12, 1198. [Google Scholar] [CrossRef]
  14. Fernández, V.; Brown, P.H. From plant surface to plant metabolism: The uncertain fate of foliar-applied nutrients. Front. Plant Sci. 2013, 4, 289. [Google Scholar] [CrossRef] [PubMed]
  15. Niu, J.; Liu, C.; Huang, M.; Liu, K.; Yan, D. Effects of foliar fertilization: A review of current status and future perspectives. J. Soil Sci. Plant Nutr. 2021, 21, 104–118. [Google Scholar] [CrossRef]
  16. Orozco-Meléndez, L.R.; Hernández-Rodríguez, O.A.; Cruz-Alvarez, O.; Benavides-Mendoza, A.; Calderón-Jurado, M.; Ojeda-Barrios, D.L. Does the application of growth bioregulators improve the foliar concentration of nutrients, non-structural carbohydrates and yield in pecan? Ciênc. Agrotec. 2021, 45, e004721. [Google Scholar] [CrossRef]
  17. Torres-Beltran, N.G.; Yañez-Munoz, R.M.; Soto-Parra, J.M.; Noperi-Mosqueda, L.C. Nutritional standards through Integrated Differential Diagnosis (IDD) in pomegranate (Punica granatum L.). Not. Bot. Horti Agrobot. Cluj-Napoca 2023, 51, 12988. [Google Scholar] [CrossRef]
  18. Chávez, E.S. Caracterización del Estado Nutricional y Fisiológico en Plantas de Judía (Phaseolus vulgaris L. cv. Strike) Sometidas a un Estrés por Nitrógeno. Ph.D. Thesis, Universidad de Granada, Granada, Spain, 2006. Available online: https://digibug.ugr.es/bitstream/handle/10481/1348/16475185.pdf?sequence=1&isAllowed=y (accessed on 23 June 2025).
  19. Krywult, M.; Bielec, D. Method of measurement of nitrate reductase activity in field conditions. J. Ecol. Eng. 2013, 14, 1. [Google Scholar]
  20. NMX-FF-084-SCFI-2009. Norma Oficial Mexicana. Productos Alimenticios no Industrializados Para Consumo Humano—Fruto Fresco—Nuez Pecanera Carya illinoensis (Wangenh) K. Koch—Especificaciones y Métodos de Prueba. 2009. Available online: http://comenuez.com (accessed on 22 September 2024).
  21. Vargas, H.M.; Zarate, D.L.G.P.; Burguete, H.F. Factoriales fraccionados y superficie de respuesta, uso de paquetes estadísticos para microcomputadoras. Monogr. Man. Estadística Cómputo. 1991, 10, 1. [Google Scholar]
  22. Oviedo-Mireles, J.C.; Yáñez-Muñoz, R.M.; Soto-Parra, J.M.; Sanchez, E.; Perez-Leal, R.; Noperi-Mosqueda, L.C. Salicylic acid and nutrient sprays to improve apple fruit quality. Not. Bot. Horti Agrobot. Cluj-Napoca 2022, 50, 12841. [Google Scholar] [CrossRef]
  23. Smith, M.W.; Rohla, C.T.; Goff, W.D. Pecan leaf elemental sufficiency ranges and fertilizer recommendations. HortTechnology 2012, 22, 594–599. [Google Scholar] [CrossRef]
  24. Muñoz-Márquez, E.; Soto-Parra, J.M.; Pérez-Leal, R.; Sánchez-Chávez, E. New Nitrogen Use Efficiency Indices for Biomass Formation and Productivity in Green Beans Under Foliar Fertilization with Molybdenum Nanofertilizer. Nitrogen 2024, 5, 667–687. [Google Scholar] [CrossRef]
  25. Soto-Parra, J.M.; Piña-Ramírez, F.J.; Sánchez-Chávez, E.; Pérez-Leal, R.; Basurto-Sotelo, M. Alternativas orgánicas para disminuir la aplicación de nitrógeno en nogal pecanero. Nova Sci. 2016, 8, 140–161. [Google Scholar] [CrossRef]
  26. Li, Z.; Zhang, R.; Xia, S.; Wang, L.; Liu, Ch.; Zhang, R.; Fan, Z.; Chen, F.; Liu, Y. Interactions between N, P and K fertilizers affect the environment and the yield and quality of satsumas. Glob. Ecol. Conserv. 2019, 19, e00663. [Google Scholar] [CrossRef]
  27. Lal, M.A. Nitrogen metabolism. In Plant physiology, Development and Metabolism; Bhatla, S.C., Lal, M.A., Eds.; Springer Nature: Singapore, 2018; pp. 295–334. [Google Scholar] [CrossRef]
  28. Rietra, R.P.J.J.; Heinen, M.; Dimkpa, C.O.; Bindraban, P.S. Effects of nutrient antagoinism and synergism on yield and fertilizer use efficiency. Commun. Soil Sci. Plant Anal. 2017, 48, 1895–1920. [Google Scholar] [CrossRef]
  29. Bonomelli, C.; de Freitas, S.T.; Aguilera, C.; Palma, C.; Garay, R.; Dides, M.; Brosssard, N.; O’Brien, J.A. Ammonium excess leads to Ca restrictions, morphological changes, and nutritional imbalances in tomato plants, which can be monitored by the N/Ca ratio. Agronomy 2021, 11, 1437. [Google Scholar] [CrossRef]
  30. Wang, J.; Geng, Y.; Zhang, J.; Li, L.; Guo, F.; Yang, S.; Yang, S.; Wan, S. Increasing Calcium and Decreasing Nitrogen Fertilizers Improves Peanut Growth and Productivity by Enhancing Photosynthetic Efficiency and Nutrient Accumulation in Acidic Red Soil. Agronomy 2023, 13, 1924. [Google Scholar] [CrossRef]
  31. Wang, T.; Chen, X.; Ju, C.; Wang, C. Calcium signaling in plant mineral nutrition: From uptake to transport. Plant Commun. 2023, 4, 100678. [Google Scholar] [CrossRef]
  32. Wöjcik, P. Effects of molybdenum sprays on the growth, yield and fruit quality of ‘Red Jonaprince’ apple trees. Sci. Hortic. 2020, 271, 109422. [Google Scholar] [CrossRef]
  33. De Sousa Ferreira, L.; De Souza Oliveira, V.; De Paula Marchiori, J.J.; Ferreira, T.C.; Bernabé, A.C.B.; Boone, G.T.F.; Do Santos Pereira, L.L.; Carriço, E. The Nutrient Magnesium in Soil and Plant: A Review. Int. J. Plant Soil Sci. 2023, 35, 136–144. [Google Scholar] [CrossRef]
  34. Yruela, I. Copper in plants: Acquisition, transport and interactions. Funct. Plant Biol. 2009, 36, 409–430. [Google Scholar] [CrossRef]
  35. Wagle, P.; Smith, M.W.; Wood, B.W.; Rohla, C.T. Supplemental foliar nickel and copper applications do not reduce kernel necrosis in pecan trees receiving excess nitrogen. Commun. Soil Sci. Plant Anal. 2011, 42, 2219–2228. [Google Scholar] [CrossRef]
  36. Ahmad, I.; Zhu, G.; Zhou, G.; Song, X.; Hussein-Ibrahim, M.E.; Ibrahim-Salih, E.G. Effect of N on growth, antioxidant capacity, and chlorophyll content of sorghum. Agronomy 2022, 12, 501. [Google Scholar] [CrossRef]
  37. Hippler, F.W.; Boaretto, R.M.; Dovis, V.L.; Gomes, G.O.; Quaggio, J.A.; Quinones, A.; Mattos, D., Jr. Revisiting nutrient management for Citrus production: To what extent does molybdenum affect nitrogen assimilation of trees? Sci. Hortic. 2017, 225, 462–470. [Google Scholar] [CrossRef]
  38. Keshavarz, K.; Vahdati, K.; Samar, M.; Azadegan, B.; Brown, P.H. Foliar application of zinc and boron improves walnut vegetative and reproductive growth. HortTechnology 2011, 21, 181–186. [Google Scholar] [CrossRef]
  39. Márquez-Quiroz, C.; López-Espinosa, S.T.; Sánchez-Chávez, E.; García-Bañuelos, M.L.; la Cruz-Lazaro, D.; Reyes-Carrillo, J.L. Effect of vermicompost tea on yield and nitrate reductase enzyme activity in saladette tomato. J. Soil Sci. Plant Nutr. 2014, 14, 223–231. [Google Scholar] [CrossRef]
  40. Ponce-García, C.O.; Soto-Parra, J.M.; Sánchez-Chávez, E.; Muñoz-Márquez, E.; Piña-Ramírez, F.J.; Flores-Córdova, M.A.; Pérez-Leal, R.; Yáñez-Muñoz, R.M. Efficiency of nanoparticle, sulfate, and zinc-chelate use on biomass, yield, and nitrogen assimilation in green beans. Agronomy 2019, 9, 128. [Google Scholar] [CrossRef]
  41. Aitlessov, K.; Zhumabekova, B.; Sagyndykov, U.; Tuyakbayeva, A.; Bitkeyeva, A.; Bazarbaeva, K.Z.; Mukhtarov, A.; Nurbekova, Z.; Satkanov, M.; Kulatayeva, M.; et al. Foliar Fertilization with Molybdate and Nitrate Up-Regulated Activity of Nitrate Reductase in Lemon Balm Leaves. Horticulturae 2023, 9, 1325. [Google Scholar] [CrossRef]
  42. Imran, M.; Sun, X.; Hussain, S.; Ali, U.; Rana, M.S.; Rasul, F.; Saleem, M.H.; Moussa, M.G.; Hu, C.X. Molybdenum-induced effects on nitrogen metabolism enzymes and elemental profile of winter wheat (Triticum aestivum L.) under different nitrogen sources. Int. J. Mol. Sci. 2019, 20, 3009. [Google Scholar] [CrossRef]
  43. Sun, J.; Zhao, Y.; Qin, X.; Hu, Z.; Li, J.; Guo, Y.; Sun, G.; Chen, Z.; Huang, H.; Hu, C.; et al. Combined effect of molybdenum and nitrogen fertilization on nitrogen metabolism and amino acid content in tobacco leaves. Front. Agron. 2024, 6, 1427571. [Google Scholar] [CrossRef]
  44. Fu, Y.F.; Zhang, Z.W.; Yang, X.Y.; Wang, C.Q.; Lan, T.; Tang, X.Y.; Chen, G.D.; Zeng, J.; Yuan, S. Nitrate reductase is a key enzyme responsible for nitrogen-regulated auxin accumulation in Arabidopsis roots. Biochem. Biophys. Res. Commun. 2020, 532, 633–639. [Google Scholar] [CrossRef]
  45. Lu, S.; Zhuo, C.; Wang, X.; Guo, Z. Nitrate reductase (NR)-dependent NO production mediates ABA-and H2O2-induced antioxidant enzymes. Plant Physiol. Biochem. 2014, 74, 9–15. [Google Scholar] [CrossRef] [PubMed]
  46. Chen, M.; Zhu, K.; Tan, P.; Liu, J.; Xie, J.; Yao, X.; Chu, G.; Peng, F. Ammonia-nitrate mixture dominated by NH4±N promoted growth, photosynthesis and nutrient accumulation in pecan (Carya illinoinensis). Forests 2023, 12, 1808. [Google Scholar] [CrossRef]
  47. Escudero-Almanza, D.J.; Ojeda-Barrios, D.L.; Cruz-Alvarez, O.; Hernández-Rodríguez, O.A.; Ortiz-Rivera, Y. ZIP proteins related to zinc metabolism in plants. In Zinc in Plants: Current Knowledge and Recent Advances; Academic Press: Cambridge, MA, USA, 2025; pp. 173–192. [Google Scholar] [CrossRef]
  48. Rutkowski, K.; Lysiak, G.P. Effect of nitrogen fertilization on tree growth and nutrient content in soil and cherry leaves (Prunus cerasus L.). Agriculture 2023, 13, 578. [Google Scholar] [CrossRef]
  49. Wang, Y.; Heerema, R.J.; Walworth, J.L.; Dungan, B.; VanLeeuwen, D.; Holguin, F.O. Nutraceutical properties of pecan kernels are affected by soil zinc fertilizer application. HortScience 2020, 55, 2001–2007. [Google Scholar] [CrossRef]
  50. Heerema, R.J.; VanLeeuwen, D.; Thompson, M.Y.; Sherman, J.D.; Comeau, M.J.; Walworth, J.L. Soil-application of Zinc-EDTA increases leaf photosynthesis of immature ‘Wichita’ pecan trees. J. Am. Soc. Hortic. Sci. 2017, 142, 27–35. [Google Scholar] [CrossRef]
  51. Noperi-Mosqueda, L.C.; Soto-Parra, J.M.; Sánchez- Chávez, E.; Navarro-León, E.; Pérez-Leal, R.; Flores-Córdova, M.A.; Salas-Salazar, N.A.; Yáñez-Muñoz, R.M. Yield, quality, alternate bearing and long-term yield index in pecan, as a response to mineral and organic nutrition. Not. Bot. Horti Agrobo. 2020, 48, 342–353. [Google Scholar] [CrossRef]
  52. Soto, J.M.; Sánchez, E.; Piña, F.J.; Basurto, M.; Yáñez, R.M.; Laos, T. Componentes del Rendimiento en Nogal Pecanero Bajo Fertilización Nitrogenada. In Proceedings of the XIV Simposio Hispamo-Luso de Nutrición Mineral de las Plantas, Madrid, Spain, 23–26 July 2012; pp. 104–110. [Google Scholar]
  53. Wood, B.W. Correction of zinc deficiency in pecan by soil banding. HortScience 2007, 42, 1554–1558. [Google Scholar] [CrossRef]
Figure 1. Effects of the application of edaphic and foliar fertilization on the nitrate content in leaves: effect of nitrogen (a); molybdenum (b); zinc (c); zinc–molybdenum (d); interaction of zinc and molybdenum (e); and interaction of zinc and zinc–molybdenum (f).
Horticulturae 11 00741 g001aHorticulturae 11 00741 g001b
Figure 2. Effects of the application of edaphic and foliar fertilization on the phosphorus content in leaves: effect of nitrogen (a); molybdenum (b); zinc (c); zinc–molybdenum (d); interaction of nitrogen and zinc–molybdenum (e); interaction of molybdenum and zinc–molybdenum (f); and interaction of zinc and zinc–molybdenum (g).
Horticulturae 11 00741 g002aHorticulturae 11 00741 g002b
Figure 3. Effects of the application of edaphic and foliar fertilization on the calcium content in leaves: effect of nitrogen (a); interaction of nitrogen and zinc–molybdenum (b); and interaction of molybdenum and zinc–molybdenum (c).
Horticulturae 11 00741 g003
Figure 4. Effects of the application of edaphic and foliar fertilization on the magnesium content in leaves: effect of nitrogen (a); molybdenum (b); interaction of molybdenum and zinc–molybdenum (c); and interaction of zinc and zinc–molybdenum (d).
Horticulturae 11 00741 g004
Figure 5. Effects of the application of edaphic and foliar fertilization on enzymatic activity. Content of NR-NO3: effect of nitrogen (a); effect of molybdenum (b); and effect of zinc (c). Content of NR-Mo: effect of molybdenum (d); effect of zinc (e); effect of interaction of nitrogen and molybdenum (f); effect of interaction of nitrogen and zinc (g); and effect of interaction of molybdenum and zinc (h).
Horticulturae 11 00741 g005aHorticulturae 11 00741 g005b
Figure 6. Effects of the application of edaphic and foliar fertilization on the chlorophyll a content concentrations in leaves: effect of nitrogen (a); molybdenum (b); zinc (c); interaction of nitrogen and molybdenum (d); interaction of nitrogen and zinc (e); and interaction of zinc and molybdenum (f).
Horticulturae 11 00741 g006
Figure 7. Effects of the application of edaphic and foliar fertilization on visual deficiency: effect of nitrogen (a); molybdenum (b); zinc (c); interaction of nitrogen and molybdenum (d); interaction of nitrogen and zinc (e); and interaction of molybdenum and zinc (f). Effect of application of edaphic and foliar fertilization on nuts per kilogram: effect of nitrogen (g); interaction of molybdenum and zinc–molybdenum (h); and interaction of zinc and zinc–molybdenum (i).
Horticulturae 11 00741 g007aHorticulturae 11 00741 g007b
Table 1. Factors and application levels in the Taguchi L16 design for soil and foliar fertilization.
LevelsFactors
Soil ApplicationFoliar Application
NMoZnZn-MoNMoZnZn-Mo
00.000.000.000.000.000.000.000.00
125.000.204.000.257.500.0250.7500.150
5125.001.0020.001.2537.500.1253.7500.750
10250.002.0040.002.5075.000.2507.5001.500
Simple mean125.001.0020.001.2537.500.1253.7500.750
Stock solution in mM500.0050.0052.7452.74500.0050.0052.7452.74
Table 2. Distribution of Taguchi L16 structure, soil and foliar applications (mM).
TreatmentSoil ApplicationFoliar Application
NMoZnZn-MoNMoZnZn-Mo
10.000.000.000.000.000.000.000.000
20.000.204.000.250.000.0250.7500.150
30.001.0020.001.250.000.1253.7500.750
40.002.0040.002.500.000.2507.5001.500
525.000.004.001.257.5000.000.7500.750
625.000.200.002.507.5000.0250.0001.500
725.001.0040.000.007.5000.1257.5000.000
825.002.0020.000.257.5000.2503.7500.150
9125.000.0020.002.5037.5000.003.7501.500
10125.000.2040.001.2537.5000.0257.5000.750
11125.001.000.000.2537.5000.1250.0000.150
12125.002.004.000.0037.5000.2500.7500.000
13250.000.0040.000.2575.0000.007.5000.150
14250.000.2020.000.0075.0000.0253.7500.000
15250.001.004.002.5075.0000.1250.7501.500
16250.002.000.001.2575.0000.2500.0000.750
Table 3. Distribution of Taguchi L16 structure, soil and foliar applications (kg ha−1).
TreatmentSoil ApplicationFoliar Application
NMoZnZn-MoNMoZnZn-Mo
10.000.000.00000.000.000.000.000.00
20.000.030.00070.410.000.010.340.24
30.000.150.00372.040.000.031.711.22
40.000.310.00744.080.000.063.412.45
51.600.000.00072.040.360.000.341.22
61.600.030.004.080.360.010.002.45
71.600.150.00740.000.360.033.410.00
81.600.310.00370.410.360.061.710.24
98.010.000.00374.082.400.001.712.45
108.010.030.00742.042.400.013.411.22
118.010.150.000.412.400.030.000.24
128.010.310.00070.002.400.060.340.00
1316.020.000.00740.410.360.003.410.24
1416.020.030.00370.000.360.011.710.00
1516.020.150.00074.080.360.030.342.45
1616.020.310.002.040.360.060.001.22
Table 4. Parameters for symptomatology and foliar development.
Foliar Symptomatology and Development Parameters
Percentage LevelsZinc
Deficiency
Leaf
Size
Foliar
Coverage
Fruiting
Shoots
0No deficiencyVery smallNo leavesOnly vegetative shoots
20IncipientSmallMinimal coverageVery few fruiting shoots
40LowMediumLow coverageFew fruiting shoots
60MediumNormalMediumDense fruiting shoots
80HighLargeHighSome fruiting shoots with nuts
100Very highVery largeVery highFruiting shoots with nuts
Table 5. Foliar nutritional content in Western pecan with the application of soil fertilization combined with foliar nutrition of nitrogen, molybdenum, zinc, and zinc–molybdenum.
Factors [kg ha−1]
N (A)Mo (B)Zn (D)Zn-Mo (E)
Eigenvalues162.500 T1.12523.7502.00Eigenvectors+/
Nitrogen  R2 0.2019, µ 1.97% (1.69–2.31) VR (1.76–2.49) → 2.47% X
6.5 U +1 +344/0
−34.5(−22.8)+4 V(−2)(+1) 75/2
[Frequency]431311 W
Dose/response96.430.8025.092.04Selection≥2
Nitrates  R2 0.6177, µ 1557.7 ppm (1095.5–2302.3) VR (1066.0–1510.0)     LY, P     → 1907.1 ppm
[Frequency]4 L,C Y3 L,C,E3 L,C,E2 L,C12
Dose/response202.92 **1.1527.71 **2.00 ** ≥2
Phosphorus  R2 0.4518, µ 0.140% (0.111–0.183) VR (0.10–0.14)   L, P   → 0.185%
[Frequency]4 L,C,E3 L,E3 L,E2 L,C12
Dose/response285.35 **1.16 *29.86 *1.93 ** ≥2
Potassium  R2 0.2086, µ 1.08% (0.83–1.83) VR (0.87–1.23)    L   → 1.39%
[Frequency]22408
Dose/response285.091.5636.281.94 ≥2
Calcium    R2 0.4106, µ 1.90% (1.02–2.60) VR (1.45–2.06)    L, C, P.    2.32%
[Frequency]4 L,E3 E0411
Dose/response223.801.28 * 30.821.94 * ≥2
Magnesium  R2 0.3105, µ 1.20% (0.79–1.49) VR (1.09–1.55)      P     → 1.30%
[Frequency]4 L,E3 L,E1 L,E3 C11
Dose/response162.50 **1.1323.752.00 ** ≥2
Sodium  R2 0.1894, µ 0.0154% (0.0040–0.0305) VR (0.028–0.039) 0.0282%
[Frequency]702110
Dose/response51.790.9523.742.08 ≥2
Iron  R2 0.7054, µ 71.2 ppm (50.0–137.5) VR (67.2–95.2) L, P → 126.8 ppm
[Frequency]3 E 3309≥2
Dose/response177.27 *1.2826.322.07 **
Manganese   R2 0.1871, µ 244.9 ppm (151.5–294.5) VR (146.8–208.0) → 250.7 ppm
[Frequency]422412
Dose/response228.051.1230.722.07 ≥2
  Zinc R2 0.5483, µ 21.4 ppm (14.0–30.0) VR (21.5–30.5)      L, C, P    → 40.7 ppm
[Frequency]323210
Dose/response211.06 *2.10 *27.362.75 ** ≥2
Copper R2 0.3317, µ 7.0 ppm (4.5–10.0) VR (4.7–6.7) L 7.9 ppm
[Frequency]4323 L12
Dose/response9.140.9629.272.37 * ≥2
SubtotalQ43272424Total 118 Z110 Z/8
Proportion +/−43/021/622/224/0
Selection7/117/114/117/11Factors/Variables22 Z/11
Factors
[Mm ha−1]
N [285.35] > Mo [1.28] > Zn [30.82] = Zn-Mo [2.37]
VariablesManganese (250.7 ppm) = Copper (7.9 ppm) = Phosphorus (0.185%) = Nitrates (1907.1 ppm) > Calcium (2.32%) = Nitrogen (2.47%) = Magnesium (1.30%)
T Simple mean of each factor. U Eigenvalues expressed as a percentage of the mean; values in parentheses correspond to the second eigenvalue and its respective eigenvector. V Each sign accounts for ±1 (0.375–0.500), ±2 (0.500–0.626), ±3 (0.625–0.875), ±4 (0.875–1.000). R2 Coefficient of determination. μ General mean (values in parentheses indicate the range of original values). X Estimated response variable value by regression. VR established reference ranges. Y Observed frequency for that variable. W Variables with values ≥10% of the total sum of positive eigenvalues (boxed) are selected. Q Within each variable, factors that are ≥20% of the eigenvalue frequency (boxed) are selected. * Significant factors (0.05 ≤ Pr ≤ 0.01). ** Highly significant (prob ≤ 0.01). Y Significant regression: linear (L), quadratic (C), product (P), and interactions between factors (A, B, D, E). Z Total frequency of eigenvalues for the set of variables. The underline was used to visuall separate the section of the table coresponding to evaluated variables, while the gray shading hihlights the numbers of replication used, emphasizing the statical relevance of the analyzed factors.
Table 6. Response surface probabilities for foliar nutritional content regression.
%mg kg−1
NPKCaMgNaN-NO3FeMnZnCu
Regression Y
Linear0.2102 Z0.00160.05900.01410.67300.23160.0002<0.00010.35330.00030.0082
Quadratic0.31310.60590.51730.06100.85630.77090.30550.15400.30340.02970.1875
Interaction0.81660.01060.97910.06000.00920.5794<0.0001<0.00010.77270.00180.6256
Total model0.49010.00160.45300.00620.08290.5598<0.0001<0.00010.5728<0.00010.0517
Residual X
Lack of fit0.48400.10390.52260.11420.18480.95060.05200.117600.7044<0.00010.0150
Parameters Y
Intercept
N<0.0001<0.0001<0.0001<0.0001<0.00010.0194<0.0001<0.0001<0.0001<0.0001<0.0001
MO0.26120.00100.93950.09950.00660.3392<0.00010.61990.38900.52970.4750
Zn0.73910.00090.94060.48550.02940.2106<0.00010.99010.49200.60350.4806
ZnMo0.5250.00320.78750.10320.01010.2552<0.00010.85940.45900.24430.5896
N20.62960.00020.92670.34930.28280.5524<0.00010.61200.70900.17910.0428
N*Mo0.32560.03320.93650.40600.18110.42660.00040.61860.57010.37860.5439
Mo20.76000.77200.98570.79060.63270.75920.60010.67280.94880.64010.8474
N*Zn0.75340.24440.97820.78460.32200.94350.06360.64100.86970.89090.9517
Zn*Mo0.68170.93810.92800.80000.59300.81000.62370.68260.99240.69200.8902
Zn20.74020.66670.92010.58980.48410.76200.22050.59560.86920.90680.9337
N*ZnMo0.54090.32170.96750.76770.61670.49660.06970.68650.81170.44420.7565
Mo*ZnMo0.61760.00200.77470.09650.02190.64820.51700.00490.48280.15900.3073
Zn*ZnMo0.32880.00150.94090.07560.01960.4296<0.00010.66260.27760.49690.3984
(ZnMo)20.30280.00170.97340.13350.01250.3116<0.00010.78980.25180.29330.4957
Factors X
N0.51050.00160.63510.12670.00360.5169<0.00010.02420.68950.04400.5751
Mo0.37480.01490.85820.01390.27920.6682<0.00010.27440.76820.01370.7280
Zn0.72480.04900.98600.44850.15350.3728<0.00010.80540.59940.56250.9836
ZnMo0.63720.00260.99530.07870.00360.7405<0.00010.00140.63400.00710.0588
Mean1.970.1401.081.901.200.0154115771.17244.9021.387.00
R20.20190.45180.20860.41060.31050.18940.61770.70540.18710.54830.3317
CV8.5510.2217.2914.6213.4961.7911.0814.9912.3711.8819.78
X F-distribution, Y t-Student distribution, Z not significant (Pr > 0.05) or significant (0.01 ≤ Pr ≤ 0.05) or highly significant (Pr < 0.01), * Multiplication.
Table 7. Enzymatic activity in the Western pecan with the application of soil fertilization combinations with foliar nutrition of nitrogen, molybdenum, and zinc.
Factors [kg ha−1]
N (A)Mo (B)Zn (D)Zn-Mo (E)
Eigenvalues162.500 T1.12523.7502.00Eigenvectors+/
Endogenous nitrate reductase  R2 0.7756, µ 1.13 µmoles NO2 g−1 p.f.h−1 (0.42–2.21) L Y,C,P → 3.36 X
333.0 U+3 V 33/0
−345.9+3+3 33/0
[Frequency]3 L,C,B,E3 L,C,E0 L,E0 L,C6
Dose/response196.52 **1.23 **28.33 **1.96 **Selection≥2
Nitrate reductase NO3  R2 0.5595, µ 11.60 µmoles NO2 g−1 p.f.h−1 (10.44–13.20) L,C,P 13.62
[Frequency]3 L Y 3 L,E3 L,E211 W
Dose/response141.87 **1.16 **20.49 **2.13 ** ≥2
Nitrate reductase Mo. R2 0.5922, µ 1.27 µmoles NO2 g−1 p.f.h−1 (0.67–2.22) L,C,P 2.84
[Frequency]4 B,D 3 C,D3 C010
Dose/response106.83 **1.17 **9.30 **2.06 ≥2
Nitrate reductase NO3-Mo  R2 0.3368, µ 2.17 µmoles NO2 g−1 p.f.h−1 (1.74–2.70) P 2.82
[Frequency]4 L42 E111
Dose/response17.85 *0.79 **31.45 *2.25 ≥2
Endogenous urease  R2 0.1705, µ 13.76 µmoles NH4 g−1 p.f. h−1 (12.19–16.39) 14.67
[Frequency]343010
Dose/response4.260.9627.852.01 ≥2
Urease  NH4-Ni, R2 0.2597, µ 13.76 µmoles NH4 g−1 p.f. h−1 (42.1–64.36) → 58.44
[Frequency]443 C011
Dose/response215.220.703.211.92 ≥2
Chlorophyll a  R2 0.9949, µ 7.05 µg cm2 (4.12–10.22) L, C, P 10.40
[Frequency]3 C,B,D,E4 C,D3 C010
Dose/response166.90 *0.01 *22.91 *1.99 ≥2
Chlorophyll b  R2 0.8244, µ 3.33 µg cm2 (2.42–4.63) 5.17
[Frequency]432312
Dose/response143.921.1918.332.30 ≥2
Chlorophyll a/b  R2 0.8928, µ 2.16 µg cm2 (0.89–2.61) 2.44
[Frequency]453012
Dose/response17.210.7530.672.08 ≥2
Carotenoids  R2 0.7487, µ 0.65 µg cm2 (0.42–0.86) → 0.83
[Frequency]422311
Dose/response275.100.8017.152.01 ≥2
Chlorophyll a/Carotenoids  R2 0.8194, µ 11.04 µg cm2 (7.80–16.09) 14.02
[Frequency]442010
Dose/response5.890.9328.352.09 ≥2
SubtotalQ 4939269Total 114 Z91 Z/23
Proportion +/−31/930/93/39/0
Selection10/1110/1110/117/11Factors/Variables18 Z/9
Factors
[Mm ha−1]
N [275.10] = Mo [1.17] > Zn [31.45]
VariablesChlorophyll a/b (2.44 µg cm2) = Chlorophyll b (5.17 µg cm2) > Nitrate reductase NO3 (13.62 µmoles NO2) = Carotenoids (0.83 µg cm2) > Urease NH4-Ni (58.44 µmoles NH4) > Chlorophyll a (10.40 µg cm2) = Endogenous urease (14.67 µmoles NH4) = Chlorophyll a/Carotenoids (14.02 µg cm2) = Nitrate reductase Mo (2.84 µmoles NO2)
T Simple mean of each factor. U Eigenvalues expressed as a percentage of the mean; values in parentheses correspond to the second eigenvalue and its respective eigenvector. V Each sign accounts for ±1 (0.375–0.500), ±2 (0.500–0.626), ±3 (0.625–0.875), ±4 (0.875–1.000). R2 Coefficient of determination. μ General mean (values in parentheses indicate the range of original values). X Estimated response variable value by regression. VR established reference ranges. Y Observed frequency for that variable. W Variables with values ≥10% of the total sum of positive eigenvalues (boxed) are selected. Q Within each variable, factors that are ≥20% of the eigenvalue frequency (boxed) are selected. * Significant factors (0.05 ≤ Pr ≤ 0.01). ** Highly significant (prob ≤ 0.01). Y Significant regression: linear (L), quadratic (C), product (P), and interactions between factors (A, B, D, E). Z Total frequency of eigenvalues for the set of variables. The underline was used to visuall separate the section of the table coresponding to evaluated variables, while the gray shading hihlights the numbers of replication used, emphasizing the statical relevance of the analyzed factors.
Table 8. Response surface probabilities for enzymatic analysis and foliar pigments.
Nitrate Reductase
(µmoles NO2 g−1 p.f. h−1)
Urease
µmoles
(NH4 g−1 p.f. h−1)
Leaf Pigments
µg cm2
Regression XEnd.NO3MoNO3MoEnd.NH4Chl aChlbChl tot Chl (a/b)CarotChl Tot/Carot
Linear<0.0001 Z0.0022<.00010.41490.47630.09620.05590.04700.26360.51500.76300.3873
Quadratic<0.00010.00090.00070.66160.39680.43660.02830.47660.22270.38960.59960.6691
Interaction<0.00010.00190.04180.00820.71780.39340.02680.77590.20490.53270.90470.7517
Total model<0.0001<0.0001<0.00010.04590.66640.21780.03250.57870.23220.53160.84760.6210
Residual X
Lack of fit0.55150.01180.00070.40920.22440.3581......
Parameters Y
Intercept
N<0.0001<0.0001<0.0001<0.0001<0.0001<0.00010.00160.04700.00910.01400.06130.0316
MO<0.00010.03350.46720.08860.46900.94170.15100.47660.32820.58730.50950.6313
Zn<0.00010.03020.64470.11360.33720.39240.90490.77590.81020.69630.62920.5726
ZnMo<0.00010.00020.91250.43190.40760.64010.25590.57870.45130.62010.56530.6181
N2<0.00010.26800.52340.37240.78320.50350.45770.64080.90740.46810.59180.5513
N*Mo0.00770.18640.15920.14780.21400.14920.04410.70910.41590.27180.57210.4045
Mo20.06240.58360.00790.68620.35800.10960.01870.86660.15700.33680.91980.5361
N*Zn0.01220.24500.01810.96910.55580.18380.02100.89000.17390.36060.96390.6856
Zn*Mo0.21090.65760.01180.55530.36570.10210.01820.91560.15940.31190.87400.5117
Zn20.07610.28900.00520.55170.43490.11950.01810.86730.15290.33260.99050.5915
N*ZnMo0.47660.28890.01180.39550.30000.09920.02770.86030.26060.27880.75180.4941
Mo*ZnMo<0.00010.67710.51110.89040.90920.29190.02880.77200.29340.26940.82350.8879
Zn*ZnMo<0.00010.00250.42370.14650.31440.50850.97450.52560.63140.43470.53410.5433
(ZnMo)2<0.00010.00240.36200.07530.28370.68940.62950.63070.82980.47000.58710.5061
Factors X
N<0.0001<0.00010.00040.06760.83000.25450.03080.82780.26250.47890.87110.8505
Mo<0.00010.00110.00500.00710.68780.58970.05530.69860.33820.55110.93070.6718
Zn<0.00010.00050.00210.01560.19020.38960.03290.67160.20700.66970.86200.4847
ZnMo<0.00010.00070.86410.21490.61230.28410.08700.68460.52360.48330.90270.873
Mean1.1311.601.272.1713.7653.047.053.3310.382.160.6516.42
R20.77560.63490.59220.33680.17050.25970.99490.82440.96020.89280.74870.8613
CV25.4329.6227.1319.6620.7618.134.3323.1310.2315.4527.8723.11
X F-distribution, Y t-Student distribution, Z not significant (Pr > 0.05) or significant (0.01 ≤ Pr ≤ 0.05) or highly significant (Pr < 0.01), * Multiplication.
Table 9. Pomological parameters in Western pecan with the application of soil fertilization combined with foliar nutrition of nitrogen, molybdenum, and zinc.
Factors [kg ha−1]
N (A)Mo (B)Zn (D)Zn-Mo (E)
Eigenvalues162.500 T1.12523.7502.00Eigenvectors+/−
Zinc deficiency R2 0.3293, µ 21.8% (3.3–46.7) L Y → 5.9% X
485.4 U+1 V+2+1 44/0
−1346(−1109)+3(−3)−1(+1) 84/4
[Frequency]4 C Y,B,D5 C,D3 C012 W
Dose/response6.55 *0.91 *28.612.01Selection ≥2
Leaflet size R2 0.1889, µ 55.4% (46.7–63.3) 71.9%
[Frequency]443011
Dose/response112.470.2028.322.08 ≥2
Foliar cover R2 0.2369, µ 61.5% (46.7–70.0) 82.1%
[Frequency]23207≥1
Dose/response118.411.736.682.71
Percentage of fruitful shoots R2 0.4416,12.3% (6.7–26.7) L, C, P 22.9%
[Frequency]533011
Dose/response110.711.604.172.40 ≥2
Percentage of kernel R2 0.2651, µ 57.1% (52.5–60.7) 60.4%
[Frequency]443 C011
Dose/response215.220.703.211.92 ≥2
Nuts per kilogram R2 0.4704, µ 166 (135–203) L, P 155
[Frequency]4 L3 E1 E4 L,C12
Dose/response186.56 *1.16 *26.84 **1.99 * ≥2
Nut weight R2 0.4900, µ 6.1 g (4.92–7.01) L, P 7.63 g
[Frequency]4 L2 E1 E4 L,C11
Dose/response323.28 *1.00 *25.91 **2.07 * ≥2
Yield  R2 0.3373 µ 121.0 kg ha−1 (7.9–425.4) L 464.3 kg ha−1
[Frequency]4330 L10
Dose/response152.671.0722.322.00 ≥2
SubtotalQ31261910Total 86 Z71 Z/15
Proportion +/−26/520/615/410/0
Selection8/88/86/88/8Factors/Variables14 Z/7
Factors
[Mm ha−1]
N [323.28] = Mo [1.73] > Zn [28.61]
VariablesPercentage of kernel (60.4) = Zinc deficiency (5.9%) = Nuts per kilogram (155) > Nut weight (7.63 g) > Percentage of fruitful shoots (22.9%) = Leaflet size (71.9%) > Yield (464.3 kg ha−1) > Foliar cover (82.1%)
T Simple mean of each factor. U Eigenvalues expressed as a percentage of the mean; values in parentheses correspond to the second eigenvalue and its respective eigenvector. V Each sign accounts for ±1 (0.375–0.500), ±2 (0.500–0.626), ±3 (0.625–0.875), ±4 (0.875–1.000). R2 Coefficient of determination. μ General mean (values in parentheses indicate the range of original values). X Estimated response variable value by regression. VR established reference ranges. Y Observed frequency for that variable. W Variables with values ≥10% of the total sum of positive eigenvalues (boxed) are selected. QWithin each variable, factors that are ≥20% of the eigenvalue frequency (boxed) are selected. * Significant factors (0.05 ≤ Pr ≤ 0.01). ** Highly significant (prob ≤ 0.01). Y Significant regression: linear (L), quadratic (C), product (P), and interactions between factors (A, B, D, E). Z Total frequency of eigenvalues for the set of variables. The underline was used to visuall separate the section of the table coresponding to evaluated variables, while the gray shading hihlights the numbers of replication used, emphasizing the statical relevance of the analyzed factors.
Table 10. Response surface probabilities for pomological parameters.
YieldDevelopment %
Regression YProduction
kg ha−1
Percentage of
Kernel
Nuts
kg−1
Nut
Weight
g
Zinc
Deficiency
Leaf Size Canopy Cover Fruiting Shoots
Linear0.0047 Z0.19920.00050.00030.02630.61230.33110.0024
Quadratic0.25850.19490.22940.15170.24900.36200.21790.0620
Interaction0.65480.34690.02470.02220.24440.47110.41450.0706
Total model0.04540.19870.00080.00040.05460.56270.31140.0023
Residual X
Lack of fit0.26860.1017<0.0001<0.00010.17680.55620.51290.4160
Parameters Y
Intercept
N0.0131<0.0001<0.0001<0.00010.3136<0.0001<0.00010.0005
MO0.18160.28920.01950.04220.26230.77410.43150.4879
Zn0.35060.11490.09030.17410.16620.96360.56110.2242
ZnMo0.41960.10930.14030.25300.21090.71790.21950.2152
N20.04900.17970.00440.00840.45190.77610.96050.7425
N*Mo0.82590.34400.17310.13020.00970.19440.86840.7134
Mo20.36200.92580.59030.93610.01700.14600.70840.3402
N*Zn0.30520.64770.43390.81100.05930.14700.6910.1820
Zn*Mo0.41530.68130.80160.82570.01500.15070.63740.2498
Zn20.36450.88180.52770.89210.02030.13270.64620.2554
N*ZnMo0.60860.51080.80760.57760.00630.12240.97640.5350
Mo*ZnMo0.23070.56040.63540.81670.69170.22170.71010.8061
Zn*ZnMo0.33980.10690.01370.02460.21030.74910.51790.3829
(ZnMo)20.39370.08590.02030.03850.25840.64570.30810.1883
Factors X
N0.66710.31440.01820.01770.08720.65070.70200.1388
Mo0.54190.06730.03710.03180.03530.59720.97960.3193
Zn0.85700.47730.00440.00400.15740.48470.48070.4049
ZnMo0.12520.53080.02660.03780.63880.62170.41660.1202
Mean120.957.11666.0921.7855.4261.4712.30
R20.33730.26510.47040.49000.32930.18890.23690.4416
CV72.833.058.287.8786.4019.4418.5748.78
X F-distribution, Y t-Student distribution, Z not significant (Pr > 0.05) or significant (0.01 ≤ Pr ≤ 0.05) or highly significant (Pr < 0.01), * Multiplication.
Table 11. Metasummary of the results of soil fertilization combined with foliar nutrition of nitrogen, molybdenum, and zinc.
Factors [kg ha−1]
N (A)Mo (B)Zn (D)Zn-Mo (E)
Eigenvalues162.500 T1.12523.7502.00Eigenvectors+/−
Foliar nutritional content (11 variables)
SubtotalQ43272424118
Proportion +/−43/021/622/224/0 110/8
Selection7/117/114/117/11 22/11
Factors
[Mm ha−1]
N [285.35] > Mo [1.28] > Zn [30.82] = Zn-Mo [2.37]
VariablesManganese (250.7 ppm) = Copper (7.9 ppm) = Phosphorus (0.185%) = Nitrates (1907.1ppm) > Calcium (2.32%) = Nitrogen (2.47%) = Magnesium (1.30%)
Enzymatic activity and leaf pigments (10 variables)
SubtotalQ4039269114
Proportion +/−31/930/923/39/0 91/23
Selection10/1110/1110/11 18/9
Factors
[Mm ha−1]
N [275.10] = Mo [1.17] > Zn [31.45]
VariablesChlorophyll a/b (2.44 µg cm2) = Chlorophyll b (5.17 µg cm2) > Nitrate reductase NO3 (2.82 µmoles NO2) = Carotenoids (0.83 µg cm2) > Urease NH4-Ni (58.44 µmoles NH4) > Chlorophyll a (10.40 µg cm2) = Endogenous urease (14.67 µmoles NH4) = Chlorophyll a/Carotenoids (14.02 µg cm2) = Nitrate reductase Mo (2.84 µmoles NO2)
Pomological parameters (8 variables)
SubtotalQ3126191086
Proportion +/−26/520/615/410/0 Z 71/15
Selection8/88/86/88/8 14/7
Factors
[Mm ha−1]
N [319.6] = Mo [1.73] > Zn [28.61]
VariablesPercentage of kernel (60.4) = Zinc deficiency (5.9%) = Nuts per kilogram (155) > Nut weight (7.63 g) > % Percentage of fruitful shoots (22.9%) = Leaflet size (71.9%) > Yield (464.3 kg ha−1) > Foliar cover (82.1%)
T Simple mean of each factor. Z Factors that are ≥ 20% of the total positive eigenvectors (boxed) are Q selected, and the highest dose inclusive for all response variables is chosen. N: nitrogen, Mo: molybdenum, Zn: zinc, Zn-Mo: zinc and molybdenum.
Disclaimer/Publisher’s Note: The statements, opinions and data contained in all publications are solely those of the individual author(s) and contributor(s) and not of MDPI and/or the editor(s). MDPI and/or the editor(s) disclaim responsibility for any injury to people or property resulting from any ideas, methods, instructions or products referred to in the content.

