Article

Integrative Genomic and Cytogenetic Analyses Reveal the Landscape of Typical Tandem Repeats in Water Hyacinth

1
College of Life Science, Fujian Normal University, Fuzhou 350117, China
2
College of Geography and Oceanography, Minjiang University, Fuzhou 350108, China
3
Biotechnology Research Institute, Fujian Academy of Agricultural Sciences, Fuzhou 350011, China
4
Queensland Alliance for Agriculture and Food Innovation, University of Queensland, Brisbane 4072, Australia
*
Author to whom correspondence should be addressed.
These authors contributed equally to this work.
Horticulturae 2025, 11(6), 657; https://doi.org/10.3390/horticulturae11060657
Submission received: 31 March 2025 / Revised: 1 June 2025 / Accepted: 7 June 2025 / Published: 10 June 2025
(This article belongs to the Special Issue Latest Advances and Prospects in Germplasm of Tropical Fruits)

Abstract

Tandem repeats in eukaryotic genomes exhibit intrinsic instability that drives rapid evolutionary diversification. However, their evolutionary dynamics in allopolyploid species such as the water hyacinth (Pontederia crassipes or Eichhornia crassipes) remain largely unexplored. Our study used integrated genomic and cytogenetic analyses of this allotetraploid species to characterize five representative tandem repeats, revealing distinct genomic distribution patterns and copy number polymorphisms. The highly abundant centromeric tandem repeat, putative CentEc, was co-localized with the centromeric retrotransposon CREc, indicating conserved centromeric architecture. Remarkably, putative CentEc sequences showed high sequence conservation (91–100%) despite subgenome divergence, indicative of active concerted evolution. Fluorescence in situ hybridization (FISH) analysis showed ubiquitous telomeric repeats across all chromosomes, while an interstitial chromosome region tandem repeat (ICREc) displayed chromosome-specific localization, both exhibiting copy number variation. Furthermore, differential rDNA organization was observed. 5S rDNA was detected on a single chromosome pair, whereas 35S rDNA exhibited multichromosomal distribution with varying intensities. A comparative analysis of subgenome-specific rDNA sequences revealed substantial heterogeneity in both 5S and 35S rDNA units, suggesting subgenome-biased evolutionary trajectories. Collectively, these findings elucidate the structural and evolutionary significance of tandem repeats in shaping the water hyacinth genome, highlighting mechanisms of concerted evolution and subgenome-biased adaptation in invasive polyploids.

1. Introduction

Pontederia crassipes (syn. Eichhornia crassipes), commonly known as water hyacinth, is a monocotyledonous aquatic plant belonging to the family Pontederiaceae, which is native to South America. It has spread widely and become naturalized across tropical and subtropical ecosystems [1]. Renowned for its exceptional invasive capabilities, P. crassipes has impacted human activities and outcompeted native species for ecological niches, leading the International Union for Conservation of Nature (IUCN) to list it among the most troublesome aquatic plants [2]. Paradoxically, emerging research highlights its dual ecological roles, as a biosorbent for pollutant remediation, a bioindicator of aquatic contamination, and a sustainable feedstock for compost production [3,4,5]. Recent chromosome-scale genome assembly (GenBank GCA_030549335.1) has confirmed its allotetraploid origin, establishing critical genomic infrastructure for investigating tandem repeat evolution in polyploid systems.
Typically, tandem repeats (TRs) refer to a sequence array formed by the repeated occurrence of basic repeating units connected head-to-tail, which constitute the major component of nuclear DNA in the genomes of most eukaryotic organisms [6,7]. Historically, these sequences were considered “junk DNA” due to their perceived lack of function [7]. However, an increasing body of research has uncovered their pivotal roles in various aspects of genomic structure, translational regulation, gene transcription, and development [7,8,9]. Satellite DNA, a type of highly amplified TR, exhibits significant variability in abundance, sequence composition, and chromosomal distribution, and is characterized by rapid evolutionary dynamics [10]. Satellite DNA is predominantly found in the subtelomeric, centromeric, and pericentromeric regions, with occasional occurrences in interstitial regions. The emergence of high-fidelity genomic data has provided novel insights into the evolution of centromeric satellite sequences across a diverse array of species, as illustrated by organisms including humans, rice, Arabidopsis thaliana, Pennisetum giganteum, and Erianthus rufpilus [11,12,13,14,15]. However, the influence of chromosomal karyotype evolution on centromeric satellite sequence evolution remains unclear in P. crassipes. Telomeres are the nucleoprotein structures at the ends of linear eukaryotic chromosomes, representing functionally essential regions [16]. Telomeric microsatellite repeats are relatively conserved across different organisms, with the TTTAGGG motif being common in most plants and TTAGGG in vertebrates [16]. However, many non-canonical telomeric repeats have been found in higher plants. Unlike the fast-evolving centromeric DNA proposed to drive rapid centromere protein evolution, telomeric DNA evolves comparatively slowly across eukaryotes [17]. The subtelomeric regions, adjacent to the telomeres, are some of the most dynamic and rapidly evolving parts of eukaryotic genomes [18]. However, studies on the molecular organization and evolution of subtelomeric repeats are rare.
Ribosomal DNA (rDNA) represents another class of important TRs, primarily comprising 5S and 35S rDNA in plants [19]. rDNA is a highly conserved family of repetitive sequences within plant genomes, typically found in clusters across one or more chromosomes [20]. Variations in rDNA sequences are often attributed to non-coding regions such as the non-transcribed spacers (NTS) of 5S rDNA and the intergenic spacer (IGS) of 35S rDNA. The 35S rDNA unit encompasses the 18S, 5.8S, and 25S rRNA genes [21], predominantly localized at nucleolar organizer regions, which are the secondary constriction sites on chromosomes, although occasionally observed at non-secondary constriction sites [22]. In most species, 5S rDNA exists as TRs physically separated from the remaining three genes of 35S rDNA, with a few exceptions [23]. Traditionally, rDNA is thought to undergo concerted evolution, wherein hundreds to thousands of rDNA units undergo a homogenization process, resulting in a genomic uniformity that exceeds expectations from mutation rates and gene redundancy [24]. Nevertheless, the mechanisms underlying the rapid evolution and extreme sequence homogeneity of these TRs in allopolyploids such as water hyacinth remain poorly understood.
Identifying tandem repeat sequences through whole-genome sequencing has become a more practical approach for most eukaryotic species [25]. Nonetheless, the assembly of these repeats is technically challenging, time-consuming, and expensive, especially for species with very large or highly complex polyploid genomes [25,26]. An alternative approach combining next-generation sequencing (NGS) with fluorescence in situ hybridization (FISH) has been proposed, which has opened the door to studying the landscape of many plant species’ typical TRs, previously unexplored in cytogenetic studies [27]. For instance, 279,480 repeat clusters were identified from 10 million reads, representing various repeat families in the combined genomes of Saccharum spontaneum SES208 and S. officinarum LA Purple [28]. In fact, this method has already proven successful in the analysis of complex genomes of various plants, including species such as sugarcane, quinoa, okra, switchgrass, Fabeae, and A. thaliana [29,30,31,32,33].
In this study, we conducted an in-depth analysis to elucidate the structural and evolutionary characteristics of five typical TRs within the allotetraploid water hyacinth genome. Our observations revealed a non-random genomic distribution pattern. Notably, a highly abundant putative centromeric tandem repeat sequence was found to exhibit remarkable homogeneity across the two subgenomes. Telomeric DNA displayed variability in copy numbers, and the interstitial chromosome regions showed significant inter-chromosomal abundance differences. Furthermore, we confirmed the distinct chromosomal localization patterns of the 5S and 35S rDNA sequences, as well as their heterogeneity in copy numbers and sequences within the two subgenomes. We also identified persistent technical challenges in assembling these canonical repeats. Collectively, these findings enrich our understanding of the characteristics of canonical TRs and their evolutionary dynamics within the context of the allopolyploid genome.

2. Materials and Methods

2.1. Plant Materials and Genomic DNA Extraction

In this study, the asexual clone plant material of P. crassipes (Mart.) Solms, with a chromosome count of 2n = 4× = 32 (Figure S1), was sourced from the lake at Minjiang University, Fujian, and then cultivated in a greenhouse. We received permission from the university’s service and management office to conduct our sampling. The voucher specimen for this plant material was deposited in the herbarium of Minjiang University. The CTAB method was used to harvest and process fresh leaves for DNA extraction.

2.2. De Novo Identification of Genomic Repeats and Chromosome Distribution Analysis

Initially, we obtained the NGS water hyacinth data (accession number SRX23120568) from the NCBI and conducted quality control using FastQC (v0.12.1). Low-quality reads were filtered using Trimmomatic (v0.36) with parameters SLIDINGWINDOW:4:15, LEADING:3, TRAILING:3, and MINLEN:36, resulting in high-quality data for repeat identification. For de novo identification of genomic repeats, RepeatExplorer2 (v2.3.7) [27] and its specialized module TAREAN (v2.3.7) were employed for clustering analysis, ensuring robust classification of repeat families. Paired-end read processing was enabled (requiring interlaced left- and right-end reads with complete pairs), and 2 million pairs of 150 bp reads were randomly selected from the dataset. Clustering was performed with default settings (90% sequence identity and minimum overlap length of 55 bp) to group nodes with similar distribution patterns into the same repeat sequence family. The Viridiplantae-specific REXdb (v4.0) database was used for annotating transposable elements, and all advanced settings were left at default. In parallel, the water hyacinth whole-genome assembly data (GenBank accession GCA_030549335.1), assembled using PacBio HiFi sequencing, were obtained from the NCBI for subsequent chromosome distribution analysis. Circos (http://circos.ca/, accessed on 23 May 2024) was used to visualize genomic enrichment patterns across chromosomes [34]. Chromosomal tracks were proportionally arranged by length, and repeat density was displayed using a log2-normalized heatmap color scale. Specific tandem repeats were highlighted in dedicated tracks (coverage threshold ≥ 1 read/kb), setting track spacing to 0.05 r, the label font size to 12 pt, and 80% transparency for clarity. To further investigate sequence conservation and duplication within the genome, multiple sequence alignments of selected repetitive elements were conducted using DNAMAN (v6.0.3) with default parameters (CLUSTAL W algorithm, gap opening penalty = 10, gap extension penalty = 0.2). Intragenomic homology analysis was performed using BLAST in TBtools (v2.154) [35], with default parameters (E-value ≤ 1 × 10⁻⁵, word size = 11, BLOSUM62 matrix). The spatial distribution of homologous sequences across chromosomes was visualized using the Integrated Genome Browser (IGB) [36].

2.3. PCR Amplification and Probe Preparation

For putative CentEc, ICREc, and rDNA, PCR amplification was performed in a 20 μL volume containing 1× Ex Taq Buffer, 100 nM of each primer pair (Table S1), 2.5 U Ex Taq DNA polymerase (TaKaRa Bio, Kusatsu, Shiga, Japan), 200 μM dNTPs, and 20 ng genomic DNA. For telomere sequences, a PCR reaction was performed without a genomic DNA template in the same 20 μL volume using a 35 nt forward primer (TTTAGGG)5 and a 35 nt reverse primer (CCCTAAA)5 (Table S1). The PCR condition was as follows: an initial denaturation at 95 °C for 3 min, followed by 35 cycles of denaturation at 95 °C for 30 s, annealing at 55 °C for 30 s, and extension at 72 °C for 30 s, with a final extension at 72 °C for 10 min. Finally, the samples were held at 12 °C for storage. For 35S rDNA amplification, PCR was performed using the same reaction mixture and thermal cycling parameters, except that the extension step at 72 °C was prolonged to at least 8 min to ensure sufficient amplification of the target sequence. The PCR products were verified using 1% agarose gel electrophoresis. Sequence homogeneity of the amplified TRs was additionally assessed using RepeatExplorer2-based clustering analysis and pairwise alignments. Additionally, the resulting PCR products were labeled using nick translation with digoxigenin-dUTP (Roche Diagnostics, Basel, Switzerland) at a final concentration of 200 ng/µL, and were subsequently used as FISH probes in the chromosome localization experiments.

2.4. Chromosome Preparation and FISH

Chromosome preparation and FISH were conducted following previously described methods [31]. The water hyacinth root tips were treated with 8-hydroxyquinoline solution at room temperature for 2.5 h, followed by fixation in 3:1 ethanol: glacial acetic acid for 24 h. An enzymatic mixture, containing 2% cellulase Onozuka-R10 (Yakult Pharmaceutical, Tokyo, Japan) and 1% pectolyase from Aspergillus niger (Sigma-Aldrich Corp., St. Louis, MO, USA), was used to digest the root tips at room temperature for 2 h. The digested root tip suspension was dropped onto slides, and those slides with well-spread metaphase chromosomes were selected using a microscope and then stored at −20 °C until use. The chromosomes were denatured in a solution containing 70% formamide in 2× SSC at 70 °C for 70 s, followed by dehydration in a cold ethanol gradient (70%, 95%, and 100%, each for 3 min at −20 °C) and then air-drying on slides. Meanwhile, the probes were mixed with a hybridization buffer containing 50% formamide and 20% dextran sulfate in 2× SSC, and denatured at 95 °C for 7 min. The denatured probe mixture was subsequently applied to the pretreated slides and hybridized in a humidified chamber at 37 °C for at least 16 h. After hybridization, the slides were rinsed three times with 2× SSC for 5 min each and once with 1× PBS for 5 min. FISH signal detection was performed using a rhodamine-conjugated anti-digoxigenin antibody (Roche Diagnostics, Basel, Switzerland). The slides were then counterstained with DAPI and examined using an Olympus BX63 fluorescence microscope with an Olympus DP80 CCD camera. The images were processed using CellSens Dimension software (v3.1.1), and the contrast was adjusted using Adobe Photoshop CC (v2022, Adobe, https://www.adobe.com). These hybridization and washing conditions, including high-formamide and dextran sulfate concentration, stringent post-hybridization washes, and probe concentration adjustment, were optimized to enhance the signal-to-noise ratio and ensure specific hybridization signals.

3. Results

3.1. Genome-Wide Identification of the Typical Tandem Repeats in the Water Hyacinth Genome

To accurately identify the typical TRs in the water hyacinth genome, we employed a sequence similarity clustering analysis method based on NGS data. Specifically, we performed sequence similarity clustering analysis on 2 million randomly selected paired-end reads by using the RepeatExplorer2 software (v2.3.7), which resulted in the identification of 161 clustered repeat sequences. Various types of repetitive sequences, including TRs and transposable elements (TEs), exhibited distinct levels of genomic representation (Table S2). Repetitive sequences constituted 28.39% of the P. crassipes genome, with TEs accounting for the majority (17.99%). Among TEs, retrotransposons (16.41%) substantially outnumbered DNA transposons (1.58%). Within retrotransposons, Ty3-gypsy elements dominated at 9.04% genomic occupancy, contrasting sharply with Ty1-copia (4.73%), unclassified LTR elements (1.39%), and LINE elements (1.25%). In addition to TEs, TRs comprised 5.88% of the genome, primarily consisting of satellite DNA (5.43%), with minor contributions from 35S rDNA (0.43%) and 5S rDNA (0.02%). We found that TR sequences were located in specific regions of the chromosome, while TEs were dispersed throughout the chromosome (Figure S2). This distribution pattern was consistent with that observed in most eukaryotic organisms [11]. We focused on the typical tandem repeat sequences in P. crassipes. Among these sequences, two star-like pattern TR sequences (CL1 and CL5) were identified using the TAREAN software (v2.3.7) (Figure 1a,b). In addition, we identified three typical TR sequences: 5S rDNA (CL121), 35S rDNA (CL36 and CL48), and telomeric sequences (CL145). 35S rDNA from CL36 and CL48 displayed linear clustering characteristics (Figure 1c,d), with 18S, 5.8S, and 25S rDNA subunits forming contiguous segments in their assemblies, consistent with the canonical organization of the 35S ribosomal array (Figure S3). Meanwhile, 5S rDNA from CL121 exhibited a circular tandem pattern (Figure 1e), and the telomeric sequence CL145 showed a certain degree of star-like pattern (Figure 1f).
Among these sequences, CL1, which is 148 bp in length, accounted for the highest proportion in the genome, reaching 4.3% (Figure 1g,h). CL5, with a length of 172 bp, was the second most abundant, representing 1.1% of the genome (Figure 1g,h). The telomeric sequence CL145 had the lowest genomic abundance, only 0.014%, and its sequence length was 7 bp (Figure 1g,h). Furthermore, the 35S rDNA from CL36 and CL48 showed a higher GC content, at 62.83% and 63.35%, respectively, with sequence lengths of 3519 bp and 3643 bp, and genomic abundances of 0.27% and 0.17%, respectively (Figure 1g–i). However, CL1 had the lowest GC content at only 35.14% (Figure 1i). These genome-wide TR profiles provide the basis for investigating their chromosomal distributions and functional significance.

3.2. Chromosome Distribution Patterns of Candidate Typical Tandem Repeats in Water Hyacinth Genome

The recent public release of the water hyacinth genome assembly data has provided us with a unique opportunity to identify chromosomal distributions of these candidate typical TRs. Using blastn in TBtool software (v2.154), we aligned them to the water hyacinth genome assembly and found these repetitive sequences present in both subgenomes of the allotetraploid water hyacinth (Figure 2). We observed significant bias in the proportion of 5S rDNA (CL121) in subgenome B, while CL5 predominated in subgenome A, with the other three TRs evenly distributed across the two subgenomes (Figure 2a). In terms of chromosomal distribution, the most abundant TR, CL1, was predominantly localized to chromosomal central regions, with additional distributions observed at terminal regions of chromosomes 1A and 1B, while being completely absent in chromosomes 2A and 2B (Figure 2b). This distribution pattern aligns with the high genomic proportion and chromosomal distribution characteristics of most reported plant centromeric sequences, suggesting that CL1 may represent a presumed centromeric repeat sequence.
Telomeric sequences (CL145) were clustered at the ends of most chromosomes, while other non-tandem telomeric sequence-like elements were dispersed across chromosomal mid-regions (Figure 2b), in line with the conserved distribution of plant telomere sequences. The second most abundant TR, CL5, was localized to multiple sites on chromosome 8B, and preferentially occupied subtelomeric regions on other chromosomes (Figure 2b), indicating that CL5 may represent a putative TR of interstitial chromosome regions. For 5S rDNA (CL121) and 35S rDNA (CL36 and CL48), the former was exclusively localized to chromosomes 8A and 8B, whereas the latter was mainly concentrated near chromosomal termini (Figure 2b). Collectively, based on sequence identities and chromosomal distribution patterns, we successfully characterized these typical TRs as putative CentEc (CL1), ICREc (CL5), 35S rDNA (CL36/CL48), 5S rDNA (CL121), and telomeric repeats (CL145). Guided by these distinct distribution patterns, we next examined their structural organization: CentEc in centromeres, telomeric repeats, and ICREc at chromosome termini, and rDNA arrays.

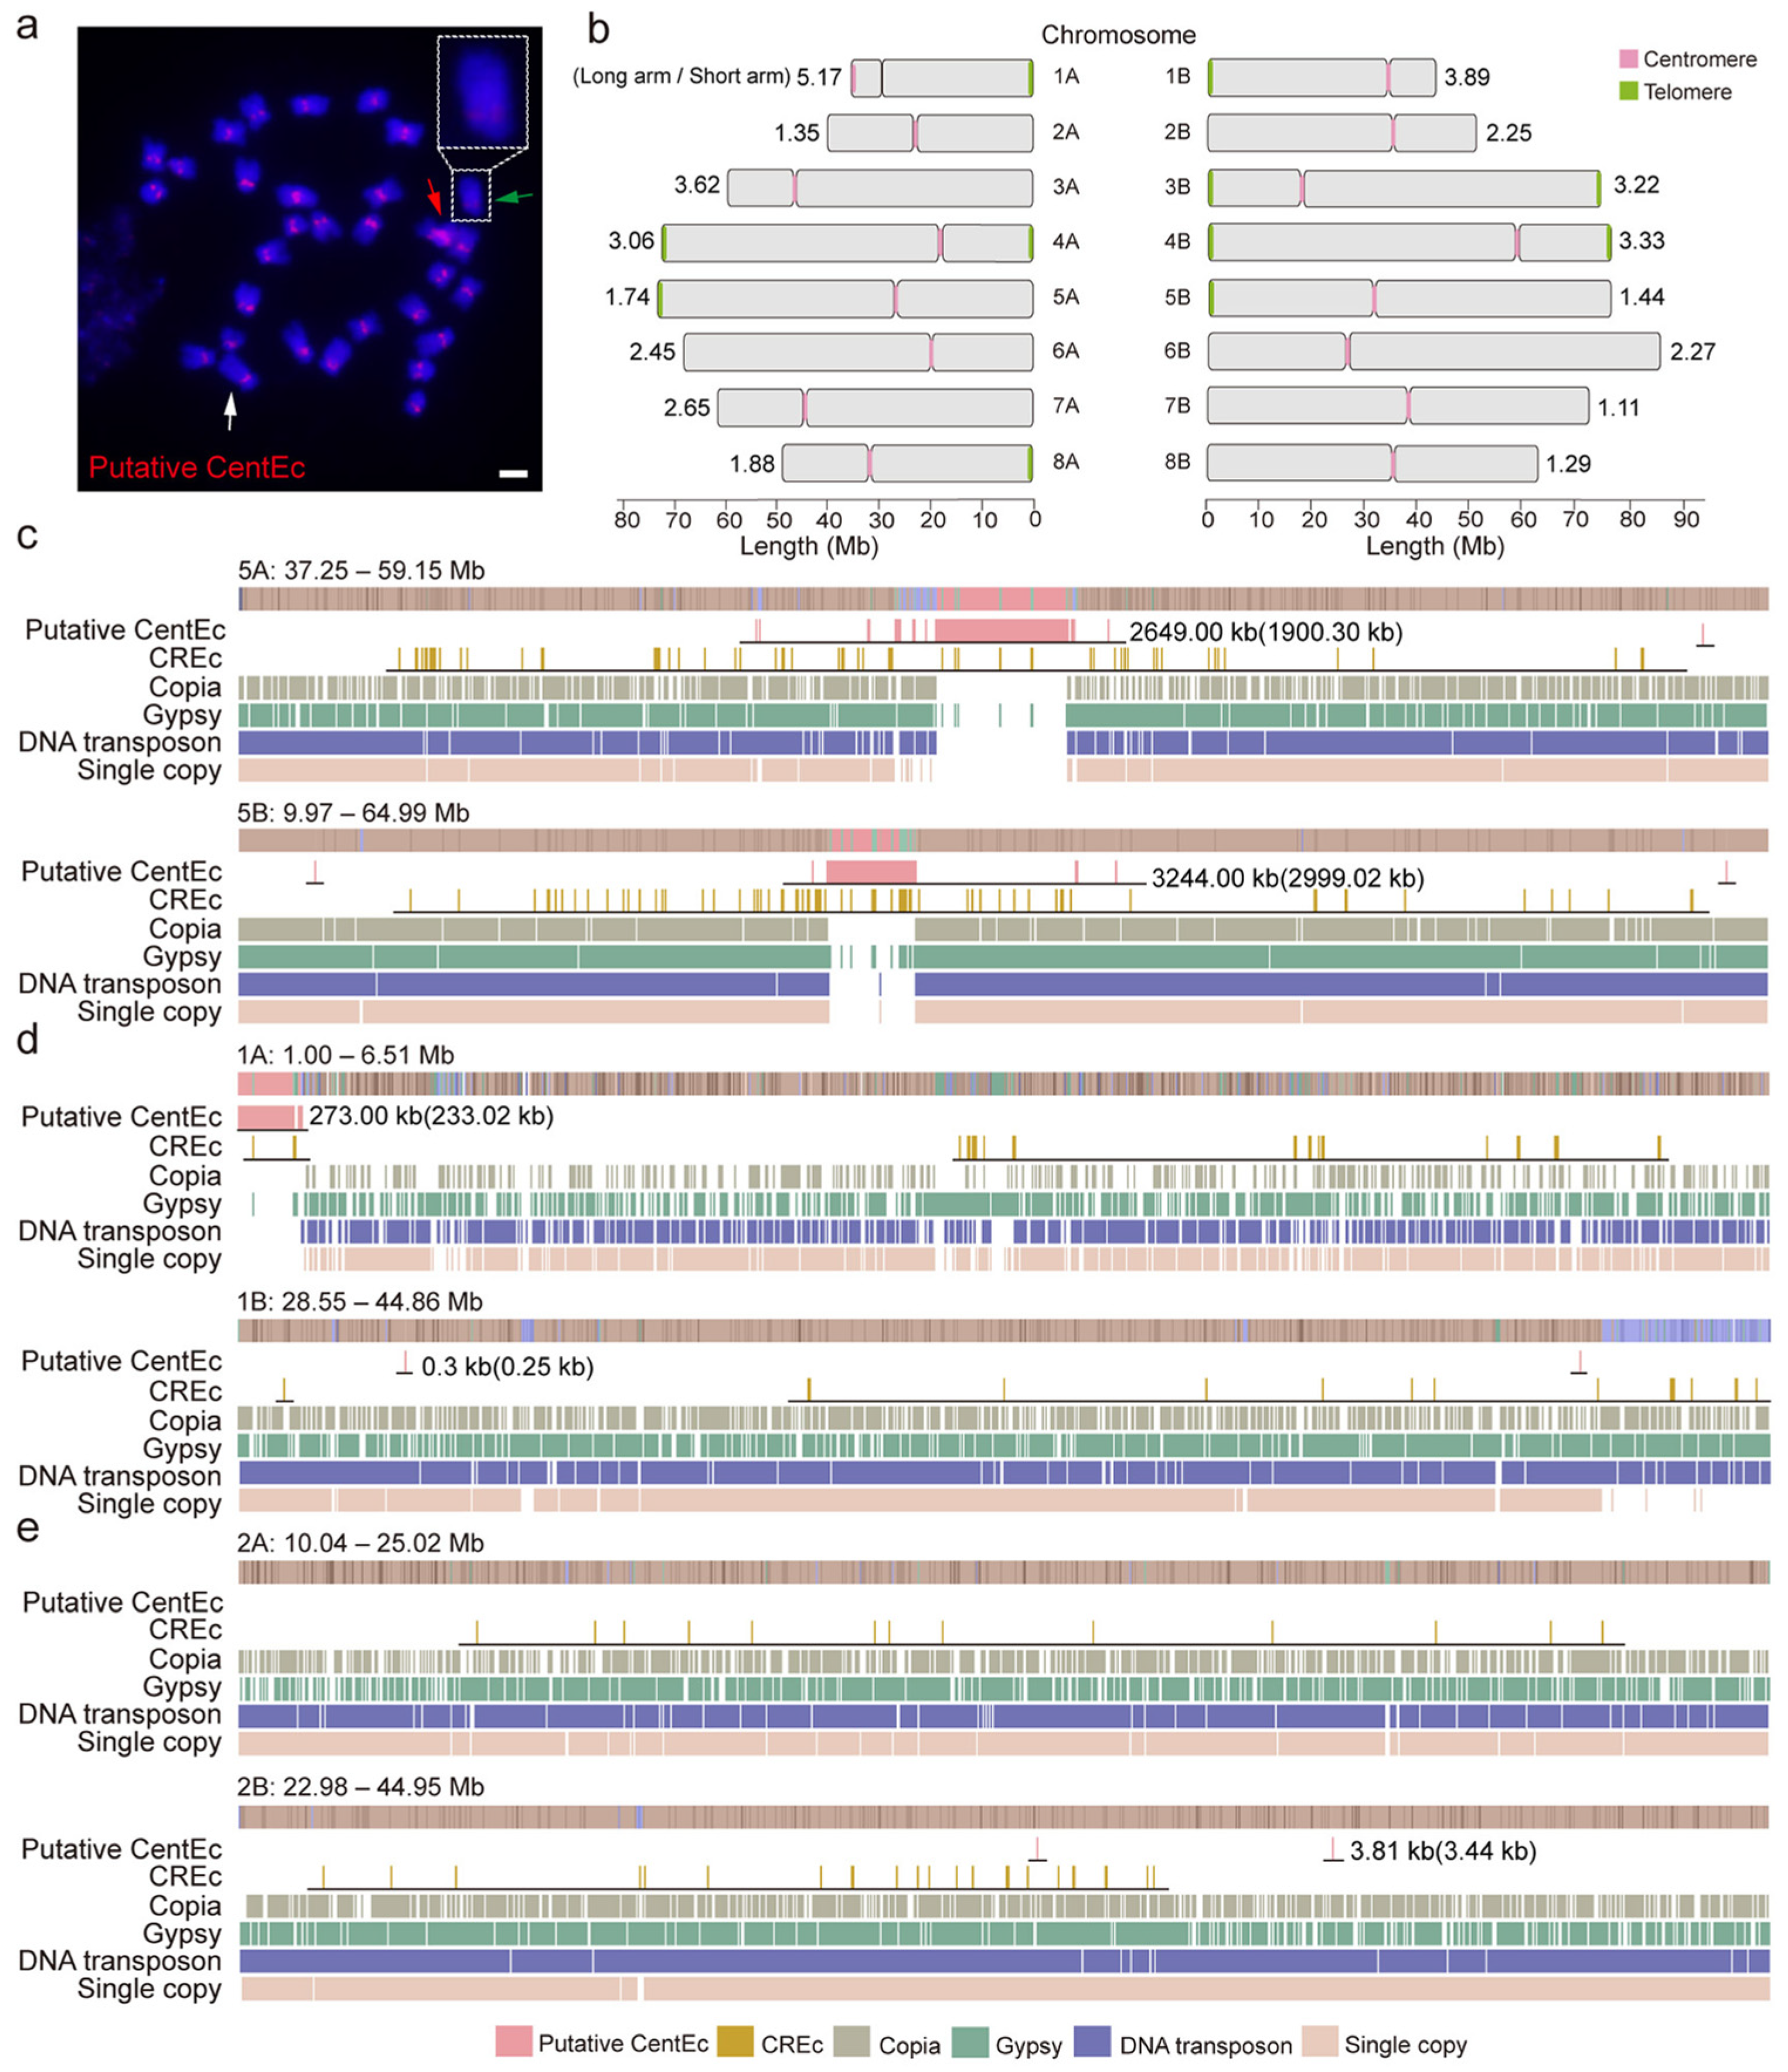
3.3. Genomic Structure of the Centromeric Tandem Repeat in the Water Hyacinth Genome

To ascertain the chromosomal distribution pattern of the candidate centromeric sequence (CentEc) in the water hyacinth genome, we conducted FISH analysis using the putative CentEc probes on metaphase chromosome spreads. Generally, centromeres are located in the primary constriction regions in plants [37]. Our FISH analysis demonstrated that putative CentEc probes localized to the primary constriction regions of P. crassipes (Figure 3a,b). Additionally, putative CentEc produced distinct signals in the central regions of all water hyacinth chromosomes, and the intensity of the signals varied across different chromosomes (Figure 3a), indicating variations in the copy number of putative CentEc among different chromosomes. The relative positions of the centromeres differed among the chromosomes, with the smallest and largest arm ratios (L/S ratio) being 5.17 (1A) and 1.11 (7B), respectively (Figure 3b). Upon alignment with the assembled water hyacinth genome, we observed that putative CentEc was interspersed with CREc retroelements and contained insertions of Copia and Gypsy retrotransposons, DNA transposons, and single-copy sequences (Figure 3c,e). Typically, centromeres consist of thousands of tandemly arranged satellite repeats interspersed with centromeric retrotransposons in plants [38]. Therefore, this observation further supports its classification as a centromeric TR.
The average length of putative CentEc was 1.31 Mb, with the longest on chromosome 5B (2.99 Mb) (Figure 3c, Table S3), and the shortest on chromosome 1B (0.25 kb) (Figure 3d, Table S3). Based on the abundance of putative CentEc (0−14.26%), chromosomes can be broadly categorized into two groups: those that are rich in putative CentEc sequences and those that are CentEc-poor (Figure 3c–e). Notably, extreme cases exist on chromosomes 1B, 2A, and 2B, characterized by the absence of putative CentEc arrays, as well as the erroneous assembly of putative CentEc arrays on chromosome 1A (Figure 2b and Figure 3d,e). These discrepancies with the FISH validation results suggest potential genome assembly errors of putative CentEc sequences on these chromosomes. Furthermore, we performed a sequence similarity analysis on the putative CentEc homologous sequences in the water hyacinth genome assembly and found that these homologous sequences have a very high degree of similarity, mainly ranging from 91% to 100%, indicating that the putative CentEc sequence is highly conserved in the water hyacinth genome (Figure S4).

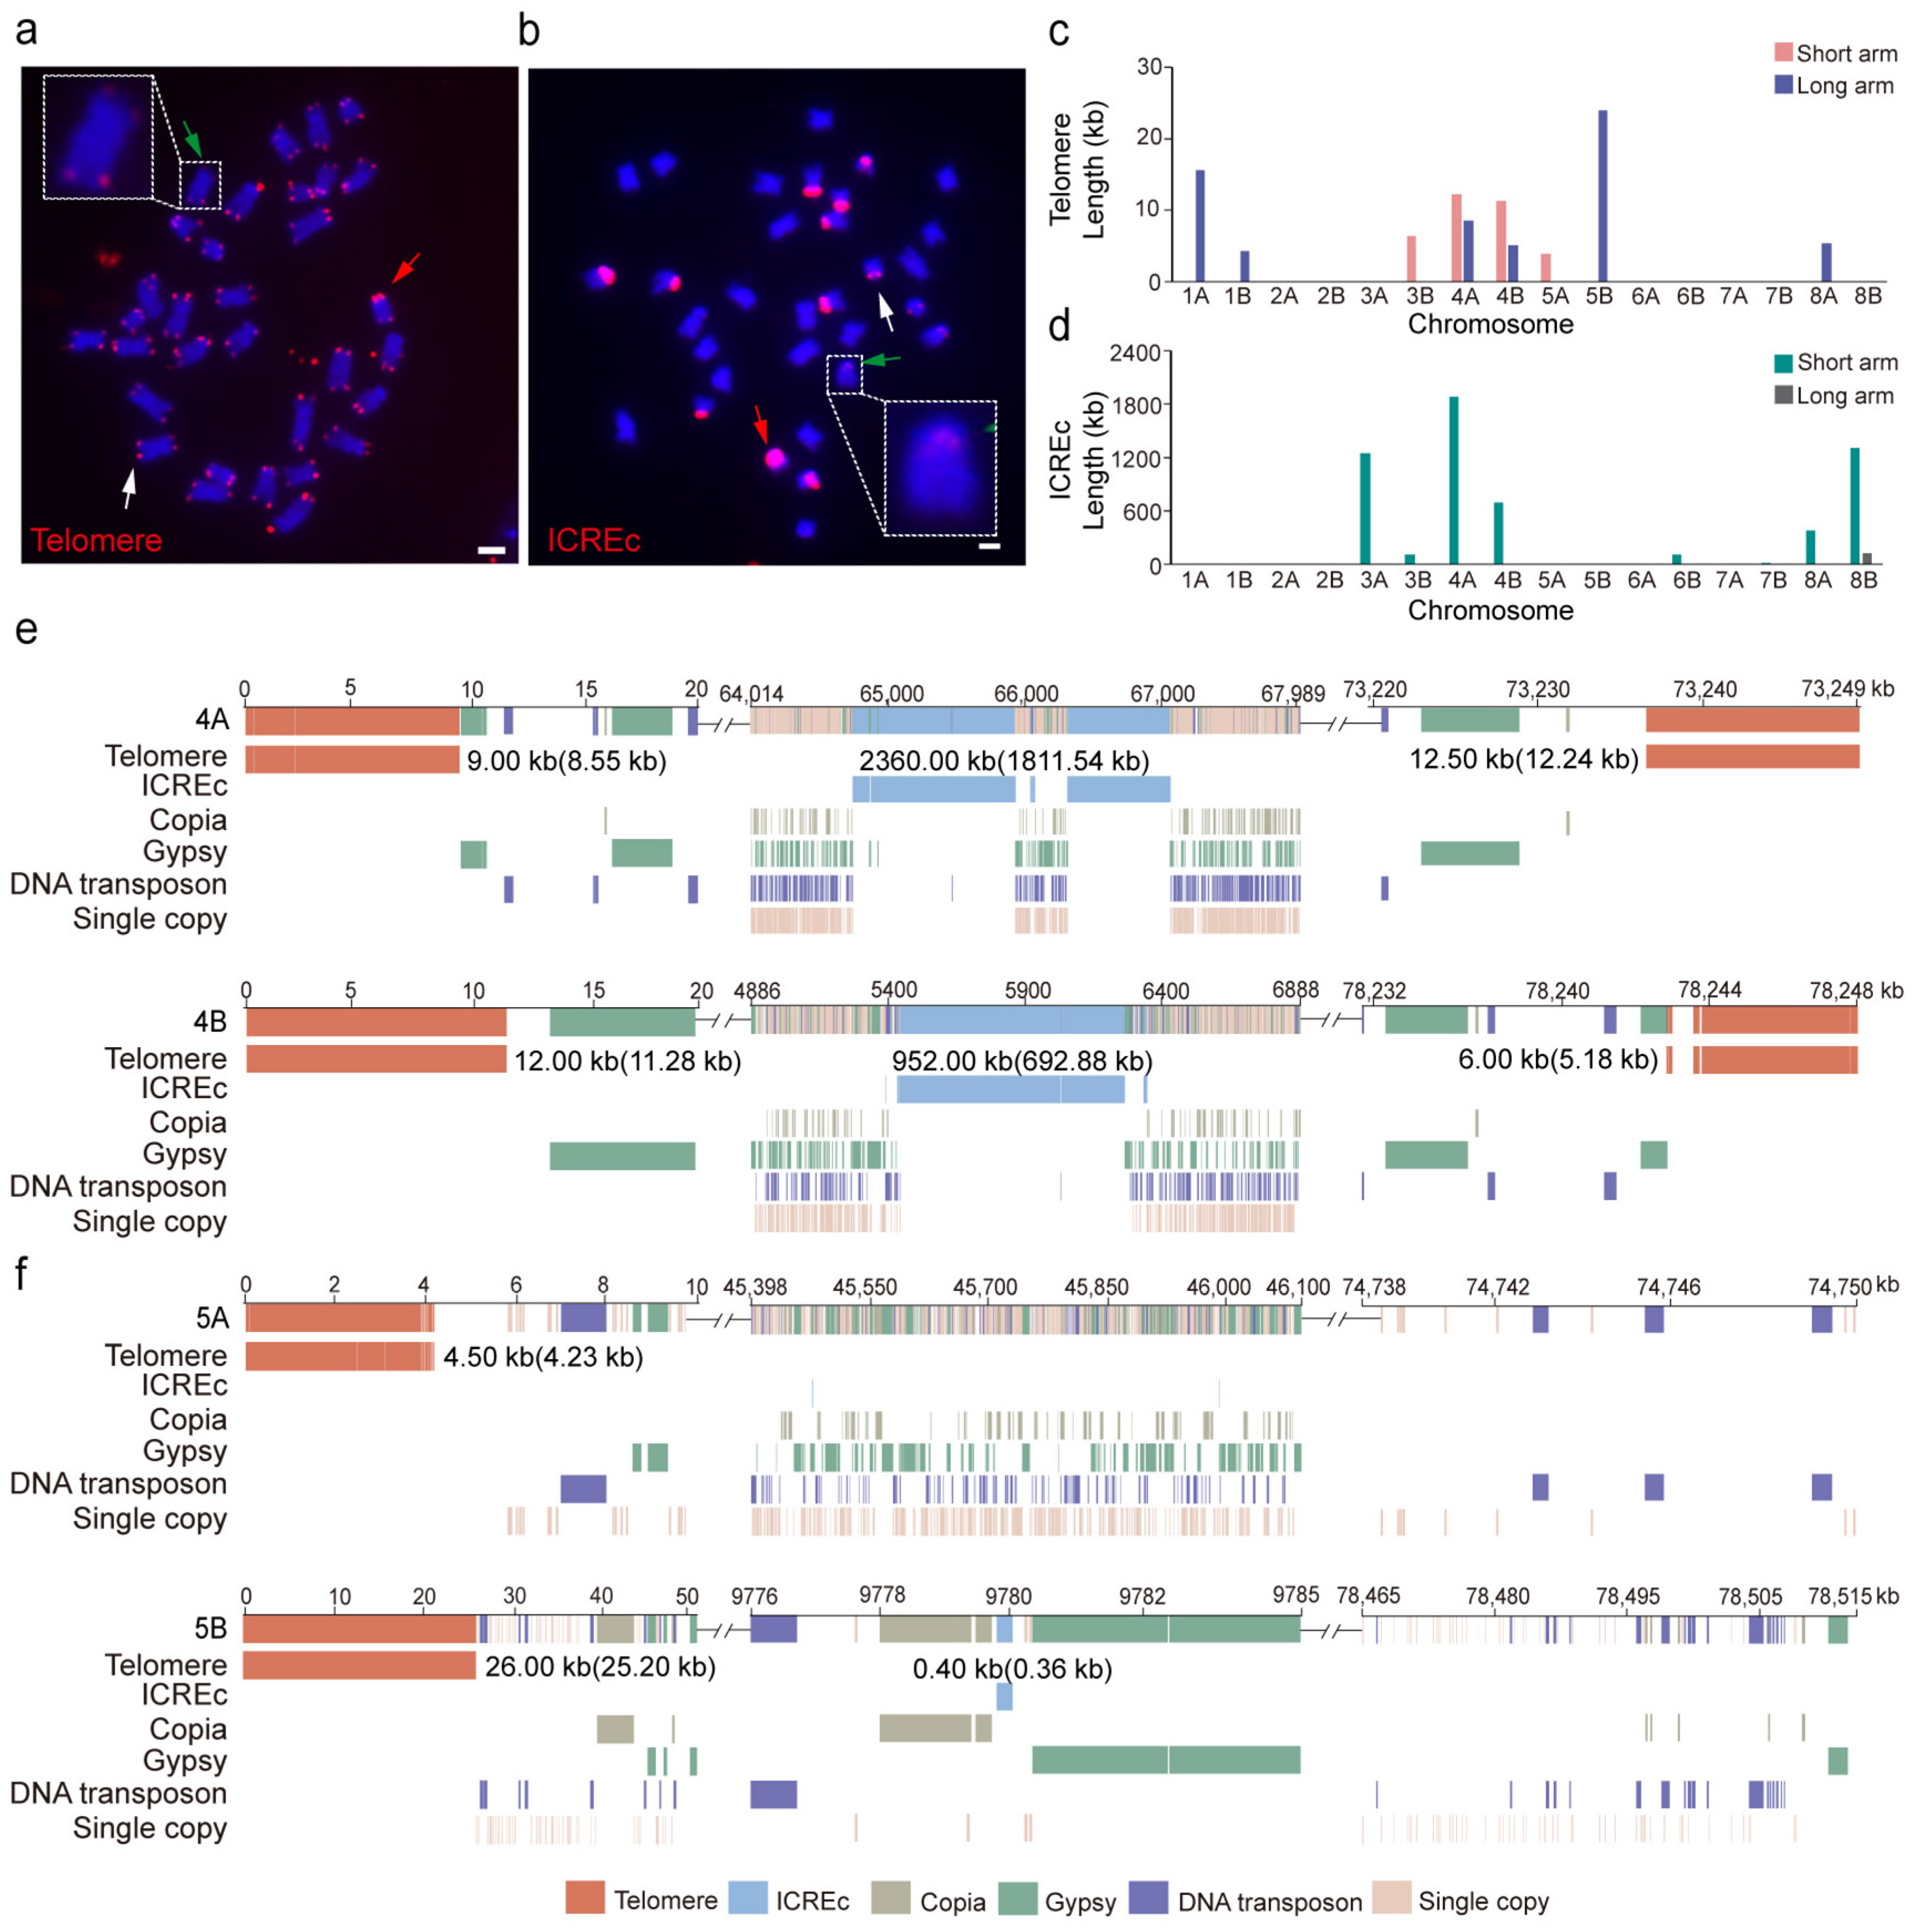
3.4. Telomere and ICREc Architecture at the Chromosome Ends of Water Hyacinth

To ascertain the chromosome distribution of telomeric sequences in the water hyacinth genome, we performed a FISH assay using a telomeric sequence probe on metaphase chromosomes of water hyacinth. Our findings indicated that the telomeric sequences generated distinct signals at the termini of each metaphase chromosome, albeit with varying signal intensities among different chromosomes, implying variations in the copy number of telomeric sequences (Figure 4a). However, we observed that only 10 telomeric regions were assembled from the 16 chromosomes (Figure 4c, Table S4), which is inconsistent with the FISH detection results, indicating that the genome assembly version we selected has not yet fully assembled all telomeric sequences. Among the assembled telomeric sequences, we observed significant differences in the length of the telomeric repeats across different chromosomes, with a variation span of up to sevenfold (Figure 4c, Table S4). Notably, the presence of telomeric sequences at both ends of chromosomes 4A and 4B (with coverages of 20.7 kb and 16.4 kb, respectively) was markedly different from the telomeric distribution on chromosomes 5A and 5B (Figure 4e,f).
We conducted a FISH assay using a probe of the TR of interstitial chromosome regions (ICREc) on metaphase chromosomes of water hyacinth. We discovered that ICREc signals were localized to one end of seven pairs of metaphase chromosomes, with varying signal strengths (Figure 4b), indicative of varying ICREc abundance across chromosomes. Notably, the results of the in-silico analysis of the chromosomal distribution of ICREc were largely consistent with the FISH findings (Figure 2b and Figure 4b). Consequently, we examined the chromosomal ends in the genome assembly and observed that seven chromosomes exhibited the typical pattern of interstitial chromosome regions. Notably, the length of ICREc varied considerably among specific chromosomes, reflecting diversity in ICREc distribution (Figure 4d,f, Table S5). The average length of ICREc regions was 367.4 kb, yet there was approximately a 9000-fold difference in length between the longest ICREc (4A-S, 1.88 Mb) and the shortest ICREc (1B-L, 0.2 kb) (Table S5), as observed by FISH (Figure 4b). Additionally, some chromosomes lacked the typical ICREc, encompassing chromosomes 1A/B, 2A/B, 5A/B, 6A, 7A/B (Figure 4d and Table S5). Additionally, the ICREc exhibited considerable diversity in the insertion of other sequence elements. For example, in the interstitial chromosome regions of chromosomes 4A-S and 4B-S, we identified the presence of Copia and Gypsy retrotransposons, DNA transposons, and single-copy sequences (Figure 4e,f). We found that the homologous sequences of ICREc exhibited a degree of similarity exceeding 85%, suggesting a moderate level of conservation within the water hyacinth genome (Figure S5). Collectively, the interstitial chromosome regions in water hyacinth demonstrate extensive variability not only in copy number and length but also in their sequence composition.

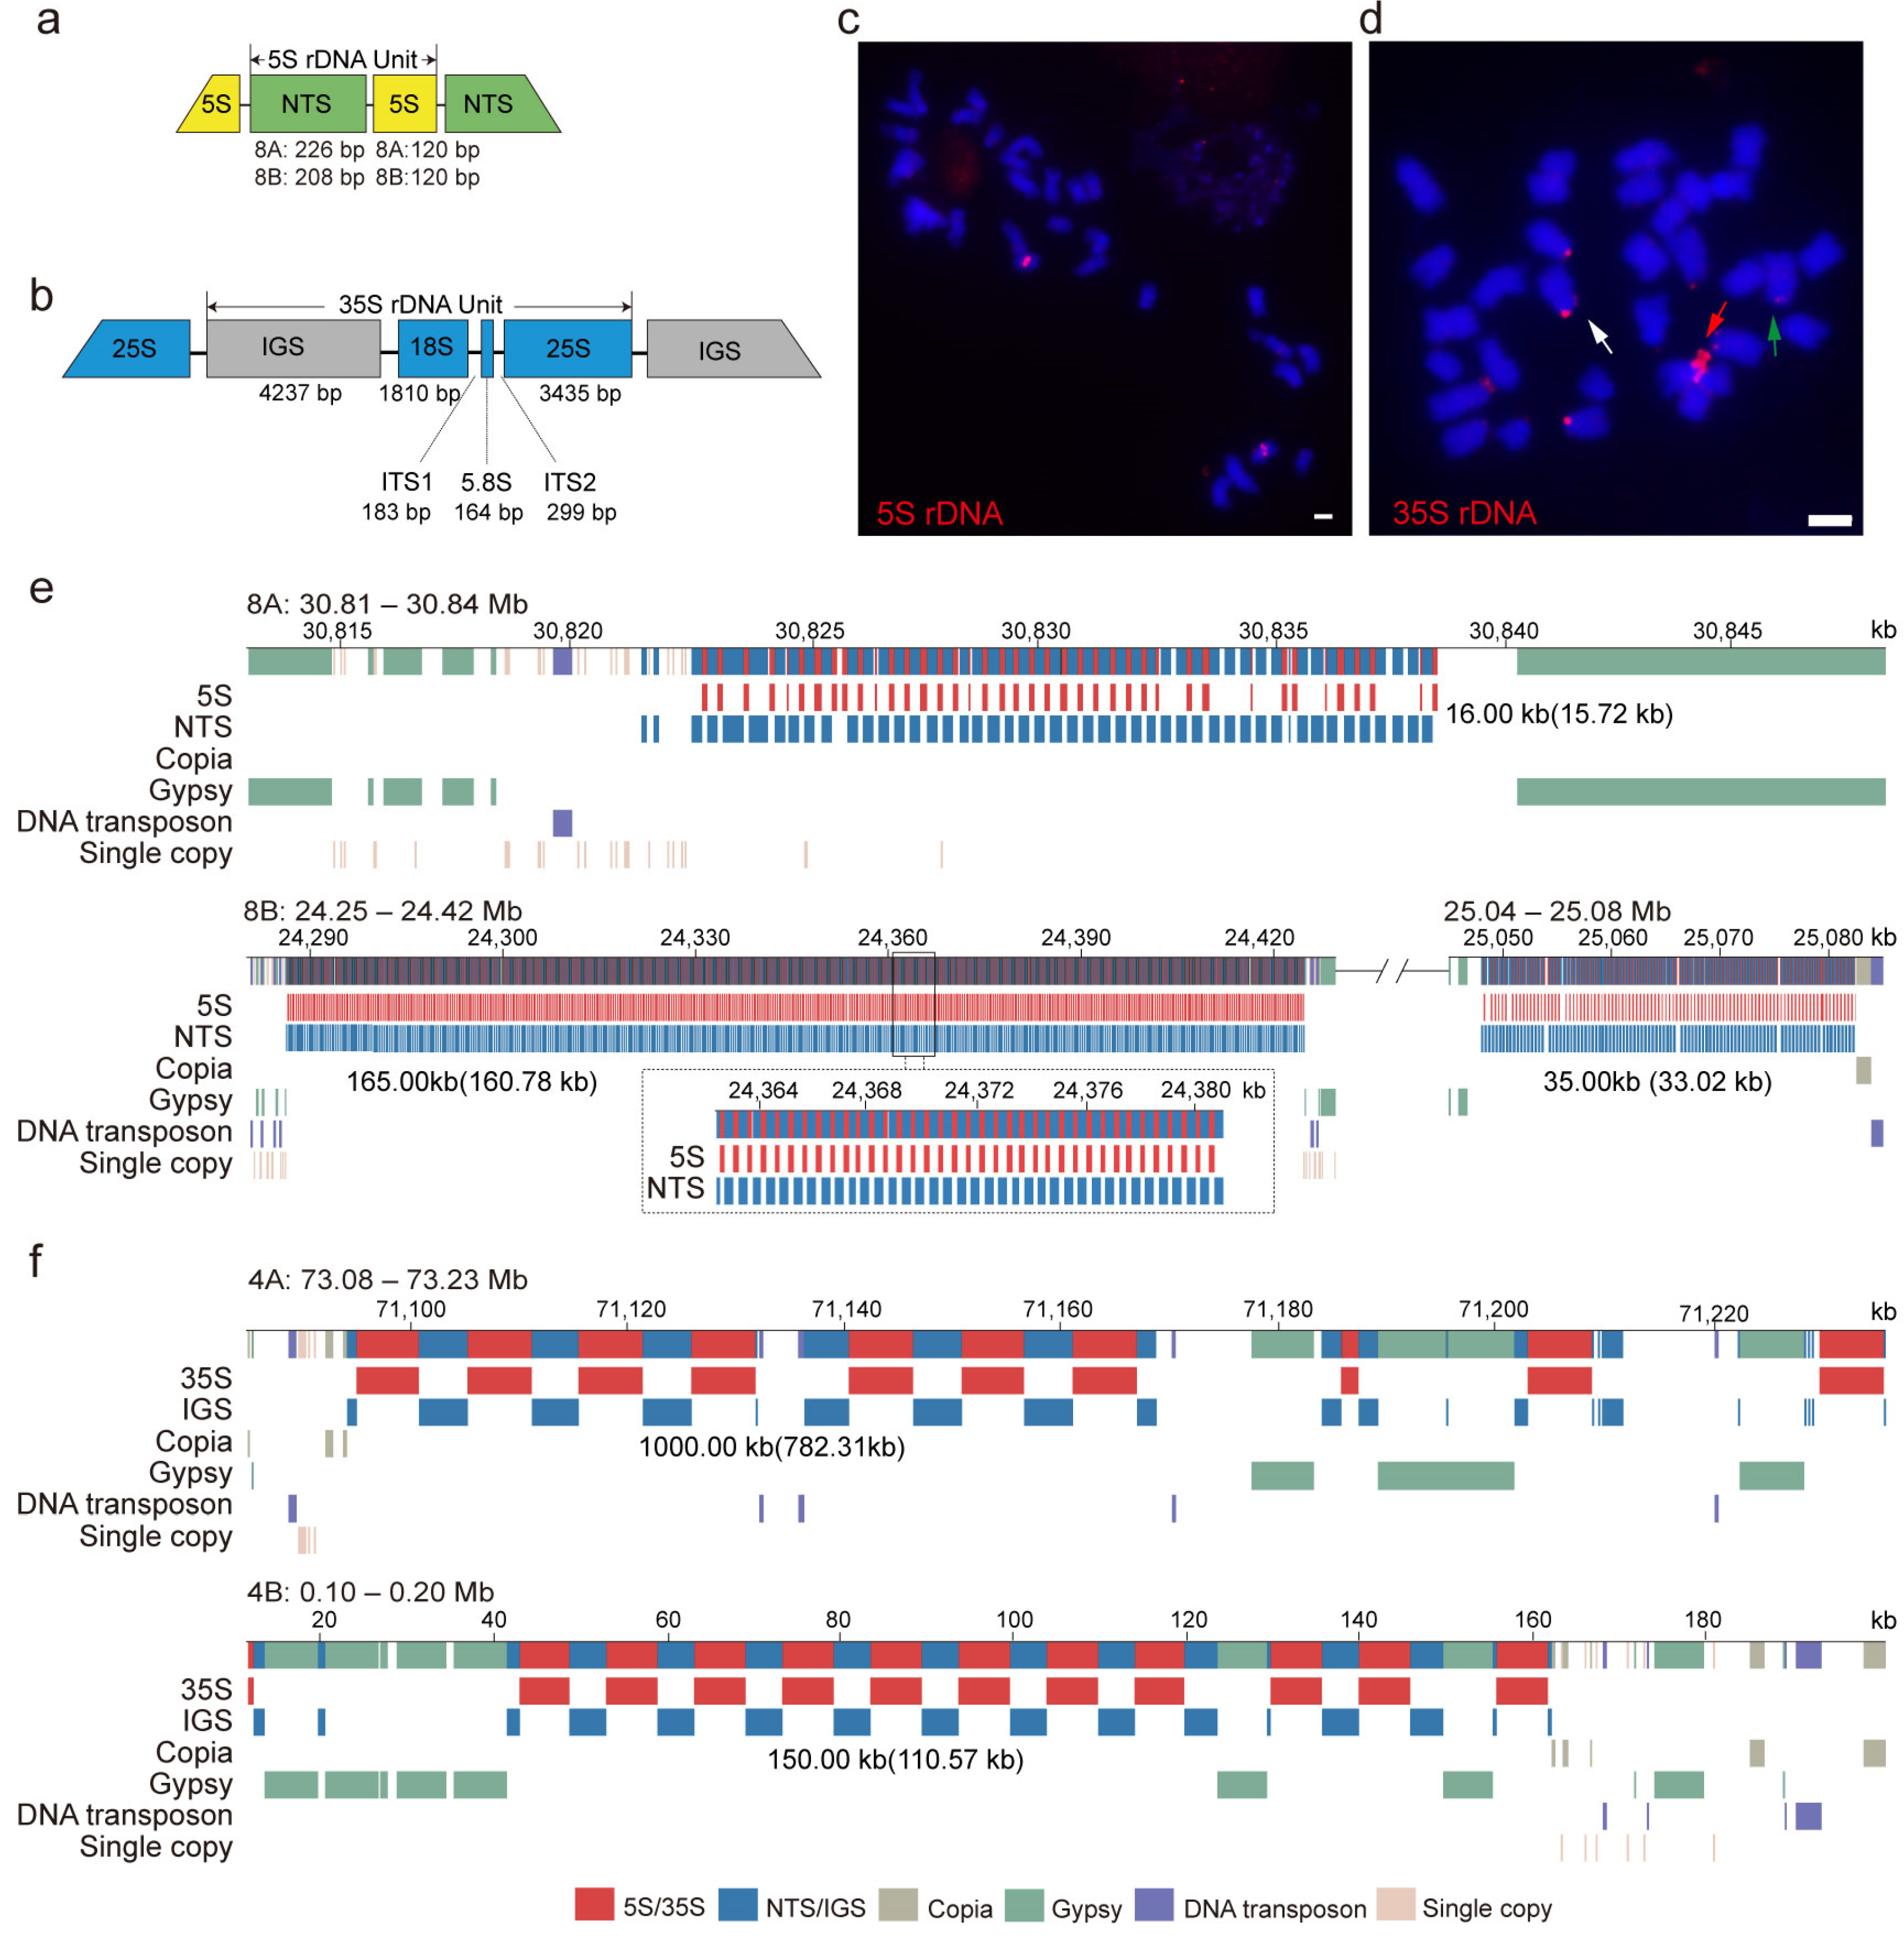
3.5. Genomic Structure of 5S and 35S rDNA Arrays in Water Hyacinth Genome

The number of rDNA loci can vary across different species [39]. In water hyacinth, the 5S rRNA genes are transcribed from 5S rDNAs, while the 18S, 5.8S, and 25S rRNAs derive from the processing of a single 35S transcript encoded by the 35S rDNA (Figure 5a,b). Both 5S and 35S rDNA sequences were highly conserved in length within the coding regions between the two subgenomes of water hyacinth (120 bp for 5S rDNA and 5891 bp for 35S rDNA). However, the 5S rDNA NTS exhibited different sequence lengths between the two subgenomes (226 bp in subgenome A and 208 bp in subgenome B), while the 35S rDNA IGS was more conserved in length (4237 bp) in the water hyacinth genome (Figure 5c). Additionally, the coding sequences of 5S rDNA and 35S rDNA between the two subgenomes exhibited a high level of similarity, ranging from 90% to 100% (Figures S6 and S7). In contrast, the similarity of the NTS and IGS sequences was significantly lower compared to the coding sequences (Figures S8 and S9). We observed the sequence heterogeneity of 5S rDNA NTS and 35S rDNA IGS from the two subgenomes, with sequence similarities of 72.12% and 84.64%, respectively (Figure 6).
To explore the chromosomal distributions of 5S and 35S rDNA in the water hyacinth genome, FISH mapping was conducted using both probes. We observed distinct chromosomal localization patterns for the two types of rDNA. The 5S and 35S rDNA signal loci were clearly detected on separate chromosome arms (Figure 5c,d). The 5S rDNA produced clear and bright signals in the central region of one pair of metaphase chromosomes (Figure 5c), whereas the 35S rDNA signals were located near the chromosomal ends, displaying 10 hybridization signals with significantly varying intensities, reflecting differences in copy numbers among chromosomes (Figure 5d). On chromosome 8B, the copy coverage of 5S rDNA reached up to 193.8 kb, greatly exceeding the coverage range on other chromosomes (0.06 kb to 15.7 kb) (Figure 5e, Table S3), as observed using FISH (Figure 5c). FISH analysis detected 5S rDNA signals on only one pair of chromosomes, likely originating from chromosome 8B (Figure 5c). However, the 5S rDNA coverage on chromosome 8A (15.7 kb) may fall below the resolution threshold of FISH detection, making it undetectable using this method (Figure 5c, Table S3). Additionally, a small number of single-copy sequence insertions were detected in the 5S rDNA array on chromosome 8A (Figure 5e). On chromosomes 4A and 4B, the coding sequence copy coverage of 35S rDNA was the highest (782.31 kb to 816.7 kb) (Figure 5f, Table S3), with several DNA transposon insertions present in the 35S rDNA array from chromosome 4A (Figure 5f). The 35S rDNA arrays on the other chromosomes were relatively smaller, ranging from 0.4 kb to 31.1 kb (Table S3).

4. Discussion

In this study, we conducted an in-depth analysis of the typical TRs in the water hyacinth genome by integrating similarity-based clustering of NGS reads with FISH. The main categories of TEs in P. crassipes were largely similar to those observed in most eukaryotes [40]. We successfully identified five typical TRs, including putative CentEc, the telomere sequence, ICREc, and 5S and 35S rDNA (Figure 1, Table S6). Centromere is a chromosomal locus that ensures the delivery of one copy of each chromosome to each daughter at cell division [41]. Typically, in eukaryotic organisms, the monomer length of satellite repeat sequences in the centromeres ranges from 150 bp to 180 bp, each capable of hosting a single centromeric histone variant CENH3 nucleosome [41]. In water hyacinth, the putative CentEc is 148 bp (Figure 1), reflecting a mature centromeric structure similar to other eukaryotes. Despite this conserved role, centromere organization varies widely, from single nucleosomes to megabase-scale TR arrays. For instance, in A. thaliana, the centromeric satellite array spans 1–2 Mb [11], while in humans, array sizes range from 340 kb (chromosome 21) to 4.8 Mb (chromosome 18) [13]. In water hyacinth, putative CentEc sequences account for 4.3% of the genome, with the largest array reaching 2.99 Mb. However, we observed incomplete centromere assembly, particularly on chromosomes 1A, 1B, 2A, and 2B (Figure 2b and Figure 3d,e), highlighting challenges in resolving complex centromeric regions using NGS.
Although centromeres are functionally conserved, they exhibit rapid evolution in both DNA sequence and kinetochore composition [41]. New repeat arrays may emerge, expand, or replace existing ones, and chromosomal rearrangements can split these arrays, generating multiple distinct satellite regions [11,41]. Consequently, high sequence polymorphism is a common feature of centromeric repeats in eukaryotes [42]. For instance, in A. thaliana, centromeric repeats exhibit 79–89% sequence identity, with most monomers being chromosome-specific [42]. Similar chromosomal homogenization patterns are observed in rice and E. rufipilus [12,14]. In humans, the higher-order repeat (HOR) pattern of centromeric satellite repeats is more regularized and homogenized, with each HOR involving more monomers, which are 50–70% identical in these sequences [43]. Notably, each human chromosome is characterized by a specific HOR pattern, consistent with the model in which satellite repeat sequence homogenization mainly occurs within chromosomes [13]. Intriguingly, water hyacinth’s putative CentEc sequences display 91–100% sequence conservation (Figure S4), suggesting stable satellite sequences despite subgenomic variations [44]. This contrasts sharply with the rapid satellite diversification seen in other plants, especially polyploid wheat [45,46], and recent studies in cotton allopolyploids [47,48]. It is assumed that such homogenization is achieved by molecular mechanisms such as unequal crossing-over, gene conversion, and rolling circle amplification [49].
Notably, several species lack canonical centromeric satellite sequences and instead possess only centromeric retrotransposons [50,51]. The centromeric enrichment of these retrotransposons implies their potential involvement in either driving centromere specification or modulating drive efficiency through epigenetic mechanisms [49]. The diversity in centromeric composition, through the presence of satellite repeats and retrotransposons, indicates a genomic mechanism for transitioning between these states [52]. However, the emergence of centromeric satellite arrays from retrotransposon-based structures remains enigmatic. Evidence suggests that centromere-preferring retrotransposons can form TR sequences, potentially offering a pathway for the evolution of satellite arrays from centromeres dominated by retrotransposons [32,53,54], as observed in the epigenetically regulated centromeres of Nicotiana [55]. This has prompted contemplation on the evolution of centromeres: whether centromeric retrotransposons have shifted from being a sporadic occurrence to becoming the foundational sequence of centromeric satellites, and whether they have evolved from a single ancestral sequence that uniformly dominated and maintained high sequence consistency across chromosomes—as observed in the water hyacinth centromere—to a diversified sequence, eventually developing into chromosome-specific variants, a pattern commonly seen in the centromeres of most eukaryotic organisms.
It is well known that telomeres are characteristic repetitive sequences at the ends of every chromosome in eukaryotic organisms, as demonstrated by the FISH assay in water hyacinth (Figure 4a). Telomeric regions are frequently misassembled or absent in whole-genome assemblies. We found that the repeat arrays of telomeres are not fully assembled in the current water hyacinth assembly (Figure 4). The predominant cause of the breakdown in sequence assembly is attributed to the presence of long, homogeneous TR arrays that are beyond the resolving capacity of reads within the 20–100 kb size range [56]. The telomere repeat TTAGGG, considered ancestral in vertebrates [57], is replaced by TTTAGGG in most plants, including water hyacinth. Despite this sequence conservation, FISH revealed significant copy number variation at chromosome ends (Figure 4a). Typically, certain TR sequences, such as subtelomeric sequences and interstitial chromosomal sequences, were found at the ends of chromosomes. The subtelomeres, highly heterogeneous repeated sequences neighboring telomeres, appear to exhibit rapid sequence evolution, with many subtelomeric repeats being species-specific and often chromosome-specific [17]. For instance, a high degree of variability was observed among the 20 subtelomeres of maize, with no typical subtelomeric repeats identified at five chromosomal ends [58]. This plasticity may stem from tolerance to copy number variation and susceptibility to double-strand breaks (DSBs), which are efficiently repaired through inter-chromosomal exchanges [59]. Telomere clustering during meiosis may further facilitate these exchanges [60], while allelic heterogeneity in subtelomeric regions increases misalignment and genetic rearrangements during meiosis [61].
The rRNAs produced by clusters of tandemly arranged rRNA genes in ribosomal DNA (rDNA) are essential for nucleolar organization, as well as for the maintenance and transcription of the cellular machinery responsible for protein synthesis [62]. In most plants, 5S rDNA is interstitial, while 35S rDNA is subtelomeric. The latter is prone to recombination, resulting in copy number variation and contributing to genome stability under stress [63]. In allopolyploids, chromosome doubling can lead to 5S rDNA loss from certain subgenomes [28]. Our study revealed a pronounced subgenome bias in 5S rDNA distribution, with higher abundance in subgenome B (193.8 kb on 8B) than in subgenome A (15.7 kb on 8A) (Figure 2a and Figure 5e). This asymmetry may result from copy loss or restricted amplification in subgenome A, compounded by structural heterogeneity caused by interspersed single-copy sequences (Figure 5e). In most eukaryotic species, the 35S rDNA is physically separated from the 5S rDNA, an arrangement known as the Separate or S-type [19]. Conversely, in a less common configuration, these are found in close proximity within the same genetic unit, known as the Linked or L-type, as observed in certain plants, including bryophytes and Ginkgo biloba [64,65]. Water hyacinth displays the S-type rDNA arrangement (Figure 2b), with 5S rDNA primarily located on subgenome B chromosomes and lower copy numbers on subgenome A (Figure 2a). Additionally, it possesses more 35S rDNA loci (ten sites) than 5S loci (Figure 5c,d), a distribution pattern commonly observed in plants [19]. Generally, the number of rDNA loci correlates with genome size and ploidy, although notable exceptions exist. For instance, small-genome Brassicaceae species possess numerous 35S loci, whereas large-genome Liliaceae species have few. This model of concerted evolution is the primary framework for studying variations in rDNA sequences, positing that rDNA copies undergo shared evolutionary changes at the genomic and species levels due to mechanisms such as gene conversion and unequal recombination [66]. Recent studies have uncovered a multitude of intra-genomic rDNA variants across diverse phyla, encompassing fungi, invertebrates, plants, and mammals [67,68,69,70]. Interestingly, several rDNA sequence variations in mammals and insects have persisted over extended evolutionary timeframes, challenging the notion of rapid fixation of mutations [68,69]. Additionally, the presence of pseudogenes and diverse rDNA variants within many rDNA arrays is a common occurrence across species. For instance, in wheat, the B and D subgenomes display a high degree of uniformity in their rDNA loci, while the subgenome A shows signs of structural irregularities, potentially indicative of disintegration and pseudogenization [71]. Our study also revealed sequence heterogeneity in copies of 5S and 35S rDNA from the two subgenomes, implying divergent evolution of these two rDNA families within their respective subgenomes (Figure 6, Figures S10 and S11).
Despite the successful identification of typical repetitive sequences through integrated NGS-FISH, the inherent limitations of short-read sequencing hindered the full assembly of these regions. TRs continue to pose assembly challenges, often leading to a significant loss of sequence information [72]. Recent advancements in sequencing technologies, particularly the high-fidelity sequencing from PacBio, the ultra-long reads from Oxford Nanopore Technologies (ONT), and Hi-C scaffolding, have illuminated new pathways for assembling regions abundant in TRs [11,13,25,73,74]. In recent years, with further developments in third-generation sequencing technologies and the refinement of assembly algorithms, there has been significant progress in the complete telomere-to-telomere T2T genome assembly across various species [47,48,55,72,75,76]. Hence, in the future, higher-quality genome sequencing of water hyacinth may provide a deeper understanding of these sequence characteristics. In summary, the five typical TRs in the allotetraploid water hyacinth exhibit distinct evolutionary profiles shaped by differential pressures, providing critical insights into the genomic dynamics of this globally significant invader.

5. Conclusions

In this study, we comprehensively characterized the genomic and cytogenetic landscapes of five canonical TRs in the allotetraploid water hyacinth (Pontederia crassipes). Through integrative genomic and cytogenetic analyses, we revealed distinct evolutionary trajectories among these TRs. The putative CentEc displayed remarkable sequence conservation (91–100%) across subgenomes, indicative of active concerted evolution following polyploidization. Telomeric repeats were universally present at chromosomal termini but exhibited copy number polymorphisms, reflecting dynamic genomic instability. ICREc demonstrated subgenome-biased abundance and chromosome-specific localization, suggesting divergent selective pressures. Both 5S and 35S rDNA arrays exhibited contrasting evolutionary paths: 5S rDNA was restricted to a single chromosome pair, whereas 35S rDNA occupied multiple chromosomal loci with varying intensities. Notably, discrepancies between cytogenetic signals and genome assembly data underscored persistent challenges in resolving complex TR architectures in polyploid genomes. Collectively, these findings provide critical insights into the structural diversification and evolutionary adaptation of TRs in invasive allopolyploids, emphasizing their role in shaping genome plasticity.

Supplementary Materials

The following supporting information can be downloaded at: https://www.mdpi.com/article/10.3390/horticulturae11060657/s1, Figure S1: Metaphase chromosome spreads of water hyacinth, Figure S2: The chromosomal distribution of the tandem repeats (TRs) and transposable elements (TEs) in the water hyacinth genome; Figure S3: The CL36 and CL48 sequence reads organized in graph structures from the RepeatExplorer2 graphical output (a and b); Figure S4: Sequence similarity of the centromeric repetitive sequences in the water hyacinth genome; Figure S5: Sequence similarity of the interstitial chromosome regions repetitive sequences (ICREc) in the water hyacinth genome; Figure S6: Sequence similarity of the coding sequences of 5S rDNA in the water hyacinth genome; Figure S7: Sequence similarity of the coding sequences of 35S rDNA in the water hyacinth genome; Figure S8: Sequence similarity of the NTS sequences of 5S rDNA in the water hyacinth genome; Figure S9: Sequence similarity of the IGS sequences of 35S rDNA in the water hyacinth genome; Figure S10: Dot plot analysis of 5S rDNA NTS 8 in the water hyacinth genome; Figure S11: Dot plot analysis of 35S rDNA IGS in the water hyacinth genome. Table S1: The PCR primers that were used in this study; Table S2: Types and proportions of major repetitive sequences in water hyacinth genome; Table S3: Genome coverage of putative CentEc, 5S rDNA and 35S rDNA in the assembly of water hyacinth genome; Table S4: Genome coverage of telomeric repeat in the assembly of water hyacinth genome; Table S5: Genome coverage of ICREc in the assembly of water hyacinth genome; Table S6: Satellite repeat characteristics in water hyacinth; Table S7: The genomic proportions of tandem repeat sequences in both subgenomes; Table S8: The chromosome length in water hyacinth.

Author Contributions

Conceptualization, J.F.; funding acquisition, D.T.; investigation, J.F. and L.F.; formal analysis, L.F., Y.Z., L.Z. and J.W.; data curation, L.F., Y.Z. and L.Z.; resources, J.F. and D.T.; writing -original draft, L.F.; writing—editing, J.F., L.F., Y.Z. and D.T.; All authors have read and agreed to the published version of the manuscript.

Funding

This research was funded by the Forestry Bureau Project of Fujian Province, China (grant Number 2025FKJ7); Fujian Provincial Natural Science Foundation of China (grant Number 2023J01508); external cooperation projects of FAAS (DWHZ2024-07) and National Natural Science Foundation of China (U23A20178).

Data Availability Statement

All the data in this study are included in the figures and tables.

Conflicts of Interest

We declare that there are no conflicts of interest.

References

  1. Ben Bakrim, W.; Ezzariai, A.; Karouach, F.; Sobeh, M.; Kibret, M.; Hafidi, M.; Kouisni, L.; Yasri, A. Eichhornia crassipes (Mart.) Solms: A comprehensive review of its chemical composition, traditional use, and value-added products. Front. Pharmacol. 2022, 13, 842511. [Google Scholar] [CrossRef] [PubMed]
  2. Ezzariai, A.; Hafidi, M.; Ben Bakrim, W.; Kibret, M.; Karouach, F.; Sobeh, M.; Kouisni, L. Identifying advanced biotechnologies to generate biofertilizers and biofuels from the world’s worst aquatic weed. Front. Bioeng. Biotechnol. 2021, 9, 769366. [Google Scholar] [CrossRef] [PubMed]
  3. Mahamood, M.; Khan, F.R.; Zahir, F.; Javed, M.; Alhewairini, S.S. Bagarius bagarius, and Eichhornia crassipes are suitable bioindicators of heavy metal pollution, toxicity, and risk assessment. Sci. Rep. 2023, 13, 1824. [Google Scholar] [CrossRef]
  4. He, X.; Zhang, S.; Lv, X.; Liu, M.; Ma, Y.; Guo, S. Eichhornia crassipes-rhizospheric biofilms contribute to nutrients removal and methane oxidization in wastewater stabilization ponds receiving simulative sewage treatment plants effluents. Chemosphere 2023, 322, 138100. [Google Scholar] [CrossRef]
  5. Islam, M.N.; Rahman, F.; Papri, S.A.; Faruk, M.O.; Das, A.K.; Adhikary, N.; Debrot, A.O.; Ahsan, M.N. Water hyacinth (Eichhornia crassipes (Mart.) Solms.) as an alternative raw material for the production of bio-compost and handmade paper. J. Environ. Manag. 2021, 294, 113036. [Google Scholar] [CrossRef]
  6. Neumann, P.; Navrátilová, A.; Koblížková, A.; Kejnovský, E.; Hřibová, E.; Hobza, R.; Widmer, A.; Doležel, J.; Macas, J. Plant centromeric retrotransposons: A structural and cytogenetic perspective. Mob DNA 2011, 2, 4. [Google Scholar] [CrossRef] [PubMed]
  7. Fingerhut, J.M.; Yamashita, Y.M. The regulation and potential functions of intronic satellite DNA. Semin. Cell Dev. Biol. 2022, 128, 69–77. [Google Scholar] [CrossRef]
  8. Von Wettstein, D.; Rasmussen, S.W.; Holm, P.B. The synaptonemal complex in genetic segregation. Annu. Rev. Genet. 1984, 18, 331–413. [Google Scholar] [CrossRef]
  9. Gemayel, R.; Cho, J.; Boeynaems, S.; Verstrepen, K.J. Beyond junk-variable tandem repeats as facilitators of rapid evolution of regulatory and coding sequences. Genes 2012, 3, 461–480. [Google Scholar] [CrossRef]
  10. Anamthawat-Jónsson, K.; Wenke, T.; Thórsson, A.T.; Sveinsson, S.; Zakrzewski, F.; Schmidt, T. Evolutionary diversification of satellite DNA sequences from Leymus (Poaceae: Triticeae). Genome 2009, 52, 381–390. [Google Scholar] [CrossRef]
  11. Naish, M.; Alonge, M.; Wlodzimierz, P.; Tock, A.J.; Abramson, B.W.; Schmücker, A.; Mandáková, T.; Jamge, B.; Lambing, C.; Kuo, P.; et al. The genetic and epigenetic landscape of the Arabidopsis centromeres. Science 2021, 374, eabi7489. [Google Scholar] [CrossRef] [PubMed]
  12. Song, J.M.; Xie, W.Z.; Wang, S.; Guo, Y.X.; Koo, D.H.; Kudrna, D.; Gong, C.; Huang, Y.; Feng, J.W.; Zhang, W.; et al. Two gap-free reference genomes and a global view of the centromere architecture in rice. Mol Plant 2021, 14, 1757–1767. [Google Scholar] [CrossRef] [PubMed]
  13. Altemose, N.; Logsdon, G.A.; Bzikadze, A.V.; Sidhwani, P.; Langley, S.A.; Caldas, G.V.; Hoyt, S.J.; Uralsky, L.; Ryabov, F.D.; Shew, C.J.; et al. Complete genomic and epigenetic maps of human centromeres. Science 2022, 376, eabl4178. [Google Scholar] [CrossRef]
  14. Wang, T.; Wang, B.; Hua, X.; Tang, H.; Zhang, Z.; Gao, R.; Qi, Y.; Zhang, Q.; Wang, G.; Yu, Z.; et al. A complete gap-free diploid genome in Saccharum complex and the genomic footprints of evolution in the highly polyploid Saccharum genus. Nat. Plants 2023, 9, 554–571. [Google Scholar] [CrossRef]
  15. Zheng, H.; Wang, B.; Hua, X.; Gao, R.; Wang, Y.; Zhang, Z.; Zhang, Y.; Mei, J.; Huang, Y.; Huang, Y.; et al. A near-complete genome assembly of the allotetrapolyploid Cenchrus fungigraminus (JUJUNCAO) provides insights into its evolution and C4 photosynthesis. Plant Commun. 2023, 4, 100633. [Google Scholar] [CrossRef] [PubMed]
  16. Adamusová, K.; Khosravi, S.; Fujimoto, S.; Houben, A.; Matsunaga, S.; Fajkus, J.; Fojtová, M. Two combinatorial patterns of telomere histone marks in plants with canonical and non-canonical telomere repeats. Plant J. 2020, 102, 678–687. [Google Scholar] [CrossRef]
  17. Saint-Leandre, B.; Levine, M.T. The telomere paradox: Stable genome preservation with rapidly evolving proteins. Trends Genet. 2020, 36, 232–242. [Google Scholar] [CrossRef]
  18. Torres, G.A.; Gong, Z.; Iovene, M.; Hirsch, C.D.; Buell, C.R.; Bryan, G.J.; Novák, P.; Macas, J.; Jiang, J. Organization and evolution of subtelomeric satellite repeats in the potato genome. G3 2011, 1, 85–92. [Google Scholar] [CrossRef]
  19. Garcia, S.; Kovařík, A.; Leitch, A.R.; Garnatje, T. Cytogenetic features of rRNA genes across land plants: Analysis of the Plant rDNA database. Plant J. 2017, 89, 1020–1030. [Google Scholar] [CrossRef]
  20. Sebastian, P.; Schaefer, H.; Telford, I.R.; Renner, S.S. Cucumber (Cucumis sativus) and melon (C. melo) have numerous wild relatives in Asia and Australia, and the sister species of melon is from Australia. Proc. Natl. Acad. Sci. USA 2010, 107, 14269–14273. [Google Scholar] [CrossRef]
  21. Volkov, R.A.; Panchuk, I.I.; Borisjuk, N.V.; Hosiawa-Baranska, M.; Maluszynska, J.; Hemleben , V. Evolutional dynamics of 45S and 5S ribosomal DNA in ancient allohexaploid Atropa belladonna. BMC Plant Biol. 2017, 17, 21. [Google Scholar] [CrossRef] [PubMed]
  22. Islam-Faridi, N.; Hodnett, G.L.; Zhebentyayeva, T.; Hosiawa-Baranska, M.; Maluszynska, J.; Hemleben, V. Cyto-molecular characterization of rDNA and chromatin composition in the NOR-associated satellite in Chestnut (Castanea spp.). Sci. Rep. 2024, 14, 980. [Google Scholar]
  23. Ding, Q.; Li, R.; Ren, X.; Chan, L.Y.; Ho, V.W.S.; Xie, D.; Ye, P.; Zhao, Z. Genomic architecture of 5S rDNA cluster and its variations within and between species. BMC Genom. 2022, 23, 238. [Google Scholar] [CrossRef]
  24. Wang, W.; Zhang, X.; Garcia, S.; Leitch, A.R.; Kovařík, A. Intragenomic rDNA variation—The product of concerted evolution, mutation, or something in between? Heredity 2023, 131, 179–188. [Google Scholar] [CrossRef]
  25. Dolzhenko, E.; English, A.; Dashnow, H.; De Sena Brandine, G.; Mokveld, T.; Rowell, W.J.; Karniski, C.; Kronenberg, Z.; Danzi, M.C.; Cheung, W.A.; et al. Characterization and visualization of tandem repeats at genome scale. Nat. Biotechnol. 2024, 42, 1606–1614. [Google Scholar] [CrossRef]
  26. Logsdon, G.A.; Vollger, M.R.; Eichler, E.E. Long-read human genome sequencing and its applications. Nat. Rev. Genet. 2020, 21, 597–614. [Google Scholar] [CrossRef]
  27. Novák, P.; Neumann, P.; Macas, J. Global analysis of repetitive DNA from unassembled sequence reads using RepeatExplorer2. Nat. Protoc. 2020, 15, 3745–3776. [Google Scholar] [CrossRef] [PubMed]
  28. Huang, Y.; Chen, H.; Han, J.; Zhang, Y.; Ma, S.; Yu, G.; Wang, Z.; Wang, K. Species-specific abundant retrotransposons elucidate the genomic composition of modern sugarcane cultivars. Chromosoma 2020, 129, 45–55. [Google Scholar] [CrossRef]
  29. Yang, X.; Zhao, H.; Zhang, T.; Zeng, Z.; Zhang, P.; Zhu, B.; Han, Y.; Braz, G.T.; Casler, M.D.; Schmutz, J.; et al. Amplification and adaptation of centromeric repeats in polyploid switchgrass species. New Phytol. 2018, 218, 1645–1657. [Google Scholar] [CrossRef]
  30. Neumann, P.; Pavlíková, Z.; Koblížková, A.; Fuková, I.; Jedličková, V.; Novák, P.; Macas, J. Centromeres off the hook: Massive changes in centromere size and structure following duplication of CenH3 gene in Fabeae species. Mol. Biol. Evol. 2015, 32, 1862–1879. [Google Scholar] [CrossRef]
  31. Heitkam, T.; Weber, B.; Walter, I.; Liedtke, S.; Ost, C.; Schmidt, T. Satellite DNA landscapes after allotetraploidization of quinoa (Chenopodium quinoa) reveal unique A and B subgenomes. Plant J. 2020, 103, 32–52. [Google Scholar] [CrossRef] [PubMed]
  32. Huang, Y.; Ding, W.; Zhang, M.; Han, J.; Jing, Y.; Yao, W.; Hasterok, R.; Wang, Z.; Wang, K. The formation and evolution of centromeric satellite repeats in Saccharum species. Plant J. 2021, 106, 616–629. [Google Scholar] [CrossRef] [PubMed]
  33. Liu, J.; Lin, X.; Wang, X.; Feng, L.; Zhu, S.; Tian, R.; Fang, J.; Tao, A.; Fang, P.; Qi, J.; et al. Genomic and cytogenetic analyses reveal satellite repeat signature in allotetraploid okra (Abelmoschus esculentus). BMC Plant Biol. 2024, 24, 71. [Google Scholar] [CrossRef]
  34. Krzywinski, M.; Schein, J.; Birol, I.; Connors, J.; Gascoyne, R.; Horsman, D.; Jones, S.J.; Marra, M.A. Circos: An information aesthetic for comparative genomics. Genome Res. 2009, 19, 1639–1645. [Google Scholar] [CrossRef] [PubMed]
  35. Chen, C.; Chen, H.; Zhang, Y.; Thomas, H.R.; Frank, M.H.; He, Y.; Xia, R. TBtools: An Integrative Toolkit Developed for Interactive Analyses of Big Biological Data. Mol. Plant 2020, 13, 1194–1202. [Google Scholar] [CrossRef]
  36. Freese, N.H.; Norris, D.C.; Loraine, A.E. Integrated genome browser: Visual analytics platform for genomics. Bioinformatics 2016, 32, 2089–2095. [Google Scholar] [CrossRef]
  37. Macas, J.; Ávila Robledillo, L.; Kreplak, J.; Novák, P.; Koblížková, A.; Vrbová, I.; Burstin, J.; Neumann, P. Assembly of the 81.6 Mb centromere of pea chromosome 6 elucidates the structure and evolution of metapolycentric chromosomes. PLoS Genet. 2023, 19, e1010633. [Google Scholar] [CrossRef]
  38. Cheng, Z.; Dong, F.; Langdon, T.; Ouyang, S.; Buell, C.R.; Gu, M.; Blattner, F.R.; Jiang, J. Functional rice centromeres are marked by a satellite repeat and a centromere-specific retrotransposon. Plant Cell 2002, 14, 1691–1704. [Google Scholar] [CrossRef]
  39. Nelson, J.O.; Watase, G.J.; Warsinger-Pepe, N.; Yamashita, Y.M. Mechanisms of rDNA copy number maintenance. Trends Genet. 2019, 35, 734–742. [Google Scholar] [CrossRef]
  40. Almojil, D.; Bourgeois, Y.; Falis, M.; Hariyani, I.; Wilcox, J.; Boissinot, S. The Structural, Functional and Evolutionary Impact of Transposable Elements in Eukaryotes. Genes 2021, 12, 918. [Google Scholar] [CrossRef]
  41. Henikoff, S.; Ahmad, K.; Malik, H.S. The centromere paradox: Stable inheritance with rapidly evolving DNA. Science 2001, 293, 1098–1102. [Google Scholar] [CrossRef] [PubMed]
  42. Maheshwari, S.; Ishii, T.; Brown, C.T.; Houben, A.; Comai, L. Centromere location in Arabidopsis is unaltered by extreme divergence in CENH3 protein sequence. Genome Res. 2017, 27, 471–478. [Google Scholar] [CrossRef] [PubMed]
  43. Miga, K.H. The promises and challenges of genomic studies of human centromeres. Prog. Mol. Subcell. Biol. 2017, 56, 285–304. [Google Scholar] [PubMed]
  44. Huang, Y.; Guo, L.; Xie, L.; Shang, N.; Wu, D.; Ye, C.; Rudell, E.C.; Okada, K.; Zhu, Q.H.; Song, B.K. A reference genome of Commelinales provides insights into the commelinids evolution and global spread of water hyacinth (Pontederia crassipes). Gigascience 2024, 13, giae006. [Google Scholar] [CrossRef]
  45. Su, H.; Liu, Y.; Liu, C.; Shi, Q.; Huang, Y.; Han, F. Centromere Satellite Repeats Have Undergone Rapid Changes in Polyploid Wheat Subgenomes. Plant Cell 2019, 31, 2035–2051. [Google Scholar] [CrossRef]
  46. Chen, C.; Wu, S.; Sun, Y.; Zhou, J.; Chen, Y.; Zhang, J.; Birchler, J.A.; Han, F.; Yang, N.; Su, H. Three near-complete genome assemblies reveal substantial centromere dynamics from diploid to tetraploid in Brachypodium genus. Genome Biol 2024, 25, 63. [Google Scholar] [CrossRef]
  47. Hu, G.; Wang, Z.; Tian, Z.; Wang, K.; Ji, G.; Wang, X.; Zhang, X.; Yang, Z.; Liu, X.; Niu, R.; et al. A telomere-to-telomere genome assembly of cotton provides insights into centromere evolution and short-season adaptation. Nat. Genet. 2025, 57, 1031–1043. [Google Scholar] [CrossRef]
  48. Yan, H.; Han, J.; Jin, S.; Han, Z.; Si, Z.; Yan, S.; Xuan, L.; Yu, G.; Guan, X.; Fang, L.; et al. Post-polyploidization centromere evolution in cotton. Nat. Genet. 2025, 57, 1021–1030. [Google Scholar] [CrossRef]
  49. Dover, G. Molecular drive: A cohesive mode of species evolution. Nature 1982, 299, 111–117. [Google Scholar] [CrossRef]
  50. Gao, D.; Gill, N.; Kim, H.R.; Walling, J.G.; Zhang, W.; Fan, C.; Yu, Y.; Ma, J.; SanMiguel, P.; Jiang, N.; et al. A lineage-specific centromere retrotransposon in Oryza brachyantha. Plant J. 2009, 60, 820–831. [Google Scholar] [CrossRef]
  51. Han, J.; Masonbrink, R.E.; Shan, W.; Song, F.; Zhang, J.; Yu, W.; Wang, K.; Wu, Y.; Tang, H.; Wendel, J.F.; et al. Rapid proliferation and nucleolar organizer targeting centromeric retrotransposons in cotton. Plant J. 2016, 88, 992–1005. [Google Scholar] [CrossRef] [PubMed]
  52. Naish, M.; Henderson, I.R. The structure, function, and evolution of plant centromeres. Genome Res 2024, 34, 161–178. [Google Scholar] [CrossRef]
  53. Sharma, A.; Wolfgruber, T.K.; Presting, G.G. Tandem repeats derived from centromeric retrotransposons. BMC Genom. 2013, 14, 142. [Google Scholar] [CrossRef]
  54. Tek, A.L.; Jiang, J. The centromeric regions of potato chromosomes contain megabase-sized tandem arrays of telomere-similar sequence. Chromosoma 2004, 113, 77–83. [Google Scholar] [CrossRef]
  55. Chen, W.; Yan, M.; Chen, S.; Sun, J.; Wang, J.; Meng, D.; Li, J.; Zhang, L.; Guo, L. The complete genome assembly of Nicotiana benthamiana reveals the genetic and epigenetic landscape of centromeres. Nat. Plants 2024, 10, 1928–1943. [Google Scholar] [CrossRef]
  56. Navrátilová, P.; Toegelová, H.; Tulpová, Z.; Kuo, Y.T.; Stein, N.; Doležel, J.; Houben, A.; Šimková, H.; Mascher, M. Prospects of telomere-to-telomere assembly in barley: Analysis of sequence gaps in the MorexV3 reference genome. Plant Biotechnol. J. 2022, 20, 1373–1386. [Google Scholar] [CrossRef]
  57. Fulnecková, J.; Sevcíková, T.; Fajkus, J.; Lukesová, A.; Lukes, M.; Vlcek, C.; Lang, B.F.; Kim, E.; Eliás, M.; Sykorová, E. A broad phylogenetic survey unveils the diversity and evolution of telomeres in eukaryotes. Genome Biol. Evol. 2013, 5, 468–483. [Google Scholar] [CrossRef]
  58. Chen, J.; Wang, Z.; Tan, K.; Huang, W.; Shi, J.; Li, T.; Hu, J.; Wang, K.; Wang, C.; Xin, B.; et al. A complete telomere-to-telomere assembly of the maize genome. Nat. Genet. 2023, 55, 1221–1231. [Google Scholar] [CrossRef]
  59. Ricchetti, M.; Dujon, B.; Fairhead, C. Distance from the chromosome end determines the efficiency of double strand break repair in subtelomeres of haploid yeast. J. Mol. Biol. 2003, 328, 847–862. [Google Scholar] [CrossRef]
  60. Bass, H.W. Telomere dynamics unique to meiotic prophase: Formation and significance of the bouquet. Cell Mol. Life Sci. 2003, 60, 2319–2324. [Google Scholar] [CrossRef]
  61. Mefford, H.C.; Trask, B.J. The complex structure and dynamic evolution of human subtelomeres. Nat. Rev. Genet. 2002, 3, 91–102. [Google Scholar] [CrossRef] [PubMed]
  62. Hori, Y.; Engel, C.; Kobayashi, T. Regulation of ribosomal RNA gene copy number, transcription and nucleolus organization in eukaryotes. Nat. Rev. Mol. Cell Biol. 2023, 24, 414–429. [Google Scholar] [CrossRef]
  63. Rosselló, J.A.; Maravilla, A.J.; Rosato, M. The Nuclear 35S rDNA World in Plant Systematics and Evolution: A Primer of Cautions and Common Misconceptions in Cytogenetic Studies. Front. Plant Sci. 2022, 13, 788911. [Google Scholar] [CrossRef]
  64. Sone, T.; Fujisawa, M.; Takenaka, M.; Nakagawa, S.; Yamaoka, S.; Sakaida, M.; Nishiyama, R.; Yamato, K.T.; Ohmido, N.; Fukui, K.; et al. Bryophyte 5S rDNA was inserted into 45S rDNA repeat units after the divergence from higher land plants. Plant Mol. Biol. 1999, 41, 679–685. [Google Scholar] [CrossRef]
  65. Galián, J.A.; Rosato, M.; Rosselló, J.A. Early evolutionary colocalization of the nuclear ribosomal 5S and 45S gene families in seed plants: Evidence from the living fossil gymnosperm Ginkgo biloba. Heredity 2012, 108, 640–646. [Google Scholar] [CrossRef]
  66. Ganley, A.R.; Kobayashi, T. Highly efficient concerted evolution in the ribosomal DNA repeats: Total rDNA repeat variation revealed by whole-genome shotgun sequence data. Genome Res. 2007, 17, 184–191. [Google Scholar] [CrossRef] [PubMed]
  67. Simon, U.K.; Weiss, M. Intragenomic variation of fungal ribosomal genes is higher than previously thought. Mol. Biol. Evol. 2008, 25, 2251–2254. [Google Scholar] [CrossRef] [PubMed]
  68. Parks, M.M.; Kurylo, C.M.; Dass, R.A.; Bojmar, L.; Lyden, D.; Vincent, C.T.; Blanchard, S.C. Variant ribosomal RNA alleles are conserved and exhibit tissue-specific expression. Sci. Adv. 2018, 4, eaao0665. [Google Scholar] [CrossRef]
  69. Keller, I.; Chintauan-Marquier, I.C.; Veltsos, P.; Nichols, R.A. Ribosomal DNA in the grasshopper Podisma pedestris: Escape from concerted evolution. Genetics 2006, 174, 863–874. [Google Scholar] [CrossRef]
  70. Sims, J.; Sestini, G.; Elgert, C.; von Haeseler, A.; Schlögelhofer, P. Sequencing of the Arabidopsis NOR2 reveals its distinct organization and tissue-specific rRNA ribosomal variants. Nat. Commun. 2021, 12, 387. [Google Scholar] [CrossRef]
  71. Tulpová, Z.; Kovařík, A.; Toegelová, H.; Navrátilová, P.; Kapustová, V.; Hřibová, E.; Vrána, J.; Macas, J.; Doležel, J.; Šimková, H. Fine structure and transcription dynamics of bread wheat ribosomal DNA loci deciphered by a multi-omics approach. Plant Genome 2022, 15, e20191. [Google Scholar] [CrossRef]
  72. Miga, K.H. Centromere studies in the era of ‘telomere-to-telomere’ genomics. Exp. Cell Res. 2020, 394, 112127. [Google Scholar] [CrossRef]
  73. Wang, B.; Jia, P.; Gao, S.; Zhao, H.; Zheng, G.; Xu, L.; Ye, K. Long and Accurate: How HiFi Sequencing is Transforming Genomics. Genom. Proteom. Bioinform. 2025, qzaf003. [Google Scholar] [CrossRef]
  74. Wlodzimierz, P.; Rabanal, F.A.; Burns, R.; Naish, M.; Primetis, E.; Scott, A.; Mandáková, T.; Gorringe, N.; Tock, A.J.; Holland, D.; et al. Cycles of satellite and transposon evolution in Arabidopsis centromeres. Nature 2023, 618, 557–565. [Google Scholar] [CrossRef]
  75. Wang, B.; Jia, Y.; Dang, N.; Yu, J.; Bush, S.J.; Gao, S.; He, W.; Wang, S.; Guo, H.; Yang, X.; et al. Near telomere-to-telomere genome assemblies of two Chlorella species unveil the composition and evolution of centromeres in green algae. BMC Genom. 2024, 25, 356. [Google Scholar] [CrossRef]
  76. Jin, X.; Du, H.; Chen, M.; Zheng, X.; He, Y.; Zhu, A. A fully phased octoploid strawberry genome reveals the evolutionary dynamism of centromeric satellites. Genome Biol. 2025, 26, 17. [Google Scholar] [CrossRef]
Figure 1. Characteristics of typical tandem repeats in the water hyacinth genome. (af) The RepeatExplorer 2 output clustering graphical structure of tandem repeats. Individual reads are represented by tops and points (nodes), and their sequences are overlapped by edges. Similar sequences are clustered into dots, lines, and rings. (g) Sequence length of tandem repeats. (h) Genomic proportion of tandem repeats. (i) GC content of tandem repeats.
Horticulturae 11 00657 g001
Figure 2. In silico distribution of typical tandem repeats in the water hyacinth genome. (a) Genomic proportion of CL1, CL5, CL36/CL48, CL121, and CL145 in the assembled genome. (b) Chromosome distribution of typical tandem repeats in water hyacinth. CL1 (dark purple), CL5 (orange), CL121 (pink), CL36/CL48 (green), and CL145 (red). The height of the peak represents the relative abundance of the sequence.
Horticulturae 11 00657 g002
Figure 3. Genomic structure of the putative centromeric repetitive sequences in the water hyacinth genome. (a) FISH localization of putative CentEc on the metaphase chromosomes of P. crassipes. The DAPI-stained metaphase chromosomes are shown in blue. The signals of the one tandem repeat are shown in red. Scale bar: 2 μm. The color of the arrow indicates the strength of the signal, with red indicating a strong signal, white indicating a moderate signal, and green indicating a weak signal. (b) Schematic representation of the positions of the centromeres on 16 chromosomes. (c) Schematic diagram showing the different sequence compositions in the putative centromeric regions on chromosomes 5A and 5B. (d) Schematic diagram showing the different sequence compositions in the putative centromeric regions on chromosomes 1A and 1B. (e) Schematic diagram showing the different sequence compositions in the putative centromeric regions on chromosomes 2A and 2B. The black solid line under the putative CentEc and CREc sequences indicates that the corresponding regions are identified as the putative CentEc array and the CREc sequences.
Horticulturae 11 00657 g003
Figure 4. Genomic structure of the telomere and interstitial chromosome regions at the chromosome ends of water hyacinth. (a,b) FISH localization of telomere (a) and ICREc (b) on the metaphase chromosomes of P. crassipes. The DAPI-stained metaphase chromosomes are shown in blue. The signals of the two tandem repeats are shown in red. Scale bar: 2 μm. The color of the arrow indicates the strength of the signal, with red indicating a strong signal, white indicating a moderate signal, and green indicating a weak signal. (c,d) Comparison of the lengths of the telomeres and ICREc of 16 chromosomes. (e,f) Schematic diagram showing the different sequence compositions in the telomeric and interstitial chromosome regions on chromosomes 4A (e) and 5A (f).
Horticulturae 11 00657 g004
Figure 5. Genomic structure of the 5S and 35S rDNA arrays in the water hyacinth genome. (a,b) Schematic diagram of the sequence structure of the 5S and 35S rDNA repeat units. (c,d) FISH localization of 5S and 35S rDNA on the metaphase chromosomes of P. crassipes. The DAPI-stained metaphase chromosomes are shown in blue. The signals of the two tandem repeats are shown in red. Scale bar: 2 μm. The color of the arrow indicates the strength of the signal, with red indicating a strong signal, white indicating a moderate signal, and green indicating a weak signal. (e,f) Schematic diagram showing the different sequence compositions in the regions of 5S (e) and 35S rDNA (f) on chromosomes 8A, 8B, 4A, and 4B.
Horticulturae 11 00657 g005
Figure 6. Dot plot analysis of 5S rDNA NTS and 35S rDNA IGS in the water hyacinth genome. (a) Dot plot analysis of 5S rDNA NTS between chromosome 8A and chromosome 8B. (b) Dot plot analysis of 35S rDNA NTS between chromosome 4A and chromosome 4B. Sequence similarities exceeding 50% over a 100-bp sliding window were displayed as dots or diagonal lines.
Horticulturae 11 00657 g006
Disclaimer/Publisher’s Note: The statements, opinions and data contained in all publications are solely those of the individual author(s) and contributor(s) and not of MDPI and/or the editor(s). MDPI and/or the editor(s) disclaim responsibility for any injury to people or property resulting from any ideas, methods, instructions or products referred to in the content.

