
Optimizing Plasma Discharge Intensities and Spraying Intervals for Enhanced Growth, Mineral Uptake, and Yield in Aeroponically Grown Lettuce


Abstract
1. Introduction
2. Materials and Methods
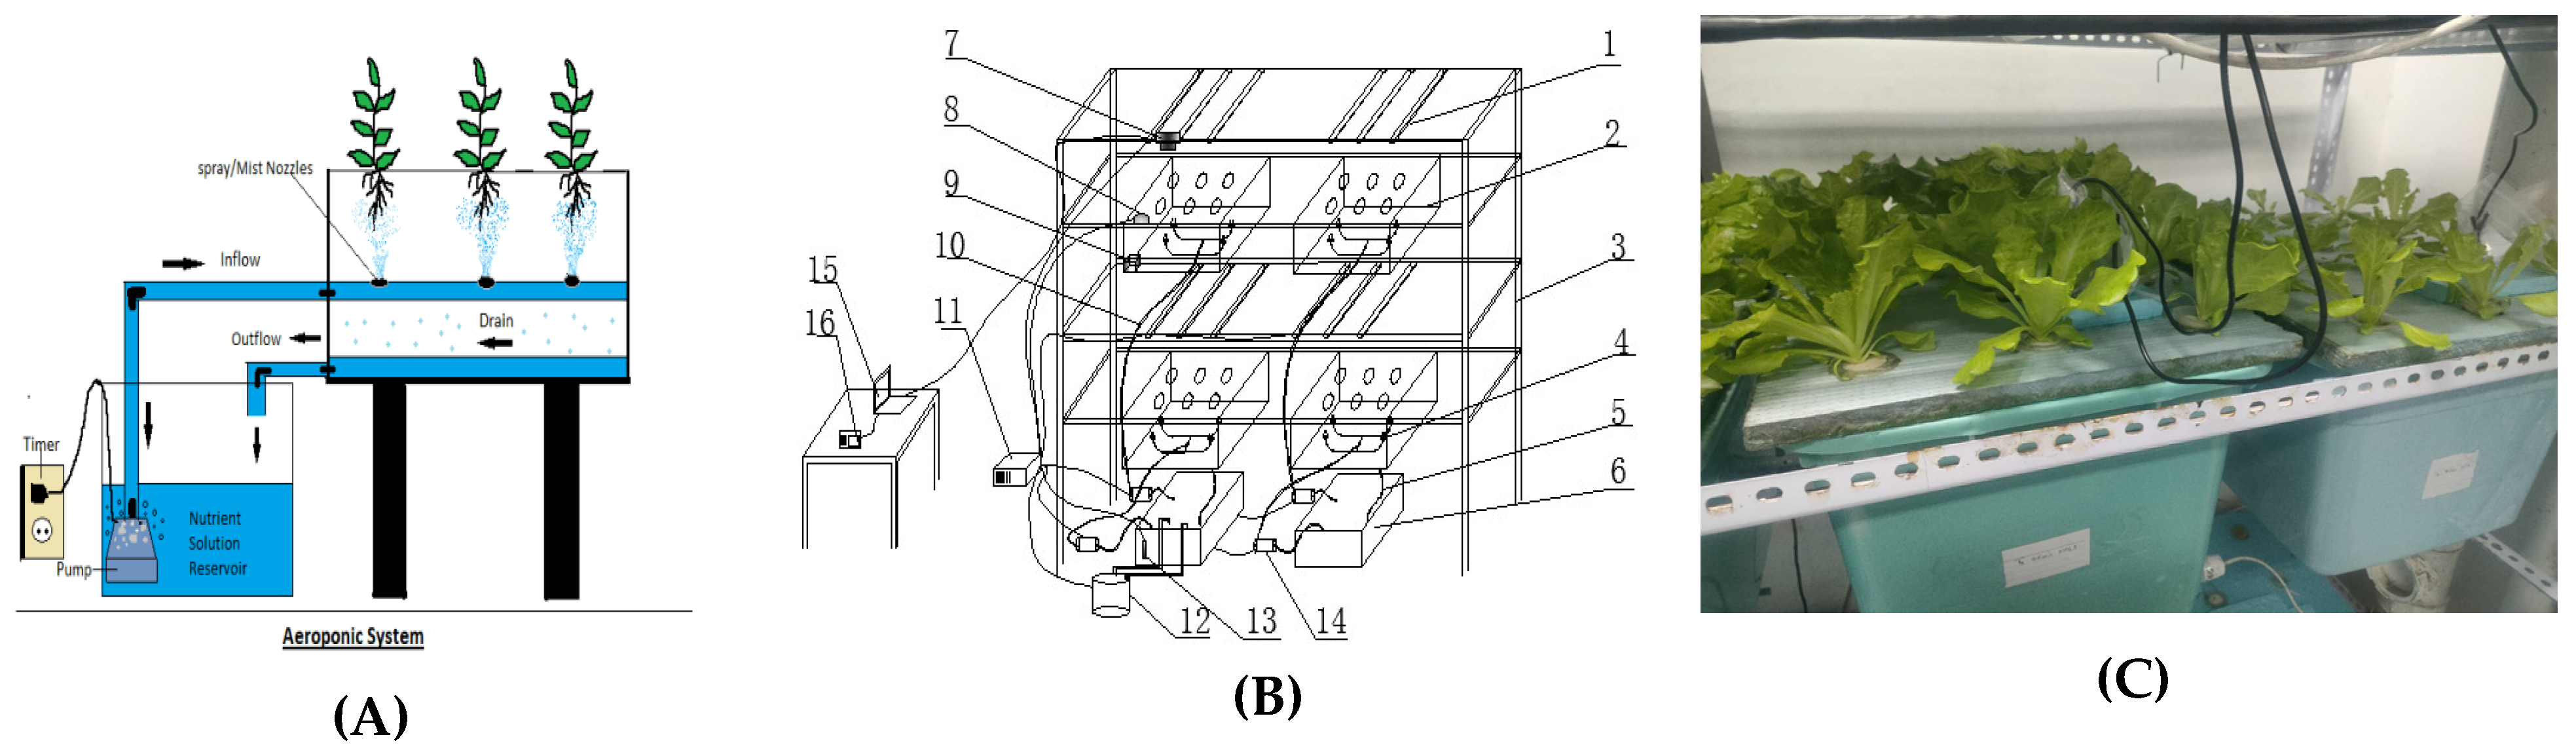
2.1. Aeroponic System
2.2. Materials and Experimental Setup
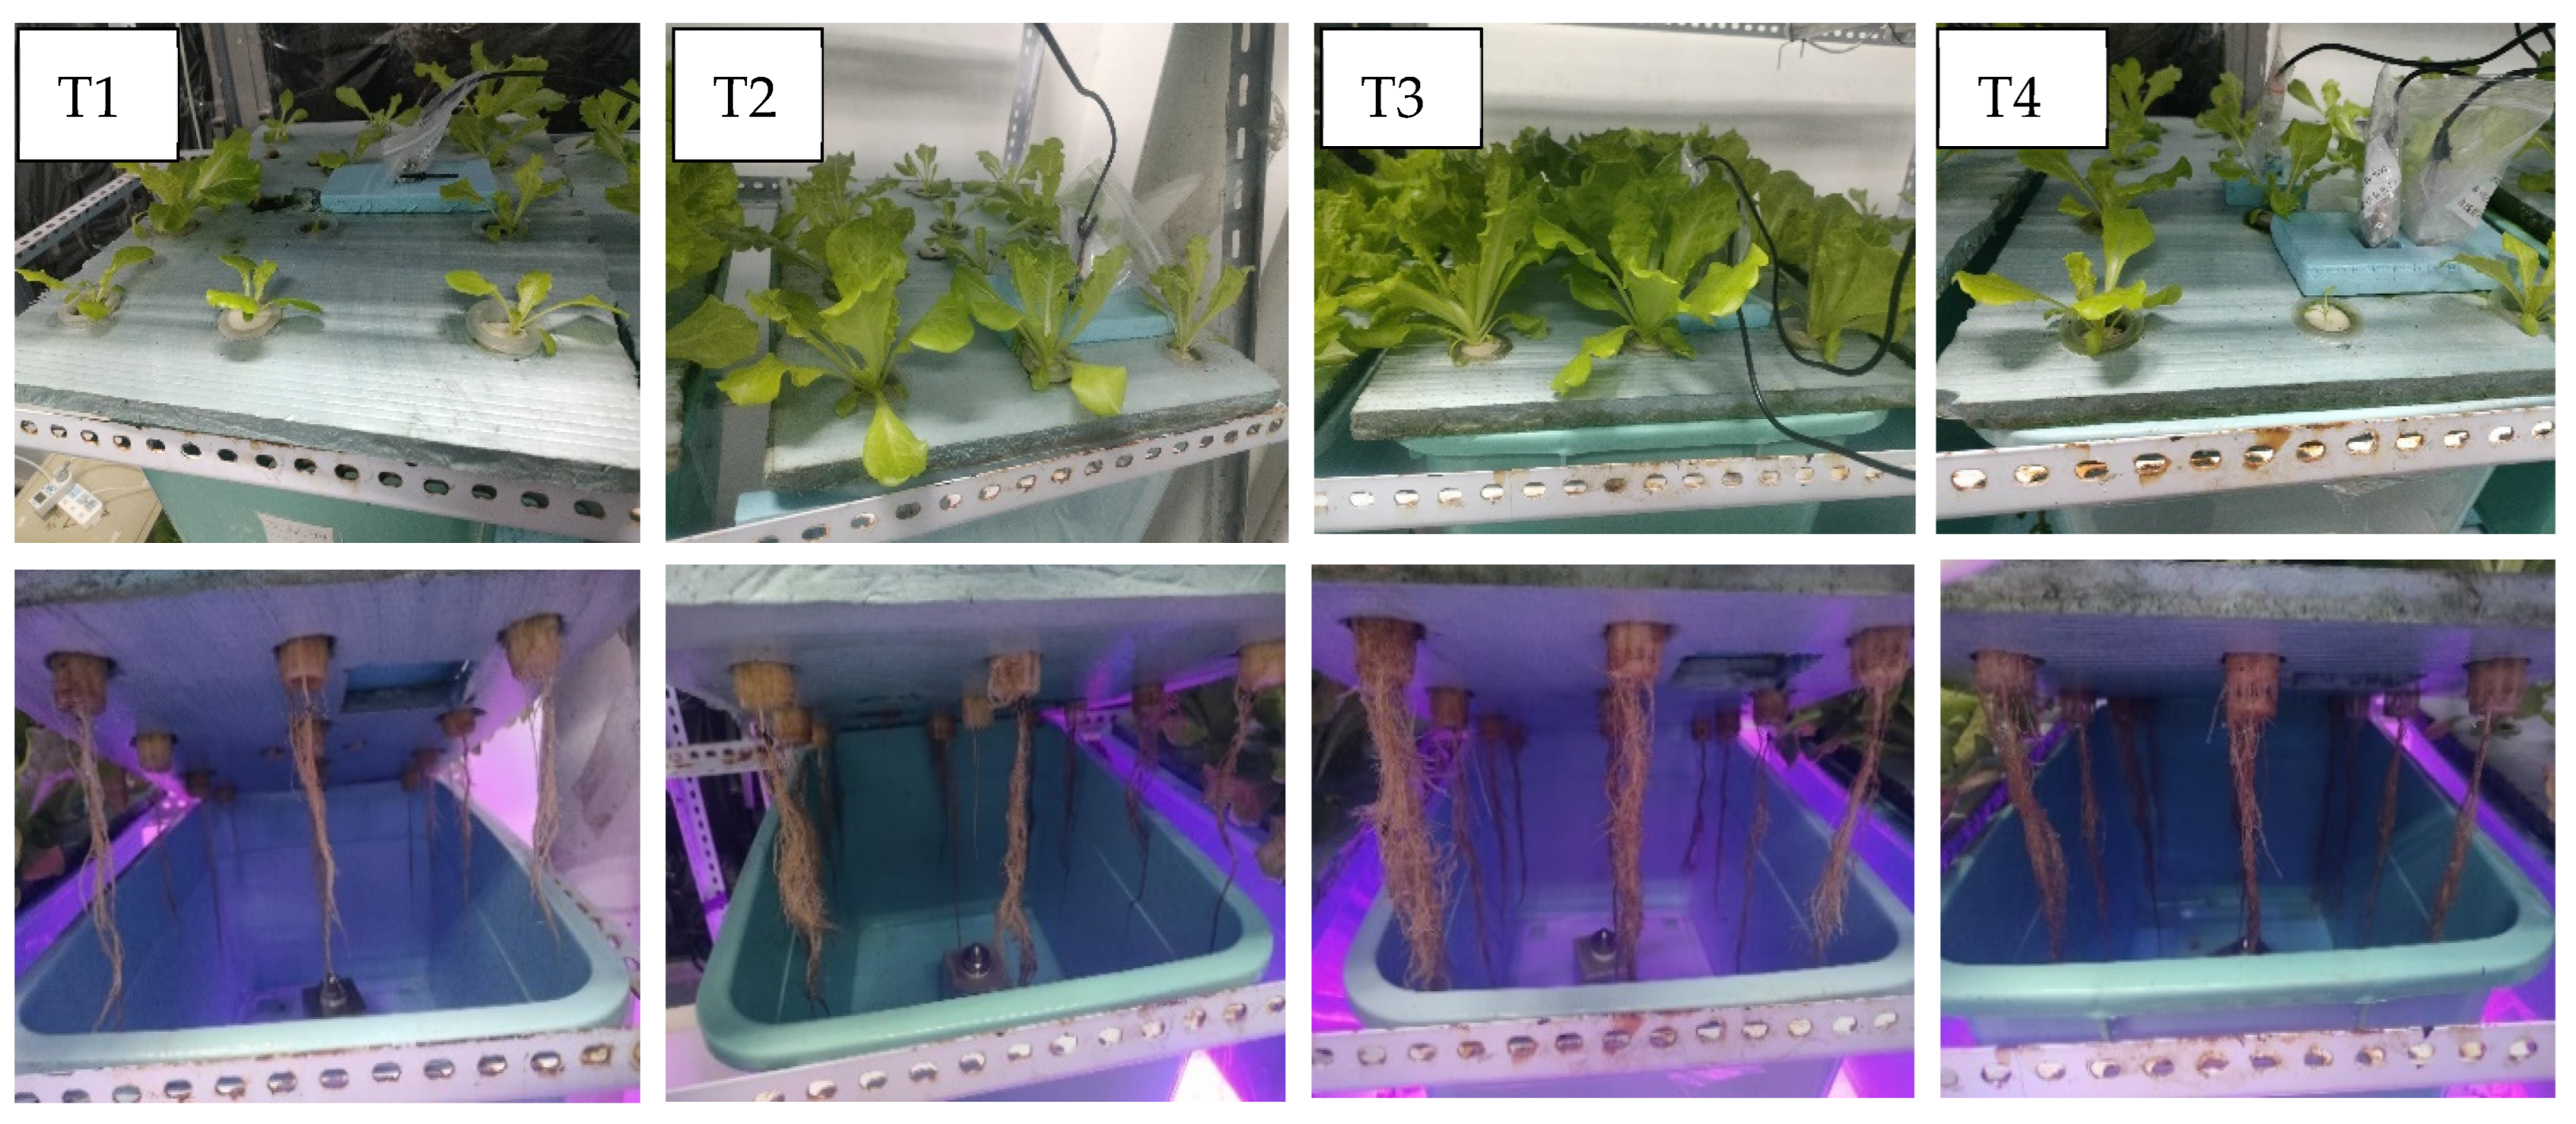
2.2.1. Experimental Design Overview
2.2.2. Plant Allocation and Selection for Analysis
2.2.3. Simultaneous Cultivation
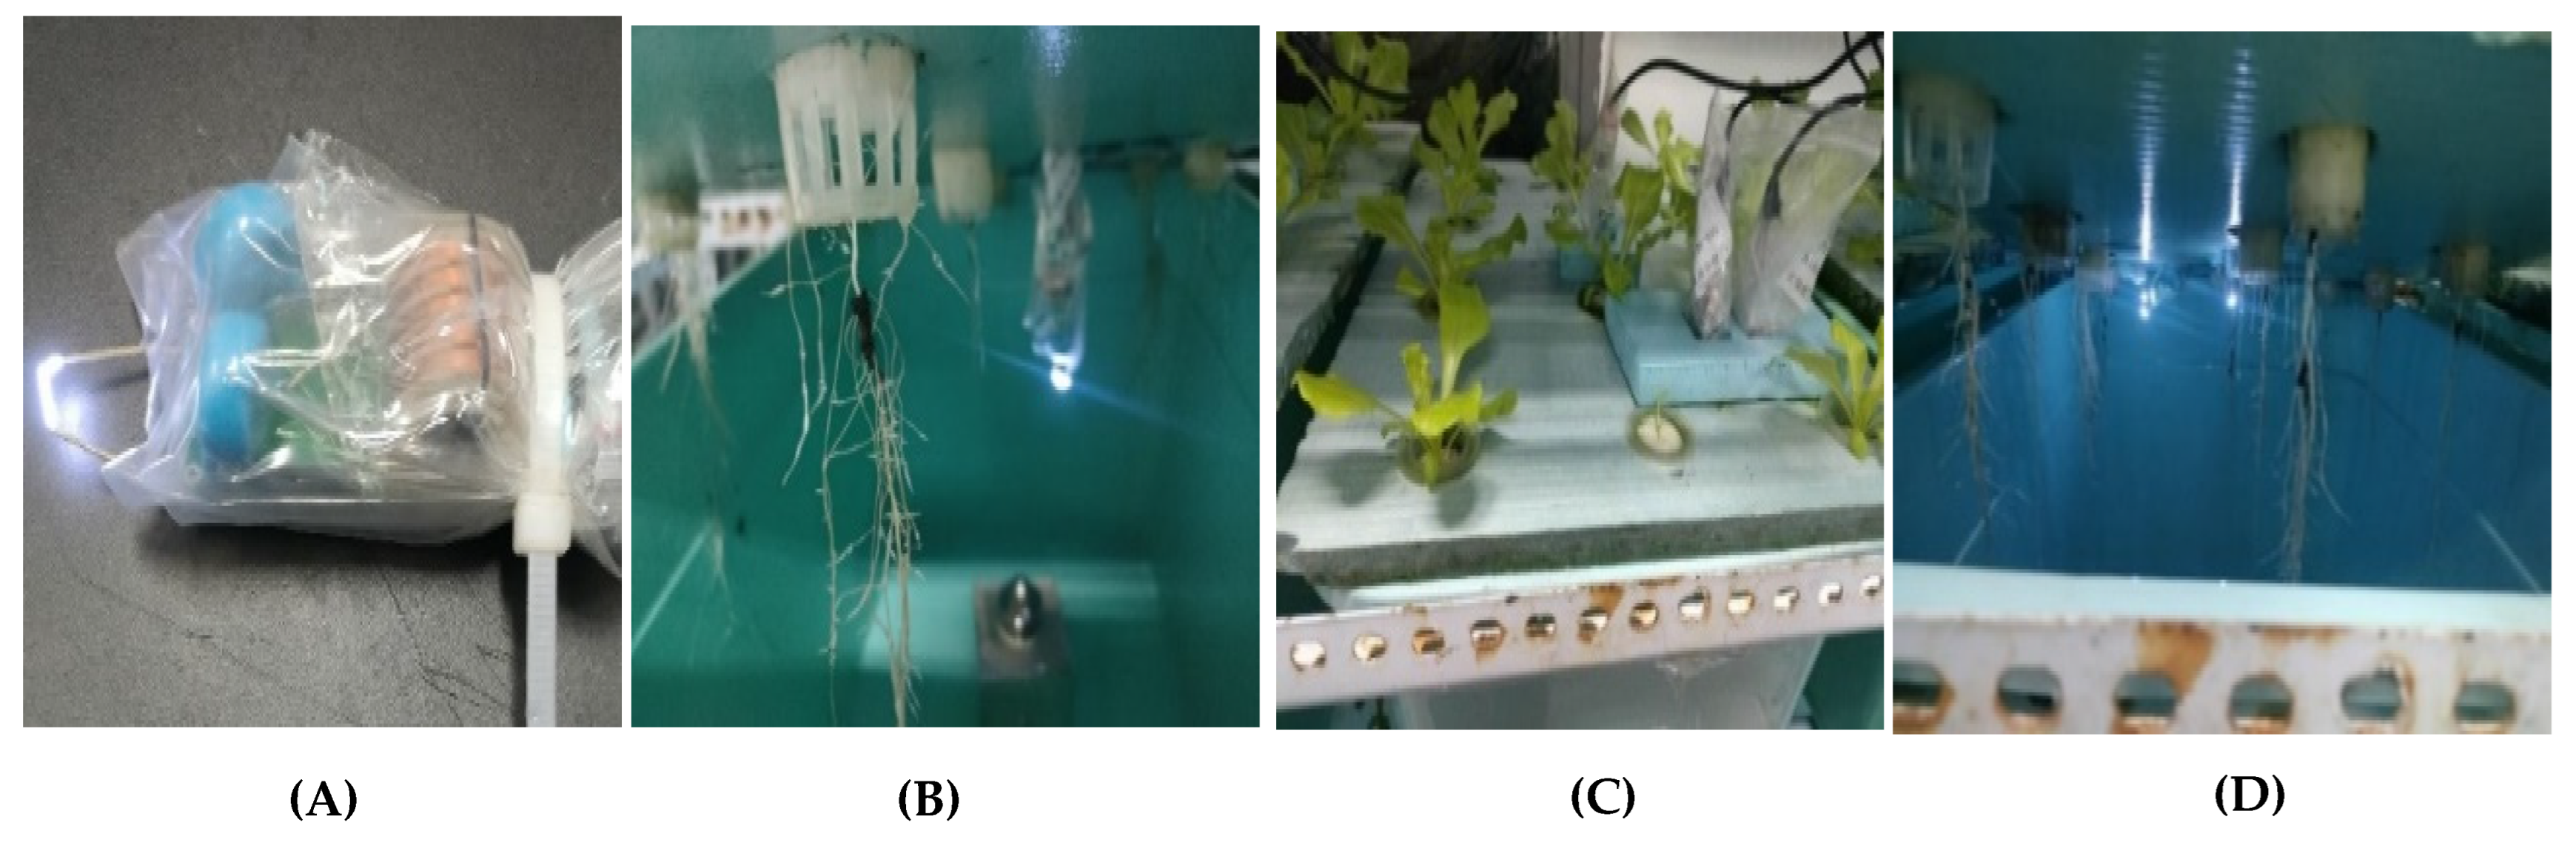
2.3. DC Plasma Discharging in the Aeroponic System
- (i)
- N2(g) + e− → N + N + e−
- (ii)
- O2(g) + e− → O + O + e−
- (iii)
- H2O + e− → OH− + H+ + e−
- (iv)
- H2O → OH− + H+ (UV irradiation)
- (i)
- O2(g) + N → NO + O,
- (ii)
- O + N2(g) → NO + N
- (iii)
- NO2(g) + O + M → NO3− + M
- (iv)
- H + N → NH
- (v)
- H + NH → NH2(g)
- (vi)
- H + NH2(g) → NH3(g)
2.4. Detection of NH3 and O3 in the Aeroponic Growth Chamber
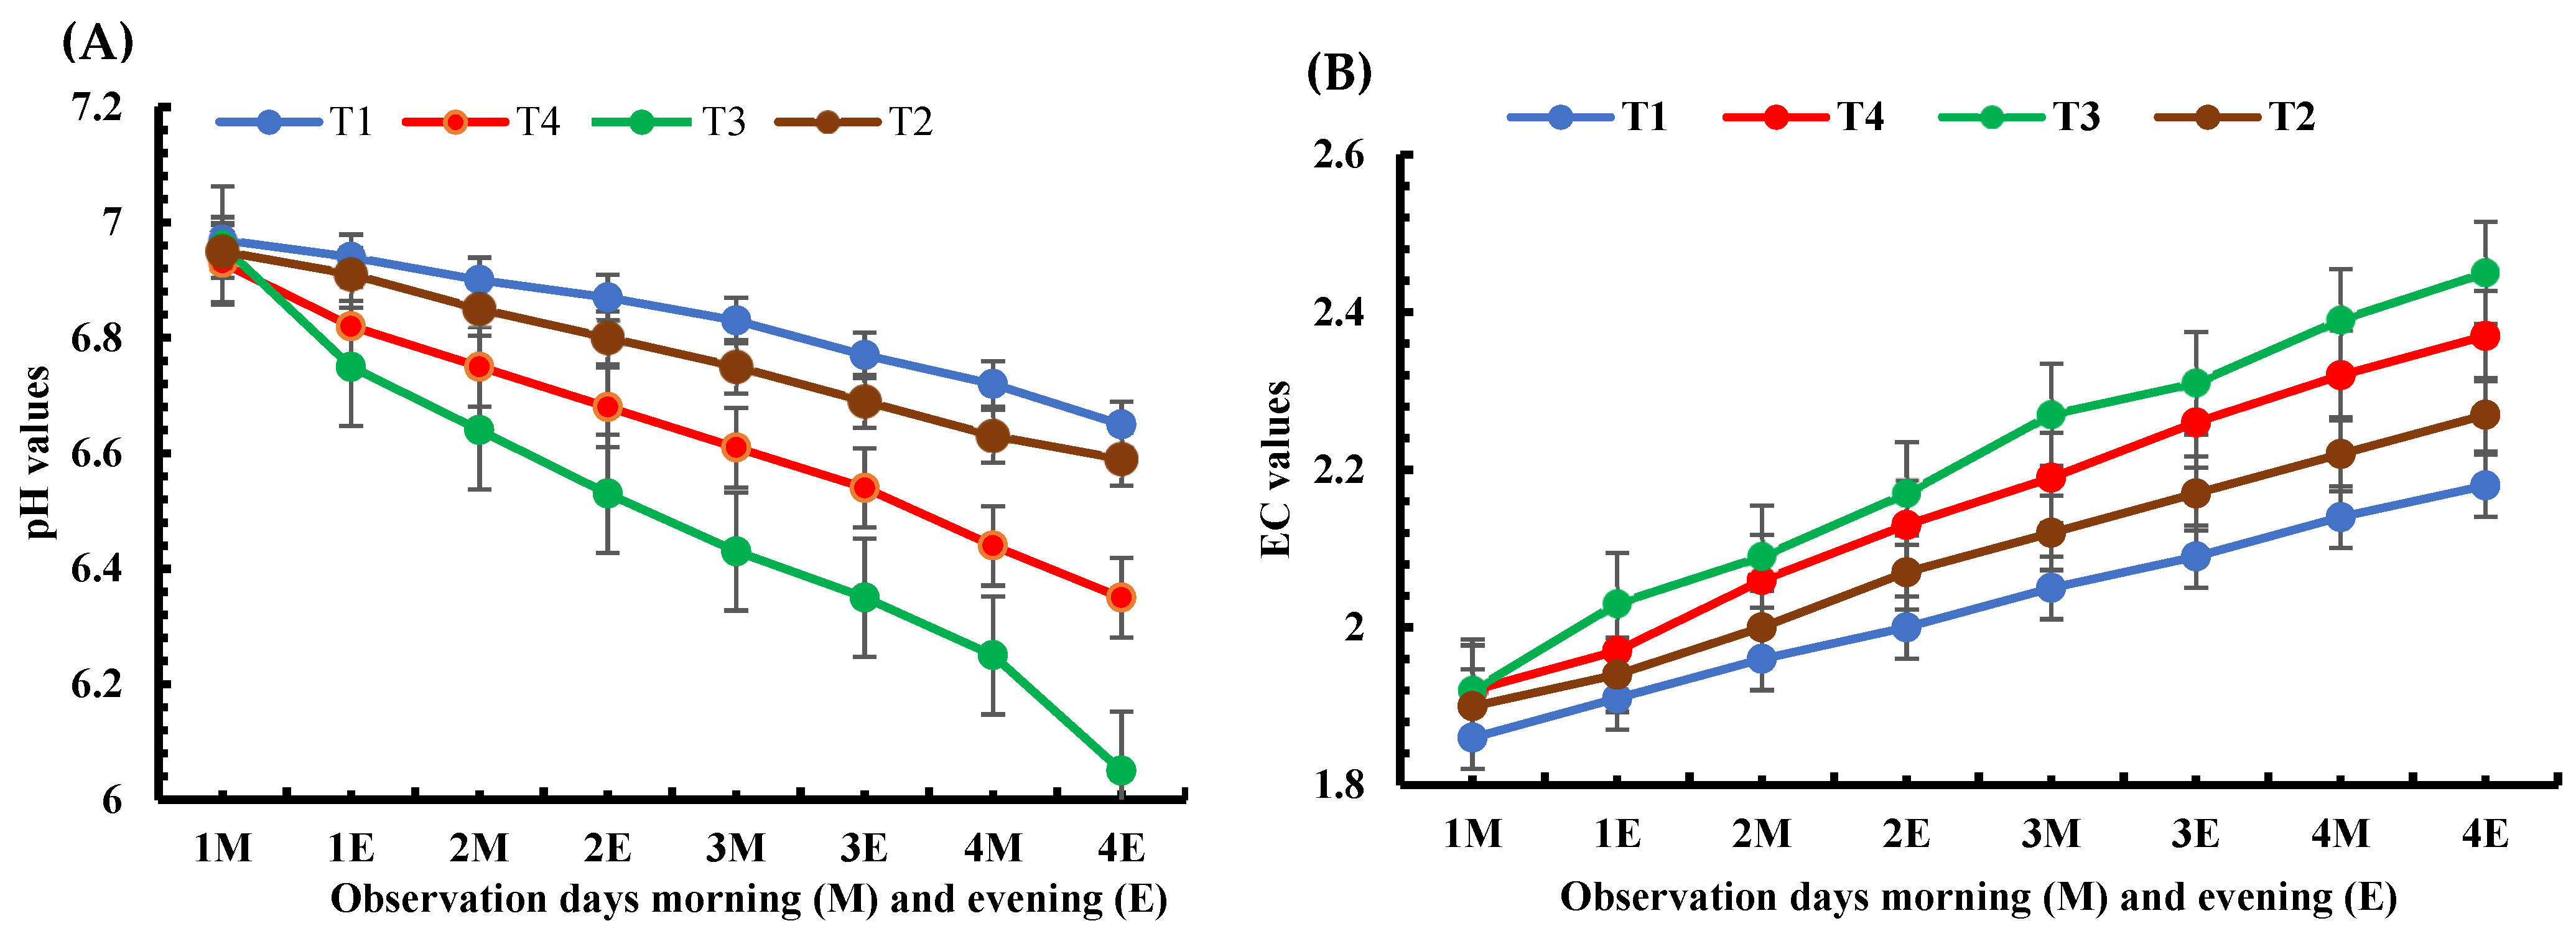
2.5. Nutritional Solution pH and EC Measurement
2.6. Lettuce Growth and Yield Measurement
2.7. Mineral Uptake
2.8. Analytical Statistics
2.9. Modelling Approach
3. Results
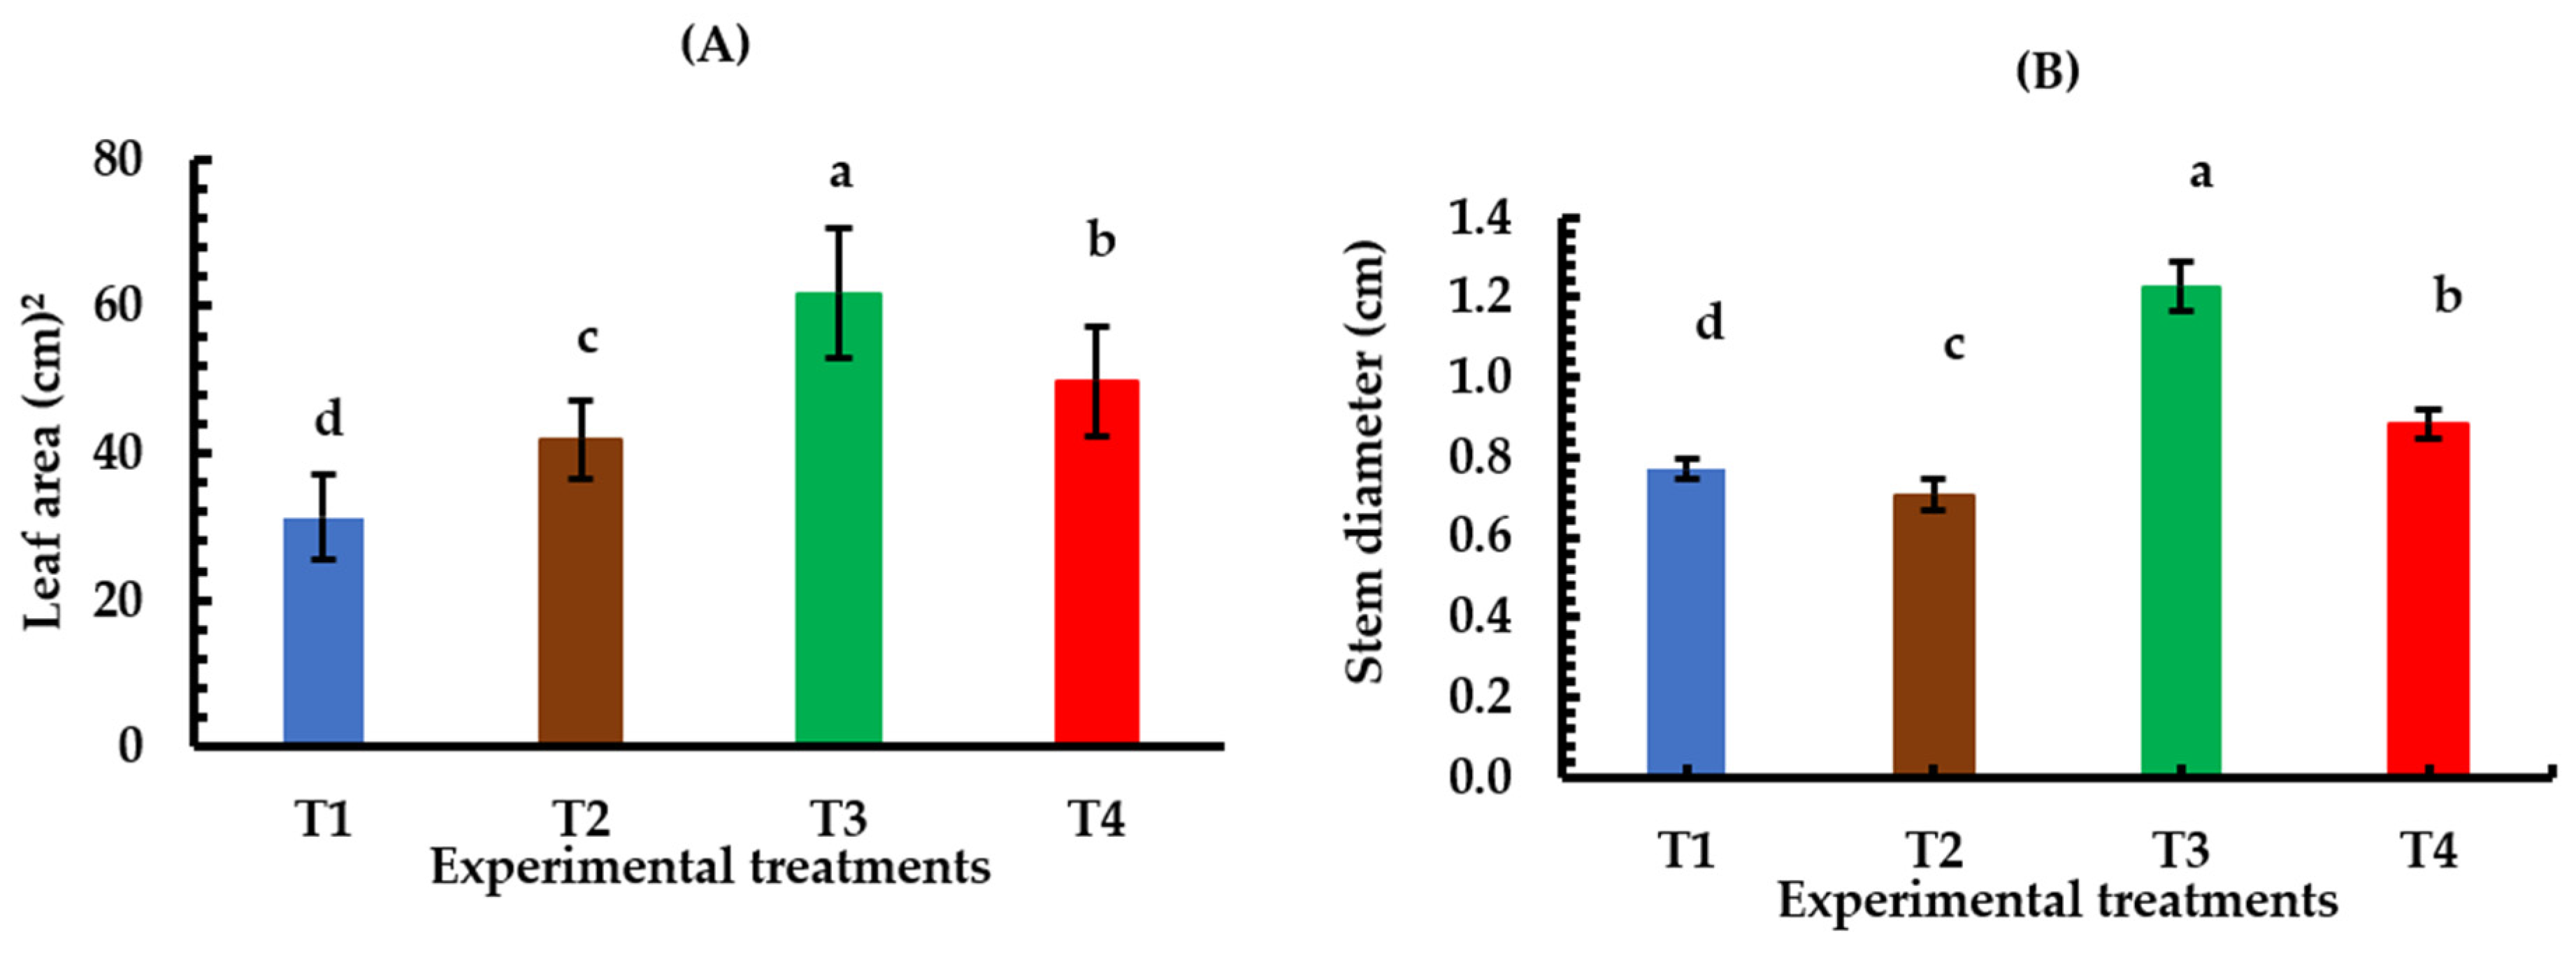
3.1. Plant Growth
3.2. Plant Yield and Root-to-Shoot Ratio
3.3. Mineral Uptake Efficiency
4. Discussion
4.1. Plasma Discharge Effects on Nutritional Solution’s EC and pH Levels
4.2. Effects of Plasma Intensities and Spraying Intervals on Lettuce Plant Growth
4.3. Effects of Plasma Intensities and Spraying Intervals on Lettuce Plant Yield
4.4. Effects of Plasma Intensities and Spraying Intervals on Mineral Uptake
5. Conclusions
Author Contributions
Funding
Data Availability Statement
Conflicts of Interest
References
- Raviv, M.; Lieth, J.H.; Bar-Tal, A. Significance of Soilless Culture in Agriculture. In Soilless Culture; Elsevier: Amsterdam, The Netherlands, 2019; pp. 3–14. ISBN 978-0-444-63696-6. [Google Scholar]
- Tang, L.; Syed, A.-A.; Otho, A.R.; Junejo, A.R.; Tunio, M.H.; Hao, L.; Asghar Ali, M.N.H.; Brohi, S.A.; Otho, S.A.; Channa, J.A. Intelligent Rapid Asexual Propagation Technology—A Novel Aeroponics Propagation Approach. Agronomy 2024, 14, 2289. [Google Scholar] [CrossRef]
- Mao, H.; Hang, T.; Zhang, X.; Lu, N. Both Multi-Segment Light Intensity and Extended Photoperiod Lighting Strategies, with the Same Daily Light Integral, Promoted Lactuca sativa L. Growth and Photosynthesis. Agronomy 2019, 9, 857. [Google Scholar] [CrossRef]
- Zhou, J.; Li, P.; Wang, J.; Fu, W. Growth, Photosynthesis, and Nutrient Uptake at Different Light Intensities and Temperatures in Lettuce. HortScience 2019, 54, 1925–1933. [Google Scholar] [CrossRef]
- Zhou, J.; Li, P.; Wang, J. Effects of Light Intensity and Temperature on the Photosynthesis Characteristics and Yield of Lettuce. Horticulturae 2022, 8, 178. [Google Scholar] [CrossRef]
- Calori, A.H.; Factor, T.L.; Feltran, J.C.; Watanabe, E.Y.; Moraes, C.C.D.; Purquerio, L.F.V. Electrical Conductivity of the Nutrient Solution and Plant Density in Aeroponic Production of Seed Potato under Tropical Conditions (Winter/Spring). Bragantia 2017, 76, 23–32. [Google Scholar] [CrossRef]
- Spinoff, N. Progressive Plant Growing Has Business Blooming. Environmental and Agricultural Resources; NASA Spinoff: New York, NY, USA, 2006; pp. 64–77. [Google Scholar]
- Kumar, A.; Trivedi, A.; Nandeha, N.; Patidar, G.; Choudhary, R.; Singh, D. A Comprehensive Analysis of Technology in Aeroponics: Presenting the Adoption and Integration of Technology in Sustainable Agriculture Practices. Int. J. Environ. Clim. Chang. 2024, 14, 872–882. [Google Scholar] [CrossRef]
- Zhang, W.; Wu, Q.; Sun, C.; Ge, D.; Cao, J.; Liang, W.; Yin, Y.; Li, H.; Cao, H.; Zhang, W.; et al. Biomass-based Lateral Root Morphological Parameter Models for Rapeseed (Brassica napus L.). Food Energy Secur. 2024, 13, e519. [Google Scholar] [CrossRef]
- Elsherbiny, O.; Gao, J.; Ma, M.; Guo, Y.; Tunio, M.H.; Mosha, A.H. Advancing Lettuce Physiological State Recognition in IoT Aeroponic Systems: A Meta-Learning-Driven Data Fusion Approach. Eur. J. Agron. 2024, 161, 127387. [Google Scholar] [CrossRef]
- Shatilov, M.; Razin, A.; Ivanova, M. Analysis of the World Lettuce Market; IOP Publishing: Bristol, UK, 2019; Volume 395, p. 012053. [Google Scholar]
- Observatory of Economic Complexity. Lettuce (HS: 0705) Product Trade, Exporters and Importers. Available online: https://oec.world/en/profile/hs/lettuce (accessed on 5 June 2025).
- Nicholson, C.F.; Eaton, M.; Gómez, M.I.; Mattson, N.S. Economic and Environmental Performance of Controlled-Environment Supply Chains for Leaf Lettuce. Eur. Rev. Agric. Econ. 2023, 50, 1547–1582. [Google Scholar] [CrossRef]
- Gargaro, M.; Murphy, R.J.; Harris, Z.M. Let-Us Investigate; A Meta-Analysis of Influencing Factors on Lettuce Crop Yields within Controlled-Environment Agriculture Systems. Plants 2023, 12, 2623. [Google Scholar] [CrossRef]
- Gao, H.; Mao, H.; Ullah, I. Analysis of Metabolomic Changes in Lettuce Leaves under Low Nitrogen and Phosphorus Deficiencies Stresses. Agriculture 2020, 10, 406. [Google Scholar] [CrossRef]
- Gao, H.; Gong, L.; Ni, J.; Li, Q. Metabolomics Analysis of Lettuce (Lactuca sativa L.) Affected by Low Potassium Supply. Agriculture 2022, 12, 1153. [Google Scholar] [CrossRef]
- Ullah, I.; Mao, H.; Rasool, G.; Gao, H.; Javed, Q.; Sarwar, A.; Khan, M.I. Effect of Deficit Irrigation and Reduced N Fertilization on Plant Growth, Root Morphology and Water Use Efficiency of Tomato Grown in Soilless Culture. Agronomy 2021, 11, 228. [Google Scholar] [CrossRef]
- Mao, H.; Wang, Y.; Yang, N.; Liu, Y.; Zhang, X. Effects of Nutrient Solution Irrigation Quantity and Powdery Mildew Infection on the Growth and Physiological Parameters of Greenhouse Cucumbers. Int. J. Agric. Biol. Eng. 2022, 15, 68–74. [Google Scholar] [CrossRef]
- Zhang, C.; Zhang, W.; Yan, H.; Ni, Y.; Akhlaq, M.; Zhou, J.; Xue, R. Effect of Micro–Spray on Plant Growth and Chlorophyll Fluorescence Parameter of Tomato under High Temperature Condition in a Greenhouse. Sci. Hortic. 2022, 306, 111441. [Google Scholar] [CrossRef]
- Xue, R.; Zhang, C.; Yan, H.; Li, J.; Ren, J.; Akhlaq, M.; Hameed, M.U.; Disasa, K.N. Physiological Response of Tomato and Cucumber Plants to Micro-Spray in High-Temperature Environment: A Scientific and Effective Means of Alleviating Crop Heat Stress. Agronomy 2023, 13, 2798. [Google Scholar] [CrossRef]
- Li, B.; Peng, L.; Cao, Y.; Liu, S.; Zhu, Y.; Dou, J.; Yang, Z.; Zhou, C. Insights into Cold Plasma Treatment on the Cereal and Legume Proteins Modification: Principle, Mechanism, and Application. Foods 2024, 13, 1522. [Google Scholar] [CrossRef] [PubMed]
- Yang, X.; Ma, L.; Zheng, J.; Qiao, Y.; Bai, J.; Cai, J. Effects of Atmospheric Pressure Plasma Treatment on the Quality and Cellulose Modification of Brown Rice. Innov. Food Sci. Emerg. Technol. 2024, 96, 103744. [Google Scholar] [CrossRef]
- Zhou, C.; Zhou, Y.; Tang, Q.; Sun, Y.; Ji, F.; Wu, J.; Yu, H.; Liu, T.; Yang, W.; Liu, S. Impact of Argon Dielectric Barrier Discharge Cold Plasma on the Physicochemical and Cooking Properties of Lightly-Milled Rice. Innov. Food Sci. Emerg. Technol. 2024, 92, 103580. [Google Scholar] [CrossRef]
- Thirumdas, R.; Kothakota, A.; Annapure, U.; Siliveru, K.; Blundell, R.; Gatt, R.; Valdramidis, V.P. Plasma Activated Water (PAW): Chemistry, Physico-Chemical Properties, Applications in Food and Agriculture. Trends Food Sci. Technol. 2018, 77, 21–31. [Google Scholar] [CrossRef]
- Bradu, C.; Kutasi, K.; Magureanu, M.; Puač, N.; Živković, S. Reactive Nitrogen Species in Plasma-Activated Water: Generation, Chemistry and Application in Agriculture. J. Phys. D: Appl. Phys. 2020, 53, 223001. [Google Scholar] [CrossRef]
- Cui, H.; Ma, C.; Lin, L. Synergetic Antibacterial Efficacy of Cold Nitrogen Plasma and Clove Oil against Escherichia Coli O157: H7 Biofilms on Lettuce. Food Control 2016, 66, 8–16. [Google Scholar] [CrossRef]
- Cui, H.; Bai, M.; Yuan, L.; Surendhiran, D.; Lin, L. Sequential Effect of Phages and Cold Nitrogen Plasma against Escherichia Coli O157: H7 Biofilms on Different Vegetables. Int. J. Food Microbiol. 2018, 268, 1–9. [Google Scholar] [CrossRef]
- Zhou, C.; Hu, Y.; Zhou, Y.; Yu, H.; Li, B.; Yang, W.; Zhai, X.; Wang, X.; Liu, J.; Wang, J. Air and Argon Cold Plasma Effects on Lipolytic Enzymes Inactivation, Physicochemical Properties and Volatile Profiles of Lightly-Milled Rice. Food Chem. 2024, 445, 138699. [Google Scholar] [CrossRef]
- Ranieri, P.; Sponsel, N.; Kizer, J.; Rojas-Pierce, M.; Hernández, R.; Gatiboni, L.; Grunden, A.; Stapelmann, K. Plasma Agriculture: Review from the Perspective of the Plant and Its Ecosystem. Plasma Process. Polym. 2021, 18, 2000162. [Google Scholar] [CrossRef]
- Attri, P.; Ishikawa, K.; Okumura, T.; Koga, K.; Shiratani, M.; Mildaziene, V. Impact of Seed Color and Storage Time on the Radish Seed Germination and Sprout Growth in Plasma Agriculture. Sci. Rep. 2021, 11, 2539. [Google Scholar] [CrossRef]
- Attri, P.; Ishikawa, K.; Okumura, T.; Koga, K.; Shiratani, M. Plasma Agriculture from Laboratory to Farm: A Review. Processes 2020, 8, 1002. [Google Scholar] [CrossRef]
- Adhikari, B.; Adhikari, M.; Ghimire, B.; Park, G.; Choi, E.H. Cold Atmospheric Plasma-Activated Water Irrigation Induces Defense Hormone and Gene Expression in Tomato Seedlings. Sci. Rep. 2019, 9, 16080. [Google Scholar] [CrossRef]
- Stolárik, T.; Henselová, M.; Martinka, M.; Novák, O.; Zahoranová, A.; Černák, M. Effect of Low-Temperature Plasma on the Structure of Seeds, Growth and Metabolism of Endogenous Phytohormones in Pea (Pisum sativum L.). Plasma Chem. Plasma Process. 2015, 35, 659–676. [Google Scholar] [CrossRef]
- Nasiru, M.M.; Frimpong, E.B.; Muhammad, U.; Qian, J.; Mustapha, A.T.; Yan, W.; Zhuang, H.; Zhang, J. Dielectric Barrier Discharge Cold Atmospheric Plasma: Influence of Processing Parameters on Microbial Inactivation in Meat and Meat Products. Compr. Rev. Food Sci. Food Saf. 2021, 20, 2626–2659. [Google Scholar] [CrossRef]
- Zhu, Y.; Li, C.; Cui, H.; Lin, L. Feasibility of Cold Plasma for the Control of Biofilms in Food Industry. Trends Food Sci. Technol. 2020, 99, 142–151. [Google Scholar] [CrossRef]
- Rashid, M.; Rashid, M.M.; Reza, M.A.; Talukder, M.R. Combined Effects of Air Plasma Seed Treatment and Foliar Application of Plasma Activated Water on Enhanced Paddy Plant Growth and Yield. Plasma Chem. Plasma Process. 2021, 41, 1081–1099. [Google Scholar] [CrossRef]
- Wu, X.; Wu, C.; Bian, Z.; Ye, Z.; Meng, L.; Xia, L.; Bao, E.; Cao, K. Abscisic Acid and Reactive Oxygen Species Were Involved in Slightly Acidic Electrolyzed Water-Promoted Seed Germination in Watermelon. Sci. Hortic. 2022, 291, 110581. [Google Scholar] [CrossRef]
- Sajib, S.A.; Billah, M.; Mahmud, S.; Miah, M.; Hossain, F.; Omar, F.B.; Roy, N.C.; Hoque, K.M.F.; Talukder, M.R.; Kabir, A.H.; et al. Plasma Activated Water: The next Generation Eco-Friendly Stimulant for Enhancing Plant Seed Germination, Vigor and Increased Enzyme Activity, a Study on Black Gram (Vigna mungo L.). Plasma Chem. Plasma Process. 2020, 40, 119–143. [Google Scholar] [CrossRef]
- Gavhane, K.P.; Hasan, M.; Singh, D.K.; Kumar, S.N.; Sahoo, R.N.; Alam, W. Determination of Optimal Daily Light Integral (DLI) for Indoor Cultivation of Iceberg Lettuce in an Indigenous Vertical Hydroponic System. Sci. Rep. 2023, 13, 10923. [Google Scholar] [CrossRef] [PubMed]
- Shieh, G.; Jan, S. The Effectiveness of Randomized Complete Block Design. Stat. Neerl. 2004, 58, 111–124. [Google Scholar] [CrossRef]
- Gao, H.; Wang, G.; Huang, Z.; Nie, L.; Liu, D.; Lu, X.; He, G.; Ostrikov, K.K. Plasma-Activated Mist: Continuous-Flow, Scalable Nitrogen Fixation, and Aeroponics. ACS Sustain. Chem. Eng. 2023, 11, 4420–4429. [Google Scholar] [CrossRef]
- MQ-131 Ozone Gas Sensor Datasheet; Zhengzhou Winsen Electronics Technology Co., Ltd.: Zhengzhou, China, 2024.
- MQ-137 Ammonia Gas Sensor Datasheet; Zhengzhou Winsen Electronics Technology Co., Ltd.: Zhengzhou, China, 2024.
- Amin, M.; Flowers, T. Evaluation of Kjeldahl Digestion Method. J. Res. Sci. 2004, 15, 159–179. [Google Scholar]
- Pal, A.; Kulkarni, M.B.; Gupta, H.; Ponnalagu, R.; Dubey, S.K.; Goel, S. Portable and Autonomous Device for Real-Time Colorimetric Detection: Validation for Phosphorous and Nitrite Detection. Sens. Actuators A Phys. 2021, 330, 112896. [Google Scholar] [CrossRef]
- Wieczorek, D.; Żyszka-Haberecht, B.; Kafka, A.; Lipok, J. Determination of Phosphorus Compounds in Plant Tissues: From Colourimetry to Advanced Instrumental Analytical Chemistry. Plant Methods 2022, 18, 22. [Google Scholar] [CrossRef]
- Bisergaeva, R.; Sirieva, Y. Determination of Calcium and Magnesium by Atomic Absorption Spectroscopy and Flame Photometry. IOP Conf. Ser. Mater. Sci. Eng. 2020, 1691, 012055. [Google Scholar] [CrossRef]
- Stevens, J. Applied Multivariate Statistics for the Social Sciences, 5th ed.; Routledge: New York, NY, USA, 2009; ISBN 978-1-136-91070-8. [Google Scholar]
- Härdle, W.K.; Simar, L. Applied Multivariate Statistical Analysis; Springer: Cham, Switzerland, 2019; ISBN 978-3-030-26005-7. [Google Scholar]
- Field, A.P. Discovering Statistics Using IBM SPSS Statistics: And Sex and Drugs and Rock “n” Roll, 4th ed.; Sage: Los Angeles, CA, USA, 2013; ISBN 978-1-4462-4917-8. [Google Scholar]
- Hair, J.F.; Black, W.C.; Babin, B.J.; Anderson, R.E. Multivariate Data Analysis, 7th ed.; Pearson: Harlow, UK, 2014; ISBN 978-1-292-02190-4. [Google Scholar]
- Tabachnick, B.G.; Fidell, L.S. Always learning. In Using Multivariate Statistics, 7th ed.; Pearson: New York, NY, USA, 2019; ISBN 978-0-13-479054-1. [Google Scholar]
- Cohen, J.; Cohen, P.; West, S.G.; Aiken, L.S. Applied Multiple Regression/Correlation Analysis for the Behavioral Sciences; Routledge: New York, NY, USA, 2013; ISBN 0-203-77444-2. [Google Scholar]
- Fox, J. Applied Regression Analysis and Generalized Linear Models; Sage Publications: London, UK, 2015; ISBN 1-4833-2131-2. [Google Scholar]
- Qureshi, W.A.; Gao, J.; Elsherbiny, O.; Mosha, A.H.; Tunio, M.H.; Qureshi, J.A. Boosting Aeroponic System Development with Plasma and High-Efficiency Tools: AI and IoT—A Review. Agronomy 2025, 15, 546. [Google Scholar] [CrossRef]
- Wang, Y.; Ma, G.; Du, X.; Liu, Y.; Wang, B.; Xu, G.; Mao, H. Effects of Nutrient Solution Irrigation Quantity and Downy Mildew Infection on Growth and Physiological Traits of Greenhouse Cucumber. Agronomy 2020, 10, 1921. [Google Scholar] [CrossRef]
- Grasso, N.; Fasciolo, B.; Awouda, A.M.M.; Bruno, G. A Smart Aeroponic Chamber: Structure and Architecture for an Efficient Production and Resource Management. In Hydroponics: The Future of Sustainable Farming; Springer: Berlin/Heidelberg, Germany, 2024; pp. 353–380. [Google Scholar]
- Forde, B.G.; Lea, P.J. Glutamate in Plants: Metabolism, Regulation, and Signalling. J. Exp. Bot. 2007, 58, 2339–2358. [Google Scholar] [CrossRef]
- İkiz, B.; Dasgan, H.Y.; Dere, S. Optimization of Root Spraying Time for Fresh Onion (Allium cepa L.) Cultivation in Aeroponics. Acta Hortic. 2020, 1273, 101–106. [Google Scholar] [CrossRef]
- Shabbir, A.; Mao, H.; Ullah, I.; Buttar, N.A.; Ajmal, M.; Lakhiar, I.A. Effects of Drip Irrigation Emitter Density with Various Irrigation Levels on Physiological Parameters, Root, Yield, and Quality of Cherry Tomato. Agronomy 2020, 10, 1685. [Google Scholar] [CrossRef]
- Mittler, R. ROS Are Good. Trends Plant Sci. 2017, 22, 11–19. [Google Scholar] [CrossRef]
- Foyer, C.H.; Noctor, G. Redox Homeostasis and Signaling in a Higher-CO2 World. Annu. Rev. Plant Biol. 2020, 71, 157–182. [Google Scholar] [CrossRef] [PubMed]
- Hussain, A.; Rizwan, M.; Ali, Q.; Ali, S. Seed Priming with Silicon Nanoparticles Improved the Biomass and Yield While Reduced the Oxidative Stress and Cadmium Concentration in Wheat Grains. Environ. Sci. Pollut. Res. 2019, 26, 7579–7588. [Google Scholar] [CrossRef]
- Del Río, L.A. ROS and RNS in Plant Physiology: An Overview. J. Exp. Bot. 2015, 66, 2827–2837. [Google Scholar] [CrossRef]
- Tsukagoshi, H. Control of Root Growth and Development by Reactive Oxygen Species. Curr. Opin. Plant Biol. 2016, 29, 57–63. [Google Scholar] [CrossRef] [PubMed]
- Ciriello, M.; Formisano, L.; Pannico, A.; El-Nakhel, C.; Fascella, G.; Duri, L.G.; Cristofano, F.; Gentile, B.R.; Giordano, M.; Rouphael, Y. Nutrient Solution Deprivation as a Tool to Improve Hydroponics Sustainability: Yield, Physiological, and Qualitative Response of Lettuce. Agronomy 2021, 11, 1469. [Google Scholar] [CrossRef]
- Scaltrito, E.; Cristiano, G.; Sdao, A.E.; Gruda, N.S.; Loconsole, D.; De Lucia, B. Influence of Water Spraying Intervals and Indole-3-Butyric Acid Concentrations on Salvia Rooted Cuttings Quality in a Closed Aeroponics System. Sci. Hortic. 2024, 337, 113452. [Google Scholar] [CrossRef]
- Sundar, L.S.; Chen, G.S. Study on the Growth Performance of Lettuce (Lactuca Sativa) and Pak Choi (Brassica Chinensis) in Different Aquaponic Growing Systems. Horticulturae 2020, 6, 69. [Google Scholar] [CrossRef]
- Khan, S.; Yu, H.; Li, Q.; Gao, Y.; Sallam, B.N.; Wang, H.; Liu, P.; Jiang, W. Exogenous Application of Amino Acids Improves the Growth and Yield of Lettuce by Enhancing Photosynthetic Assimilation and Nutrient Availability. Agronomy 2019, 9, 266. [Google Scholar] [CrossRef]
- Xie, Y.; Rathinasabapathi, B.; Schaffer, B.; Mylavarapu, R.; Liu, G. Phosphorus Uptake and Growth of Wild-Type Barley and Its Root-Hairless Mutant Cultured in Buffered- and Non-Buffered-P Solutions. Agronomy 2020, 10, 1556. [Google Scholar] [CrossRef]


| Compound Name | Compound Formula | Concentration (mg/L) | |
|---|---|---|---|
| 1 | Calcium Nitrate | Ca(NO3)2·4H2O | 945 |
| 2 | Potassium Nitrate | KNO3 | 607 |
| 3 | Magnesium Sulphate | MgSO4·7H2O | 493 |
| 4 | Ammonium Dihydrogen Phosphate | NH4H2PO4 | 115 |
| 5 | Boric Acid | H3BO3 | 2.86 |
| 6 | Zinc Sulphate | ZnSO4·7H2O | 0.22 |
| 7 | Ammonium Molybdate | (NH4)6Mo7O24 | 0.02 |
| 8 | Copper Sulphate | CuSO4·5H2O | 0.08 |
| 9 | Manganese Sulphate | MnSO4·4H2O | 2.13 |
| 10 | Iron-EDTA | Fe-EDTA | 28 |
| Effect | Value | F | Hypothesis df | Error df | Sig. | |
|---|---|---|---|---|---|---|
| Intercept | Pillai’s Trace | 1.00 | 6472.302b | 5.00 | 40.00 | 0.000 |
| Wilks’ Lambda | 0.00 | 6472.302b | 5.00 | 40.00 | 0.000 | |
| Hotelling’s Trace | 809.04 | 6472.302b | 5.00 | 40.00 | 0.000 | |
| Roy’s Largest Root | 809.04 | 6472.302b | 5.00 | 40.00 | 0.000 | |
| Spraying interval | Pillai’s Trace | 0.83 | 40.249b | 5.00 | 40.00 | 0.000 |
| Wilks’ Lambda | 0.17 | 40.249b | 5.00 | 40.00 | 0.000 | |
| Hotelling’s Trace | 5.03 | 40.249b | 5.00 | 40.00 | 0.000 | |
| Roy’s Largest Root | 5.03 | 40.249b | 5.00 | 40.00 | 0.000 | |
| Plasma discharge | Pillai’s Trace | 0.96 | 199.550b | 5.00 | 40.00 | 0.000 |
| Wilks’ Lambda | 0.04 | 199.550b | 5.00 | 40.00 | 0.000 | |
| Hotelling’s Trace | 24.94 | 199.550b | 5.00 | 40.00 | 0.000 | |
| Roy’s Largest Root | 24.94 | 199.550b | 5.00 | 40.00 | 0.000 | |
| Spraying interval × Plasma discharge | Pillai’s Trace | 0.90 | 71.935b | 5.00 | 40.00 | 0.000 |
| Wilks’ Lambda | 0.10 | 71.935b | 5.00 | 40.00 | 0.000 | |
| Hotelling’s Trace | 8.99 | 71.935b | 5.00 | 40.00 | 0.000 | |
| Roy’s Largest Root | 8.99 | 71.935b | 5.00 | 40.00 | 0.000 |
| Source/Factor | Measure Parameters | Type III Sum of Squares | df | Mean Square | F | Sig. |
|---|---|---|---|---|---|---|
| Spraying intervals | Leaf Number | 60.75 | 1 | 60.75 | 23.90 | 0.000 |
| Leaf Length | 24.14 | 1 | 24.14 | 24.82 | 0.000 | |
| Leaf Width | 9.28 | 1 | 9.28 | 28.73 | 0.000 | |
| Stem Diameter | 0.23 | 1 | 0.23 | 164.42 | 0.000 | |
| Leaf Area | 1530.59 | 1 | 1530.59 | 43.14 | 0.000 | |
| Plasma discharge | Leaf Number | 168.75 | 1 | 168.75 | 66.39 | 0.000 |
| Leaf Length | 106.68 | 1 | 106.68 | 109.67 | 0.000 | |
| Leaf Width | 41.59 | 1 | 41.59 | 128.80 | 0.000 | |
| Stem Diameter | 1.19 | 1 | 1.19 | 852.58 | 0.000 | |
| Leaf Area | 4403.54 | 1 | 4403.54 | 124.11 | 0.000 | |
| Spraying intervals × Plasma discharge | Leaf Number | 33.33 | 1 | 33.33 | 13.12 | 0.001 |
| Leaf Length | 3.69 | 1 | 3.69 | 3.79 | 0.058 | |
| Leaf Width | 4.5 | 1 | 4.50 | 13.94 | 0.001 | |
| Stem Diameter | 0.48 | 1 | 0.48 | 346.56 | 0.000 | |
| Leaf Area | 5.68 | 1 | 5.68 | 0.16 | 0.691 |
| Source/Factor | Measured Parameters | Type III Sum of Squares | df | Mean Square | F-Value | Sig. |
|---|---|---|---|---|---|---|
| Spraying interval (min) | Shoot fresh weight | 1155.029 | 1 | 1155.029 | 82.49 | 0.000 |
| Root fresh weight | 12.679 | 1 | 12.679 | 32.01 | 0.000 | |
| Edible yield | 1350.971 | 1 | 1350.971 | 91.47 | 0.000 | |
| Total biomass yield | 1625.41 | 1 | 1625.41 | 95.65 | 0.000 | |
| Ratio of root to shoot wet | 4.75 | 1 | 4.75 | 0.53 | 0.473 | |
| Ratio of root to shoot dry | 726.185 | 1 | 726.185 | 19.48 | 0.000 | |
| Plasma discharge | Shoot fresh weight | 3128.578 | 1 | 3128.58 | 223.45 | 0.000 |
| Root fresh weight | 32.489 | 1 | 32.49 | 82.01 | 0.000 | |
| Edible yield | 3528.956 | 1 | 3528.96 | 238.93 | 0.000 | |
| Total biomass yield | 4238.648 | 1 | 4238.65 | 249.44 | 0.000 | |
| Ratio of root to shoot wet | 55.255 | 1 | 55.26 | 6.10 | 0.017 | |
| Ratio of root to shoot dry | 2509.967 | 1 | 2509.97 | 67.34 | 0.000 | |
| Spraying intervals × Plasma discharge | Shoot fresh weight | 749.078 | 1 | 749.08 | 53.50 | 0.000 |
| Root fresh weight | 10.24 | 1 | 10.24 | 25.85 | 0.000 | |
| Edible yield | 889.671 | 1 | 889.67 | 60.24 | 0.000 | |
| Total biomass yield | 1090.804 | 1 | 1090.80 | 64.19 | 0.000 | |
| Ratio of root to shoot wet | 0.227 | 1 | 0.23 | 0.03 | 0.875 | |
| Ratio of root to shoot dry | 990.992 | 1 | 990.99 | 26.59 | 0.000 |
| Source/Factor | Uptake Minerals | Type III Sum of Squares | df | Mean Square | F | Sig. |
|---|---|---|---|---|---|---|
| Spraying interval | Nitrogen | 42.772 | 1 | 42.77 | 49.60 | 0.000 |
| Potassium | 215.796 | 1 | 215.80 | 324.42 | 0.000 | |
| Phosphorus | 3.022 | 1 | 3.02 | 91.66 | 0.000 | |
| Calcium | 8.122 | 1 | 8.12 | 129.23 | 0.000 | |
| Magnesium | 0.245 | 1 | 0.25 | 90.49 | 0.000 | |
| Plasma discharge | Nitrogen | 228.715 | 1 | 228.72 | 265.22 | 0.000 |
| Potassium | 414.801 | 1 | 414.80 | 623.60 | 0.000 | |
| Phosphorus | 17.043 | 1 | 17.04 | 516.98 | 0.000 | |
| Calcium | 19.478 | 1 | 19.48 | 309.88 | 0.000 | |
| Magnesium | 0.697 | 1 | 0.70 | 257.50 | 0.000 | |
| Spraying interval × Plasma discharge | Nitrogen | 8.546 | 1 | 8.55 | 9.91 | 0.004 |
| Potassium | 93.896 | 1 | 93.90 | 141.16 | 0.000 | |
| Phosphorus | 3.706 | 1 | 3.71 | 112.41 | 0.000 | |
| Calcium | 1.11 | 1 | 1.11 | 17.65 | 0.000 | |
| Magnesium | 0.167 | 1 | 0.17 | 61.58 | 0.000 |
Disclaimer/Publisher’s Note: The statements, opinions and data contained in all publications are solely those of the individual author(s) and contributor(s) and not of MDPI and/or the editor(s). MDPI and/or the editor(s) disclaim responsibility for any injury to people or property resulting from any ideas, methods, instructions or products referred to in the content. |
© 2025 by the authors. Licensee MDPI, Basel, Switzerland. This article is an open access article distributed under the terms and conditions of the Creative Commons Attribution (CC BY) license (https://creativecommons.org/licenses/by/4.0/).
Share and Cite
Mosha, A.H.; Shen, P.; Gao, J.; Elsherbiny, O.; Qureshi, W.A. Optimizing Plasma Discharge Intensities and Spraying Intervals for Enhanced Growth, Mineral Uptake, and Yield in Aeroponically Grown Lettuce. Horticulturae 2025, 11, 650. https://doi.org/10.3390/horticulturae11060650
Mosha AH, Shen P, Gao J, Elsherbiny O, Qureshi WA. Optimizing Plasma Discharge Intensities and Spraying Intervals for Enhanced Growth, Mineral Uptake, and Yield in Aeroponically Grown Lettuce. Horticulturae. 2025; 11(6):650. https://doi.org/10.3390/horticulturae11060650
Chicago/Turabian StyleMosha, Abdallah Harold, Pengfei Shen, Jianmin Gao, Osama Elsherbiny, and Waqar Ahmed Qureshi. 2025. "Optimizing Plasma Discharge Intensities and Spraying Intervals for Enhanced Growth, Mineral Uptake, and Yield in Aeroponically Grown Lettuce" Horticulturae 11, no. 6: 650. https://doi.org/10.3390/horticulturae11060650
APA StyleMosha, A. H., Shen, P., Gao, J., Elsherbiny, O., & Qureshi, W. A. (2025). Optimizing Plasma Discharge Intensities and Spraying Intervals for Enhanced Growth, Mineral Uptake, and Yield in Aeroponically Grown Lettuce. Horticulturae, 11(6), 650. https://doi.org/10.3390/horticulturae11060650