Article

Bioactive Components and Color Variation Mechanism Among Three Differently Colored Peppers Based on Transcriptomics and Non-Targeted Metabolomics

1
College of Food Science and Technology, Yunnan Agricultural University, Kunming 650201, China
2
Key Laboratory of Vegetable Biology of Yunnan Province, College of Landscape and Horticulture, Yunnan Agricultural University, Kunming 650201, China
3
Sericulture and Apiculture Research Institute, Yunnan Academy of Agricultural Sciences, Mengzi 661101, China
*
Author to whom correspondence should be addressed.
Horticulturae 2025, 11(6), 638; https://doi.org/10.3390/horticulturae11060638
Submission received: 30 April 2025 / Revised: 29 May 2025 / Accepted: 2 June 2025 / Published: 6 June 2025
(This article belongs to the Special Issue Genomics and Genetic Diversity in Vegetable Crops)

Abstract

:
Fruit color serves as a crucial visual indicator in chili peppers and is closely linked to the bioactive components that determine their economic and nutritional value. However, the specific components and potential molecular mechanisms that impact fruits’ development and color changes are less thoroughly understood. Here, we utilized three chili pepper varieties (CS03, CS29, and L816) at different developmental stages (young fruit stage, turning color stage, and mature stage) as research materials and integrated transcriptome and non-targeted metabolome analyses to explore the variation in bioactive components and color to explain the molecular regulatory mechanisms underlying different colors of chili peppers during the young fruit stage. Our results showed that flavonoids were the most enriched differential metabolites; aromadendrin 4′-glucoside, diospyrin, precarthamin, kaempferol-3-O-rutinoside, and kaempferol-3-O-Glucoside were significantly enriched in the young fruit stage of pepper CS03; and cyanidin, delphinidin, and cyanidin 3-glucoside were major contributors to the color formation. The upregulation of anthocyanin was related to the structural genes CaC4H, Ca4CL, CaCHS, CaF3H, CaANS, and CaUFGT, and key transcription factors such as CaMYBs and CabHLHs may have contributed to the differential accumulation of anthocyanins in CS03; in addition, RT-qPCR validation was correlated with anthocyanins, but also with flavonoids. This article mainly focuses on the changes in chili pigments, particularly anthocyanins, and explores the molecular mechanisms involved. This provides a reference for research on color in solanaceae vegetables and lays a theoretical foundation for further research on the bioactive components of chili peppers, as well as for optimizing harvesting practices and dietary recommendations.

1. Introduction

Chili pepper (Capsicum annuum L.) is a globally essential food crop and rich in bioactive compounds (including vitamins C and vitamins E), carotenoids, capsaicinoids, and phenolic compounds [1]. The diverse colors of mature pepper fruits are primarily attributed to the accumulation of different carotenoids in the pericarp [2]. In contrast, immature chili peppers exhibit a broader phenotypic diversity, displaying green, white, purple, and orange, and may contain higher concentrations of active substances; however, they have not been well studied and explained. These compounds are critical determinants of chili pepper quality and have significant implications for human health [3]. For instance, flavonoids, a subgroup of phenolic compounds that are also referred to as bioflavonoids, have demonstrated beneficial effects in preventing various chronic diseases, including diabetes, cancers, and cardiovascular diseases [4,5,6]. Although peppers are recognized as a valuable source of flavonoids, the comprehensive profiling of the flavonoid composition of pepper fruits remains insufficiently documented [7]. Among flavonoids, anthocyanins are particularly notable due to their role in generating a wide spectrum of colors through their synthesis [8]. As natural antioxidants, anthocyanins not only mitigate oxidative damage caused by reactive oxygen species to DNA, lipids, proteins, and other macromolecules but also offer protective effects against various diseases, including certain cancers, cardiovascular disorders, and age-related degenerative conditions [9,10]. Kaempferol, another prominent flavonoid found in numerous plant species, is widely distributed in nature and exhibits diverse biological activities [11]. Research has shown that kaempferol has pharmacological activities such as antioxidant, anti-inflammatory, and cardiac and neuroprotective effects, as well as cancer prevention [12,13].
The biosynthesis of flavonoids and anthocyanins is regulated by many factors and enzymes; enzymes, which are encoded by specific genes, including upstream regulatory genes (PAL, C4H, 4CL, CHS, CHI, etc.) and downstream regulatory genes (F3H, F3′H, F3′5′H, DFR, ANS, UFGT, etc.), have been studied thoroughly [14]. Phenylpropanoid biosynthesis starts with phenylalanine and generates p-Coumaroyl CoA through PAL, C4H, 4CL, and then p-Coumaroyl CoA entering the early flavonoid biosynthesis pathway. After generating dihydrokaempferol, it splits into three branches and enters the anthocyanin generation stage [9]. Anthocyanins are synthesized in the cytoplasm and subsequently transported to vacuoles with the assistance of transport proteins [15,16]. Many studies have demonstrated that anthocyanin synthesis is regulated by various transcription factors, particularly MYB (myeloblastosis) transcription factors, which often form a regulatory protein complex (MBW) with bHLH (basic helix-loop-helix) and WD40 proteins [17,18,19]. Although the molecular mechanisms of anthocyanin biosynthesis have been studied in numerous purple plants, the key regulatory genes that are involved in flavonoid and anthocyanin biosynthesis vary significantly among different plant species [20]. For instance, the overexpression of MwMYB-1 has been shown to induce anthocyanin accumulation in tobacco and Arabidopsis, but it functions independently without forming the MBW [21]. The biosynthesis of metabolites is often triggered by tissue-specific developmental cues. Sun identified CaMYB48, an MYB transcription factor that acts as a key activator in regulating capsaicinoid biosynthesis [22]. Similarly, bHLH transcription factors, such as bHLH42 in caitai and PsbHLH1 in P. suffruticosa, have been found to specifically activate anthocyanin accumulation through the MBW transcription complex [23,24].
Purple peppers are a relatively rare germplasm resource among chili peppers worldwide. According to Teng [25], who investigated Chinese southwest pepper germplasm resources, purple peppers exhibit strong heat and drought resistance, outperforming control varieties in disease and pest resistance. Moreover, their summer fruit setting rate, photosynthetic performance, and plant oxidase activity are significantly higher than those of ordinary green chili peppers [26]. Pepper CS03 is a unique germplasm resource, characterized by its purple stems, leaves, flowers, and fruits. The fruits gradually turn green as they develop but eventually mature to a red color. In recent years, significant progress has been made in the study of the mechanism of color formation in chili peppers [27,28]. However, the molecular regulation mechanisms underlying the relationship between color change and biological activity remain poorly understood. Therefore, research on the identification of anthocyanin biosynthesis and its molecular regulation mechanisms in chili peppers is of great importance. Such studies will not only aid in the cultivation of purple chili pepper varieties but also potentially contribute to improved human health through enhanced nutritional properties.
In this research, we aimed to explore the differential metabolites and differentially expressed genes in differently colored peppers through a comprehensive analysis of non-targeted metabolomics and transcriptomes to explore their correlations and elucidate the molecular mechanisms of color changes in pepper fruits, especially purple fruits. We utilized three chili pepper varieties, CS03, CS29, and L816, at different fruit developmental stage, which exhibited significant color differences in the early stage (CS03 was purple black, CS29 was milky white, and L816 was green), in order to investigate the mechanisms underlying chili fruit color variation. We assumed that the purple color in CS03 is due to the upregulation of structural genes in the flavonoid pathway, especially the anthocyanin branch. We analyzed the color differences and different understandings of the specific situation of common secondary metabolites in chili peppers and attempted to explain the mechanism of fruit color change, with a focus on providing insights into the formation and degradation of anthocyanins and providing references for the rational harvesting and dietary selection of chili peppers, as well as information for further research on the health benefits of chili peppers.

2. Materials and Methods

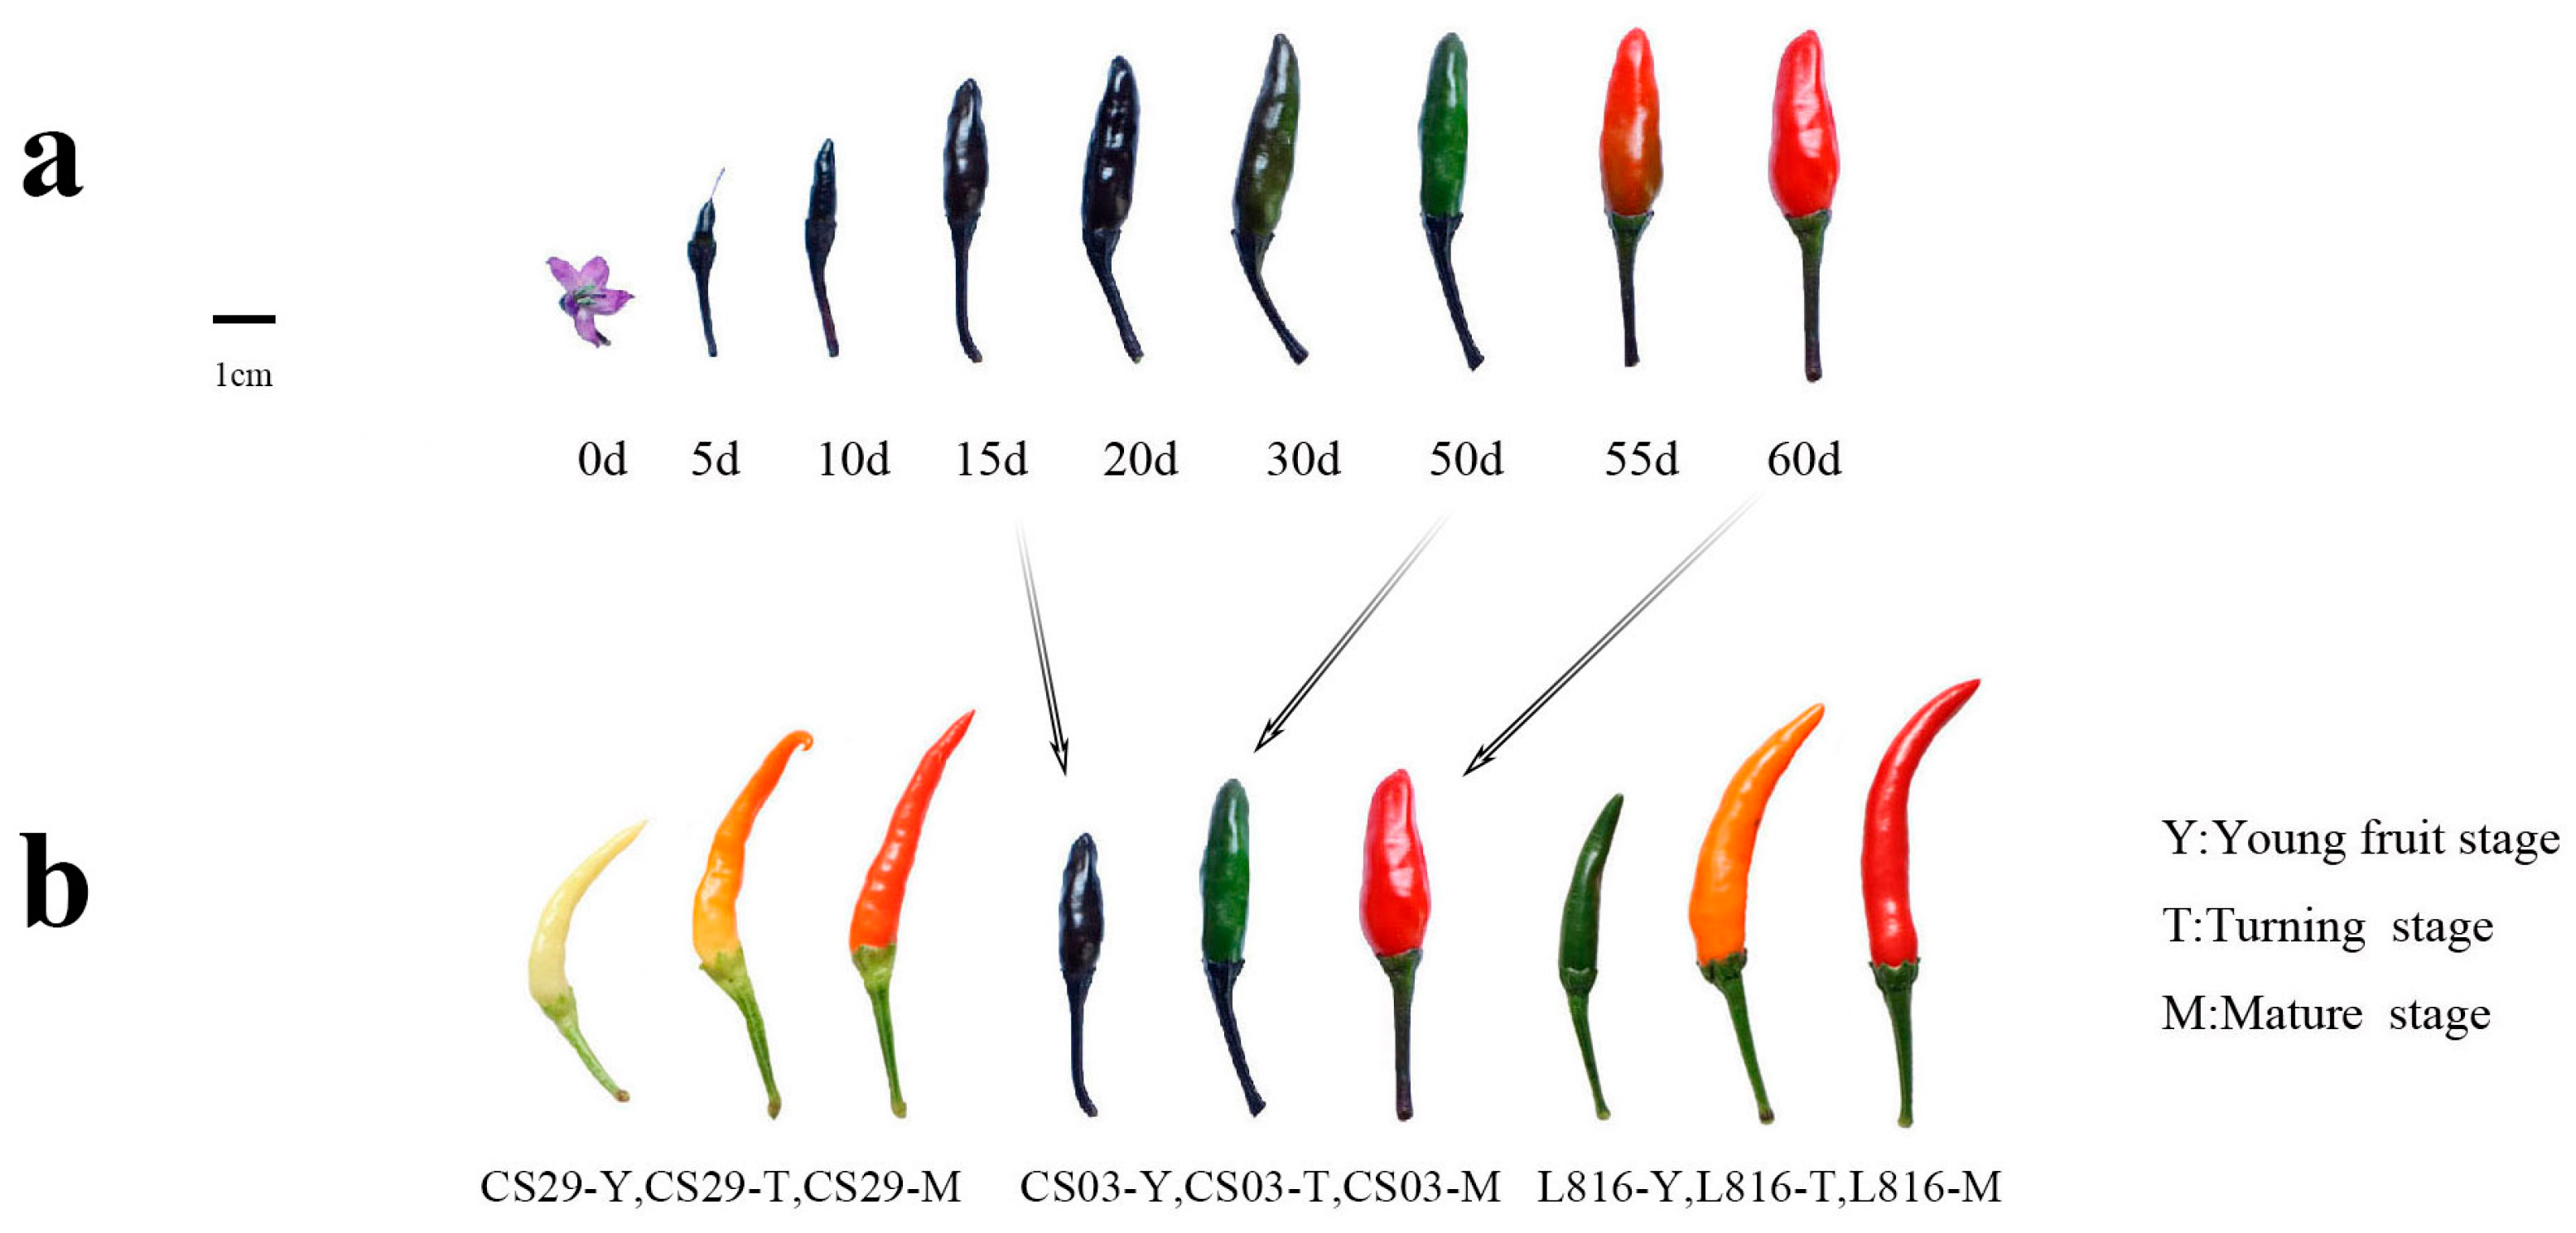
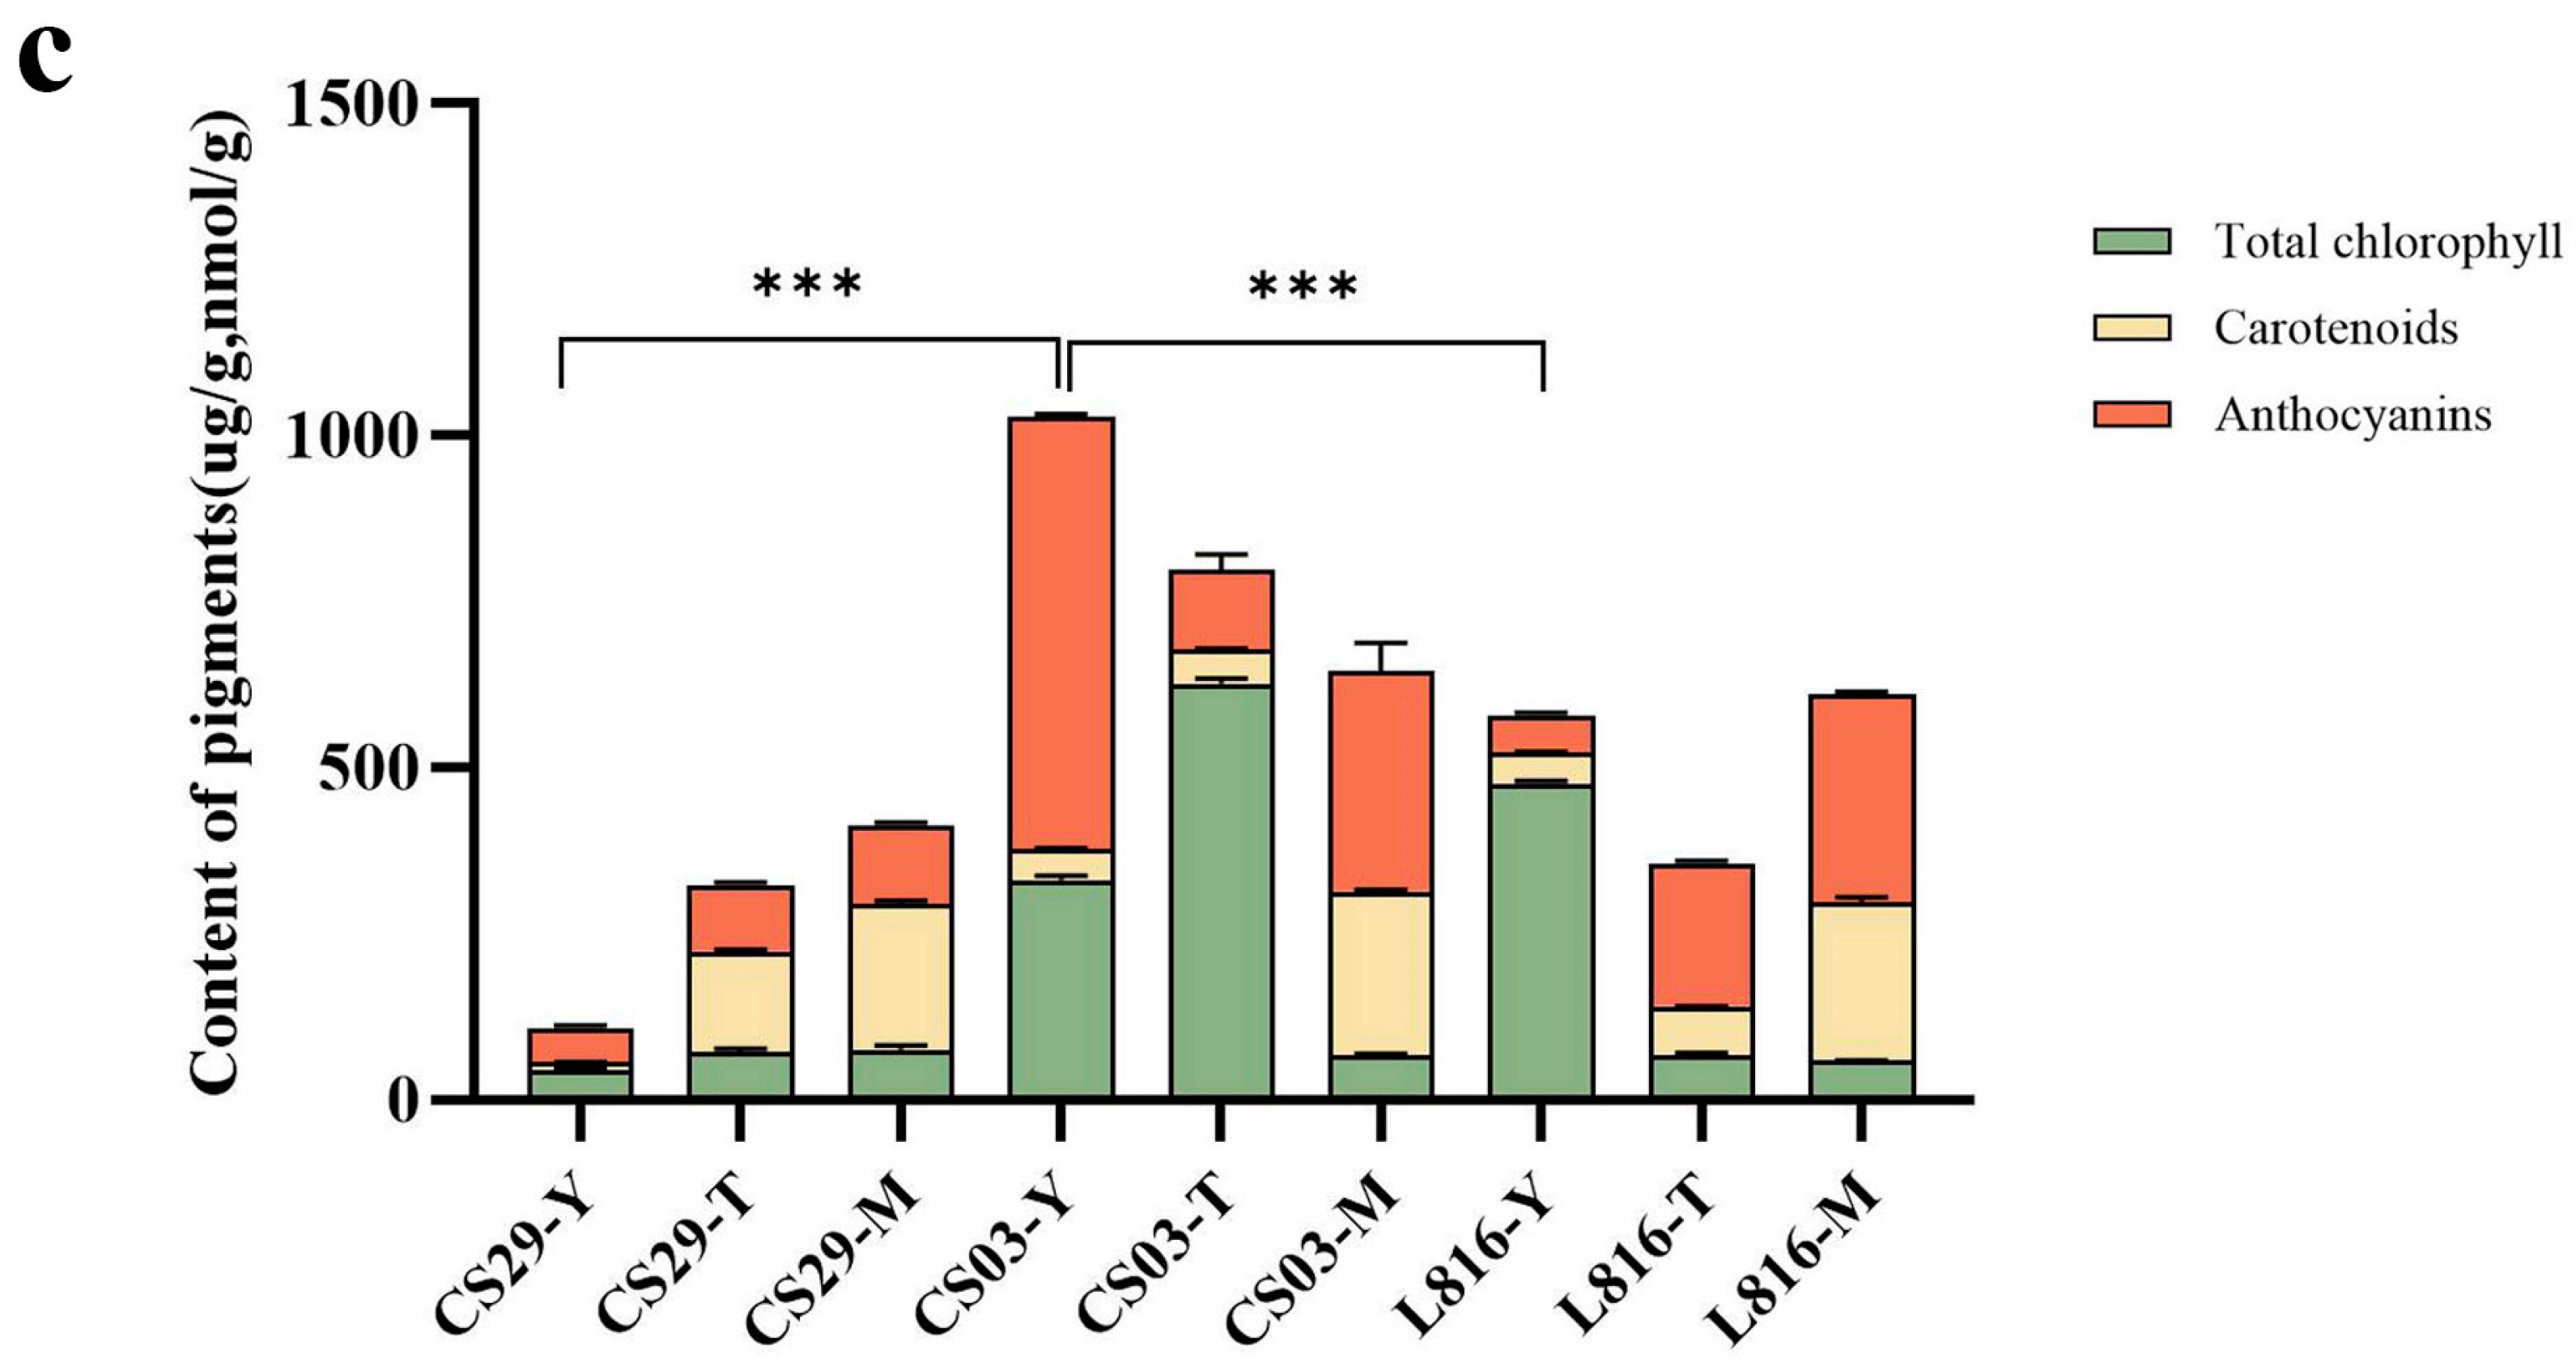
2.1. Pepper Materials

The three chili pepper varieties, CS03, CS29, and L816 (Figure 1a), were cultivated at the vegetable base of Yunnan Agricultural University (Kunming, China), starting in May 2024. Samples from each variety were collected at three distinct growth stages, 15 days, 50 days, and 60 days after flowering, corresponding to the young fruit stage, turning stage, and mature stage, respectively. Samples collected at each stage were replicated three times (Figure 1a). These fruit samples were immediately frozen in liquid nitrogen and stored at −80 °C for subsequent transcriptome sequencing, metabolite extraction, and real-time PCR analysis.

2.2. Extraction and Identification of Total Chlorophyll, Carotenoids, and Anthocyanins

The determination methods for the three pigments were all based on the Plant Content Assay Kit (produced by Beijing Boxbio Science & Technology Co., Ltd., Beijing, China). Of these, the concentrations of total anthocyanins were quantified using a P4 UV spectrophotometer (Shanghai Meipuda Instrument Co., Ltd., Shanghai, China), and the specific operation is as follows: Weigh 0.1 g of fresh chili fruit (seedless), add 1 mL of extraction solution, and place it in a mortar. Use a grinding pestle to grind it thoroughly to a homogenate and extract at 60 °C for 30 min (sealed to prevent water loss). Shake and mix several times during the process; after that, centrifuge at 12,000 rpm for 10 min, and then take the supernatant as the sample to be tested. Preheat the spectrophotometer for at least 30 min and adjust the distilled water to zero. After thoroughly mixing the test sample (100 µL) with reagent one (900 µL), measure the absorbance values of group A at 530 nm and 700 nm, denoted as A1 and A2. After thoroughly mixing the test sample (100 µL) with reagent two (900 µL), measure the absorbance values of group B at 530 nm and 700 nm, denoted as A3 and A4. Repeat each sample three times. The calculation formula is as follows: ΔA = (A1 − A2) − (A3 − A4), Anthocyanin content (µmol/g) = ΔA × Vtotal reaction × Vextraction × 103/ε × d × Vsample × W = 0.372 × ΔA/W (ε: molar extinction coefficient of anthocyanins, 2.69 × 10⁴ mL/mmol/cm; d: 1 mL glass colorimetric dish with a diameter of 1.0 cm; W: sample quality, g). Then, convert µmol per gram to nmol per gram.
The figure was created using GraphPad Prism (Version 10.4.1), and significance levels were determined by one-way ANOVA tests using IBM SPSS statistics (Version 27.0.1), with a significance level of 0.05.

2.3. Non-Targeted Metabolomics

In brief, the LC-MS/MS analysis was conducted at Shanghai Meiji Biomedical Technology Co., Ltd. (Shanghai, China). The instrument was the ultra-high-performance liquid chromatography tandem Fourier transform mass spectrometry UHPLC-Q Exactive system (Thermo Fisher Scientific, Waltham, MA, USA), and the sample preparation, chromatography, mass spectrometry conditions, etc., were all carried out according to the company’s standards. The samples of chili pepper fruit were treated with liquid nitrogen and sent to Shanghai using dry ice from Yunnan Agricultural University. The sample quality was qualified and met the machine standards. After the completion of the processing, the raw LC-MS data was imported into the metabolomics processing software Progenesis QIv3.0(WatersCorporation, Milford, CT, USA) for baseline filtering, peak identification, etc., and finally, a data matrix of the retention time, mass-to-charge ratio, and peak intensity was obtained. At the same time, the MS and MS/MS spectra information was matched with the metabolic Meiji self-built exclusive plant metabolite database MJDBPM to obtain metabolite information. Then, we uploaded the searched data matrix to the Meiji cloud platform (https://www.majorbio.com/, accessed on 20 September 2024) for analysis.

2.4. RNA Sequencing and Data Analysis

Total RNA was extracted from the pepper fruits (seedless) using TRIzol® Reagent (Invitrogen, Carlsbad, CA, USA) according to the manufacturer’s instructions. RNA purification, reverse transcription, library construction, and sequencing were performed at Shanghai (China) Majorbio Bio-pharm Biotechnology Co., Ltd. (Shanghai, China). The mRNA sequencing was based on the second-generation high-throughput sequencing platform, and the sequencing experiment used Illumina® Stranded mRNA Prep, while the Ligation (constant) method was used for library construction. The process included extracting total RNA, enriching the mRNA with Oligo dT, fragmenting the mRNA, reverse-synthesizing the cDNA, connecting the adapter, and conducting fragment screening, library enrichment, and machine sequencing. We completed transcriptome analyses of 27 samples (9 samples, 3 replicates each), obtaining a total of 181.33 Gb Clean Data. The Clean Data of each sample was above 6.01 Gb, and the Q30 base percentage was above 95.22%. The reference genome version was capsicum-anuum_genome, and the reference genome source came from http://www.pepperbase.site/node/3 (accessed on 9 November 2024). We performed sequence alignment between clean reads and designated the reference genome, with alignment rates ranging from 96.59% to 97.45%.

2.5. Combined Analysis of Transcriptomics and Non-Targeted Metabolomics

According to the differential screening criteria of “p value < 0.05, VIP_pre-PLS-DA > 1, and up- and downregulation multiples > 1”, differential metabolic sets were obtained. Gene sets were obtained from the differential gene result table, which was generated by batch processing using the software “DESeq2” (Version 1.42.0) and by using the multiple test correction method “BH” from the expression-level statistical table according to the differential screening criteria of “p adjust < 0.05 and up- and downregulation multiples > 2”. To obtain key genes involved in flavonoid/anthocyanin biosynthesis, differentially expressed genes (DEGs) and differentially accumulated metabolites (DAMs) between the three peppers were selected for integrative analysis. The data analysis was conducted on the Meiji Cloud platform, with the URL being https://cloud.majorbio.com (accessed on 20 September 2024). The coexpression network was visualized using cytoscape (version 3.8.2).

2.6. Real-Time Fluorescence Quantitative PCR

To further validate the candidate transcription factors, we conducted real-time fluorescence quantitative analysis. The operation method was carried out using conventional methods, and total RNA extraction was performed using Quick RNA Isolation Kit (Beijing Huayueyang Biotechnology Co., Ltd., Beijing, China). The reaction system was a 20 µL system, and the mixture included 1 µL cDNA, 0.4 µL forward and reverse primers, 8.2 µL ddH2O, and 10 µL Hieff ® qPCR SYBR Green Master Mix (Yeasen Biotechnology (Shanghai) Co., Ltd., Shanghai, China). The quantitative real-time PCR system (QuantStudio 5) was used for PCR amplification at an annealing temperature of 60 °C. Each gene underwent three repeated tests. Using the ACTIN gene as an internal standard, quantitative data was analyzed using the 2−ΔΔCT method. The primers used for qRT-PCR are listed in Supplementary Table S1.

3. Results

3.1. Contents of Total Chlorophyll, Carotenoids, and Anthocyanins

Pepper CS03 is a small pepper variety. Its stems, leaves, flowers, and fruits are all purple in color, especially the young fruits, which are dark purple. However, as it grows, it gradually turns green and eventually red (Figure 1a). Unlike CS03, pepper CS29 and L816 are milky white and green, respectively, during the young fruit stage and then gradually turn orange while growing and finally becoming (Figure 1b). The total chlorophyll, carotenoid, and anthocyanin concentrations in these samples are presented in Figure 1c. The total chlorophyll in the turning stage of pepper CS03 was the highest, followed by the young fruit stage of L816 and then CS03_Y. The contents of carotenoids during the mature stage were similar in the three peppers, at nearly 230 µg/g. The total anthocyanins content in the young fruit stage of pepper CS03 was the highest, exceeding 600 nmol/g, which was significantly different from pepper CS29 and pepper L816 at the same stage. Therefore, anthocyanins are characteristic metabolites that distinguish colors between samples.

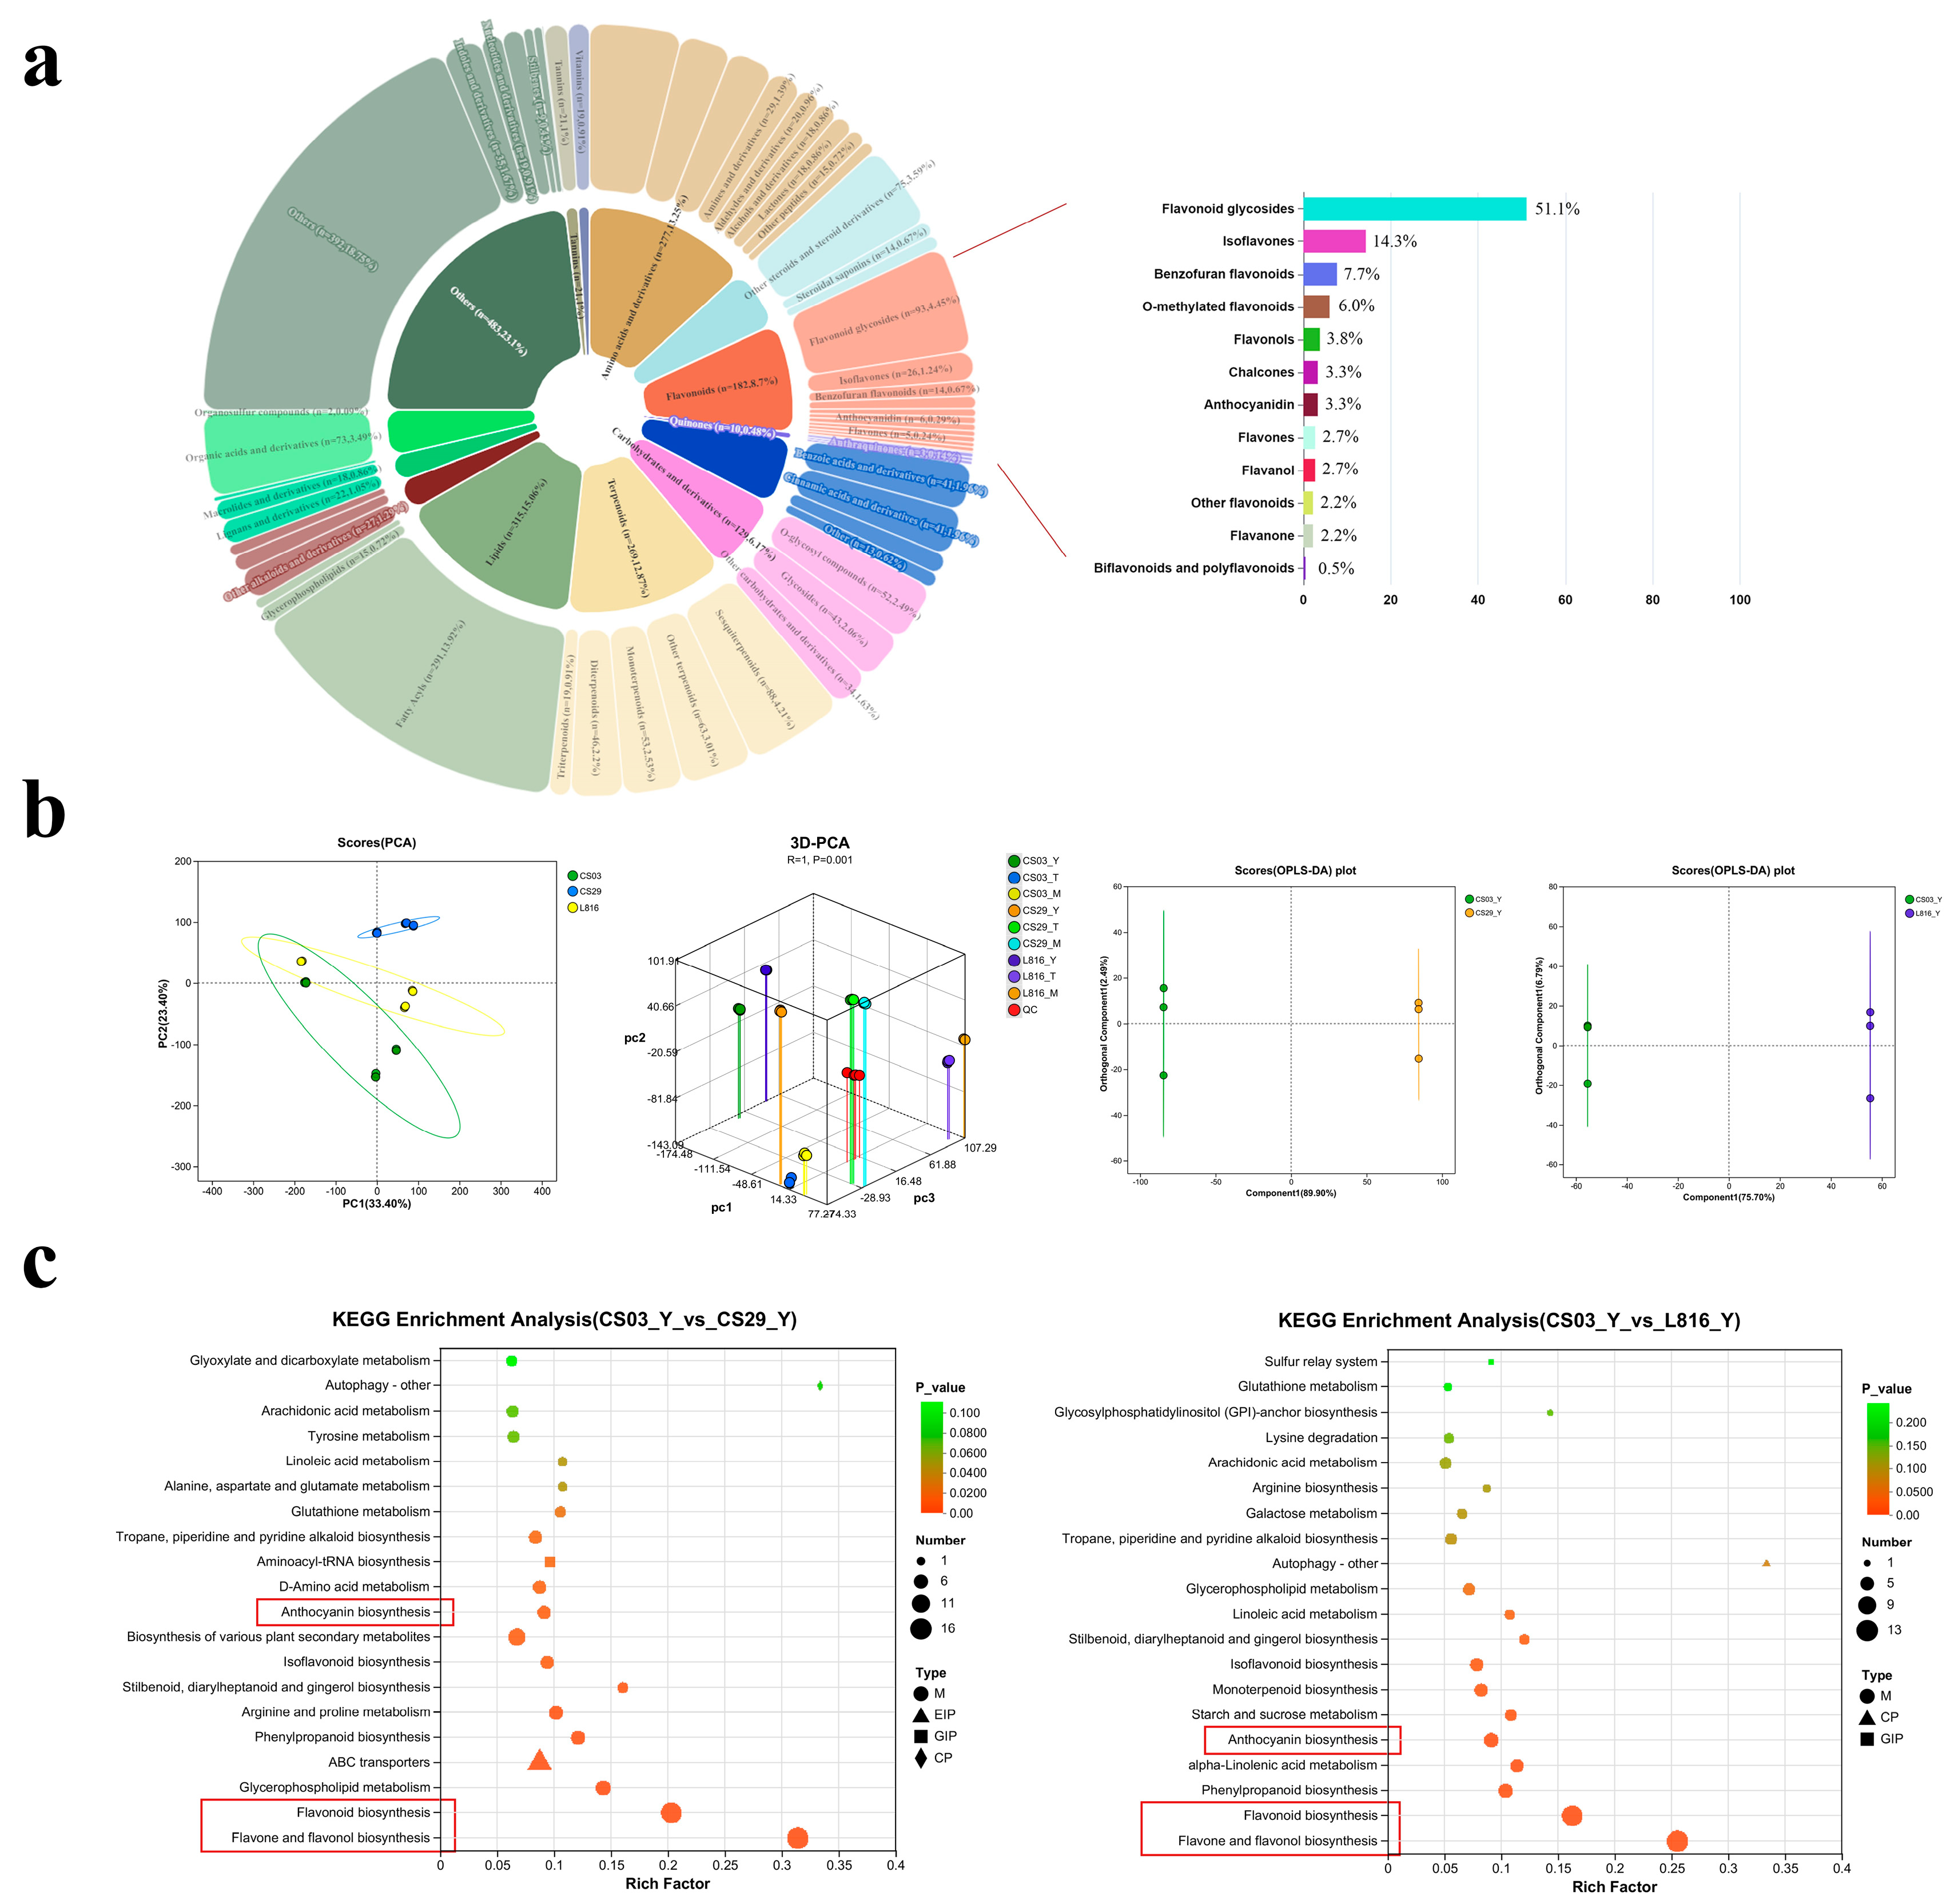
3.2. Differentially Accumulated Metabolites in Peppers

In this study, a total of 2091 metabolites (Supplementary Table S2) were identified based on the non-targeted metabolomics, and all metabolites were categorized into fourteen classes of phytochemical compounds (Supplementary Table S3). Flavonoids (182 metabolites) account for 8.7% of total metabolites, with flavonoid glycosides being the most abundant among them (Figure 2a). Next was isoflavones (26 metabolites), accounting for 14.3%, and then Benzofuran flavonoids (14 metabolites); it is noteworthy that a total of 6 metabolites were detected in anthocyanins (account for 3.3%). PCA (Principal Component Analysis) illustrated the overall differences among the three groups, and OPLS-DA (Orthogonal Partial Least Squares Discriminant Analysis) revealed clear distinctions between the CS03, CS29, and L816 peppers, demonstrating the stability and effectiveness of the model for evaluating metabolite differences (Figure 2b). The differential metabolite column diagram shows that a total of 834 DAMs (420 upregulated and 414 downregulated) were screened to compare CS03 with CS29 in the young fruit stage, while a total of 700 DAMs (469 upregulated and 231 downregulated) were screened to compare CS03 with L816 in the same stage (Figure S1). Compared with pepper CS29, the above DAMs of pepper CS03 were significantly enriched in certain pathways, including flavone and flavonol biosynthesis, flavonoid biosynthesis, ABC transporters, and the biosynthesis of various secondary plant metabolites in the KEGG database. Meanwhile, compared with pepper L816, the DAMs were mainly enriched in the flavone and flavonol biosynthesis, flavonoid biosynthesis, phenylpropanoid biosynthesis, alpha-linolenic acid metabolism, and anthocyanin biosynthesis pathways (Figure 2c). Interestingly, a comparative analysis of two groups indicated that both of them were enriched in the flavone and flavonol biosynthesis, flavonoid biosynthesis, and anthocyanin biosynthesis pathways, which meant that flavonoids and anthocyanins were significantly differential metabolites between the CS03, CS29, and L816 peppers (Figure S2), and their high expressions are likely to participate in important metabolic pathways or have important biological functions.

3.3. Cluster Analysis of Common Flavonoids

From the above results, it could be seen that flavonoids were the most numerous differentially expressed metabolites that were annotated in our study based on the KEGG (Figure S3), as 182 flavonoid substances were identified (Supplementary Table S4). To gain further insight into the flavonoid variations between the CS03, CS29, and L816 peppers, we conducted a heatmap cluster analysis using Euclidean as a metabolite distance algorithm. The top 100 identified metabolites were classified into five distinct clusters. As shown in heatmap tree, pepper CS03 exhibited significant differences with pepper CS29 and pepper L816 (Figure 3). Subcluster 2, comprising 34 metabolites, exhibited high levels in the young fruit stage of pepper CS03 and pepper L816, which was significantly different from pepper CS29. The metabolites included apigenin, apigenin-7-O-(6″-malonyl-apiosyl-glucoside),6-Methoxykaempferol3-(6″-acetylglucoside), brassicoside, corymboside, isosakuranin, isovitexin, schaftoside, kaempferol, cyanidin 3-glucoside, vicenin 2, and isoschaftoside. Especially in subcluster 5, metabolites such as aromadendrin 4′-glucoside, diospyrin, precarthamin, kaempferol-3-O-rutinoside, and kaempferol-3-O-Glucoside were significantly enriched in CS03_Y, while they were clearly distinguished from CS29_Y and L816_Y. However, in subclusters 2 and 4, metabolites such as ocophyllal B, 5-Hydroxyflavone, pongamone E, obovaten, petunidin, and isorhamnetin 3-(6″-malonylglucoside) were significantly enriched in CS29_Y, which was distinct from CS03_Y and L816_Y; at the same time, they were significantly enriched in CS29_T and CS29_M, which were significantly different from both pepper CS03 and pepper L816. In other words, there are direct or indirect substances that distinguish pepper CS29 from peppers CS03 and L816 in terms of phenotypes and functions.
These metabolites may be the reason for the notable differences in appearance or closely related to their physiological characteristics. To preserve more of these substances, it is important to pay attention to the selection of varieties and to ensure a reasonable harvesting period. In addition, anthocyanins such as pelargonidin and cyanidin 3-glucoside may be the key substances that cause significant differences between them.

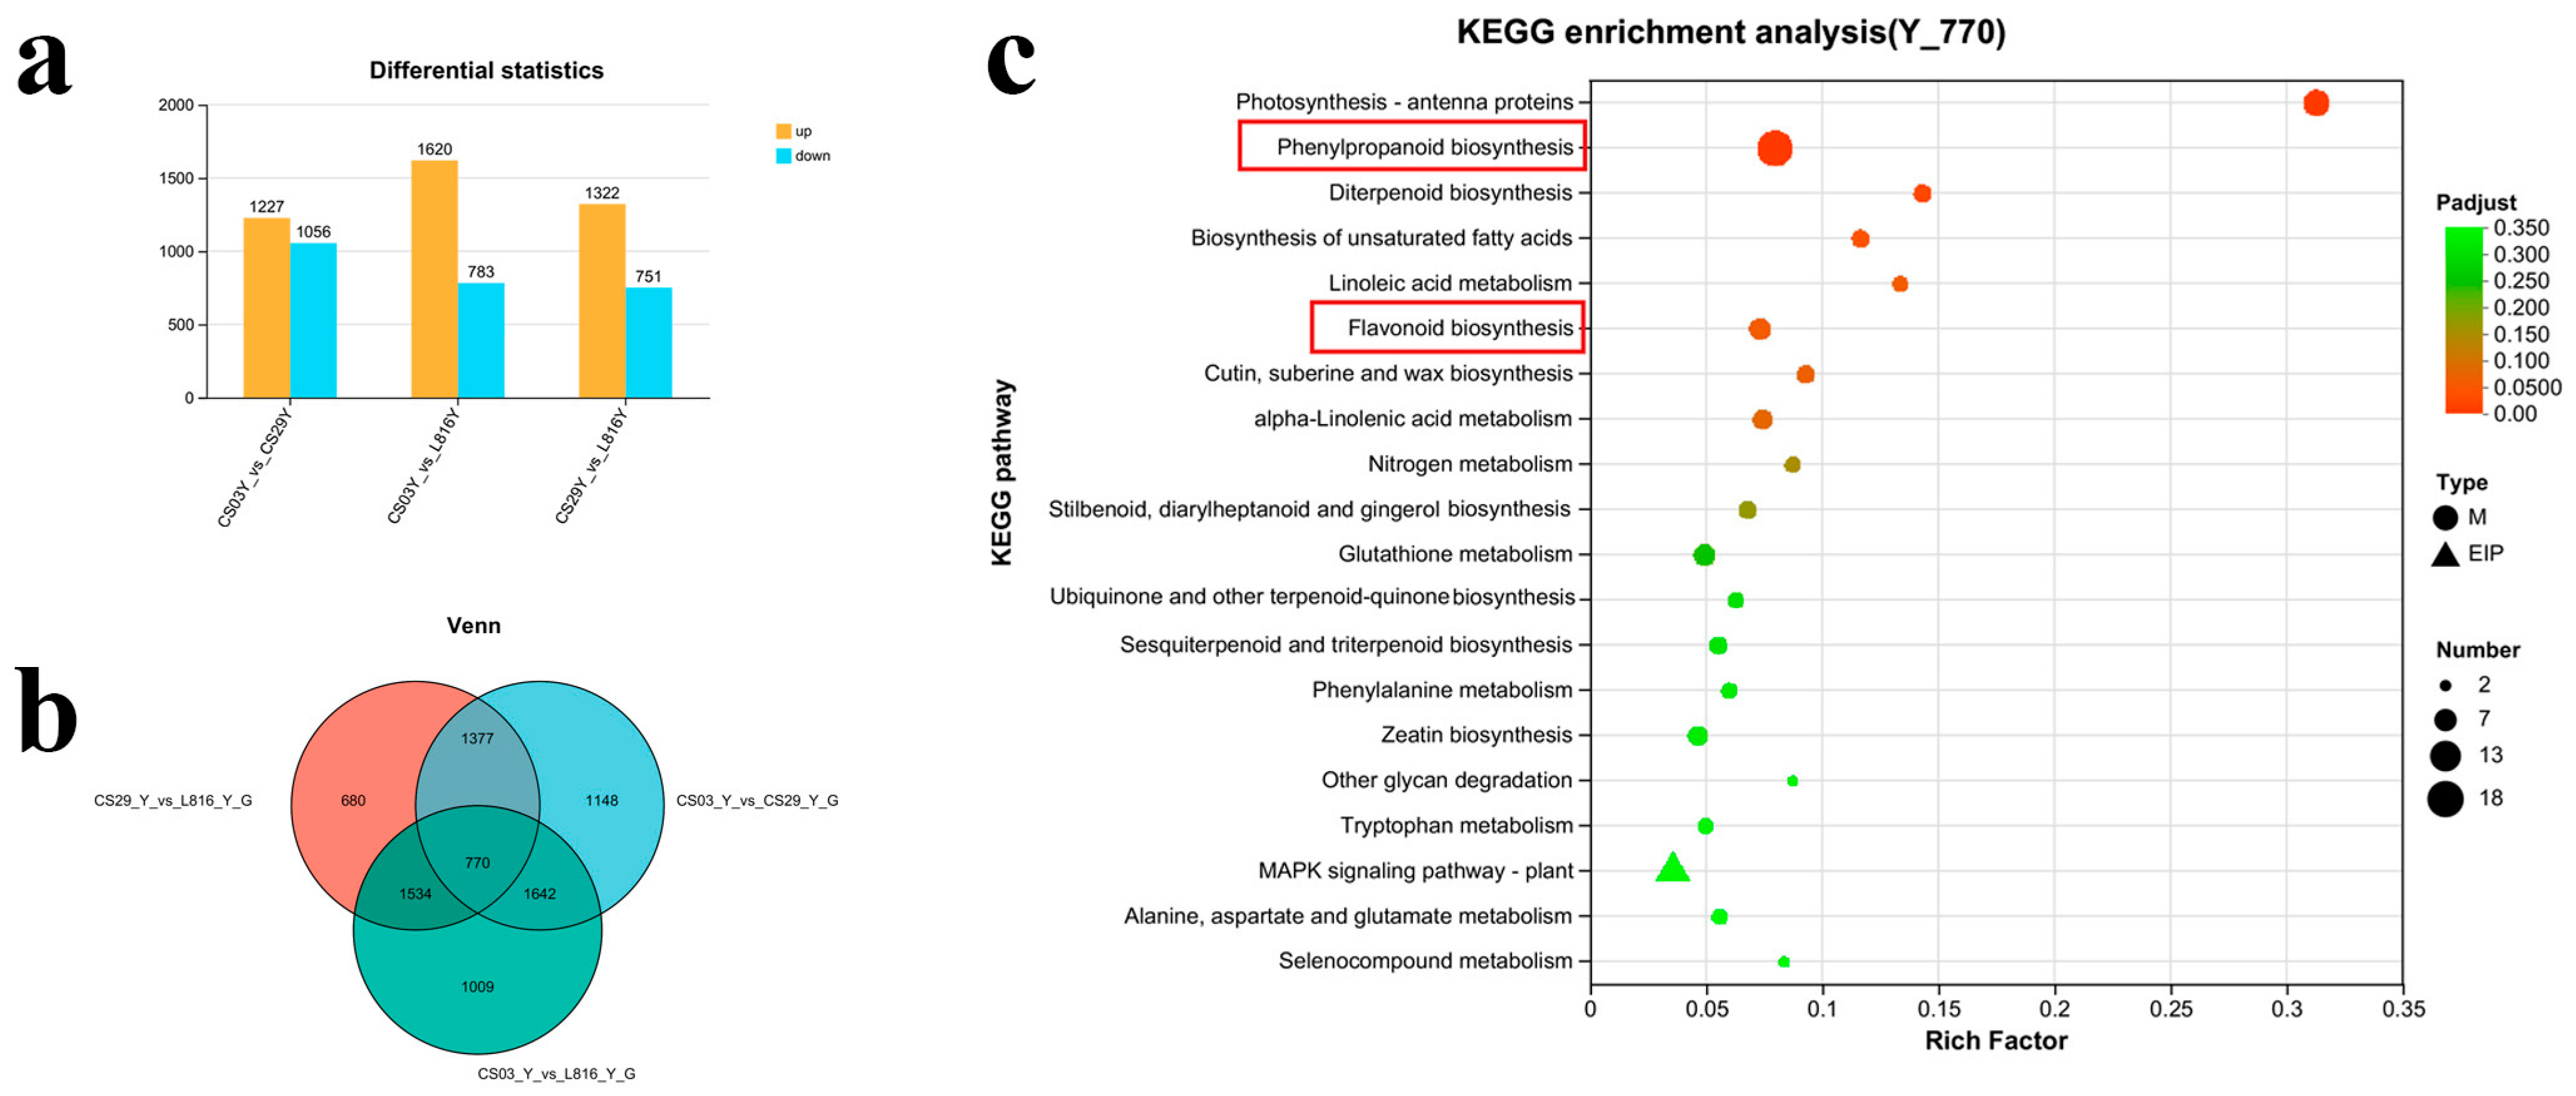
3.4. Analysis of Differentially Expressed Genes (DEGs) in Chili Peppers During Young Fruit Stage

Based on the clustering results for the differential metabolites of flavonoids mentioned above, as well as the phenotype and compound contents of different chili peppers, in order to explore the molecular mechanism of color formation in chilis, we selected the young fruit stage as the main source of differential gene screening. During the young fruit stage, a total of 4152 differentially expressed genes were obtained (Supplementary Table S5); compared with CS29, chili pepper CS03 had a total of 2283 DEGs, of which 1227 were upregulated and 1056 were downregulated; compared with L816, pepper CS03 had a total of 2403 DEGs, of which 1620 were upregulated and 783 were downregulated (Figure 4a). In addition, according to the Venn diagram of the differentially expressed genes of the three chili varieties (Figure 4b), a total of 770 DEGs were mapped to 20 pathways based on the KEGG enrichment analysis (Figure 4c). As shown in the picture, genes that are enriched in the biosynthesis pathway of phenylpropanoid are the most abundant, except for photosynthesis-antenna protein and MAPK signaling pathway-plant. The flavonoid biosynthesis pathway is significantly enriched, indicating that the DEGs are mainly related to the biosynthesis of phenylpropanoid and flavonoids during young fruit stage; that is, their differentially expressed genes may be closely related to the expression of different colors in chili peppers during the young fruit stage.

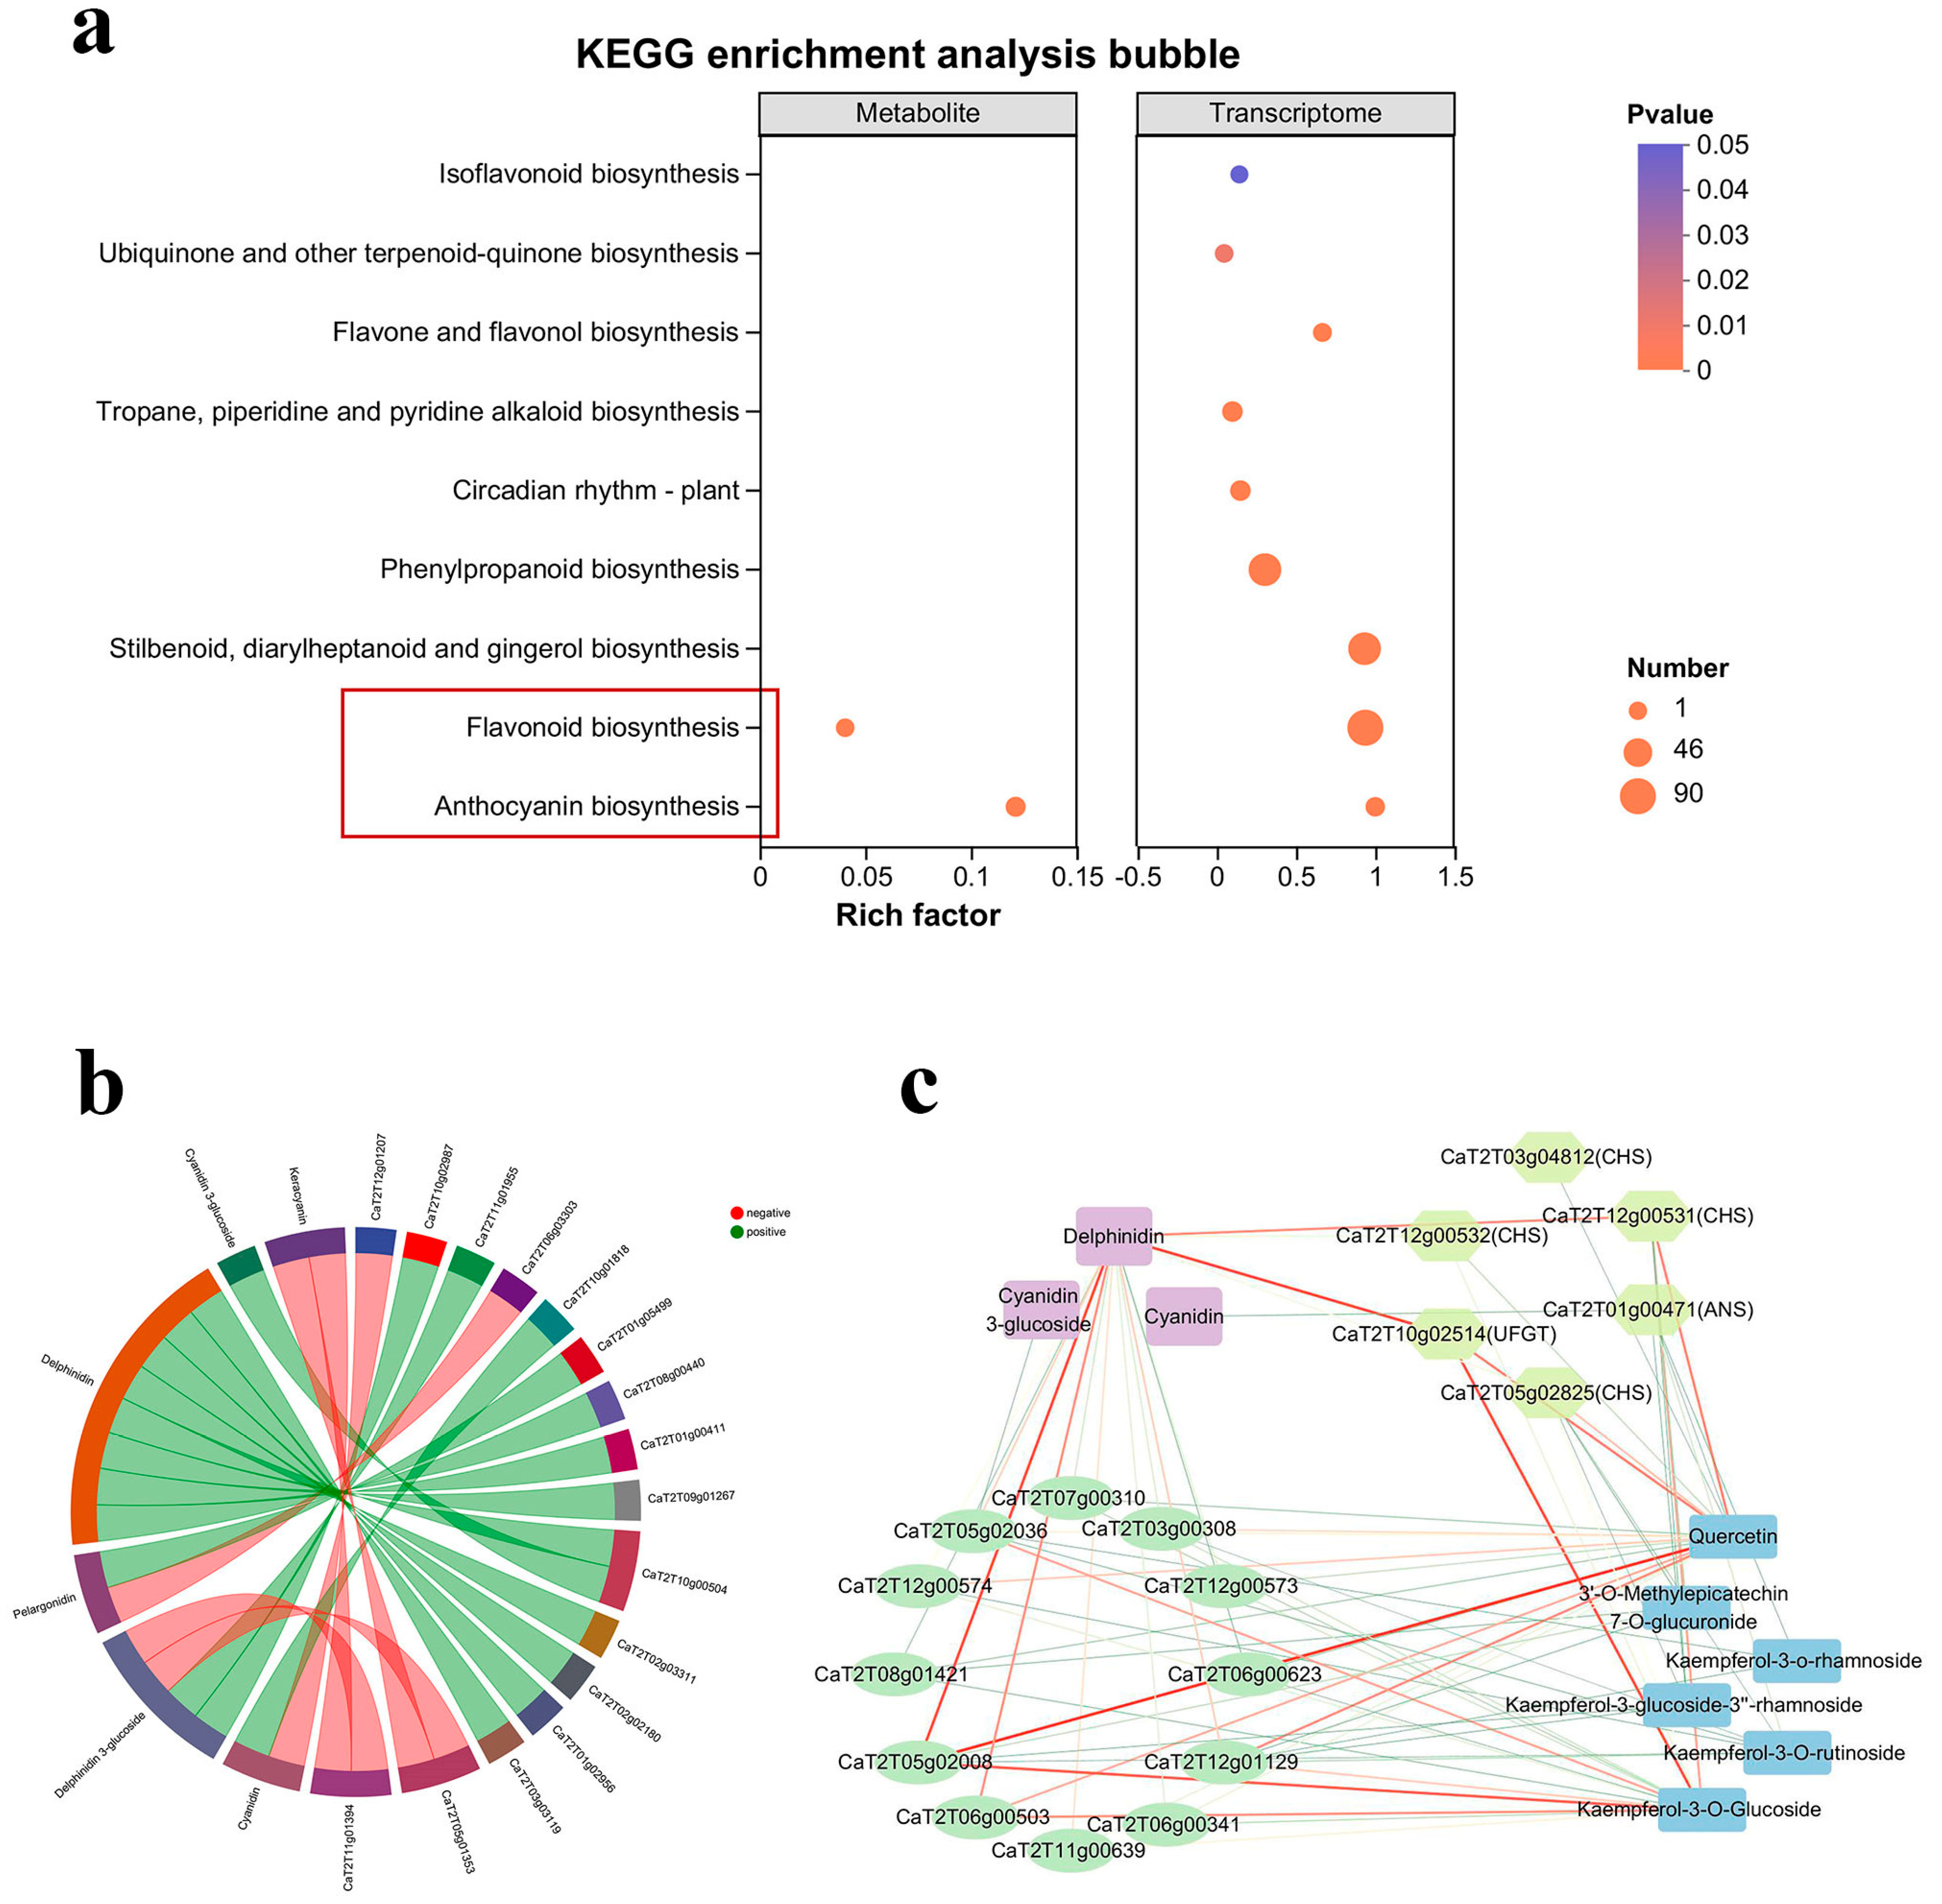
3.5. Correlation Analysis of Transcriptome and Metabolome

Combining the metabolic set “Anthocyanin” with the gene set “map00941942” for a joint analysis, we obtained Figure 5a. In the picture, the left side shows the metabolome results, the right side shows the transcriptome results, and each bubble represents a pathway; the larger a bubble is, the more genes or metabolites were enriched in the pathway (the color represents the p-value; by default, we selected the tertiary pathways that were significantly enriched in genes and metabolites, merged them, and then drew the top 10 separately). The KEGG enrichment showed that both the transcriptome and metabolome were significantly enriched in the flavonoid and anthocyanin biosynthesis pathways.
The correlation chord diagram between the transcriptome and metabolome (Figure 5b) showed that different anthocyanins were positively or negatively correlated with different genes. For example, keracyanin was positively correlated with CaT2T05g01353 and CaT2T11g01394, while cyanidin was positively correlated with CaT2T12g1207 but negatively correlated with CaT2T10g01818. The expression correlation network diagram (Figure 5c) showed that delphinidin was not only positively correlated with the structural genes CHS (encoded by CaT2T12g00531) and UFGT (encoded by CaT2T10g02514), but also positively correlated with the transcription factors CaT2T05g02008, CaT2T06g00503, CaT2T11g00639, and CaT2T12g01129. Meanwhile, the transcription factor CaT2T05g02008 was positively correlated with quercetin and kaempferol-3-O-glucoside. These provide a reference for the modular regulation of chili color formation.

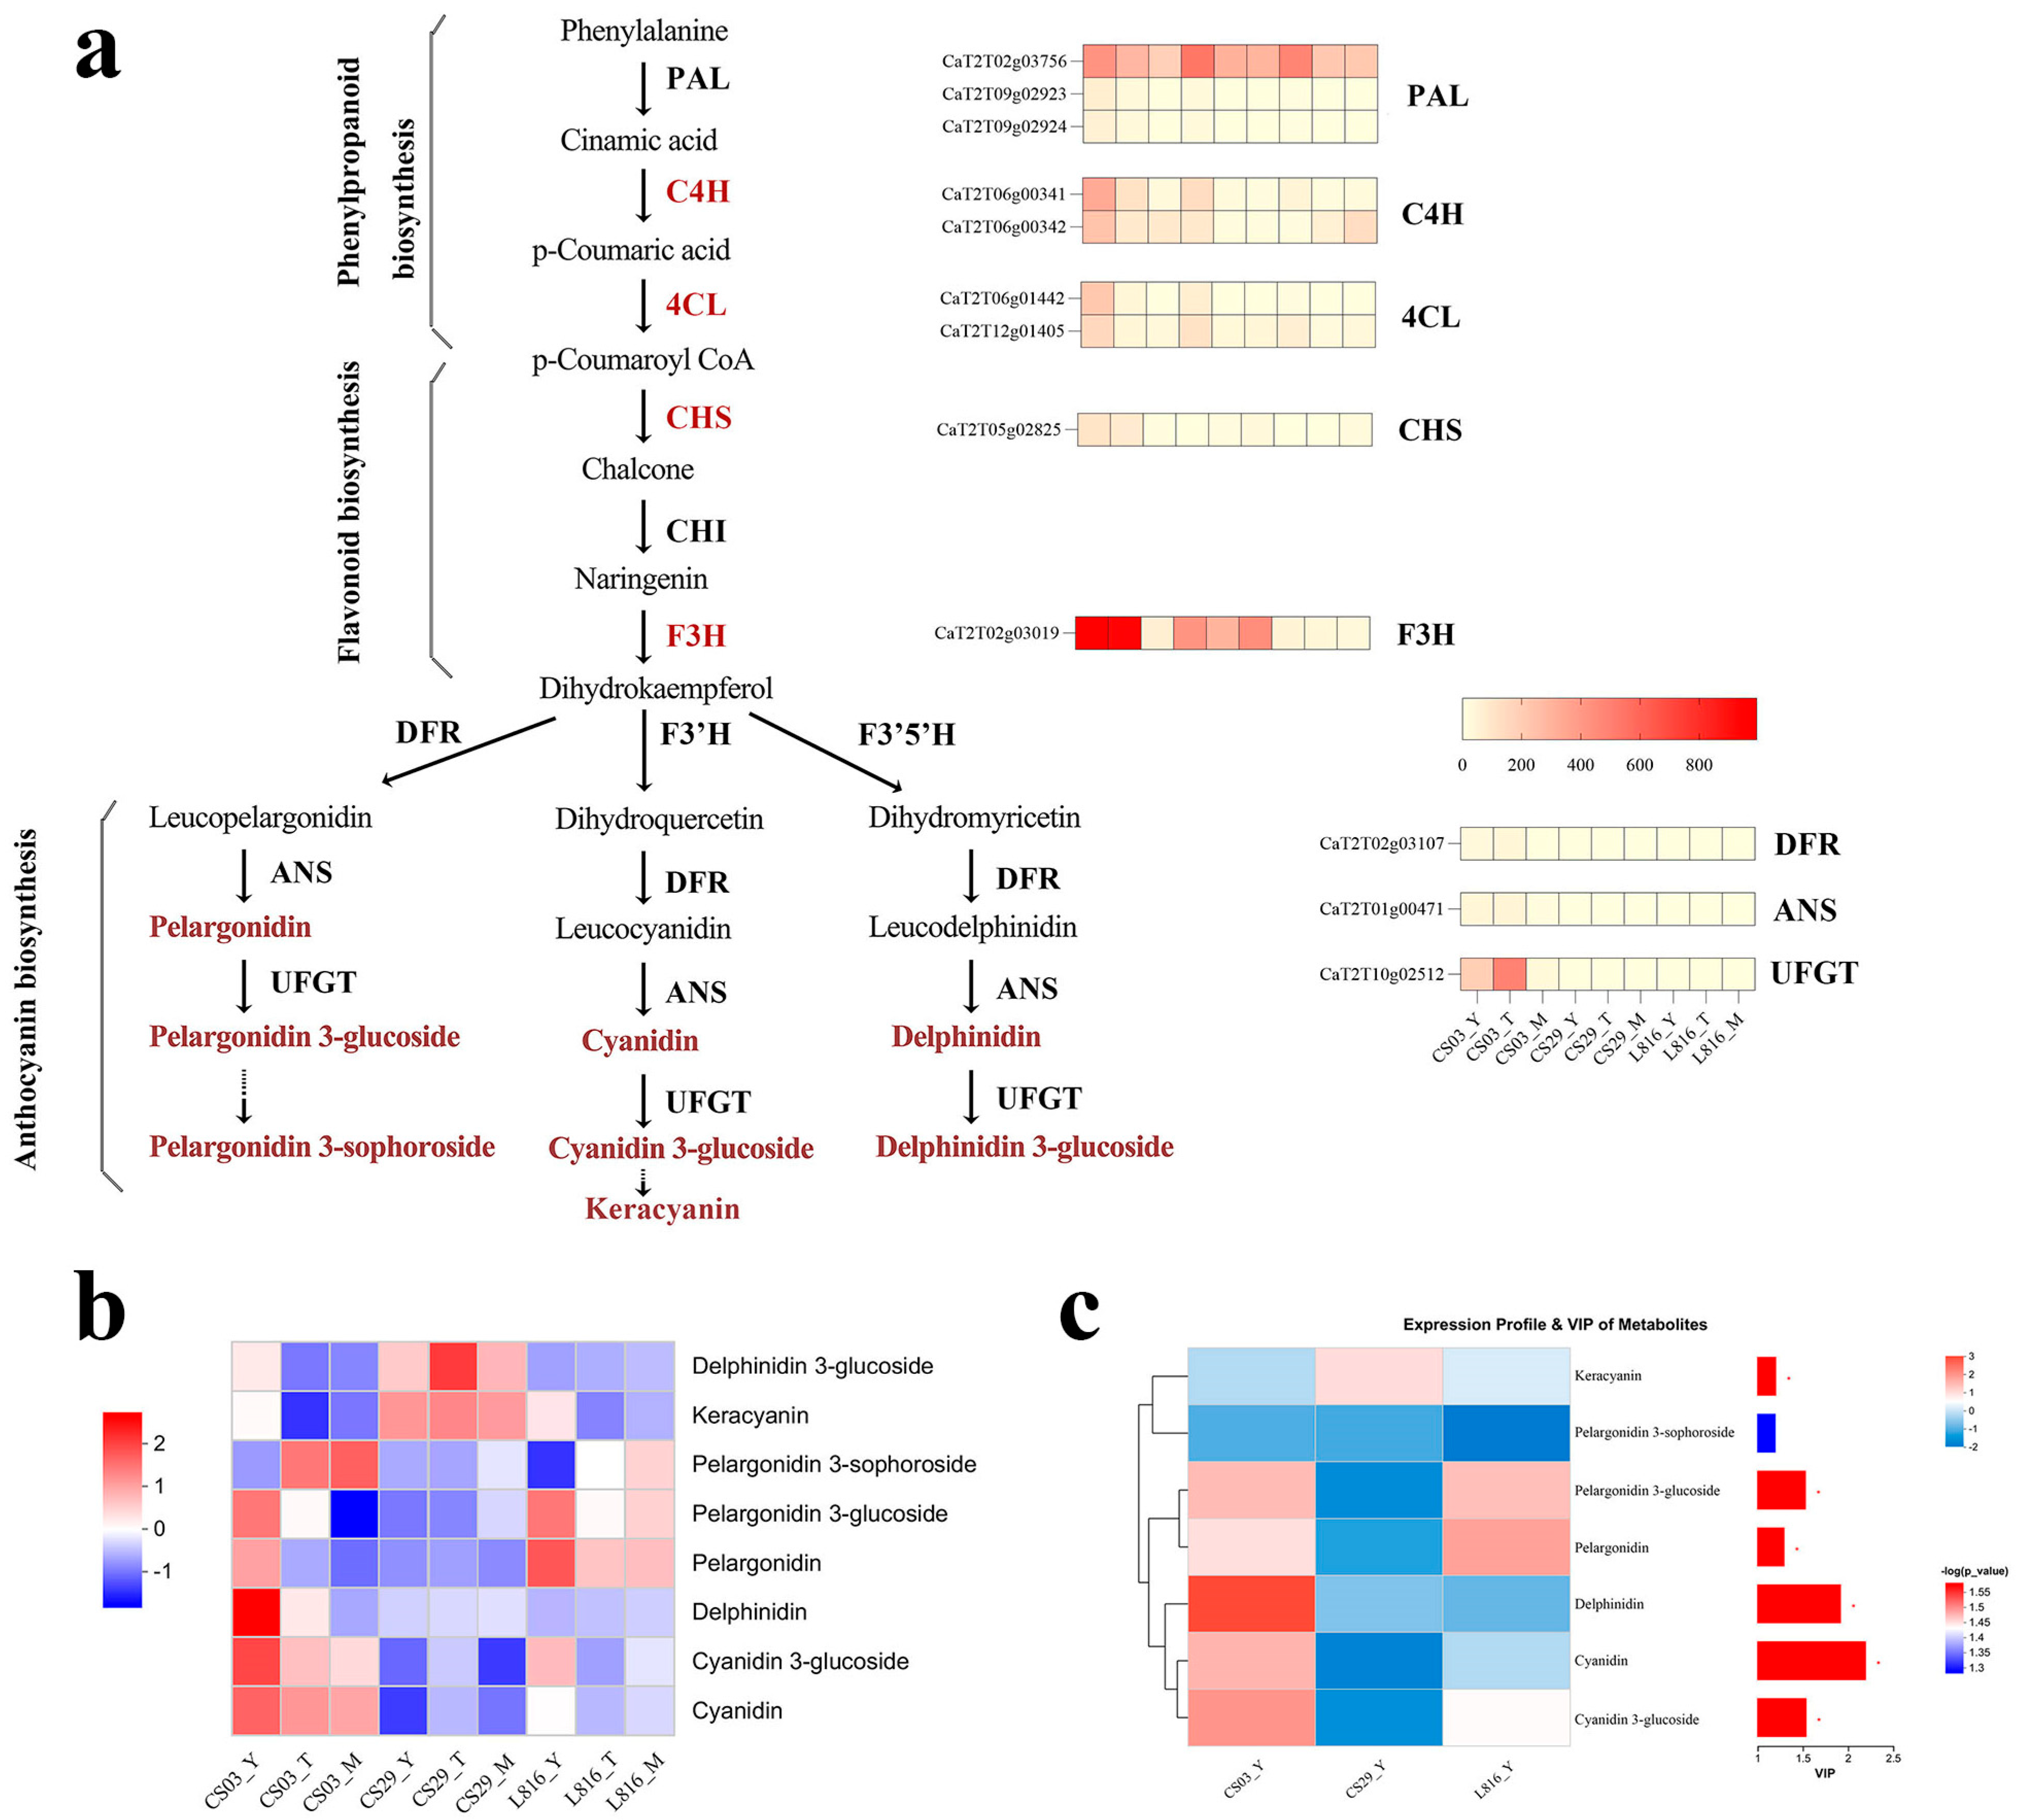
3.6. Relationship Between Structural Genes and Metabolites in Anthocyanin Synthesis Pathway

In order to further explore the color formation mechanism of chili peppers, we visualized the metabolic pathways related to phenylpropanoid biosynthesis and flavonoid/anthocyanin biosynthesis (Figure 6a). Starting from phenylalanine, a series of reactions were carried out to produce intermediate products such as chalcone, quercetin, and, finally, anthocyanins. The enzymes required for each step have been thoroughly studied, and those that were involved in the reaction are shown using alphabetical abbreviations and bold font. The abundance of genes encoding specific enzymes was represented in the form of a heatmap, with different gradient colors indicating the gene expression levels of different samples. The results showed that genes involved in the biosynthesis and regulation of flavonoids/anthocyanins, including C4H, 4CL, CHS, F3H, DFR, ANS, and UFGT, were highly expressed in the young fruit stage of pepper CS03, while their expression levels were lower in CS29_Y and L816_Y. Meanwhile, these structural genes were less expressed in other stages of the three varieties (except for F3H and UFGT in CS03_T).
Anthocyanins were differentially accumulated in the young fruit stage of CS03, CS29, and L816. The heatmap reveals enrichment of the corresponding metabolites in peppers: anthocyanins such as delphinidin, cyanidin, cyanidin3-glucoside, and pelargonidin were more abundant in CS03_Y, while delphinidin 3-glucoside and keracyanin were more abundant in CS29_Y, and pelargonidin and pelargonidin 3-glucoside exhibited high levels in L816_Y. The enrichment analysis revealed the critical roles of flavonoid and anthocyanin biosynthesis in plant pigment production, emphasizing their primary contributions to the distinct coloration patterns observed between pepper CS03 and peppers CS29 and L816. The initial metabolic profile included eight anthocyanins (Figure 6b), but after applying VIP (Variable Importance Projection, VIP ≥ 1) analysis, seven metabolites with significant contributions were identified: delphinidin, cyanidin, cyanidin 3-glucoside, pelargonidin, pelargonidin 3-glucoside, pelargonidin 3-sophoroside, and keracyanin (Figure 6c). In general, the anthocyanin content was higher in the young fruit stage of CS03 than in the CS29 and L816 peppers, and cyanidin (VIP = 2.19) majorly contributed to this difference, followed by delphinidin (VIP = 1.91), cyanidin 3-glucoside (VIP = 1.53), pelargonidin 3-glucoside (VIP = 1.52), and pelargonidin (VIP = 1.29).

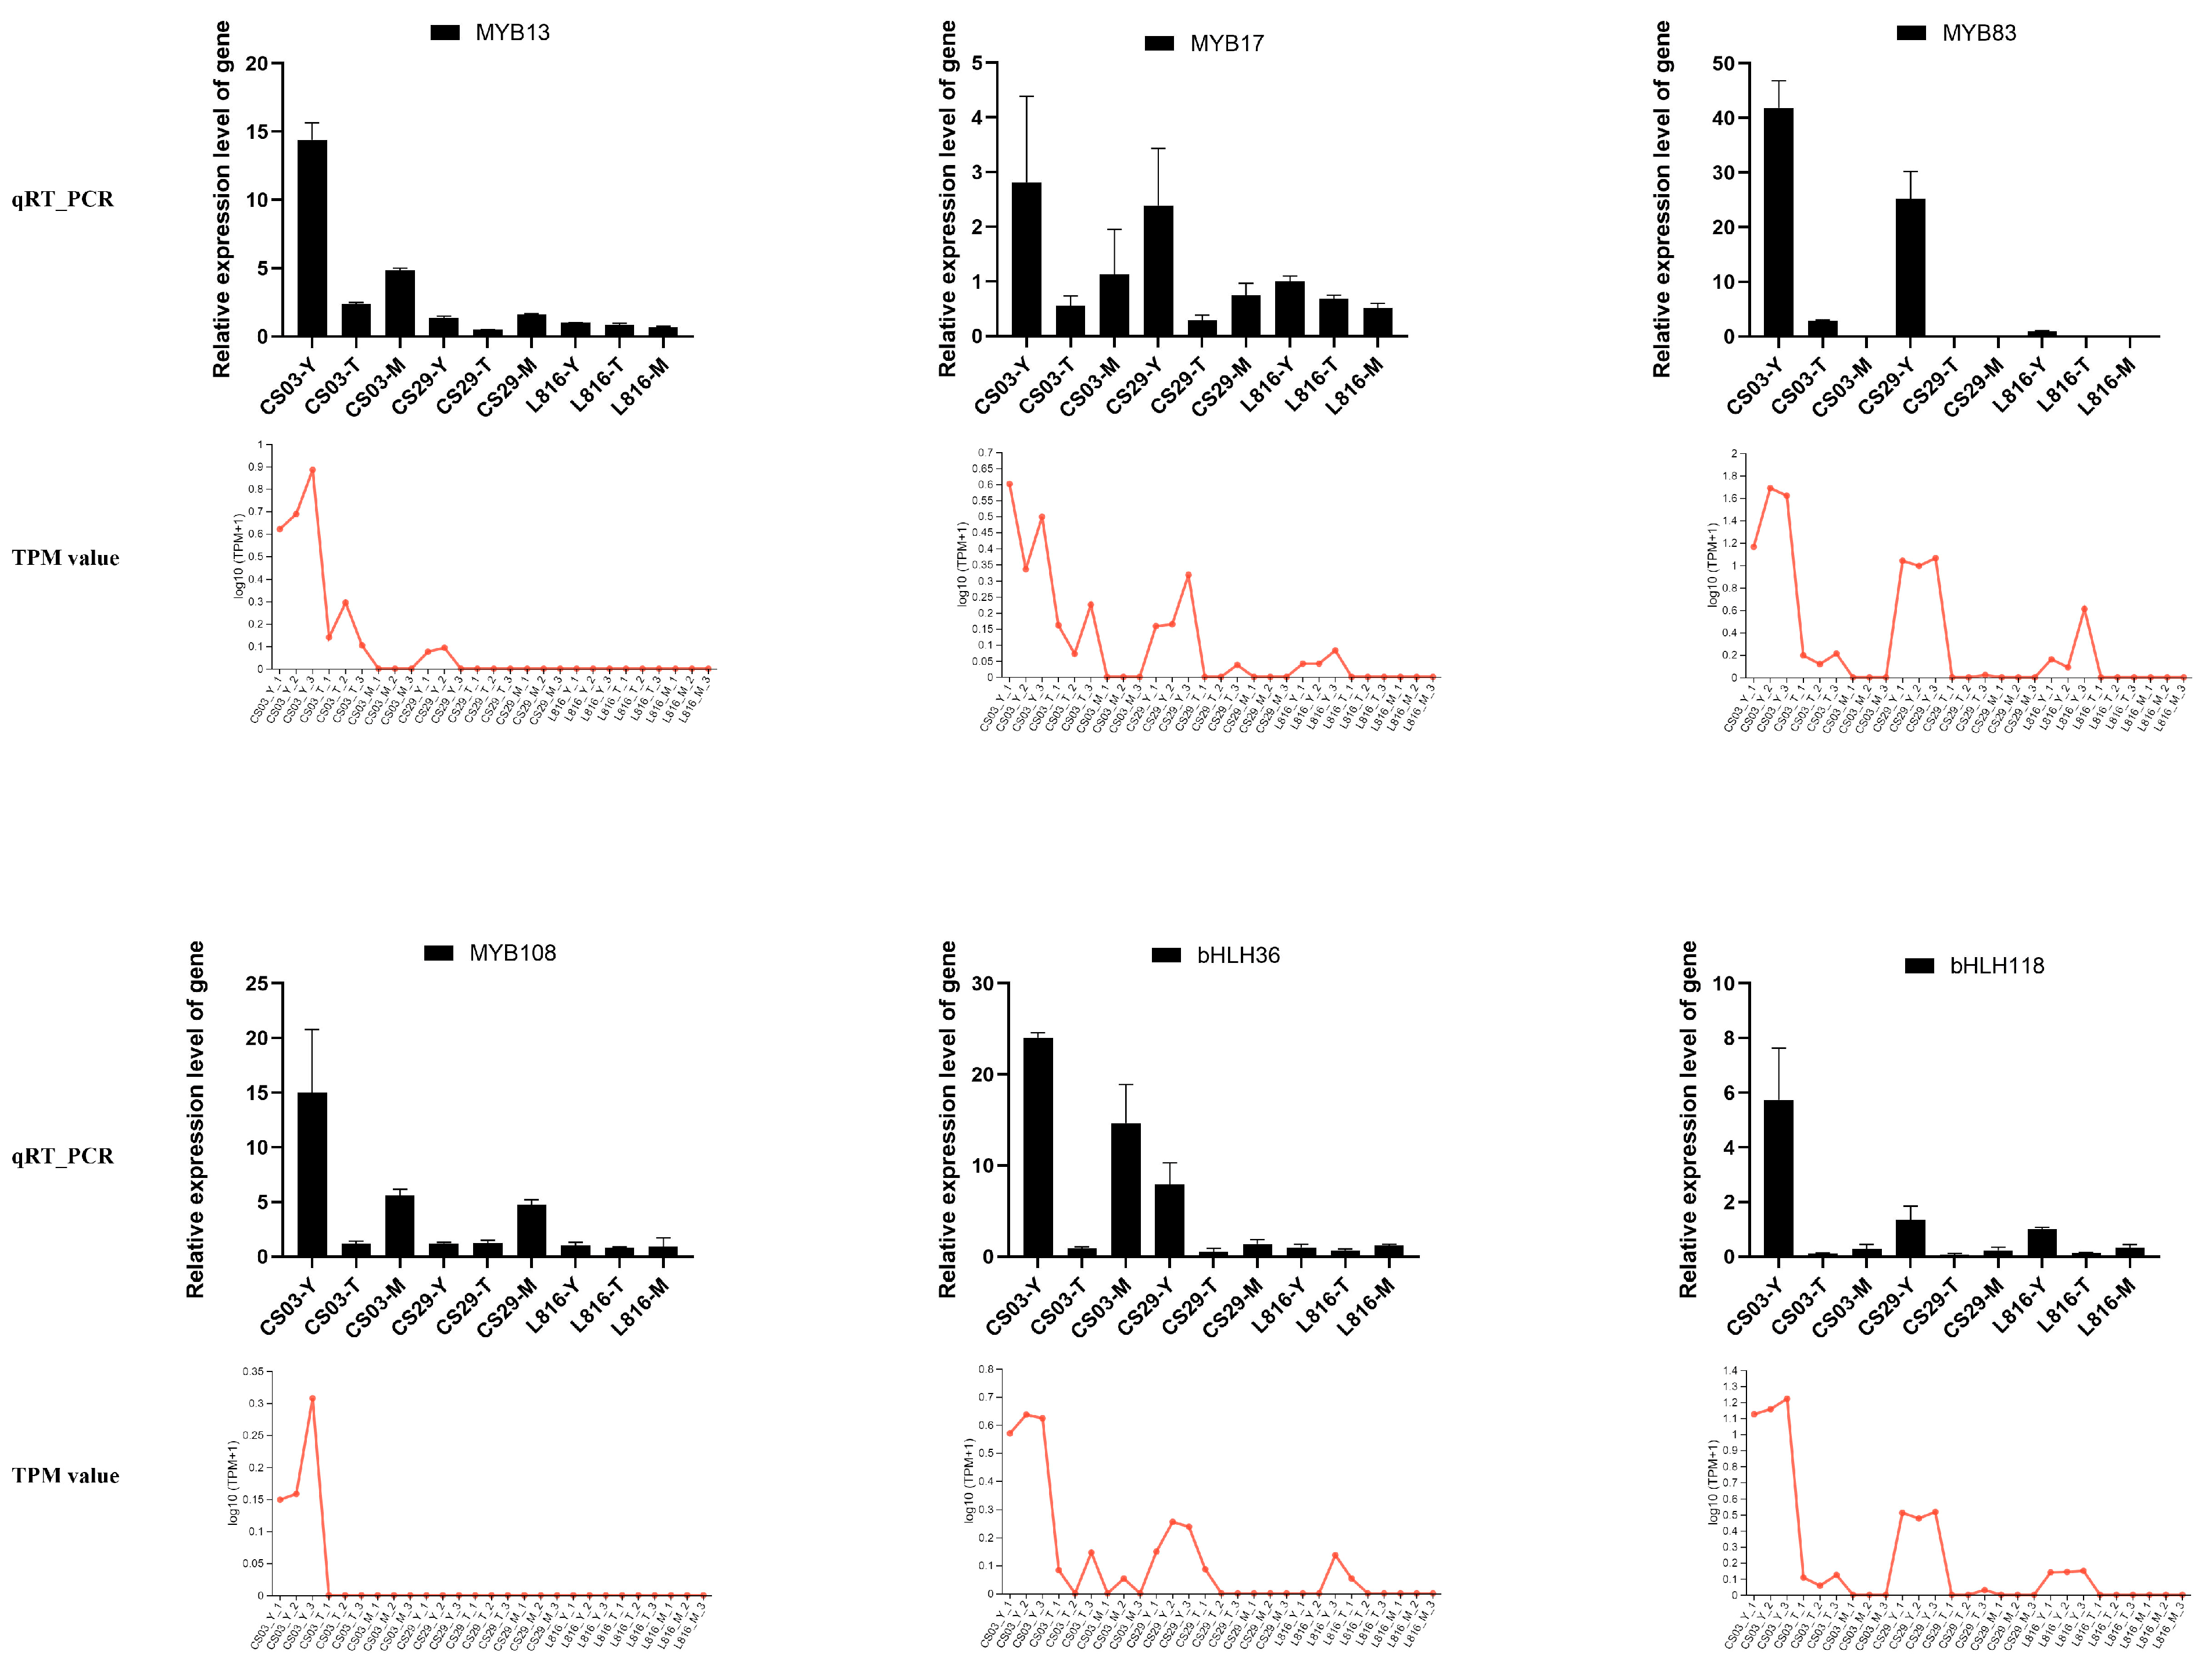
3.7. Prediction and Family Analysis of Transcription Factors in Peppers

The focus of this study is to analyze the differences in the young fruit stage of chili peppers and predict the relevant transcription factors that may regulate these differences. The results indicated that there are 247 transcription factors (Supplementary Table S6), belonging to 35 families. The major TF families were M_type (27 genes), MYB (26 genes), bHLH (24 genes), NAC (20 genes), and ERF (19 genes), followed by B3 (17 genes), MYB_related (16 genes), HB_other (15 genes), WRKY (15 genes), and GRAS (10 genes) (Figure S4 and Supplementary Table S6).
In addition, four MYB transcription factors (CaMYB13, CaMYB17, CaMYB83, CaMYB108) and two bHLH transcription factors (CabHLH36, CabHLH118) were selected for quantitative real-time PCR verification based on the transcription factor prediction results (Supplementary Table S6). The data of qRT-PCR were normalized using the ACTIN gene, and the fold change in normalized ACTIN levels in every sample was calculated. The primer list for qRT-PCR is provided in Supplementary Table S1. The experimental results indicated that the qRT-PCR results were consistent with the TPM values of genes in the samples (log10 (TPM + 1)) obtained in this study (Figure 7).

4. Discussion

The richness and diversity of chili color are well known, but previous research on the relationship between fruit color and metabolites has mainly focused on the targeted metabolism of carotenoids in mature red fruits [29,30], while less research has been conducted on immature chili fruits’ color. In this study, we elucidated the changes in the contents of flavonoids and anthocyanins, as well as the key genes and regulatory mechanisms related to the fruit color, based on multi-omics analysis (transcriptomics and non-targeted metabolomics). We believe that the objectivity of non-targeted metabolomics research can provide a new perspective on the mechanism of chili color formation.

4.1. The Purple Color of Pepper CS03 Is Related to the Content of Anthocyanins

In the present study, we established that flavonoids were the most abundant metabolites in the three peppers (Figure 2a), and five anthocyanin derivatives accumulated specifically during the young fruit stage of CS03. Flavonoids are one of the major secondary metabolites in higher plants, and some flavonoids—especially anthocyanins, chalcones, aurones, and flavonols—act as pigments, contributing to the color formation [31]. For example, the color of cyanic flowers, which are purple, violet, and blue, are mainly due to the anthocyanidins, delphinidin, and its methylated derivatives [32]. The blue color of flowers is mainly attributed to anthocyanins [33]. Plant species such as blue carnations or roses, which are not naturally existing, can be achieved by genetic engineering through accumulating delphinidin-based anthocyanins. Vivid yellow-flowered plants can be achieved by combining genome editing and a suitable expression of betaxanthin biosynthetic genes in ornamental plants [34]. The predominant pigment in violet pepper was assigned to delphinidin 3-trans-coumaroylrutinoside-5-glucoside [35]. In our study, the purple color of CS03 in the young fruit stage might be due to the copigmentation of anthocyanins and many flavonoids derivatives, such as quercitrin and kaempferol. These findings align with a previous report, which revealed that cyanidin, delphinidin, and cyanidin 3-glucoside were major contributors to color formation. The significant differences in anthocyanins during the young fruit stage of chili peppers indicated that anthocyanins are the basis for the color formation of chili peppers. Additionally, pelargonidin, which has been widely reported in fruits and crops, exhibits antioxidant and anti-inflammatory properties owing to its free radical-scavenging ability [36,37]. Accordingly, the pelargonidin detected in pepper CS03 could provide a reference for dietary choices, indicating that purple chili peppers may be more beneficial to our health [38].

4.2. Key Structural Genes and Transcription Factors Involved in Anthocyanin Synthesis in Pepper CS03

Combined non-targeted metabolomics and transcriptomics were used in this study based on their significance in the discovery of specialized plant pathways and associated metabolites [39]. Previous studies indicated that variation in the activity of regulatory genes may be responsible for variations in anthocyanin production among various carrot cultivars [40]. In our study, the upregulation of structural genes that are involved in phenylpropanoid biosynthesis and flavonoid/anthocyanin biosynthesis, including C4H, 4CL, CHS, F3H, ANS, and UFGT, showed distinct patterns in pepper CS03 compared with pepper CS29 and pepper L816 (Figure 6a). Especially, the F3H gene had higher expression levels in the purple fruit compared with other peppers, which is different from former research results [41]. Combined transcriptome and metabolic analyses showed that the structural genes encoding CHS, UFGT, and ANS play a critical role in the biosynthesis of delphinidin, cyanidin, and cyanidin-3-O-glucoside. The major transcription factor families MYB and bHLH were closely related to anthocyanins, which was consistent with previous research findings. Additionally, the involvement of other TFs, especially NAC and ERF, that was detected in this research (Figure S4 and Supplementary Table S7) also requires verification. Our study indicates that non-monotonic regulation (i.e., modular regulation) is very evident, and there is a very close relationship between plant metabolites. Therefore, we can reasonably propose that the formation of anthocyanins is not only regulated by structural genes but also by the activation of transcription factors, which is particularly evident in the formation of purple color in the young fruit stage of pepper CS03. The changes in transcription levels of structural genes and the joint involvement of transcription factors are closely related to the accumulation pattern of anthocyanin components. In summary, our research findings elucidated the key anthocyanin components and genes associated with pepper CS03 during the young fruit stage. Three anthocyanin metabolites, delphinidin, cyanidin, and cyanidin-3-glucoside, were significantly higher in pepper CS03 than in the CS29 and L816 peppers.
Differentially expressed structural genes (C4H, 4CL, CHS, F3H, ANS, and UFGT) in phenylpropanoid and flavonoid/anthocyanin biosynthesis, together with the related TFs (MYB and bHLH), were identified as common regulatory modules involved in purple color formation. These findings suggested that the formation of anthocyanin pigments requires the joint participation of structural genes and transcription factors. The same structural gene and transcription factor may regulate both color-related anthocyanins and flavonoids with antioxidant effects, and both of them play a crucial role in the changes in phenotype color and active ingredient contents. In addition, the research results also suggested the effectiveness of chili pepper as a medicinal food (as it is rich in flavonoids and anthocyanins). However, this study did not analyze the accumulation of anthocyanins throughout the entire fruit stage, nor did it conduct further verification in terms of regulatory mechanisms, and more experiments are needed to verify the function of transcription factors, such as gene silencing, overexpression, etc. Further investigation and more studies are needed before we can conclude that pepper fruits that are rich in flavonoids and anthocyanins have better antioxidant and anti-inflammatory effects.

5. Conclusions

This study conducted comprehensive non-targeted metabolomics and transcriptome analysis on three different chili peppers, CS03, CS29, and L816, at different stages. Due to the significantly higher content of anthocyanins in the young fruit stage of pepper CS03 compared with the other two varieties and the non-targeted metabolome indicating that flavonoids were also significantly different in the different pepper samples, this study mainly analyzed the expression levels of structural genes in the flavonoid/anthocyanin biosynthesis pathway and differentially expressed transcription factors during the young fruit stage. The research results indicated that compared with the CS29 and L816 peppers, the formation of a purple color in the young fruit stage of CS03 was mainly determined by cyanidin, delphinidin, and cyanidin 3-glucoside. Relevant analyses showed that structural genes in the biosynthesis pathway of flavonoids, as well as the related transcription factors CaMYBs and CabHLHs, may participate in both the formation of anthocyanins and flavonoids. In conclusion, our results provide a reference for the biosynthesis and accumulation mechanism of flavonoids/anthocyanins in chili peppers and suggest correlations that should be explored functionally.

Supplementary Materials

The following supporting information can be downloaded at https://www.mdpi.com/article/10.3390/horticulturae11060638/s1: Figure S1: Differential metabolites column diagram between CS03_Y, CS29_Y, and L816_Y; Figure S2: KEGG enrichment analysis of common_Y (CS03_Y_vs_CS29_Y and CS03_Y_vs_L816_Y); Figure S3: Compound classification; Figure S4: Statistics of TF family; Supplementary Table S1: The primer list for qRT-PCR; Supplementary Table S2: All metabolites detected by non-targeted metabolome; Supplementary Table S3: Detailed classification and quantity of phytochemical compounds; Supplementary Table S4: Specific flavonoids detected by non-targeted metabolome; Supplementary Table S5: Differentially Expressed Genes between CS03, CS29 and L816 in the young fruit stage; Supplementary Table S6: 247 transcription factors predicted by combined analysis of differentially expressed genes and metabolites; Supplementary Table S7: Details of TF family classification.

Author Contributions

Conceptualization and methodology, W.H.; software and validation, H.C.; formal analysis and investigation, R.Z.; data curation, writing—original draft preparation, and writing—review and editing, Y.M.; visualization and supervision, P.L.; resources, project administration, and funding acquisition, M.D. All authors have read and agreed to the published version of the manuscript.

Funding

This research was funded by the National Natural Science Foundation of China (32460764, 32160708); the project of Yunnan Science and Technology Plan (202205AR070001); and Yunnan Province “Xing Dian talent support plan” project (XDYC-CYCX-2022-0034).

Data Availability Statement

Data is contained within the article and supplementary materials.

Conflicts of Interest

The authors declare no conflicts of interest.

References

  1. Grotewold, E. The genetics and biochemistry of floral pigments. Annu. Rev. Plant Biol. 2006, 57, 761–780. [Google Scholar] [CrossRef]
  2. Villa-Rivera, M.G.; Ochoa-Alejo, N. Chili Pepper Carotenoids: Nutraceutical Properties and Mechanisms of Action. Molecules 2020, 25, 5573. [Google Scholar] [CrossRef] [PubMed]
  3. Lee, Y.M.; Yoon, Y.; Yoon, H.; Park, H.M.; Song, S.; Yeum, K.J. Dietary Anthocyanins against Obesity and Inflammation. Nutrients 2017, 9, 1089. [Google Scholar] [CrossRef] [PubMed]
  4. González-Paramás, A.M.; Ayuda-Durán, B.; Martínez, S.; González-Manzano, S.; Santos-Buelga, C. The Mechanisms Behind the Biological Activity of Flavonoids. Curr. Med. Chem. 2019, 26, 6976–6990. [Google Scholar] [CrossRef]
  5. Kumar, S.; Pandey, A.K. Chemistry and biological activities of flavonoids: An overview. Sci. World J. 2013, 2013, 162750. [Google Scholar] [CrossRef]
  6. Lepiniec, L.; Debeaujon, I.; Routaboul, J.M.; Baudry, A.; Pourcel, L.; Nesi, N.; Caboche, M. Genetics and biochemistry of seed flavonoids. Annu. Rev. Plant Biol. 2006, 57, 405–430. [Google Scholar] [CrossRef]
  7. Cho, S.Y.; Kim, H.W.; Lee, M.K.; Kim, H.J.; Kim, J.B.; Choe, J.S.; Lee, Y.M.; Jang, H.H. Antioxidant and Anti-Inflammatory Activities in Relation to the Flavonoids Composition of Pepper (Capsicum annuum L.). Antioxidants 2020, 9, 986. [Google Scholar] [CrossRef]
  8. Holton, T.A.; Cornish, E.C. Genetics and Biochemistry of Anthocyanin Biosynthesis. Plant Cell 1995, 7, 1071–1083. [Google Scholar] [CrossRef] [PubMed]
  9. Liu, Y.; Tikunov, Y.; Schouten, R.E.; Marcelis, L.F.M.; Visser, R.G.F.; Bovy, A. Anthocyanin Biosynthesis and Degradation Mechanisms in Solanaceous Vegetables: A Review. Front. Chem. 2018, 6, 52. [Google Scholar] [CrossRef]
  10. Suresh, S.; Begum, R.F.; Singh, A.S.; Chitra, V. Anthocyanin as a therapeutic in Alzheimer’s disease: A systematic review of preclinical evidences. Ageing Res. Rev. 2022, 76, 101595. [Google Scholar] [CrossRef]
  11. Wang, J.; Fang, X.; Ge, L.; Cao, F.; Zhao, L.; Wang, Z.; Xiao, W. Antitumor, antioxidant and anti-inflammatory activities of kaempferol and its corresponding glycosides and the enzymatic preparation of kaempferol. PLoS ONE 2018, 3, e0197563. [Google Scholar] [CrossRef]
  12. Imran, M.; Salehi, B.; Sharifi-Rad, J.; Aslam Gondal, T.; Saeed, F.; Imran, A.; Shahbaz, M.; Tsouh Fokou, P.V.; Umair Arshad, M.; Khan, H.; et al. Kaempferol: A Key Emphasis to Its Anticancer Potential. Molecules 2019, 24, 2277. [Google Scholar] [CrossRef]
  13. Kamisah, Y.; Jalil, J.; Yunos, N.M.; Zainalabidin, S. Cardioprotective Properties of Kaempferol: A Review. Plants 2023, 12, 2096. [Google Scholar] [CrossRef]
  14. Tang, B.; Li, L.; Hu, Z.; Chen, Y.; Tan, T.; Jia, Y.; Xie, Q.; Chen, G. Correction to Anthocyanin Accumulation and Transcriptional Regulation of Anthocyanin Biosynthesis in Purple Pepper. J. Agric. Food Chem. 2020, 68, 12152–12163. [Google Scholar] [CrossRef]
  15. Bi, M.; Liang, R.; Wang, J.; Qu, Y.; Liu, X.; Cao, Y.; He, G.; Yang, Y.; Yang, P.; Xu, L.; et al. Multifaceted roles of LhWRKY44 in promoting anthocyanin accumulation in Asiatic hybrid lilies (Lilium spp.). Hortic. Res. 2023, 10, uhad167. [Google Scholar] [CrossRef]
  16. Zhang, L.; Zhang, F.; He, X.; Dong, Y.; Sun, K.; Liu, S.; Wang, X.; Yang, H.; Zhang, W.; Lakshmanan, P.; et al. Comparative metabolomics reveals complex metabolic shifts associated with nitrogen-induced color development in mature pepper fruit. Front. Plant Sci. 2024, 15, 1319680. [Google Scholar] [CrossRef]
  17. Karppinen, K.; Lafferty, D.J.; Albert, N.W.; Mikkola, N.; McGhie, T.; Allan, A.C.; Afzal, B.M.; Häggman, H.; Espley, R.V.; Jaakola, L. MYBA and MYBPA transcription factors co-regulate anthocyanin biosynthesis in blue-coloured berries. N. Phytol. 2021, 232, 1350–1367. [Google Scholar] [CrossRef]
  18. Naing, A.H.; Kim, C.K. Roles of R2R3-MYB transcription factors in transcriptional regulation of anthocyanin biosynthesis in horticultural plants. Plant Mol. Biol. 2018, 98, 1–18. [Google Scholar] [CrossRef] [PubMed]
  19. Wang, L.; Zhong, Y.; Liu, J.; Ma, R.; Miao, Y.; Chen, W.; Zheng, J.; Pang, X.; Wan, H. Pigment Biosynthesis and Molecular Genetics of Fruit Color in Pepper. Plants 2023, 12, 2156. [Google Scholar] [CrossRef]
  20. Song, S.; Tao, Y.; Gao, L.; Liang, H.; Tang, D.; Lin, J.; Wang, Y.; Gmitter, F.G., Jr.; Li, C. An Integrated Metabolome and Transcriptome Analysis Reveal the Regulation Mechanisms of Flavonoid Biosynthesis in a Purple Tea Plant Cultivar. Front. Plant Sci. 2022, 13, 880227. [Google Scholar] [CrossRef]
  21. Liu, X.P.; Luo, M.; Liu, X.Q.; Hao, L.Y.; Zhu, C.; Wang, L.; Ma, L.Y. MYB-1 regulates anthocyanin biosynthesis in Magnolia wufengensis. Plant Physiol. Biochem. 2024, 217, 109283. [Google Scholar] [CrossRef]
  22. Sun, B.; Zhou, X.; Chen, C.; Chen, C.; Chen, K.; Chen, M.; Liu, S.; Chen, G.; Cao, B.; Cao, F.; et al. Coexpression network analysis reveals an MYB transcriptional activator involved in capsaicinoid biosynthesis in hot peppers. Hortic. Res. 2020, 7, 162. [Google Scholar] [CrossRef]
  23. Zhang, D.; Sun, L.; Xi, D.; Li, X.; Gao, L.; Miao, L.; Luo, Y.; Tian, M.; Zhu, H. Methyl jasmonate-induced bHLH42 mediates tissue-specific accumulation of anthocyanins via regulating flavonoid metabolism-related pathways in Caitai. Physiol. Plant. 2024, 176, e14434. [Google Scholar] [CrossRef]
  24. Zhu, J.; Wang, Y.; Wang, Q.; Li, B.; Wang, X.; Zhou, X.; Zhang, H.; Xu, W.; Li, S.; Wang, L. The combination of DNA methylation and positive regulation of anthocyanin biosynthesis by MYB and bHLH transcription factors contributes to the petal blotch formation in Xibei tree peony. Hortic. Res. 2023, 10, uhad100. [Google Scholar] [CrossRef]
  25. Teng, Y.; Xu, X.; Chen, X. Sichuan Southwest Pepper Germplasm Resources. Chin. Veg. 1997, 31–34. (In Chinese) [Google Scholar]
  26. Sui, Y.; Qian, C.; Chen, J.; Shi, J.; Hu, N.; Cao, Y. Analysis of Summer Fruit Setting Rate and Main Photosynthetic Characteristics of Purple Chili. J. Hortic. 2011, 38, 77–86. (In Chinese) [Google Scholar]
  27. Razola-Díaz, M.D.C.; Gómez-Caravaca, A.M.; López de Andrés, J.; Voltes-Martínez, A.; Zamora, A.; Pérez-Molina, G.M.; Castro, D.J.; Marchal, J.A.; Verardo, V. Evaluation of Phenolic Compounds and Pigments Content in Yellow Bell Pepper Wastes. Antioxidants 2022, 11, 557. [Google Scholar] [CrossRef]
  28. Wang, Y.; Liu, S.; Wang, H.; Zhang, Y.; Li, W.; Liu, J.; Cheng, Q.; Sun, L.; Shen, H. Identification of the Regulatory Genes of UV-B-Induced Anthocyanin Biosynthesis in Pepper Fruit. Int. J. Mol. Sci. 2022, 23, 1960. [Google Scholar] [CrossRef]
  29. Liu, Y.; Lv, J.; Liu, Z.; Wang, J.; Yang, B.; Chen, W.; Ou, L.; Dai, X.; Zhang, Z.; Zou, X. Integrative analysis of metabolome and transcriptome reveals the mechanism of color formation in pepper fruit (Capsicum annuum L.). Food Chem. 2020, 306, 125629. [Google Scholar] [CrossRef]
  30. Wang, Y.; Li, X.; Qiu, H.; Chen, R.; Zhang, Z.; Xiong, A.; Xu, Z.; Chen, R.; Zhang, X.; Liu, X.; et al. Metabolomics and transcriptomics analyses provide insights into the dynamic of metabolites and the molecular mechanisms of natural pigment formation of different color-transition types of red Pepper (Capsicum). Sci. Hortic. 2025, 342, 114062. [Google Scholar] [CrossRef]
  31. Kovács, Z.; Bedő, J.; Pápai, B.; Tóth-Lencsés, A.K.; Csilléry, G.; Szőke, A.; Bányai-Stefanovits, É.; Kiss, E.; Veres, A. Ripening-Induced Changes in the Nutraceutical Compounds of Differently Coloured Pepper (Capsicum annuum L.) Breeding Lines. Antioxidants 2022, 11, 637. [Google Scholar] [CrossRef]
  32. Iwashina, T. Contribution to flower colors of flavonoids including anthocyanins: A review. Nat. Prod. Commun. 2015, 10, 529–544. [Google Scholar] [CrossRef] [PubMed]
  33. Yoshida, K. Chemical and biological study of flavonoid-related plant pigment: Current findings and beyond. Biosci. Biotechnol. Biochem. 2024, 88, 705–718. [Google Scholar] [CrossRef]
  34. Nishihara, M.; Hirabuchi, A.; Goto, F.; Nishizaki, Y.; Uesugi, S.; Watanabe, A.; Tasaki, K.; Washiashi, R.; Sasaki, N. Production of yellow-flowered gentian plants by genetic engineering of betaxanthin pigments. New Phytol. 2023, 240, 1177–1188. [Google Scholar] [CrossRef] [PubMed]
  35. Sadilova, E.; Stintzing, F.C.; Carle, R. Anthocyanins, colour and antioxidant properties of eggplant (Solanum melongena L.) and violet pepper (Capsicum annuum L.) peel extracts. Z. Naturforsch C J. Biosci. 2006, 61, 527–535. [Google Scholar] [CrossRef]
  36. Agarwal, P.; Holland, T.M.; James, B.D.; Cherian, L.J.; Aggarwal, N.T.; Leurgans, S.E.; Bennett, D.A.; Schneider, J.A. Pelargonidin and Berry Intake Association with Alzheimer’s Disease Neuropathology: A Community-Based Study. J. Alzheimer’s Dis. 2022, 88, 653–661. [Google Scholar] [CrossRef]
  37. Nayak, B.; Liu, R.H.; Tang, J. Effect of processing on phenolic antioxidants of fruits, vegetables, and grains—A review. Crit. Rev. Food Sci. Nutr. 2015, 55, 887–919. [Google Scholar] [CrossRef]
  38. Wadhera, D.; Capaldi-Phillips, E.D. A review of visual cues associated with food on food acceptance and consumption. Eat. Behav. 2014, 15, 132–143. [Google Scholar] [CrossRef]
  39. Wang, S.-Q.; Zhou, X.-L.; Lyu, Z.-Y.; Zhang, R.; Yang, L.; Shen, S.-K. Anthocyanin accumulation underlies petal blotch coloration in Rhododendron rex and its medicinal potential. Ind. Crops Prod. 2025, 224, 120335. [Google Scholar] [CrossRef]
  40. Xu, Z.S.; Feng, K.; Que, F.; Wang, F.; Xiong, A.S. A MYB transcription factor, DcMYB6, is involved in regulating anthocyanin biosynthesis in purple carrot taproots. Sci. Rep. 2017, 7, 45324. [Google Scholar] [CrossRef]
  41. Meng, Y.; Zhang, H.; Fan, Y.; Yan, L. Anthocyanins accumulation analysis of correlated genes by metabolome and transcriptome in green and purple peppers (Capsicum annuum). BMC Plant Biol. 2022, 22, 358. [Google Scholar] [CrossRef]
Figure 1. The phenotype and total anthocyanin contents in different stages of the CS03, CS29, and L816 peppers. (a) The phenotypes of pepper CS03 at different developmental stages. (b) Samples from the corresponding periods (15 days, 50 days, 60 days) of the CS03, CS29, and L816 peppers were analyzed in this study. (c) The total chlorophyll, carotenoid, and anthocyanin concentrations in different samples (measurement unit of total chlorophyll and carotenoids was µg/g, measurement unit of anthocyanins was nmol/g; *** represents an obvious significant difference between them, p < 0.001).
Horticulturae 11 00638 g001aHorticulturae 11 00638 g001b
Figure 2. Analysis of total metabolites in three chili peppers. (a) Detailed classification of metabolites from three chili peppers based on phytochemistry classification. (b) PCA and 3D-PCA of three groups and OPLS-DA graph of CS03_Y, CS29_Y, and L816_Y (ANOSIM, Confidence level of 95%). (c) KEGG pathway enrichment analysis between CS03, CS29, and L816 peppers in young fruit stage (p < 0.05).
Horticulturae 11 00638 g002
Figure 3. The cluster heatmap tree of flavonoids in different samples in different stages (the columns in the figure represent samples, rows represent metabolites, and colors represent the relative expression levels of metabolites).
Horticulturae 11 00638 g003
Figure 4. Transcriptome analysis of different peppers in young fruit stage. (a) Statistic of DEGs between CS03_Y, CS29_Y, and L816_Y (Significance level: p < 0.05; Difference multiple of up/down adjustment: 5). (b) Venn diagram between CS03_Y_vs_CS29_Y, CS03_Y_vs_ L816_Y, and CS29_Y_vs_L816_Y. (c) KEGG analysis of common DEGs in pepper during young fruit stage (DEGs are significantly enriched in these two pathways (red frames) that related to anthocyanin biosynthesis, p < 0.05).
Horticulturae 11 00638 g004
Figure 5. Correlation analysis of the transcriptome and metabolome. (a) Combined KEGG enrichment analysis between the transcriptome and metabolome (Using the BH method to correct the p value, p < 0.05). (b) Correlation chord diagram between the transcriptome and metabolome. The labels on the edge of the circle are genes or metabolites, with metabolites on the left and genes on the right. The connecting lines inside the circle represent the correlation between genes and metabolites, and each string inside the circle represents a significant correlation between metabolites and genes. A red string represents a positive correlation, and a green string represents a negative correlation. (c) Expression correlation network diagram. Predicted transcription factors related to anthocyanins and representative flavonoids and the correlation between structural genes and anthocyanins or flavonoids (a red line represents a positive correlation, and a green line represents a negative correlation).
Horticulturae 11 00638 g005
Figure 6. The phenylpropanoid and flavonoid/anthocyanin biosynthesis pathway, heatmap, and VIP score of anthocyanins. (a) The phenylpropanoid and flavonoid/anthocyanin biosynthesis pathway. (b) Heatmap depicting the relative abundance levels of related anthocyanins in different pepper samples; red boxes represent high abundance, and purple boxes represent low abundance. (c) The expression profile and VIP metabolites (* p < 0.05).
Horticulturae 11 00638 g006
Figure 7. The qRT-PCR results compared with the TPM value of genes in the samples from transcriptome data.
Horticulturae 11 00638 g007
Disclaimer/Publisher’s Note: The statements, opinions and data contained in all publications are solely those of the individual author(s) and contributor(s) and not of MDPI and/or the editor(s). MDPI and/or the editor(s) disclaim responsibility for any injury to people or property resulting from any ideas, methods, instructions or products referred to in the content.

