Abstract
The production of fruit crops plays a vital role in the agricultural sector, contributing significantly to the social and economic development of rural communities. In Brazil, fruit production is diverse due to favorable edaphoclimatic conditions, with avocado (Persea americana Mill.) emerging as an important crop. Its production continues to expand in both cultivated areas and yield, making it a key export to non-producing countries. However, despite its importance, nutritional management information, crucial for achieving high yields, remains limited. Current guidelines on nutrition monitoring are outdated, general, and based on data from other countries with different edaphoclimatic conditions, making them not directly applicable to Brazilian orchards. Furthermore, outdated nutritional information becomes less reliable over time, as climate change alters soil conditions and crop nutrient concentrations and requirements, reinforcing the need for the establishment of up-to-date and specific nutritional information. This study aimed to establish nutritional standards for ‘Hass’ avocado production using the Diagnosis and Recommendation Integrated System (DRIS) and Compositional Nutrient Diagnosis (CND) methodologies, and to define sufficiency ranges (SRs) and Critical Levels (CLs) for both macronutrients (N, P, K, Ca, Mg, and S) and micronutrients (B, Cu, Fe, Mn, and Zn). The analyses were based on yield (t ha−1) and leaf nutrient content data from commercial orchards, with datasets divided into younger (4–9 years) and older (10–26 years) plant groups. The DRIS effectively established nutritional standards for younger plants, explaining 11% of yield variation through nutritional balance. CND, in turn, was effective for both groups, accounting for 14% of yield variation and outperforming DRIS in associating nutritional status with productivity. SRs and CLs for ‘Hass’ avocado production were defined using both DRIS and CND. Together, these indices and diagnostic parameters offer valuable tools for enhancing nutritional monitoring and fertilization strategies in Brazil. Notably, SRs and CLs varied according to plant age.
1. Introduction
Brazil produces a wide variety of fruits due to the diverse climate conditions across the country [1], making it the third largest producer globally, with approximately 40 million tons of fresh fruit produced in 2020 [2]. Among these, avocado (Persea americana Mill.) has seen significant growth in both yield and cultivated area, positioning Brazil as the seventh largest global producer, with 338 thousand tons produced in 2022 [3].
The opening of international markets in response to increasing avocado consumption has driven global demand, particularly in non-producing countries such as Japan, Canada, France, the Netherlands, and England [4]. This demand continues to rise due to the health benefits of avocados, which contribute to weight loss, combat oxidative stress, and reduce inflammation [5,6]. This trend presents significant opportunities for Brazilian producers. Recently, it was reported that avocado became the 11th most exported fruit from Brazil [7], with 25.6 thousand tons destined for international markets in 2023, more than double the amount exported in 2022 [8], primarily the ‘Hass’ cultivar.
In Brazil, São Paulo is the leading state in avocado production, accounting for approximately 43.4% of the country’s total output [9]. Although the potential for avocado production is estimated to exceed 30.0 t ha−1 [10], as also observed in countries like Samoa, El Salvador, and Panama [3], the average productivity in Brazil remains at 18.6 t ha−1 [3,9], indicating a gap and presenting an opportunity to further increase productivity in Brazilian orchards.
Achieving high yields is influenced by several biotic and abiotic factors [11]. Additionally, plant growth and development depend on nutritional balance, as an excess or deficiency of nutrients can negatively impact productivity and crop quality [12]. Assessing the nutritional status through leaf analysis is crucial for planning fertilization programs, thereby enhancing productivity [13].
Despite the potential for avocado production in Brazil, studies on mineral nutrition management are limited. Information on the upper and lower nutrient limits for optimal avocado cultivation has not been updated or developed for specific cultivars. The only reference available to avocado producers is the sufficiency ranges in Teixeira et al. [14], which have remained unchanged since the last publication [15] and, in addition to not specifying cultivars, are similar to those published by Embleton and Jones [16].
Moreover, climate change represents a growing challenge for agricultural systems, with projections indicating a potential reduction in global crop yields [17,18]. Nutrient management is particularly affected by climatic variability, which can alter plant physiological processes and soil dynamics [19,20,21]. These factors underscore the increasing need for updated and comprehensive nutritional guidelines to sustain crop performance under changing environmental conditions.
Given this, the use of diagnostic methodologies such as the Diagnosis and Recommendation Integrated System (DRIS) [22], a bivariate method, and Compositional Nutrient Diagnosis (CND) [23], a multivariate method, emerges as a valuable tool. These methods not only determine crop nutritional standards but can also generate sufficiency ranges (SRs) and Critical Levels (CLs) [24], while considering nutrient interactions [25], distinguishing them from the classical univariate method and allowing for a more precise assessment of plants’ nutritional status, especially when employed with compositional data from commercial areas [26].
Applying the DRIS and CND diagnostic methods to compositional data from commercial ‘Hass’ avocado orchards will allow the establishment of accurate nutritional standards, including SRs and CLs for macro- and micronutrients, thereby supporting more effective nutrient management and enhancing yield performance under Brazilian conditions. Therefore, the objective of this study was to establish the DRIS and CND standards in avocado ‘Hass’ production and generate the SRs and CLs of macro- and micronutrients’ leaf nutrient content for adequate ‘Hass’ avocado production.
2. Materials and Methods
2.1. Data Collection
The data used in this study consisted of leaf nutrient content (N, P, K, Ca, Mg, S, B, Cu, Fe, Mn, and Zn) and yield (t ha−1), collected from 2021 to 2024 across four avocado ‘Hass’ production farms located in Avaré, Bernardino de Campos, Charqueada, and Itaí, São Paulo, Brazil (Figure 1). The predominant soil types in these regions are Argisol and Latosol [27]. The climate of the region is classified according to the Köppen system as Cfa in Avaré, Bernardino de Campos, and Itaí and as Cwa in Charqueada. Avaré has a mean annual temperature of 19.6 °C and rainfall of 1315.8 mm; Bernardino de Campos, 20.2 °C and 1334.6 mm; Charqueada, 20.4 °C and 1339.7 mm; and Itaí, 19.7 °C and 1235.3 mm [28].
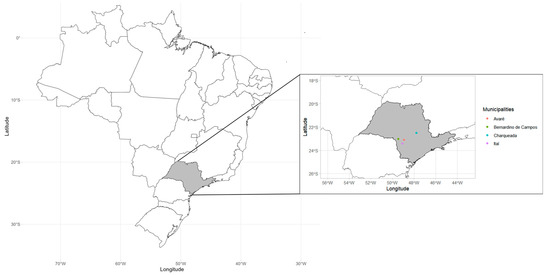
Figure 1.
Geographical distribution of ‘Hass’ avocado production farms used for data collection.
The dataset consisted of commercial-age rainfed ‘Hass’ avocado plants grafted onto seed-derived rootstocks, with plant ages ranging from 4 to 26 years (176 commercial plots). Due to age differences between the plants, two separate datasets were created and analyzed: one for the 4–9-year-old plants (123 plots) with plants spaced at 7 m × 4 m, 7 m × 5 m, 8 m × 4 m, 8 m × 5 m, and 8 m × 6 m, and another for the 10–26-year-old plants (53 plots) with plants spaced at 7 m × 5 m, 8 m × 6 m, 9 m × 4.5 m, and 10 m × 5 m. To confirm the need for dividing the datasets by plant age, a t-test was performed on the multivariate nutrient relationship obtained in the CND calculation.
Leaf sampling followed the protocol established by Koen and Plessis [29], collecting four complete (leaf + petiole) fully expanded healthy leaves from each quadrant of the plant, located at the 3rd node of fruitless shoots without signs of new vegetative growth flushes. After sample collection, the leaves were dried in a forced-air oven at 60 °C ± 5 °C until reaching a constant weight, then ground and passed through a 20-mesh sieve. N concentration was determined using the micro-Kjeldahl method. K, Ca, Mg, Cu, Fe, Mn, and Zn were quantified by atomic absorption spectrophotometry, while P and B were determined by colorimetry and S by turbidimetry [30]. Yield (t ha−1) for each plot was recorded and used as the productivity indicator for the CND and DRIS calculations.
2.2. DRIS—Calculations and Statistical Analyses
Nutrient content for macronutrients was expressed in g kg−1, while micronutrients were expressed in mg kg−1. The datasets consisted of 123 plots for 4–9-year-old plants and 53 plots for 10–26-year-old plants. The normality of each yield distribution was tested using the Kolmogorov–Smirnov test—4–9-year-old plants (p > 0.24) and 10–26-year-old plants (p > 0.59)—indicating that the data followed a normal distribution [31]. Each dataset was then divided into high-yield (reference population) and low-yield populations, using the mean yield (t ha−1) as the criterion [32]. The mean and standard deviation (DRIS norms) of the log-transformed bivariate relationships for the reference population were calculated [33], followed by the determination of nutrient ratio functions [34]:
where represents the dual relationship between nutrient content in the sample; is the average of the dual relationships for nutrient content in the high-yield population; s is the standard deviation of the dual relationships in the high-yield population; and c is the sensitivity coefficient (set to 1).
Subsequently, DRIS indices were calculated for each nutrient [22]:
where IA is the DRIS index for nutrient A; is the directly proportional function between two nutrients; is the inversely proportional function between two nutrients; n is the number of direct relationships assessed; and m is the number of inverse relationships assessed.
The Nutrient Balance Index (NBI) was calculated as the sum of the absolute values of the DRIS indices for each nutrient [22]:
The Mean Nutrient Balance Index (NBIm) was then calculated by dividing the NBI by the total number of nutrients analyzed (n):
Finally, the Critical Levels, along with the lower and upper limits for each dataset, were determined through regression analysis between each nutrient’s content and its corresponding NBI [35,36].
2.3. CND—Calculations and Statistical Analyses
Nutrient content for both macronutrients and micronutrients is expressed in mg kg−1. Outlier exclusion was performed using the Mahalanobis distance (p < 0.01) for both datasets [37]. After excluding outliers, the number of plots for the CND calculations was 120 for the 4–9-year-old plants (97.6% of the original dataset) and 45 for the 10–26-year-old plants (85% of the original dataset). Normality tests using the Kolmogorov–Smirnov test indicated that the data followed a normal distribution: 4–9-year-old (p > 0.24) and 10–26-year-old (p > 0.57) [31]. Each dataset was then divided into high-yield (reference population) and low-yield populations, with the cumulative distribution function serving as the criterion [38].
The CND calculation for each dataset was performed following the procedure to obtain R, where leaf tissue is regarded as a closed system consisting of both quantified nutrients and non-quantified components, represented by R [23]:
where R represents all components not determined in the dry matter, expressed in mg kg−1; 1,000,000 represents the total dry matter in mg kg−1; and Nti is the quantity of each nutrient in the dry matter, also expressed in mg kg−1.
The geometric mean was calculated to ensure that all components included in the R value were accounted for in the sample analysis [23]:
where G is the geometric mean of nutrient content in the dry matter; Nti is the content of each nutrient in the dry matter; R is the value of non-determined components; and n is the number of nutrients analyzed.
Next, the multivariate relationship between the nutrients was determined using the Napierian logarithm of nutrient content to improve the data distribution [33]:
where Vi represents the multivariate relationship between the nutrients; G is the geometric mean of the nutrient content in the dry matter; and Nti is the content of each nutrient in the dry matter.
The CND indices were then calculated:
where Ii is the Nutritional Balance Index for nutrient i; VI is the value of the multivariate relationship I for the evaluated sample; Vi is the mean value of the multivariate relationship i in the reference population; and σi is the standard deviation of the variable i in the reference population.
The Nutrient Imbalance Index (CND-r2) was determined by summing the individual indices. Critical Levels, along with the lower and upper limits for each dataset, were established through regression analysis of each nutrient’s content against its corresponding CND index [35,36].
2.4. Statistical Analysis
The Pearson correlation analysis, regression tests, and t-test were performed using the R software (version 4.3.3) [39].
3. Results
3.1. T-Test of the Multivariate Nutrient Relationships
Differences in nutritional balance between the two datasets were observed through a t-test applied to the multivariate relationships among nutrients obtained from the CND calculation (Table 1). All parameters showed significant differences between the datasets, except for K, Fe, and Mn (Table 1).

Table 1.
Mean ± standard deviation (SD) and t-test of multivariate relationship between nutrients (CND standards) for leaf nutrient content in relation to yield in the 4–9-year-old and 10–26-year-old plant datasets for ‘Hass’.
3.2. Correlation Analysis
In the 4–9-year-old plants dataset, 27 significant correlations were identified. All nutrients exhibited either positive or negative correlations with one another, and yield showed a negative correlation with N, Fe, and Mn, while being positively correlated with Mg (Figure 2a). In the 10–26-year-old plants dataset, 23 significant correlations were observed. All nutrients, except N, were correlated with each other, and yield had a negative correlation with Ca, Mg, and Mn, while being positively correlated with B, Cu, and Zn (Figure 2b).
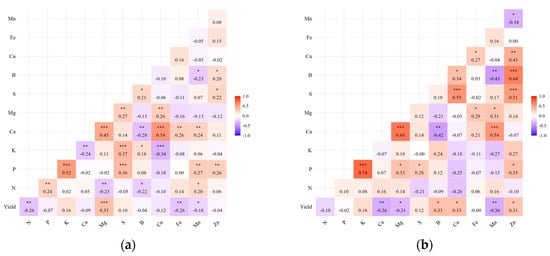
Figure 2.
Pearson’s correlation matrix between leaf nutrient content and yield (t ha−1) in ‘Hass’: (a) 4–9-year-old plants (n = 123); (b) 10–26-year-old plants (n = 53). Significancy levels: *** p < 0.001, ** p < 0.01, and * p < 0.05.
3.3. DRIS Standards Establishment
The datasets were divided into high- and low-yield populations. In the 4–9-year-old plants’ high-yield population, the yield ranged from 9.0 to 33.6 t ha−1, with a mean productivity of 19.2 t ha−1, and 30% of the dataset was classified as high-yield. In the 10–26-year-old plants’ high-yield population, the yield varied from 9.0 to 33.3 t ha−1, with a mean productivity of 15.1 t ha−1, and 43.4% of the plots were classified as high-yield within the entire dataset (Table 2).
Table 2.
Minimum (Min.), maximum (Max.), mean, standard deviation (SD), and coefficient of variation (CV) for leaf nutrient content and yield in the 4–9-year-old and 10–26-year-old plant datasets for ‘Hass’, categorized into high- and low-yield populations, for the DRIS calculation.
In general, for both datasets and for both high- and low-yield populations, the coefficient of variation was higher for micronutrients compared to macronutrients (Table 2).
The mean and standard deviation of the log-transformed nutrient ratios for leaf content in the high-yield populations of both the 4–9-year-old and 10–26-year-old plant datasets were calculated (Table 3 and Table 4).
Table 3.
Mean (x̅) and standard deviation (SD) of log-transformed ratios (R) (DRIS standards) for leaf nutrient content in the high-yield population of 4–9-year-old ‘Hass’ plants.
Table 4.
Mean (x̅) and standard deviation (SD) of log-transformed ratios (R) (DRIS standards) for leaf nutrient content in the high-yield population of 10–26-year-old ‘Hass’ plants.
Linear and quadratic regression analyses were performed between the mean Nutrient Balance Index (NBIm) and yield for both datasets (Figure 3). For the 4–9-year-old plant dataset, the regression was statistically significant, with an R2 of 11%, indicating that 11% of the variation in yield for ‘Hass’ avocado production can be explained by the plant’s nutritional status (Figure 3a). In contrast, the 10–26-year-old plant dataset showed no significant correlation, with an R2 of 4%, suggesting that for these plots, yield variation is not solely dependent on the nutritional balance of the avocado trees but also influenced by other field factors (Figure 3b).
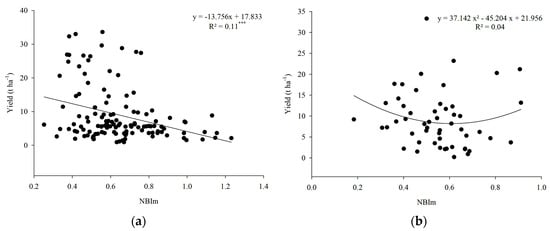
Figure 3.
Relationship between the mean Nutrient Balance Index (NBIm) and yield (t ha−1) in ‘Hass’ (a) 4–9-year-old plants; (b) 10–26-year-old plants. Significancy level: *** p < 0.001.
3.4. CND Standards Establishment
The regression analysis between the cumulative function and yield was fitted to a cubic model. For the 4–9-year-old plants dataset, the inflection point occurred at 20.3 t ha−1, classifying 15.0% of the dataset as the high-yield population. In the 10–26-year-old plants dataset, the inflection point was 10.0 t ha−1, with 33.3% of the dataset classified as high-yield. The yield in the high-yield population of the 4–9-year-old dataset ranged from 20.6 to 33.6 t ha−1, with a mean productivity of 26.5 t ha−1. For the high-yield population in the 10–26-year-old plants dataset, the yield ranged from 10.3 to 33.3 t ha−1, with a mean of 16.1 t ha−1 (Table 5). In general, both high- and low-yield populations in both datasets showed higher coefficients of variation for some types of micronutrient leaf content compared to macronutrients (Table 5).
Table 5.
Minimum (Min.), maximum (Max.), mean, standard deviation (SD), and coefficient of variation (CV) for leaf nutrient content and yield in the 4–9-year-old and 10–26-year-old plant datasets for ‘Hass’, categorized into high- and low-yield populations, for the CND calculation.
The mean and standard deviation of the multivariate relationships between nutrients (CND standards) were calculated (Table 6). Based on the high values obtained, the macronutrients with the greatest requirements for ‘Hass’ avocado production, in both datasets, were ranked in descending order as follows: N > Ca > K > Mg > S > P (Table 6).
Table 6.
Mean and standard deviation (SD) of multivariate relationship between nutrients (CND standards) for leaf nutrient content in relation to yield in the 4–9-year-old and 10–26-year-old plant datasets for ‘Hass’.
The Nutrient Imbalance Index (CND-r2) regression in relation to yield for both datasets was fitted to a linear model. For the 4–9-year-old plants dataset, the regression was highly significant (p < 0.001), while for the 10–26-year-old plants dataset, it was significant at the 5% level. In both datasets, the R2 value was 14%, indicating that, using the CND method, 14% of the variation in yield can be explained by nutritional balance (Figure 4).
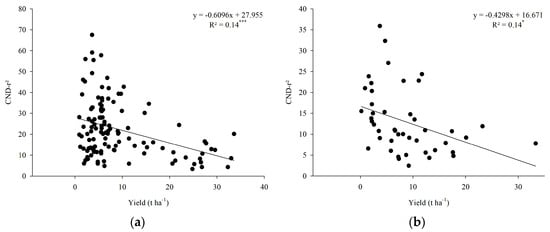
Figure 4.
Relationship between the Nutrient Imbalance Index (CND-r2) and yield in ‘Hass’ (a) 4–9-year-old plants; (b) 10–26-year-old plants. Significancy level: *** p < 0.001, and * p < 0.05.
3.5. Sufficiency Range (SR) and Critical Level (CL) Development
Establishing the SR and CL using the DRIS indices for each nutrient and their relationships with the respective leaf nutrient content resulted in linear, quadratic, and logarithmic regression models (Table 7). All regressions were significant (p < 0.001, p < 0.01, and p < 0.05) for both datasets, with high R2 values ranging from 38% to 96%. As a result, SRs and CLs were calculated using the DRIS method for both the 4–9-year-old and 10–26-year-old plant datasets (Table 7).
Table 7.
Statistical models for the relationship between DRIS indices and leaf nutrient content, sufficiency ranges (SRs), and Critical Levels (CLs) according to datasets: 4–9-year-old and 10–26-year-old plants for ‘Hass’ avocado production.
In the CND method, regressions were fitted to linear, quadratic, and logarithmic models to analyze the relationship between the CND indices and their respective nutrient content (Table 8). For both the 4–9-year-old and 10–26-year-old plant datasets, all regressions were significant (p < 0.001, p < 0.01, and p < 0.05), with R2 values ranging from 35% to 98% (Table 7). SRs and CLs were successfully established using the CND method (Table 8).
Table 8.
Statistical models for the relationship between CND indices and leaf nutrient content, sufficiency ranges (SRs), and Critical Levels (CLs) according to datasets: 4–9-year-old and 10–26-year-old plants for ‘Hass’ avocado production.
For comparison, the SRs established in this study using the CND and DRIS indices for both the 4–9-year-old and 10–26-year-old plant datasets are presented alongside the existing SRs for avocado production in Brazil, United States and France in Table 9 and Table 10.
Table 9.
Macronutrient sufficiency ranges (SRs) for avocado production obtained by the DRIS and CND methods in the present study in comparison to the SRs existing in Brazil, the United States (USA), and France.
Table 10.
Micronutrient sufficiency ranges (SRs) for avocado production obtained by the DRIS and CND methods in the present study in comparison to the SRs existing in in Brazil, the United States (USA), and France.
The SRs established in this study showed differences between the plant datasets for both DRIS and CND. Higher values of N, Ca, Mg, Cu, and Zn were calculated for the 4–9-year-old plants dataset compared to the 10–26-year-old plants. Additionally, a wider range of Mn was observed in the older plant group (Table 9 and Table 10).
When compared to the existing SRs in Brazil, the values from this study revealed some differences, narrowing the SRs for all nutrients except Mn. It is important to note that, for some nutrients, the existing SRs either overestimate or underestimate the optimal range compared to our results (Table 9 and Table 10).
Some similarities were found between the SRs established by Embleton and Jones [16] and Gaillard [41] and the existing Brazilian SRs, even though these SRs were developed for different locations. For instance, our established SRs differ in value from the recently established ranges for California [40].
4. Discussion
Mineral nutrition is one of the most essential factors influencing plant development and yield [42]. Supplying macronutrients and micronutrients in a balanced way enables the crop to reach its genetic potential for growth and productivity [43]. On the other hand, an excess or deficiency of nutrients can directly affect crops’ yield and quality [44], underscoring the importance of an adequate nutrient supply. In our study, both datasets showed significant positive and negative correlations between nutrient content and yield.
The 4–9-year-old plants exhibited a negative correlation with N, Fe, and Mn and a positive correlation with Mg, while the 10–26-year-old plants showed a negative correlation with Ca, Mg, and Mn and a positive correlation with B, Cu, and Zn. However, explaining yield through univariate methods is challenging, as nutrients interact in complex multi-nutrient relationships [45]. As observed in the correlation matrix, almost all nutrients showed significant correlations with one another, highlighting that using a univariate method to explain yield is insufficient [46].
The variability in nutrient content in both datasets was higher for some micronutrients compared to macronutrients, as indicated by the high coefficient of variation. This phenomenon is not fully understood [47], but it is likely related to evolutionary and environmental factors. Additionally, macronutrients, which are required in larger quantities, tend to be more stable [47,48], a trend also observed in recent DRIS and CND studies on fruit crops [49,50]. In particular, the higher coefficients of variation (CVs) observed for Cu may be associated with the application of agrochemicals containing this micronutrient, which are routinely used. Despite careful washing of the plant material, Cu may remain adhered to suberized, non-physiologically active tissues, which are still included in analytical procedures that digest the entire leaf sample. In contrast, the high variability observed for Fe is likely due to differences in soil properties, especially at greater depths (below the arable layer). Such variability is common in tropical soils and may exert a greater influence on avocado crops, which are characterized by a deep root system.
The plots in the high-yield population showed a yield variation ranging from 9.0 to 33.6 t ha−1 in the 4–9-year-old plants dataset and from 9.2 to 33.3 t ha−1 in the 10–26-year-old plants dataset. The mean productivity for the high-yield populations was 19.2 t ha−1 for the younger plant group, which is higher than the Brazilian mean productivity of 18.6 t ha−1 in 2023 [9], and 15.1 t ha−1 for the older plant group, which is lower than the national average.
Avocado yield is influenced by various biotic and abiotic factors, including climate variations, pests, soil conditions, and diseases [51,52,53,54]. Additionally, as plants age, their yield tends to decrease [55], which may help explain the yield differences observed between the two datasets in our study. It is also worth noting that the 10–26-year-old plants dataset includes plots with larger spacings, which may influence yield [56].
However, both datasets included plots yielding more than 30 t ha−1, which is considered above the estimated potential for avocado production [10], suggesting that the datasets are suitable for establishing nutritional standards, as they presents high-yield orchards [57].
According to the multi-nutrient variables obtained through the CND method in this study, the greatest nutrient requirement for avocado production in both plant age groups was N > Ca > K. This differs from fruit nutrient removal studies, where in Mexico the highest nutrient export was K > N > Mg [58] and in Colombia, K > N > P [59]. This disparity emphasizes the need for site-specific studies on nutrient management in avocado, which are still lacking under Brazilian conditions.
Using the mean Nutrient Balance Index (NBIm) from the DRIS method and the Nutrient Imbalance Index (CND-r2) from the CND method, regression analysis was performed with the yield for both datasets. High values of NBIm and CND-r2 indicate nutritional imbalances in the plot, which consequently reduce yields [49]. When significant, the coefficient of determination from the regression can explain, in percentage, the variation in yield affected by the plant’s nutritional status [49,60].
In the present study, all regressions were significant, except for the DRIS method in the 10–26-year-old plants dataset. The reasons for DRIS method being ineffective for older trees may be derived from the fact that the subpopulation division in this method is based on an arbitrary criterion, and that the DRIS does not include the outlier exclusion as in the CND method. The R2 values for the 4–9-year-old plants dataset were 11% (DRIS) and 14% (CND), while for the 10–26-year-old plants dataset, they were 0.4% (DRIS) and 14% (CND). This indicates that, for the 4–9-year-old plants, 11% and 14% of the yield variation can be explained by nutritional balance, while for the 10–26-year-old plants dataset, only the CND method was effective in explaining 14% of the variation in yield.
The DRIS method has been successfully and widely applied to assess the nutritional status of fruit and perennial crops, leading to the development of SRs and CLs, as demonstrated for sweet cherry [Prunus avium (L.) L.] [61], apple [Malus domestica (Suckow) Borkh.] [62], rubber tree [Hevea brasiliensis (Willd. Ex A.Juss.) Müll.Arg.] [22], and more recently for cashew (Anacardium occidentale L.) [63] and mango (Mangifera indica L.) [64].
However, in the present study, the CND method proved to be superior to DRIS for evaluating the nutritional status of ‘Hass’ avocado. CND is a multivariate approach that considers the relationship between nutrient content and the geometric mean of other dry matter components, including those not measured in the tissue analysis [13,25]. Additionally, unlike the arbitrary division of high- and low-yield populations in the DRIS method [65], the CND method bases its division on the cumulative function of the variance ratio derived from the indices. It also uses Mahalanobis distance prior to population division, excluding aberrant data [23], which results in a more precise diagnosis [37,66].
Using the equations of the obtained regressions between nutrient indices and leaf nutrient content, equating them to zero made it possible to obtain the Critical Levels (CLs) for both the DRIS and CND methods, and by adding or subtracting two-thirds of the standard deviation of the indices, the sufficiency ranges (SRs) were calculated [60]. In this study, for the first time, we established the CLs and SRs for ‘Hass’ avocado production in Brazil, based on plant age, from data collected in commercial orchards. Plant aging alters the nutritional status of perennial woody trees and should be considered when planning fertilization programs [67], as well as when establishing nutritional standards, as demonstrated in this study, supporting the indications by Rozane et al. [68] on the need to develop specific norms and refuting the applicability of universal standards.
Despite the existence of SRs for avocado production in Brazil [14,15], these values for leaf nutritional diagnosis, considered adequate, are not cultivar-specific and have not been updated since 1997. Additionally, the values are similar to SRs established in other countries [16,41], suggesting that they may be adaptations of those SRs and may not be suitable for Brazilian orchards. This discrepancy is reflected in the different results obtained in the present study.
A similar situation occurred in California, where SRs were established by adapting values used in citrus production, combined with researcher knowledge [69]. The new optimum ranges for California avocado production were then defined, and these values differ from those previously used [40], highlighting the necessity of updating the old SRs and generating new, specific ranges to guide producers.
The development of site-specific nutritional status guidelines, such as SRs and CLs, is essential for accurately monitoring the nutritional balance of orchards [70], challenging the validity of universal recommendations [68]. Variations in edaphoclimatic conditions such as temperature and rainfall directly influence plant nutrient requirements by altering growth patterns and physiological responses [71,72,73]. Additionally, soil type and fertility are key factors that shape nutrient availability and influence symbiotic associations within the crop [74,75,76]. These environmental conditions may induce structural and physiological adaptations in plants, enhancing their ability to optimize their nutrient uptake and response under specific scenarios [75,76]. Building on the influence of local environmental factors, climate change introduces an additional layer of complexity to plant nutrition by affecting nutrient availability and plant physiology, largely driven by the rise in atmospheric CO2 and global mean temperatures [19,21].
In summary, the nutritional standards for ‘Hass’ avocado production, along with the CLs and SRs, were successfully established using the DRIS and CND methods. These results will serve as a valuable tool for nutritional monitoring in Brazilian orchards, improving nutritional balance and, consequently, yields, while minimizing losses due to over- and under-fertilization. Soon, management tools based on the CND norms will be developed, including software similar to the one presented by Rozane [77].
Annual recording of leaf nutrient content and yield data is needed to improve future DRIS and CND analyses for avocado in Brazil, especially regarding other cultivation regions and different cultivars, improving the robustness of the standards and SRs and CLs for nutritional analysis in this fruit crop.
5. Conclusions
Nutritional standards for ‘Hass’ avocado production were established using the DRIS method for 4–9-year-old plants and the CND method for both 4–9 and 10–26-year-old plant groups. CND proved more efficient than DRIS in explaining the yield variation related to nutritional balance, accounting for 14% of the variation across both age groups, with this portion of variability attributed to nutritional conditions. DRIS and CND norms can be applied to assess nutrient excess, equilibrium, or deficiency for both macro- and micronutrients. The SRs and CLs generated from these methods serve as useful tools for nutritional diagnosis and support adequate ‘Hass’ avocado production in Brazil. Together, the DRIS and CND indices, along with SRs and CLs, will contribute to more precise nutrient monitoring and fertilization strategies. Importantly, SR and CL values varied according to plant age. Further data from different cultivated regions and cultivars are needed to refine nutritional guidelines and enhance the productivity of this important and expanding crop in Brazil.
Author Contributions
Writing—original draft, investigation, data curation, and formal analysis, M.A.d.O.J.; writing—review and editing, conceptualization, data curation, formal analysis, and methodology, D.E.R.; investigation and data curation, T.C.-A.; writing—review and editing, conceptualization, project administration, supervision, and investigation, S.R.d.S. All authors have read and agreed to the published version of the manuscript.
Funding
This work was supported by Conselho Nacional de Desenvolvimento Científico e Tecnológico (CNPq) (Grant No. 147600/2021-9 and 309027/2021-7) and Coordenação de Aperfeiçoamento de Pessoal de Nível Superior (CAPES).
Data Availability Statement
Data will be made available upon reasonable request.
Acknowledgments
The authors thank the avocado production farms Carlini Avocados, HP avocados, Brasfruit, and Sítio São João for their valuable contributions to this research and CNPq and CAPES for their financial support.
Conflicts of Interest
The authors declare that they have no conflicts of interest, whether financial or non-financial.
References
- Zacharias, A.O.; Faleiro, F.G.; Almeida, G.Q. Producers profile and the adoption of technologies in passion fruit cultivation in the Triângulo Mineiro region. Rev. Bras. Frutic. 2020, 42, e-058. [Google Scholar] [CrossRef]
- Kist, B.B.; Carvalho, C.; Beling, R.R. Anuário Brasileiro de Horti & Fruti 2022; Gazeta Santa Cruz: Santa Cruz do Sul, Brazil, 2022; pp. 1–51. [Google Scholar]
- Top 10 Country Production and Gross Production Value of Avocados. FAOSTAT. Available online: https://www.fao.org/faostat/en/#rankings/countries_by_commodity (accessed on 16 December 2024).
- Ramos-Aguilar, A.L.; Ornelas-Paz, J.; Tapia-Vargas, L.M.; Ruiz-Cruz, S.; Gardea-Béjar, A.A.; Yahia, E.M.; Ornelas-Paz, J.J.; Pérez-Martínez, J.D.; Rios-Velasco, C.; Ibarra-Junquera, V. The importance of the bioactive compounds of avocado fruit (Persea americana Mill.) on human health. Biotecnia 2019, 21, 154–162. [Google Scholar] [CrossRef]
- Dreher, M.L.; Davenport, A.J. Hass avocado consumption and potential health effects. Crit. Rev. Food Sci. Nutr. 2013, 53, 738–750. [Google Scholar] [CrossRef] [PubMed]
- Caldas, A.P.S.; Chaves, L.O.; Silva, L.L.; Morais, D.C.; Alfenas, R.C.G. Mechanisms involved in the cardioprotective effect of avocado consumption: A systematic review. Int. J. Food Prop. 2017, 20, 1675–1685. [Google Scholar] [CrossRef][Green Version]
- Kist, B.B.; Beling, R.R. Anuário Brasileiro de Horti & Fruti 2023; Editora Gazeta Santa Cruz: Santa Cruz do Sul, Brazil, 2023; pp. 1–108. [Google Scholar]
- Brasil, H.F. Hortifruti Brasil 232; Centro de Estudos Avançados em Economia Aplicada (CEPEA): Piracicaba, SP, Brazil, 2023; pp. 1–32. Available online: https://www.hfbrasil.org.br/br/revista/acessar/completo/https-issuu-com-hfbrasil-docs-hf-232-flip.aspx (accessed on 22 June 2024).
- Instituto Brasileiro de Geografia e Estatística. Produção Agrícola Municipal: Culturas temporárias e permanentes. Available online: https://www.ibge.gov.br/estatisticas/economicas/agricultura-e-pecuaria/9117-producao-agricola-municipal-culturas-temporarias-e-permanentes.html (accessed on 16 December 2024).
- Schaffer, B.; Wolstenholme, B.N.; Whiley, A.W. (Eds.) Introduction. In The Avocado: Botany, Production and Uses, 2nd ed.; CAB International: Wallingford, UK, 2013; pp. 1–9. [Google Scholar]
- Lal, M.K.; Tiwari, R.K.; Altaf, M.A.; Kumar, A.; Kumar, R. Editorial: Abiotic and biotic stress in horticultural crops: Insight into recent advances in the underlying tolerance mechanism. Front. Plant Sci. 2023, 14, 1212982. [Google Scholar] [CrossRef]
- Williams, L.; Salt, D.E. The plant ionome coming into focus. Curr. Opin. Plant Biol. 2009, 12, 247–249. [Google Scholar] [CrossRef]
- Prado, R.M.; Rozane, D.E. Leaf analysis as a diagnostic tool for balanced fertilization in tropical fruits. In Fruit Crops: Diagnosis and Management of Nutrient Constraints; Srivastava, A.K., Hu, C., Eds.; Elsevier: Amsterdam, The Netherlands, 2020; pp. 131–143. [Google Scholar] [CrossRef]
- Teixeira, L.A.J.; Quaggio, J.A.; Mattos Junior, D.; Boaretto, R.M.; Cantarella, H. Frutíferas. In Boletim 100: Recomendações de Adubação e Calagem para o Estado de São Paulo; Cantarella, H., Quaggio, J.A., Mattos Junior, D., Boaretto, R.M., van Raij, B., Eds.; Instituto Agronômico de Campinas: Campinas, Brazil, 2022; pp. 259–308. [Google Scholar]
- Quaggio, J.A.; van Raij, B. Frutíferas. In Boletim 100: Recomendações de Adubação e Calagem para o Estado de São Paulo; van Raij, B., Cantarella, H., Quaggio, J.A., Furlani, Â.M.C., Eds.; Instituto Agronômico de Campinas: Campinas, Brazil, 1997; pp. 119–152. [Google Scholar]
- Embleton, T.W.; Jones, W.W. Avocado nutrition in California. In Proceedings of the Florida State Horticultural Society, Miami, FL, USA, 3–6 November 1964; Volume 77, pp. 400–407. [Google Scholar]
- Field, C.; Barros, V.; Intergovernmental Panel on Climate Change (Eds.) Climate Change 2014: Impacts, Adaptation, and Vulnerability; Working Group II Contribution to the Fifth Assessment Report of the Intergovernmental Panel on Climate Change; Cambridge University Press: Cambridge, UK, 2014; pp. 1–9. [Google Scholar]
- Wing, I.S.; De Cian, E.; Mistry, M.N. Global vulnerability of crop yields to climate change. J. Environ. Econ. Manag. 2021, 109, 102462. [Google Scholar] [CrossRef]
- Elbasiouny, H.; El-Ramady, H.; Elbehiry, F.; Rajput, V.D.; Minkina, T.; Mandzhieva, S. Plant nutrition under climate change and soil carbon sequestration. Sustainability 2022, 14, 914. [Google Scholar] [CrossRef]
- Shahzad, Z.; Rouached, H. Protecting plant nutrition from the effects of climate change. Curr. Biol. 2022, 32, R725–R727. [Google Scholar] [CrossRef]
- Wang, J.; Li, L.; Lam, S.K.; Shi, X.; Pan, G. Changes in plant nutrient status following combined elevated [CO2] and canopy warming in winter wheat. Front. Plant Sci. 2023, 14, 1132414. [Google Scholar] [CrossRef]
- Beaufils, E.R. Diagnosis and recommendation integrated system (DRIS). Soil Sci. Bull. 1973, 1, 132. [Google Scholar]
- Parent, L.E.; Dafir, M. A theoretical concept of compositional nutrient diagnosis. J. Am. Soc. Hortic. Sci. 1992, 117, 239–242. [Google Scholar] [CrossRef]
- Krug, A.V.; Marques, A.L.L.; Marques, A.C.R.; Stefanello, L.O.; Oliveira, F.N.; Berghetti, A.L.P.; Moura-Bueno, J.M. Proposition of critical levels of nutrients in citrus leaves, grown in a subtropical climate, for fresh market fruit production. Sci. Hortic. 2023, 317, 112047. [Google Scholar] [CrossRef]
- Morais, T.C.B.; Prado, R.M.; Traspadini, E.I.F.; Wadt, P.G.S.; Paula, R.C.; Rocha, A.M.S. Efficiency of the CL, DRIS and CND methods in assessing the nutritional status of Eucalyptus spp. rooted cuttings. Forests 2019, 10, 786. [Google Scholar] [CrossRef]
- Oliveira, C.T.; Rozane, D.E.; Deus, J.A.L.; Lima, J.D.; Lopes, M.D.C.; Souza, W.J.O. Establishment of DRIS standards and sufficiency range for ‘Nanica’ banana trees in Vale do Ribeira. Acta Sci. Agron. 2024, 46, e67171. [Google Scholar] [CrossRef]
- Serviço Geológico do Brasil. Programa Nacional de Solos do Brasil (PronaSolos). Available online: https://geoportal.sgb.gov.br/pronasolos/ (accessed on 16 December 2024).
- Alvares, C.A.; Stape, J.L.; Sentelhas, P.C.; Gonçalves, J.L.M.; Sparovek, G. Köppen’s climate classification map for Brazil. Meteorol. Z 2013, 22, 711–728. [Google Scholar] [CrossRef]
- Koen, T.J.; Plessis, S.F. Optimal leaf analysis norms for avocado (cv. Furter). In Proceedings of the Second World Avocado Congress, Orange, Australia, 21–26 April 1991; pp. 289–299. [Google Scholar]
- da Silva, F.C. Manual de Análises Químicas de Solos, Plantas e Fertilizantes, 2nd ed.; Embrapa Informação Tecnológica: Brasília, Brazil, 2009; p. 627. [Google Scholar]
- Hair, J.J.F.; Black, W.C.; Babin, B.J.; Tatham, R.L. Multivariate Data Analysis, 6th ed.; Grupo A-Bookman: Porto Alegre, Brazil, 2009; p. 688. [Google Scholar]
- Santos, E.M.H.; Rozane, D.E. DRIS standard and normal ranges of foliar nutrients for the culture of ‘Thompson’ atemoya. Cienc. Rural 2017, 47, e20160613. [Google Scholar] [CrossRef]
- Beverly, R.B. Modified DRIS method for simplified nutrient diagnosis of ‘Valencia’ orange. J. Plant Nutr. 1987, 10, 1401–1408. [Google Scholar] [CrossRef]
- Jones, C.A. Proposed modifications of the diagnosis and recommendation integrated system (DRIS) for interpreting plant analyses. Commun. Soil Sci. Plant Anal. 1981, 12, 785–794. [Google Scholar] [CrossRef]
- Souza, H.A.; Rozane, D.E.; Amorim, D.A.; Dias, M.J.T.; Modesto, V.C.; Natale, W. Assessment of nutritional status of guava seedlings using preliminary DRIS norms and sufficiency ranges. J. Plant Nutr. 2015, 38, 1611–1618. [Google Scholar] [CrossRef]
- Oliveira, C.T.; Rozane, D.E.; Amorim, D.A.; Souza, H.A.; Fernandes, B.S.; Natale, W. Diagnosis of the nutritional status of ‘Paluma’ guava trees using leaf and flower analysis. Rev. Bras. Frutic. 2020, 42, e-132. [Google Scholar] [CrossRef]
- Parent, L.E.; Natale, W.; Ziadi, N. Compositional nutrient diagnosis of corn using the Mahalanobis distance as nutrient imbalance index. Can. J. Soil Sci. 2009, 89, 383–390. [Google Scholar] [CrossRef]
- Khiari, L.; Parent, L.E.; Tremblay, N. Selecting the high-yield subpopulation for diagnosing nutrient imbalance in crops. Agron. J. 2001, 93, 802–808. [Google Scholar] [CrossRef]
- R Core Team. R: A Language and Environment for Statistical Computing, Version 4.3.3.; R Foundation for Statistical Computing: Vienna, Austria, 2024; Available online: https://www.R-project.org/ (accessed on 22 June 2024).
- Crowley, D.; Campisi, S.; Escalera, J.; Lovatt, C.J.; Rolshausen, P.; Arpaia, M.L. Decision support tools for avocado fertilization & salinity management: Preview to the final project report. In From the Grove: Fall 2015 Bulletin; California Avocado Commission: Irvine, CA, USA, 2015; pp. 25–28. [Google Scholar]
- Gaillard, J.-P. Nutrition—Fertilisation de l’avocatier. In L’avocatier: Sa Culture, Ses Produits; G.-P. Maisonneuve & Larose: Paris, France, 1987; pp. 216–237. [Google Scholar]
- Srivastava, A.K.; Malhotra, S.K. Nutrient use efficiency in perennial fruit crops—A review. J. Plant Nutr. 2017, 40, 1928–1953. [Google Scholar] [CrossRef]
- Guan, D.-X.; Menezes-Blackburn, D.; Li, G. The importance of mineral elements for sustainable crop production. Agronomy 2024, 14, 209. [Google Scholar] [CrossRef]
- Brdar-Jokanović, M. Boron toxicity and deficiency in agricultural plants. Int. J. Mol. Sci. 2020, 21, 1424. [Google Scholar] [CrossRef]
- Kumar, S.; Kumar, S.; Mohapatra, T. Interaction between macro- and micro-nutrients in plants. Front. Plant Sci. 2021, 12, 665583. [Google Scholar] [CrossRef]
- Ayres, G.; Brunetto, G.; Simões, F.; Rozane, D.E.; Moura-Bueno, J.M.; Berghetti, A.L.P.; Dotto, L.; Oliveira, F.N.; Marques, A.C.R.; Stefanello, L.O.; et al. Proposition of critical levels and nutrient sufficiency ranges in leaves of ‘White Moscato’ (Vitis vinifera ‘Muscat’) and ‘Bordeaux’ (Vitis labrusca ‘Ives’). Vitis 2023, 62, 125–135. [Google Scholar] [CrossRef]
- Zhao, N.; Yu, G.; He, N.; Wang, Q.; Guo, D.; Zhang, X.; Wang, R.; Xu, Z.; Jiao, C.; Li, N.; et al. Coordinated pattern of multi-element variability in leaves and roots across Chinese forest biomes. Glob. Ecol. Biogeogr. 2016, 25, 359–367. [Google Scholar] [CrossRef]
- Han, W.X.; Fang, J.Y.; Reich, P.B.; Woodward, F.I.; Wang, Z.H. Biogeography and variability of eleven mineral elements in plant leaves across gradients of climate, soil and plant functional type in China. Ecol. Lett. 2011, 14, 788–796. [Google Scholar] [CrossRef]
- Lima-Neto, A.J.; Natale, W.; Rozane, D.E.; Lima de Deus, J.A.; Rodrigues Filho, V.A. Establishment of DRIS and CND standards for fertigated ‘Prata’ banana in the Northeast, Brazil. J. Soil Sci. Plant Nutr. 2022, 22, 765–777. [Google Scholar] [CrossRef]
- Amorim, D.A.; Favero, A.C.; Conceição, M.P.; Rodrigues, M.G.V.; Rodrigues, J.B.B.; Natale, W.; Rozane, D.E. DRIS nutritional norms and sufficiency range for the Pérola pineapple cultivation. J. Plant Nutr. 2024, 47, 3998–4007. [Google Scholar] [CrossRef]
- Sedgley, M. The effect of temperature on floral behaviour, pollen tube growth and fruit set in the avocado. J. Hort. Sci. 1977, 52, 135–141. [Google Scholar] [CrossRef]
- Guest, D.; Grant, B. The complex action of phosphonates as antifungal agents. Biol. Rev. 1991, 66, 159–187. [Google Scholar] [CrossRef]
- Bonomelli, C.; Celis, V.; Lombardi, G.; Mártiz, J. Salt stress effects on avocado (Persea americana Mill.) plants with and without seaweed extract (Ascophyllum nodosum) application. Agronomy 2018, 8, 64. [Google Scholar] [CrossRef]
- Arioli, T.; Villalta, O.N.; Hepworth, G.; Farnsworth, B.; Mattner, S.W. Effect of seaweed extract on avocado root growth, yield and post-harvest quality in far north Queensland, Australia. J. Appl. Phycol. 2024, 36, 745–755. [Google Scholar] [CrossRef]
- Meena, R.; Senthilkumar, S.; Manivannan, S. Senile orchard management system in tropical fruit production. Int. J. Agric. Environ. Biotechnol. 2022, 15, 861–866. [Google Scholar] [CrossRef]
- Cano-Gallego, L.E.; Bedoya-Ramírez, S.I.; Bernal-Estrada, J.A.; Barrera-Sánchez, C.F.; Córdoba-Gaona, O.d.J. Yield and fruit quality of avocado grown at different planting densities in Colombia. Pesqui. Agropecu. Bras. 2023, 58, e03146. [Google Scholar] [CrossRef]
- Nachtigall, G.R.; Dechen, A.R. DRIS norms for evaluating the nutritional state of apple tree. Sci. Agric. 2007, 64, 282–287. [Google Scholar] [CrossRef]
- Maldonado-Torres, R.; Álvarez-Sánchez, M.E.; Almaguer-Vargas, G.; Barrientos-Priego, A.F.; García-Mateos, R. Estándares nutrimentales para aguacatero ‘Hass’. Rev. Chapingo Ser. Hortic. 2007, 13, 103–108. [Google Scholar] [CrossRef]
- Rebolledo-Roa, A.; Burbano-Diaz, R.A. Nutrient balance in Hass avocado trees as a tool to optimize crop fertilization management. Agronomy 2023, 13, 1956. [Google Scholar] [CrossRef]
- Ferreira, E.; Medeiros, F.C.; Rozane, D.E.; Lindsey, L.; Amadori, C.; Rocha, C.S. Assessment of nutritional status of soybean by the DRIS method in western Bahia State. Rev. Bras. Cienc. Solo 2024, 48, e0230099. [Google Scholar] [CrossRef]
- Davee, D.E.; Righetti, T.L.; Fallahi, E.; Robbins, S. An evaluation of the DRIS approach for identifying mineral limitations on yield in ‘Napoleon’ sweet cherry. J. Am. Soc. Hortic. Sci. 1986, 111, 988–993. [Google Scholar] [CrossRef]
- Fallahi, E.; Righetti, T.L. Use of Diagnosis and Recommendation Integrated System (DRIS) in apple. HortScience 1984, 19, 592. [Google Scholar]
- Taniguchi, C.A.K.; Rozane, D.E.; Serrano, L.A.L.; Artur, A.G.; Natale, W. DRIS norms for nutritional diagnosis of dwarf cashew. J. Plant Nutr. 2025, 48, 1–10. [Google Scholar] [CrossRef]
- Tullio, L.; Rozane, D.E. DRIS norms for ‘Keitt’ mango in the Brazilian semiarid region: Diagnosis and validation. Rev. Bras. Frutic. 2022, 44, e-117. [Google Scholar] [CrossRef]
- Walworth, J.L.; Sumner, M.E. The Diagnosis and Recommendation Integrated System (DRIS). In Advances in Soil Science; Stewart, B.A., Ed.; Springer: New York, NY, USA, 1987; Volume 6, pp. 149–188. [Google Scholar] [CrossRef]
- Parent, S.-É.; Parent, L.E.; Rozane, D.E.; Natale, W. Plant ionome diagnosis using sound balances: Case study with mango (Mangifera indica). Front. Plant Sci. 2013, 4, 449. [Google Scholar] [CrossRef]
- Zhou, Q.; Melgar, J.C. Tree age influences nutrient partitioning among annually removed aboveground organs of peach. HortScience 2020, 55, 560–564. [Google Scholar] [CrossRef]
- Rozane, D.E.; Toselli, M.; Brunetto, G.; Baldi, E.; Natale, W.; Paula, B.V.d.; Lima, J.D.; Medeiros, F.C.; Ayres, G.; Gobi, S.F. Proposal of nutritional standards for the assessment of the nutritional status of grapevines in subtropical and temperate regions. Plants 2025, 14, 698. [Google Scholar] [CrossRef]
- Spann, T.; Lovatt, C.J. Optimum leaf nutrient concentration ranges for the ‘Hass’ avocado in California. In From the Grove: Summer 2020 Bulletin; California Avocado Commission: Irvine, CA, USA, 2020; pp. 40–41. [Google Scholar]
- Trapp, T.; Moura-Bueno, J.M.; de Siqueira, G.N.; Hahn, L.; Rozane, D.E.; Lima Neto, A.J.; Natale, W.; Loss, A.; Brunetto, G. Nutrients’ critical level propositions and sufficiency ranges aimed at high apple yield under subtropical climate. Eur. J. Agron. 2025, 164, 127523. [Google Scholar] [CrossRef]
- Fang, Z.; Han, X.; Xie, M.; Jiao, F. Spatial distribution patterns and driving factors of plant biomass and leaf N, P stoichiometry on the Loess Plateau of China. Plants 2021, 10, 2420. [Google Scholar] [CrossRef] [PubMed]
- Hofhansl, F.; Chacón-Madrigal, E.; Brännström, Å.; Dieckmann, U.; Franklin, O. Mechanisms driving plant functional trait variation in a tropical forest. Ecol. Evol. 2021, 11, 3856–3870. [Google Scholar] [CrossRef] [PubMed]
- Li, J.; Prentice, I.C. Global patterns of plant functional traits and their relationships to climate. Commun. Biol. 2024, 7, 1136. [Google Scholar] [CrossRef] [PubMed]
- Veldhuis, M.P.; Hulshof, A.; Fokkema, W.; Berg, M.P.; Olff, H. Understanding nutrient dynamics in an African savanna: Local biotic interactions outweigh a major regional rainfall gradient. J. Ecol. 2016, 104, 913–923. [Google Scholar] [CrossRef]
- Oldroyd, G.E.D.; Leyser, O. A plant’s diet: Surviving in a variable nutrient environment. Science 2020, 368, eaba0196. [Google Scholar] [CrossRef] [PubMed]
- Muller, C.T.; Cera, A.; Palacio, S.; Moore, M.J.; Tejero, P.; Mota, J.F.; Drenovsky, R.E. Nutritional convergence in plants growing on gypsum soils in two distinct climatic regions. Ann. Bot. 2024, 134, 1003–1012. [Google Scholar] [CrossRef]
- Rozane, D.E.; Natale, W.; Parent, L.E.; dos Santos, E.M.H. The CND-Goiaba 1.0 software for nutritional diagnosis of guava (Psidium guajava L.) ‘Paluma’, in Brazil. Acta Hortic. 2012, 959, 161–166. [Google Scholar] [CrossRef]


Disclaimer/Publisher’s Note: The statements, opinions and data contained in all publications are solely those of the individual author(s) and contributor(s) and not of MDPI and/or the editor(s). MDPI and/or the editor(s) disclaim responsibility for any injury to people or property resulting from any ideas, methods, instructions or products referred to in the content. |
© 2025 by the authors. Licensee MDPI, Basel, Switzerland. This article is an open access article distributed under the terms and conditions of the Creative Commons Attribution (CC BY) license (https://creativecommons.org/licenses/by/4.0/).