Article

Genome-Wide Analysis of the ATGs Family in Watermelon and the Involvement of ATG8s in Graft Union Formation

1
College of Agriculture and Biology, Liaocheng University, Liaocheng 252000, China
2
Engineering Laboratory of Genetic Improvement of Horticultural Crops of Shandong Province, College of Horticulture, Qingdao Agricultural University, Qindao 266000, China
3
College of Horticulture Science, Zhejiang A&F University, Hangzhou 311300, China
4
State Key Laboratory of Vegetable Biobreeding, Institute of Vegetables and Flowers, Chinese Academy of Agricultural Sciences, Beijing 100081, China
*
Authors to whom correspondence should be addressed.
These authors contributed equally to this work.
Horticulturae 2025, 11(6), 619; https://doi.org/10.3390/horticulturae11060619
Submission received: 2 April 2025 / Revised: 15 May 2025 / Accepted: 26 May 2025 / Published: 1 June 2025
(This article belongs to the Section Genetics, Genomics, Breeding, and Biotechnology (G2B2))

Abstract

Autophagy, an evolutionarily conserved process for cellular component degradation and recycling, occurs in yeasts, animals, and plants under both stress and normal conditions. However, the functions of autophagy-related genes (ATGs) in watermelon (Citrullus lanatus) remain uncharacterized. In this study, a phylogenetic analysis identified 27 ATGs belonging to 16 subfamilies in the watermelon genome. A promoter analysis revealed that all the ClaATGs contain multiple photo-responsive elements. Tissue-specific expression profiling showed diverse expression patterns of ClaATGs across different tissues, except for the constitutively expressed ClaATG6. Exogenous independent treatments with glucose, naphthalene acetic acid, and 6-benzylaminopurine induced the expression of most ClaATGs, particularly members of the ClaATG8 subfamily, in the graft unions of normal and etiolated seedlings. A sugar application significantly increased autophagosome numbers during the early stages of graft interface healing, accompanied by the upregulation of ClaATG6, ClaATG8b, ClaATG8i, and ClaTOR, as well as the downregulation of ClaSnRK1. These findings elucidate the roles of ATGs in watermelon graft union formation and provide novel insights into the complex functions of autophagy in plant development and stress responses.

1. Introduction

Autophagy, a pivotal cellular mechanism, is indispensable for the recycling of impaired cellular entities within the lysosomal or vacuolar compartments [1]. This process is instrumental in preserving cellular homeostasis and endowing cells with the capacity to adapt to diverse stressors. In the botanical realm, autophagic activity is stringently modulated, maintaining a minimal basal level during periods of optimal growth. Nevertheless, upon exposure to developmental transitions and environmental challenges, such as germination, senescence, and biotic and abiotic stresses, it undergoes rapid activation, underscoring its significance in plant physiological adaptation [2]. From a mechanistic perspective, autophagy can be categorized into non-selective and selective forms. Non-selective autophagy, which is predominantly elicited during nutrient scarcity, encompasses the bulk degradation of cytoplasmic contents, thereby facilitating the recycling of essential nutrients and metabolites. By contrast, selective autophagy represents a highly specialized and targeted process, specifically engineered to sequester and eliminate damaged proteins, malfunctioning organelles, and other specific cellular components. This sophisticated regulatory framework ensures that autophagy can be precisely calibrated to accommodate the ever-changing physiological requirements of plant cells across varying developmental stages and environmental conditions, thereby highlighting its integral role in plant survival, growth, and development [3].
Autophagosomes, double-membraned vesicles, encapsulate superfluous and potentially hazardous cellular ‘cargo’ that is subsequently degraded by lytic enzymes upon transfer to the vacuole [2]. This process is meticulously regulated by Autophagy-related genes (ATGs) and their interacting partners. Genome-wide analyses of ATGs have been conducted in numerous plant species, with Arabidopsis thaliana serving as a prime model. Typically, ATG knockouts in plants impair viability and diminish stress resistance, whereas overexpression often confers enhanced adaptive responses. In Arabidopsis, nine ATG8 isoforms have been identified that play critical roles in abiotic stress and starvation responses [4,5]. The tissue-specific expression patterns of ATG8 homologues under nitrogen starvation suggest functional divergence among these proteins [6]. For instance, ATG8f overexpression reduces shoot anthocyanin accumulation and participates in cytokinin-mediated root–shoot signaling [4]. The heterologous expression of GmATG8c enhances nitrogen deficiency tolerance and increases yields in Arabidopsis [7]. Additionally, OxATG5 and OxATG7 boost tolerance to necrotrophic pathogens and oxidative stress by promoting ATG8 lipidation and autophagosome biogenesis, thereby enhancing growth and extending lifespans [8]. In other species, PagATG18a interacts with LHCB1 and APX2 to modulate photosynthesis and antioxidant defense under salt stress, and its overexpression significantly improves poplar salt tolerance [9]. In N. benthamiana, MaATG8s transiently expressed in Nicotiana benthamiana activate autophagy, and MaATG8-mediated hypersensitive response-like cell death is autophagy-dependent and regulated by salicylic, jasmonic, and ethylene pathways during Fusarium wilt resistance [10]. Collectively, autophagy’s pivotal role in plant stress tolerance is well-established, yet the functions of ATG-like genes in non-model crops remain largely unexplored and warrant further investigation.
Wounding commonly triggers autophagy, enabling cells adjacent to the damaged tissue to re-enter the cell cycle, replace necrotic cells, and recycle damaged cellular components in both plants and animals. In turn, autophagy is essential for efficient wound healing [11]. It plays a pivotal role in converting chronic wounds into acute ones, thus facilitating rapid skin repair and regeneration [12]. Graft union healing is a complex physiological process involving wound responses and communication between scion and rootstock. It includes necrotic layer formation, callus development, and vascular tissue differentiation [13]. In A. thaliana seedling micrografting, ATG8 is highly expressed in the cambial region of the graft union. Both Atatg2 mutant/wild-type (WT) homografts and NbATG5-knockout/At heterografts show reduced graft success rates. Additionally, more microautophagy granules are detected at 14 days after grafting (DAG) in heterografts, compared with their absence at 7 DAG in At self-grafts, indicating a prolonged autophagy response in less compatible heterografts [14]. The TOR kinase, as a key energy sensor, is inhibited under nutrient and sugar deficiencies, thereby activating autophagy. In Arabidopsis, the chemical inhibition of TOR activity or disruption of RAPTOR induces constitutive autophagy [15,16]. The TOR inhibitor AZD-8055 delays vascular connection at the graft union due to reduced energy charge, whereas exogenous glucose treatments after AZD-8055 exposure promote xylem reconnection and the growth of grafted cucumbers. This suggests the involvement of sugars and ATGs in the formation of heterografted cucumber–pumpkin unions [17]. Further studies to elucidate autophagy-related mechanisms in wounding and grafting [18], which would advance our understanding of autophagy’s biological functions in plants, are warranted.
Watermelon (Citrullus lanatus), belonging to the cucurbit family, is frequently grafted onto pumpkin rootstocks to improve fruit quality, increase yield, and enhance resistance to abiotic and biotic stresses during cultivation. Despite the widespread use of grafting in watermelon production, no systematic analysis of ATGs in watermelon has been reported, and the role of autophagy in graft union formation remains poorly understood. In this study, ClaATGs were identified, and a comprehensive analysis of their phylogenetic relationships, gene structures, and evolutionary history was conducted. Using RT-PCR, the expression patterns of ClaATGs were investigated across different tissues, and their responses to sugars, naphthalene acetic acid (NAA), and 6-benzylaminopurine (6-BA) during wounding and graft union formation were determined. Additionally, the function of autophagy in the process of graft union formation in watermelon was explored. The results offer novel insights into the characteristics and functions of ATGs in watermelon, thereby contributing to a better understanding of autophagy in this important horticultural crop.

2. Materials and Methods

2.1. The Plant Materials and Stress Treatments

The plant nursery and management were conducted in the climate rooms of the College of Horticultural Science, Zhejiang Agriculture and Forestry University, and the College of Agriculture and Biology, Liaocheng University. The experimental plant materials comprised the watermelon (Citrullus lanatus) cultivar “Yuefan” and the pumpkin (Cucurbita moschata Duch.) cultivar “Juejinglong”. Seeds of both species were meticulously selected, enveloped in sterile gauze, and immersed in 55 °C warm water for 5 h. Pumpkin seeds were sown three days after watermelon seeds. Subsequently, the seeds were transferred onto moist filter paper in Petri dishes and incubated in darkness at 28 °C for 24 h (watermelon) and 36 h (pumpkin). Uniformly germinated seeds were selected and sown in 50-well cavity trays filled with a culture medium (grass charcoal:vermiculite = 2:1). The trays were placed in an artificial climate chamber with the following conditions: a 12-h light/12-h dark photoperiod, 50,000 Lux light intensity, a daytime temperature of 28 ± 1 °C, a nighttime temperature of 18 ± 1 °C, and relative air humidity of 65–85%.
Grafting was performed when the scion cotyledons were fully expanded and the rootstock cotyledons were just emerging, ensuring comparable hypocotyl diameters between the two. Splice grafting was employed to unite the scion onto the rootstock, and the grafted watermelon plants were cultured under previously described conditions [17]. Graft union tissues were harvested at 0, 1, 3, and 5 days after grafting (DAG) (Figure S1). All samples were immediately snap-frozen in liquid nitrogen and stored at −80 °C. Each experimental treatment consisted of three biological replicates. Furthermore, to test the effect of sugars and plant hormones on grafting, the cotyledons of ungrafted and grafted watermelon were sprayed with a solution containing 0.5% glucose, 5 μM NAA, and 0.1 μM 6-BA before grafting, and samples were collected 1 DAG using the same sampling protocol (Figure S1); 10–12 plant replicates were performed for every treatment. For etiolated seedlings, watermelon seedlings were exposed to continuous darkness for 5 days prior to grafting, with other environmental parameters held constant. Homologous grafting was conducted using normal watermelon plants, and 0.5% glucose was externally applied on 0, 1, 3, and 5 DAG, with sampling restricted to the scion portion.

2.2. Identification of ClaATGs Gene Family Members

To identify homologous sequences of watermelon ATGs, the BLASTP program from the Watermelon Protein Sequence Collection (WPSC) website (http://cucurbitgenomics.org/blast, accessed on 3 February 2024) was employed. The search was conducted based on the reported nucleic acid sequences of Arabidopsis thaliana, Oryza sativa, and Cucumis sativus. Potential watermelon ATG sequences were retrieved by querying the Watermelon Information Archive database (http://cucurbitgenomics.org/blast, accessed on 3 February 2024) using the keywords “autophagy” or “ATG”. Additionally, the same keywords were used to search the watermelon information archive database (http://cucurbitgenomics.org/search/genome/21, accessed on 3 February 2024). Subsequently, the obtained sequences underwent protein structure prediction using tools including INTER-PRO (https://www.ebi.ac.uk/interpro/, accessed on 3 February 2024), SMART (http://smart.embl-heidelberg.de, accessed on 3 February 2024), NCBI-CDD (https://www.ncbi.nlm.nih.gov/cdd/, accessed on 3 February 2024), and CDD. This process was aimed at screening out false-positive sequences and identifying candidate members of the watermelon ATG gene family.

2.3. Analysis of Protein Physicochemical Properties of ClaATGs Gene Family Members

Open reading frames and amino acid lengths were determined using the ORF finder web tool (https://www.ncbi.nlm.nih.gov/orffinder/, accessed on 5 February 2024). Molecular weights, theoretical isoelectric points (pI), instability indices, and aliphatic indices were calculated via the ProtParam tool (https://web.expasy.org/protparam/, accessed on 5 February 2024). Signal peptide and transmembrane region predictions were conducted using SignalP-5.0 (https://services.healthtech.dtu.dk/services/SignalP-5.0/, accessed on 6 February 2024) and TMHMM-2.0 (https://services.healthtech.dtu.dk/services/TMHMM-2.0/, accessed on 6 February 2024), respectively. Subcellular localization of the ClaATG genes was predicted using WOLFPSORT (https://wolfpsort.hgc.jp/, accessed on 6 February 2024) and IPSORT (https://ipsort.hgc.jp/, accessed on 6 February 2024).

2.4. Amino Acid Sequence Comparison and Phylogenetic Tree Construction of ClaATGs Family Members

The amino acid sequences of ClaATG, OsATG, and AtATG family members were aligned using the MUSCLE algorithm implemented in MEGA11 software (Version 11). Phylogenetic trees were constructed via the maximum likelihood method with 1000 bootstrap replicates to assess branch support. The generated evolutionary trees were then visualized and refined using the iTOL online platform (https://itol.embl.de, accessed on 10 February 2024).

2.5. Gene Structure, Protein Structural Domain Distribution, and Protein Interaction Network Construction of ClaATGs Family Members

The exon-intron structures of ClaATGs were visualized by comparing their coding sequences (CDSs) with corresponding genomic sequences using the GSDS 2.0 software (http://gsds.cbi.pku.edu.cn/, accessed on 12 February 2024). The protein structures of ClaATGs were characterized via the SMART online tool. Sequences and names of ClaATG family proteins were submitted to STRING (https://string-db.org, accessed on 12 February 2024) for analysis. The generated string-interaction-short file was downloaded and processed with Cytoscape v3.10.1 software to construct and analyze protein-interaction networks.

2.6. Cis-Acting Element Analysis of ClaATGs Family Members

The first 2000 base pairs of non-coding sequences upstream of ClaATGs genes were retrieved from the watermelon genebank using TBtools (Version 2). These 2000-bp sequences of each gene were then analyzed with PlantCARE (http://bioinformatics.psb.ugent.be/webtools/plantcare/html/, accessed on 12 February 2024). The 2000-bp upstream non-coding region sequences were employed to predict cis-acting elements involved in responses to photosynthesis, stress, and hormones.

2.7. Total RNA Extraction, Reverse Transcription and qRT-PCR Analysis

Total RNA was extracted using TaKaRa’s (Dalian, China) RNAiso Plus reagent, and cDNA synthesis was performed via reverse transcription with Vazyme’s All-in-one RT SuperMix Perfect for qPCR kit. Quantitative real-time PCR (qRT-PCR) was carried out according to the protocol of the Taq Pro Universal SYBR qPCR Master Mix kit (Vazyme) (Nanjing, China) to determine the relative gene expression levels. The qRT-PCR reaction had a total volume of 20 μL, consisting of 2 μL of cDNA, 10 μL of 2× Taq Pro Universal SYBR qPCR Master Mix, 0.4 μL each of forward and reverse primers, and 7.2 μL of ultrapure water. The thermal cycling conditions were pre-denaturation at 95 °C for 30 s, followed by 40 cycles of 95 °C for 10 s and 60 °C for 30 s, and a final melting curve analysis with 95 °C for 15 s, 60 °C for 60 s, and 95 °C for 15 s. Each sample was analyzed in triplicate. Relative gene expression was calculated using the 2−∆∆CT method and normalized to the expression level of the reference gene ClaACT [19].

2.8. Measurement of Plant Physiological Parameters

The physiological measurements were performed on ten grafted plants from each treatment 10 days after grafting. The dry and fresh weights were measured using an OHAUS micrometer precision balance (Shanghai, China). Additionally, the chlorophyll content in watermelon cotyledons was quantified with a SPAD-502PLUS handheld chlorophyll meter (Beijing, China). The survival rate of grafted seedlings was documented for each experimental treatment.

2.9. MDC Staining

Dansylcadaverine (MDC), a fluorescent stain with eosinophilic properties, was employed to detect autophagosome formation. True leaves of grafted seedlings from different treatments were excised at 0, 12, 24, and 72 h post-grafting. Thin strips (approximately 2 × 4 mm) were carefully prepared, avoiding major leaf veins. Samples were immersed in a 100 μM MDC solution (Sigma-Aldrich, 30,432) (Shanghai, China), vacuum-infiltrated, and incubated for 30 min. Following incubation, samples were washed three times with 1× PBS buffer (Solarbio, P1020) (Beijing, China) and visualized using a confocal microscope (Zeiss, Oberkochen, Germany). Detailed protocols were adapted from [20].

2.10. Observation of Grafting Interface Healing

At 3 and 5 days post-grafting, the interface sections of watermelon grafted seedlings were excised with a razor blade and then transversely sliced into 0.3-mm-thick sections. These sections were stained with 0.01% saffron for 30 min, followed by three rinses with water. Prepared samples were mounted on slides, sealed with coverslips and water, and observed under an Olympus optical microscope (Tokyo, Japan). Representative images were captured. Each experimental treatment was replicated three times at each time point.

2.11. Data Analysis

Data analysis using EXCEL(Version 2019) and heatmap creation using TBtools (Version 2).

3. Results

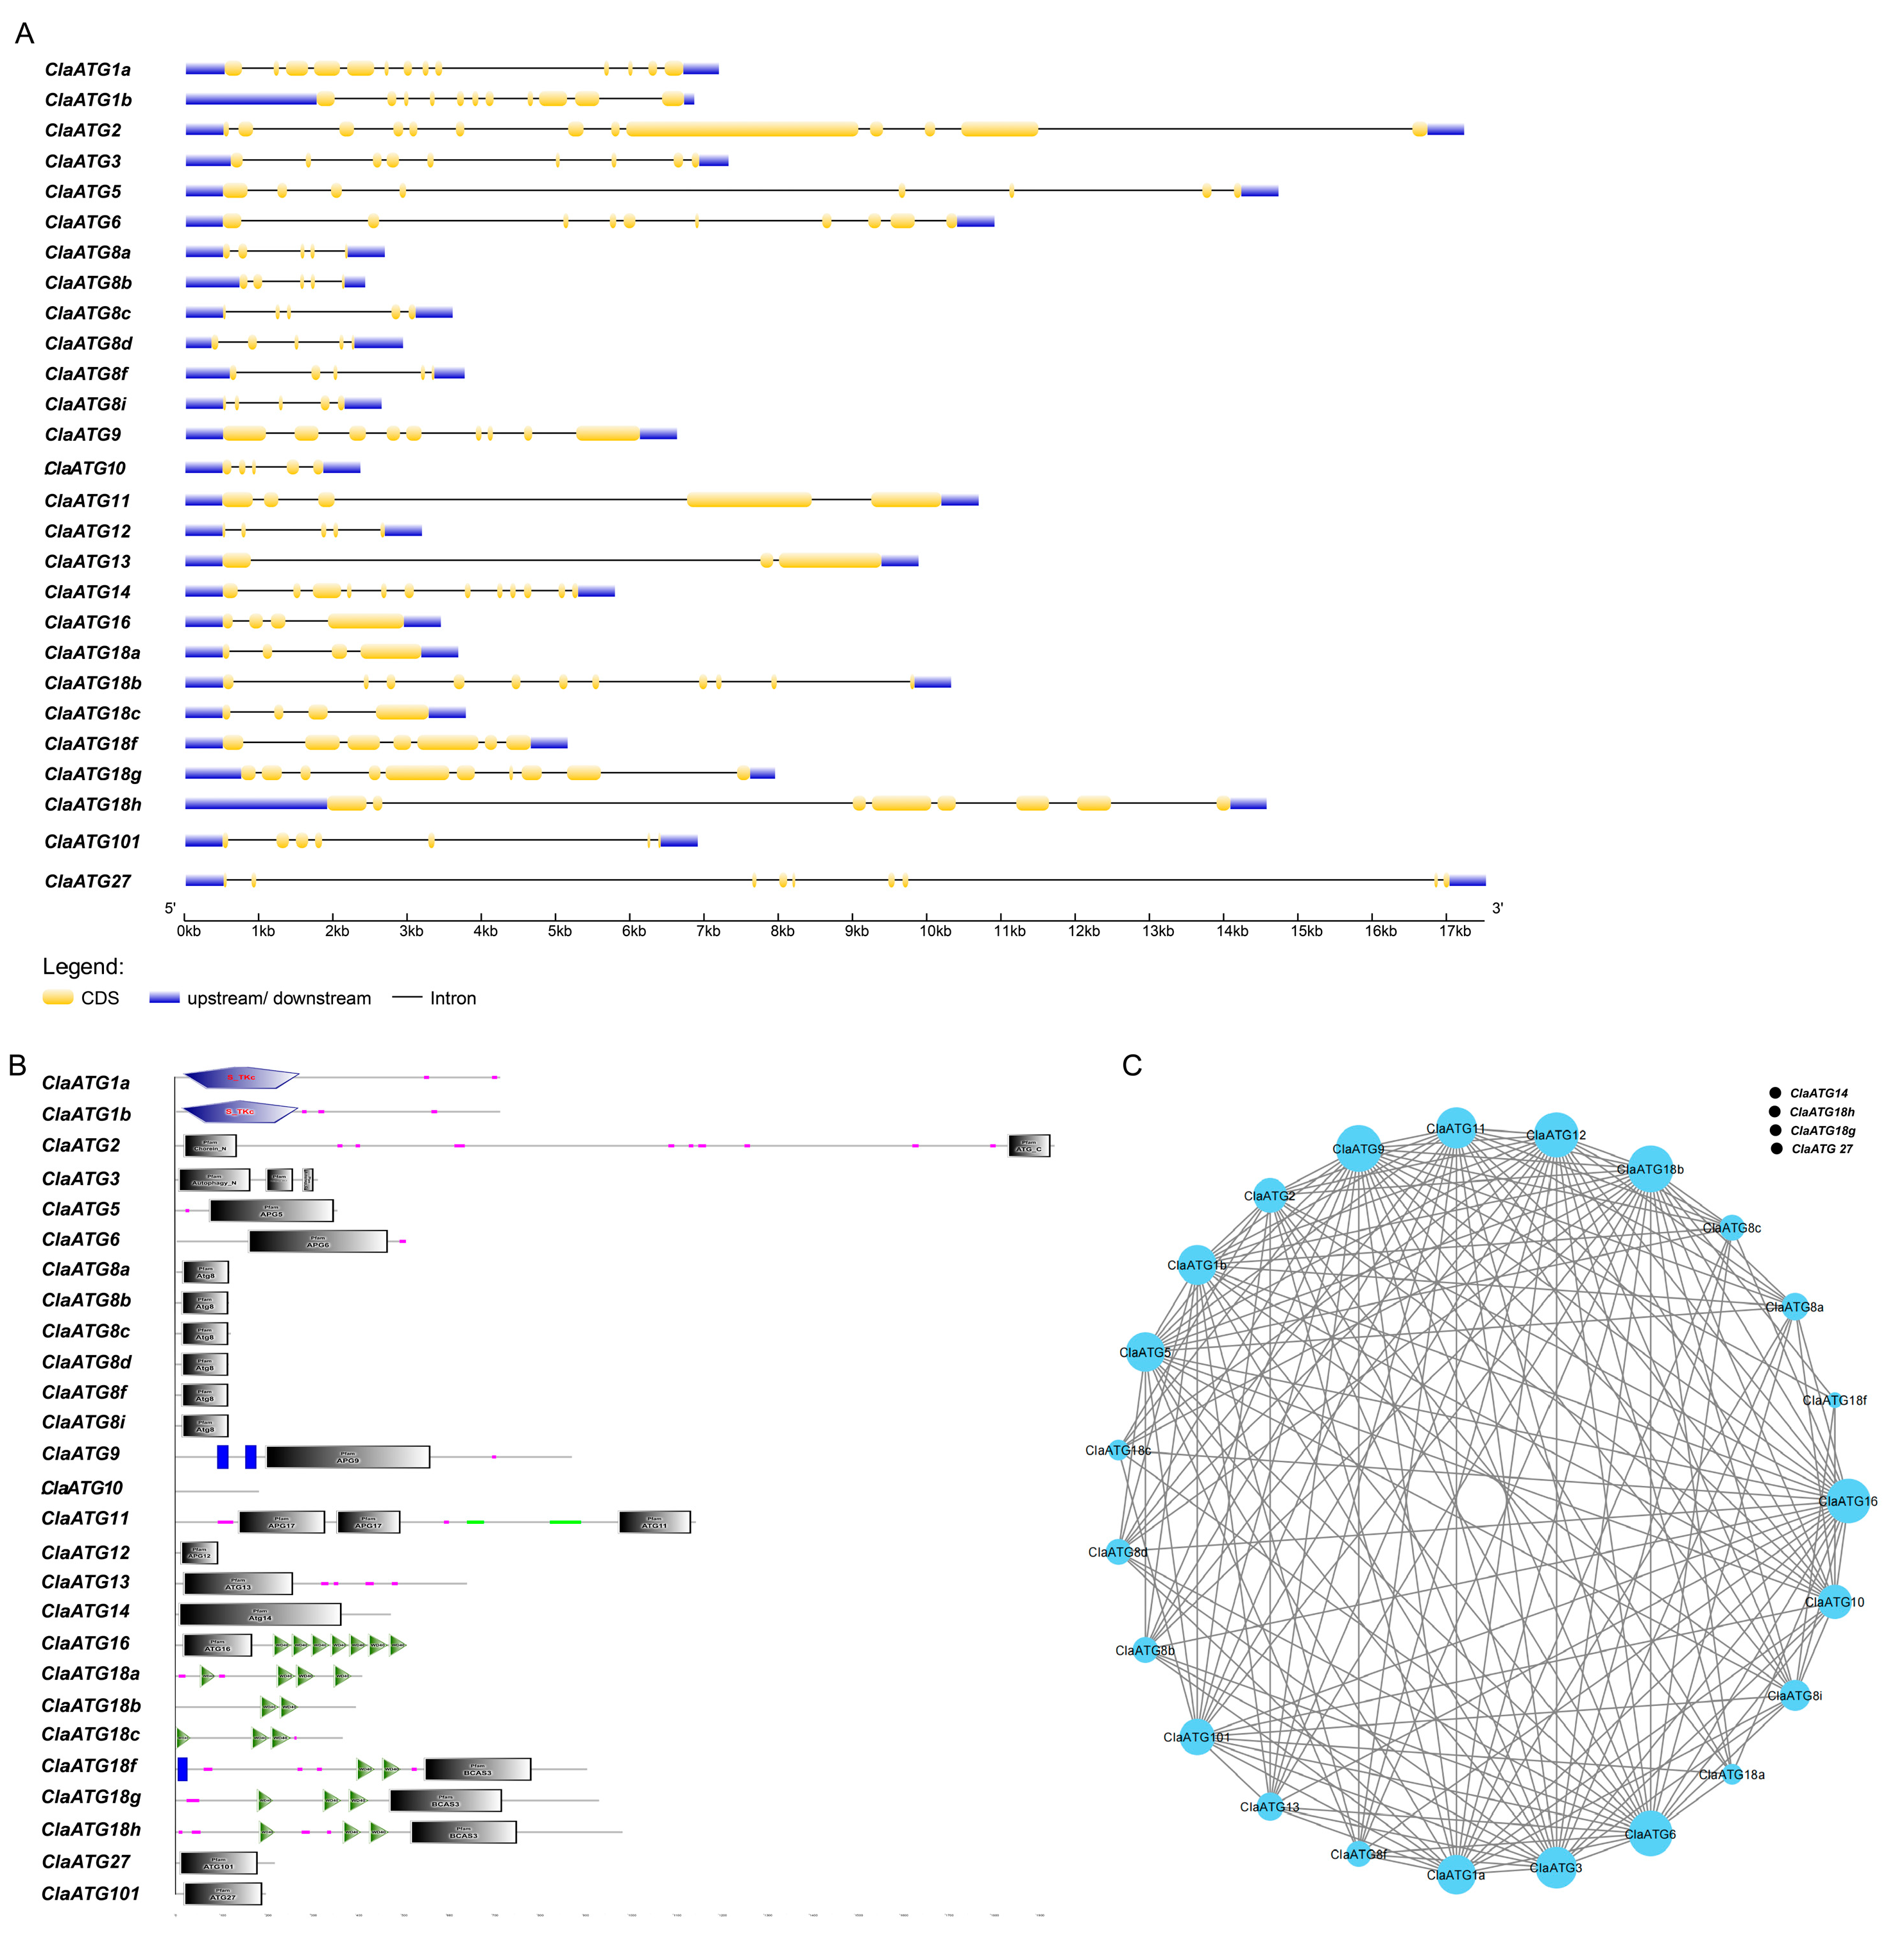
3.1. Bioinformatics Analysis of 27 ClaATGs in the Watermelon Genome

Using Arabidopsis ATG proteins as query sequences, 27 putative ATGs in the watermelon genome were identified (Table 1). Among them, two, six, and six isoforms of the ClaATG1s, ClaATG8s, and ClaATG18s, respectively, were revealed. The encoding genes are unevenly distributed across nine of the watermelon chromosomes. Six chromosomes (1, 5, 6, 7, 9, and 10) carry 3 or 4 ClaATGs each, accounting for 22 genes in total, whereas three chromosomes (2, 3, and 10) contain 1 or 2 genes each. The open reading frames (ORFs) of the 27 ClaATGs range from 288 to 5823 bp, encoding proteins of 95 to 1940 amino acids with molecular weights of 10.51 to 214.86 kDa. Predicted theoretical isoelectric points span from 5.00 to 9.21. A subcellular localization analysis indicated that ClaATGs are present in the cytoplasm, nucleus, chloroplasts, and plastids. Notably, protein isoforms of the same gene can localize to different subcellular compartments. For instance, ClaATG1a and ClaATG1b localize to the nucleus and chloroplast, respectively. None of these ClaATGs possess signal peptides. Furthermore, ClaATG9 was predicted to have five transmembrane helices, whereas ClaATG18g and ClaATG27 were each predicted to have only one (Table 1).
To elucidate the evolutionary relationships of ClaATGs in watermelon, an unrooted phylogenetic tree was constructed using representative plant species, including A. thaliana, Oryza sativa, Cucumis sativus, and C. lanatus. As depicted in Figure 1, the proteins encoded by the 27 ATGs were classified into 16 distinct clades. Notably, almost all the ClaATG sequences showed a high degree of homology with those of C. sativus. While the majority of ClaATG gene sequences formed separate clusters, certain subfamilies exhibited greater conservation levels than others. For example, ClaATG2 and ClaATG10 clustered within the same subfamily, whereas ClaATG18 sequences were segregated into two distinct branches. Overall, the ClaATGs displayed significant evolutionary conservation across species, although functional divergence may exist.

3.2. Genes Structure and Protein Motif Analysis of Genes Encoding ClaATGs

To decipher the exon-intron architectures of ClaATGs, the genomic and ORF sequences of these genes were uploaded to the GSDS v2.0 online platform. As illustrated in Figure 2A, the number of exons in different ClaATGs varied from 3 to 13. Specifically, members of the ClaATG1 and ClaATG8 subfamilies exhibited a similar exon-intron structure, whereas members of the ClaATG18 subfamily displayed two distinct configurations. Generally, proteins encoded by genes within the same subgroup shared comparable domains, yet notable disparities existed in the conserved domains of proteins encoded by ClaATGs across subgroups. For instance, serine/threonine protein kinases were present in all the members of the ClaATG1 subfamily, while members of the ClaATG5, ClaATG6, ClaATG8s, ClaATG12, ClaATG13, ClaATG14, ClaATG101, and ClaATG27 subfamilies harbored only a single conserved domain. ClaATG11 featured two distinct autophagy-related domains, APG17 and APG11, and ClaATG3 possessed three specialized domains: an autophagy-related domain at the N-terminal, another at the C-terminal, and an autophagy activation domain also at the C-terminal (Figure 2B). The most distinctive subfamily was the ClaATG18s, with 2 to 4 WD40 domains and a C-terminal BCAS3 domain. Additionally, transmembrane domains, chorein domains, and coiled-coil structures were identified in ClaATGs. An investigation into the interactions among ClaATGs in watermelon revealed a specific protein-protein interaction pattern. Most CsATGs interacted closely, except for ClaATG14, ClaATG18h, ClaATG18g, and ClaATG27, which is likely due to the limited research on these proteins in model plants (Figure 2C). Notably, ClaATG18 interacted with only four ClaATGs (ClaATG8i, ClaATG9, ClaATG10, and ClaATG18b). These results underscore the complexity of the autophagy process, which is accomplished through the coordinated interactions of multiple ARG-encoded proteins.

3.3. Promoter Elements Analysis of ClaATGs and Respond to Exogenous Sugars

A cis-element analysis of ClaATG promoters uncovered a multitude of conserved regulatory elements, including those responsive to photosynthesis, phytohormones, defense/stress, and wounding (Figure 3A). Light-responsive elements were detected across all the ClaATG families, whereas phytohormone- and defense/stress-responsive elements were prevalent in most. Notably, wounding-responsive cis-acting elements were identified exclusively in the ClaATG3, ClaATG6, ClaATG11, and ClaATG14 proteins. Except for ClaATG101, which harbored only light- and ABA-responsive elements, the majority of ClaATGs contained at least three types of cis-elements. These results imply that the expression of ClaATGs is likely modulated by carbon metabolism, hormone signaling pathways, and stress-related substances.
The ClaATG2, ClaATG5, ClaATG6, and ClaATG8 are essential components of the plant autophagy process. In Arabidopsis, these genes are involved in responses to carbon and nitrogen starvation, as well as other stress conditions [20,21]. To explore their roles in watermelon, the genes encoding these four proteins were selected as representatives from the 27 ClaATGs identified in the watermelon genome for further investigation. The expression patterns of these four ClaATGs, along with five additional related proteins, were analyzed in etiolated watermelon plants under control conditions and sugar treatment. As shown in Figure 3B, under carbon starvation stress, the expressions of most ClaATGs were induced. Notably, ClaATG8s were significantly upregulated after 48 h in etiolated seedlings, and this upregulation was mitigated by an exogenous sugar application. Conversely, in normal watermelon plants, the levels of ClaATG8s were significantly downregulated at 12 h following an exogenous sugar treatment. In contrast, the expressions of ClaATG2 and ClaATG6 remained unaffected by exogenous sugars in both normal and etiolated watermelon seedlings.

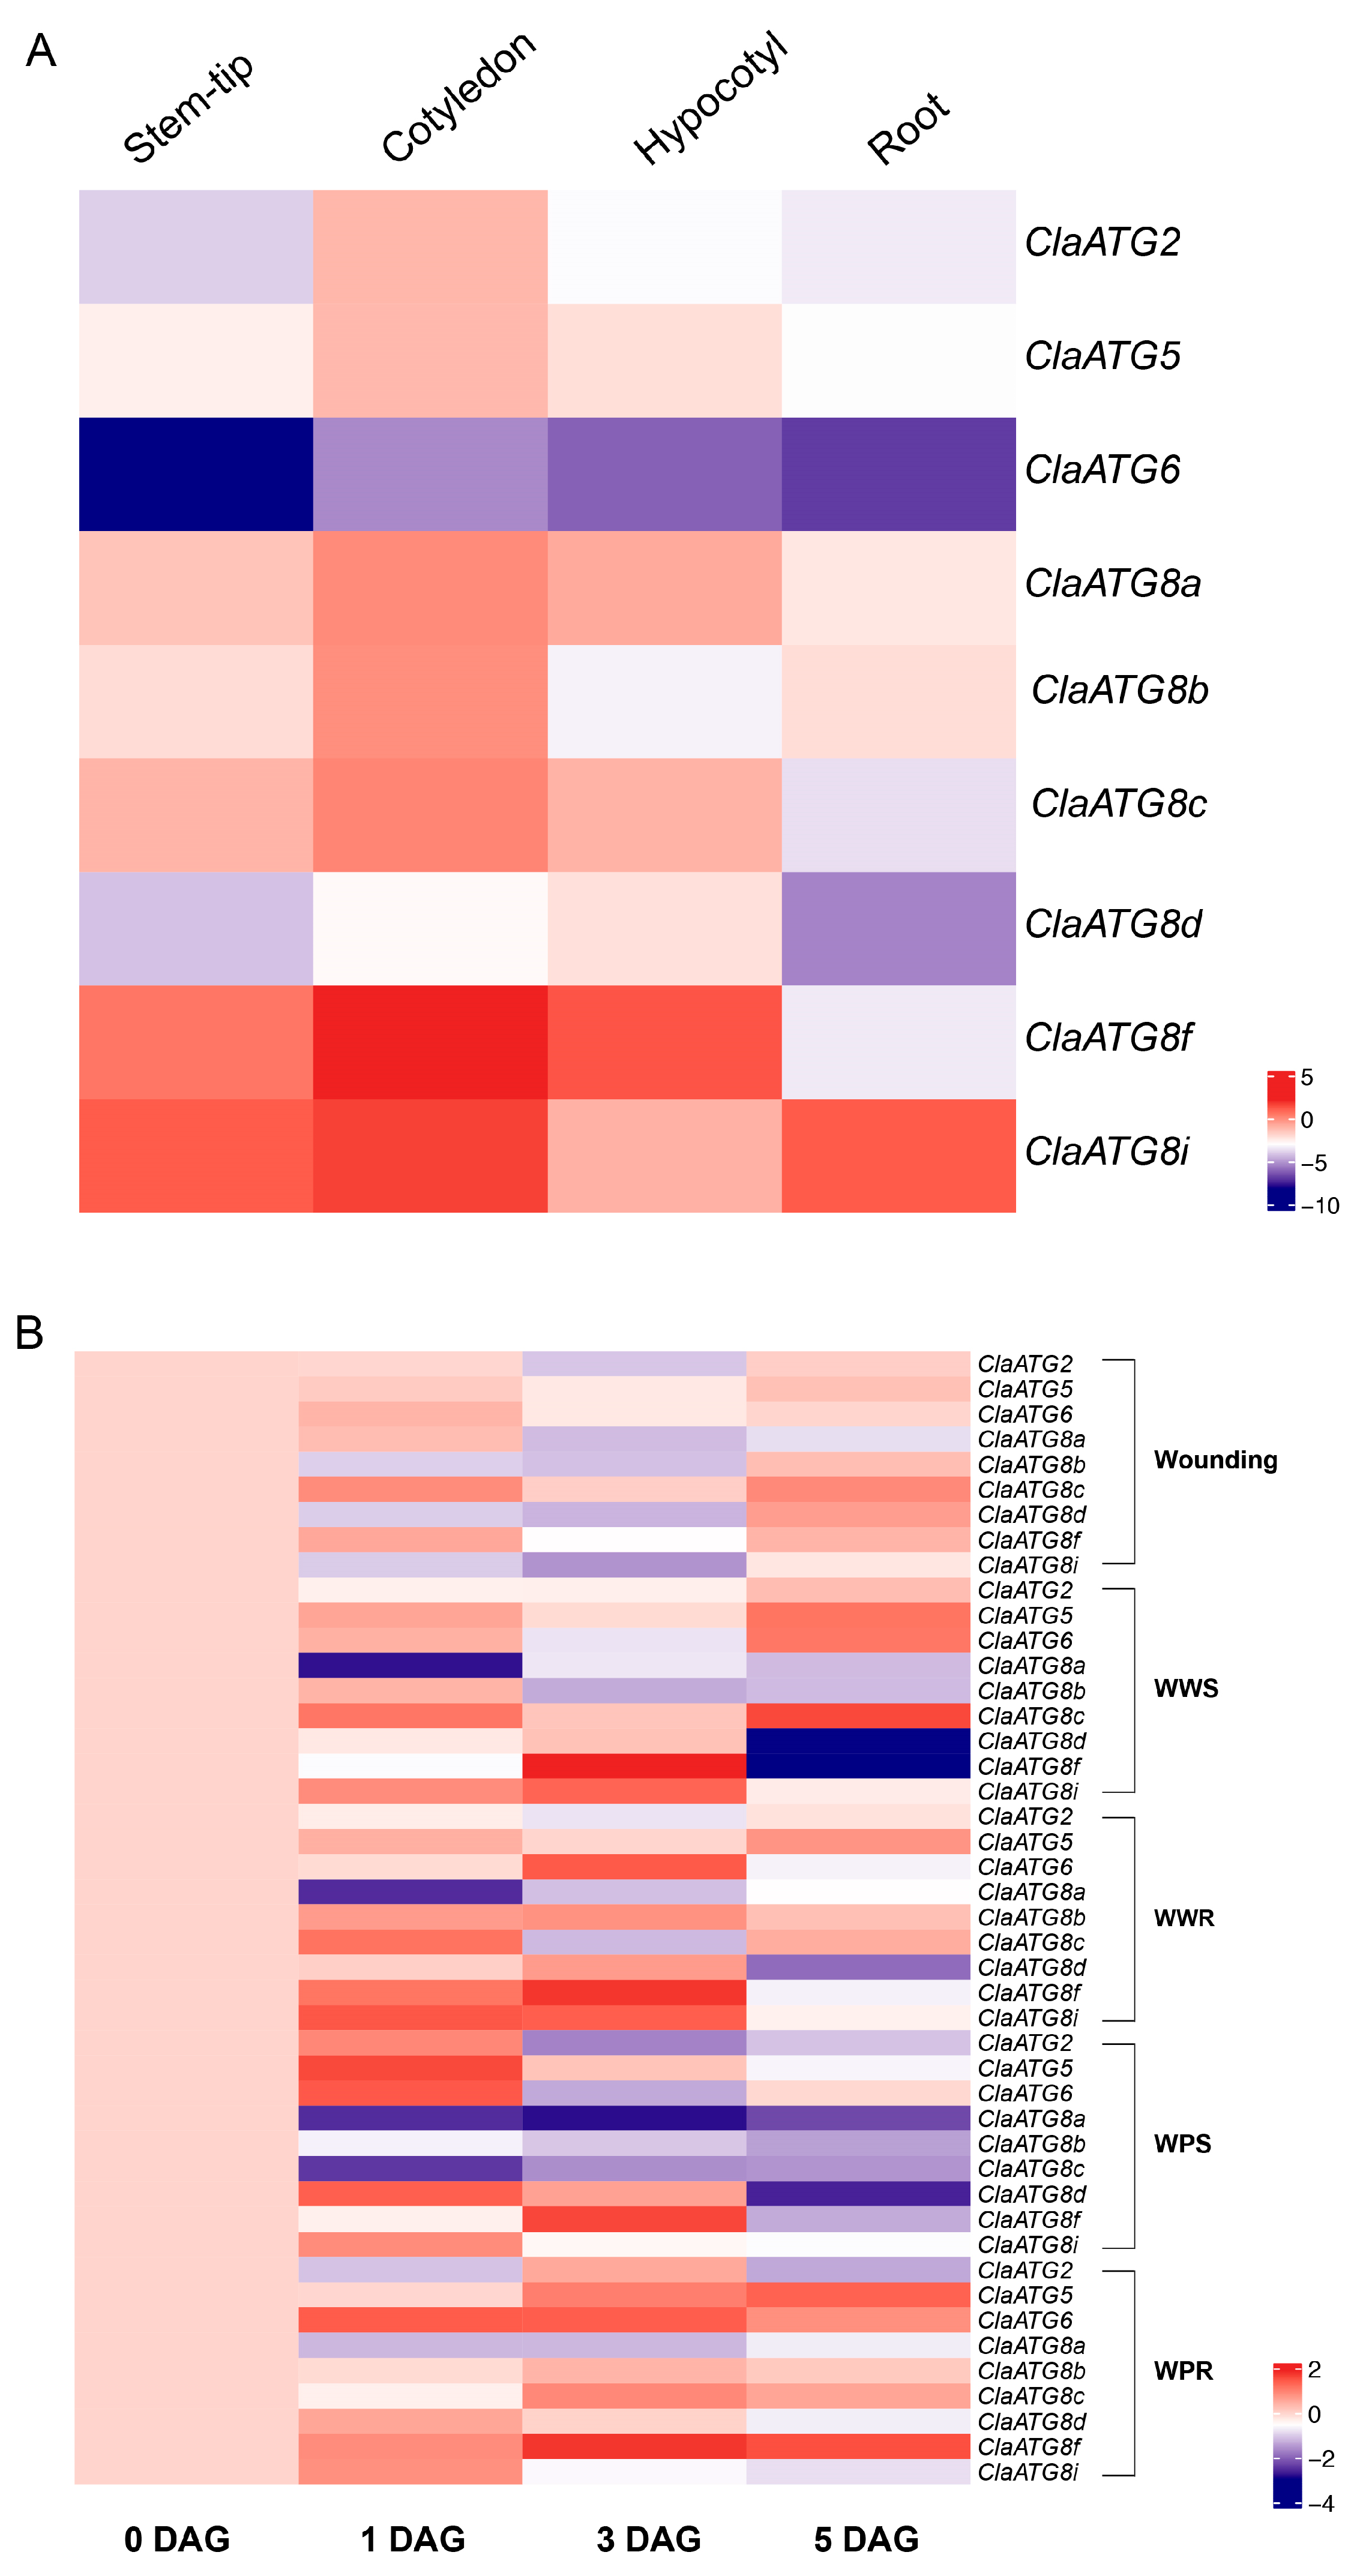
3.4. Watermelon ClaATGs Expression Profiles at Various Tissues and Wounding Responses

To elucidate the expression profiles of ClaATGs in watermelon seedlings, the expression patterns of nine ATGs across root, hypocotyl, cotyledon, and stem tip tissues were analyzed (Figure 4A). Transcript detection revealed tissue-specific expression levels, with members of the same subfamily exhibiting distinct expression patterns despite sequence similarities. For example, ClaATG8a, ClaATG8c, and ClaATG8f showed high transcription levels in all the tissues except roots, whereas ClaATG8b and ClaATG8d displayed low transcription levels. Notably, ClaATG8i was ubiquitously expressed in all the seedling tissues. In contrast, ClaATG2 and ClaATG5 exhibited low expression levels, and ClaATG6 expression showed no significant tissue-dependent variation. Previous studies have shown that ATG2, ATG5, and ATG8 positively regulate wounding response and graft union formation. To investigate the role of ClaATGs in watermelon, hypocotyl interface samples were collected from wounded plants, homografts (watermelon–watermelon), and heterografts (watermelon–pumpkin and pumpkin–watermelon). The transcriptional expression analysis showed that multiple ClaATGs were rapidly activated 1 day after wounding. Specifically, ClaATG8c and ClaATG8f were significantly upregulated, whereas ClaATG8a, ClaATG8b, and ClaATG8i were downregulated during wound healing (Figure 4B). In addition, ClaATG5 and ClaATG6 maintained stable expression levels. Compared to the single wounding response, ClaATGs exhibited more complex expression dynamics during graft union formation. While homografts and heterografts showed similar overall trends, the latter displayed more pronounced responses. Several genes, including ClaATG2, ClaATG5, ClaATG6, ClaATG8a, ClaATG8b, ClaATG8d, and ClaATG8f, showed stronger upregulation or downregulation in either scion or rootstock tissues. Notably, ClaATG8a expression was significantly lower in the scion of watermelon–pumpkin heterografts compared with watermelon-watermelon homografts. Additionally, ClaATG8c and ClaATG8i exhibited contrasting expression patterns between homografts and heterografts during graft union healing. For instance, ClaATG8i was significantly upregulated at 1 and 3 DAG in watermelon–watermelon rootstocks but downregulated at 3 and 5 DAG in pumpkin–watermelon rootstocks. Collectively, these findings indicate that autophagy plays a role in wounding and graft union formation in watermelon, with ClaATGs potentially exhibiting differential functions in scion and rootstock tissues, particularly in heterografts.

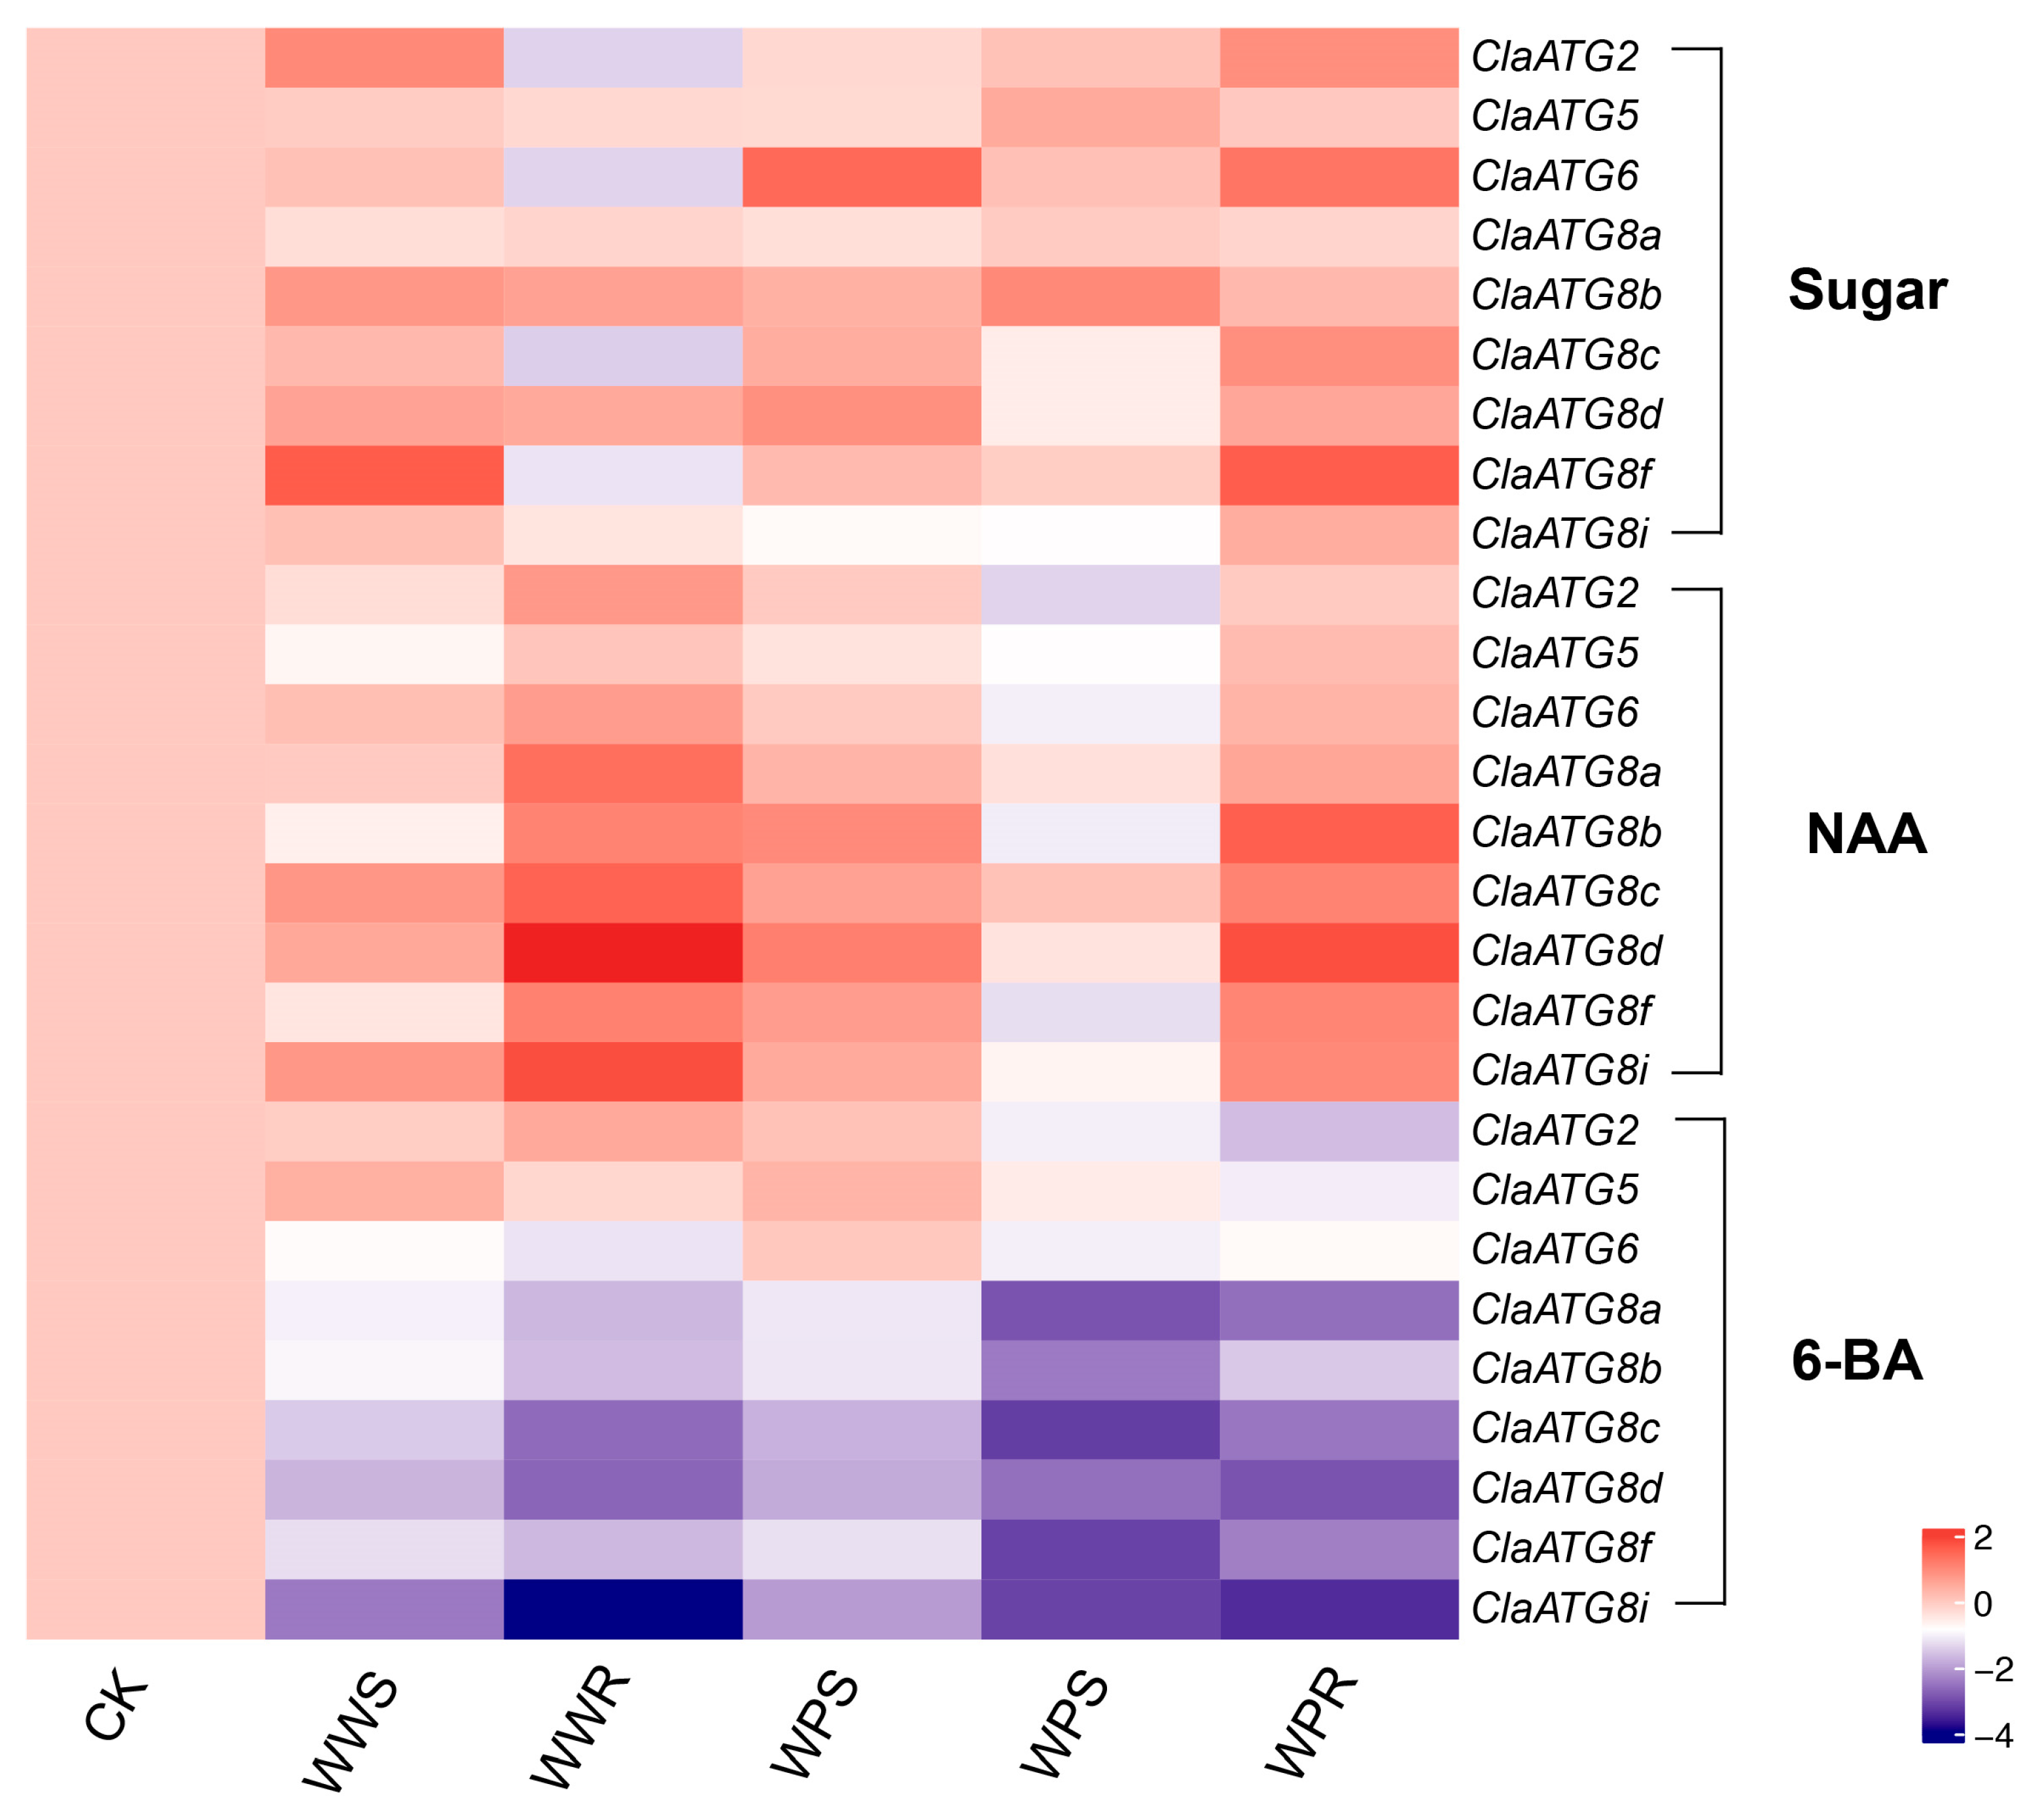
3.5. Watermelon ClaATG Expression Profiles in Response to Various Treatments at the Grafting Union

To investigate the role of ClaATGs in the response to exogenous sugars and plant hormones during graft interface wound healing, quantitative real-time PCR was employed to analyze the expression patterns of nine ATGs. As depicted in Figure 5, all the ClaATGs were upregulated at the wound site 1 day after the sugar application, with ClaATG8f exhibiting the most pronounced activation. Following an indole-3-acetic acid treatment, the ClaATGs displayed modest increases in expression at the wound site, whereas the 6-BA treatment led to slight decreases in expression. After the exogenous sugar treatment, ClaATG2, ClaATG6, ClaATG8c, and ClaATG8f expression levels significantly decreased in the scion but increased in the rootstock of watermelon–watermelon homografts. In contrast, watermelon–pumpkin heterografts showed minimal expression changes in the scion, with notable upregulation being observed only in the pumpkin rootstock. Similarly, most ClaATGs were upregulated in the scion of the homografts but downregulated in the scion of the heterografts. After NAA treatment, however, ClaATG expression patterns were consistent between homograft and heterograft rootstocks. Notably, during graft union formation, the majority of ClaATGs, especially members of the ClaATG8 subfamily, were downregulated in both homografts and heterografts. These findings suggest that a complex autophagy regulatory network mediates the responses to exogenous sugars, NAA, and 6-BA during graft union formation, highlighting potential differential functions of ClaATGs between scion and rootstock tissues across grafting combinations.

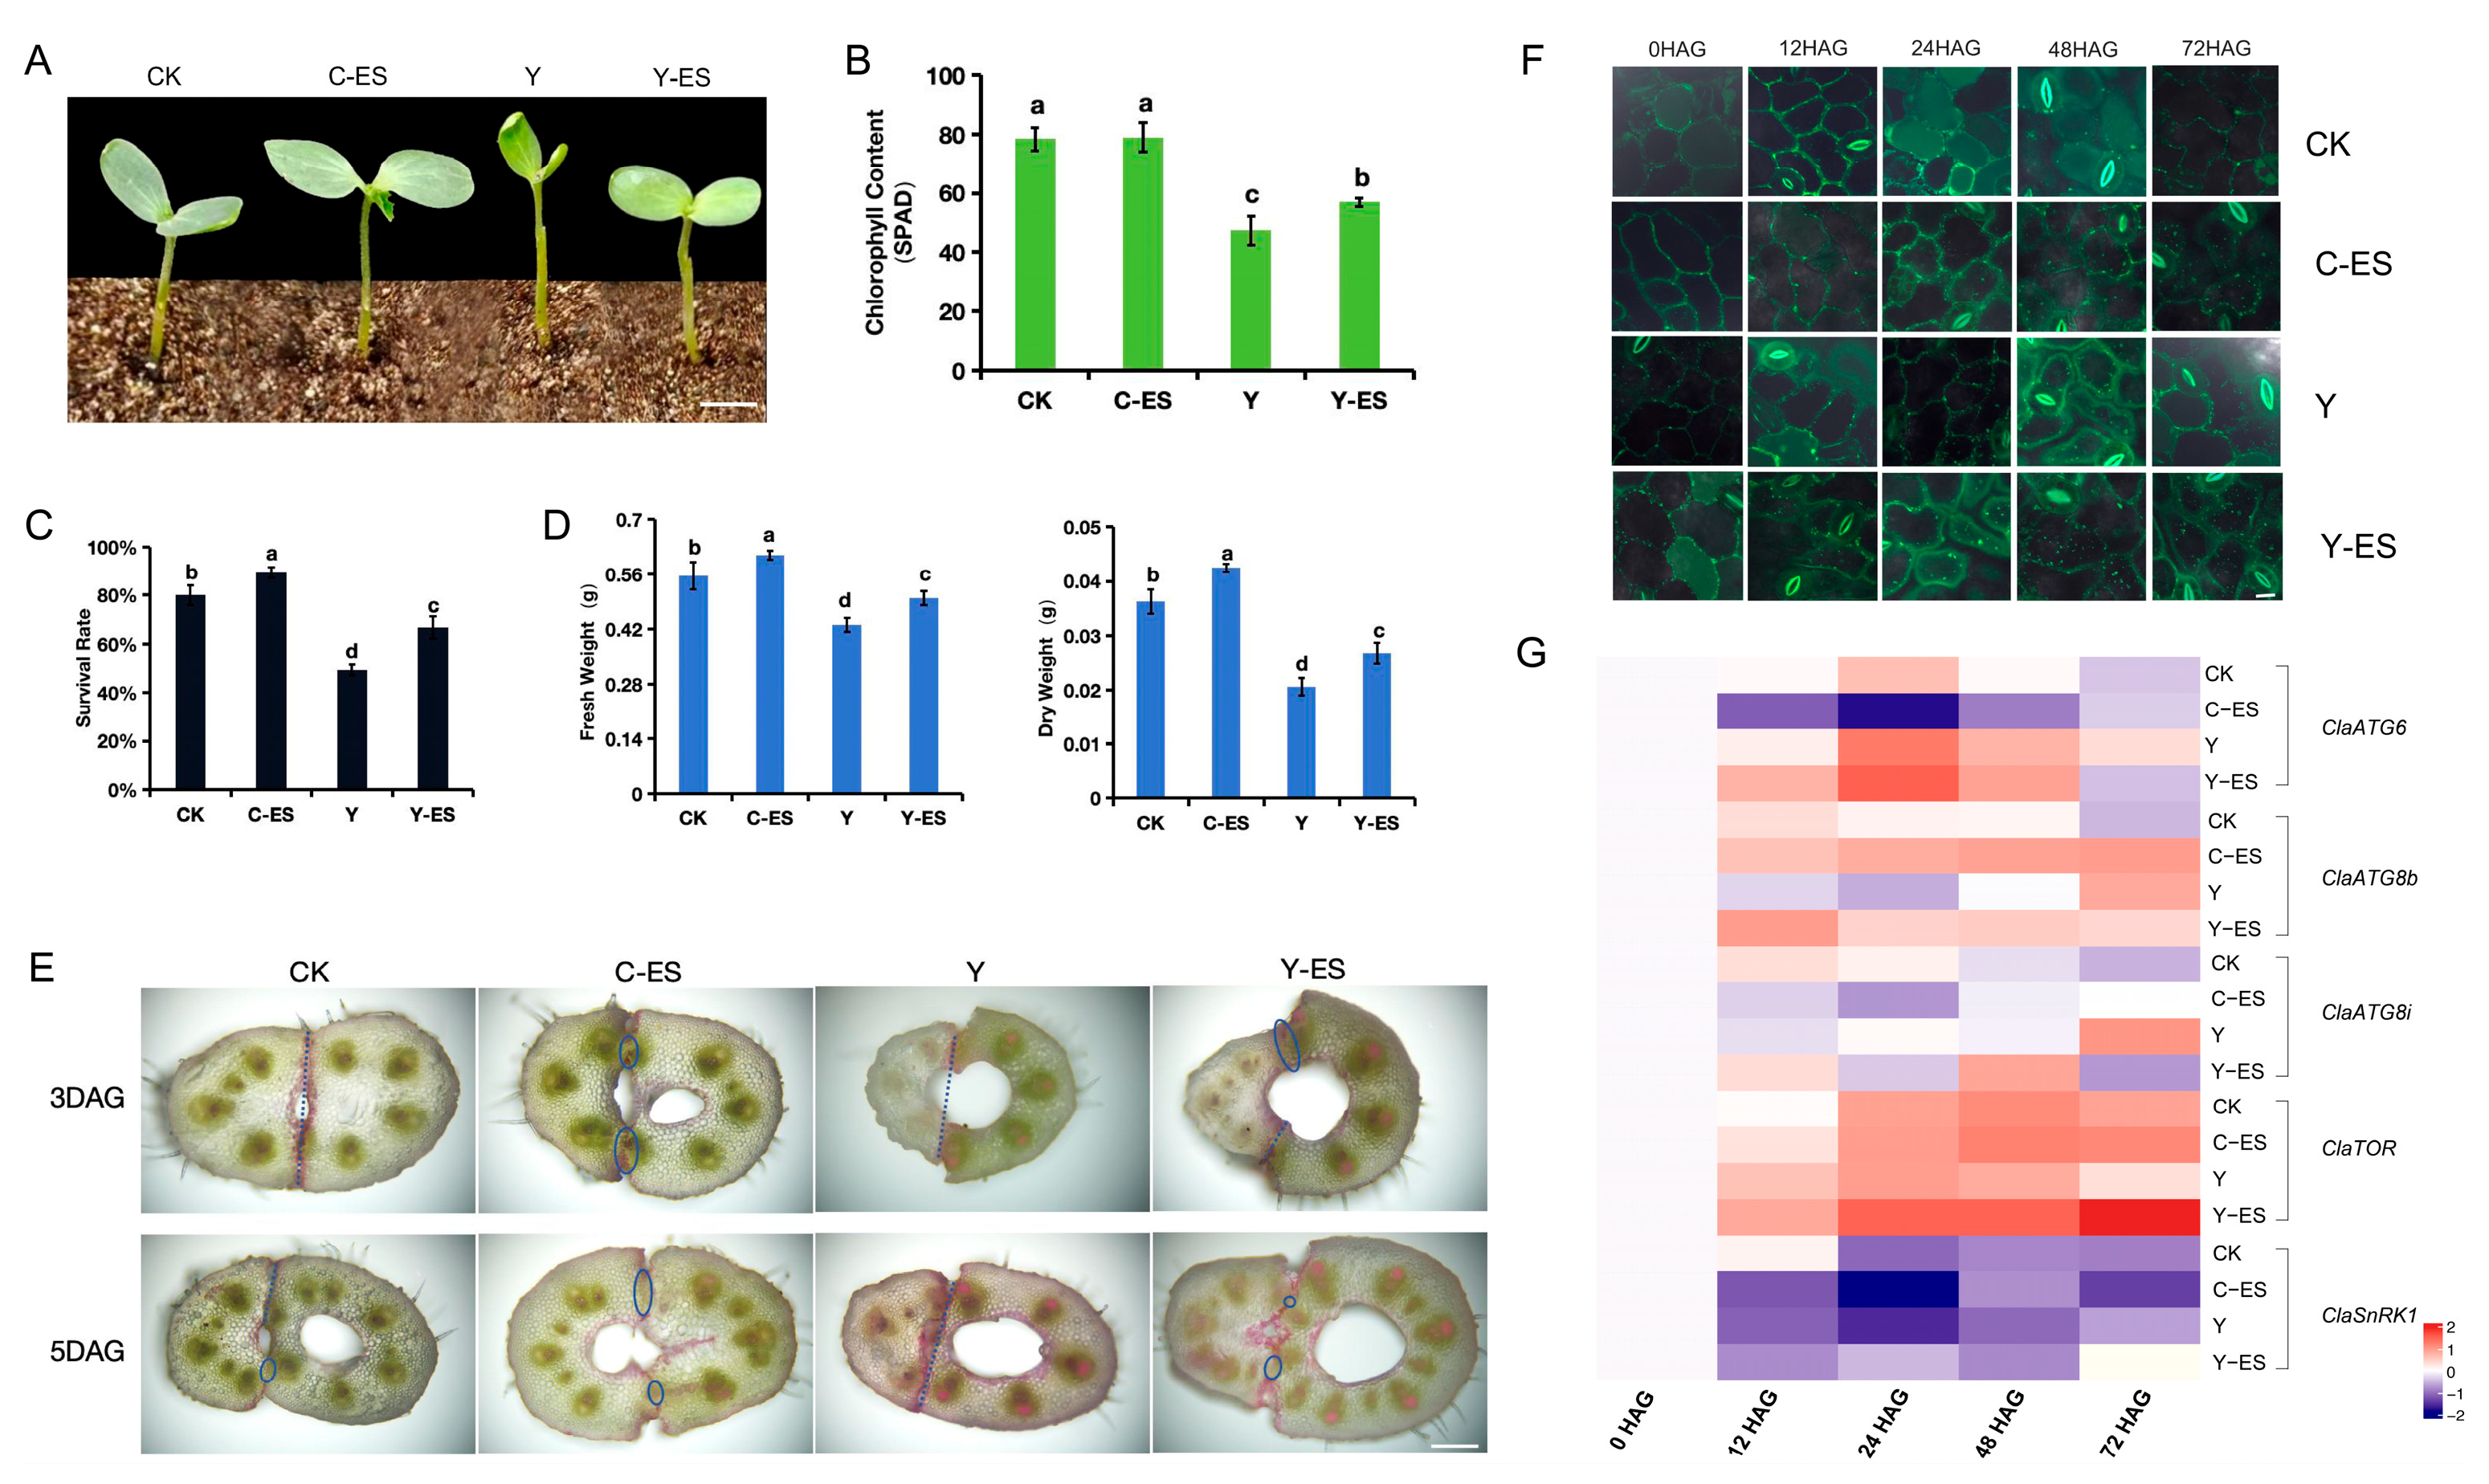
3.6. Autophagy Monitoring During Heterograft Graft Union Formation After an Exogenous Sugar Treatment

To elucidate the autophagic process during graft union formation under carbon starvation, the numbers of autophagosomes and graft success rates were evaluated in WT and etiolated autografted seedlings treated with exogenous sugars. As shown in Figure 6A–D, etiolated seedlings exhibited significant reductions in graft survival rates, which were improved upon exogenous sugar treatment, highlighting the dual role of sugars in promoting graft growth and enhancing union success. In homografts, vascular junction formation was completed by 5 DAG, whereas this process was delayed in etiolated grafts. An exogenous sugar application significantly accelerated interface healing in both normal and etiolated grafted seedlings. Autophagosome quantification revealed that autophagy actively participated in graft union formation, regardless of sugar availability. Autophagosome numbers increased in all the treatments starting from 12 h after grafting (HAG). Notably, etiolated grafts contained a basal level of autophagosomes at 0 HAG, with counts being consistently higher than those in normal grafts until 12 HAG. The sugar treatment significantly elevated autophagosome numbers in both etiolated and normal grafts, particularly at 24 HAG.
The expression profiles of ClaATGs were further investigated during graft union formation under carbon starvation. ClaATG6 was highly expressed in etiolated watermelon grafted onto a pumpkin, peaking at 24 HAG, and this pattern remained unaffected by an exogenous sugar treatment. Conversely, in normal grafted watermelon, ClaATG6 expression was significantly downregulated after a sugar treatment. In normal grafts, ClaATG8b and ClaATG8i showed minimal expression changes, whereas ClaATG8i was significantly upregulated by exogenous sugars. Both genes were highly upregulated in etiolated grafts, with ClaATG8i being stably expressed after a sugar treatment (Figure 6). Additionally, the expressions of ClaTOR and ClaSnRK1, key regulators of plant sugar sensing and energy homeostasis that act antagonistically in response to sugar signals, were analyzed. In grafted plants, these genes continued to exhibit opposite levels, with ClaTOR upregulated and ClaSnRK1 downregulated. Notably, an exogenous sugar treatment significantly enhanced ClaTOR expression in etiolated grafts, whereas ClaSnRK1 expression remained unaffected (Figure 6G). These findings underscore the intricate interplay between autophagy, sugar signaling pathways, and carbon starvation responses during graft union formation, highlighting the differential regulatory roles of ClaATGs, ClaTOR, and ClaSnRK1 in normal and etiolated grafted seedlings.

4. Discussion

4.1. ClaATGs Involved in the Growth and Development of Watermelon

Autophagy is a fundamental biological process crucial for plant growth, functioning both under normal conditions and during stress responses. This process involves the induction, encapsulation, transport, degradation, and recycling of autophagosomes, which are orchestrated by ATGs. Initially identified in yeast, ATGs have since been characterized in numerous plant species, including 32 in A. thaliana [7], 33 in O. sativa [22], 29 in Capsicum annuum [23], and 21 in C. sativus [24]. Their physiological functions have been partially elucidated. In this study, 27 ClaATGs were identified in watermelon. These genes exhibited autophagic features comparable to those in other species, such as multiple copies of ATG8 and ATG18 homologs. A phylogenetic analysis and protein domain characterization further confirmed the high evolutionary conservation of ATGs across plant taxa. Notably, 22 out of the 27 ClaATG family members exhibited instability, consistent with the findings from ATG characterization studies performed in tea and other plants [25].
Recent research has increasingly focused on deciphering the functions and regulatory mechanisms of ATGs in plant development. Multiple studies have demonstrated the involvement of autophagy in key developmental processes, including pollen maturation [26], seed maturation [27], and leaf senescence [8]. Among ATGs, the ATG8 family has emerged as a central regulator of plant growth. As highly conserved ubiquitin-like proteins, ATG8s become activated upon conjugation with phosphatidylethanolamine to form adducts, which subsequently associate with autophagosomal membranes, facilitating autophagosome biogenesis, phagolysosome expansion, and cargo degradation [28,29,30]. Here, six ATG8 isoforms were identified in watermelon, and they displayed significant sequence similarity to their counterparts in A. thaliana, O. sativa, and C. sativus. Expression analysis revealed that most ClaATG8s exhibited high expression levels in hypocotyls, cotyledons, and stem tips, with ClaATG8f showing particularly prominent expression. These findings suggest a pivotal role for ClaATG8s in regulating watermelon development, consistent with the expression patterns observed in other species, such as A. thaliana, where AtATG8s are ubiquitously expressed across various tissues [5].

4.2. Expression of ClaATGs Under Various Treatments

Beyond its role in plant growth and development, autophagy is essential for plant defense against biotic and abiotic stresses, including nutrient limitation, drought, and light deprivation. Under shading or low-light conditions, photosynthesis is inhibited, reducing sugar production and causing carbon starvation. Autophagy genes are upregulated in darkness, accompanied by accelerated starch degradation, indicating autophagy’s involvement in dark stress responses [31,32]. Carbon starvation directly induces autophagy in plant cells [33], mediated by transcription factor TGA9-a basic leucine zipper protein. TGA9 binds to TGACG motifs in the promoters of AtATG8b and AtATG8e, activating autophagy gene expression. Overexpression of TGA9 in plants upregulates AtATG8s and other autophagy genes, increases autophagic vesicle formation, and enhances seedling tolerance to carbon starvation [20]. Notably, the present analysis revealed that the 2000-bp promoter regions of all 27 ClaATGs contain multiple photosynthesis-responsive elements, suggesting a critical role for light in regulating these genes. Etiolation induced by dark treatment in watermelon seedlings upregulated ClaATG6 and most ClaATG8s at 48 h post-treatment, an effect mitigated by exogenous glucose application. Additionally, ClaATG promoters harbor various cis-elements associated with hormone and stress responses, consistent with the induction of these genes during wounding and graft union formation.
While autophagy’s role in animal wound healing, being crucial for accelerating chronic wound repair, is well-established, its function in plant wound healing remains less explored [12]. In Arabidopsis, exogenous indole-3-methanol or wounding induces autophagy and suppresses root auxin responses [3]. Compared with WT plants, atg5, and atg7 mutants exhibit impaired wound-induced cellular reprogramming and lose regulatory control in pluripotent cell induction media [34], similar to observations in zebrafish muscle regeneration, indicating that defective autophagy disrupts stem cell formation and tissue regeneration [35]. These findings suggest the evolutionary conservation of autophagy-mediated dedifferentiation and organ regeneration across kingdoms. In this study, ClaATGs displayed differential expression patterns in wounded and grafted watermelon plants, with distinct responses between homografts and heterografts. During homograft union formation, most ClaATGs were upregulated in scions and rootstocks at 3 or 5 DAG, except ClaATG8a and ClaATG8b, which were downregulated in watermelon scions. In heterografts, the majority of ClaATGs were significantly downregulated in scions at 3–5 DAG, whereas rootstock expression, except for that of ClaATG8a, showed an opposite trend at the graft interface. These results demonstrate that autophagy is a rapid response to wounding and graft union formation in watermelon, with potentially divergent functions in scions versus rootstocks, particularly in heterografted plants.

4.3. ClaATGs Involved in Graft Union Formation Under Sugar Starvation in Watermelon Plants

Plant graft interface healing represents a complex biological process closely linked to wound repair mechanisms triggered by mechanical stress. Here, a pivotal role of autophagy in this process was demonstrated, which aligned with previous reports highlighting the intricate interplay among autophagy, wound healing, and sugar signaling pathways [36,37]. The differential expression patterns of ClaATGs in grafted seedlings treated with exogenous sugars were observed, with genes exhibiting both upregulation and downregulation. Notably, ClaATG8s showed more pronounced responses during plant hormone-mediated healing, suggesting that a complex autophagic regulatory network modulates graft union formation in response to exogenous sugars.
Chloroplasts, essential organelles in photosynthetic cells, are responsible for energy production via photosynthesis, generating sugars and starch [38]. In darkness, Rubisco-containing bodies initiate chloroplast degradation as plants adapt to carbon starvation [39]. Here, etiolated seedlings were shown to have significantly lower chlorophyll contents and dry/fresh weight ratios compared with normal plants. However, an exogenous sugar application to grafted etiolated seedlings restored chlorophyll levels and increased biomass, likely by replenishing light deprivation-related energy deficits that then promoted photosynthetic recovery. Autophagosome biogenesis in sugar-starved plants is crucial for chloroplast protrusion development, with autophagosome formation coordinated with chloroplast division to facilitate degradation [40]. Consistent with this, normal plants contained few autophagosomes, possibly due to the short-term dark treatment before grafting. In contrast, etiolated seedlings showed elevated autophagosome numbers, reflecting continuous chloroplast degradation under prolonged darkness.
Plant-derived sugars serve as primary energy sources and as signaling molecules regulating cell growth and development. The evolutionarily conserved protein kinases SnRK1 and TOR, which act as central regulators of autophagy, sugar sensing, and energy homeostasis, function antagonistically to control plant growth [41]. The TOR inhibitor AZD-8055 delays vascular connection formation in energy-deprived grafts, whereas exogenous glucose promotes xylem reconnection in squash grafts, implicating sugar and arginine in heterograft union formation [17]. SnRK1, which acts as a positive regulator of autophagy, is activated by energy starvation during darkness but inhibited by exogenous sucrose or glucose. It functions upstream of TOR, which negatively regulates autophagy [42,43,44]. In this study, a glucose application induced an antagonistic response, downregulating ClaSnRK1 and upregulating ClaTOR. Intriguingly, similar expression patterns were observed in non-sugar-treated grafted seedlings, possibly due to wound-induced glucose release that triggered autophagy [45]. Although D-glucose applications in Arabidopsis stimulate autophagosome formation, the specific roles of autophagosomes, SnRK1, and TOR in graft interface healing warrant further investigation.

5. Conclusions

In this study, 27 autophagy-related (ATG) genes were identified in the watermelon genome. Promoter analysis showed that all ClaATGs harbored numerous photo-responsive elements, and most ClaATGs responded to exogenous glucose in both normal and etiolated seedlings. Tissue-specific expression assays revealed diverse expression patterns for ClaATGs across tissues, except for ClaATG6. The study further explored the responses of selected ClaATGs during injury and grafting. Expression of ClaATGs was induced during wounding, graft union formation, and in response to IAA and CK. Sugar spray enhanced autophagy, improving the grafting success rate of etiolated seedlings. This suggested that exogenous glucose promotes the healing process through increased autophagosome numbers and high-level expression of ClaATG6. Additionally, an antagonistic regulatory relationship between ClaTOR and ClaSnRK1, key regulators of autophagy, was observed during graft union formation. These findings deepen our understanding of the role of ClaATGs in watermelon wound healing and grafting, illuminating the multifaceted functions of plant autophagy.

Supplementary Materials

The following supporting information can be downloaded at: https://www.mdpi.com/article/10.3390/horticulturae11060619/s1. Figure S1: Wound and grafted plants tissues were harvested ~1mm above (top) and ~1 mm below (bottom) the cut site. Figure S2: Conserved motif in watermelon ClaATGs proteins. Ten motifs with E-value < 0.05 are presented.

Author Contributions

Conceptualization, L.M.; methodology, S.C. and F.D.; software, S.C. and S.F.; validation, S.C., S.F. and X.C.; formal analysis, X.F. and X.C.; data curation, J.Z. and Y.Z.; writing—original draft preparation, S.C. and F.D.; writing-review and editing, Y.L. and L.M.; All authors have read and agreed to the published version of the manuscript.

Funding

This study was supported by the National Natural Science Foundation of China (32202511), the Taishan Program of Shandong Province (Grant tsqn202306246), Undergraduate Innovation And Entrepreneurship Training Program (2540), Liaocheng University (3180520392).

Data Availability Statement

Data are contained within the article and supplementary materials. Additional data can be obtained by contacting the first corresponding author of the article.

Conflicts of Interest

The authors declare no conflicts of interest.

References

  1. Kanne, J.V.; Ishikawa, M.; Bressendorff, S.; Ansbol, J.; Hasebe, M.; Rodriguez, E.; Petersen, M. Overexpression of ATG8/LC3 enhances wound-induced somatic reprogramming in Physcomitrium patens. Autophagy 2022, 18, 1463–1466. [Google Scholar] [CrossRef] [PubMed]
  2. Bassham, D.C. Plant autophagy--more than a starvation response. Curr. Opin. Plant Biol. 2007, 10, 587–593. [Google Scholar] [CrossRef] [PubMed]
  3. Katz, E.; Chamovitz, D.A. Wounding of Arabidopsis leaves induces indole-3-carbinol-dependent autophagy in roots of Arabidopsis thaliana. Plant J. 2017, 91, 779–787. [Google Scholar] [CrossRef]
  4. Slavikova, S.; Ufaz, S.; Avin-Wittenberg, T.; Levanony, H.; Galili, G. An autophagy-associated Atg8 protein is involved in the responses of Arabidopsis seedlings to hormonal controls and abiotic stresses. J. Exp. Bot. 2008, 59, 4029–4043. [Google Scholar] [CrossRef]
  5. Sláviková, S.; Shy, G.; Yao, Y.; Glozman, R.; Levanony, H.; Pietrokovski, S.; Elazar, Z.; Galili, G. The autophagy-associated Atg8 gene family operates both under favourable growth conditions and under starvation stresses in Arabidopsis plants. J. Exp. Bot. 2005, 56, 2839–2849. [Google Scholar] [CrossRef] [PubMed]
  6. Zhang, J.; Yang, W.; Yue, J.; Liu, Y.; Pei, D.; Wang, H. The Responses of Wheat Autophagy and ATG8 Family Genes to Biotic and Abiotic Stresses. J. Plant Growth Regul. 2020, 39, 867–876. [Google Scholar] [CrossRef]
  7. Xia, T.; Xiao, D.; Liu, D.; Chai, W.; Gong, Q.; Wang, N.N. Heterologous Expression of ATG8c from Soybean Confers Tolerance to Nitrogen Deficiency and Increases Yield in Arabidopsis. PLoS ONE 2012, 7, e37217. [Google Scholar] [CrossRef]
  8. Minina, E.A.; Moschou, P.N.; Vetukuri, R.R.; Sanchez-Vera, V.; Cardoso, C.; Liu, Q.; Elander, P.H.; Dalman, K.; Beganovic, M.; Yilmaz, J.L.; et al. Transcriptional stimulation of rate-limiting components of the autophagic pathway improves plant fitness. J. Exp. Bot. 2018, 69, 1415–1432. [Google Scholar] [CrossRef]
  9. Yu, X.-Q.; Su, W.; Zhang, H.; Niu, M.; Liu, X.; Li, Z.; Liu, C.; Wang, H.-L.; Yin, W.; Xia, X. Genome-wide analysis of autophagy-related gene family and PagATG18a enhances salt tolerance by regulating ROS homeostasis in poplar. Int. J. Biol. Macromol. 2023, 224, 1524–1540. [Google Scholar] [CrossRef]
  10. Wei, Y.; Liu, W.; Hu, W.; Liu, G.; Wu, C.; Liu, W.; Zeng, H.; He, C.; Shi, H. Genome-wide analysis of autophagy-related genes in banana highlights MaATG8s in cell death and autophagy in immune response to Fusarium wilt. Plant Cell Rep. 2017, 36, 1237–1250. [Google Scholar] [CrossRef]
  11. Kakanj, P.; Bhide, S.; Moussian, B.; Leptin, M. Autophagy-mediated plasma membrane removal promotes the formation of epithelial syncytia. Embo J. 2022, 41, e109992. [Google Scholar] [CrossRef] [PubMed]
  12. Mijaljica, D.; Spada, F.; Klionsky, D.J.J.; Harrison, I.P.P. Autophagy is the key to making chronic wounds acute in skin wound healing. Autophagy 2023, 19, 2578–2584. [Google Scholar] [CrossRef] [PubMed]
  13. Miao, L.; Li, S.; Bai, L.; Anwar, A.; Li, Y.; He, C.; Yu, X. Effect of grafting methods on physiological change of graft union formation in cucumber grafted onto bottle gourd rootstock. Sci. Hortic. 2019, 244, 249–256. [Google Scholar] [CrossRef]
  14. Kurotani, K.I.; Tabata, R.; Kawakatsu, Y.; Sugita, R.; Notaguchi, M. Autophagy is Induced During Plant Grafting for Wound Healing; Cold Spring Harbor Laboratory: New York, NY, USA, 2020. [Google Scholar]
  15. Pu, Y.; Luo, X.; Bassham, D.C. TOR-Dependent and -Independent Pathways Regulate Autophagy in Arabidopsis thaliana. Front. Plant Sci. 2017, 8, 1204. [Google Scholar] [CrossRef] [PubMed]
  16. Janse van Rensburg, H.C.; Van den Ende, W.; Signorelli, S. Autophagy in Plants: Both a Puppet and a Puppet Master of Sugars. Front. Plant Sci. 2019, 10, 1664. [Google Scholar] [CrossRef]
  17. Miao, L.; Li, Q.; Sun, T.-S.; Chai, S.; Wang, C.; Bai, L.; Sun, M.; Li, Y.; Qin, X.; Zhang, Z.; et al. Sugars promote graft union development in the heterograft of cucumber onto pumpkin. Hortic. Res. 2021, 8, 146. [Google Scholar] [CrossRef]
  18. Li, Y.; Wang, N.; Feng, J.; Liu, Y.; Wang, H.; Deng, S.; Dong, W.; Liu, X.; Lv, B.; Sun, J.; et al. Enhancing genetic transformation efficiency in cucurbit crops through AtGRF5 overexpression: Mechanistic insights and applications. J. Integr. Plant Biol. 2025. [Google Scholar] [CrossRef]
  19. Kong, Q.; Yuan, J.; Gao, L.; Zhao, S.; Jiang, W.; Huang, Y.; Bie, Z. Identification of suitable reference genes for gene expression normalization in qRT-PCR analysis in watermelon. PLoS ONE 2014, 9, e90612. [Google Scholar] [CrossRef]
  20. Wang, P.; Nolan, T.M.; Yin, Y.; Bassham, D.C. Identification of transcription factors that regulate ATG8 expression and autophagy in Arabidopsis. Autophagy 2020, 16, 123–139. [Google Scholar] [CrossRef]
  21. Yang, C.; Shen, W.; Yang, L.; Sun, Y.; Li, X.; Lai, M.; Wei, J.; Wang, C.; Xu, Y.; Li, F.; et al. HY5-HDA9 module transcriptionally regulates plant autophagy in response to light-to-dark conversion and nitrogen starvation. Mol. Plant 2020, 13, 515–531. [Google Scholar] [CrossRef]
  22. Xia, K.; Liu, T.; Ouyang, J.; Wang, R.; Fan, T.; Zhang, M. Genome-Wide Identification, Classification, and Expression Analysis of Autophagy-Associated Gene Homologues in Rice (Oryza sativa L.). DNA Res. 2011, 18, 363–377. [Google Scholar] [CrossRef] [PubMed]
  23. Zhai, Y.; Guo, M.; Wang, H.; Lu, J.; Liu, J.; Zhang, C.; Gong, Z.; Lu, M. Autophagy, a Conserved Mechanism for Protein Degradation, Responds to Heat, and Other Abiotic Stresses in Capsicum annuum L. Front. Plant Sci. 2016, 7, 131. [Google Scholar] [CrossRef]
  24. Han, Y.; Yang, Y.; Wang, Y.; Elsheery, N.I.; Ding, G. Genome-wide identification and expression analysis of autophagy genes in cucumber. Res. Sq. 2021. [Google Scholar] [CrossRef]
  25. Wang, H.; Ding, Z.; Gou, M.; Hu, J.; Wang, Y.; Wang, L.; Wang, Y.; Di, T.; Zhang, X.; Hao, X.; et al. Genome-wide identification, characterization, and expression analysis of tea plant autophagy-related genes (CsARGs) demonstrates that they play diverse roles during development and under abiotic stress. BMC Genom. 2021, 22, 121. [Google Scholar] [CrossRef]
  26. Qin, G.; Ma, Z.; Zhang, L.; Xing, S.; Hou, X.; Deng, J.; Liu, J.; Chen, Z.; Qu, L.-J.; Gu, H. Arabidopsis AtBECLIN 1/AtAtg6/AtVps30 is essential for pollen germination and plant development. Cell Res. 2007, 17, 249–263. [Google Scholar] [CrossRef]
  27. Di Berardino, J.; Marmagne, A.; Berger, A.; Yoshimoto, K.; Cueff, G.; Chardon, F.; Masclaux-Daubresse, C.; Reisdorf-Cren, M. Autophagy controls resource allocation and protein storage accumulation in Arabidopsis seeds. J. Exp. Bot. 2018, 69, 1403–1414. [Google Scholar] [CrossRef] [PubMed]
  28. Nair, U.; Yen, W.-L.; Mari, M.; Cao, Y.; Xie, Z.; Baba, M.; Reggiori, F.; Klionsky, D.J. A role for Atg8-PE deconjugation in autophagosome biogenesis. Autophagy 2012, 8, 780–793. [Google Scholar] [CrossRef]
  29. Nieto-Torres, J.L.; Leidal, A.M.; Debnath, J.; Hansen, M. Beyond Autophagy: The Expanding Roles of ATG8 Proteins. Trends Biochem. Sci. 2021, 46, 673–686. [Google Scholar] [CrossRef] [PubMed]
  30. Xie, Z.; Nair, U.; Klionsky, D.J. Atg8 controls phagophore expansion during autophagosome formation. Mol. Biol. Cell 2008, 19, 3290–3298. [Google Scholar] [CrossRef]
  31. Wang, Y.; Yu, B.; Zhao, J.; Guo, J.; Li, Y.; Han, S.; Huang, L.; Du, Y.; Hong, Y.; Tang, D.; et al. Autophagy Contributes to Leaf Starch Degradation. Plant Cell 2013, 25, 1383–1399. [Google Scholar] [CrossRef]
  32. Yan, H.; Liu, Y.; Zhang, K.; Song, J.; Xu, W.; Su, Z. Chromatin State-Based Analysis of Epigenetic H3K4me3 Marks of Arabidopsis in Response to Dark Stress. Front. Genet. 2019, 10, 306. [Google Scholar] [CrossRef]
  33. Huang, X.; Zheng, C.; Liu, F.; Yang, C.; Zheng, P.; Lu, X.; Tian, J.; Chung, T.; Otegui, M.S.; Xiao, S.; et al. Genetic Analyses of the Arabidopsis ATG1 Kinase Complex Reveal Both Kinase-Dependent and Independent Autophagic Routes during Fixed-Carbon Starvation. Plant Cell 2019, 31, 2973–2995. [Google Scholar] [CrossRef] [PubMed]
  34. Rodriguez, E.; Chevalier, J.; Olsen, J.; Ansbol, J.; Kapousidou, V.; Zuo, Z.; Svenning, S.; Loefke, C.; Koemeda, S.; Drozdowskyj, P.S.; et al. Autophagy mediates temporary reprogramming and dedifferentiation in plant somatic cells. Embo J. 2020, 39, e103315. [Google Scholar] [CrossRef]
  35. Saera-Vila, A.; Kish, P.E.; Louie, K.W.; Grzegorski, S.J.; Klionsky, D.J.; Kahana, A. Autophagy regulates cytoplasmic remodeling during cell reprogramming in a zebrafish model of muscle regeneration. Autophagy 2016, 12, 1864–1875. [Google Scholar] [CrossRef] [PubMed]
  36. Wang, Y.; Zhao, Y.; Wang, B.; Han, Y.; Li, Y.; Prusky, D.; Bi, Y. Soluble sugars, organic acids and energy metabolism involved in the wound healing of muskmelons elicited by benzothiadiazole. Postharvest Biol. Technol. 2023, 199, 112277. [Google Scholar] [CrossRef]
  37. Li, K.; Liang, Y.; Xing, L.; Mao, J.; Liu, Z.; Dong, F.; Meng, Y.; Han, M.; Zhao, C.; Bao, L.; et al. Transcriptome Analysis Reveals Multiple Hormones, Wounding and Sugar Signaling Pathways Mediate Adventitious Root Formation in Apple Rootstock. Int. J. Mol. Sci. 2018, 19, 2201. [Google Scholar] [CrossRef]
  38. Jarvis, P.; Lopez-Juez, E. Biogenesis and homeostasis of chloroplasts and other plastids. Nat. Rev. Mol. Cell Biol. 2013, 14, 787–802. [Google Scholar] [CrossRef]
  39. Hirota, T.; Izumi, M.; Wada, S.; Makino, A.; Ishida, H. Vacuolar Protein Degradation via Autophagy Provides Substrates to Amino Acid Catabolic Pathways as an Adaptive Response to Sugar Starvation in Arabidopsis thaliana. Plant Cell Physiol. 2018, 59, 1363–1376. [Google Scholar] [CrossRef]
  40. Izumi, M.; Nakamura, S.; Otomo, K.; Ishida, H.; Hidema, J.; Nemoto, T.; Hagihara, S. Autophagosome development and chloroplast segmentation occur synchronously for piecemeal degradation of chloroplasts. Elife 2024, 12, RP93232. [Google Scholar] [CrossRef]
  41. Dobrenel, T.; Caldana, C.; Hanson, J.; Robaglia, C.; Vincentz, M.; Veit, B.; Meyer, C. TOR Signaling and Nutrient Sensing. Annu. Rev. Plant Biol. 2016, 67, 261–285. [Google Scholar] [CrossRef]
  42. Ananieva, E.A.; Gillaspy, G.E.; Ely, A.; Burnette, R.N.; Erickson, F.L. Interaction of the WD40 domain of a myoinositol polyphosphate 5-phosphatase with SnRK1 links inositol, sugar, and stress signaling. Plant Physiol. 2008, 148, 1868–1882. [Google Scholar] [CrossRef] [PubMed]
  43. Baena-González, E.; Rolland, F.; Thevelein, J.M.; Sheen, J. A central integrator of transcription networks in plant stress and energy signalling. Nature 2007, 448, 938–943. [Google Scholar] [CrossRef] [PubMed]
  44. Ramon, M.; Dang, T.V.T.; Broeckx, T.; Hulsmans, S.; Crepin, N.; Sheen, J.; Rolland, F. Default Activation and Nuclear Translocation of the Plant Cellular Energy Sensor SnRK1 Regulate Metabolic Stress Responses and Development. Plant Cell 2019, 31, 1614–1632. [Google Scholar] [CrossRef] [PubMed]
  45. Versluys, M.; Tarkowski, L.P.; Van den Ende, W. Fructans As DAMPs or MAMPs: Evolutionary Prospects, Cross-Tolerance, and Multistress Resistance Potential. Front. Plant Sci. 2017, 7, 2061. [Google Scholar] [CrossRef]
Figure 1. Phylogenetic analysis of ClaATGs and known ATGs in Arabidopsis (32), Oryza sativa (33), watermelon (27), and Cucumis sativusand (21). A total of 113 ATGs sequences were used to construct phylogenetic tree throughout the maximum likelihood method with 1000 repeated bootstrap tests in MEGA 10.0 software. ClaATGs are highlighted with red color, and different ATG subfamilies were covered with different colors.
Horticulturae 11 00619 g001
Figure 2. Comprehensive analysis of character of watermelon ClaATG genes family. (A) The phylogenetic tree was generated based on the full-length sequences of ClaATG proteins in watermelon. Exon-intron distribution of ClaATG genes. (B) Conserved motif in watermelon ClaATGs proteins. Ten motifs with E-value < 0.05 are presented (Figure S2). (C) Protein interaction of ClaATGs in watermelon.
Horticulturae 11 00619 g002
Figure 3. Motif position of ClaATG family (A) and expression changes of ClaATGs under different sugar treatment (B). The sequence 2000 bp upstream of ATG genes was compared by the PlantCARE database. CK: the control plants; C-ES: the control plants under 0.5% glucose treatment; Y: the etiolation plants; Y-ES: the the etiolation plants under 0.5% glucose treatment.
Horticulturae 11 00619 g003
Figure 4. Changes of expression levels of different autophagy genes in different tissues (A) and in the incision of the wound and grafted watermelon (B). Transcript levels of ClaATGs were analyzed by qRT-PCR in stem-tip, cotyledon, hypocotyl, and root. Values are means ± SD (n = 3). Wounding: the hypocotyl of ungrafted watermelon; WWS: Watermelon grafted onto watermelon, sampling scion; WWR: Watermelon grafted onto watermelon, sampling rootstock; WPS: Watermelon grafted onto pumpkin, sampling scion; WPR: Pumpkin grafted onto watermelon, sampling rootstock. DAG, days after grafting. Values are means ±SD (n = 3).
Horticulturae 11 00619 g004
Figure 5. Changes of expression levels of ClaATGs in different treatments (exogenous sugar, NAA, and 6-BA) during healing processes. WWS: Watermelon grafted onto watermelon, sampling scion; WWR: Watermelon grafted onto watermelon, sampling rootstock; WPS: Watermelon grafted onto pumpkin, sampling scion; WPR: Pumpkin grafted onto watermelon, sampling rootstock.
Horticulturae 11 00619 g005
Figure 6. Determination of physiological indexes and autophagy of grafted watermelon. (A) Phenotypic observation of grafted watermelon with different treatments 10 DAG, which showed the difference among treatments (The ruler unit is 1 cm.). (BD) Determination of chlorophyll content, survival rate, dry weight, fresh weight in grafted watermelon with different treatments 10 DAG. (E) Healing of grafted watermelon interface on the 3 and 5 DAG. (F) Changes of autophagy in grafted watermelon at different times and treatments (The ruler unit is 10 um.). (G) Changes of expression levels of ClaATG6, ClaATG8b, ClaATG8i, ClaTOR, and ClaSnRK1 in graft union formation in the watermelon/pumpkin and etiolated watermelon/pumpkin from 0 to 72 h after grafting with/without application of exogenous sugar. CK: watermelon grafted onto the pumpkin; C-ES: watermelon grafted onto the pumpkin under exogenous sugar; Y: the etiolation watermelon grafted onto the pumpkin; Y-ES: the etiolation watermelon grafted onto the pumpkin under exogenous sugars. DAG, days after grafting. HAG, hours after grafting. Error bars indicate SE (n = 3). Different letters indicate significant differences (one-way ANOVA, p < 0.05).
Horticulturae 11 00619 g006
Table 1. Physical and chemical properties of ClaATG gene family.
Gene NameGene IDORF (bp)AAMW (KDa)pIInstability IndexAliphatic IndexLocSignalPTMHs
ClaATG1aCla97C06G111650215471779.786.06unstable91.28NucleusNO0
ClaATG1bCla97C10G204720215471779.756.78unstable87.46ChloroplastNO0
ClaATG2Cla97C05G09244058231940214.865.51unstable86.57NucleusNO0
ClaATG3Cla97C06G11185094831535.544.80unstable83.49CytoplasmNO0
ClaATG5Cla97C05G092850107735840.585.00unstable92.51CytoplasmNO0
ClaATG6Cla97C06G111550153050958.236.23stable70.35NucleusNO0
ClaATG8aCla97C03G05583035711813.658.78unstable84.32CytoplasmNO0
ClaATG8bCla97C01G02158037212313.769.12unstable88.05CytoplasmNO0
ClaATG8cCla97C02G03530036011913.738.62unstable84.37CytoplasmNO0
ClaATG8dCla97C01G00415035711813.698.71stable85.93CytoplasmNO0
ClaATG8fCla97C06G11249035411713.517.89unstable82.48CytoplasmNO0
ClaATG8iCla97C09G16701035711813.856.73stable68.47NucleusNO0
ClaATG9Cla97C07G1292502628875100.986.14unstable82.00PlasmidNO5
ClaATG10Cla97C09G17111055818521.535.88unstable78.00NucleusNO0
ClaATG11Cla97C02G04006034501149129.835.57unstable82.66NucleusNO0
ClaATG12Cla97C07G1408002889510.519.21unstable88.21CytoplasmNO0
ClaATG13Cla97C01G014550193564471.209.07unstable69.21NucleusNO0
ClaATG14Cla97C11G215480143147653.618.88unstable76.43ChloroplastNO0
ClaATG16Cla97C06G127290153651156.196.17stable91.84CytoplasmNO0
ClaATG18aCla97C09G168700124241345.616.60unstable80.48CytoplasmNO0
ClaATG18bCla97C11G218570111337040.396.75unstable98.08ChloroplastNO0
ClaATG18cCla97C11G212430120039944.276.18stable88.17NucleusNO0
ClaATG18fCla97C05G096000273090998.788.34unstable86.42ChloroplastNO1
ClaATG18gCla97C09G1692902808935102.225.81unstable79.60ChloroplastNO0
ClaATG18hCla97C03G0669902964987107.015.83unstable75.73ChloroplastNO0
ClaATG101Cla97C01G01565066322025.826.15unstable92.50NucleusNO0
ClaATG27Cla97C07G13308060320022.038.77unstable97.35CytoplasmNO1
ORF: opening reading fame; AA: the numbers of amino acid residues; pI: Theoretical isoelectric point; MW: Molecule weight; Loc: Subcellular location; TMHs: Transmembrane helices.
Disclaimer/Publisher’s Note: The statements, opinions and data contained in all publications are solely those of the individual author(s) and contributor(s) and not of MDPI and/or the editor(s). MDPI and/or the editor(s) disclaim responsibility for any injury to people or property resulting from any ideas, methods, instructions or products referred to in the content.

