Article

From Sun to Snack: Different Drying Methods and Their Impact on Crispiness and Consumer Acceptance of Royal Gala Apple Snacks

by
Lisete Fernandes
1,*,
Pedro B. Tavares
1 and
Carla Gonçalves
2,3,4
1
CQ-VR Centre of Chemistry—Vila Real, UME/CIDE Electron Microscopy Unit—Innovation and Development Centre, University of Trás-os-Montes and Alto Douro, 5000-801 Vila Real, Portugal
2
CITAB—Centre for the Research and Technology of Agro-Environmental and Biological Sciences, University of Trás-os-Montes e Alto Douro, 5000-801 Vila Real, Portugal
3
Epi-Unit—Epidemiology Research Unit and Laboratory for Integrative and Translational Research in Population Health, Institute of Public Health, 4050-600 Porto, Portugal
4
RISE-Health, School of Life and Environmental Sciences, University of Trás-os-Montes and Alto Douro (UTAD), 5000-801 Vila Real, Portugal
*
Author to whom correspondence should be addressed.
Horticulturae 2025, 11(6), 610; https://doi.org/10.3390/horticulturae11060610
Submission received: 30 April 2025 / Revised: 23 May 2025 / Accepted: 28 May 2025 / Published: 29 May 2025

Abstract

:
This study explores the acoustic, mechanical and sensory characteristics of Royal Gala dried apples, with a special focus on the potential of solar drying as a sustainable processing method. Apple samples were subjected to different drying techniques, being solar dried (SDA) or oven dried (ODA), with two industrially processed commercial products (CCA—commercial apples C and CFA—commercial apples F) included. The samples were analyzed using acoustic measurements, X-ray diffraction (XRD) and sensory evaluation to assess textural properties and consumer perception. Acoustic analysis revealed that crispier samples produced louder and higher-frequency sounds upon fracture, showing strong alignment with sensory assessments. X-ray diffraction indicated an increase in crystallinity during dehydration, with a shift in the amorphous peak toward lower angles, and reduced intensity, reflecting progressive water removal. Sensory evaluation showed varying degrees of crispiness among the samples, in the following order: CFA > SDA > CCA > ODA. Consumer testing highlighted greater acceptance and consensus for SDA and ODA samples in terms of texture and overall appeal, whereas CCA and CFA received more polarized opinions. These findings demonstrate how different drying methods influence the structural and textural properties of dried apples. Solar drying was shown to be a promising sustainable alternative; as it uses a renewable energy source, it has a low operating cost and simple maintenance. It allows farmers and small producers to process their own food, adding value and reducing post-harvest losses, preserving desirable textural attributes and achieving high consumer acceptance.

1. Introduction

Drying is a complex process that involves simultaneous heat and mass transfer, supplemented by physical, chemical and phase change transformations [1].
The temperature and duration of the drying process play a crucial role in determining the quality of the final product. Typically, fruits are dried at temperatures between 50 °C and 70 °C [2], while vegetables may require slightly lower temperatures to preserve nutrients [3]. The drying time can vary from several hours to more than a day, depending on the type and size of the food and the drying method used (e.g., air drying, oven drying, or using a dehydrator) [4].
Despite its effectiveness, drying can cause some damage to food. High temperatures or prolonged drying may lead to the degradation of heat-sensitive vitamins such as vitamin C and some B vitamins. Additionally, drying can cause changes in texture, color, and flavor, which may affect consumer acceptance [5]. However, when performed carefully, drying can retain much of the food’s nutritional value while extending its shelf life [6].
In the food industry, drying is a widely used method for producing apple snacks, as it reduces logistics costs and lowers water activity [7].
Dried apple snacks have gained popularity as a convenient and nutritious alternative to traditional processed snacks. They retain the natural sweetness and beneficial nutrients of fresh apples while offering portability [8]. However, the drying process significantly alters the structural properties of apples, affecting their texture, crispness and associated sound profile. Different drying methods can lead to variations in moisture content, porosity and mechanical strength, ultimately influencing the way these snacks break and sound when bitten [9,10].
Solar dehydration stands out as a sustainable and energy-efficient technique for food preservation, such as for dehydrated apples. This method operates with renewable solar energy, reducing the consumption of non-renewable resources and minimizing the carbon footprint associated with conventional industrial processes [4]. Additionally, solar dehydration has been shown to better preserve the structural integrity and moisture balance of foods, resulting in products with a crispy texture and higher sensory acceptance by consumers [11]. In solar dehydration, temperatures typically range from 40 °C to 70 °C, depending on the design of the solar dryer, the intensity of sunlight and ambient conditions [12]. These temperatures are ideal for preserving fruits and vegetables, allowing for moisture removal without excessive nutrient loss. To achieve a crispy texture—a key factor for higher sensory acceptance—drying times must be carefully controlled. In sunny conditions, it usually takes between 6 and 10 h to dehydrate thin apple slices to a crispy state using an indirect solar dryer. Thicker slices or foods with higher moisture content may require longer. Proper air circulation and consistent temperature are essential to ensure uniform drying and to develop the desired texture that appeals to consumers [13]. Thus, plus being an eco-friendly solution, solar drying contributes to the production of high-quality fruit snacks, aligning with current demands for more sustainable and environmentally respectful agricultural practices [14].
Texture properties of food are fundamental sensory attributes that considerably influence consumer perception and acceptance [15]. Consumers often trust texture as a key quality indicator, associating specific textural characteristics with freshness, processing methods and overall product quality [16]. For instance, crispness and crunchiness in snacks are linked to freshness and desirability, whereas softness or excessive hardness may lead to negative evaluations [17].
In the case of dried apple snacks, texture is particularly important, as the dehydration process alters the cellular structure, influencing crispness, porosity and mechanical resistance [18]. The way these snacks fracture, break or produce sound upon biting directly affects consumer expectations and satisfaction [19]. Studies have shown that acoustic feedback from food can reinforce positive sensory experiences and increase perceived quality [20]. This knowledge can guide food manufacturers in optimizing drying processes to enhance the sensory appeal of their products, ensuring a desirable balance between texture, taste and overall eating experience [21].
The sensory experience of food extends beyond taste and aroma, incorporating visual, textural and auditory indications that influence consumer perception and acceptance [22]. Among these, sound plays a crucial role in shaping the perceived crispness and freshness of snacks, particularly those that rely on a crispy texture for consumer appeal. The auditory properties of food have been extensively studied in different products such has cheese [23], biscuits [24], French fries [25], bakery products [26] and apple [27,28,29], yet their impact on dried fruit snacks remains underexplored [30,31,32]. By examining the frequency and intensity of the sound produced upon biting, a correlation between acoustic properties, textural attributes and consumer acceptance is sought [33].
This study aims to compare the mechanical, acoustic and sensory characteristics of Royal Gala apples dried with solar, oven and industrially processed methods. By analyzing the acoustic properties of different drying methods, it is aimed to determine how sound contributes to the sensory experience and overall product desirability. Understanding these auditory cues could provide valuable insights and practical implications for food manufacturers in optimizing the textural and sensory qualities of dried fruit snacks, enhancing consumer satisfaction and market competitiveness.

2. Materials and Methods

2.1. Apples and Drying Process

Royal Gala apples for this study were sourced from a local market. Solar-dried samples (SDA) were prepared using a custom-built indirect cabinet solar dryer [14], with the temperature of 65 °C for 6 h, while oven-dried samples (ODA) were processed with a Captain Jerky 110 food dehydrator (Klarstein, Berlin, Germany), with the temperature of 85 °C for 4 h. Prior to each drying session, empty trays were weighed to ensure precise measurements. The preparation involved selecting, washing, coring and slicing the apples into rings using an electric slicer, maintaining a consistent thickness of approximately 3.0 ± 0.1 mm. These rings were then arranged in a single layer on the trays. During the drying process, the trays were periodically unloaded and weighed until the weight remained consistent in two consecutive measurements, indicating the end of the drying process. Weight loss values were normalized relative to the initial sample weight [34].
For comparison, two commercial products were included: CCA—commercial apples C, a store-brand snack from a major national supermarket, and CFA—commercial apples F, a specialized dried food brand, both of which explicitly list Royal Gala apples as principal ingredient. The thickness of the CCA dried snacks is similar to the SDA and ODA (1.0 ± 0.1 mm); however, the CFA samples are slightly thicker (1.5 ± 0.1 mm).
Despite the absence of information on the drying method, hot air drying continues to be the most widely adopted on an industrial scale due to its balance between cost, energy efficiency and mass production capacity [35,36,37].

2.2. Crispiness Evaluation

The crispiness parameter was evaluated using puncture tests that is a standard method to assess the textural properties of food [38]. For that purpose, the dried apple snacks were measured using a texture analyzer (TA. XTplus; Stable Micro Systems, Godalming, UK). The equipment was set with an 8 mm spherical ball probe. The heavy-duty platform was positioned in such a way that the ball probe passed centrally through the crisp support rig, which had a diameter of 1.5 cm. During the puncture test, the probe ran at a speed of 1 mm s−1 for 5 mm into the sample. The test was triggered by a force of 0.049 N. Ten measurements were performed for each drying treatment, ensuring a sufficient sample size for statistical analysis. This test measures the force required to puncture the sample, providing insights into its mechanical resistance and crispiness [10].

2.3. Sound Measurements Apparatus

The sound was acquired during the breaking of each dried sample during puncture tests, simulating one bite (Figure 1).
The technique consisted of using a microphone to capture the sound produced by the breaking of each dried snack and transferring it to a computer. The microphone was directed at a right angle to the test piece, considering the angle at which the microphone is sensitive, while the distance was standardized. The data were analyzed with the free software Audacity (Version 3.7.3) with no manipulation or filtering. Sound assessment was carried out in terms of amplitude/time plots and sound intensity and frequency analysis graphs of each sample [17].

2.4. X-Ray Diffraction

X-ray diffraction (XRD) patterns were acquired, at room temperature, by a PANalytical X’Pert Pro diffractometer, equipped with X’Celerator detector and secondary monochromator in Ꝋ/2Ꝋ Bragg–Brentano geometry. The measurements were carried out using 40 kV and 30 mA, a CuKα radiation (λꝊ1 = 1.54060 Å and λꝊ2 = 1.54443 Å), 0.017°/step, 100 s/step, in a 10–60° 2Ꝋ angular range. The resulting diffractograms were analyzed using HighScore 4.8 software through baseline and peak deconvolution.

2.5. Sensorial Analyses

The sensory evaluation of the dried apple samples was conducted following a protocol approved by the Ethics Committee of the Universidade de Trás-os-Montes e Alto Douro (Doc100-CE-UTAD-2024). A consumer study was carried out with participants recruited from the university student population, who were selected based on their interest in participating in the project. The study included 100 participants (94 Portuguese, 3 Brazilians, 2 Chinese and 1 Spanish) young adults aged 18–25 (88%) and 66% were female. All participants provided informed consent before taking part. The session began with a questionnaire collecting demographic information, such as gender and age, along with details about intolerances and allergies. The evaluations were performed in a standardized testing room (ISO 8589:2007), with each session lasting approximately 15 min.
All dried apple samples were presented at the same time on white plates divided into four sections, with each having a three-digit code (SDA, ODA, CCA and CFA). Data were collected via mobile phones using an online descriptive questionnaire (Google Forms®), which included a Check-All-That-Apply (CATA) section featuring 5 descriptors. The CATA test is a sensory evaluation method where participants are asked to check the texture attributes that apply to a given sample.
Consumers were additionally asked to rate the products based on overall liking and intention to consume using a 9-point hedonic scale (1 = “dislike extremely,” 9 = “like extremely”). To ensure accurate evaluations, participants were provided with water to refresh their palate between samples [39,40].

2.6. Statistical Analysis

The data were expressed as mean± SD (standard deviation). Significant differences (p < 0.05) were identified using a one-way analysis of variance and the unequal N Tukey post hoc test. The statistical treatments were performed using Statistica 12 software (StatSoft, Inc., Tulsa, OK, USA).

3. Results and Discussion

3.1. Drying Kinetics

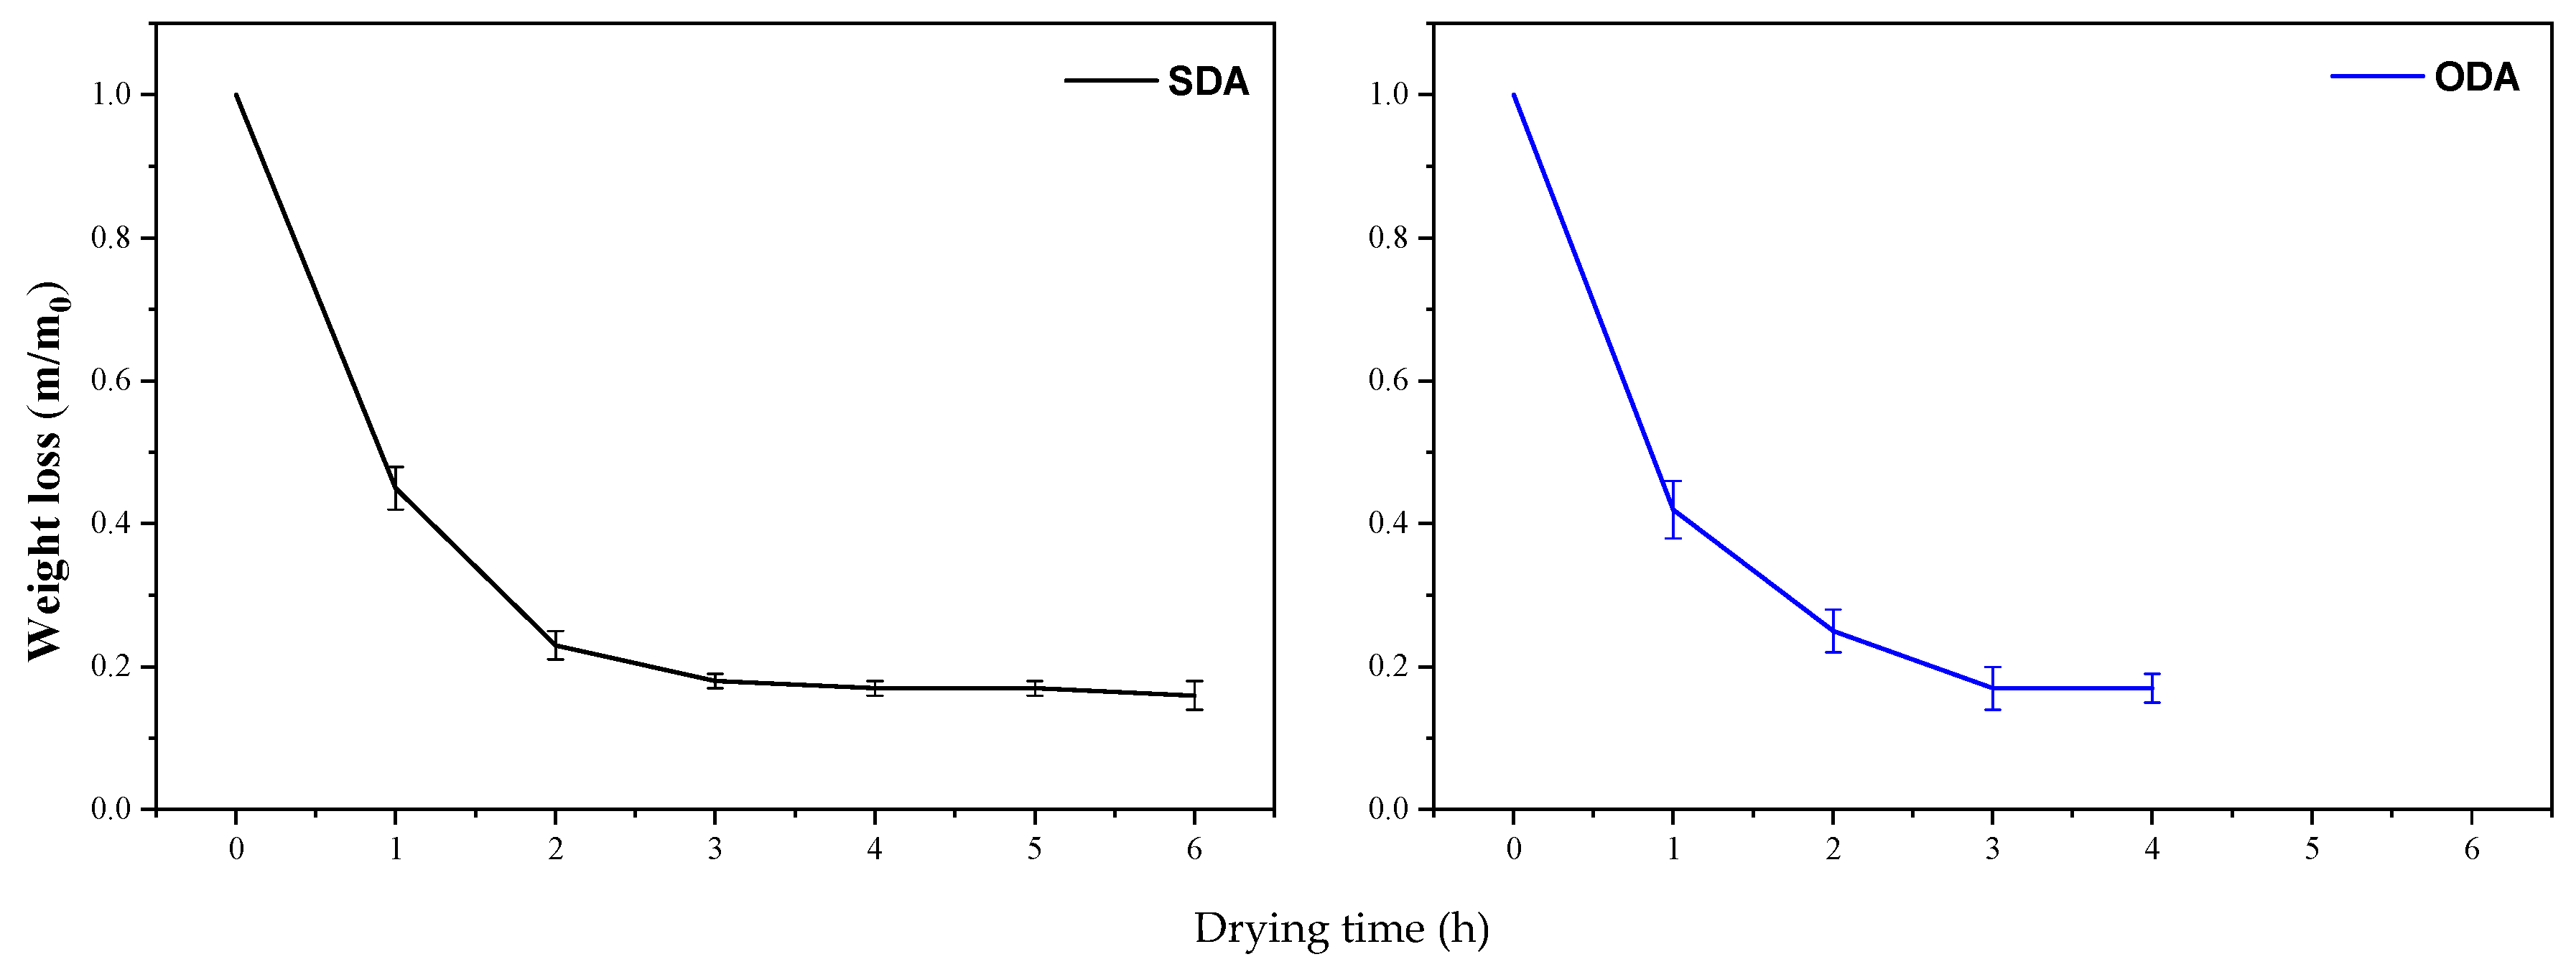
The drying kinetics curves for apple slices (SDA and ODA) are shown in Figure 2.
The graphs show the weight loss trends for solar-dried (SDA) and oven-dried (ODA) apple samples over the drying period until constant weight. Both drying methods exhibit a steep decline in weight within the first hour, indicating high moisture evaporation at the beginning of the process [41]. The trend is similar for both SDA and ODA, suggesting that the early drying phase is ruled by surface moisture removal [42,43]. Similar results were obtain in other studies of dried apple [44,45,46].
After the initial drop, the weight loss rate decreases gradually, reflecting the transition from surface moisture evaporation to water removal. By the third hour, weight loss stabilizes, indicating that most free water has been removed [47,48].
Both drying methods reach a similar final weight loss. ODA shows slightly higher moisture loss at the first hour, possibly due to temperature (approximately 85 °C for ODA samples and 65 °C for SDA samples) or the efficiency of the air circulation within the oven. Also, the total weight loss is higher in ODA samples and the drying process is quicker (6 h for SDA samples and 4 h for ODA samples before a constant weight is reached).
The drying dynamics of SDA and ODA are comparable, with both showing rapid early moisture loss followed by a slower stabilization phase. The choice between methods may depend on energy efficiency, product texture and consumer preference rather than significant differences in dehydration performance [49,50].

3.2. Crispiness

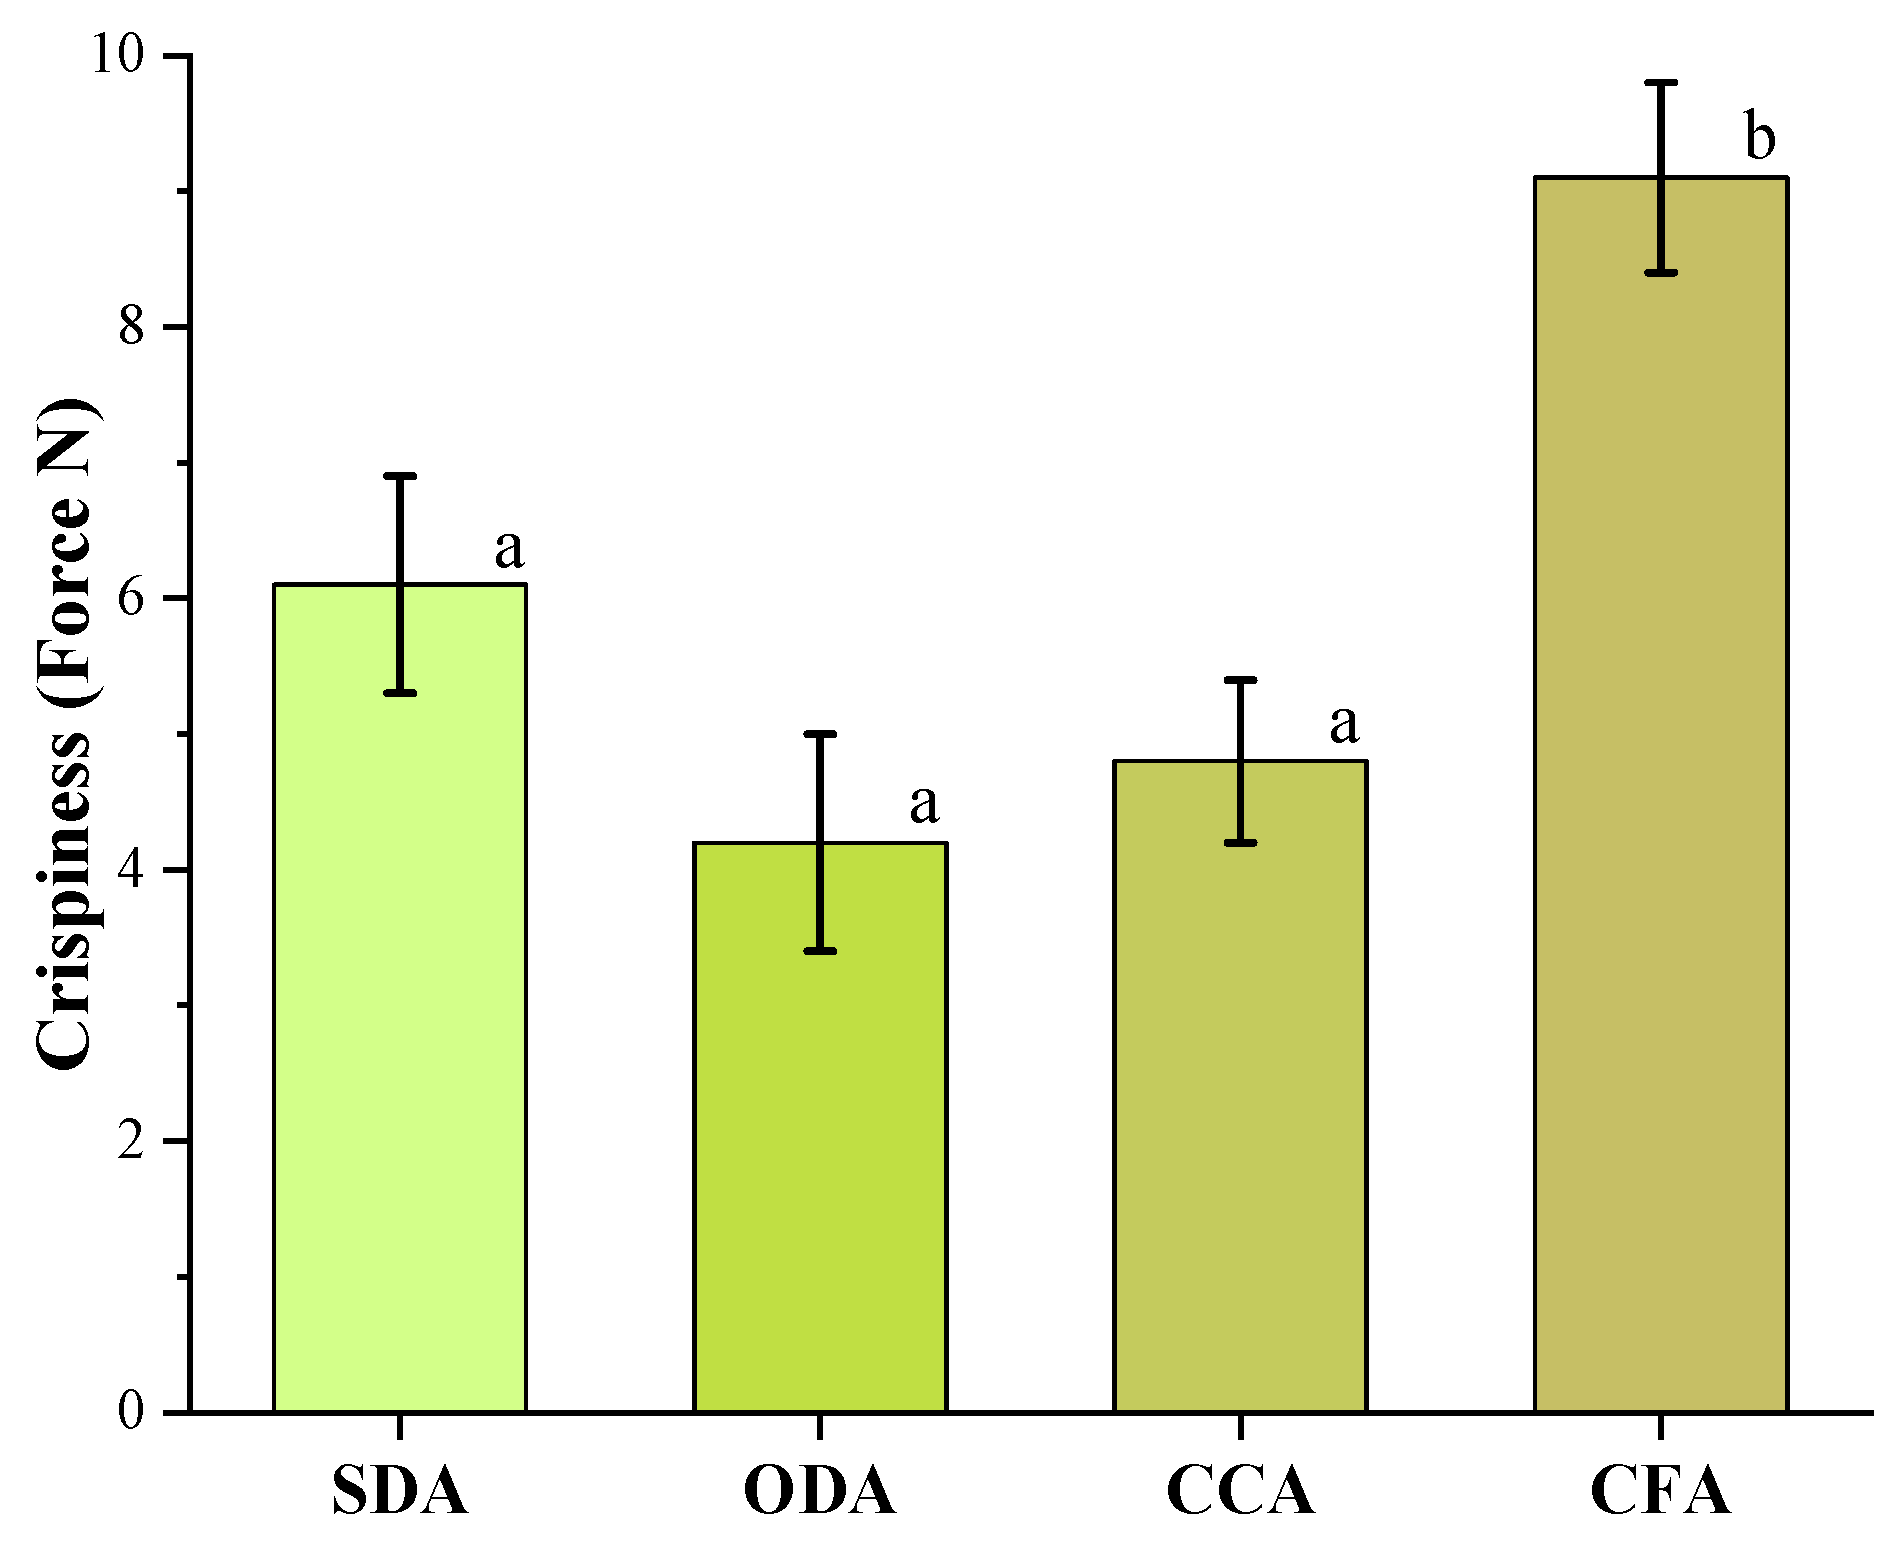
For definition, crispiness is a property that describes how a food breaks when the force that is applied exceeds the sample’s resistance. Figure 3 shows the differences in crispiness in the dried samples under study.
The average crispiness of the snacks was approximately 4, 5, 6 and 9 newtons for ODA, CCA, SDA and CFA samples, respectively.
The results indicate that SDA, ODA and CCA do not differ significantly from each other (p > 0.05), while CFA presents a significantly higher crispiness value (p < 0.05). The absence of statistical differences between SDA, ODA and CCA suggests that, despite the different drying conditions, such as temperature, the impact on final crispiness was similar. This may indicate that other factors, such as the original composition of the raw material or the storage history (in the case of CCA), had no influence on the final product. These results reinforce the idea that less controlled drying methods, such as SDA, can still produce products with acceptable textural characteristics, comparable to those obtained by more technological methods, such as ODA, and even like the commercial samples analyzed (CCA).
CFA samples were significantly (p < 0.05) crispier than those from any other drying method, suggesting that this specialized brand employs advanced drying techniques that enhance crispiness.
With the highest crispiness values, CFA snacks are the best option for consumers who prioritize crispy texture. In contrast, SDA, CCA, and ODA samples, which exhibited lower crispiness, retained higher moisture content with less structural damage, making them more suitable for those who prefer a chewier or not-so-hard texture [16].

3.3. Sound Emission Analyses

Textural properties are perceived through a combination of visual, tactile, kinesthetic and auditory sensations [51,52]. The sounds produced during food consumption are crucial sensory indicators that influence consumer perception and acceptance. Acoustic properties, such as crunchiness and crispiness, contribute to the overall eating experience and play a vital role in determining the quality of dried apple snacks [53].

3.3.1. Sound Amplitude

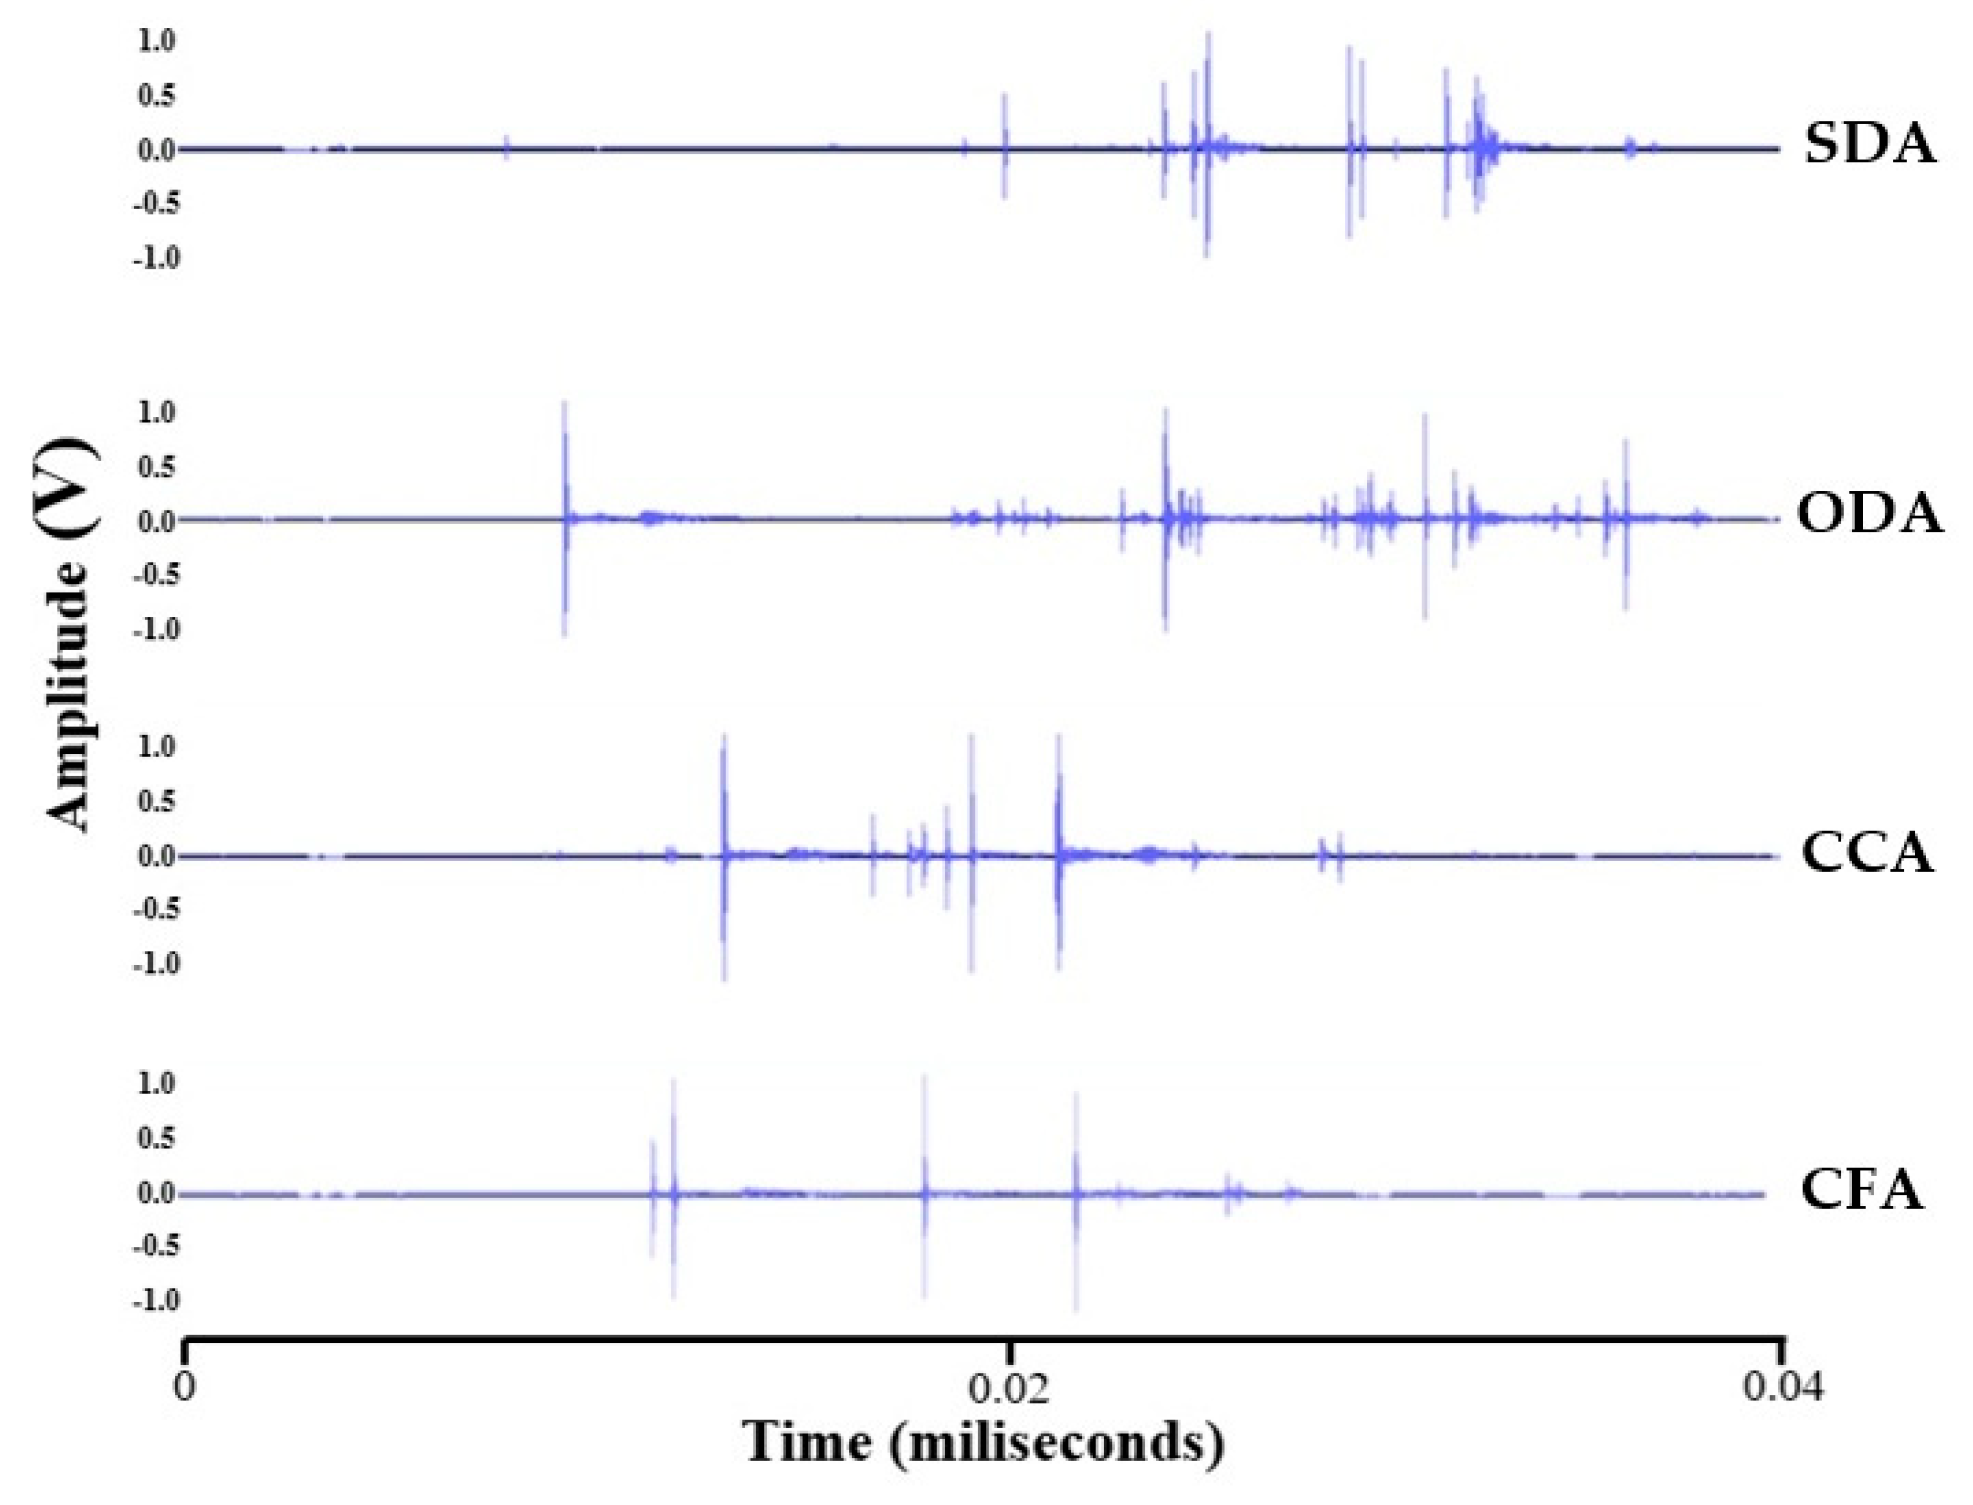
During the application of a force to a noisy product, a sound wave is produced [54]. The amplitude of displacement of the molecules is proportional to the amount of force that is applied to the sample [55]. This can be graphically illustrated by plotting the amplitude of the sound wave vs. time (Figure 4).
The amplitude represents the loudness or intensity of the sound, while the time axis shows the duration over which the sound is produced. The vertical scale (amplitude) ranges from approximately −1.0 to +1.0, likely normalized for comparison. The horizontal scale (time) is in milliseconds, showing the temporal evolution of the sound.
SDA samples have low amplitude peaks, indicating a softer, less intense sound, with short-lived sound events with minimal sustained vibrations. The low amplitude and short duration suggest that SDA samples have moderate crispiness but do not produce a very loud or prolonged sound.
ODA samples registered moderate amplitude peaks, higher than SDA but lower than CCA and CFA, with shorter bursts of sound, like SDA but slightly more pronounced. Oven-dried apples produce a louder sound compared to solar-dried apples, indicating slightly higher crispiness, but still relatively soft.
CCA samples showed higher amplitude peaks compared to SDA and ODA, suggesting a louder sound, with more sustained sound events, indicating longer-lasting vibrations. CCA dried apples exhibit greater crispiness, as evidenced by the louder and more prolonged sound.
CFA samples indicated high amplitude peaks, substantially louder than the other drying methods, with long-lasting sound events with sustained vibrations. The loudest and most prolonged sound indicates extremely high crispiness.
The results show some differences compared to the crispiness chart. The fracture sound depends on the physical characteristics of the material, like rigidity, density and cellular structure, while the crispiness is influenced by mechanical properties [17]. It involves not only the sound, but also the mechanical resistance of the food to compression and fracture, as well as the residual texture after breaking [56].
The compression and puncture testing with acoustic envelope detector (AED) [26,57,58,59] and impact testing [24,29,60] are ideal for assessing the acoustic response of food. However, it requires specialized equipment (compression/puncture tests require a texturometer and an AED) or may not provide detailed information about progressive deformation (impact testing). In line with this, some authors developed ultrasonic testing [61] and resonance frequency analysis [62] methods that are suitable for non-destructive evaluation of internal structure and material properties. These techniques are adequate for samples with relatively uniform shapes and which require precise calibration and coupling of the transducers. The most simple and practical methods for rapid quality control and product development are the drop test with sound recording [63], microphone acoustic assessment [23,25,32,64,65], used in the present study, and the use of a sound-attenuated booth [66,67]. Their limitations can be related to their lower precision and the need for data processing software.
Although the sound of breaking is often used as an indirect indicator of crispiness, they are not synonymous. A food may make a loud, crisp sound when breaking but not be perceived as “crispy” by consumers if, for example, it is too hard or produces a sticky residue in the mouth [68]. On the other hand, foods with low sound emission can be considered crispy if they have a crumbly texture that is pleasant to the palate [67].

3.3.2. Sound Frequency

Sound frequency is a fundamental characteristic in acoustics, essential for understanding the nature and impact of sound. It provides insights into the origin of sound sources, how sound propagates through different media and its effects on human perception [69]. Based on the sound frequency analysis graphs, distinct patterns can be observed for each Royal Gala apple dehydration method (Figure 5).
The x-axis represents frequency in Hertz (Hz), ranging from approximately 100 Hz to 10,000 Hz. The y-axis represents the sound level in decibels (dB), with lower values indicating lower sounds. Each spectrum shows peaks and troughs that reflect the distribution of sound energy at different frequencies.
The overall spectrum of SDA samples is relatively smooth, with moderate energy levels across mid-to-high frequencies. The presence of peaks suggests some crispiness, but the overall energy distribution is not very pronounced. There is a significant frequency peak above 10,000 Hz, indicating considerable crunchiness. The smooth transition in the curve suggests a more uniform crispiness structure.
Energy is concentrated at lower frequencies, with a gradual decline toward higher frequencies in ODA samples, which show similar behavior to that of SDA, with strong peaks at high frequencies, which also suggests, although less pronounced, a crispy texture. Small variations may indicate differences in cellular structure due to the controlled oven temperature.
More prominent peaks are seen in CCA samples with higher-frequency components (>5000 Hz), showing increased energy compared to SDA and ODA. They present a less uniform pattern, with oscillations before the main peak. This may indicate a less homogeneous texture, with variations in crispiness throughout the snack.
High-frequency components (>5000 Hz) show significantly more energy in CFA samples compared to the others, with sharp, pronounced peaks observed around 1000 Hz and 3000 Hz, that indicate very high crispiness. It has a similar behavior to CCA, but with a more defined peak pattern, which may suggest a denser microstructure.
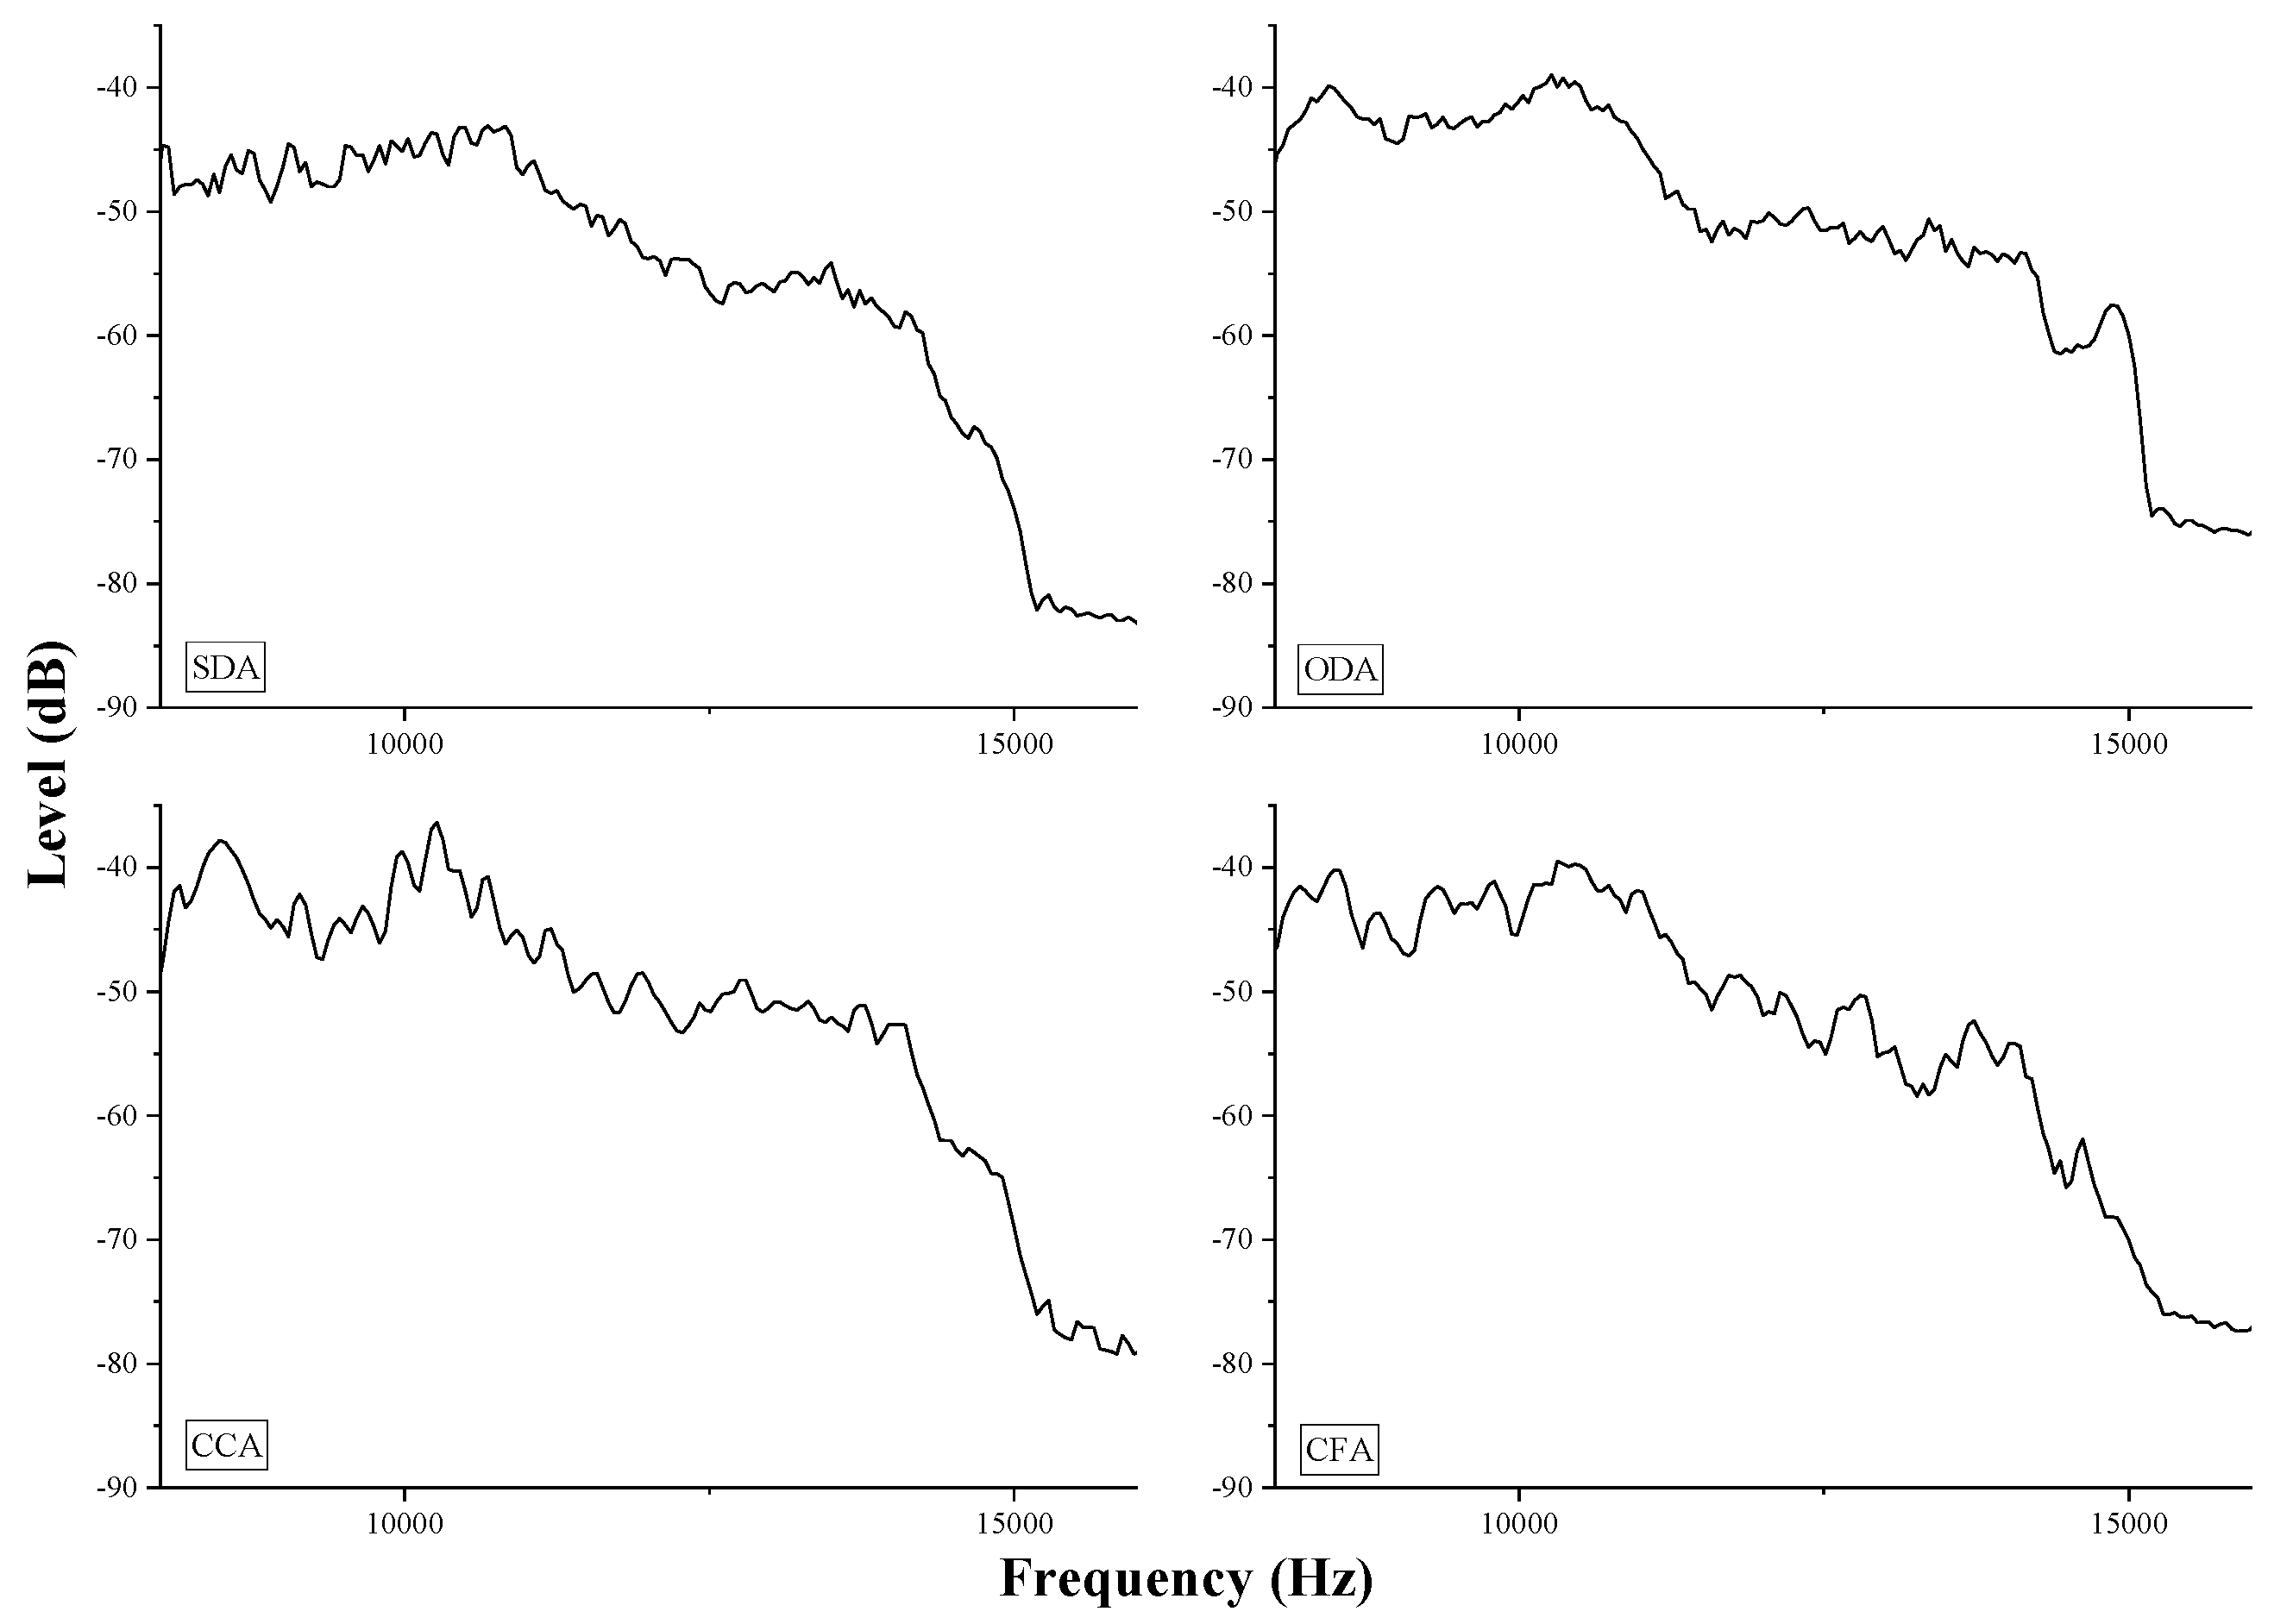
For a more detailed analysis of the crispiness of the apple snacks, once is generally associated with high-frequency sounds, typically above 5000 Hz, a closer look of the spectra at higher frequencies was made (Figure 6).
SDA and ODA samples exhibit well-defined peaks in the range of 10,000 Hz to 12,000 Hz, which suggests a crispy texture and uniform breakdown of the snack structure. They have smoother transitions at the beginning and a swift increase at the maximum peak, suggesting a sharper crisp snap. Our results are in concordance with the bibliography, once the measured frequencies range of crispy products should extend at least 12,000 Hz, according to Duizer (2001) [54]. Similar results were obtain in apple by Piazza and Giovenzana (2015) [57], Banaszak and Pawlowski (2018) [59], Marzec et al. (2009; 2010) [61,64] and Demattè et al. (2014) [70].
On the other hand, CCA and CFA samples also present peaks in the same frequency range, but with more variations before the maximum peak, indicating possible differences in texture and breakdown pattern. They show oscillations before the maximum peak, which may indicate irregular fragmentation of the snack structure, resulting in less consistent crispiness.
In terms of the impact of the final product, SDA preserves some structural integrity, resulting in moderate, high-frequency sound. The smoother drying process can better preserve the apple’s cellular structure, leading to a well-defined and crispy characteristic sound. ODA degrades the structure more, leading to lower-frequency dominance sound, similar to solar dehydration, but which may have a slightly different crispiness due to more uniform temperature and humidity control. CCA achieves moderate crispiness through controlled drying processes, and CFA uses techniques to maximize high-frequency sound, producing the crispiest texture. Industrial processing can affect the final texture, making the crispiness less uniform and variable between brands [71].
The analysis of the graphs confirms that dehydrated apple snacks present distinct crispiness patterns depending on the drying method used. SDA and ODA appear to maintain a more uniform and intense crispness, while CCA and CFA may present variations in texture.

3.4. X-Ray Analyses

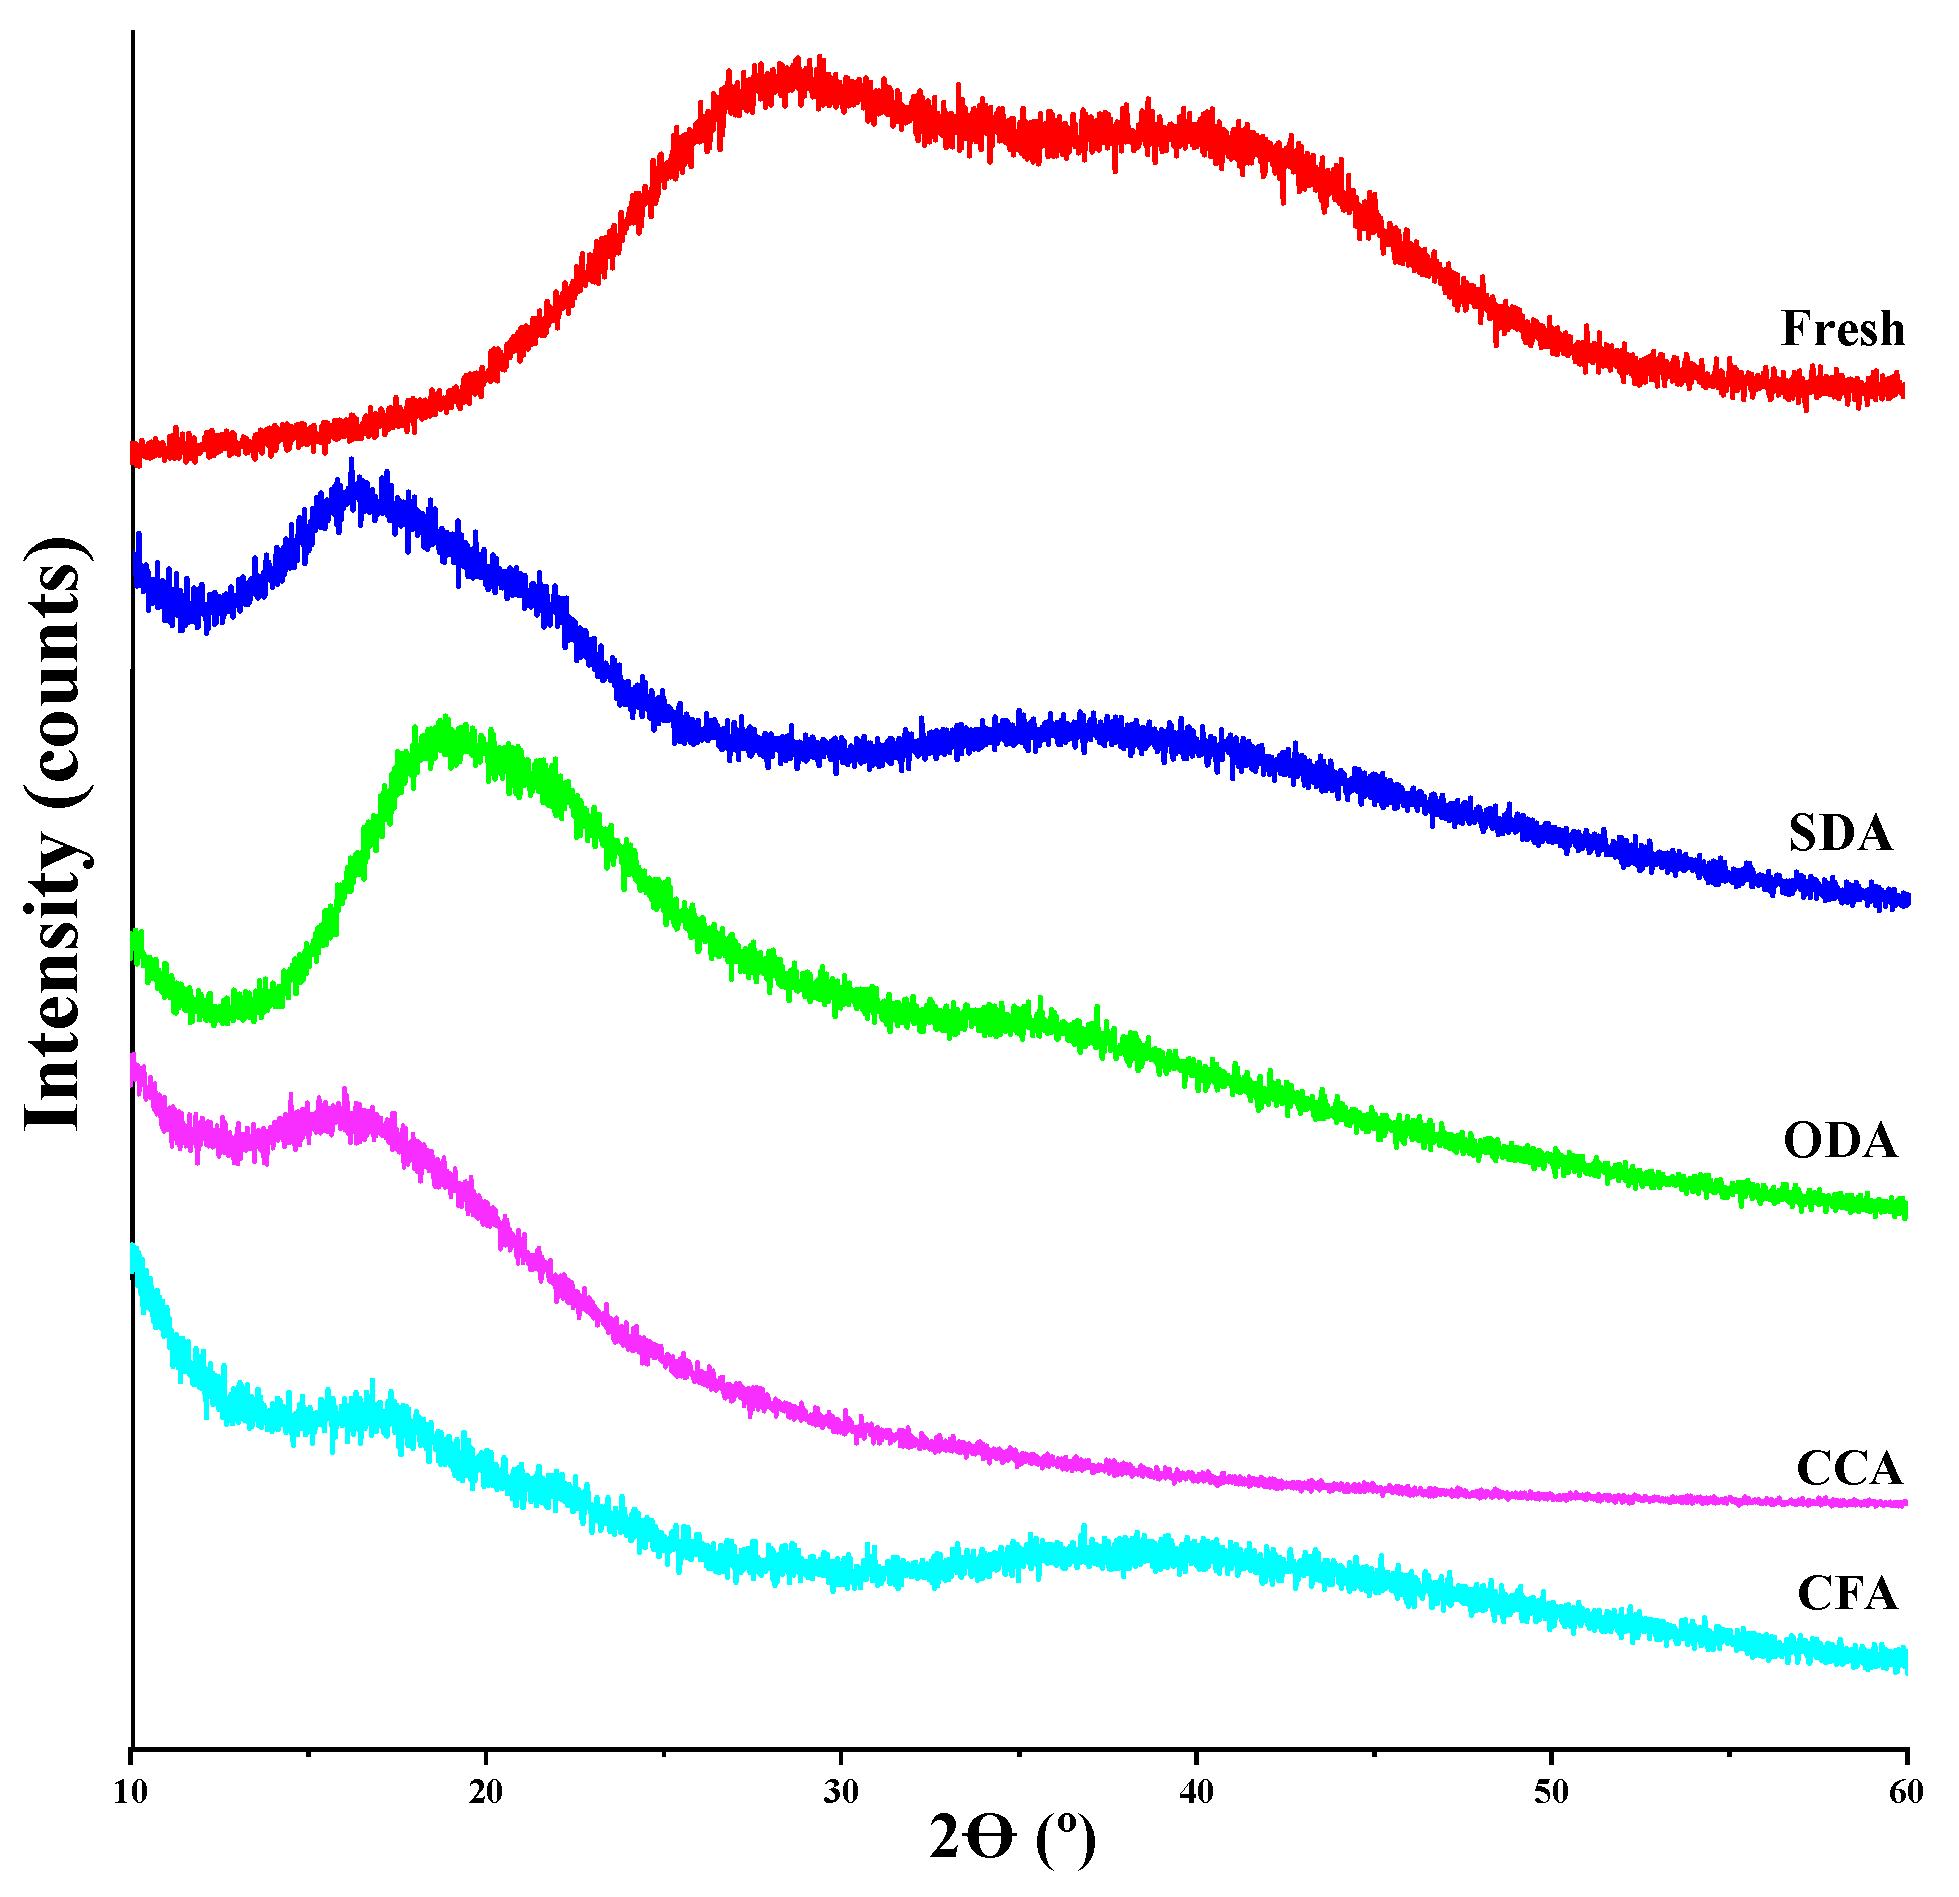
The X-ray diffraction (XRD) pattern provides insights into the structural differences among the different dried Royal ala apple samples [72]. In Figure 7, the diffraction patterns of fresh and dried apples are shown.
All diffraction patterns show broad peaks, indicating the absence of long-range order characteristic of an amorphous material. However, peak positions change substantially from fresh to dehydrated apples and smaller differences can be observed between samples with different dehydration techniques. Usually, in amorphous materials such as silica glass, two peaks can be observed [73]. The first one, around 2Ꝋ ~ 21–24° (d ~ 3.7–4.2 Å) corresponds to the scattering from the nearest neighbor lattice points, i.e., the average distance between silicon atoms. The diffractograms were analyzed using HighScore 4.8 software to deconvolute the peaks, calculating peak positions and calculate integral breadth (Table 1).
Crystallite size was calculated using the Scherrer model (Equation (1)).
t c = K λ β cos θ
where tc is the crystallite size, K = 0.9, λ = 1.5418 Å, and β is the integral breadth corrected with instrumental broadening (Equation (2)) and is the peak position (°).
β 2 = β exp 2 β i n s t 2
The XRD patterns of fresh fruit show broad amorphous peaks due to water and non-crystalline components. The long range order, in general represented by crystallite size, is very short (7 Å), typically related to highly amorphous material. The first peak is located at 27.7° (d = 3.2 Å), which could represent average distances between organic molecules (e.g., starch or sugars) intermediated by water molecules through hydrogen bonds. In dehydrated fruit the amorphous peak position shifts toward lower angles (higher d values) due to changes in intermolecular distances and diminishing intensity (the removal of water molecules replaces the stronger hydrogen bonds by weaker Van der Waals forces). Consequently, the first peaks shift towards 2θ ~ 16.1–17.5° (d ~ 5.06–5.50 Å). At the same time, sugars became more concentrated, leading to increases in the crystallinity denoted by the increase in the crystallite size (18 Å). Clearly, in CFA samples, the drying process was taken to a different level, leading to a further increase in the crystallite size (24 Å).

3.5. Relation Between Crispiness, Sound and X-Ray Diffraction

The relation between crispiness, sound and X-ray diffraction in dried apples provides valuable insights into their texture and structural properties (Table 2).
Underlying structural properties are central to understanding how crispiness, sound, and X-ray diffraction are interconnected. [74]. Crispier foods are associated with higher crystallinity, reflected in XRD peaks and produce louder, higher-pitched sounds upon fracture [75]. Generally, as drying processes reduce crystallinity, the food can become less crispy and the associated sounds become lower. However, the X-ray diffraction pattern may indicate changes in crystallinity in dehydrated apples, as the formation of more crystalline or amorphous structures is related to the degree of hydration and the transformations of cellular components during the drying process [76]. The dehydrated apple is crispy because its mechanical structure becomes rigid and brittle after the water is removed, allowing it to break abruptly and produce characteristic sounds [64]. This difference reflects the distinction between mechanical properties (perceived sensorially) and structural properties (observed by techniques such as XRD). Similar results were obtained by Bhat et al. [77] and Qadri et al. [78] in dried apple powder. There is also a strong correlation (Pearson’s r = 0.969) between crispiness (Figure 3) and crystallite size (Table 1) that is presented in Figure 8.

3.6. Sensory Analyses: CATA Tests, Quality and Acceptance

3.6.1. CATA Test

The results provided in Table 3 summarize the percentage of respondents who selected each texture attribute for the four types of dried apples.
The selected texture attributes for the CATA test were as follows: dry—the absence of moisture or juiciness; crispy—indicates a brittle, easily breakable texture with a sharp sound upon biting or crushing; soft/elastic—describes a flexible or springy texture; hard: refers to a firm, resistant texture that requires significant force to bite or crush and firm—indicates a solid, compact texture but not as extreme as “hard”.
In relation to dryness, CFA has the highest percentage (51%) for the “dry” attribute, indicating that it is perceived as the driest among the samples. ODA and CCA follow closely, suggesting they are also relatively dry. SDA has the lowest percentage (30%), implying it retains more moisture compared to the others. The crispy parameter reveals that ODA has the highest percentage (84%) for the “crispy” attribute, indicating it is perceived as the crunchiest or most brittle. CFA has 80%, suggesting it also has a very crispy texture. SDA and CCA have lower percentages, at 73% and 63%, respectively, indicating they are less crispy compared to ODA and CFA. Considering the soft/elastic factor, CCA has the highest percentage (24%), suggesting it retains some flexibility or springiness. SDA, ODA and CFA have much lower percentages (14%, 9% and 10%, respectively), indicating they are predominantly hard or brittle rather than soft or elastic. In terms of hardness, CFA has the highest percentage (31%), indicating that it is perceived as the firmest or most resistant to biting. ODA follows closely with 29%, suggesting it is also quite hard. SDA and CCA have lower percentages (20% and 22%, respectively), indicating they are less hard compared to ODA and CFA. In firmness, ODA has the highest percentage (36%), indicating it is perceived as the most solid or compact. SDA registered 34%, suggesting it is also relatively firm. CCA and CFA have lower percentages (26% and 27%, respectively), indicating they are slightly less firm compared to SDA and ODA.
Summary, the CATA test results provide insights into how consumers perceive the texture of the dried apples, based on different drying methods. SDA balances crispiness and firmness, providing a moderate texture. ODA is characterized by high crispiness and hardness, making it ideal for those who prefer a very crunchy texture. CCA is the most flexible and least dry, appealing to those who prefer a softer texture. CFA is extremely dry and hard, offering a distinct texture profile.

3.6.2. Texture Evaluation

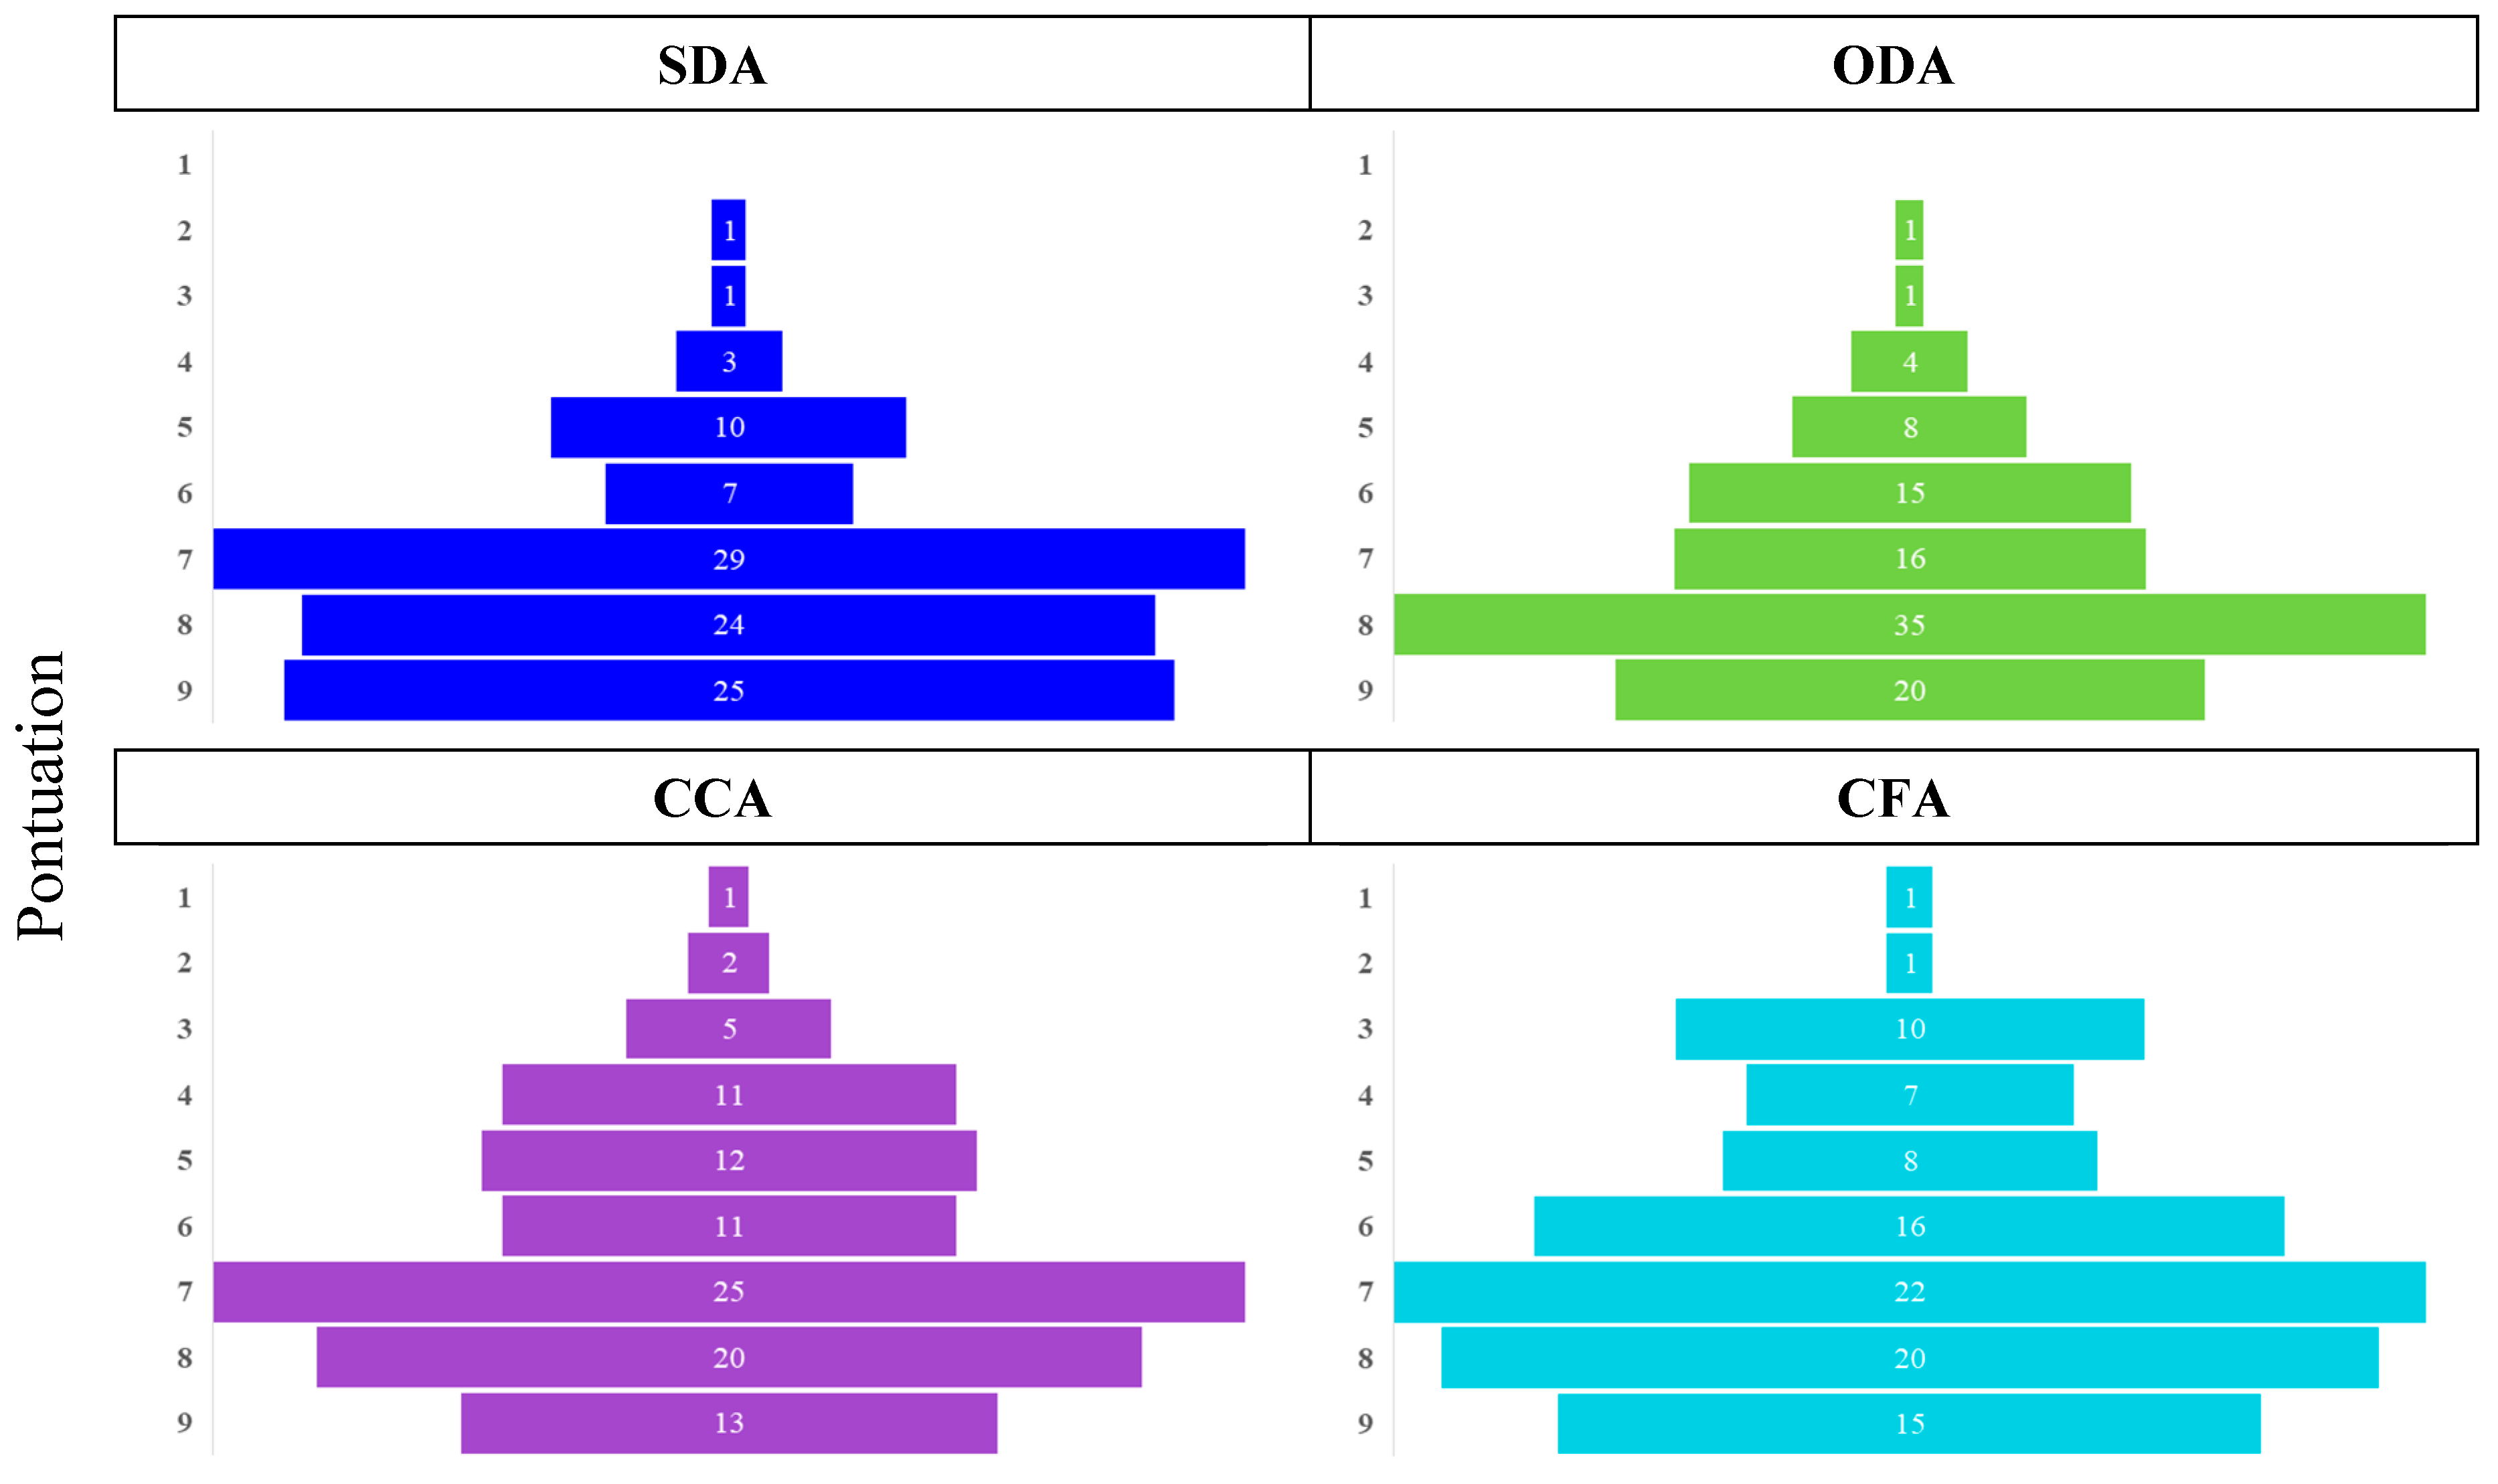
The provided funnel graphs represent the results of hedonic tests regarding the texture of dried apples using a 9-point scale (1 = extreme dislike, 9 = like extremely much) (Figure 9).
The analysis of the funnel plots reveals that the SDA and ODA samples present predominantly high evaluations, concentrated between 7 and 9, with greater consistency in SDA, while ODA shows slight variability in opinions. CCA samples exhibit a more uniform distribution, with medium scores (4 to 6) being more frequent, indicating less emphasis on texture in comparison to the other samples. CFA, on the other hand, resembles ODA, with scores also concentrated in the upper range, but less frequently in the maximum values (9). In terms of overall average, SDA and ODA lead as the preferred ones, followed by CFA, while CCA demonstrates less positive consensus among participants.
The statistical analyses showed that SDA samples had the highest mean ± SD (7.20 ± 1.71), followed by ODA (7.06 ± 1.46) and CCA (7.13 ± 2.14). The CFA samples had the lowest mean ± SD (6.54 ± 1.89). The CFA samples are significantly different (p < 0.05) from the others.
This analysis highlights the importance of drying methods in consumers’ perception of texture in dried apples. Solar-dried apples were the most favored by participants, with the strongest consensus and highest scores. The oven-dried apples (ODA) were also highly appreciated, closely following SDA in terms of appeal. CCA samples showed the most variability in participant opinions, suggesting they may not meet the same texture standards as the other options and CFA offered good texture but did not stand out as distinctly as SDA or ODA. The texture appears to be well-liked, but it does not match the strong consensus seen by SDA.

3.6.3. Overall Quality

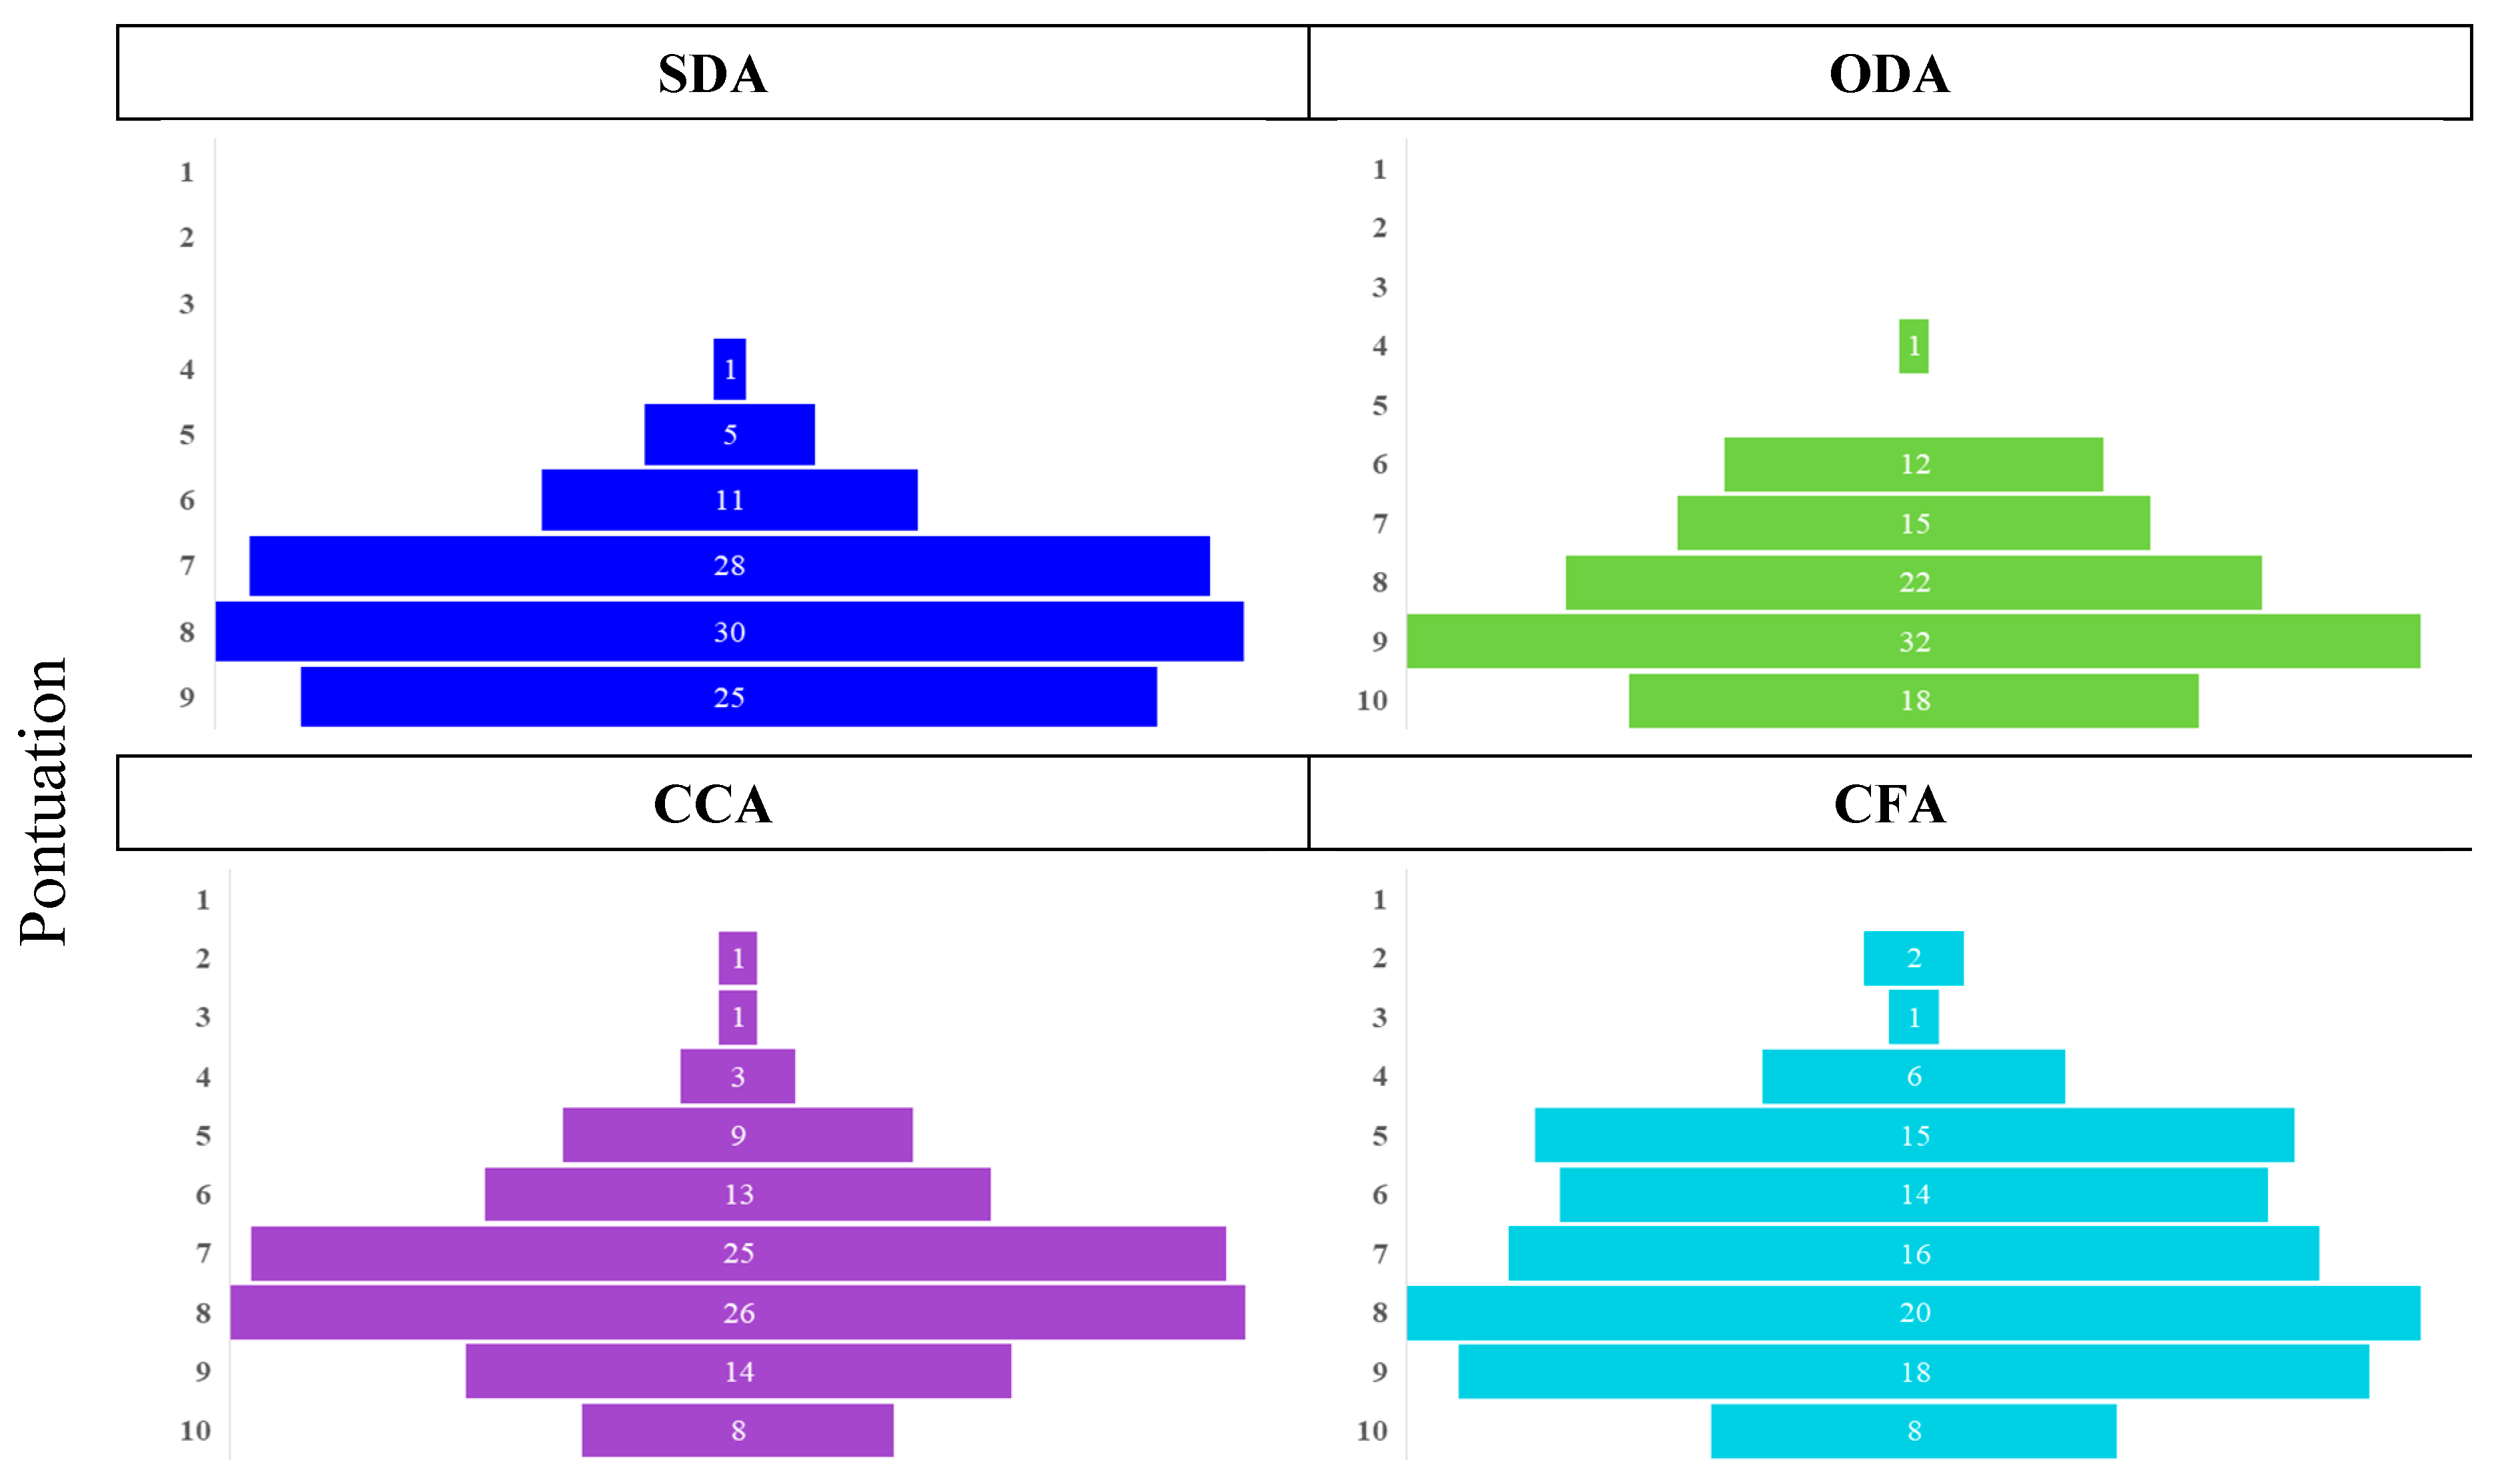
The provided funnel graphs represent the results of hedonic tests evaluating the overall quality of dried apples using a 9-point scale (1 = extreme dislike, 9 = like extremely much) (Figure 10).
The analysis reveals that SDA and ODA have scores concentrated in the high range (7–9), with SDA showing the greatest consensus (8 and 9) and ODA following behind but with slight dispersion. CCA is more evenly distributed, with more average ratings (4–6) and less overall prominence. CFA is concentrated in the high scores (6–9) but not as much as SDA or ODA. On average, SDA leads as the highest rated, followed by ODA, while CFA is consistent but garners less enthusiasm and CCA shows greater variability and lower consensus.
The statistical analyses showed that SDA samples had the highest mean ± SD (7.07 ± 1.24), followed by ODA (6.58 ± 1.43) and CCA (6.27 ± 1.55). The CFA samples had the lowest mean ± SD (5.04 ± 1.84). There are no significant differences between the ODA and CCA samples. However, the SDA samples show significant differences (p < 0.05) compared to all other samples, being associated with the highest acceptance, while the CFA samples show significant differences linked to the lowest acceptance.
The best overall quality was registered in SDA samples, which were the most favored by participants, with the strongest consensus and highest scores. ODA samples were also highly appreciated, closely following SDA in terms of appeal. In turn, CCA samples showed the most variability in participant opinions, suggesting they may not meet the same quality standards as the other options. The CFA samples offered good overall quality, but not as distinctly as SDA or ODA.

3.6.4. Acceptance of the Snacks Under Study

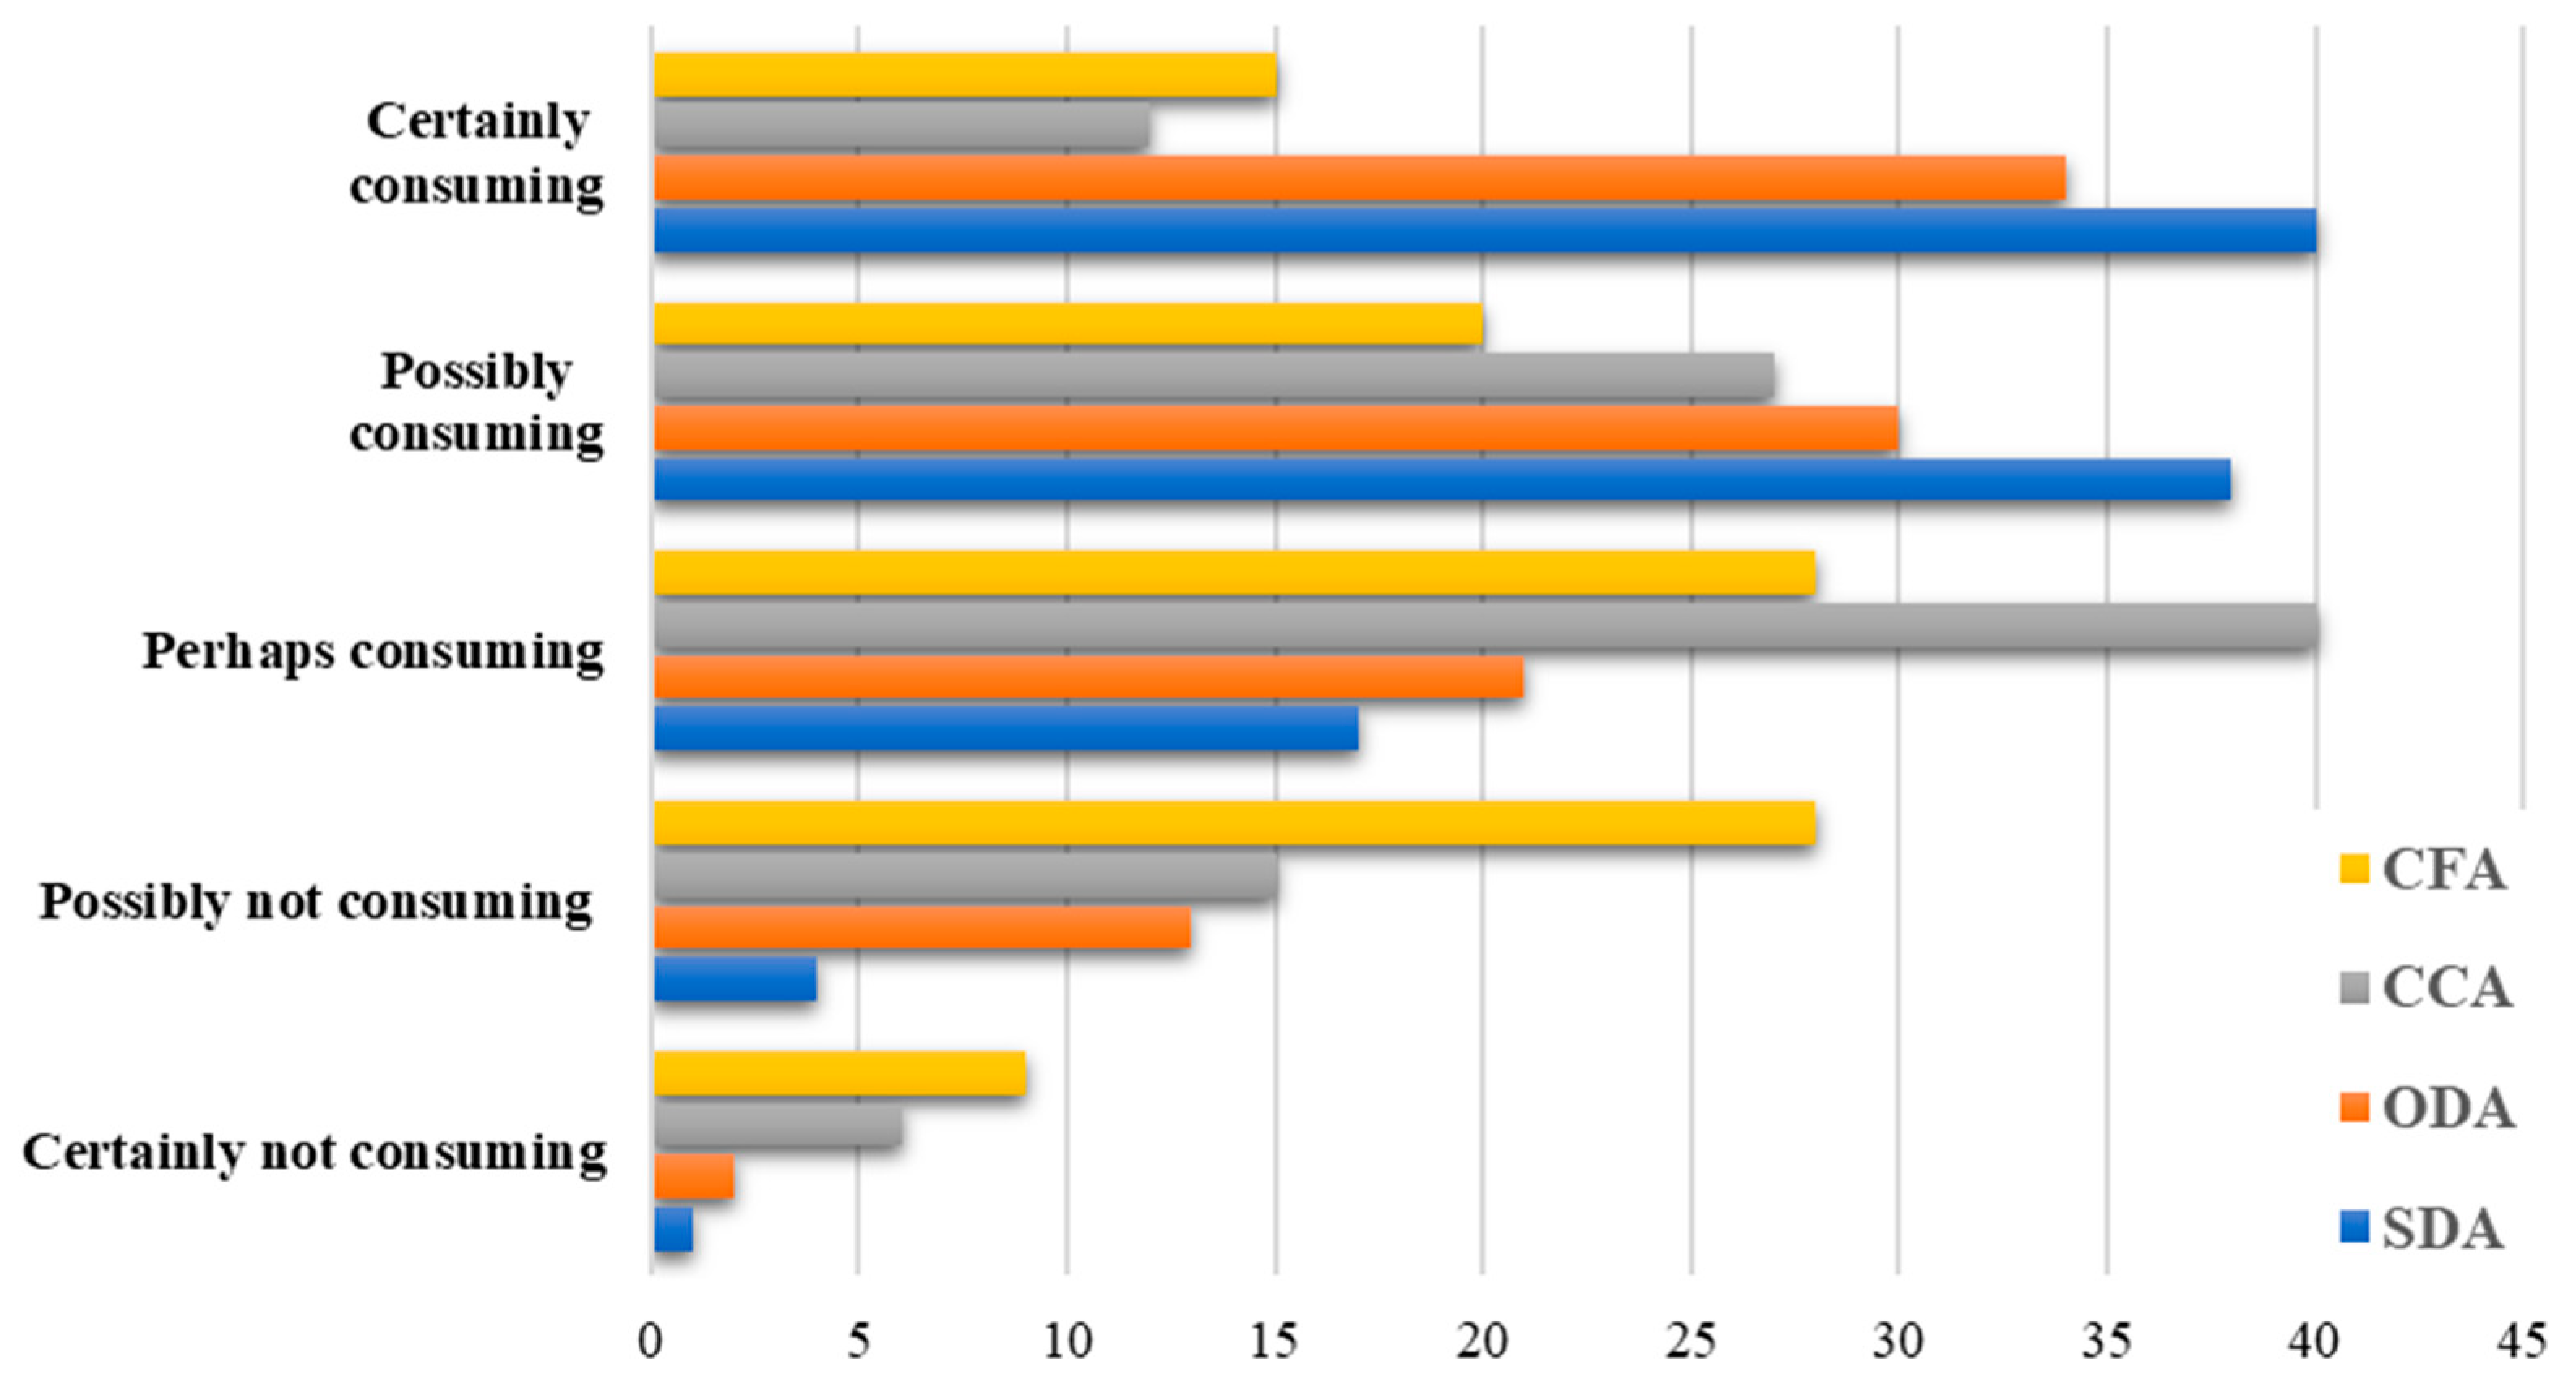
The acceptability of the different types of dried apples based on participants’ responses to their overall quality were assessed. The categories of acceptance were as follows: certainly consuming, possibly consuming, perhaps consuming, possibly not consuming and certainly not consuming. Each category represents how likely participants are to consume each type of dried apple, with higher values indicating stronger acceptance (Figure 11).
SDA samples had the highest acceptance across all categories; 40% of consumers considers that would “certainly consume” this product. This indicates strong and consistent acceptance of solar dried apples. On the other hand, the commercial samples, CCA and CFA, showed the lowest acceptance compared to the other options.

4. Conclusions

The research conducted demonstrated that the drying method influences mechanical, acoustic and sensory properties of dried apples. Acoustic measurements showed that not only does the crispiness parameter cause louder, higher-pitched sounds during fracture, but it is highly related with physical properties.
X-ray diffraction (XRD) analysis highlighted the transition from a short-range molecular order, water mediated, controlled by hydrogen bonds, to a longer molecular order in dehydrated samples. The amorphous peak position shift toward lower angles and diminish in intensity due to water removal and increased crystallinity during dehydration.
Sensory evaluations showed that dried apples retained varying degrees of crispiness, with solar-dried (SDA) and oven-dried (ODA) samples exhibiting superior textural qualities compared to industrially processed alternatives (CCA and CFA). In both overall quality and consumers’ acceptance, the most preferable samples were SDA, followed by ODA.
Specifically, SDA relies on renewable solar energy, which significantly reduces carbon emissions compared to industrial drying methods such as CCA and CFA that depend on fossil fuels or high-consumption electric systems. According to the bibliography, industrial drying can emit approximately 1.5–3.0 kg CO2 per kg of dried product, whereas SDA has near-zero operational emissions. Despite its lower energy input, SDA was shown to preserve superior textural properties—including crispness and fracture acoustics—when compared to industrial alternatives, as evidenced by sensory, mechanical, and XRD analyses. This dual benefit positions SDA not only as a more environmentally friendly option but also as a method capable of maintaining key sensory attributes that influence consumer acceptance.
These results underscore the importance of drying techniques in preserving desirable textural attributes, offering advantages in maintaining consumer appeal. Sensory tests confirmed a strong correlation between perceived crispiness, acoustic properties and drying methods, highlighting the role of both structural integrity and auditory feedback in consumer preferences.
This study provides a comprehensive analysis of the structural, mechanical and sensory properties of dried apples, emphasizing the impact of drying methods on their quality, ultimately improving their marketability and consumer satisfaction.

Author Contributions

Conceptualization: P.B.T., C.G. and L.F.; investigation: L.F.; resources P.B.T. and C.G.; formal analysis: P.B.T.; methodology, validation and review: L.F., C.G. and P.B.T.; original draft preparation: L.F. All authors have read and agreed to the published version of the manuscript.

Funding

This research received no external funding.

Informed Consent Statement

Informed consent for participation was obtained from all subjects involved in the study.

Data Availability Statement

The original contributions presented in this study are included in the article. Further inquiries can be directed to the corresponding author.

Acknowledgments

The authors would like to acknowledge CIDE-UME for the XRD analyses and CQ-VR.

Conflicts of Interest

The authors declare that they have no known competing financial interests or personal relationships that could have appeared to influence the work reported in this paper.

References

  1. Zhou, L.; Wang, X.; Bi, J.; Liu, X.; Yi, J.; Wu, X. Effect of different moisture equilibration process on the quality of apple chips dried by instant controlled pressure drop (dic)-assisted hot air drying. J. Food Process. Preserv. 2017, 42, e13316. [Google Scholar] [CrossRef]
  2. Pateiro, M.; Vargas-Ramella, M.; Franco, D.; da Cruz, A.G.; Zengin, G.; Kumar, M.; Dhama, K.; Lorenzo, J.M. The role of emerging technologies in the dehydration of berries: Quality, bioactive compounds, and shelf life. Food Chem. X 2022, 16, 100465. [Google Scholar] [CrossRef]
  3. Sablani, S.S. Drying of fruits and vegetables: Retention of nutritional/functional quality. Dry. Technol. 2006, 24, 123–135. [Google Scholar] [CrossRef]
  4. Fernandes, L.; Tavares, P.B. A Review on Solar Drying Devices: Heat Transfer, Air Movement and Type of Chambers. Solar 2024, 4, 15–42. [Google Scholar] [CrossRef]
  5. Guiné, R.P.F. The Drying of Foods and Its Effect on the Physical-Chemical, Sensorial and Nutritional Properties. ETP Int. J. Food Eng. 2018, 4, 93–100. [Google Scholar] [CrossRef]
  6. Siddiqui, S.A.; Ucak, I.; Jain, S.; Elsheikh, W.; Redha, A.A.; Kurt, A.; Toker, O.S. Impact of drying on techno-functional and nutritional properties of food proteins and carbohydrates—A comprehensive review. Dry. Technol. 2024, 42, 592–611. [Google Scholar] [CrossRef]
  7. Omolola, A.O.; Jideani, A.I.O.; Kapila, P.F. Quality properties of fruits as affected by drying operation. Crit. Rev. Food Sci. Nutr. 2015, 57, 95–108. [Google Scholar] [CrossRef]
  8. Ghinea, C.; Prisacaru, A.E.; Leahu, A. Physico-Chemical and Sensory Quality of Oven-Dried and Dehydrator-Dried Apples of the Starkrimson, Golden Delicious and Florina Cultivars. Appl. Sci. 2022, 12, 2350. [Google Scholar] [CrossRef]
  9. Radojčin, M.; Pavkov, I.; Kovačević, D.B.; Putnik, P.; Wiktor, A.; Stamenković, Z.; Kešelj, K.; Gere, A. Effect of selected drying methods and emerging drying intensification technologies on the quality of dried fruit: A review. Processes 2021, 9, 132. [Google Scholar] [CrossRef]
  10. Fernandes, L.; Fernandes, J.R.; Nunes, F.M.; Tavares, P.B. Effect of drying temperature and storage time on the crispiness of homemade apple snacks. J. Sci. Food Agric. 2023, 104, 916–931. [Google Scholar] [CrossRef]
  11. El-Mesery, H.S.; El-Seesy, A.I.; Hu, Z.; Li, Y. Recent developments in solar drying technology of food and agricultural products: A review. Renew. Sustain. Energy Rev. 2022, 157, 112070. [Google Scholar] [CrossRef]
  12. Margarita, C.T.; Beatriz, C.T.; Viviana, M.M.E.; Carlos, O.S.J. Technical and Experimental Study of the Solar Dehydration of the Moringa Leaf and Its Potential Integration to the Sustainable Agricultural Industry. Eur. J. Sustain. Dev. 2018, 7, 65–73. [Google Scholar] [CrossRef]
  13. Petikirige, J.; Karim, A.; Millar, G. Effect of drying techniques on quality and sensory properties of tropical fruits. Int. J. Food Sci. Technol. 2022, 57, 6963–6979. [Google Scholar] [CrossRef]
  14. Fernandes, L.; Fernandes, J.R.; Tavares, P.B. Design of a Friendly Solar Food Dryer for Domestic Over-Production. Solar 2022, 2, 495–508. [Google Scholar] [CrossRef]
  15. Appiani, M.; Cattaneo, C.; Laureati, M. Sensory properties and consumer acceptance of plant-based meat, dairy, fish and eggs analogs: A systematic review. Front. Sustain. Food Syst. 2023, 7, 1268068. [Google Scholar] [CrossRef]
  16. Jeltema, M.; Beckley, J.; Vahalik, J. Model for understanding consumer textural food choice. Food Sci. Nutr. 2015, 3, 202–212. [Google Scholar] [CrossRef]
  17. Saeleaw, M.; Schleining, G. A review: Crispness in dry foods and quality measurements based on acoustic-mechanical destructive techniques. J. Food Eng. 2011, 105, 387–399. [Google Scholar] [CrossRef]
  18. Kahraman, O.; Malvandi, A.; Vargas, L.; Feng, H. Drying characteristics and quality attributes of apple slices dried by a non-thermal ultrasonic contact drying method. Ultrason. Sonochem. 2021, 73, 105510. [Google Scholar] [CrossRef]
  19. Drake, M.; Watson, M.; Liu, Y. Sensory Analysis and Consumer Preference: Best Practices. Annu. Rev. Food Sci. Technol. 2023, 14, 427–448. [Google Scholar] [CrossRef]
  20. Zampini, M.; Spence, C. Assessing the role of sound in the perception of food and drink. Chemosens. Percept. 2010, 3, 57–67. [Google Scholar] [CrossRef]
  21. Michel, M.; Eldridge, A.L.; Hartmann, C.; Klassen, P.; Ingram, J.; Meijer, G.W. Benefits and challenges of food processing in the context of food systems, value chains and sustainable development goals. Trends Food Sci. Technol. 2024, 153, 104703. [Google Scholar] [CrossRef]
  22. Kamei, M.; Nishibe, M.; Araki, R.; Kohyama, K.; Kusakabe, Y. Effect of texture preference on food texture perception: Exploring the role of matching food texture and preference. Appetite 2023, 192, 107078. [Google Scholar] [CrossRef] [PubMed]
  23. Arimi, J.; Duggan, E.; O’sullivan, M.; Lyng, J.; O’riordan, E. Crispiness of a microwave-expanded imitation cheese: Mechanical, acoustic and sensory evaluation. J. Food Eng. 2012, 108, 403–409. [Google Scholar] [CrossRef]
  24. Maruyama, T.T.; Arce, A.I.C.; Ribeiro, L.P.; Costa, E.J.X. Time-frequency analysis of acoustic noise produced by breaking of crisp biscuits. J. Food Eng. 2008, 86, 100–104. [Google Scholar] [CrossRef]
  25. Sanz, T.; Primo-Martín, C.; van Vliet, T. Characterization of crispness of French fries by fracture and acoustic measurements, effect of pre-frying and final frying times. Food Res. Int. 2007, 40, 63–70. [Google Scholar] [CrossRef]
  26. Piazza, L.; Gigli, J.; Benedetti, S. Study of structure and flavour release relationships in low moisture bakery products by means of the acoustic-mechanical combined technique and the electronic nose. J. Cereal Sci. 2008, 48, 413–419. [Google Scholar] [CrossRef]
  27. Grimi, N.; Mamouni, F.; Lebovka, N.; Vorobiev, E.; Vaxelaire, J. Impact of apple processing modes on extracted juice quality: Pressing assisted by pulsed electric fields. J. Food Eng. 2011, 103, 52–61. [Google Scholar] [CrossRef]
  28. Costa, F.; Cappellin, L.; Fontanari, M.; Longhi, S.; Guerra, W.; Magnago, P.; Gasperi, F.; Biasioli, F. Texture dynamics during postharvest cold storage ripening in apple (Malus×domestica Borkh.). Postharvest Biol. Technol. 2012, 69, 54–63. [Google Scholar] [CrossRef]
  29. Shmulevich, I.; Galili, N.; Howarth, M. Nondestructive dynamic testing of apples for firmness evaluation. Postharvest Biol. Technol. 2003, 29, 287–299. [Google Scholar] [CrossRef]
  30. Spence, C. Eating with our ears: Assessing the importance of the sounds of consumption on our perception and enjoyment of multisensory flavour experiences. Flavour 2015, 4, 3. [Google Scholar] [CrossRef]
  31. Reinoso-Carvalho, F.; Janice Wang, Q. Extrinsic Auditory Contributions to Food Perception. Multisens. Res. 2019, 32, 275–318. [Google Scholar]
  32. Aboonajmi, M.; Jahangiri, M.; Hassan-Beygi, S.R. A Review on Application of Acoustic Analysis in Quality Evaluation of Agro-food Products. J. Food Process. Preserv. 2015, 39, 3175–3188. [Google Scholar] [CrossRef]
  33. Dias-Faceto, L.S.; Salvador, A.; Conti-Silva, A.C. Acoustic settings combination as a sensory crispness indicator of dry crispy food. J. Texture Stud. 2019, 51, 232–241. [Google Scholar] [CrossRef] [PubMed]
  34. JECFA; FAO; WHO. Combined Compendium of Food Additive Specifications—Analytical Methods, Test Procedures and Laboratory Solutions Used by and Referenced in the Food Additive Specification; Food & Agriculture Org.: Rome, Italy, 2005; Volume 4.
  35. Murugan, P.; Dhanushkodi, S.; Sudhakar, K.; Wilson, V.H. Industrial and small-scale biomass dryers: An overview. Energy Eng. J. Assoc. Energy Eng. 2021, 118, 435–446. [Google Scholar] [CrossRef]
  36. Yudhistira, B.; Adi, P.; Mulyani, R.; Chang, C.; Gavahian, M.; Hsieh, C. Achieving sustainability in heat drying processing: Leveraging artificial intelligence to maintain food quality and minimize carbon footprint. Com. Rev. Food Sci. Food Saf. 2024, 23, e13413. [Google Scholar] [CrossRef]
  37. Lewicki, P.P. Design of hot air drying for better foods. Trends Food Sci. Technol. 2006, 17, 153–163. [Google Scholar] [CrossRef]
  38. Liu, Y.-X.; Cao, M.-J.; Liu, G.-M. Texture Analyzers for Food Quality Evaluation; Elsevier Inc.: Amsterdam, The Netherlands, 2019. [Google Scholar]
  39. Dooley, L.; Lee, Y.-S.; Meullenet, J.-F. The application of check-all-that-apply (CATA) consumer profiling to preference mapping of vanilla ice cream and its comparison to classical external preference mapping. Food. Qual. Prefer. 2010, 21, 394–401. [Google Scholar] [CrossRef]
  40. Zhu, Y.; Wang, S.; Zhu, B.; Wang, C.; Li, J.; Liu, Y.; Jia, Y.; Zhu, L. Relationship between consumer acceptance, sensory characteristics, and physicochemical characteristics of ‘Fuji’ apples from different origins. J. Food Sci. 2024, 89, 7944–7957. [Google Scholar] [CrossRef]
  41. Massei, A.; Falco, N.; Fissore, D. NIR-Based Real-Time Monitoring of Freeze-Drying Processes: Application to Fault and Endpoint Detection. Processes 2025, 13, 452. [Google Scholar] [CrossRef]
  42. Zeng, Z.; Han, C.; Wang, Q.; Yuan, H.; Zhang, X.; Li, B. Analysis of drying characteristic, effective moisture diffusivity and energy, exergy and environment performance indicators during thin layer drying of tea in a convective-hot air dryer. Front. Sustain. Food Syst. 2024, 8, 1371696. [Google Scholar] [CrossRef]
  43. Veleșcu, I.D.; Rațu, R.N.; Arsenoaia, V.-N.; Roșca, R.; Cârlescu, P.M.; Țenu, I. Research on the Process of Convective Drying of Apples and Apricots Using an Original Drying Installation. Agriculture 2023, 13, 820. [Google Scholar] [CrossRef]
  44. Pinheiro, M.C.; Castro, L.M. Effective moisture diffusivity prediction in two Portuguese fruit cultivars (Bravo de Esmolfe apple and Madeira banana) using drying kinetics data. Heliyon 2023, 9, e17741. [Google Scholar] [CrossRef] [PubMed]
  45. Segura-Ponce, L.A.; Soto-Pardo, V.A.; Guzmán-Meza, M.F. Characterization of apples (Granny Smith) dried in industrial equipment and the relationship with drying mechanisms. Food Struct. 2019, 21, 100119. [Google Scholar] [CrossRef]
  46. Sharabiani, V.R.; Kaveh, M.; Abdi, R.; Szymanek, M.; Tanaś, W. Estimation of moisture ratio for apple drying by convective and microwave methods using artificial neural network modeling. Sci. Rep. 2021, 11, 9155. [Google Scholar] [CrossRef]
  47. Linke, M.; Praeger, U.; Neuwald, D.A.; Geyer, M. Measurement of Water Vapor Condensation on Apple Surfaces during Controlled Atmosphere Storage. Sensors 2023, 23, 1739. [Google Scholar] [CrossRef]
  48. Rashvand, M.; Nadimi, M.; Paliwal, J.; Zhang, H.; Feyissa, A.H. Effect of Pulsed Electric Field on the Drying Kinetics of Apple Slices during Vacuum-Assisted Microwave Drying: Experimental, Mathematical and Computational Intelligence Approaches. Appl. Sci. 2024, 14, 7861. [Google Scholar] [CrossRef]
  49. de Ayala, A.; Foudi, S.; Solà, M.d.M.; López-Bernabé, E.; Galarraga, I. Consumers’ preferences regarding energy efficiency: A qualitative analysis based on the household and services sectors in Spain. Energy Effic. 2021, 14, 3. [Google Scholar] [CrossRef]
  50. Mari, A.; Parisouli, D.N. Exploring Osmotic Dehydration for Food Preservation: Methods, Modelling, and Modern Applications. Foods 2024, 13, 2783. [Google Scholar] [CrossRef]
  51. Mazumder, P.; Roopa, B.; Bhattacharya, S. Textural attributes of a model snack food at different moisture contents. J. Food Eng. 2007, 79, 511–516. [Google Scholar] [CrossRef]
  52. Szczesniak, A.S. Texture is a sensory property. Food Qual. Prefer. 2002, 13, 215–225. [Google Scholar] [CrossRef]
  53. Zdunek, A.; Konopacka, D. Crispiness and Crunchiness Judgement of Apples Based on Contact Acoustic Emission. J. Texture Stud. 2010, 41, 75–91. [Google Scholar] [CrossRef]
  54. Duizer, L. A review of acoustic research for studying the sensory perception of crisp, crunchy and crackly textures. Trends Food Sci. Technol. 2001, 12, 17–24. [Google Scholar] [CrossRef]
  55. Bleha, T.; Cifra, P. Force-displacement relations at compression of dsDNA macromolecules. J. Chem. Phys. 2019, 151, 014901. [Google Scholar] [CrossRef] [PubMed]
  56. Lucas, P.; Prinz, J.; Agrawal, K.; Bruce, I. Food texture and its effect on ingestion, mastication and swallowing. J. Texture Stud. 2004, 35, 159–170. [Google Scholar] [CrossRef]
  57. Piazza, L.; Giovenzana, V. Instrumental acoustic-mechanical measures of crispness in apples. Food Res. Int. 2015, 69, 209–215. [Google Scholar] [CrossRef]
  58. Rizzolo, A.; Vanoli, M.; Cortellino, G.; Spinelli, L.; Contini, D.; Herremans, E.; Bongaers, E.; Nemeth, A.; Leitner, M.; Verboven, P.; et al. Characterizing the tissue of apple air-dried and osmo-air-dried rings by X-CT and OCT and relationship with ring crispness and fruit maturity at harvest measured by TRS. Innov. Food Sci. Emerg. Technol. 2014, 24, 121–130. [Google Scholar] [CrossRef]
  59. Banaszak, J.; Pawłowski, A. Influence of ultrasound assist during hot air drying on properties of dried apple crisps. Chem. Process Eng. Inz. Chem. I Proces. 2018, 39, 263–270. [Google Scholar] [CrossRef]
  60. Marzec, A.; Kowalska, H.; Zadrożna, M. Analysis of instrumental and sensory texture attributes of microwave-convective dried apples. J. Texture Stud. 2010, 41, 417–439. [Google Scholar] [CrossRef]
  61. Bechar, A.; Mizrach, A.; Barreiro, P.; Landahl, S. Determination of mealiness in apples using ultrasonic measurements. Biosyst. Eng. 2005, 91, 329–334. [Google Scholar] [CrossRef]
  62. Taniwaki, M.; Sakurai, N. Evaluation of the internal quality of agricultural products using acoustic vibration techniques. J. Jpn. Soc. Hortic. Sci. 2010, 79, 113–128. [Google Scholar] [CrossRef]
  63. Marzec, A.; Kowalska, H.; Pasik, S. Mechanical and Acoustic Properties of Dried Apples. J. Fruit Ornam. Plant Res. 2009, 17, 127–137. [Google Scholar]
  64. Suman, S.; Khan, M.K.; Pathak, M. Performance enhancement of solar collectors—A review. Renew. Sustain. Energy Rev. 2015, 49, 192–210. [Google Scholar] [CrossRef]
  65. De Belie, N.; Harker, F.; De Baerdemaeker, J. Crispness judgement of Royal Gala apples based on chewing sounds. Biosyst. Eng. 2002, 81, 297–303. [Google Scholar] [CrossRef]
  66. Zampini, M.; Spence, C. The role of auditory cues in modulating the perceived crispness and staleness of potato chips. J. Sens. Stud. 2004, 19, 347–363. [Google Scholar] [CrossRef]
  67. Endo, H.; Ino, S.; Fujisaki, W. The effect of a crunchy pseudo-chewing sound on perceived texture of softened foods. Physiol. Behav. 2016, 167, 324–331. [Google Scholar] [CrossRef]
  68. Chen, J. Surface texture of foods: Perception and characterization. Crit. Rev. Food Sci. Nutr. 2007, 47, 583–598. [Google Scholar] [CrossRef]
  69. Imanov, A.; Kozhas, A.; Mukhamejanova, A.; Nazarova, A.; Kazhimkanuly, D. Experimental study of sound wave propagation patterns. Technobius 2024, 4, 0057. [Google Scholar] [CrossRef]
  70. Demattè, M.L.; Pojer, N.; Endrizzi, I.; Corollaro, M.L.; Betta, E.; Aprea, E.; Charles, M.; Biasioli, F.; Zampini, M.; Gasperi, F. Effects of the sound of the bite on apple perceived crispness and hardness. Food Qual. Prefer. 2014, 38, 58–64. [Google Scholar] [CrossRef]
  71. van der Sman, R.; Schenk, E. Causal factors concerning the texture of French fries manufactured at industrial scale. Curr. Res. Food Sci. 2024, 8, 100706. [Google Scholar] [CrossRef]
  72. Khodayari, A.; Hirn, U.; Spirk, S.; Ogawa, Y.; Seveno, D.; Thielemans, W. Advancing plant cell wall modelling: Atomistic insights into cellulose, disordered cellulose, and hemicelluloses—A review. Carbohydr. Polym. 2024, 343, 122415. [Google Scholar] [CrossRef]
  73. Biswas, R.K.; Khan, P.; Mukherjee, S.; Mukhopadhyay, A.K.; Ghosh, J.; Muraleedharan, K. Study of short range structure of amorphous Silica from PDF using Ag radiation in laboratory XRD system, RAMAN and NEXAFS. J. Non. Cryst. Solids 2018, 488, 1–9. [Google Scholar] [CrossRef]
  74. Boudina, I.; Delalonde, M.; Koegel, L.; Maraval, I.; Forestier-Chiron, N.; Domingo, R.; Ricci, J.; Sharkawi, T.; Rondet, E. Mechanical approach for the evaluation of the crispiness of food granular products. J. Texture Stud. 2023, 54, 633–645. [Google Scholar] [CrossRef] [PubMed]
  75. Tunick, M.H.; Onwulata, C.I.; Thomas, A.E.; Phillips, J.G.; Mukhopadhyay, S.; Sheen, S.; Liu, C.-K.; Latona, N.; Pimentel, M.R.; Cooke, P.H. Critical evaluation of crispy and crunchy textures: A review. Int. J. Food Prop. 2013, 16, 949–963. [Google Scholar] [CrossRef]
  76. Garvey, C.J.; Parker, I.H.; Simon, G.P. On the interpretation of X-ray diffraction powder patterns in terms of the nanostructure of cellulose I fibres. Macromol. Chem. Phys. 2005, 206, 1568–1575. [Google Scholar] [CrossRef]
  77. Bhat, I.M.; Wani, S.M.; Mir, S.A.; Naseem, Z. Effect of microwave-assisted vacuum and hot air oven drying methods on quality characteristics of apple pomace powder. Food Prod. Process. Nutr. 2023, 5, 26. [Google Scholar] [CrossRef]
  78. Qadri, T.; Naik, H.R.; Hussain, S.Z.; Naseer, B.; Bhat, T.; Vijaykumar; Wani, F.J. Spray dried apple powder: Qualitative, rheological, structural characterization and its sorption isotherm. Lwt 2022, 165, 113694. [Google Scholar] [CrossRef]
Figure 1. Simulation of sound acquisition for each dried sample breaking during puncture tests, simulating one bite.
Horticulturae 11 00610 g001
Figure 2. Drying kinetics of slices from ten apples with each drying method, solar-dried (SDA) and oven-dried (ODA). Data are presented as mean ± SD.
Horticulturae 11 00610 g002
Figure 3. Crispiness analyses of dried apples SDA, ODA, CCA and CFA. Data are expressed in force (N) as mean ± SD (n = 10). Values with the same lowercase letters are not significantly different (p > 0.05). SDA—solar-dried apples; ODA—oven-dried apples; CCA—national supermarket apples; CFA—specialized dried food brand apples.
Horticulturae 11 00610 g003
Figure 4. Amplitude–time plot of the crispiness sound of dried apples under study. SDA—solar-dried apples; ODA—oven-dried apples; CCA—national supermarket apples; CFA—specialized dried food brand apples.
Horticulturae 11 00610 g004
Figure 5. Average frequency spectra of the crispiness sound of dried apples under study. SDA—solar-dried apples; ODA—oven-dried apples; CCA—national supermarket apples; CFA—specialized dried food brand apples.
Horticulturae 11 00610 g005
Figure 6. Average high frequency spectra of the crispiness sound of dried apples under study. SDA—solar-dried apples; ODA—oven-dried apples; CCA—national supermarket apples; CFA—specialized dried food brand apples.
Horticulturae 11 00610 g006
Figure 7. X-ray analyses of the samples under study and the fresh apple. SDA—solar-dried apples; ODA—oven-dried apples; CCA—national supermarket apples; CFA—specialized dried food brand apples.
Horticulturae 11 00610 g007
Figure 8. Plot of correlation of crispiness vs. crystallite size. The dashed lines represent a 95% confidence interval.
Horticulturae 11 00610 g008
Figure 9. Funnel graphs showing how participants evaluate the tested products with regard to texture. SDA—solar-dried apples; ODA—oven-dried apples; CCA—national supermarket apples; CFA—specialized dried food brand apples.
Horticulturae 11 00610 g009
Figure 10. Funnel graphs showing how participants evaluate the tested products regarding overall quality. SDA—solar-dried apples; ODA—oven-dried apples; CCA—national supermarket apples; CFA—specialized dried food brand apples.
Horticulturae 11 00610 g010
Figure 11. Consumer preferences for each dried product, between SDA, ODA, CCA and CFA. SDA—solar-dried apples; ODA—oven-dried apples; CCA—national supermarket apples; CFA—specialized dried food brand apples.
Horticulturae 11 00610 g011
Table 1. XRD peak positions and crystallite sizes of fresh and dried samples.
Peak 1Peak 2Peak 3Peak 4Crystallite Size
Sample(2Ꝋ)d (Å)(2Ꝋ)d (Å)(2Ꝋ)d (Å)(2Ꝋ)d (Å)(Å)
Fresh27.74°3.21439.22°2.29572.51°1.303--7 ± 2
SDA16.43°5.38920.60°4.30837.83°2.37643.90°2.06118 ± 2
ODA17.58°5.04020.364.35925.083.54834.75°2.57916 ± 4
CCA16.17°5.47619.55°4.536----18 ± 2
CFA17.46°5.07521.66°4.09738.16°2.35744.86°2.01924 ± 4
SDA—solar-dried apples; ODA—oven-dried apples; CCA—national supermarket apples; CFA—specialized dried food brand apples.
Table 2. Relation between crispiness, sound and x-ray diffraction of the samples under study.
Acoustic SignalAcoustic AnalysesX-Ray
SDAlow amplitude and short duration signal; weak and brief soundsound energy concentrated at lower frequencies, with little energy at higher frequenciesincrease in crystallinity, comparing to fresh
ODAmoderate amplitude and short duration signal; louder than SDA, but still relatively weak soundsound energy like SDA, but slightly more concentrated at low frequenciesincrease in crystallinity, comparing to fresh
CCAmoderately high amplitude and prolonged duration signal; more intense and long-lasting soundmore distributed sound energy, with significant peaks at mid-high frequenciesincrease in crystallinity, comparing to fresh
CFAhigh amplitude and long duration signal; very intense and prolonged soundgreater energy at high frequencies, with well-defined peakshighest increase in crystallinity, comparing to fresh and other drying processes
Principal Conclusionscrispness is directly related to the intensity and duration of the acoustic signalcrispness is related to the presence of high frequency components in the sound spectrumcrispiness is associated with crystallinity, but it is largely influenced by drying process
SDA—solar-dried apples; ODA—oven-dried apples; CCA—national supermarket apples; CFA—specialized dried food brand apples.
Table 3. Frequencies for each texture descriptor of the check-all-that-apply questionnaire.
SDAODACCACFA
TextureDry30354151
Crispy73846380
Soft/elastic1492410
Hard20292231
Firm34362627
SDA—solar-dried apples; ODA—oven-dried apples; CCA—national supermarket apples; CFA—specialized dried food brand apples.
Disclaimer/Publisher’s Note: The statements, opinions and data contained in all publications are solely those of the individual author(s) and contributor(s) and not of MDPI and/or the editor(s). MDPI and/or the editor(s) disclaim responsibility for any injury to people or property resulting from any ideas, methods, instructions or products referred to in the content.