Article

Flooding Tolerance and Recovery Capacity of Carya illinoinensis

1
Co-Innovation Center for Sustainable Forestry in Southern China of Jiangsu Province, Key Laboratory of Soil and Water Conservation and Ecological Restoration of Jiangsu Province, Nanjing Forestry University, Nanjing 210037, China
2
Wuxi Branch, Bureau of Investigation on Hydrologic Water Resources, Wuxi 214000, China
*
Author to whom correspondence should be addressed.
Horticulturae 2025, 11(6), 590; https://doi.org/10.3390/horticulturae11060590
Submission received: 27 February 2025 / Revised: 20 May 2025 / Accepted: 22 May 2025 / Published: 26 May 2025

Abstract

:
Carya illinoinensis is a relatively water-tolerant species widely planted in areas with high flood risk. Evaluating its adaptation strategies and tolerance thresholds is crucial for ecological restoration in the context of climate change. In this study, five treatments were applied to 1-year-old C. illinoinensis seedlings in a potting simulation experiment: T1 (field capacity: 75%), T2 (5 cm below the root collar), T3 (up to the root collar), T4 (10 cm above the root collar), and T5 (30 cm above the root collar). The flooding episode lasted for 4 months and was followed by a recovery period of 6 months. The results show that, at the end of flooding, total biomass (TB), stem-mass ratio (SMR), malondialdehyde (MDA), soluble protein (SP), superoxide dismutase (SOD), and catalase (CAT) were significantly increased in all the flooded groups (T2–T5) compared to the control (T1), while the root-to-shoot ratio (RSR), root-to-mass ratio (RMR), leaf-to-mass ratio (LMR), and leaf-mass fraction (LMF) were significantly decreased. Although survival in the high stress group (T5) temporarily decreased to 83.3% (T1–T4 remained 100%), survival in all treatment groups fully recovered (100%) after recovery. Significant decreases (p < 0.001) were observed when comparing post-recovery to end-flooding levels within each flooded group (T2–T5), with reductions ranging: LMR (21.0–30.8%), REL (14.0–26.7%), MDA (16.1–25.3%), SP (42.2–67.3%), SOD (27.6–49.8%), and CAT (47.0–61.3%) across treatments. At this time, T5 showed lower TB and higher MDA, soluble sugars (SS), and SP compared to T1. PCA analysis indicated that the damage ranked as T5 > T4 > T3 > T2 > T1 at the end of flooding, and as T5 > T1 > T4 > T3 > T2 at the end of recovery. Therefore, it could be concluded that 1-year-old C. illinoinensis exhibits high flooding tolerance, with self-recovery thresholds below the T5 treatment, making it suitable for ecological restoration in flood-prone areas.

1. Introduction

Global warming is associated with an increase in flooding events, which threaten many ecosystems worldwide with submergence [1,2]. These flooding events represent major abiotic stresses for plants, significantly impacting the global distribution of plant species, community composition, structure, and dynamics [3,4,5]. Research has demonstrated that excess water adversely affects plant growth and metabolism [6]; however, the primary contributor to these damages is not the water itself but secondary stresses induced by changes in the soil moisture environment [7]. Specifically, flooding causes soil hypoxia, resulting in a hypoxic or anaerobic environment in the plant root zone, where normal aerobic respiration is replaced by anaerobic respiration [4]. Consequently, plant responses to flooding mainly depend on their adaptation to hypoxia, including changes in tree height and diameter [8], root growth [9], root-to-shoot ratio [10], dry mass accumulation [11], membrane systems, osmoregulatory substances, and antioxidant enzymes [12,13].
Flood-tolerant plants have evolved distinct adaptive strategies to cope with flooding and hypoxic conditions, namely the Low Oxygen Escape Syndrome (LOES) and the Low Oxygen Quiescence Syndrome (LOQS) [14,15]. LOES involves enhancing gas exchange within the plant body and depleting its own carbohydrates to promote stem elongation, thereby exposing as much of the plant’s upper parts as possible. Conversely, LOQS entails accumulating carbohydrates by inhibiting growth and reducing energy consumption, thus maintaining long-term survival underwater while ensuring sufficient energy for growth resumption post-flooding [16]. The strategy employed by plants to adapt to flooding environments may depend on factors such as the duration and depth of flooding, as well as plant species and age [17,18,19].
Carya illinoinensis (also known as the American pecan) is a deciduous nut tree of the Juglandaceae family [20]. In terms of timber value, C. illinoinensis is one of the three best hardwood species, along with Juglans nigra and Cerasus maximowiczii. This species is native to Mexico and the United States, but it has been commercially cultivated in several countries, such as Canada, Italy, Brazil, France, Israel, South Africa, Japan, and China [21]. In China, large-scale demonstration sites for C. illinoinensis have been established, particularly in the Yangtze River Delta region [22]. However, this region is affected by the high water levels of the Yangtze River, leading to frequent flooding [23]. Therefore, it is important to study and protect C. illinoinensis, especially to explore its adaptation and recovery strategies to prolonged flooding.
While laboratory simulation experiments have examined the response of C. illinoinensis seedlings to varying flood durations and depths, indicating its relative flood tolerance [24,25,26], detailed studies on tolerance thresholds and recovery processes after prolonged flooding remain scarce. This study aims to analyze the growth and physiological responses of C. illinoinensis under five different flooding treatments and assess its recovery ability post-flooding. We hypothesized that: (1) C. illinoinensis may employ a combination of LOES and LOQS traits; (2) Flood depth would differentially affect seedling height, diameter, root system, dry matter partitioning, membrane system, osmoregulatory substances, and antioxidant enzyme activities; (3) Seedling growth, physiology, and other indicators would return to normal levels during the recovery period.

2. Materials and Methods

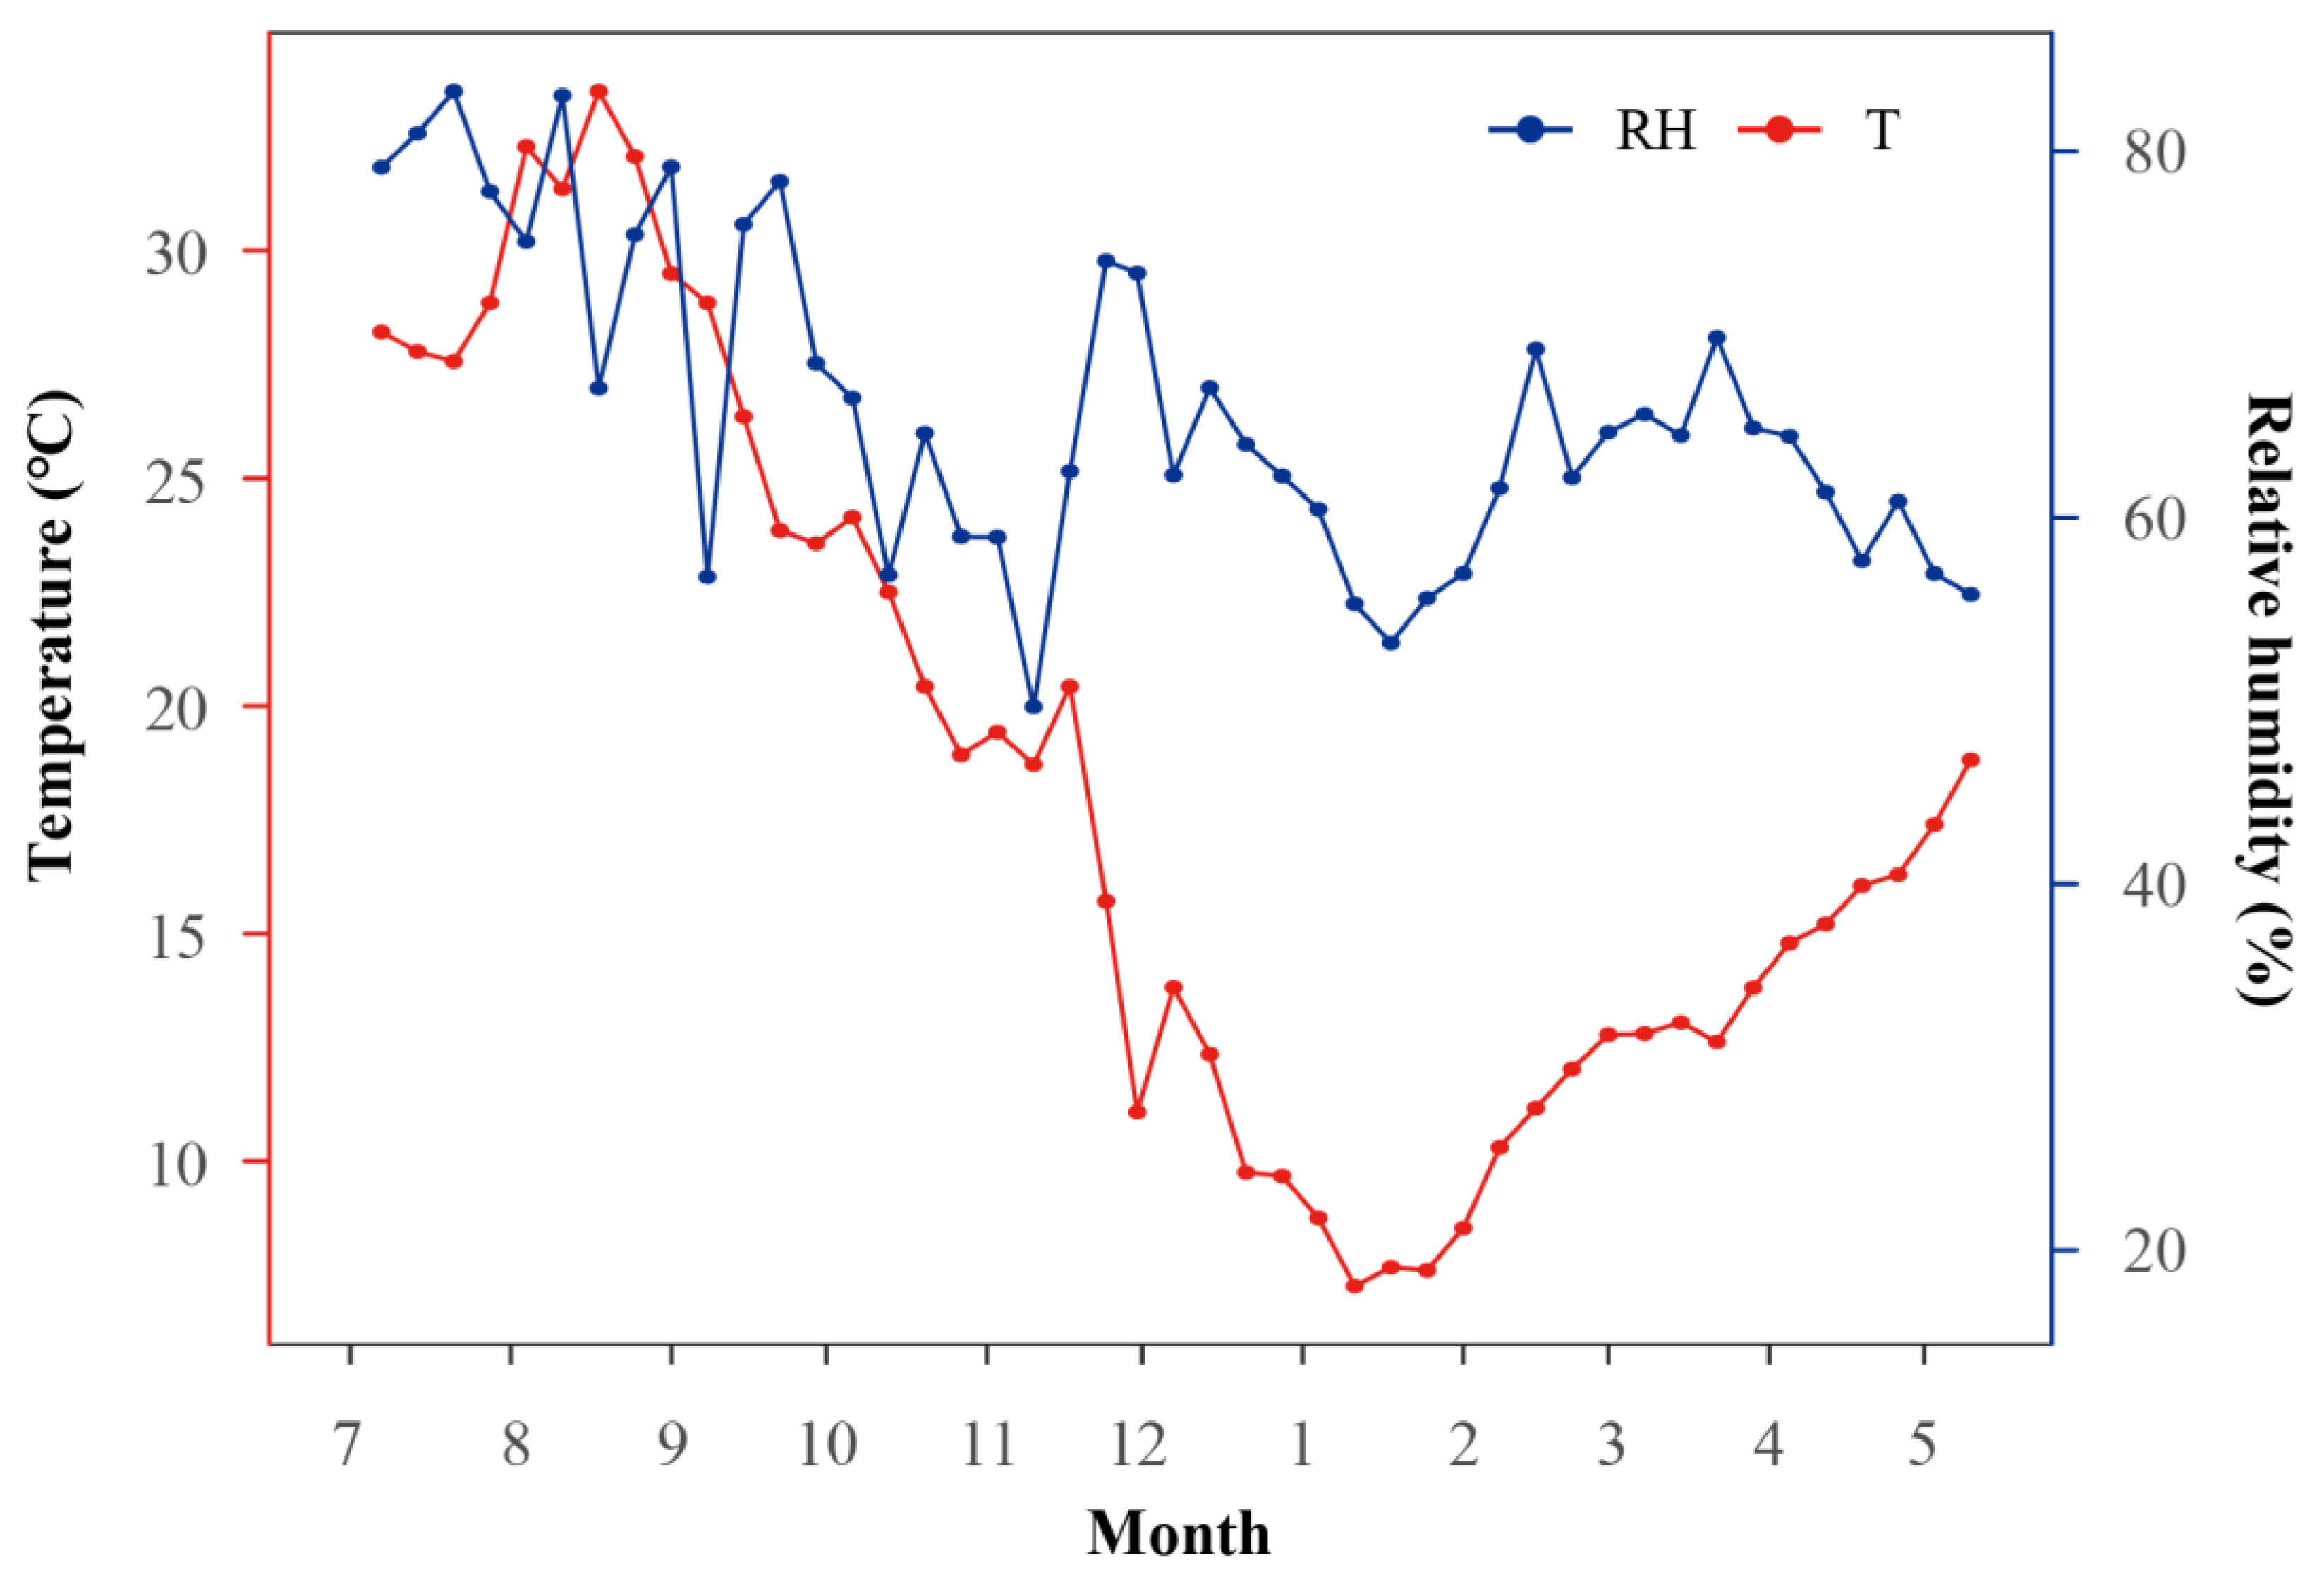
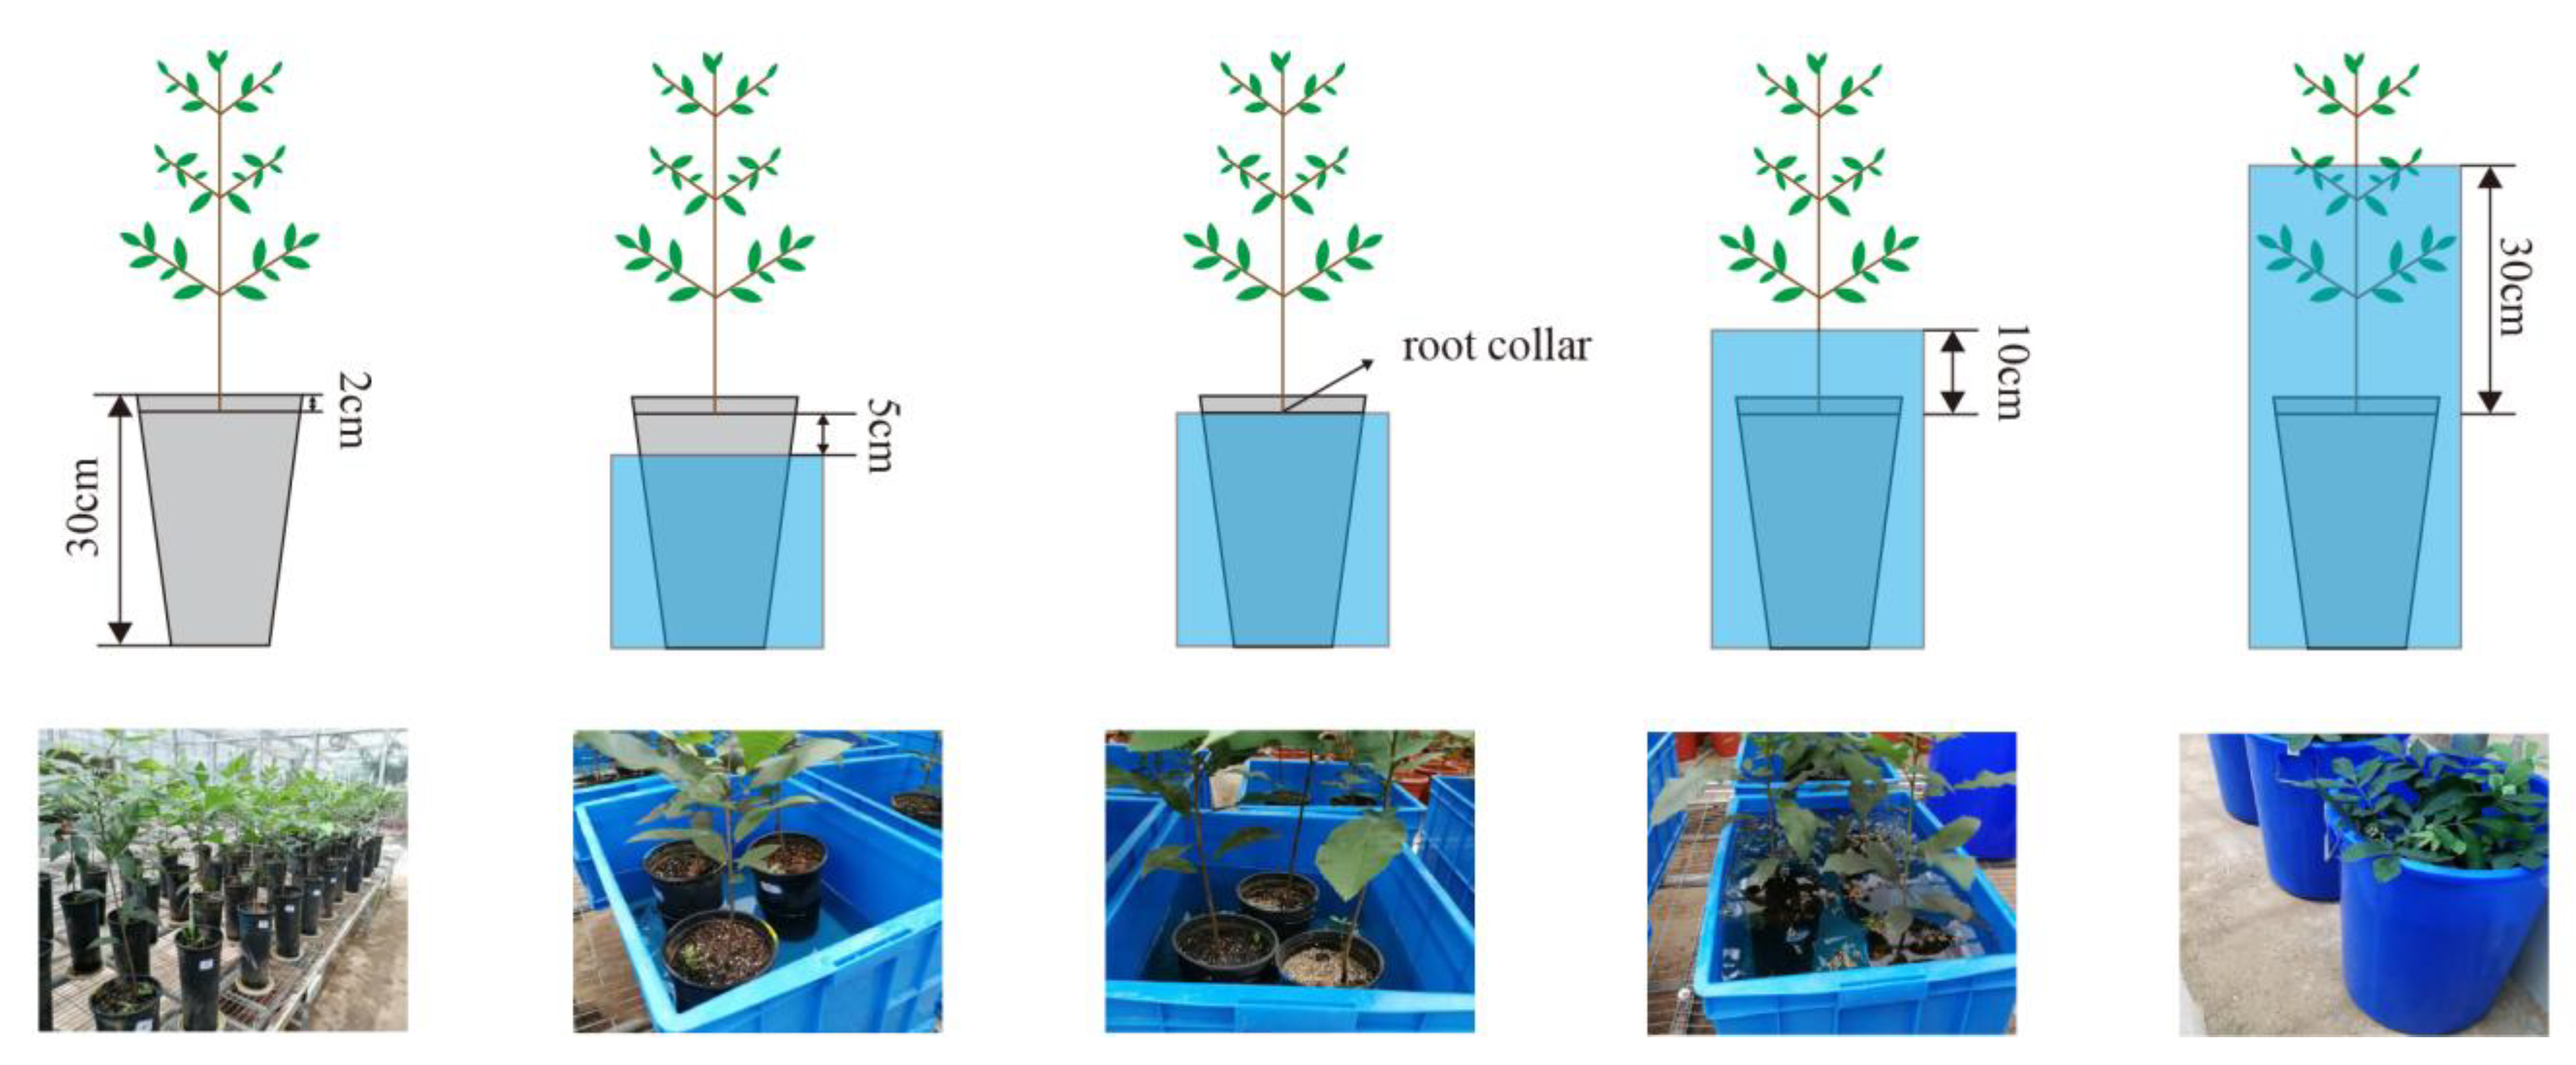
2.1. Plant Materials

The experimental materials were one-year old C. illinoinensis seedlings, which were from the C. illinoinensis experimental base of Nanjing Forestry University. The potted seedling containers were black gallon pots (16 cm upper diameter × 12 cm lower diameter × 30 cm high), each of which was filled with soil up to 2 cm from the upper rim of the pot. The culture medium consisted of garden soil, earthworm soil, and organic fertilizer, which were uniformly mixed at a 3:6:1 ratio. The soil pH was 5.5, the field water capacity was 31.05%, the proportion of organic matter was 2.83%, and the contents of available N, P, and K were 121.25, 51.18, and 93.29 mg kg−1, respectively.

2.2. Experimental Design

At the beginning of the experiment, uniformly growing (~40 cm high) seedlings were selected and acclimatized for 15 days in the greenhouse with shading function of Nanjing Forestry University’s Xiashu Forestry (N32.07, E119.12). The temperature of the greenhouse ranged from 7.26 to 33.5 °C, and the relative humidity ranged from 49.69 to 83.27% throughout the experiment (Figure 1). The experimental design was in randomized blocks in a 5 × 2 factorial scheme, with three replicates of three plants per treatment. The treatments consisted of five flooding levels (field capacity 75%, 5 cm below root collar, up to root collar, 10 cm above root collar, and 30 cm above root collar) and two moments (flooding and recovery), totaling 90 plants (Figure 2).
In the period before the beginning of the experiment, all seedlings were watered until the beginning of water percolation, then allowed to drain. As soon as the drainage stopped, indicating that the soil was at field capacity (control group, T1), seedlings were individually weighed, and from that point, flooding and recovery conditions were implemented.
To maintain 75% water holding capacity in the field, control seedlings (T1) were managed using the weighing method, where pots were weighed daily and rehydrated as needed. Seedlings in the flooded treatments (T2, T3, T4, and T5) were always immersed in water-filled containers, replenished daily to compensate for transpiration losses and to maintain a stable water level. The water is fully replaced weekly by draining through the container’s bottom valve and refilling via a hose to maintain consistent water levels. These treatments lasted for 4 months (15 July to 11 November 2020). Afterwards, the flooded seedlings were subjected to the same management practices as the controls to recover from water stress (12 November 2020 to 10 May 2021). All plants were maintained under this condition until the end of the experiment.

2.3. Determination of Growth Indicators

The height and ground diameter were recorded weekly to assess the level of plant growth, with six replicates per treatment, during the flooding and recovery, respectively (total of 60 plants). For the aboveground growth of seedlings, the height and ground diameter rates were calculated during the flooding and recovery periods, respectively, according to Equation (1):
R = Y 2 Y 1 X 2 X 1 = Y X
where R is the rate of height or ground diameter; Y is the amount of change in the mean value of height or ground diameter; and X is the corresponding time variation.
The root length and surface area were measured by a root system analyzer (Win-RHIZO Pro LA2400, Regent Instruments Inc., Quebec City, Canada) with six replicates per treatment, which were evaluated at the end of flooding and recovery, respectively (total of 60 plants).
To determine the dry weight, the C. illinoinensis seedlings were sampled at the end of the flooding treatments and recovery, respectively. Six plants per treatment were randomly selected for each sample and harvested, separated into leaves, stems, and roots, and their dry mass weight was determined separately after drying at 80 °C to a constant weight. Thus, the root-to-shoot ratio (RSR), root-to-mass ratio (RMR), leaf-to-mass ratio (LMR), stem-to-mass ratio (SMR), and leaf-mass fraction (LMF) were obtained from the following equations, respectively:
Root - to - shoot   ratio = root   biomass / aboveground   biomass
Root - to - mass   ratio = root   biomass / total   biomass
Leaf - to - mass   ratio = leaf   biomass / total   biomass
Stem - to - mass   ratio = stem   biomass / total   biomass
Leaf - mass   fraction = leaf   biomass / aboveground   biomass

2.4. Determination of Physiological and Biochemical Indicators

At the conclusion of the flooding and recovery experiments, the mature leaves in the middle section of the plants were harvested and wiped. Some leaves were taken for the determination of plasma membrane permeability, and the rest were stored in an ultra-low temperature refrigerator (−80 °C) for the determination of other physiological indicators.
The relative electrolytic leakage (REL) was determined using the method of Huang with some modifications [27]. The fresh leaf was mixed by cutting with scissors (avoiding the main leaf vein), which was weighed at 0.1 g in a glass test tube containing 10 mL of deionized water and incubated for 12 h at room temperature (25 °C). Following the incubation period, the initial electrical conductivity (C1) was measured using a conductivity meter. The samples were then extracted in a boiling water bath for 10 min and the final electrolytic conductivity (C2) was recorded when the sample solution was cooled. The REL was calculated according to Equation (7):
R E L % = C 1 C 2 × 100 %
The malondialdehyde (MDA) content was extracted using a thiobarbituric acid (TBA) reagent and boiled at 100 °C for 20 min according to the method of Wassie [28]. Once the solution was cooled to room temperature, it was centrifuged at 3000 rpm for 10 min. The absorbance of the supernatant was then measured using a spectrophotometer (Shimadzu UV-2450, Shimadzu Corporation, Kyoto, Japan) at 450, 532, and 600 nm. The MDA concentration was estimated using Equation (8):
MDA   ( μ mol / g   F w ) = 6.45   A 532 A 600 0.56 A 450
where A450, A532, and A600 are the absorbance of the supernatant at 450, 532, and 600 nm, respectively.
The soluble sugar (SS) content was estimated using an anthrone colorimetric method described by Moustakas [29]. The sample (0.5 g) was ground into a homogeneous slurry and then extracted with 6 mL of sulfosalicylic acid for 2 h. The samples were centrifuged at 4000 rpm for 5 min after filtration. Following centrifugation, the absorbance of the supernatant was measured at 630 nm using a spectrophotometer. The soluble sugar was calculated according to Equation (9):
Soluble   sugar   ( % ) = C   ×   N 10 6   ×   W   ×   100
where C is the sugar content from a standard curve; N is the dilution multiple; and W is the sample weight.
The soluble protein (SP) content was determined via a Coomassie brilliant blue G-250 staining method. A 0.1 g volume of leaves was ground using a mortar with a 1 mL phosphate buffer solution (PBS, pH = 7.8), and then transferred to a 10 mL centrifuge tube. The material was then washed twice with 2 mL PBS and transferred to a 10 mL centrifuge tube and centrifuged at 10,000 rpm for 15 min at 4 °C. After centrifugation, the 0.1 mL supernatant was transferred into a test tube, to which 5 mL of Coomassie brilliant blue G-250 was added and thoroughly mixed. Two min later, the absorbance of the resulting solution was measured at 595 nm using a spectrophotometer. The soluble protein was calculated according to Equation (10):
Soluble   protein   ( mg / g   F W ) = C   ×   V T W   ×   V S   ×   1000
where C is the protein content from a standard curve; VT is the total volume of extracting solution; W is the sample weight; and VS is the sampling volume of determination.
The superoxide dismutase (SOD) activity was measured through a nitro blue tetrazolium (NBT) reduction method. To prepare the enzyme solution: 0.5 g of leaves were ground into a homogenate with a 10 mL of phosphate buffer (PBS, pH = 7.8), transferred to a centrifuge tube, and centrifuged at 12,000 rpm for 20 min at 4 °C. The supernatant was a SOD crude enzyme solution. The reaction solution consisted of a 14.5 mM methionine (Met) solution, 3 mM ethylenediaminetetraacetic acid disodium salt (EDTA-Na2) solution, 60 μM riboflavin solution, and 2.25 mM NBT solution. Subsequently, 2.9 mL of the reaction mixture and 0.1 mL of the enzyme solution were extracted via testing tubes. Two control tubes were prepared simultaneously, one with 2.9 mL of a reaction mixture and 0.1 mL of PBS (without the enzyme solution) as the maximum light reduction tube, and the other with 2.9 mL of the reaction mixture and 0.1 mL of PBS while wrapped in tin foil to block the light. The tubes were then placed in a light incubator at 4000 lux for 20 min at 25 °C and then in darkness to stop the reaction. Following the reaction, the spectrophotometer was zeroed with the control tube without illumination, and the absorbance of each tube was measured separately at 560 nm. One unit of SOD activity was defined as the amount of enzyme that inhibited the NBT reduction by 50%.
SOD   ( U / g   F W ) = ( A 0 A S )   ×   V T 0.5   ×   A 0   ×   W   ×   V 1
where A0 is the absorbance of control; AS is the absorbance of the sample; VT is the total volume of the extracting solution; W is the sample weight; and V1 is the sampling volume of determination.
The catalase (CAT) activity was determined using a UV absorption method. For enzyme extraction, 0.5 g of leaves was weighed in a mortar, and 2–3 mL of a pre-cooled phosphate buffer (PBS, pH = 7.8) was added at 4 °C with a small amount of quartz sand and ground into a homogenate. This material was transferred to a 25 mL volumetric flask, and the mortar was rinsed several times with buffer solution to fix the volume on the scale. Subsequently, the volumetric flask was placed in a refrigerator at 5 °C for 10 min, and the upper clarified liquid was centrifuged at 4000 rpm for 15 min. The supernatant was the CAT crude enzyme. For the determination of enzyme activity, three 10 mL test tubes were used (two for sample measurement and one as a blank) and designated as S0, S1, and S2 respectively, to which 0.2 mL of the crude enzyme solution, 1.5 mL of a phosphate buffer (PBS, pH = 7.8), and 1.0 mL of distilled water were added, respectively. The test tube S0 was heated in a boiling water bath for 1 min to deactivate the enzyme solution and cooled. All of the test tubes were then preheated at 25 °C to which 0.3 mL of 0.1 mol/L H2O2 was added one by one. Each tube was quickly timed and quickly poured into a quartz cuvette, and the absorbance was measured at 240 nm with a 1 min reading at each interval for 4 min. Once all three tubes were measured, the enzyme activity was calculated. A unit of CAT activity was defined as the changes in absorbance at 240 nm per min.
CAT   ( U / g   F W ) = A 240   ×   V T 0.1   ×   V S   ×   t   ×   W
A 240 = A S 0 ( A S 1 + A S 2 ) 2
where ΔA240 is the absorbance (control minus the assay); VT is the total volume of extracting solution; VS is the sampling volume of determination; t is the time from the beginning of the addition of H2O2 to the last reading; and W is the sample weight.

2.5. Statistical Analysis

A repeated-measures ANOVA was performed on the data obtained (growth and physiology) to determine the effect of treatments (T1, T2, T3, T4, and T5) with moments (flooding; recovery) and their interaction. Post hoc comparisons among flooding treatments (T1–T5) were performed using a Tukey’s HSD test at a 95% family-wise confidence level, with statistical significance defined as p < 0.05. The data were expressed as mean ± standard deviation (SD). Finally, the dimensions of each indicator in the different treatments were reduced, and the data were subjected to principal component analysis (PCA) after standardization. A KMO and Bartlett’s test of sphericity showed p < 0.01 indicating that PCA was appropriate.

3. Results

3.1. Growth Indicators of C. illinoinensis Under Different Flooding Treatments

3.1.1. The Growth Rate of the Height and Ground Diameter

Treatment, moment, and the interaction between treatment × moment significantly affected both the growth rate of the ground diameter (GRD, all p < 0.001) and the growth rate of the height (Table 1).
At the end of flooding, the GRD varied significantly (p < 0.001) among treatments, with T4 (2.87 mm) and T5 (1.75 mm) exhibiting significantly higher GRD than T1–T3 (p < 0.001). At the end of recovery, the GRD decreased by 108.92% (p < 0.015), 153.73% (p < 0.001), and 168.57% (p < 0.001) in T3, T4, and T5, respectively. In addition, compared to T1–T3, the GRD was significantly lower and reduced by 1.51–1.58 mm (95% CIs: 1.27–1.81) in T4 and 1.17–1.24 mm (0.93–1.47) in T5 at the end of the recovery.
The GRH did not exhibit significant differences among treatments at the end of flooding. However, after recovery, the GRH increased significantly across all treatments (p < 0.001). Specifically, compared to T5, the GRH increased by 6.99 cm (95% CIs: 0.45–13.53) and 7.01 cm (95% CIs: 0.47–13.55) in T3 and T4, respectively.

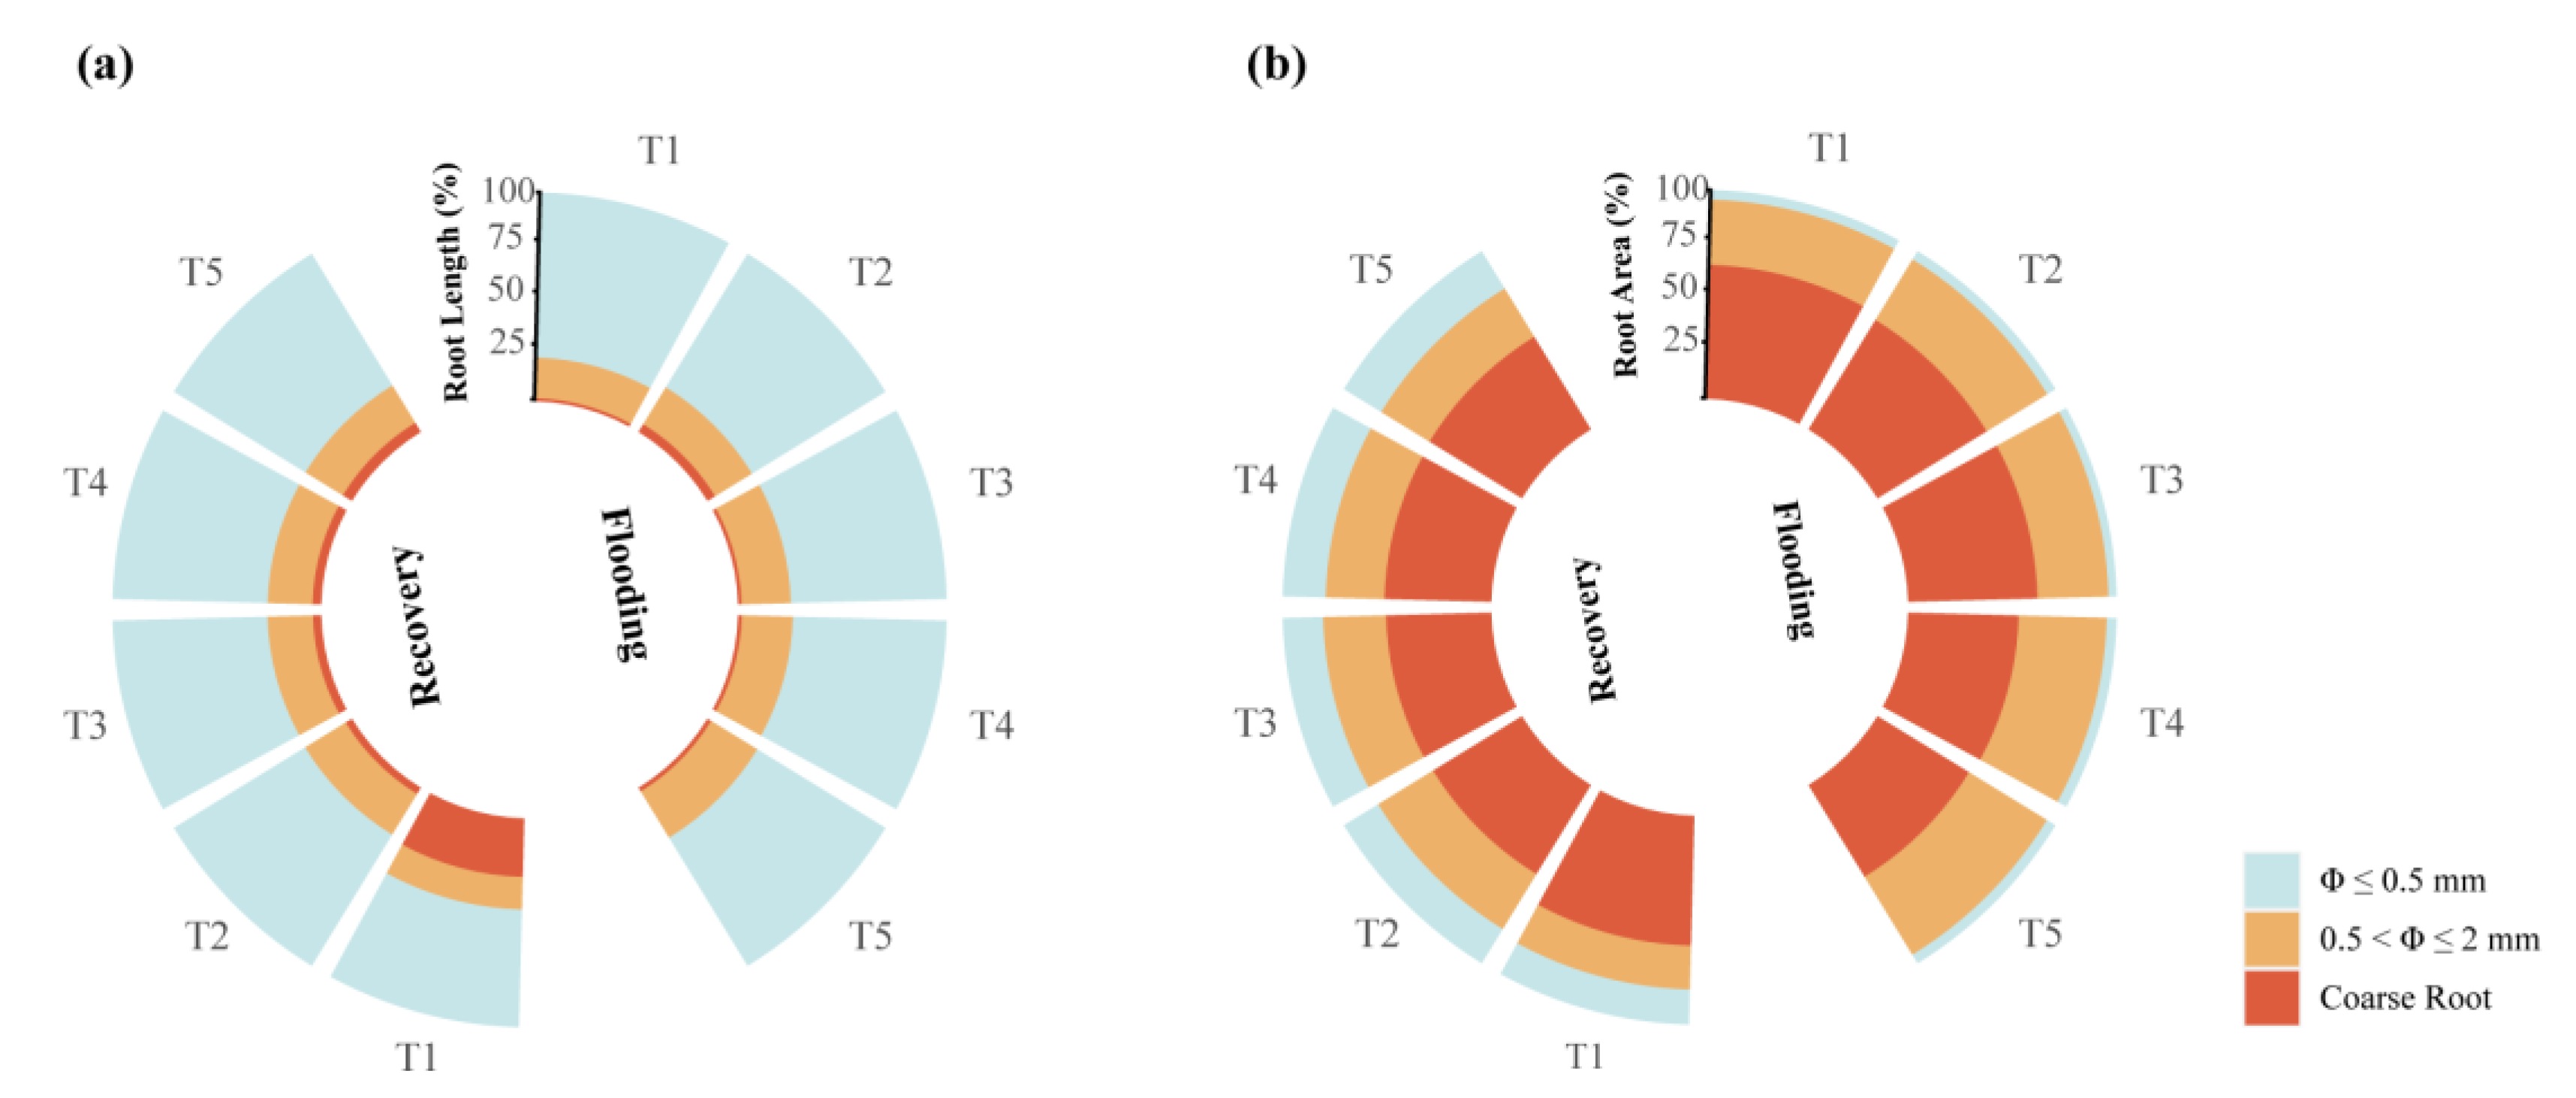
3.1.2. Root Length and Root Surface Area

There were significant effects of treatment (p = 0.008 for TRL; p < 0.001 for TRA), moment (all p < 0.001), and their interaction (p = 0.049 for TRL; p = 0.003 for TRA) on the total root length (TRL) and total root surface area (TRA, Table 2).
At the end of flooding, no significant differences in the TRL were observed among treatments. However, after recovery, the TRL increased significantly (p < 0.001) in all treatments (T1–T5) by 104.05%, 154.64%, 145.78%, 135.12%, and 221.84%, respectively. At the end of recovery, the minimum TRL was recorded in T5 (26.86 m), which was 12.69 mm lower than that of T2 (95% CI: 3.11–22.26, p = 0.005).
At the end of flooding, the TRA for T4 was reduced by 43.87% (p < 0.001) compared to T1; additionally, the TRA for T5 decreased by 46.89% (p < 0.001) and 33.87% (p = 0.039) compared to T1 and T2, respectively. At the end of recovery, all flooding treatment groups (T2–T5) exhibited a significant increase in TRA compared to T1 (T2–T4: p < 0.001; T5: p = 0.002). The TRA was highest in T2 (855.49 cm2), which was significantly greater than in T1 (649.97 cm2), T4 (672.81 cm2), and T5 (538.33 cm2). Furthermore, the TRA for T3 was 250.49 mm higher than that of T5 (95% CI: 3.11–22.26, p < 0.001).
At the end of flooding, the percentage of fine root length gradually decreased (Figure 3a), while the percentage of surface area gradually increased with increasing stress (Figure 3b). At the end of recovery, both the fine root length and surface area percentage had increased in the flooded group compared to T1 (Figure 3a,b). To gain a clearer understanding of fine root growth, the root system of fine roots (Φ ≤ 2 mm) was further divided by diameter as Φ ≤ 0.5 mm and 0.5 < Φ ≤ 2 mm, respectively. Compared to T1, the length and surface area percentage of Φ ≤ 0.5 mm in the flooded group (T2, T3, T4, and T5) decreased, while those of 0.5 < Φ ≤ 2 mm increased during both the flooding and recovery periods.

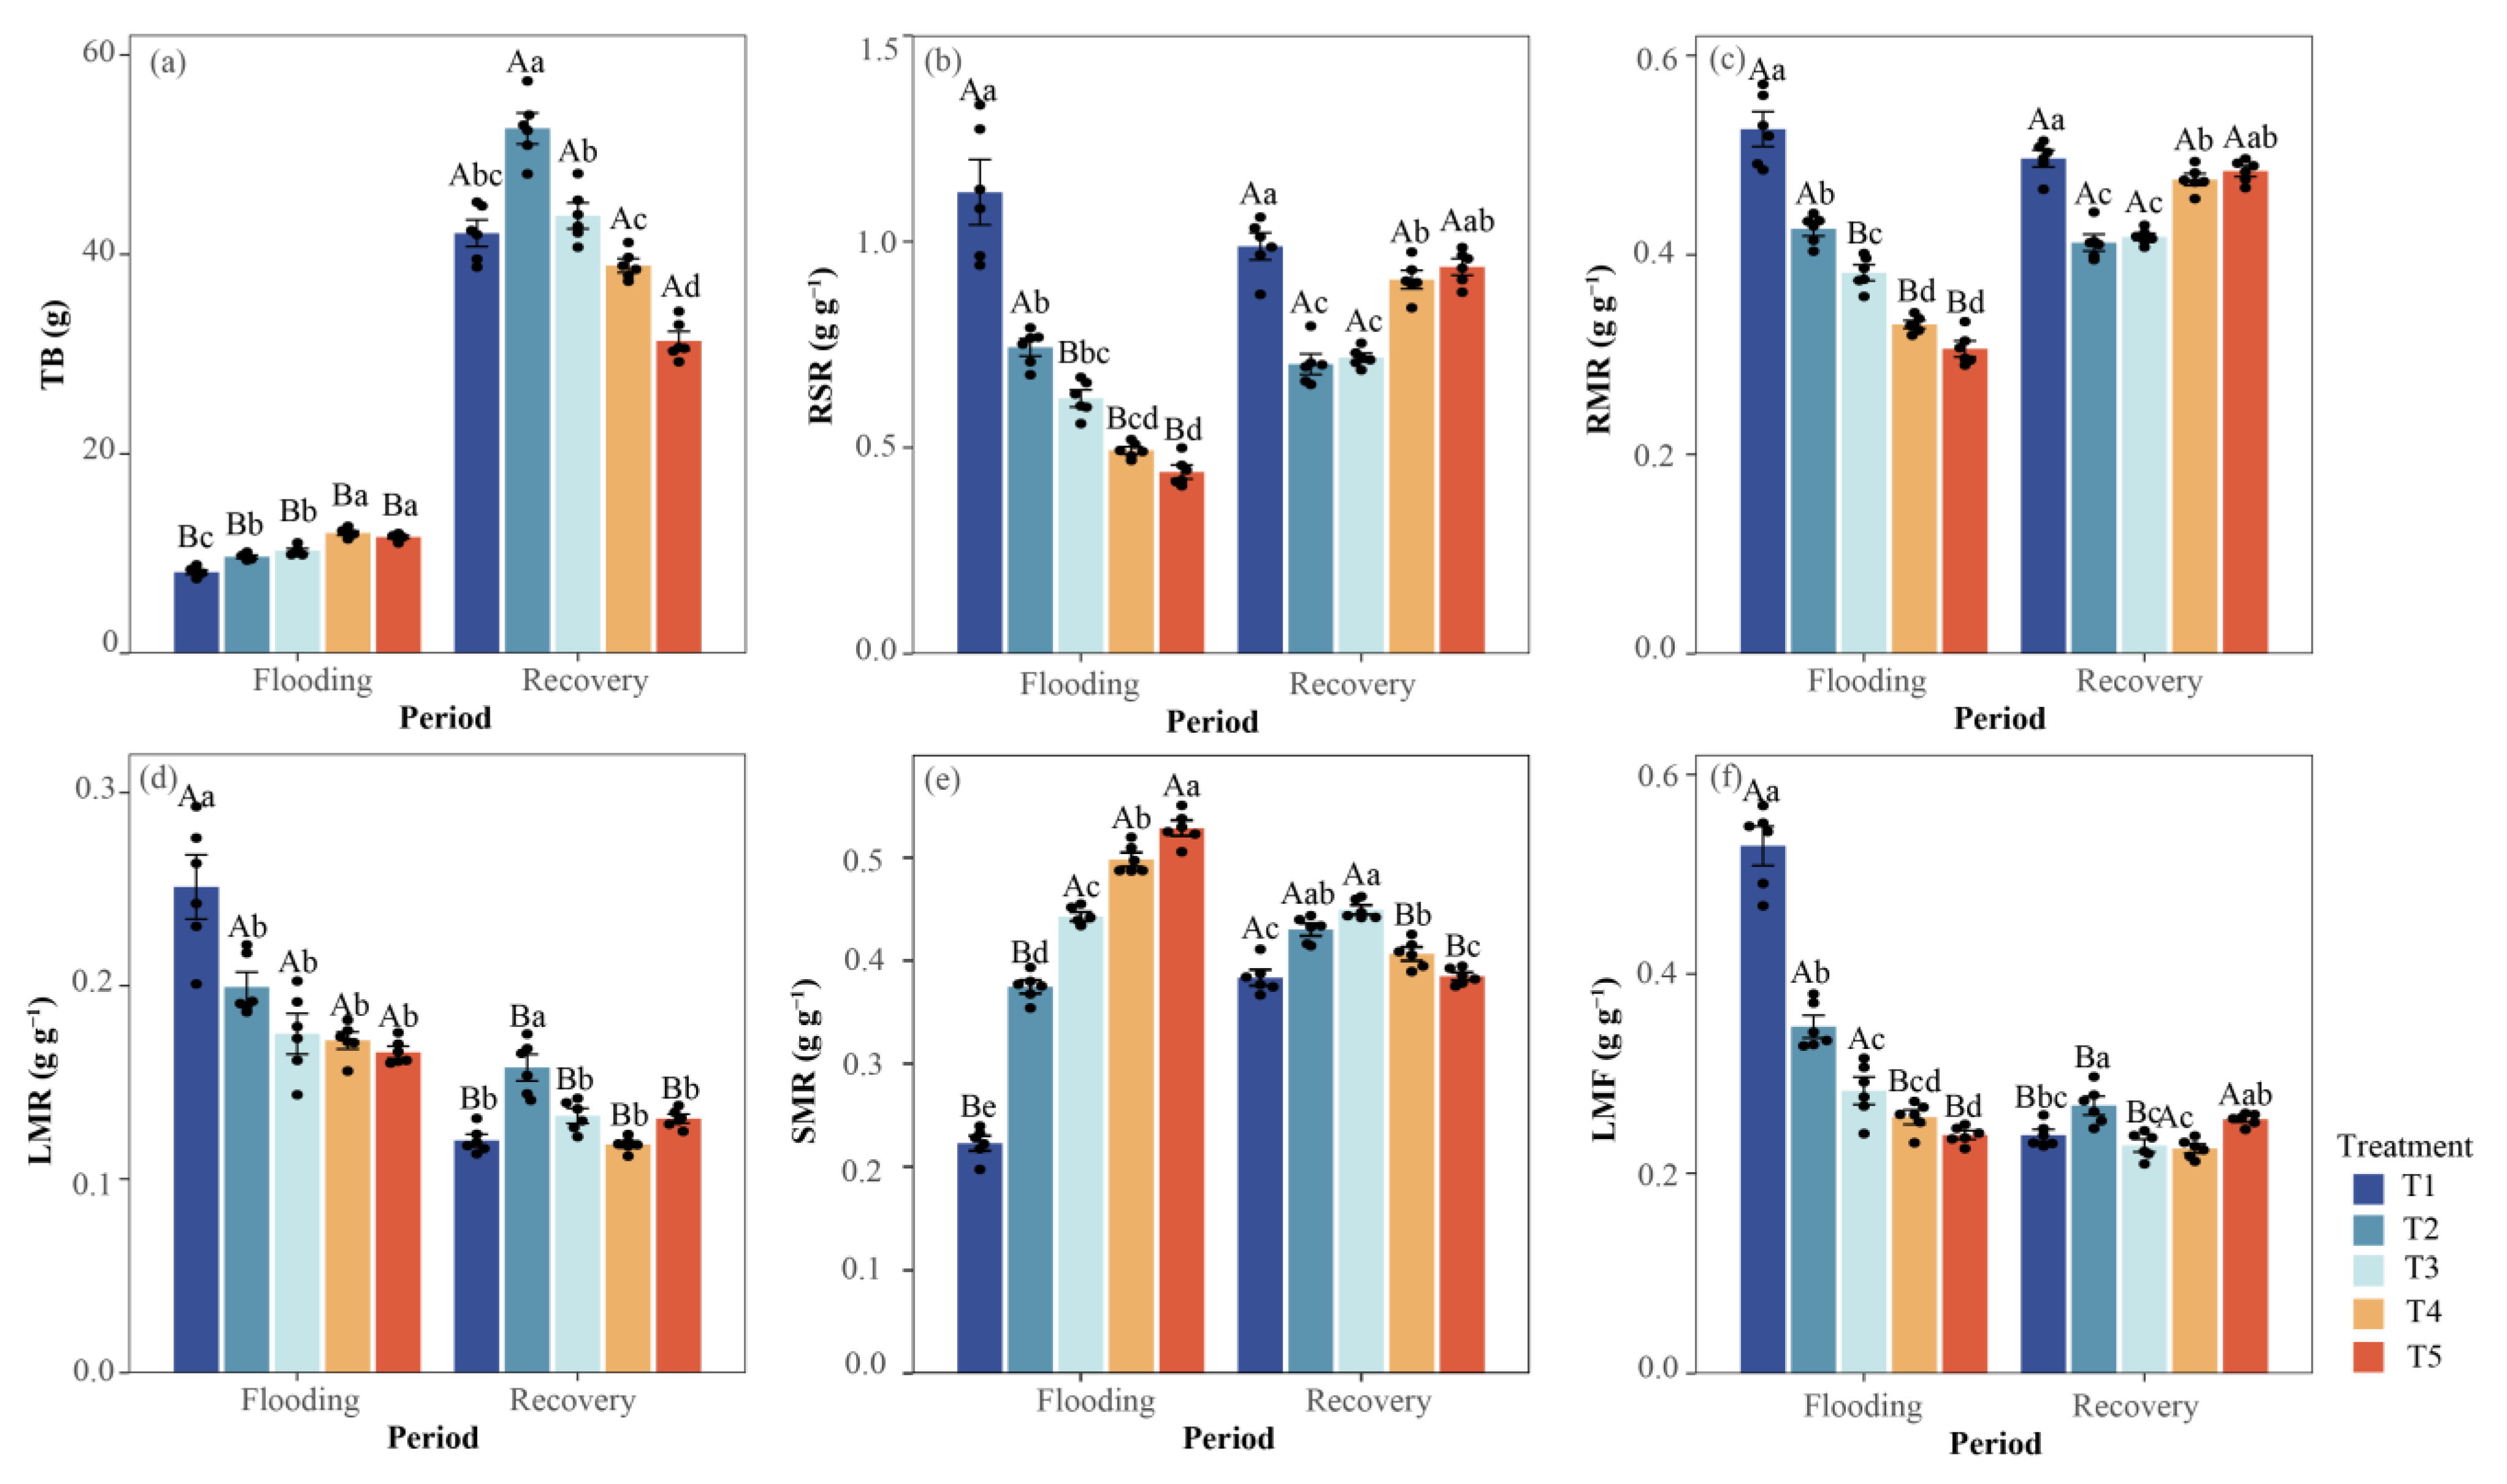
3.1.3. Dry Mass Accumulation

All conditions (treatment, moment, and treatment × moment) had significant effects on biomass and its allocation indicators (p < 0.001), but the effect of treatment on the biomass only reached marginal significance (p = 0.04), whereas the effect of the moment on the SMR was not significant (p > 0.05, Table 3).
At the end of flooding, the total biomass (TB) of the flooded group was significantly higher than that of T1 (8.13 g, p < 0.001), with increases ranging from 1.54 to 3.92 g (Figure 4a). Specifically, the TB was significantly higher in T4 (12.05 g) and T5 (11.65 g) than in T2 (9.67 g) and T3 (10.28 g). Compared to T1, the root-to-shoot ratio (RSR), root-to-mass ratio (RMR), leaf-to-mass ratio (LMR), and leaf-mass fraction (LMF) of the plants post-flooding were significantly reduced, while the stem-to-mass ratio (SMR) increased significantly (Figure 4b–f).
After recovery, the TB increased significantly across the different treatments (p < 0.001, Figure 4a). Notably, the TB reached a maximum value in T2 (52.63 g) and a minimum in T5 (31.33 g), which were significantly different from T1 (42.12 g, p < 0.001). Specifically, the LMR (0.16 g g−1) and LMF (0.27 g g−1) were significantly higher in T2 compared to the other treatment groups (Figure 4d,f). In comparison to T1, the RSR and RMR were significantly lower, and the SMR was significantly higher in T2, T3 and T4, whereas no significant differences were observed between T5 and T1 (Figure 4b,c,e).

3.1.4. Survival Rates

At the end of flooding, C. illinoinensis maintained 100% survival in all treatments except T5 (83.3%, Table 4). No additional mortality of seedlings occurred during the recovery period, and ultimately all treatments showed 100% survival (Table 4).

3.2. Physiological Indicators of C. illinoinensis Under Different Flooding Treatments

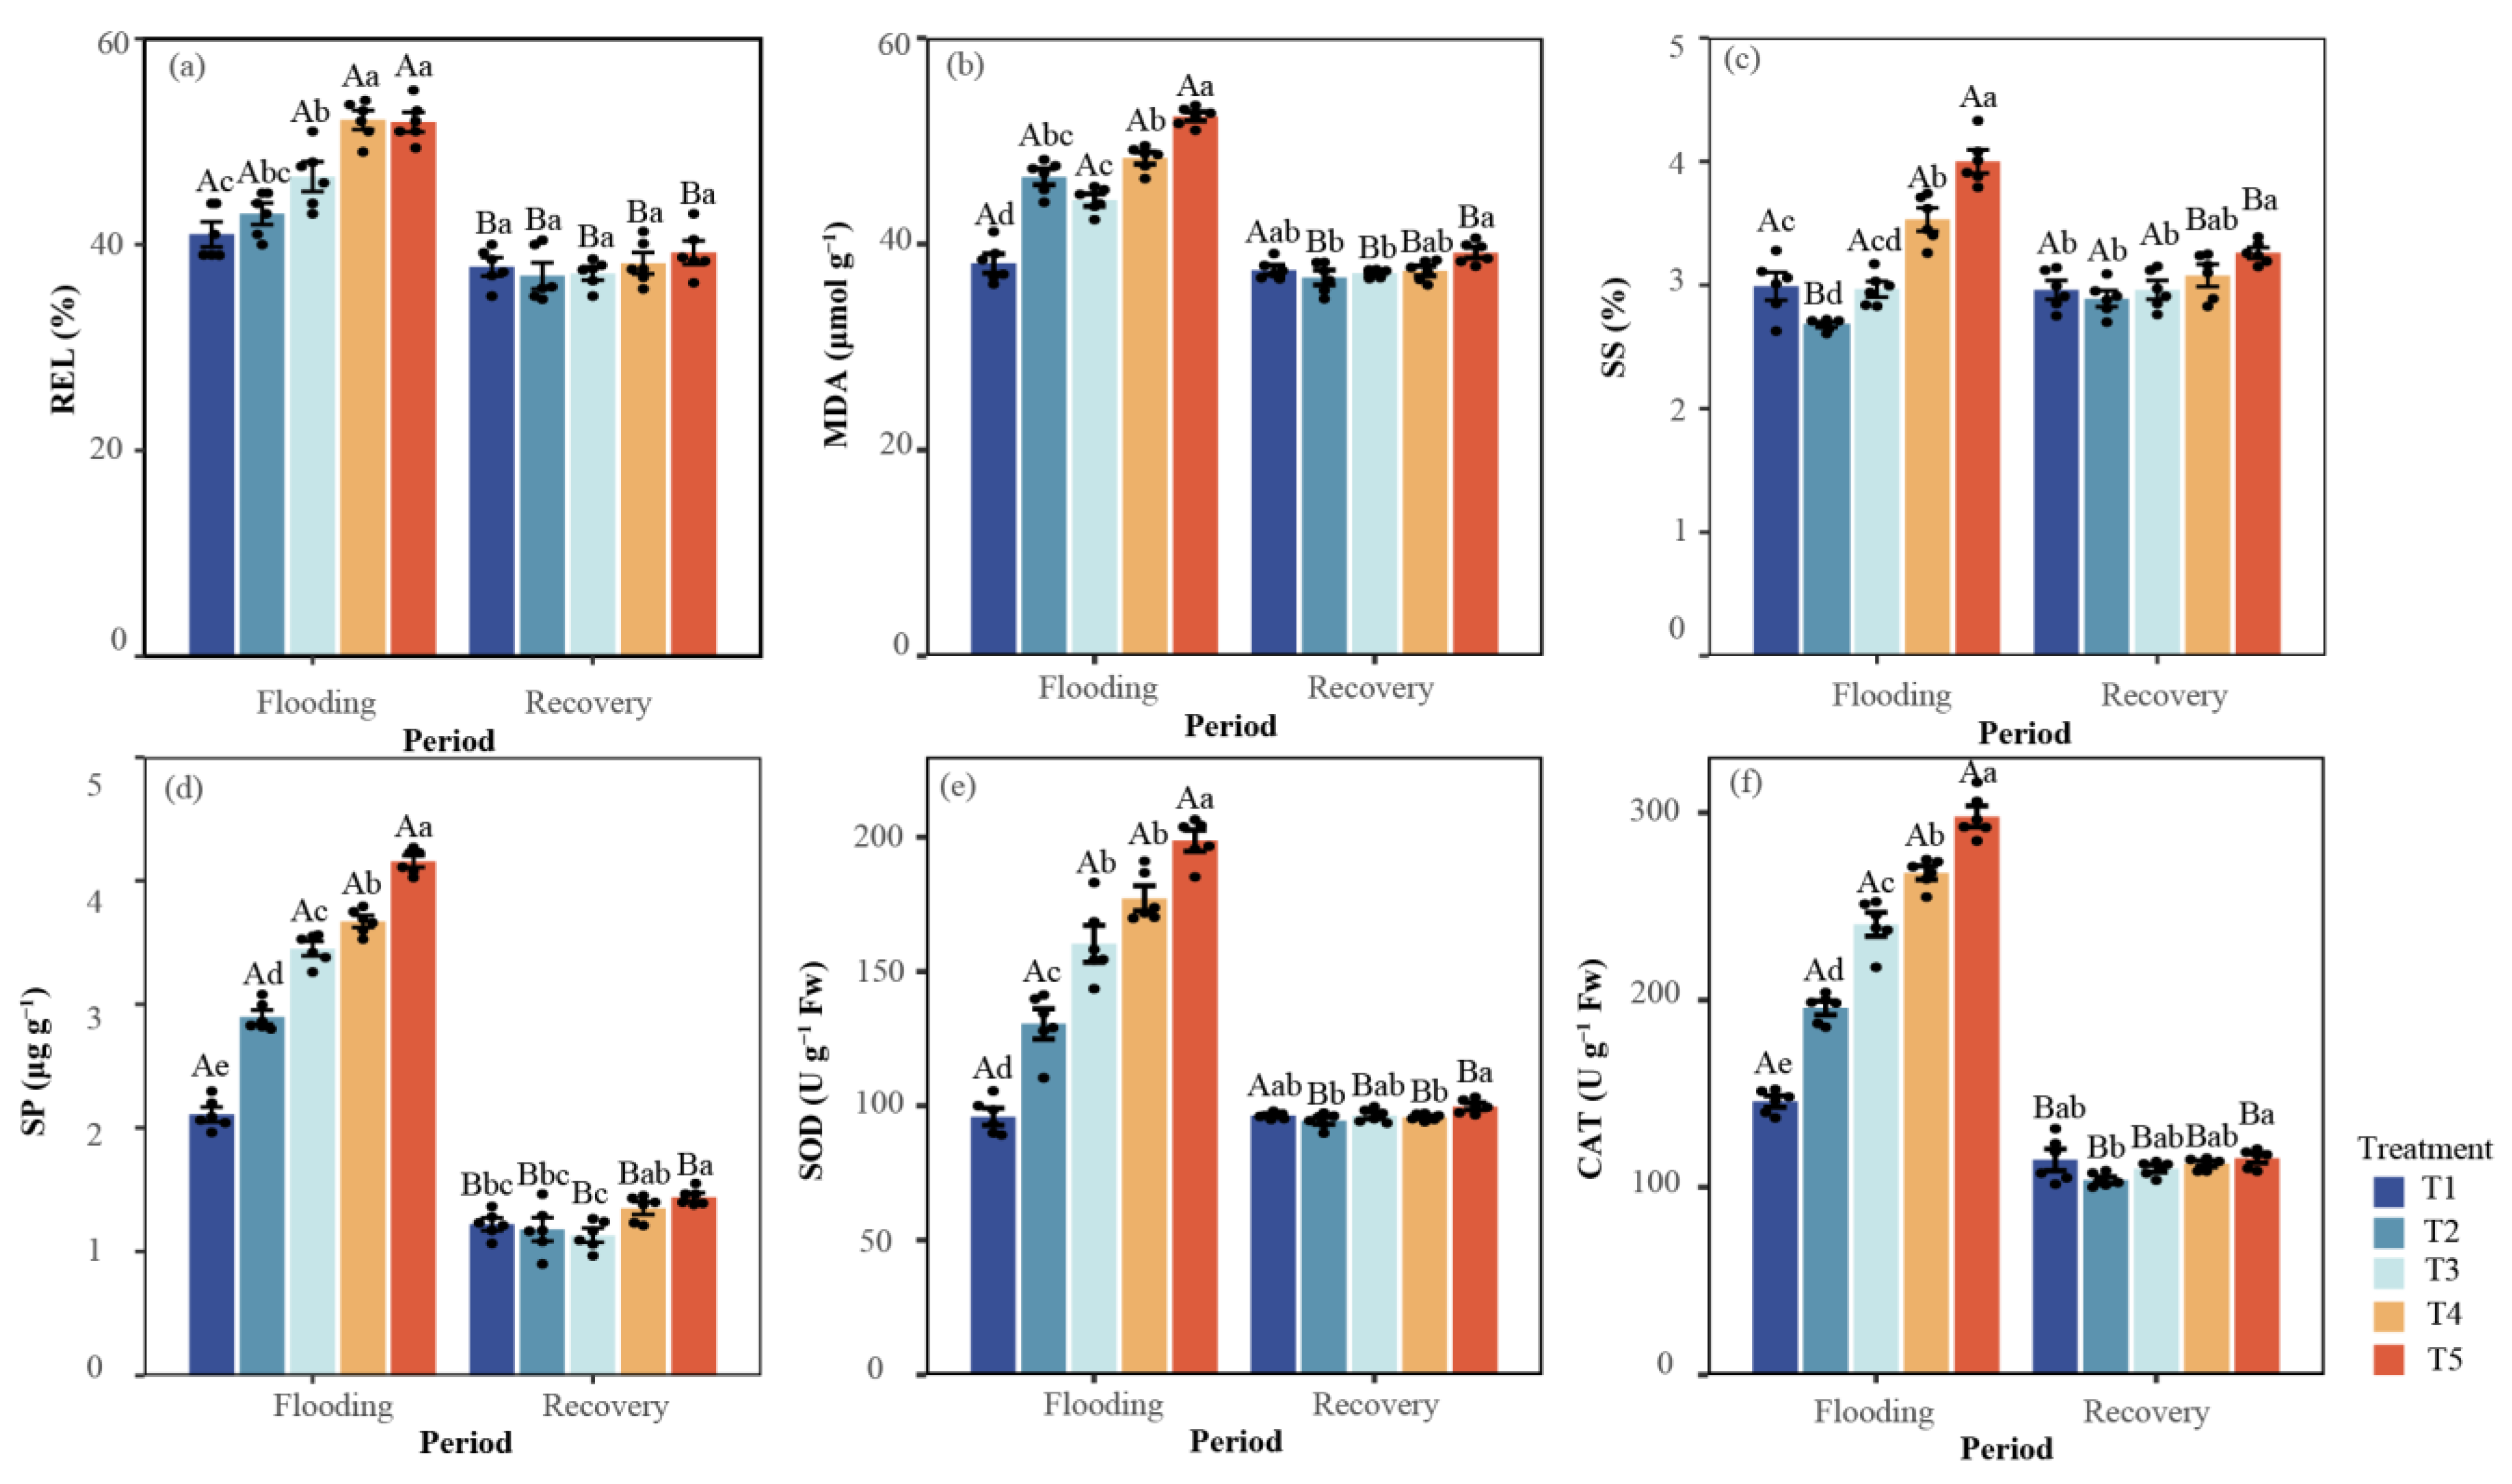
3.2.1. Relative Electrolytic Leakage and Malondialdehyde

As shown in Table 5, all conditions (treatment, moment, and treatment × moment) had highly significant effects on both relative electrolytic leakage (REL) and malondialdehyde (MDA) (p < 0.001).
At the end of flooding, the REL was significantly higher (p < 0.001) in T3 (46.60%), T4 (52.10%), and T5 (51.90%) compared to T1 (41.00%), with increases ranging from 5.60 to 11.10 percentage points (Figure 5a). However, T2 (43.00%) did not exhibit a significant difference from T1. After recovery, the REL decreased significantly across all treatment groups (T1–T5), with a decline from 41% to 37.8% in T1 (p = 0.018). Meanwhile, T2–T5 decreased from 43–51.9% to 36.97–39.23% (p < 0.001). But there were no significant differences among the treatments.
At the end of flooding, the MDA content was significantly increased in all flooded groups (T2–T5) compared to T1 (38.11 μmol g−1, p < 0.001) (Figure 5b). After recovery, the MDA content in T2–T5 decreased by 16.05–25.26% (all p < 0.001). At that time, the MDA content of T5 (39.17 μmol g−1) retained maximum value and was significantly higher than that of T2 (Δ = 2.42 μmol g−1, 95%CI: 0.62–4.23) and T3 (=2.01 μmol g−1, 95%CI: 0.21–3.81).

3.2.2. Soluble Sugar and Soluble Protein

As shown in Table 5, all conditions (treatment, moment, and treatment × moment) had highly significant effects on both soluble sugar (SS) and soluble protein (SP) (p < 0.001).
At the end of flooding, the SS content was lower in T2 (Δ = 0.31%, 95%CI: 0.11–0.61) and higher in T4 (Δ = 0.54%, 95%CI: 0.24–0.84) and T5 (Δ = 1.01%, 95%CI: 0.71–1.31) compared to T1 (2.99%) (Figure 5c). After recovery, the SS was significantly increased in T2 (p = 0.031), while it was significantly decreased in T4 and T5 (p < 0.001). Notably, the SS remained at its maximum in T5 (3.26%), significantly higher than in T1 (Δ = 0.30%, 95%CI: 0.04–0.56), T2 (Δ = 0.37%, 95%CI: 0.11–0.63) and T3 (Δ = 0.30%, 95%CI: 0.04–0.56).
At the end of flooding, the SP content exhibited significant variation across treatments (p < 0.001), and a gradient increasing trend with increasing stress intensity: T1 < T2 < T3 < T4 < T5 (Figure 5d). After recovery, the SP content of T1–T5 decreased by 42.18–67.25% (p < 0.001). Similarly, the SP content of T5 (1.44 μg g−1) remained significantly higher than that of T1 (Δ = 0.22 μg g−1, 95%CI: 0.01–0.44), T2 (Δ = 0.26 μg g−1, 95%CI: 0.05–0.48) and T3 (Δ = 0.31 μg g−1, 95%CI: 0.10–0.53) at the end of recovery.

3.2.3. Superoxide Dismutase and Catalase
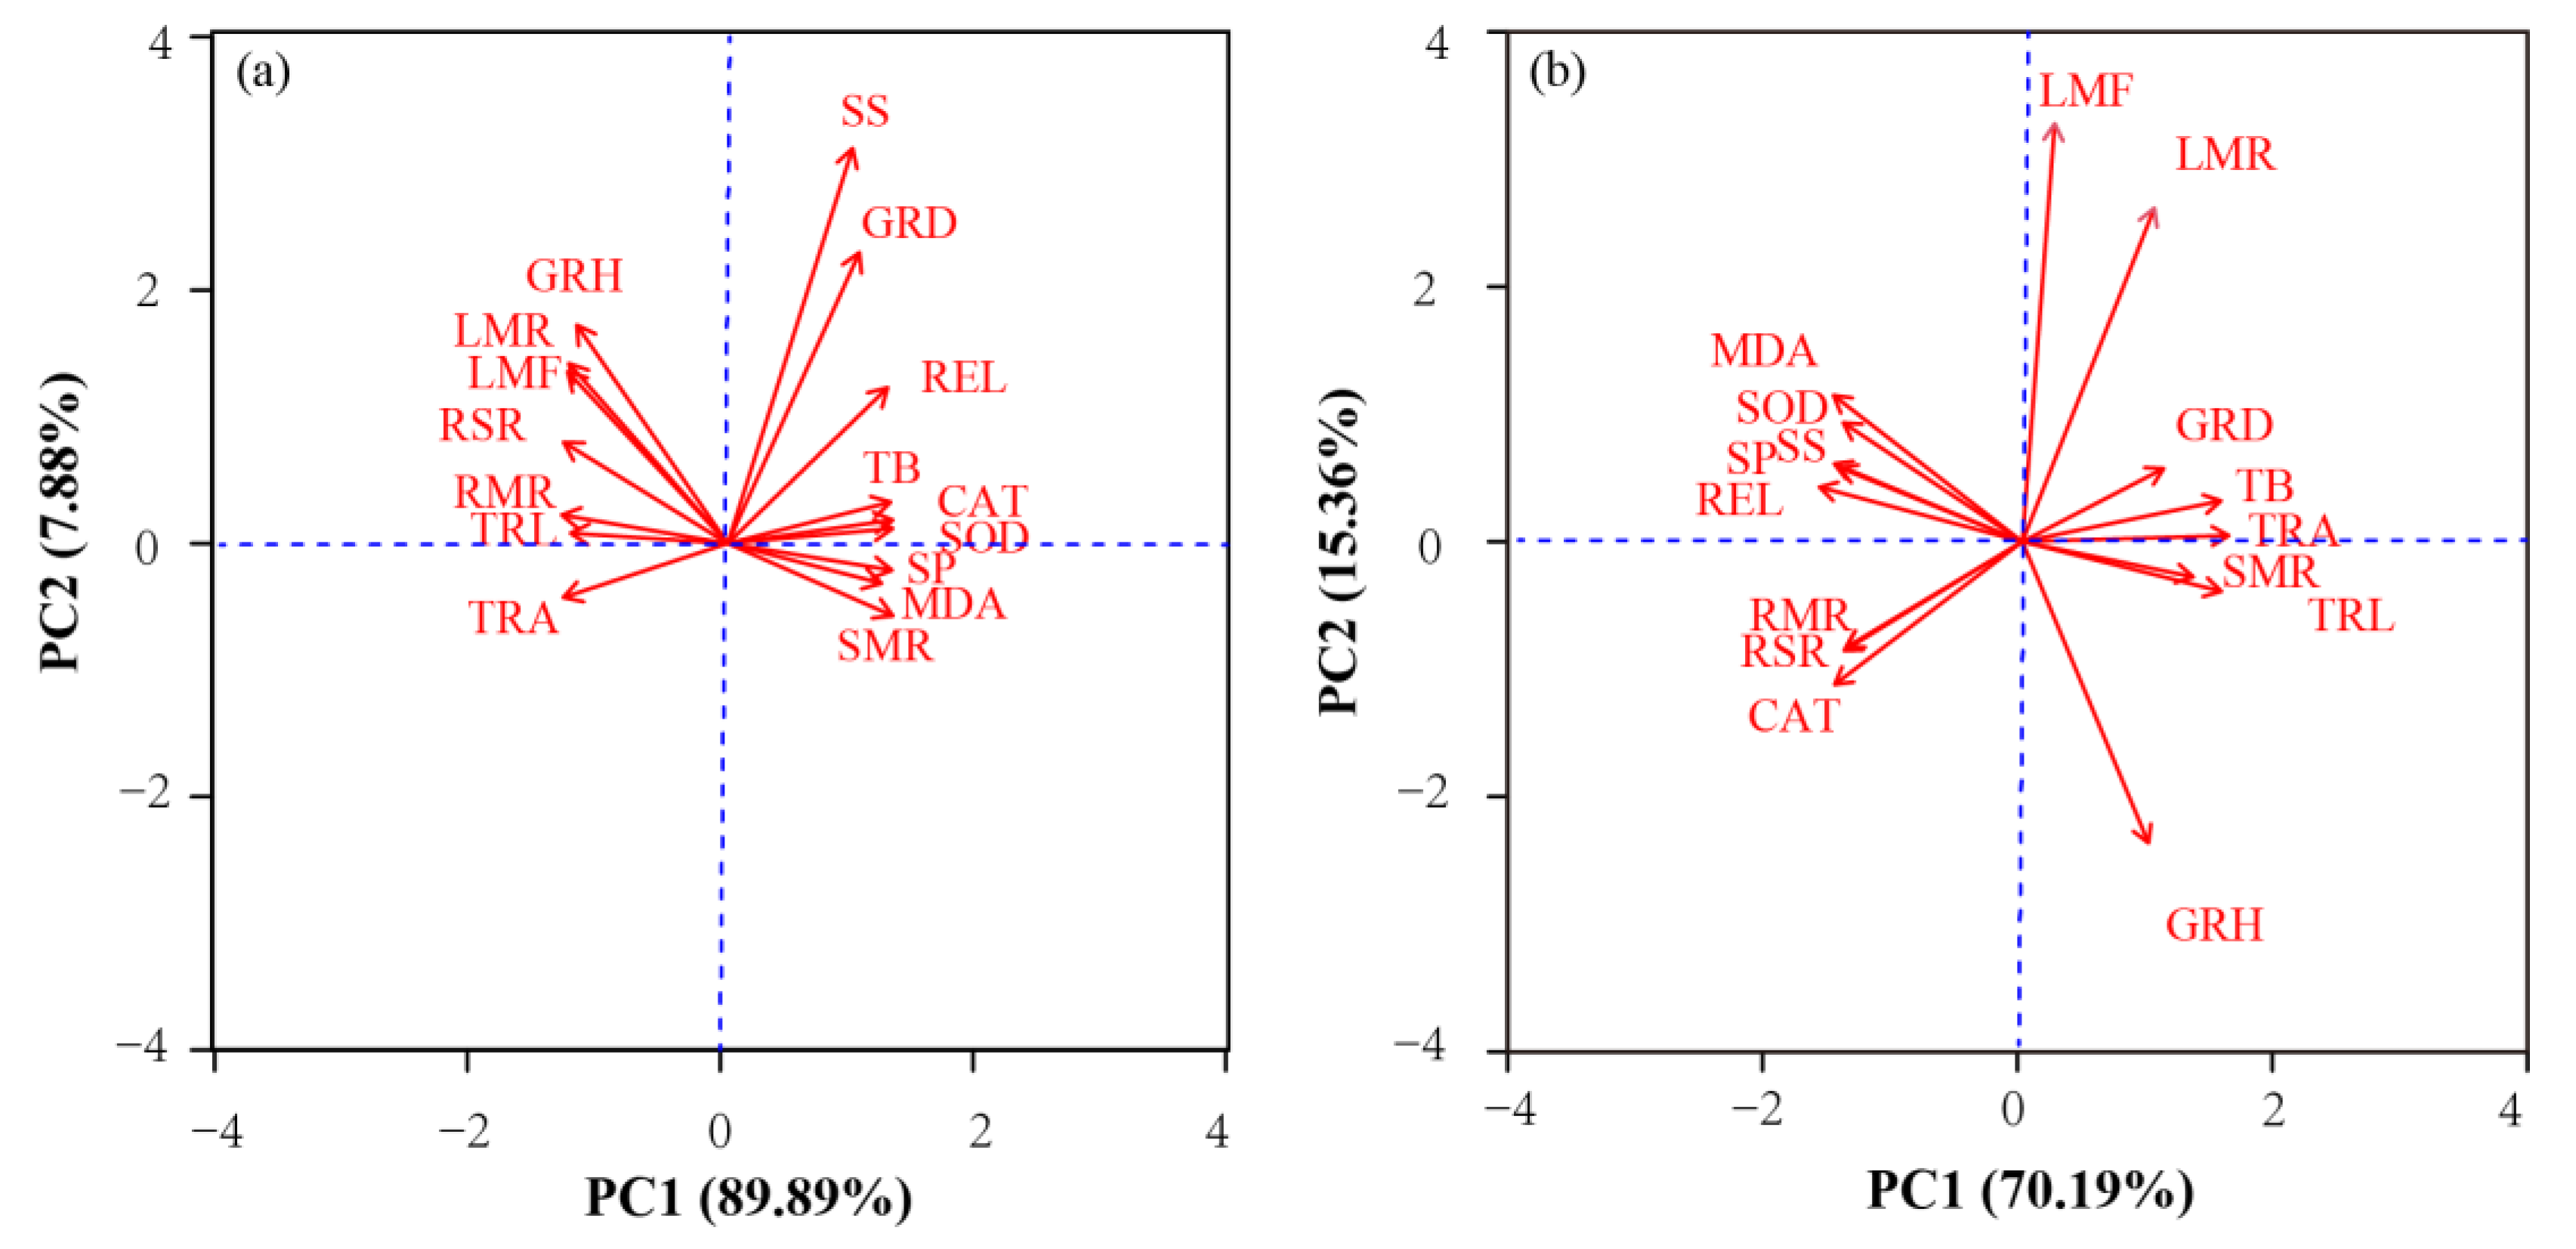
As shown in Table 5, all conditions (treatment, moment, and treatment × moment) had highly significant effects on both superoxide dismutase (SOD) and catalase (CAT) (p < 0.001).
At the end of flooding, SOD activity in the flooded group (T2–T5) increased overall with stress intensity by 35.96–107.03% (p < 0.001) compared to T1 (95.98 U g−1 Fw) (Figure 5e). After recovery, although SOD activity decreased by 27.62–49.78% (p < 0.001) in the flooded group, T5 (99.79 U g−1 Fw) remained significantly higher than T2 (Δ = 5.34 U g−1 Fw, 95%CI: 1.55–9.13) and T4 (Δ = 4.03 U g−1 Fw, 95%CI: 0.24–7.82).
At the end of flooding, CAT activity exhibited a significant stress intensity-dependent response (p < 0.001), which increased sequentially from T1 to T5 as the gradient of treatment intensity increased (Figure 5f). At the end of recovery, CAT activity decreased by 21.43–61.28% (p < 0.001) in all treatment groups, with the lowest activity in T2 (103.75 U g−1 Fw), which was significantly lower than that in T5 (Δ = 11.67 U g−1 Fw, 95%CI: 0.53–22.81).

3.3. PCA Analysis

At the end of flooding, principal component analysis (PCA) was conducted on the 16 indicators mentioned above. Following the standardization of these indicators, the eigenvalues of the rotated correlation coefficient matrix and their variance contributions were derived according to the analysis procedures (Table 6). The first two axes accounted for 97.75% of the information regarding the adaptation of C. illinoinensis to flooding stress (Table 6, Figure 6a). Specifically, the eigenvalue of PC1 was 14.38, explaining 89.89% of the total variance, with all the indicators exhibiting high loading on it (|Loading| > 0.7). The eigenvalue of PC2 was 1.26, which accounted for 7.88% of the variance. The rotated component score coefficient matrix was obtained through a variance-maximizing orthogonal rotation, and all the variables contributed to the first and second principal components, as calculated in Equations (14) and (15), where the variables represent standardized values. Equation 16 was used to integrate the principal component scores of PC1 and PC2 for a systematic assessment of the response characteristics of C. illinoinensis at the end of flooding. The results indicate that the growth and physiological responses of C. illinoinensis to stress were most pronounced in the order of T5 > T4 > T3 > T2 > T1 (Table 7).
Z 1 = 0.263 R M R + 0.263 S M R + 0.262 C A T + 0.261 S O D 0.261 T R A + 0.260 S P 0.260 R S R + 0.259 T B + 0.254 R E L 0.254 L M R 0.253 L M F 0.249 T R L 0.244 M D A 0.240 G R H + 0.209 G R D + 0.198 S S
Z 2 = 0.556 S S + 0.393 G R D + 0.315 G R H + 0.247 L M F + 0.231 L M R + 0.213 R E L + 0.144 R S R 0.088 S M R 0.071 T R A 0.055 M D A + 0.051 T B + 0.051 R M R + 0.035 C A T 0.034 S P + 0.023 S O D + 0.005 T R L
Z = 0.8989Z1 + 0.0788Z2
Similarly, the standardization of indicators at the end of the recovery yielded the eigenvalues of the rotated correlation coefficient matrix and its variance contribution (Table 6). The first two axes of the PCA explained 85.55% of the information regarding the adaptation of C. illinoinensis to flooding stress (Table 6, Figure 6b). The eigenvalue of PC1 was 11.23, with a variance ratio of 70.19%, primarily contributed by TRL, TRA, TB, RSR, RMR, SMR, REL, MDA, SS, SP, SOD, and CAT. PC2 had an eigenvalue of 2.46, accounting for a variance ratio of 15.36%, which mainly included GRH, LMR, and LMF. The coefficient matrix of the rotated component scores was derived through variance-maximizing orthogonal rotation, using the formulas presented in Equations (17) and (18). PC1 and PC2 were utilized as composite indices to assess its characteristics at the end of recovery (Equation (19)). The results demonstrate that the magnitude of response of C. illinoinensis to stress during recovery followed the order T5 > T1 > T4 > T3 > T2 (Table 7).
Z 1 = 0.997 T R A + 0.977 R E L 0.963 T B 0.963 T R L + 0.913 C A T + 0.910 M D A + 0.907 S S + 0.875 S P + 0.866 S O D + 0.852 R S R + 0.828 R M R 0.816 S M R 0.684 G R D 0.302 L M F 0.598 G R H 0.657 L M R
Z 2 = 0.93 L M F 0.724 G R H + 0.714 L M R + 0.334 M D A 0.296 C A T 0.282 R M R + 0.271 S O D + 0.203 G R D 0.2 R S R 0.189 S M R + 0.161 S P + 0.155 S S + 0.127 R E L 0.122 T R L + 0.096 T B 0.007 T R A
Z = 0.7019Z1 + 0.1536Z2

4. Discussion

The frequency of extreme flooding events under future climate change scenarios, particularly in the Yangtze River Basin, poses a significant threat to the growth of neighboring forests and presents a serious challenge to natural resource managers [30,31]. When artificially regenerating forests in the region, practitioners must have a detailed understanding of the adaptations of each species to local conditions [32]. C. illinoinensis, an excellent water-tolerant plant, is widely planted along rivers and on plains around lakes [33]. This study aims to provide information on the flooding tolerance of C. illinoinensis and considers these species for replanting management in the Yangtze River protection forests. Furthermore, the threat of flooding to plants exists not only during the flooding itself but also after the flooding has receded. Therefore, this study separately discusses coping strategies for C. illinoinensis both during flooding and post-flood recovery.

4.1. Response of C. illinoinensis During Flooding Period

In this study, we found a significant increase in the GRD at T4 and T5 at the end of the flooding period (Table 1), which may be due to the appearance of hypertrophic lenticels at the base of the stem. It has been suggested that this is the signature morphological response of flood-tolerant woody plants to flooding [34,35]. Plants adapted by increasing the total area of O2-absorbing tissues exposed to the air, forming hypertrophied lenticels, ventilated tissues, or adventitious roots [26,36], thereby enhancing the ventilation of flooded organs to avoid energy crises caused by hypoxia [37]. Furthermore, plant height responded differently to flooding stress. For example, Barringtonia acutangula [38], Taxodium ‘Zhongshanshan’, and T. distichum [39] adopted the LOES strategy [14], characterized by rapid height growth to escape the flooded environment and access more oxygen. Conversely, Zelkova serrata [40] and Poplar [41] adopted the LOQS strategy [14], which involved reducing the growth rate, maintaining low energy requirements, and improving stress tolerance duration. In this study, the GRH showed a decreasing trend with increasing depth of flooding (Table 1), but still maintained a high survival rate (100% for T1–T4; 83.3% for T5, Table 4). This may be due to the fact that C. illinoinensis prioritize the allocation to essential survival functions rather than vertical growth.
The root system is the primary organ of the plant that senses and adjusts to changes in the soil environment. In this study, the plants TRA showed a decreasing trend with increasing flooding stress (Table 2). This is similar to the results reported by Palta [42], which indicate that root growth and proliferation essentially ceased under flooded conditions. This can be attributed to the prolonged flooding stress, which hampers timely recovery of the damage caused. Consequently, plants adjust the distribution of assimilated products between aboveground and belowground parts, decreasing allocation to the root system while increasing allocation to aboveground parts [17]. This is consistent with the results of the present study, where the RSR and RMR were significantly reduced in flooded plants (Figure 4b,c). Under this allocation strategy, plants channel fewer assimilated products to the roots, thereby reducing metabolic stress on the root system. In addition, we also observed that the increased aboveground allocation was primarily concentrated in the stems rather than the leaves (Figure 4d–f). This may be due to a strategy to reduce leaf water transpiration and enhance stem water and aeration capacity, thus maintaining the plant’s resistance to flooding.
Furthermore, plants under flooding stress adapt by adjusting their physiological molecular metabolism or physiological structure to mitigate damage [43]. Typically, during adverse conditions, the balance of free radical metabolism in plant cells is disrupted, leading to the accumulation of MDA, the end product of membrane lipid peroxidation, in large quantities [44,45]. Additionally, plants counteract the accumulation of free radicals and reactive oxygen species in their cells by amassing osmoregulatory substances [46] and enhancing antioxidant enzyme activities [47,48,49], which represent their adaptive responses [50,51,52]. Similar results were observed in most of the physiological indicators in this study, except for REL at T2 and SS at T3, which did not show significant differences compared to the control group (Figure 5). This discrepancy might be attributed to the extent of stress influencing these indicators.
PCA analysis indicates that all indicators exhibited higher loadings on PC1 (Table 6), potentially due to the synergistic changes induced by flooding stress. This has been reported in a variety of woody seedlings. For example, the levels of MDA, SS, SP, SOD, and POD in Xanthoceras sorbifolia also showed significant increases [53]. Similarly, Morinda citrifolia demonstrated significant increases in proline, MDA, SOD, and POD under flooding conditions [54]. Furthermore, we observed a positive correlation between the overall degree of damage in C. illinoinensis and the flooding depth, following the order of T5 > T4 > T3 > T2 > T1 (Table 7). This finding aligns with the study on flooding stress in Artemisia selengensis [55], which revealed a significant gradient of damage at a flooding level of 20–30 cm.

4.2. Response of C. illinoinensis During Recovery Period

At the end of recovery, the GRD of T4 and T5 was significantly reduced and markedly lower than that of the other treatment groups (Table 1). This indicates that the hypertrophied lenticels gradually returned to normal levels after the stress was alleviated [56]. In addition, seedlings subjected to different flooding treatments exhibited significant growth (GRH, TRL, TRA, etc.) by the end of the recovery period compared to the end of the flooding period (Table 1 and Table 2), which is consistent with the results of Agayev [57]. Acevedo described this phenomenon as the “compensatory effect,” whereby the growth traits of flood-tolerant species can be restored after flooding, demonstrating a positive self-regulation ability [58].
In terms of biomass, most of the flooded seedlings (T2, T3, T4) in this study resumed growth after stress relief and even outperformed the control (T2 > T1). Specifically, the biomass distribution of T2, T3, and T4 was concentrated in the aboveground parts (Figure 4). It indicates that after flooding alleviation, plants increase aboveground biomass through mechanisms such as leaf number augmentation [11], resumption of photosynthesis [59], and resource reallocation [17], thereby promoting plant growth recovery. Notably, growth indicators such as GRH, TRL, TRA, and TB at the end of the recovery period all reached their minimum values in T5, suggesting a nonlinear relationship between its recovery ability and the flooding treatment. This may be due to T5 exceeding the critical point (threshold) for plants to self-restore growth [60,61].
The recovery process after stress relief is also a process of cellular structural and functional repair and scavenging of accumulated peroxides such as MDA. In this study, most physiological indicators of flooded seedlings were significantly reduced at the end of the recovery period (Figure 5), showing little difference from T1, consistent with many other studies. Zeng et al. [12] found that REL, MDA, SOD, and CAT decreased in most peanut varieties during the recovery period compared to post-flooding. Shao et al. [60] studied the physiology and biochemistry of Pinus massoniana under drought stress and found that SS, SP, MDA, and SOD steadily returned to normal during the recovery process. The main reason behind this phenomenon is that when plants are removed from a stressful environment, they do not need to improve resistance by regulating physiological indicators. However, it has been shown that oxidized substances produced by abiotic stress can have long-lasting cellular effects [62] and may be converted into more toxic secondary metabolites during catabolism, continuing to adversely affect plant recovery. In the present study, the content of MDA, SS, and PR in T5 were still significantly higher than those in T1 (Figure 5), which may be due to the adverse effects of oxidized substances produced during the flooding period.
PCA analysis revealed that at the end of the recovery period, C. illinoinensis was primarily associated with root growth characteristics, resource allocation strategies, and physiological adaptive capacity, followed by aboveground growth indicators (Figure 6). This finding aligns with the results of Zhao et al. [54], which indicate that plants enhance recovery growth by optimizing the allocation of assimilated products after the cessation of flooding stress. Notably, the overall degree of damage to C. illinoinensis at the end of the recovery was ranked as T5 > T1 > T4 > T3 > T2 (Table 7), suggesting that the damage extent in T5 had surpassed its self-repair threshold, leading to ineffective recovery by the end of the recovery period.

4.3. Limitations

This study was conducted in a micro-ecosystem, which has both advantages and limitations. One advantage of microecological studies is the ability to isolate independent variables, making it easier to determine the response of a specific dependent variable [63]. However, micro-experiments may differ from the natural systems they model in many important ways. For instance, it is difficult to match the simulated experiments exactly with actual habitat changes in the Yangtze River Basin in terms of ecological factors such as water temperature and composition, dissolved oxygen content, turbidity, soil structure and nutrients, and light intensity. Whether the performance of plants in the actual habitat is consistent with the simulation results needs to be verified by subsequent field investigations. In addition, this study focused only on the effects of flooding stress on the growth and basic physiological indicators of C. illinoinensis, while gaps still exist in the dynamic process of photosynthesis as well as molecular marker experiments. The effects of other ecological factors and the synergistic effects between factors on plants have also not been thoroughly explored. Therefore, future research will involve establishing fixed plots in the Yangtze River Basin and conducting long-term monitoring that integrates other indicators (such as photosynthetic rate and gene expression regulation) along with relevant ecological factors to investigate the adaptation mechanisms and resilience of plants in their natural habitat.

5. Conclusions

C. illinoinensis under five different treatments exhibited varying responses during the flooding and recovery periods. At the end of the flooding period, C. illinoinensis adapted to the flooded environment by inhibiting root growth, increasing stem partitioning, accumulating osmoregulatory substances, and enhancing antioxidant enzyme activities. Although the high-stress treatment (T5) resulted in a temporary decrease in survival to 83.3%, all seedlings recovered at the end of the recovery period, confirming the positive self-regulation capacity of this species. These characteristics make it a preferred species for flooding adaptation, and its potential for field application warrants further investigation in subsequent studies.

Author Contributions

Conceptualization, X.C. and H.H.; methodology, X.C.; software, X.C.; validation, C.W. and L.Z.; formal analysis, X.C.; investigation, X.C.; resources, X.C.; data curation, C.W.; writing—original draft preparation, X.C.; writing—review and editing, X.C.; visualization, X.C.; supervision, H.H.; project administration, H.H.; funding acquisition, H.H. All authors have read and agreed to the published version of the manuscript.

Funding

This research was funded by the Jiangsu Province Carbon Peak and Carbon Neutrality Technology Innovation Special Fund Project in 2021 (BE2022305); Positioning research project of forest ecological system in the Yangtze River delta of National Forestry and Grassland Administration (2021132068); Technical support and collaboration project from the Wuxi Water Conservancy Bureau (2107116).

Data Availability Statement

Data contained in this study are available on request from the corresponding authors.

Conflicts of Interest

The authors declare no conflicts of interest.

References

  1. Knapp, A.K.; Beier, C.; Briske, D.D.; Classen, A.T.; Luo, Y.; Reichstein, M.; Smith, M.D.; Smith, S.D.; Bell, J.E.; Fay, P.A.; et al. Consequences of More Extreme Precipitation Regimes for Terrestrial Ecosystems. Bioscience 2008, 58, 811–821. [Google Scholar] [CrossRef]
  2. Bailey-Serres, J.; Voesenek, L. Flooding Stress: Acclimations and genetic diversity. Annu. Rev. Plant Biol. 2008, 59, 313–339. [Google Scholar] [CrossRef] [PubMed]
  3. Lopez, O.R.; Kursar, T.A. Does flood tolerance explain tree species distribution in tropical seasonally flooded habitats? Oecologia 2003, 136, 193–204. [Google Scholar] [CrossRef] [PubMed]
  4. Renziehausen, T.; Frings, S.; Schmidt-Schippers, R. ‘Against all floods’: Plant adaptation to flooding stress and combined abiotic stresses. Plant J. 2024, 117, 1836–1855. [Google Scholar] [CrossRef] [PubMed]
  5. Li, H.; Li, Z.; Shen, Z.J.; Luo, M.R.; Liu, Y.L.; Wei, M.Y.; Wang, W.H.; Qin, Y.Y.; Gao, C.H.; Li, K.K.; et al. Physiological and proteomic responses of mangrove plant seedlings to simulated periodical inundation. Plant Soil 2020, 450, 231–254. [Google Scholar] [CrossRef]
  6. Zeng, R.; Chen, T.; Wang, X.; Cao, J.; Li, X.; Xu, X.; Chen, L.; Xia, Q.; Dong, Y.; Huang, L.; et al. Physiological and Expressional Regulation on Photosynthesis, Starch and Sucrose Metabolism Response to Waterlogging Stress in Peanut. Front. Plant Sci. 2021, 12, 601771. [Google Scholar]
  7. Zhao, T.; Li, Q.; Pan, X.J.; Hua, X.F.; Zhang, W.E. Adaptation mechanism of terrestrial plants to waterlogging stress. J. Plant Physiol. 2021, 57, 2091–2103. (In Chinese) [Google Scholar]
  8. Schindler, M.; Jungmann, L.; Donath, T.W.; Ludewig, K. Influence of flooding duration and aeration on saplings of ten hardwood floodplain forest species. PLoS ONE 2020, 15, e0234936. [Google Scholar] [CrossRef]
  9. Daniel, K.; Hartman, S. How plant roots respond to waterlogging. J. Exp. Bot. 2024, 75, 511–525. [Google Scholar] [CrossRef]
  10. Markus-Michalczyk, H.; Hanelt, D.; Jensen, K. Effects of Tidal Flooding on Juvenile Willows. Estuaries Coasts 2016, 39, 397–405. [Google Scholar] [CrossRef]
  11. Sun, L.; Li, X.; Wang, X.; Xiang, L.; Yang, J.; Min, Q.; Chen, G.; Chen, F.; Huang, C.; Wang, G. Growth and respiratory metabolic adaptation strategies of riparian plant Distylium chinense to submergence by the field study and controlled experiments. Plant Physiol. Biochem. 2020, 157, 1–12. [Google Scholar] [CrossRef]
  12. Zeng, R.; Cao, J.; Li, X.; Wang, X.; Wang, Y.; Yao, S.; Gao, Y.; Hu, J.; Luo, M.; Zhang, L.; et al. Waterlogging tolerance and recovery capability screening in peanut: A comparative analysis of waterlogging effects on physiological traits and yield. PeerJ 2022, 10, e12741. [Google Scholar] [CrossRef]
  13. Sanchez, F.W.; Crane, J.H.; Bayabil, H.; Sarkhosh, A.; Shahid, M.A.; Schaffer, B. Physiological and biochemical responses of the achachairu tree (Garcinia humilis) to prolonged flooding. Sci. Hortic. 2024, 337, 113573. [Google Scholar] [CrossRef]
  14. Voesenek, L.; Bailey-Serres, J. Flood adaptive traits and processes: An overview. New Phytol. 2015, 206, 57–73. [Google Scholar] [CrossRef] [PubMed]
  15. Nakamura, M.; Noguchi, K. Tolerant mechanisms to O2 deficiency under submergence conditions in plants. J. Plant Res. 2020, 133, 343–371. [Google Scholar] [CrossRef] [PubMed]
  16. Colmer, T.D.; Voesenek, L.A.C.J. Flooding tolerance: Suites of plant traits in variable environments. Funct. Plant Biol. 2009, 36, 665–681. [Google Scholar] [CrossRef] [PubMed]
  17. Mozo, I.; Rodríguez, M.E.; Monteoliva, S.; Luquez, V.M.C. Floodwater Depth Causes Different Physiological Responses During Post-flooding in Willows. Front. Plant Sci. 2021, 12, 575090. [Google Scholar] [CrossRef]
  18. Zhou, Z.; Li, G.; Chao, W.; Xu, F.; Sun, X.; Chen, Z. Physiological Responses and Tolerance Evaluation of Five Poplar Varieties to Waterlogging. Not. Bot. Horti Agrobot. 2019, 47, 658–667. [Google Scholar] [CrossRef]
  19. Samir, S.; Poliana, L.; Lucas, H.; Gonçalves, R.L.M.; Caroline, M.; Luis, C.R.; Luisa, S.T. Assessing the role of light in flooding tolerance for tree species recommendation in the restoration of riparian subtropical forests. Trees 2022, 37, 403–415. [Google Scholar] [CrossRef]
  20. Briceno-Contreras, E.A.; Moreno-Resendez, A.; Valenzuela-Nunez, L.M.; Garcia-De la Pena, C.; Esparza-Rivera, J.R.; Rodriguez-Martinez, R.; Molina-Ochoa, J. Influence of temperature and irradiation on starch concentration in Carya illinoinensis K. Koch varieties Wichita and Western. Rev. Chapingo Ser. Cie. 2019, 25, 305–314. [Google Scholar]
  21. Marco, R.; Goldschmidt, R.J.Z.; Herter, F.G.; Martins, C.R.; Mello-Farias, P.C.; Uberti, A. The irrigation effect on nuts’ growth and yield of Carya illinoinensis. An. Acad. Bras. Cienc. 2021, 93, e20181351. [Google Scholar] [CrossRef] [PubMed]
  22. Zhang, R.; Yong-Rong, L.I.; Peng, F.R. Cultivation adaptability and evaluation of Mahan in Carya illinoinensis. Non-Wood Forest Res. 2013, 31, 176–180. (In Chinese) [Google Scholar]
  23. Zhou, F.; Ma, J.; Hu, Y.J.; Yan, L.; Chen, B. Study on characteristics and causes of water-induced disaster in Yangtze Delta. J. China Inst. Water Resour. Hydropower Res. 2016, 14, 81–89. (In Chinese) [Google Scholar]
  24. Sun, F.; Zhao, J.M.; Yao, X.H.; Zhang, F.H.; Ma, S.L.; Zhang, L. Effects of water stress on physiological characteristics of Carya illinoensis—An economical plant for soil and water conservation. J. Southwest Univ. Nat. Sci. Ed. 2014, 36, 1–7. (In Chinese) [Google Scholar]
  25. Jiao, Z.Y.; Luo, Q.; Zhang, J.L.; Hao, R.M.; Xu, W.G.; Pan, W.M. The comparison of waterlogging resistance of 10 trees. J. Jiangsu For. Sci. Technol. 2007, 34, 15–18. (In Chinese) [Google Scholar]
  26. Miao, T.T.; Cao, Z.H.; Liu, J.L.; Sun, H.; Wu, Z.N. Effects of water stress on seedling growth and chlorophyll fluorescence characteristics of two Carya illinoensis varieties. Jiangsu Agric. Sci. 2022, 50, 138–146. (In Chinese) [Google Scholar]
  27. Huang, X.; Shi, H.; Hu, Z.; Liu, A.; Amombo, E.; Chen, L.; Fu, J. ABA Is Involved in Regulation of Cold Stress Response in Bermudagrass. Front. Plant Sci. 2017, 8, 1613. [Google Scholar] [CrossRef] [PubMed]
  28. Wassie, M.; Zhang, W.; Zhang, Q.; Ji, K.; Chen, L. Effect of Heat Stress on Growth and Physiological Traits of Alfalfa (Medicago sativa L.) and a Comprehensive Evaluation for Heat Tolerance. Agronomy 2019, 9, 597. [Google Scholar] [CrossRef]
  29. Moustakas, M.; Sperdouli, I.; Kouna, T.; Antonopoulou, C.I.; Therios, I. Exogenous proline induces soluble sugar accumulation and alleviates drought stress effects on photosystem II functioning of Arabidopsis thaliana leaves. Plant Growth Regul. 2011, 65, 315–325. [Google Scholar] [CrossRef]
  30. He, Y.X.; Wang, Q.; Xu, Y.P.; Li, Z.Y.; Yuan, J.; Lu, M.; Lin, Z.X. Climate change increased the compound extreme precipitation-flood events in a representative watershed of the Yangtze River Delta, China. Stoch. Env. Res. Risk A 2022, 36, 3803–3818. [Google Scholar] [CrossRef]
  31. Yang, P.; Xia, J.; Luo, X.G.; Meng, L.S.; Zhang, S.Q.; Cai, W.; Wang, W.Y. Impacts of climate change-related flood events in the Yangtze River Basin based on multi-source data. Atmos. Res. 2021, 263, 105819. [Google Scholar] [CrossRef]
  32. Kabrick, J.M.; Dey, D.C.; Van Sambeek, J.W.; Coggeshall, M.V.; Jacobs, D.F. Quantifying flooding effects on hardwood seedling survival and growth for bottomland restoration. New Forest. 2012, 43, 695–710. [Google Scholar] [CrossRef]
  33. Liu, Y.; Sheng, Z.P. Soil Moisture Status in an Irrigated Pecan Field. J. Irrig. Drain. Eng. 2013, 139, 26–40. (In Chinese) [Google Scholar] [CrossRef]
  34. Phukan, U.J.; Mishra, S.; Shukla, R.K. Waterlogging and submergence stress: Affects and acclimation. Crit. Rev. Biotechnol. 2016, 36, 956–966. [Google Scholar] [CrossRef]
  35. Argus, R.E.; Colmer, T.D.; Grierson, P.F. Early physiological flood tolerance is followed by slow post-flooding root recovery in the dryland riparian tree subsp. Plant Cell Environ. 2015, 38, 1189–1199. [Google Scholar] [CrossRef]
  36. Li, J.J.; Chen, Y.H.; Zhou, Z.H.; Wang, Y.J.; Yao, X.; Guo, L. Research progress on mechanisms of plant adaptation to flooding stress. Plant Sci. J. 2023, 41, 835–846. (In Chinese) [Google Scholar]
  37. Fukao, T.; Barrera-Figueroa, B.E.; Juntawong, P.; Pena-Castro, J.M. Submergence and Waterlogging Stress in Plants: A Review Highlighting Research Opportunities and Understudied Aspects. Front. Plant Sci. 2019, 10, 340. [Google Scholar] [CrossRef] [PubMed]
  38. Liang, F.; Huang, S.R.; Yu, Y.P.; Huang, Q.W.; Zhang, J.; Tan, X.H. Growth and Physiological Response of Barringtonia acutangula to Freshwater Flooding Stress. J. Southwest Univ. Nat. Sci. Ed. 2019, 39, 18–25. (In Chinese) [Google Scholar]
  39. Han, L.W.; Shi, Q.; Xuan, L.; Yin, Y.L.; Hua, J.F. Growth traits of Taxodium ‘Zhongshanshan’ and T. distichum Under Different Waterlogging Stress. J. Zhejiang For. Sci. Technol. 2017, 37, 1–8. (In Chinese) [Google Scholar]
  40. Fan, F.F.; Yuan, W.G.; Li, T.T.; Wu, C.P.; Zhang, J.; Jiao, J.J. Effect of Water Logging and Drainage on Growth and Physiological Properties of Zelkova serrata. J. Zhejiang For. Sci. Technol. 2018, 38, 62–68. (In Chinese) [Google Scholar]
  41. Sun, H.; Wu, Z.N.; Liu, J.L.; Miao, T.T.; Cao, Z.H. Effects of Water Stress on Growth and Physiological Properties of Four Poplar Varieties. J. West. China For. Sci. 2020, 49, 62–67. (In Chinese) [Google Scholar]
  42. Palta, J.A.; Ganjeali, A.; Turner, N.C.; Siddique, K.H.M. Effects of transient subsurface waterlogging on root growth, plant biomass and yield of chickpea. Agric. Water Manag. 2010, 97, 1469–1476. [Google Scholar] [CrossRef]
  43. Patel, M.K.; Pandey, S.; Burritt, D.J.; Tran, L.S.P. Plant responses to low-oxygen stress: Interplay between ROS and NO signaling pathways. Environ. Exp. Bot. 2019, 161, 134–142. [Google Scholar] [CrossRef]
  44. Yu, B.; Zhao, C.Y.; Li, J.; Li, J.Y.; Peng, G. Morphological, physiological, and biochemical responses of Populus euphratica to soil flooding. Photosynthetica 2015, 53, 110–117. [Google Scholar] [CrossRef]
  45. Fan, L.H.; Li, P.J.; Wang, J.; Gao, X.Q.; Zhen, Z.Y.; Wang, H.R.; Xing, W.X.; Zheng, C.W.; Liu, H. Study on waterlogging tolerance of Juglans sigillata. J. Anhui Agric. Univ. 2024, 51, 563–568. [Google Scholar]
  46. Wang, B.M.; Chen, J.J.; Chen, L.S.; Wang, X.N.; Wang, R.; Ma, L.; Peng, S.F.; Luo, J.; Chen, Y.Z. Combined drought and heat stress in Camellia oleifera cultivars: Leaf characteristics, soluble sugar and protein contents, and Rubisco gene expression. Trees-Struct. Funct. 2015, 29, 1483–1492. [Google Scholar] [CrossRef]
  47. Hussain, H.A.; Hussain, S.; Khaliq, A.; Ashraf, U.; Anjum, S.A.; Men, S.N.; Wang, L.C. Chilling and Drought Stresses in Crop Plants: Implications, Cross Talk, and Potential Management Opportunities. Front. Plant Sci. 2018, 9, 393. [Google Scholar] [CrossRef]
  48. Azarabadi, S.; Abdollahi, H.; Torabi, M.; Salehi, Z.; Nasiri, J. ROS generation, oxidative burst and dynamic expression profiles of ROS-scavenging enzymes of superoxide dismutase (SOD), catalase (CAT) and ascorbate peroxidase (APX) in response to Erwinia amylovora in pear (Pyrus communis L). Eur. J. Plant Pathol. 2016, 147, 279–294. [Google Scholar] [CrossRef]
  49. Lan, Z.Q.; Wen, J.H.; Chen, C.Y.; Xie, D.Z.; Zhao, Z.H.; Huang, X.L.; Liao, J.M. Physiological Responses and Tolerance Evaluation of Different Varieties of Carya illinoinensis Seedlings Under Water Logging Stress. Guangxi For. Sci. 2024, 53, 144–151. (In Chinese) [Google Scholar]
  50. Yan, Z.; Zhang, J.T.; Zhao, P.H.; Yang, S.H.; Ma, Y.T.; Zhu, D. Effects of continuous waterlogging stress on growth, physiology and biochemistry of Populus deltoides seedlings. J. Cent. South. Univ. For. Technol. 2019, 39, 16–23. (In Chinese) [Google Scholar]
  51. Liu, C.C.; Lan, C.J.; Li, H.; Li, C.J.; Qiu, Y.; Wang, X.L. Effects of Flooding Stress and Recovery on Root and Leaf Cell Membrane Stability at Cherry Tomato Seedlings. J. Irrig. Drain. 2022, 41, 61–70. (In Chinese) [Google Scholar]
  52. Li, Y.; Shi, L.C.; Yang, J.; Qian, Z.H.; He, Y.X.; Li, M.W. Physiological and transcriptional changes provide insights into the effect of root waterlogging on the aboveground part of Pterocarya stenoptera. Genomics 2021, 113, 2583–2590. [Google Scholar] [CrossRef] [PubMed]
  53. Liu, J.J.; Xuanyuan, X.T.; Zheng, B.T.; Wang, G.P.; Zhai, J.T.; Yu, P.F. Effects of waterlogging stress and restoration on morphological and physiological characteristics of Xanthoceras sorbifolia Bunge seedlings. Non-Wood For. Res. 2024, 42, 77–85. (In Chinese) [Google Scholar]
  54. Zhao, Y.Q.; Wang, C.Y.; Yang, J.F.; Wang, X.X.; Zhang, B.G.; Li, Z.G.; Zu, C.; Chen, X.A.; Zhang, Y.J.; Tan, M.Y.; et al. Effects of short-term waterlogging stress and stress relief on physiology and yield of Noni. Chin. J. Trop. Crops 2024, 45, 2117–2128. (In Chinese) [Google Scholar]
  55. Li, X.; Cao, Y.; Xie, Q.Z.; Yao, X.C.; Tang, S.W.; Feng, K.P. Effects of water level change and normal moisture after waterlogging on the growth and physiology of Artemisia selengensis. Chin. J. Ecol. 2022, 41, 1109–1120. (In Chinese) [Google Scholar] [CrossRef]
  56. Li, M.; López, R.; Venturas, M.; Pita, P.; Gordaliza, G.G.; Gil, L.; Rodríguez-Calcerrada, J. Greater resistance to flooding of seedlings of Ulmus laevis than Ulmus minor is related to the maintenance of a more positive carbon balance. Trees 2015, 29, 835–848. [Google Scholar] [CrossRef]
  57. Agayev, Y.M.; Zarifi, E. Peculiar Evolution of Saffron (Crocus sativus L.): Prosperity and Decline. Acta Hortic. 2010, 850, 29–33. [Google Scholar] [CrossRef]
  58. Acevedo, E.; Hsiao, T.C.; Henderson, D.W. Immediate and subsequent growth responses of maize leaves to changes in water status. Plant Physiol. 1971, 48, 631–636. [Google Scholar] [CrossRef] [PubMed]
  59. Luo, F.-L.; Nagel, K.A.; Scharr, H.; Zeng, B.; Schurr, U.; Matsubara, S. Recovery dynamics of growth, photosynthesis and carbohydrate accumulation after de-submergence: A comparison between two wetland plants showing escape and quiescence strategies. Ann. Bot. 2011, 107, 49–63. [Google Scholar] [CrossRef]
  60. Shao, C.C.; Duan, H.L.; Ding, G.J.; Luo, X.Y.; Fu, Y.H.; Lou, Q. Physiological and Biochemical Dynamics of Pinus massoniana Lamb. Seedlings under Extreme Drought Stress and during Recovery. Forests 2022, 13, 65. [Google Scholar] [CrossRef]
  61. Crawford, R.M.M.; Braendle, R. Oxygen deprivation stress in a changing environment. J. Exp. Bot. 1996, 47, 145–159. [Google Scholar] [CrossRef]
  62. Striker, G.G. Time is on our side: The importance of considering a recovery period when assessing flooding tolerance in plants. Ecol. Res. 2012, 27, 983–987. [Google Scholar] [CrossRef]
  63. Diamond, J.M. Ecology: Laboratory, field and natural experiments. Nature 1983, 304, 586–587. [Google Scholar] [CrossRef]
Figure 1. Temperature and humidity in the greenhouse of Nanjing Forestry University’s Xiashu Forestry throughout the experiment.
Horticulturae 11 00590 g001
Figure 2. Illustration of C. illinoinensis 1-year old seedlings under different flooding treatments (T1, T2, T3, T4, and T5). T1: control (field capacity 75%); T2: flooding 5 cm below the root collar; T3: flooding up to the root collar; T4: flooding 10 cm above the root collar; T5: flooding 30 cm above the root collar.
Horticulturae 11 00590 g002
Figure 3. Ratios of root length of fine roots and coarse roots to total roots (a), and ratios of root surface area of fine roots and coarse roots to total roots (b) under different treatments (T1, T2, T3, T4, and T5) at the end of flooding (4 months) and recovery (6 months). T1: control (field capacity 75%); T2: flooding 5 cm below the root collar; T3: flooding up to the root collar; T4: flooding 10 cm above the root collar; T5: flooding 30 cm above the root collar.
Horticulturae 11 00590 g003
Figure 4. Total biomass (TB, (a)), root-to-shoot ratio (RSR, (b)), root-to-mass ratio (RMR, (c)), leaf-to-mass ratio (LMR, (d)), stem-to-mass ratio (SMR, (e)), and leaf-mass fraction (LMF, (f)) under different treatments at the end of flooding (4 months) and recovery (6 months). Capital letters indicate significant differences between assessment moments (flooding × recovery), while lowercase letters indicate differences among treatments (T1: control; T2: flooding 5 cm below root collar; T3: flooding up to root collar; T4: flooding 10 cm above root collar; T5: flooding 30 cm above root collar). Data were expressed as a mean ± SD.
Horticulturae 11 00590 g004
Figure 5. The relative electrolytic leakage (REL, (a)), malondialdehyde (MDA, (b)), soluble sugar (SS, (c)), soluble protein (SP, (d)), superoxide dismutase (SOD, (e)) and catalase (CAT, (f)) under different treatments at the end of flooding (4 months) and recovery (6 months). Capital letters indicate significant differences between assessment moments (flooding × recovery), while lowercase letters indicate differences among treatments (T1: control; T2: flooding 5 cm below root collar; T3: flooding up to root collar; T4: flooding 10 cm above root collar; T5: flooding 30 cm above root collar). Data were expressed as a mean ± SD.
Horticulturae 11 00590 g005
Figure 6. Principal component analysis (PCA) of growth and physiological indicators under different treatments (T1, T2, T3, T4, and T5) at the end of flooding (4 months, (a)) and recovery (6 months, (b)). T1: control (field capacity 75%); T2: flooding 5 cm below the root collar; T3: flooding up to the root collar; T4: flooding 10 cm above the root collar; T5: flooding 30 cm above the root collar.
Horticulturae 11 00590 g006
Table 1. Growth rate in ground diameter and height of C. illinoinensis under different flooding treatments at the end of flooding (4 months) and recovery (6 months).
Growth Rate in Ground Diameter (mm)Growth Rate in Height (cm)
FloodingRecoveryFloodingRecovery
T10.03 ± 0.03 Ac0.03 ± 0.04 Aa0.87 ± 0.27 Ba21.86 ± 0.82 Aab
T20.03 ± 0.13 Ac0.03 ± 0.13 Aa0.06 ± 0.67 Ba23.50 ± 5.14 Aab
T30.37 ± 0.65 Ac−0.03 ± 0.04 Ba−0.06 ± 0.85 Ba26.26 ± 4.47 Aa
T42.87 ± 0.22 Aa−1.54 ± 0.27 Bc−0.30 ± 1.27 Ba26.28 ± 4.59 Aa
T51.75 ± 0.09 Ab−1.20 ± 0.08 Bb−0.10 ± 0.31 Ba19.27 ± 2.50 Ab
F97.006179.4352.0823.615
P<0.001 ***< 0.001 ***0.1130.119
TreatmentDf = 4, F = 17.963, p < 0.001 ***Df = 4, F = 2.946, p = 0.040 *
MomentDf = 1, F = 501.165, p < 0.001 ***Df = 1, F = 1143.563, p < 0.001 ***
Treatment × MomentDf = 4, F = 169.792, p < 0.001 ***Df = 4, F = 4.269, p = 0.009 **
The data were expressed as a mean ± standard deviation (SD). Treatments (T1, T2, T3, T4, and T5), moment (flooding × recovery), and their interactions from repeated-measures ANOVA. Capital letters indicate significant differences between the different assessment moments and lowercase letters indicate significant differences between the different treatments (p < 0.05). T1: control (field capacity 75%); T2: flooding 5 cm below the root collar; T3: flooding up to the root collar; T4: flooding 10 cm above the root collar; T5: flooding 30 cm above the root collar. * Represents p < 0.05, ** represents p < 0.01, and *** represents p < 0.001.
Table 2. Root growth of C. illinoinensis under different flooding treatments at the end of flooding (4 months) and recovery (6 months).
Total Root Length (m)Total Root Area (cm2)
FloodingRecoveryFloodingRecovery
T116.28 ± 2.76 Ba33.22 ± 5.15 Aab634.53 ± 75.08 Aa649.97 ± 87.75 Abc
T215.53 ± 2.12 Ba39.55 ± 6.39 Aa509.61 ± 105.46 Bab855.49 ± 110.84 Aa
T314.44 ± 2.24 Ba35.49 ± 6.04 Aab482.13 ± 167.03 Babc788.82 ± 70.06 Aab
T414.55 ± 1.01 Ba34.22 ± 7.09 Aab356.15 ± 47.99 Bbc672.81 ± 102.45 Abc
T513.52 ± 2.56 Ba26.86 ± 2.29 Ab336.99 ± 30.08 Bc538.33 ± 72.61 Ac
F1.3733.9789.28411.332
P0.2720.012 **< 0.001 ***< 0.001 ***
TreatmentDf = 4, F = 4.419, p = 0.008 **Df = 4, F = 17.279, p < 0.001 ***
MomentDf = 1, F = 304.251, p < 0.001 ***Df = 1, F = 81.032, p < 0.001 ***
Treatment × MomentDf = 4, F = 2.784, p = 0.049 *Df = 4, F = 5.287, p = 0.003 **
The data were expressed as a mean ± standard deviation (SD). Treatments (T1, T2, T3, T4, and T5), moment (flooding × recovery), and their interactions from repeated-measures ANOVA. Capital letters indicate significant differences between the different assessment moments and lowercase letters indicate significant differences between the different treatments (p < 0.05). T1: control (field capacity 75%); T2: flooding 5 cm below the root collar; T3: flooding up to the root collar; T4: flooding 10 cm above the root collar; T5: flooding 30 cm above the root collar. * represents p < 0.05, ** represents p < 0.01, and *** represents p < 0.001.
Table 3. Results of repeated-measures ANOVA on the effects of flooding treatments (T1, T2, T3, T4, and T5), moments (flooding and recovery), and their interactions on dry mass accumulation.
IndicatorsTreatmentMomentTreatment × Moment
DfFpDfFpDfFp
TB439.5570.040 *16524.849<0.001 ***4100.314<0.001 ***
RSR455.408<0.001 ***1173.509<0.001 ***495.963<0.001 ***
RMR483.196<0.001 ***1321.174<0.001 ***4140.725<0.001 ***
LMR415.678<0.001 ***1249.323<0.001 ***421.317<0.001 ***
SMR4388.891<0.001 ***10.8590.3634223.690<0.001 ***
LMF4112.960<0.001 ***1267.830<0.001 ***495.528<0.001 ***
Note: * represents p < 0.05 and *** represents p < 0.001. TB represents total biomass; RSR represents root-to-shoot ratio; RMR represents root-to-mass ratio; LMR represents leaf-to-mass ratio; SMR represents stem-to-mass ratio; LMF represents leaf-mass fraction.
Table 4. Survival rate of C. illinoinensis under different flooding treatments at the end of flooding (4 months) and recovery (6 months).
TreatmentMomentTreatment × Moment
T1100%100%
T2100%100%
T3100%100%
T4100%100%
T583.3%100%
Table 5. Results of repeated-measures ANOVA on the effects of flooding treatments (T1, T2, T3, T4, and T5), moments (flooding and recovery), and their interactions on physiological indicators.
IndicatorsTreatmentMomentTreatment × Moment
DfFpDfFpDfFp
REL497.467<0.001 ***1261.824<0.001 ***412.960<0.001 ***
MDA448.074<0.001 ***11325.803<0.001 ***489.298<0.001 ***
SS456.810<0.001 ***124.675<0.001 ***417.526<0.001 ***
SP4122.814<0.001 ***17203.544<0.001 ***4183.909<0.001 ***
SOD486.727<0.001 ***11026.6<0.001 ***4100.484<0.001 ***
CAT4151.024<0.001 ***14037.111<0.001 ***4200.944<0.001 ***
Note: *** represents p < 0.001. REL represents relative electrolytic leakage; MDA represents malondialdehyde; SS represents soluble sugar; SP represents soluble protein; SOD represents superoxide dismutase; CAT represents catalase.
Table 6. PCA analysis of growth and physiological indicators of C. illinoinensis at the end of flooding and recovery.
IndicatorsFloodingRecovery
PC1PC2PC1PC2
GRD0.7940.440−0.6840.203
GRH−0.9080.353−0.598−0.724
TRL−0.9440.006−0.963−0.122
TRA−0.990−0.080−0.997−0.007
TB0.9810.057−0.9630.096
RSR−0.9870.1610.852−0.200
RMR−0.9980.0570.828−0.282
LMR−0.9620.259−0.6570.714
SMR0.995−0.098−0.816−0.189
LMF−0.9600.277−0.3020.930
REL0.9630.2390.9770.127
MDA0.924−0.0620.9100.334
SS0.7510.6230.9070.155
SP0.987−0.0380.8750.161
SOD0.9910.0260.8660.271
CAT0.9920.0390.913−0.296
Eigenvalue14.3821.26011.2312.457
Proportion (%)89.8897.88070.19315.359
Cumulative (%)89.88997.75070.19385.552
Table 7. Comprehensive evaluation of C. illinoinensis under flooding treatments at the end of flooding (4 months) and recovery (6 months).
TreatmentsFloodingRecovery
Synthesis ScoreRankingSynthesis ScoreRanking
T1−4.9150.562
T2−1.544−2.685
T30.273−1.734
T42.6720.433
T53.5113.411
Disclaimer/Publisher’s Note: The statements, opinions and data contained in all publications are solely those of the individual author(s) and contributor(s) and not of MDPI and/or the editor(s). MDPI and/or the editor(s) disclaim responsibility for any injury to people or property resulting from any ideas, methods, instructions or products referred to in the content.

