Article

Genome-Wide Identification of the Eceriferum Gene Family and Analysis of Gene Expression Patterns Under Different Treatments in Pepper (Capsicum annuum L.)

1
Institute of Vegetable, Henan Academy of Agricultural Sciences, Zhengzhou 450002, China
2
College of Horticulture, Henan Agricultural University, Zhengzhou 450002, China
*
Authors to whom correspondence should be addressed.
These authors contributed equally to this work.
Horticulturae 2025, 11(6), 571; https://doi.org/10.3390/horticulturae11060571
Submission received: 15 April 2025 / Revised: 17 May 2025 / Accepted: 20 May 2025 / Published: 23 May 2025
(This article belongs to the Section Genetics, Genomics, Breeding, and Biotechnology (G2B2))

Abstract

:
Plant cuticular wax serves as a critical component for defense against biotic and abiotic stresses, with its biosynthetic pathway regulated by the ECERIFERUM (CER) gene family. This study presents the first genome-wide identification of 79 CER genes (CalCERs) in pepper (Capsicum annuum L.), which are distributed across all 12 chromosomes. Phylogenetic analysis classified CalCERs into five clades, with clade-specific conservation of exon–intron architectures and protein motifs. Promoter cis-element analysis revealed enrichment of light-responsive elements, abscisic acid (ABA), jasmonic acid (JA), and stress-responsive regulatory motifs, indicating multi-pathway regulation. Transcriptomic data highlighted tissue-specific expression patterns, such as the root-predominant express gene CalCER1-2 and the flower-specific express gene CalCER3-1. Under abiotic stresses (drought, salt, heat, and cold), CalCER4-2 and CalCER6-6 responded rapidly, while most genes showed delayed differential expression. Under biotic stress, CalCER3-1 and CalCER5-3 were upregulated, whereas CalCER2-2 exhibited pathogen-specific suppression, suggesting roles in modulating wax-mediated pathogen resistance. Hormone treatments revealed dynamic responses: CalCER2-2 was persistently ABA-inducible, while CalCER3-1 specifically responded to JA. This study underscores evolutionary conservation and species-specific expansion of the pepper CER family, linking their expression to wax biosynthesis and stress adaptation. These insights provide a foundation for enhancing stress resilience in crops. Future work should employ gene editing and metabolomics to validate functional mechanisms and optimize breeding strategies.

1. Introduction

The plant cuticle, a hydrophobic layer primarily composed of cutin and wax, serves as the first line of defense against environmental stressors such as drought, UV radiation, and pathogen invasion [1,2]. Cuticular wax, synthesized through the elongation and modification of very-long-chain fatty acids (VLCFAs), plays a pivotal role in minimizing non-stomatal water loss and enhancing plant resilience to abiotic and biotic challenges [3].
The ECERIFERUM (CER) gene family, initially identified in Arabidopsis thaliana, encodes enzymes and regulatory proteins critical for wax biosynthesis, including VLCFA elongation, decarbonylation, and acyl reduction pathways [4,5]. As the first functionally validated member of this family, the CER1 gene (AtCER1) in Arabidopsis thaliana encodes a decarbonylase that catalyzes the conversion of ultra-long-chain aldehydes into alkanes. This process represents not only a crucial step in wax biosynthesis but also a key molecular mechanism for plants to respond to biotic and abiotic stresses [6,7]. For instance, the apple MdCER1 homolog enhances tissue water retention by modulating wax metabolic pathways, thereby improving drought resistance [8]. Rice OsCER1 participates in VLCFA synthesis, plastid differentiation, and pollen formation, highlighting the functional diversity of CER genes [9]. Moreover, AtCER2 regulates the elongation of C28 fatty acids, synergistically affecting pollen coat structure and cuticle formation [10,11,12,13]. Similarly, overexpression of BnCER1-2 in oilseed rape (Brassica napus) significantly increases alkane production and enhances drought tolerance, further demonstrating the potential of CER genes in stress-resistant crop breeding [14]. Additionally, CER4, a multifunctional member, is widely distributed in roots, stems, leaves, siliques, and flowers, participating in the synthesis of primary alcohols [15]. Meanwhile, ATP-binding cassette (ABC) transporter family members, such as Arabidopsis CER5, mediate the transmembrane transport of wax components from epidermal cells to the cuticle, modulating wax secretion efficiency [16]. In the Arabidopsis cer7 mutant, downregulated expression of CER3/WAX2 disrupts wax biosynthesis [17], while the functional loss of CER8/LACS1 overlaps with LACS2 in metabolic pathways, suggesting redundancy among long-chain acyl-CoA synthetases in wax elongation [18]. Furthermore, CER9, encoding an E3 ubiquitin ligase, regulates water balance during seed development and germination through the ABA signaling pathway [19,20]. The cer10 mutant exhibits increased non-stomatal water loss due to defects in VLCFA synthesis, yet paradoxically shows enhanced drought resilience [21]. Notably, overexpression of CER26 alters stem wax composition, resulting in a glossy phenotype, whereas heterologous expression of CER60 in yeast weakly catalyzes the elongation of C28 to C30 fatty acids, indicating its potential role in synthesizing specific VLCFA chain lengths [22,23]. Mechanistically, CER proteins often act in coordination. For example, the CER3-CER1 complex in Arabidopsis directly converts VLCFA-CoA to alkanes [24], and their heterologous co-expression in tobacco not only promotes cuticular wax deposition but also mitigates water loss under drought stress [25].
Given the critical roles of CER genes in regulating plant growth, development, and adaptive responses to biotic and abiotic stresses, the CER gene family has been extensively characterized in many species, such as A. thaliana, apple (Malus domestica) [26], sunflower (Helianthus annuus) [27], jujube (Ziziphus jujuba) [28], passion fruit (Passiflora edulis) [29], Chinese chestnut (Castanea mollissima Bl.) [30], tomato (Solanum lycopersicum) [31], cotton (Gossypium spp.) [32], and cabbage (Brassica oleracea) [33].
As a high-value vegetable and spice crop, pepper is highly susceptible to yield and quality losses caused by drought and fungal infections. The integrity of its fruit surface wax layer, which prevents water infiltration, microbial colonization, and postharvest deterioration, is likely mediated by CER gene activity [34,35,36,37]. However, the genomic landscape of CER genes in pepper, their evolutionary relationships, and their responsiveness to stress signals are yet to be elucidated. Previous studies in tomato (Solanum lycopersicum) and passion fruit (Passiflora edulis) have demonstrated that CER genes undergo significant transcriptional regulation under drought and pathogen stress, suggesting conserved roles in stress adaptation. Furthermore, the domestication process of crops like tomato has highlighted the selective pressures acting on wax-related genes, underscoring the need to explore CER family dynamics in pepper to inform breeding strategies.
In this study, we performed a genome-wide identification of the CER gene family in Capsicum annuum to address the following objectives: (1) characterize the phylogenetic relationships, gene structures, and conserved motifs of CalCER genes; (2) analyze promoter cis-elements to predict regulatory mechanisms; (3) investigate the expression patterns of CalCER genes; and (4) identify candidate CalCER genes linked to stress adaptation. By bioinformatics approaches, this work provides foundational insights into the roles of CER genes in pepper cuticle formation and stress responses, offering potential targets for enhancing agronomic traits through genetic engineering.

2. Materials and Methods

2.1. Retrieval and Identification of Eceriferum Genes in Pepper

The gap-free genome of pepper (Capsicum annuum Zunla-1_v3.0) [38] was retrieved from the PepperBase database (www.bioinformaticslab.cn/PepperBase/; accessed on 6 March 2025) for genome-wide identification of Eceriferum (CER) genes. To systematically identify CalCER genes, 17 CER family members from Arabidopsis thaliana were acquired from The Arabidopsis Information Resource (TAIR) database [39], and their corresponding Hidden Markov Model (HMM) profiles were downloaded from the Pfam database [40]. These HMM profiles were employed to conduct domain-specific searches against the pepper proteome using HMMER version 3.3.2 with an e-value threshold of 1 × 10⁻⁵ (Table S1). To validate sequence specificity and refine the CalCER gene set, local BLASTP analyses (E-value < 1 × 10⁻¹⁰, identity > 30%) were performed using AtCER and SlCER [31] protein sequences as queries against the pepper proteome (Table S1). Chromosomal localization of CalCER genes was mapped and visualized using TBtools v2.138 [41], with genomic coordinates annotated according to the Zunla-1 reference genome.

2.2. Analysis of Physicochemical Properties and Subcellular Localization of CalCERs

The physicochemical properties of CalCER proteins, including the number of amino acids, molecular weight, theoretical isoelectric point (pI), instability index (predicting in vitro stability), aliphatic index (reflecting aliphatic side chain volume), and grand average of hydropathicity (GRAVY, calculated as the sum of hydropathy values of all the amino acids, divided by the number of residues in the sequence), were evaluated using the ProtParam tool (https://web.expasy.org/protparam/, accessed on 16 March 2025). Subcellular localization of CalCER proteins was predicted using CELL-PLoc 2.0 (http://www.csbio.sjtu.edu.cn/bioinf/Cell-PLoc-2/, accessed on 16 March 2025).

2.3. Sequence Alignment and Construction of Phylogenetic Tree

Multiple sequence alignment of CER amino acid sequences from Arabidopsis thaliana, Solanum lycopersicum, and Capsicum annuum L. was performed using MEGA11.0 software to perform multiple sequence alignment. Alignment was based on the ClustalW algorithm [42]. Then, MEGA11.0 software was also used to determine the optimal conformational tree model of the CER gene family and then a Neighbor-Joining tree was constructed. Final visualization and annotation of the phylogenetic tree were executed using the Interactive Tree of Life (iTOL) platform (https://itol.embl.de/; accessed 20 March 2025).

2.4. Gene Structure and Motif Analysis of CalCERs

Gene structures of CalCER genes were annotated using the pepper reference genome (Zunla-1_v3.0) retrieved from the PepperBase database (available at: http://www.bioinformaticslab.cn/PepperBase; accessed on 9 March 2025). For de novo motif identification, protein sequences of CalCERs were analyzed using the MEME Suite (https://meme-suite.org/meme/tools/meme; accessed on 9 March 2025) with the following parameters: maximum motif count = 15, motif width = 6–50 residues, and E-value threshold <0.05. The resulting motifs and exon–intron architectures were visualized and annotated using the Interactive Tree of Life (iTOL) platform, with color-coded motifs mapped to corresponding phylogenetic clades to highlight structural-functional correlations.

2.5. Cis-Regulatory Element Analysis of CalCER Promoters

Promoter sequences spanning 2000 bp upstream of CalCER transcription start sites (TSS) were extracted from the pepper genome. Cis-regulatory elements were predicted using PlantCARE (https://bioinformatics.psb.ugent.be/webtools/plantcare/html/; accessed on 20 March 2025) with default parameters, retaining elements with a significance threshold of p < 0.05. The visualization of the identified elements, in conjunction with the phylogenetic tree, was achieved through the utilization of the iTOL online website.

2.6. RNA-Seq Data Analyses

Expression profiles of the 79 identified CalCER genes across tissues and experimental treatments were analyzed using publicly available RNA-seq datasets. Raw sequencing reads for abiotic stress (SRP187794), biotic stress (SRP438321), and phytohormone treatments (SRP265260) [43] were retrieved from the NCBI Sequence Read Archive (SRA; https://www.ncbi.nlm.nih.gov/sra; accessed on 20 March 2025). The clean reads obtained were aligned and quantified against the pepper reference genome (Capsicum annuum Zunla-1_v3.0) using HISAT2 version 2.1.0 [44] and StringTie version 2.0.6 [45]. To assess technical and biological variability, PCA was conducted on FPKM values using the FactoMineR package in R (Figures S1–S3). Differential gene expression analysis was conducted using the DESeq2 package version 1.40.2, employing the MA-plot-based method in R version 3.0.3. p values were adjusted using the Benjamini–Hochberg procedure to control the false discovery rate [46]. The fold change was determined using FPKM (fragments per kilobase of transcript sequence per million base pairs sequenced) values. The criteria for identifying DEGs were set as |log2FoldChange| ≥ 1 and the adjusted p < 0.05.

3. Results

3.1. Identification and Physicochemical Properties of CER Genes in Pepper

A total of 79 CER genes (CalCERs) were identified in the pepper (Capsicum annuum L.) genome, distributed across all 12 chromosomes. These genes were systematically named based on their ortholog to Arabidopsis CER homologs (Figure 1, Table S1). To elucidate their functional potential, we analyzed key physicochemical properties of CalCER proteins using bioinformatic tools. The length of CalCER proteins ranged from 146 (CalCER4-21) to 1235 (CalCER13) amino acids, with a corresponding molecular weight range from 16.5 to 137 kDa. The isoelectric points ranged from 4.94 (CalCER4-21) to 9.73 (CalCER10). The instability index ranged from 15.41 (CalCER4-2) to 56.79 (CalCER11-2). A total of 49 CalCERs were deemed stable (instability index smaller than 40), and 30 CalCERs were unstable (greater than 40). The aliphatic index ranged from 77.87 (CalCER11-2) to 108.55 (CalCER9), while the GRAVY ranged from −0.484 (CalCER11-2) to 0.301 (CalCER9) (Table S2).

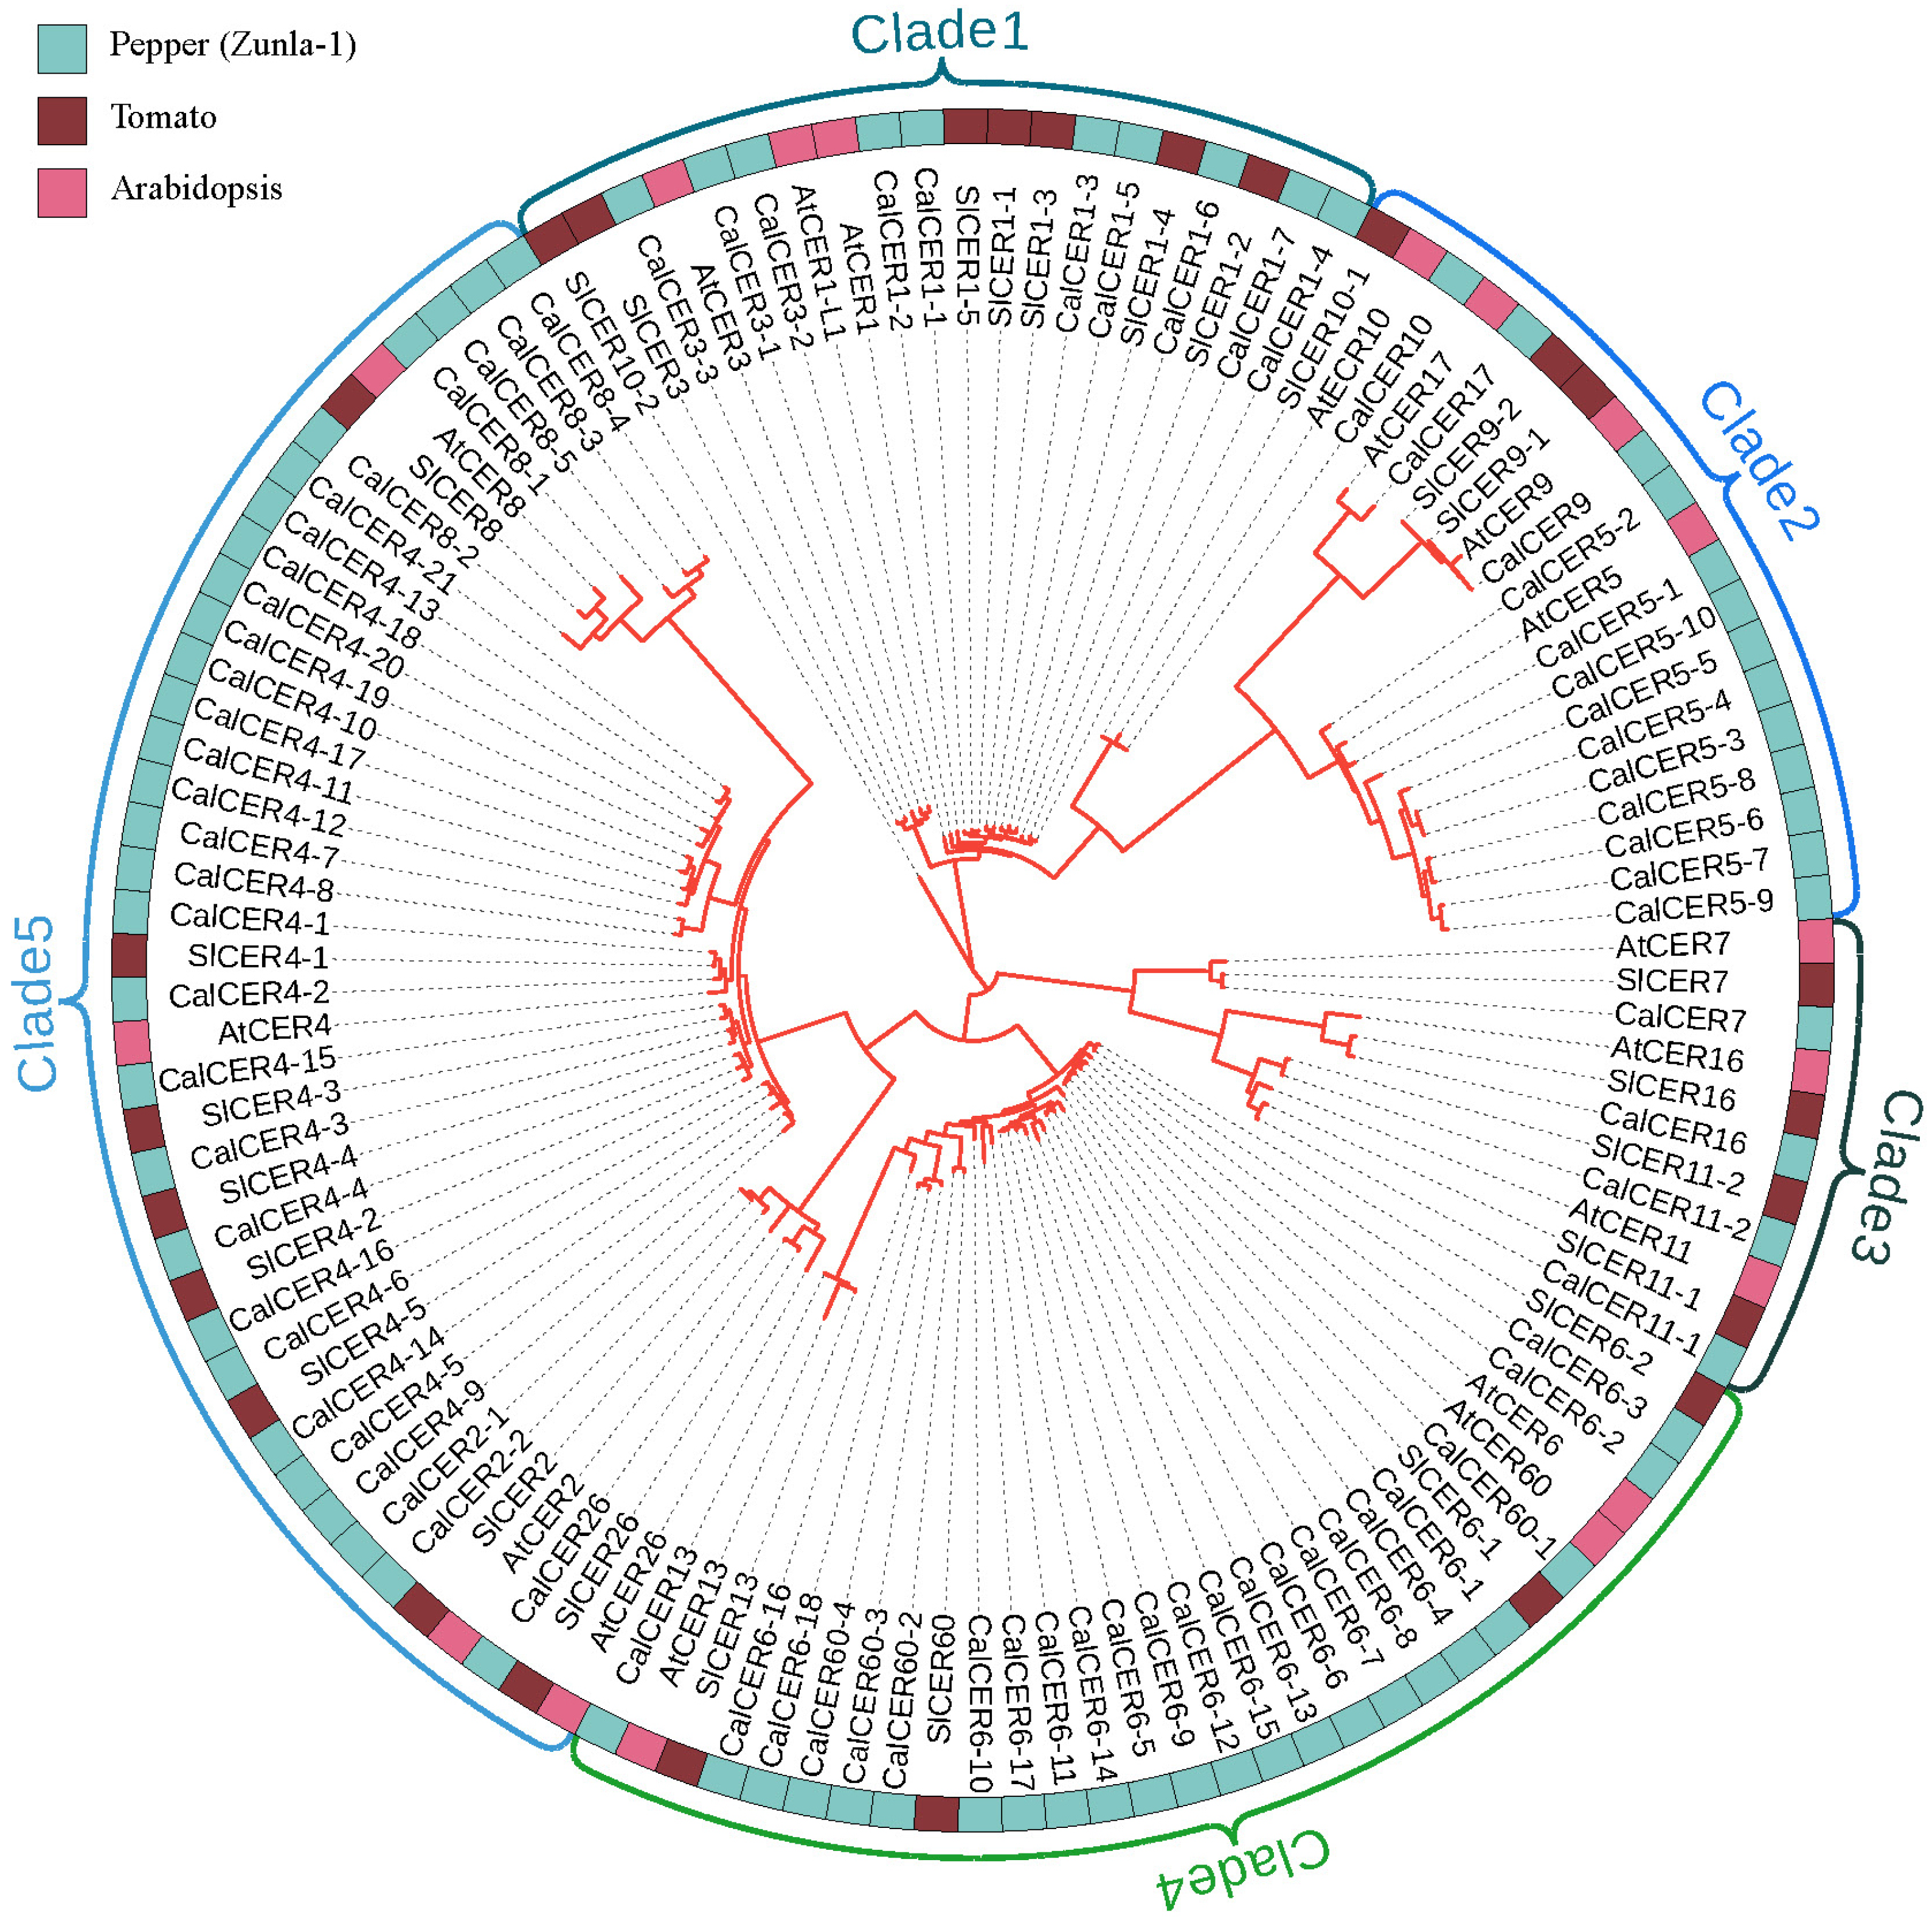
3.2. Phylogenetic Analysis of CalCER Proteins in Pepper

To resolve the evolutionary relationships and functional diversification of the CalCER gene family, a phylogenetic tree was reconstructed using protein sequences from 17 Arabidopsis thaliana (AtCER), 26 Solanum lycopersicum (SlCER), and 79 Capsicum annuum (CalCER) genes (Table S2). The analysis, performed with MEGA11 software, classified CalCERs into five distinct clades (clades 1–5) based on sequence homology and the genetic relationship between the CalCER protein sequence and tomato, Arabidopsis (Figure 2). Clade 1 comprised 10 members, including CalCER1s and CalCER3s, while clade 2 contained 13 genes (CalCER5s, CalCER9, CalCER10, and CalCER17). Clade 3 grouped four genes (CalCER7, CalCER11s, and CalCER16), whereas clade 4 encompassed 23 members (CalCER6s, CalCER13, and CalCER60s). Clade 5, the largest group, included 29 genes (CalCER2s, CalCER4s, CalCER8s, and CalCER26). This clade-specific clustering mirrors functional conservation within orthologous groups (e.g., clade 1 homologs linked to alkane biosynthesis) and highlights lineage-specific expansions, particularly in clades 4 and 5, suggesting adaptive diversification in pepper.

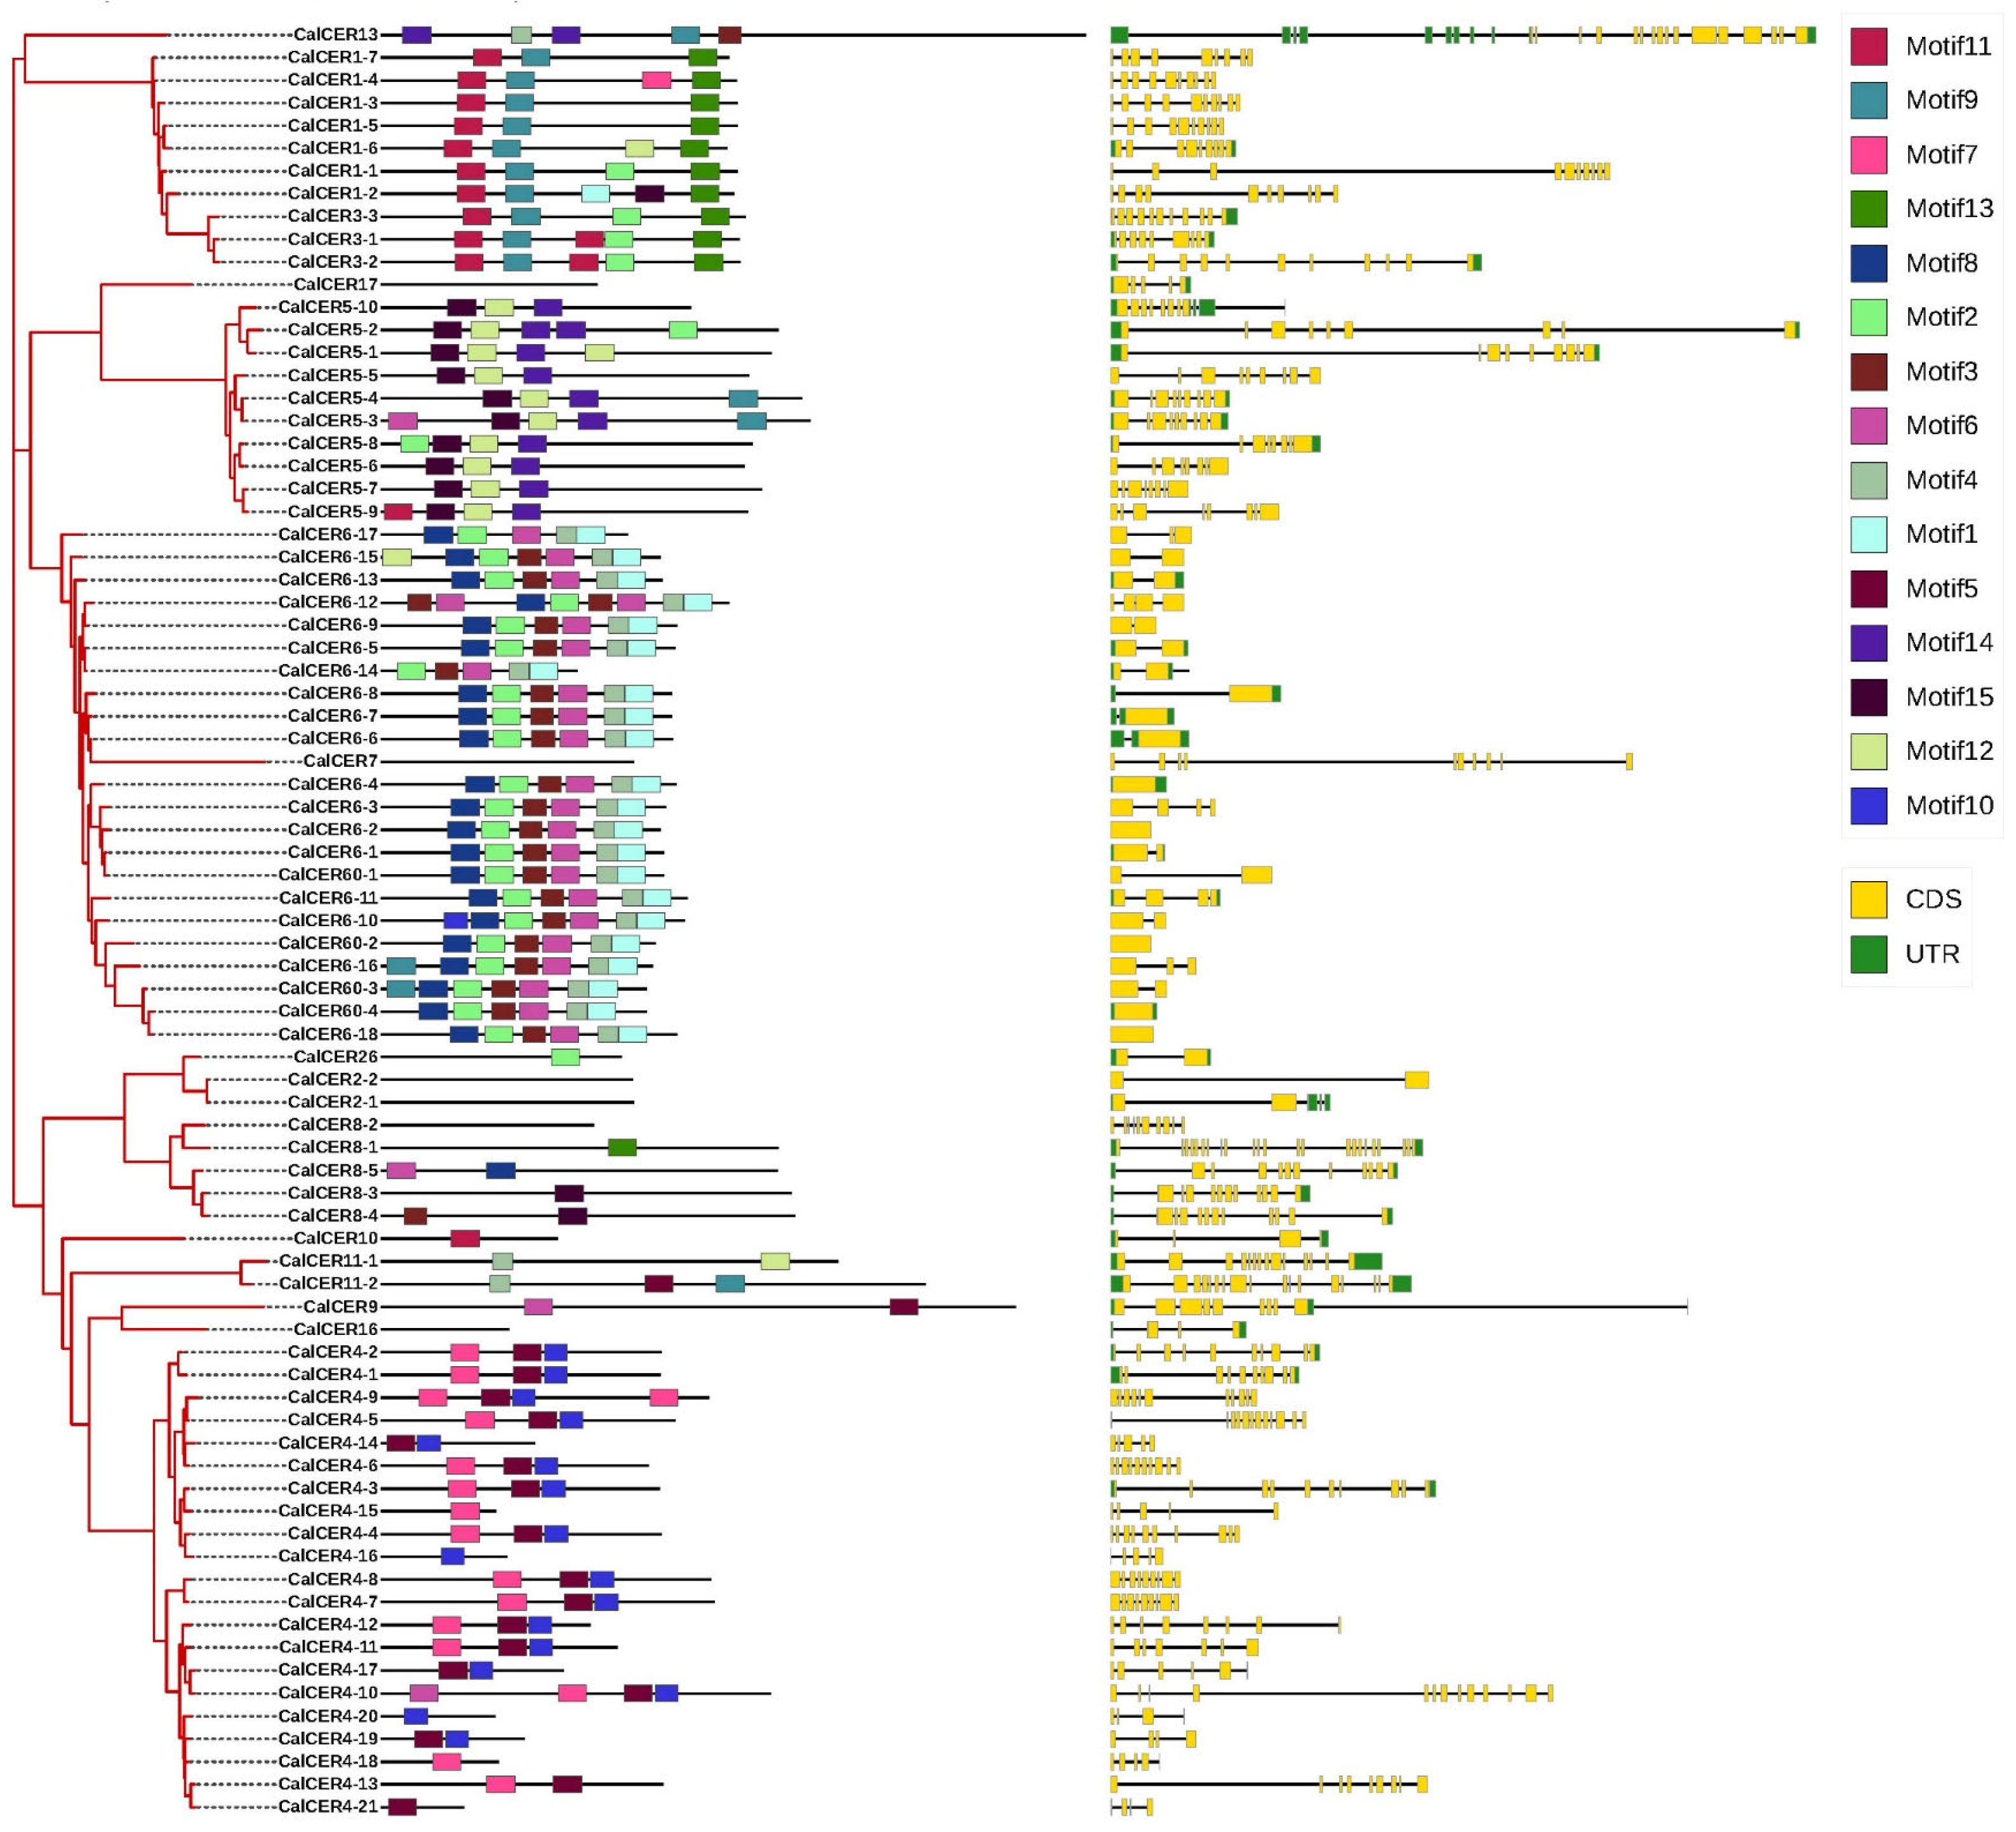
3.3. Motifs and Gene Structural Analysis of CalCERs

Gene structure variation and motif composition are critical drivers of evolutionary diversification in gene families. To delineate structural and functional divergence within the CalCER family, we analyzed conserved protein motifs and exon–intron architectures (Figure 3).
Using the MEME Suite, 15 distinct motifs (designated motifs 1–15) were identified in CalCER proteins. Motif counts per gene ranged from 0 to 8, with CalCER6-12 containing the maximum (eight motifs). Notably, CalCER2-1, CalCER2-2, CalCER7, CalCER8-2, CalCER16, and CalCER17 lacked detectable motifs, suggesting potential neofunctionalization or lineage-specific sequence divergence. Among motif-bearing genes, 19 CalCERs harbored three motifs, while 15 retained six motifs (Figure 3). Shared motifs and comparable motif arrangements were identified in the majority of CER proteins within a given subfamily, suggesting a conserved structural framework among these proteins.
The gene structure of CalCER genes was then analyzed. The structural similarities among CalCER genes within the same subgroup were clear (Figure 3). Nevertheless, CalCER6-2, CalCER6-4, CalCER6-18, CalCER26, CalCER60-2, and CalCER60-4 only featured one exon. CalCER8-1 and CalCER13 contain 23 and 25 exons, respectively. Notably, CalCER6s and CalCER60s contain a smaller number of exons, ranging from one to four. The number of exons of the remaining CalCER genes is about 10 on average. Collectively, these observations suggest that evolutionarily closely related genes exhibit a higher degree of similarity in exon number compared to those with more distant phylogenetic relationships. These findings suggest that genes with a varying number of exon/introns may serve distinct biological functions.

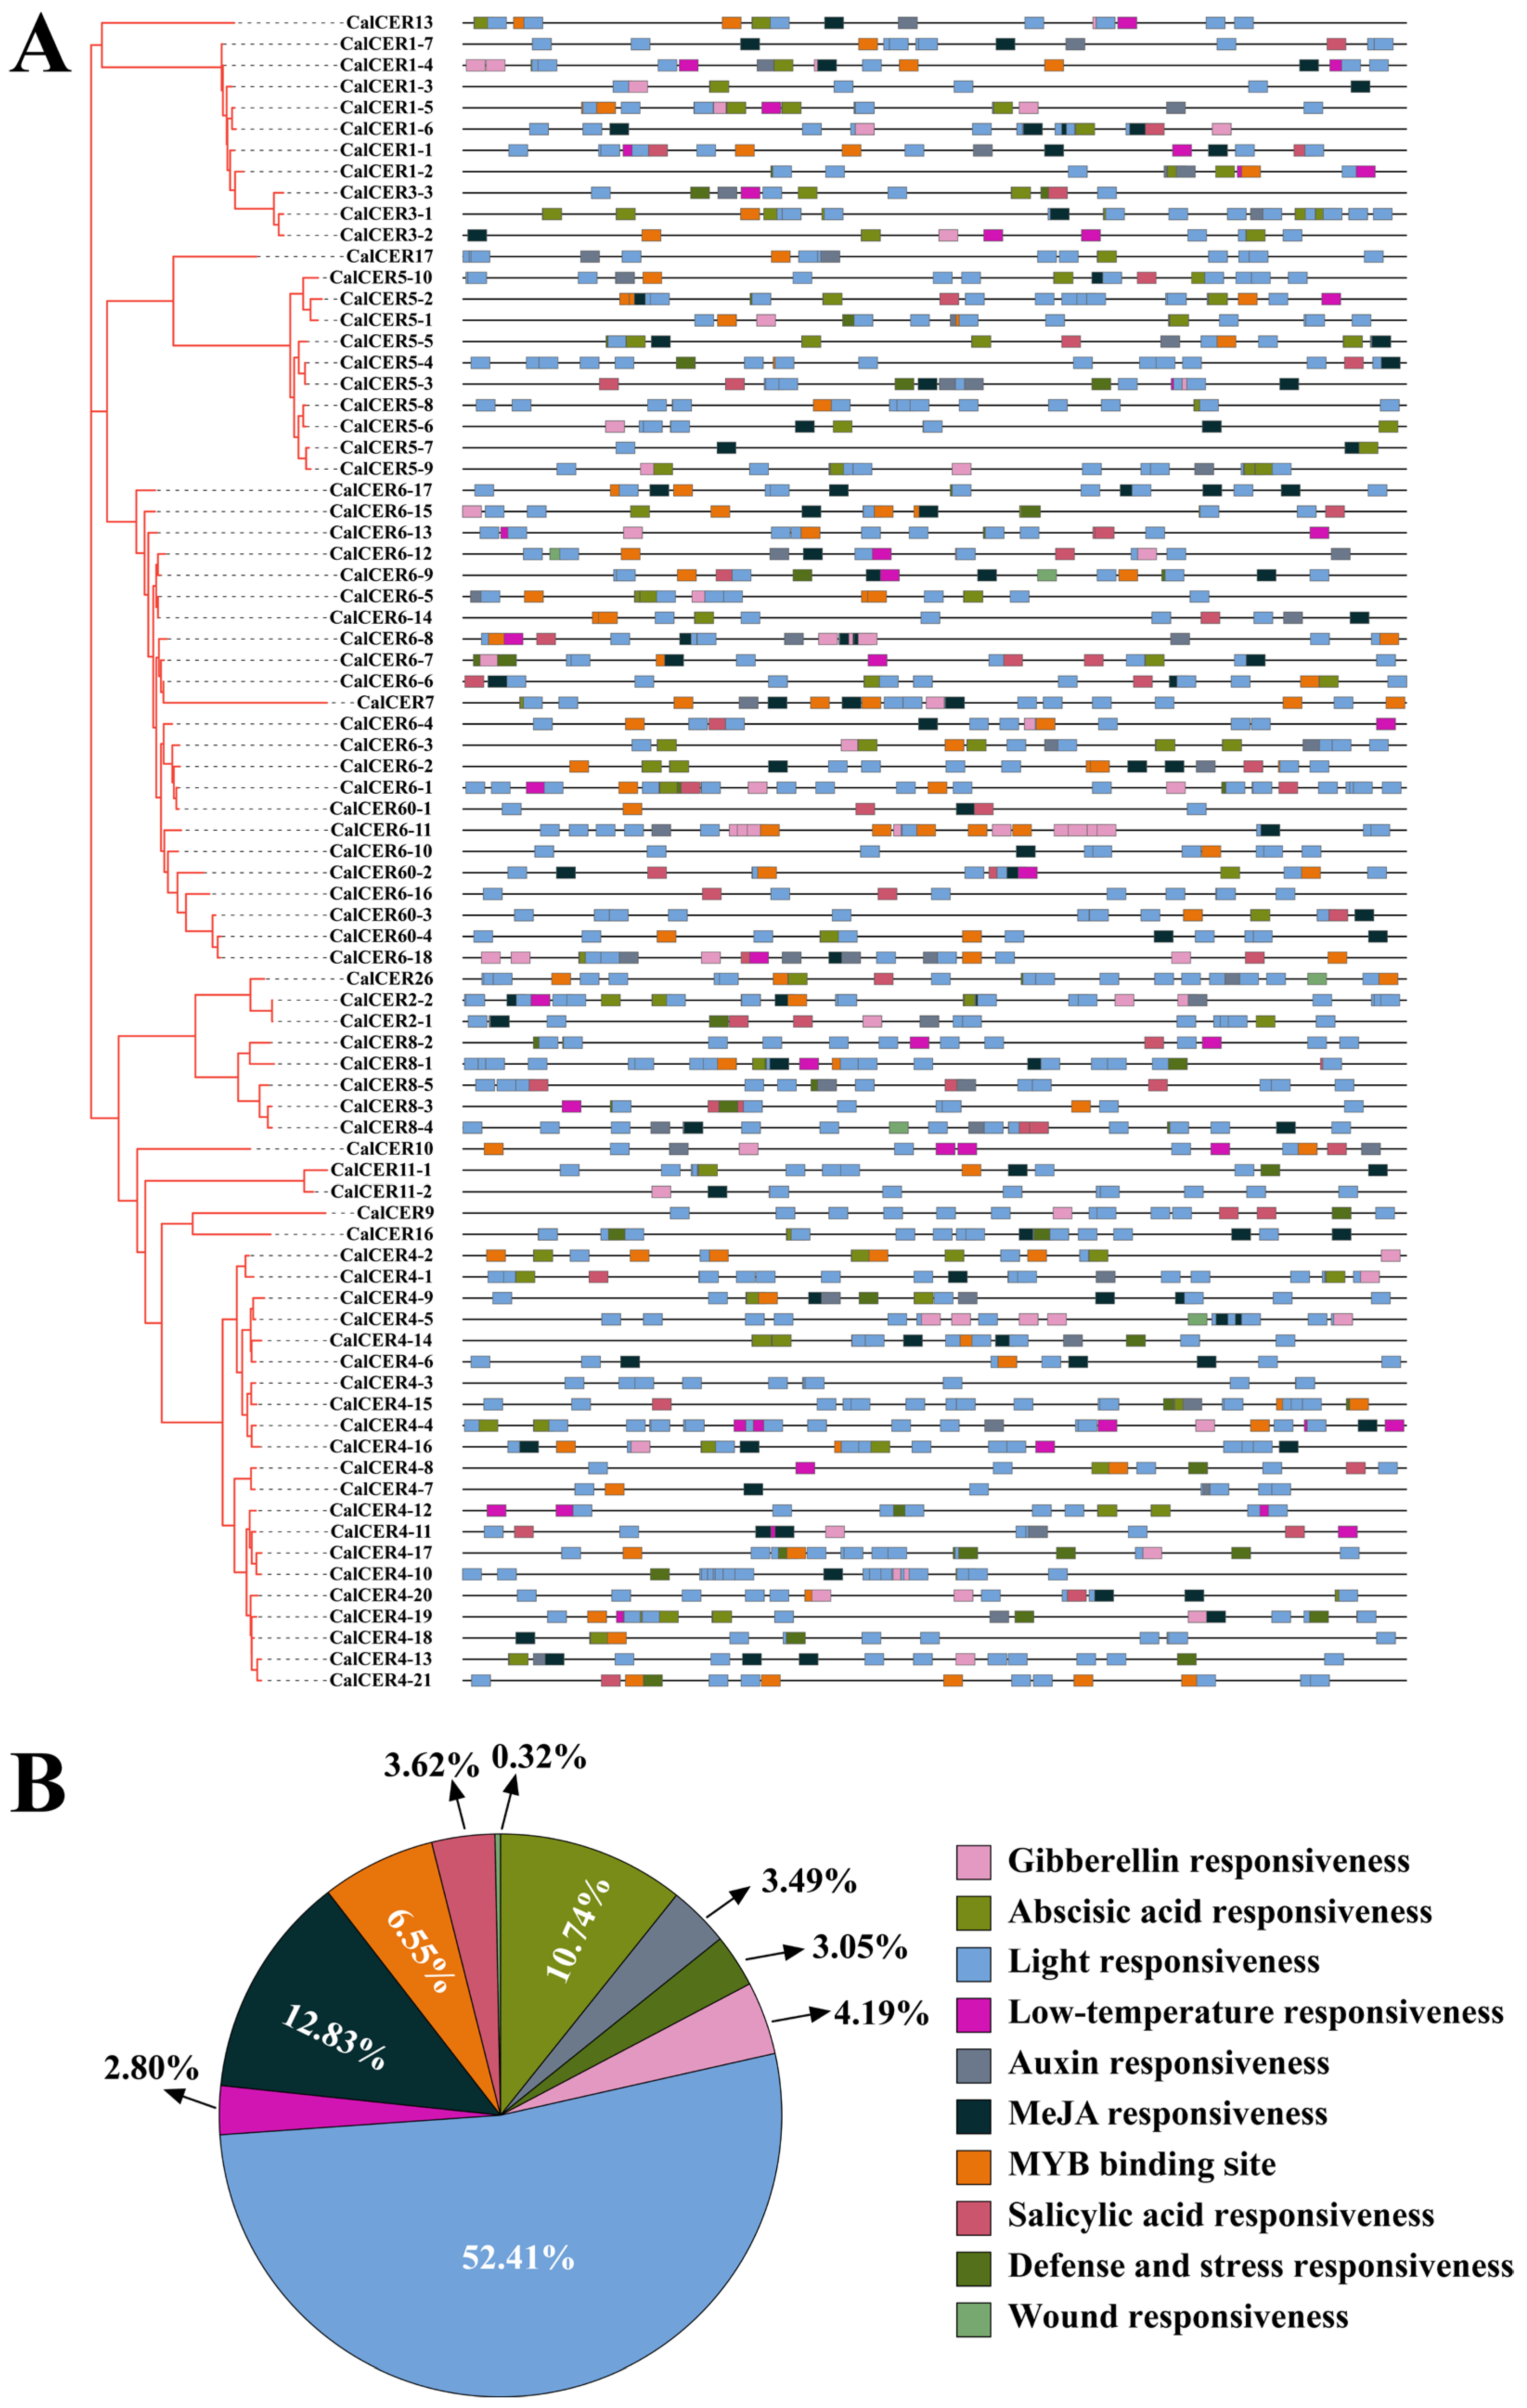
3.4. Cis-Regulatory Element Analysis of CalCERs

To further understand the possible functions of CalCER genes, the cis-regulatory elements of CalCER genes from 2000 bp upstream promoter regions were analyzed (Figure 4A, Table S3). The promoters of CalCER genes mainly comprised 10 categories of cis-regulatory elements including light responsiveness (26 different types of cis-elements, including 3-AF1 binding site, 4cl-CMA2b, ACE, AE-box, AT1-motif, ATC-motif, ATCT-motif, Box 4, Box II, CAG-motif, chs-CMA1a, chs-CMA2a, chs-Unit 1 m1, GA-motif, Gap-box, GATA-motif, G-box, GT1-motif, GTGGC-motif, I-box, LAMP-element, LS7, sbp-CMA1c, Sp1, TCCC-motif, and TCT-motif), MeJA responsiveness (two different types of cis-elements, including CGTCA-motif and TGACG-motif), abscisic acid responsiveness (only ABRE), MYB binding site (four different types of cis-elements, including CCAAT-box, MBS, MBSI, and MRE), gibberellin responsiveness (three different types of cis-elements: GARE-motif, P-box, and TATC-box), salicylic acid responsiveness (two different types of cis-elements: SARE and TA-element), auxin responsiveness (four different types of cis-elements: AuxRE, AuxRR-core, TGA-box, and TGA-element), defense and stress responsiveness (TC-rich repeats), low-temperature responsiveness (LTR), and wound responsiveness (WUN-motif). Light-responsive elements dominated the promoter landscape (52.41% of total elements), followed by MeJA- (12.83%) and ABA-responsive motifs (10.74%). In contrast, wound-responsive elements were least abundant (0.32%) (Figure 4B, Table S3). The prevalence of stress- and hormone-related motifs—particularly ABRE, G-box, and TC-rich repeats—suggests that CalCER genes are likely regulated by interconnected networks involving abiotic stress, phytohormone signaling, and photomorphogenesis during plant growth and environmental adaptation.

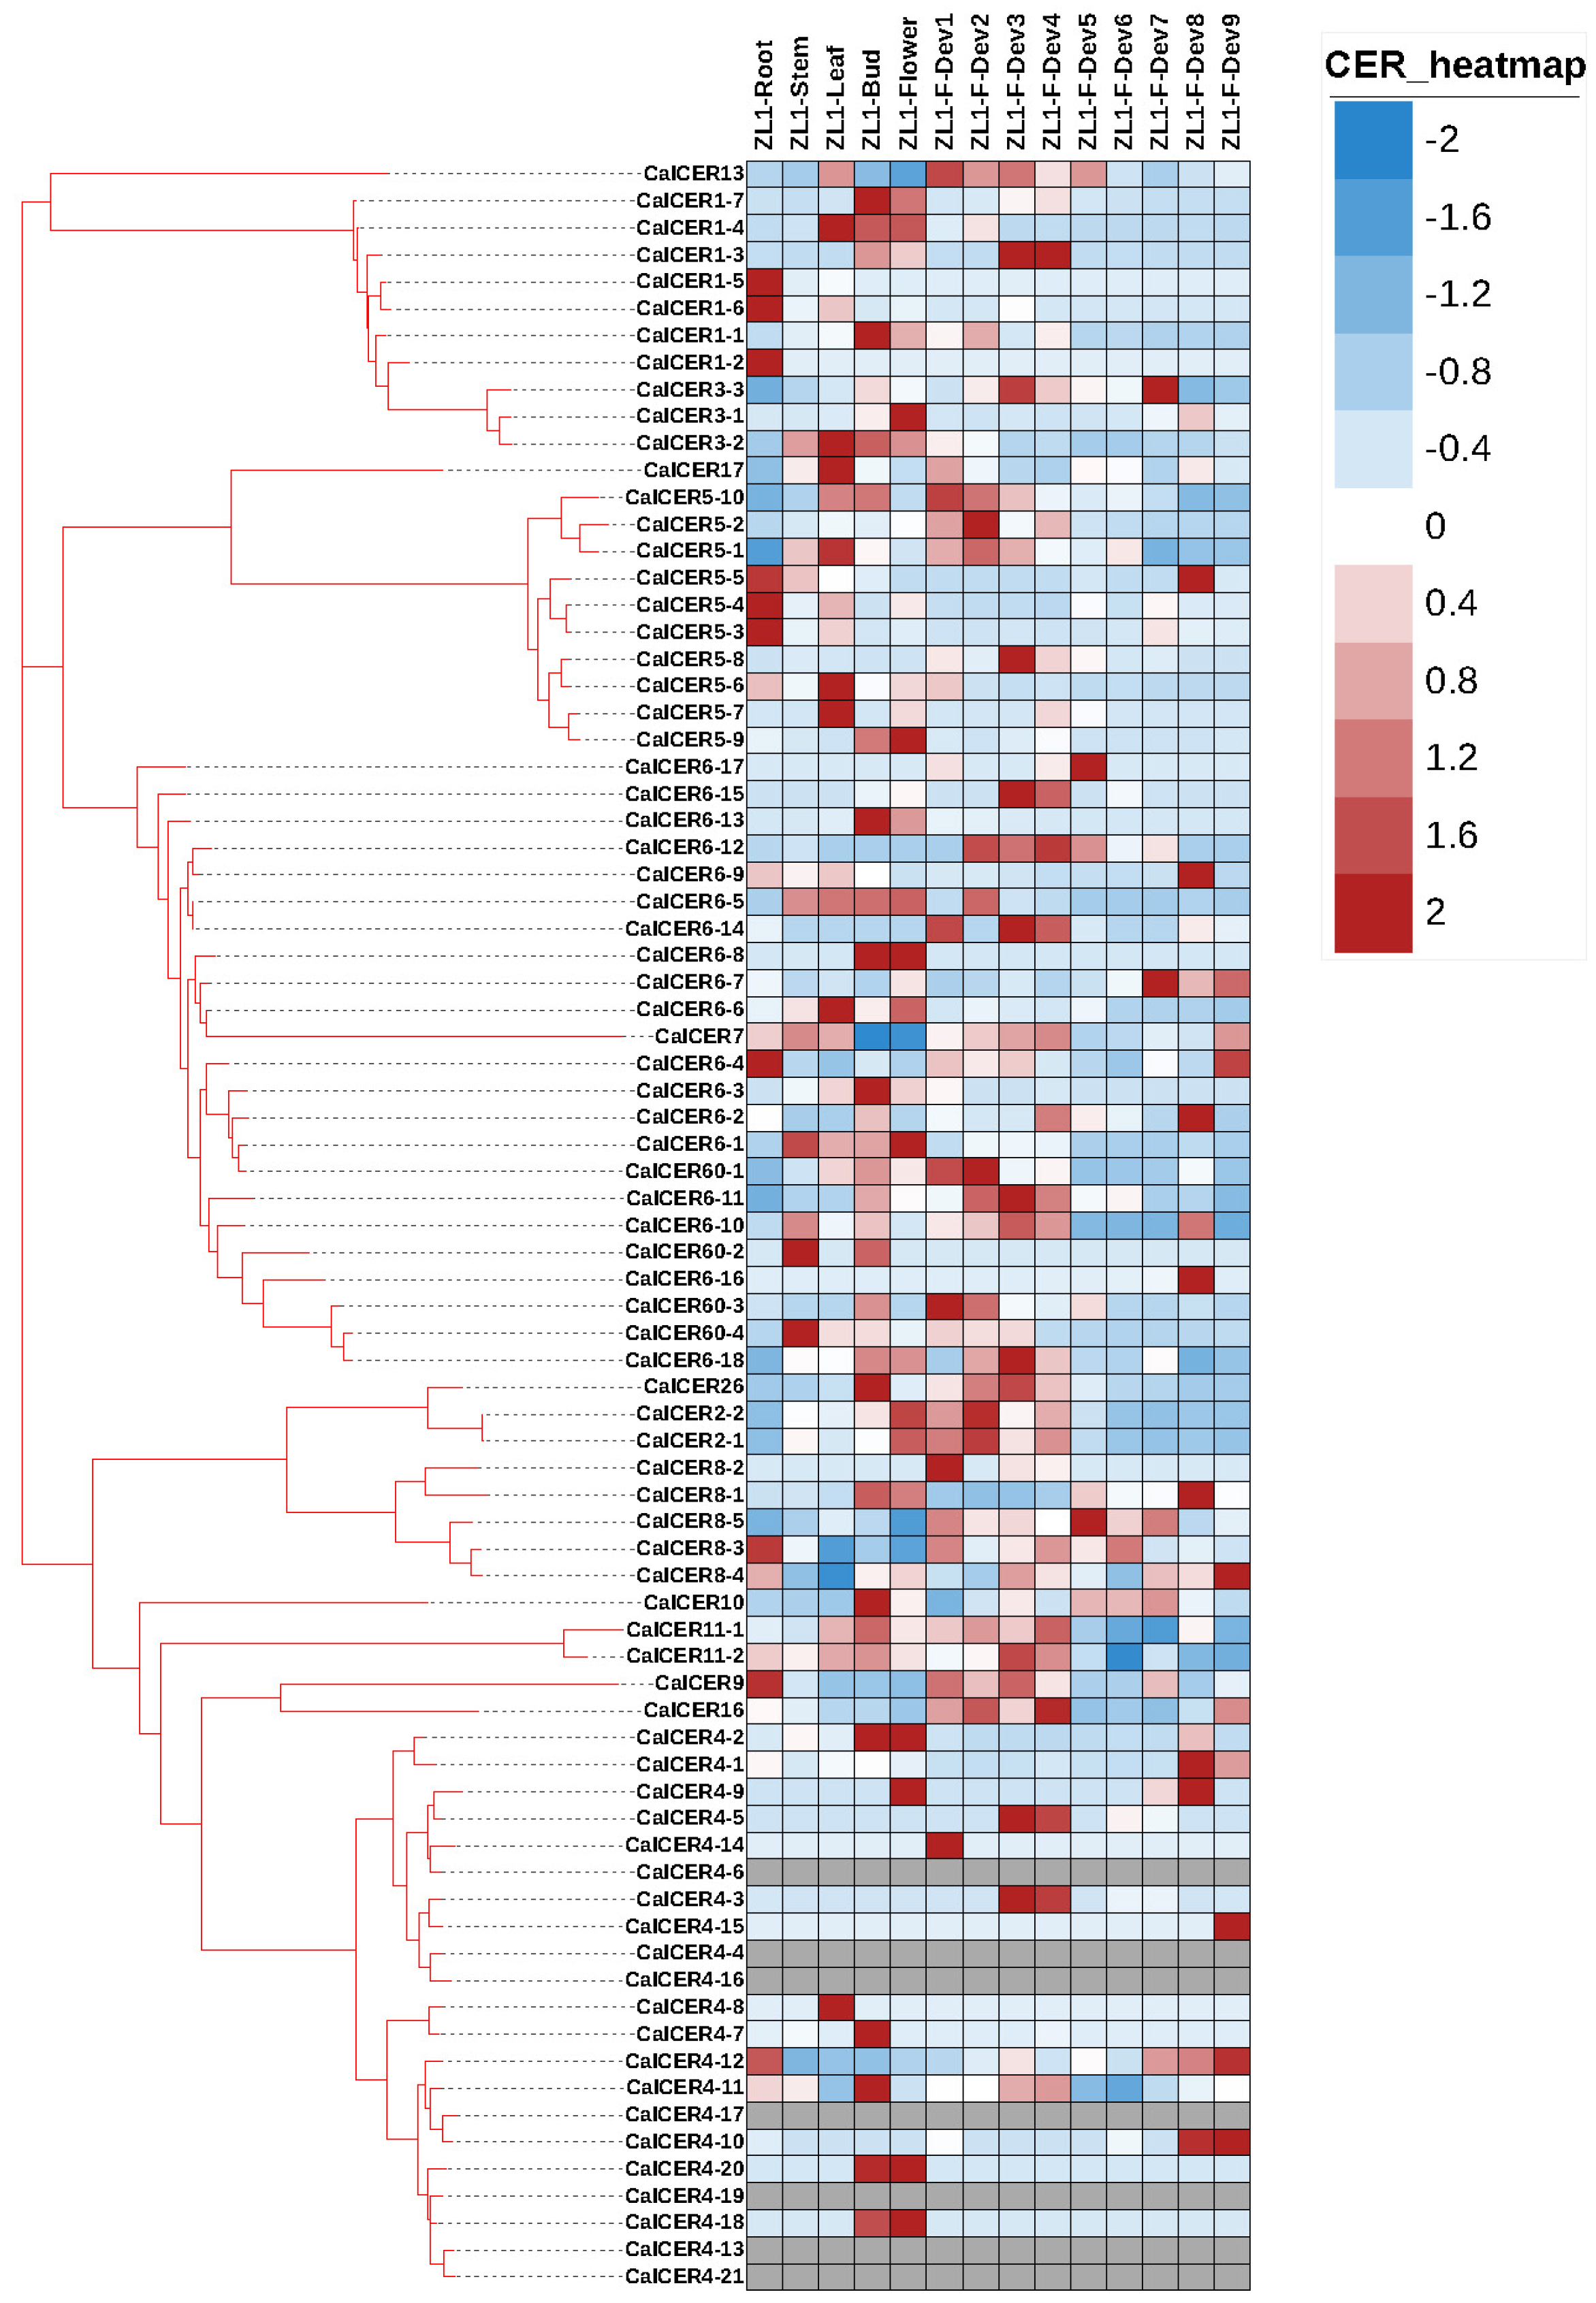
3.5. Expression Profiles of CalCER Genes During Different Development Stages

In order to explore the spatial and temporal transcriptional characteristics of CalCER genes and analyze their function, transcriptomic data from the pepper reference cultivar Zunla-1 [47] were analyzed across tissues and developmental stages (Figure 5; Table S4). As shown in Figure 5 and Table S4, CalCER1-2, CalCER1-5, CalCER1-6, CalCER5-3, CalCER5-4, CalCER6-4, CalCER8-3, and CalCER9 were mainly expressed in roots, CalCER60-2 and CalCER60-4 were mainly expressed in stems, CalCER4-8, CalCER5-1, CalCER5-6, CalCER5-7, CalCER6-6, and CalCER17 were mainly expressed in leaf, CalCER1-1, CalCER4-7, CalCER4-11, CalCER6-3, and CalCER10 were mainly expressed in bud, CalCER3-1 were mainly expressed in flower, and CalCER1-7, CalCER5-9, CalCER6-13, CalCER5-9, CalCER4-2, CalCER4-18, and CalCER4-20 were mainly expressed in bud and flower. The expression of CalCER4-4, CalCER4-6, CalCER4-13, CalCER4-16, CalCER4-17, CalCER4-19, or CalCER4-21 was not detected in any tissue. Expect for CalCER1-4, CalCER3-2, CalCER6-1, CalCER6-5, CalCER7, CalCER11-1, and CalCER11-2, the majority of the remaining CalCER genes are predominantly expressed during various developmental stages of fruit. These specific expression patterns imply their functions in the biotic/abiotic resistance of leaves, pollen fertility of flowers, or glossiness and shelf life of the fruits by potentially influencing the synthesis of wax.

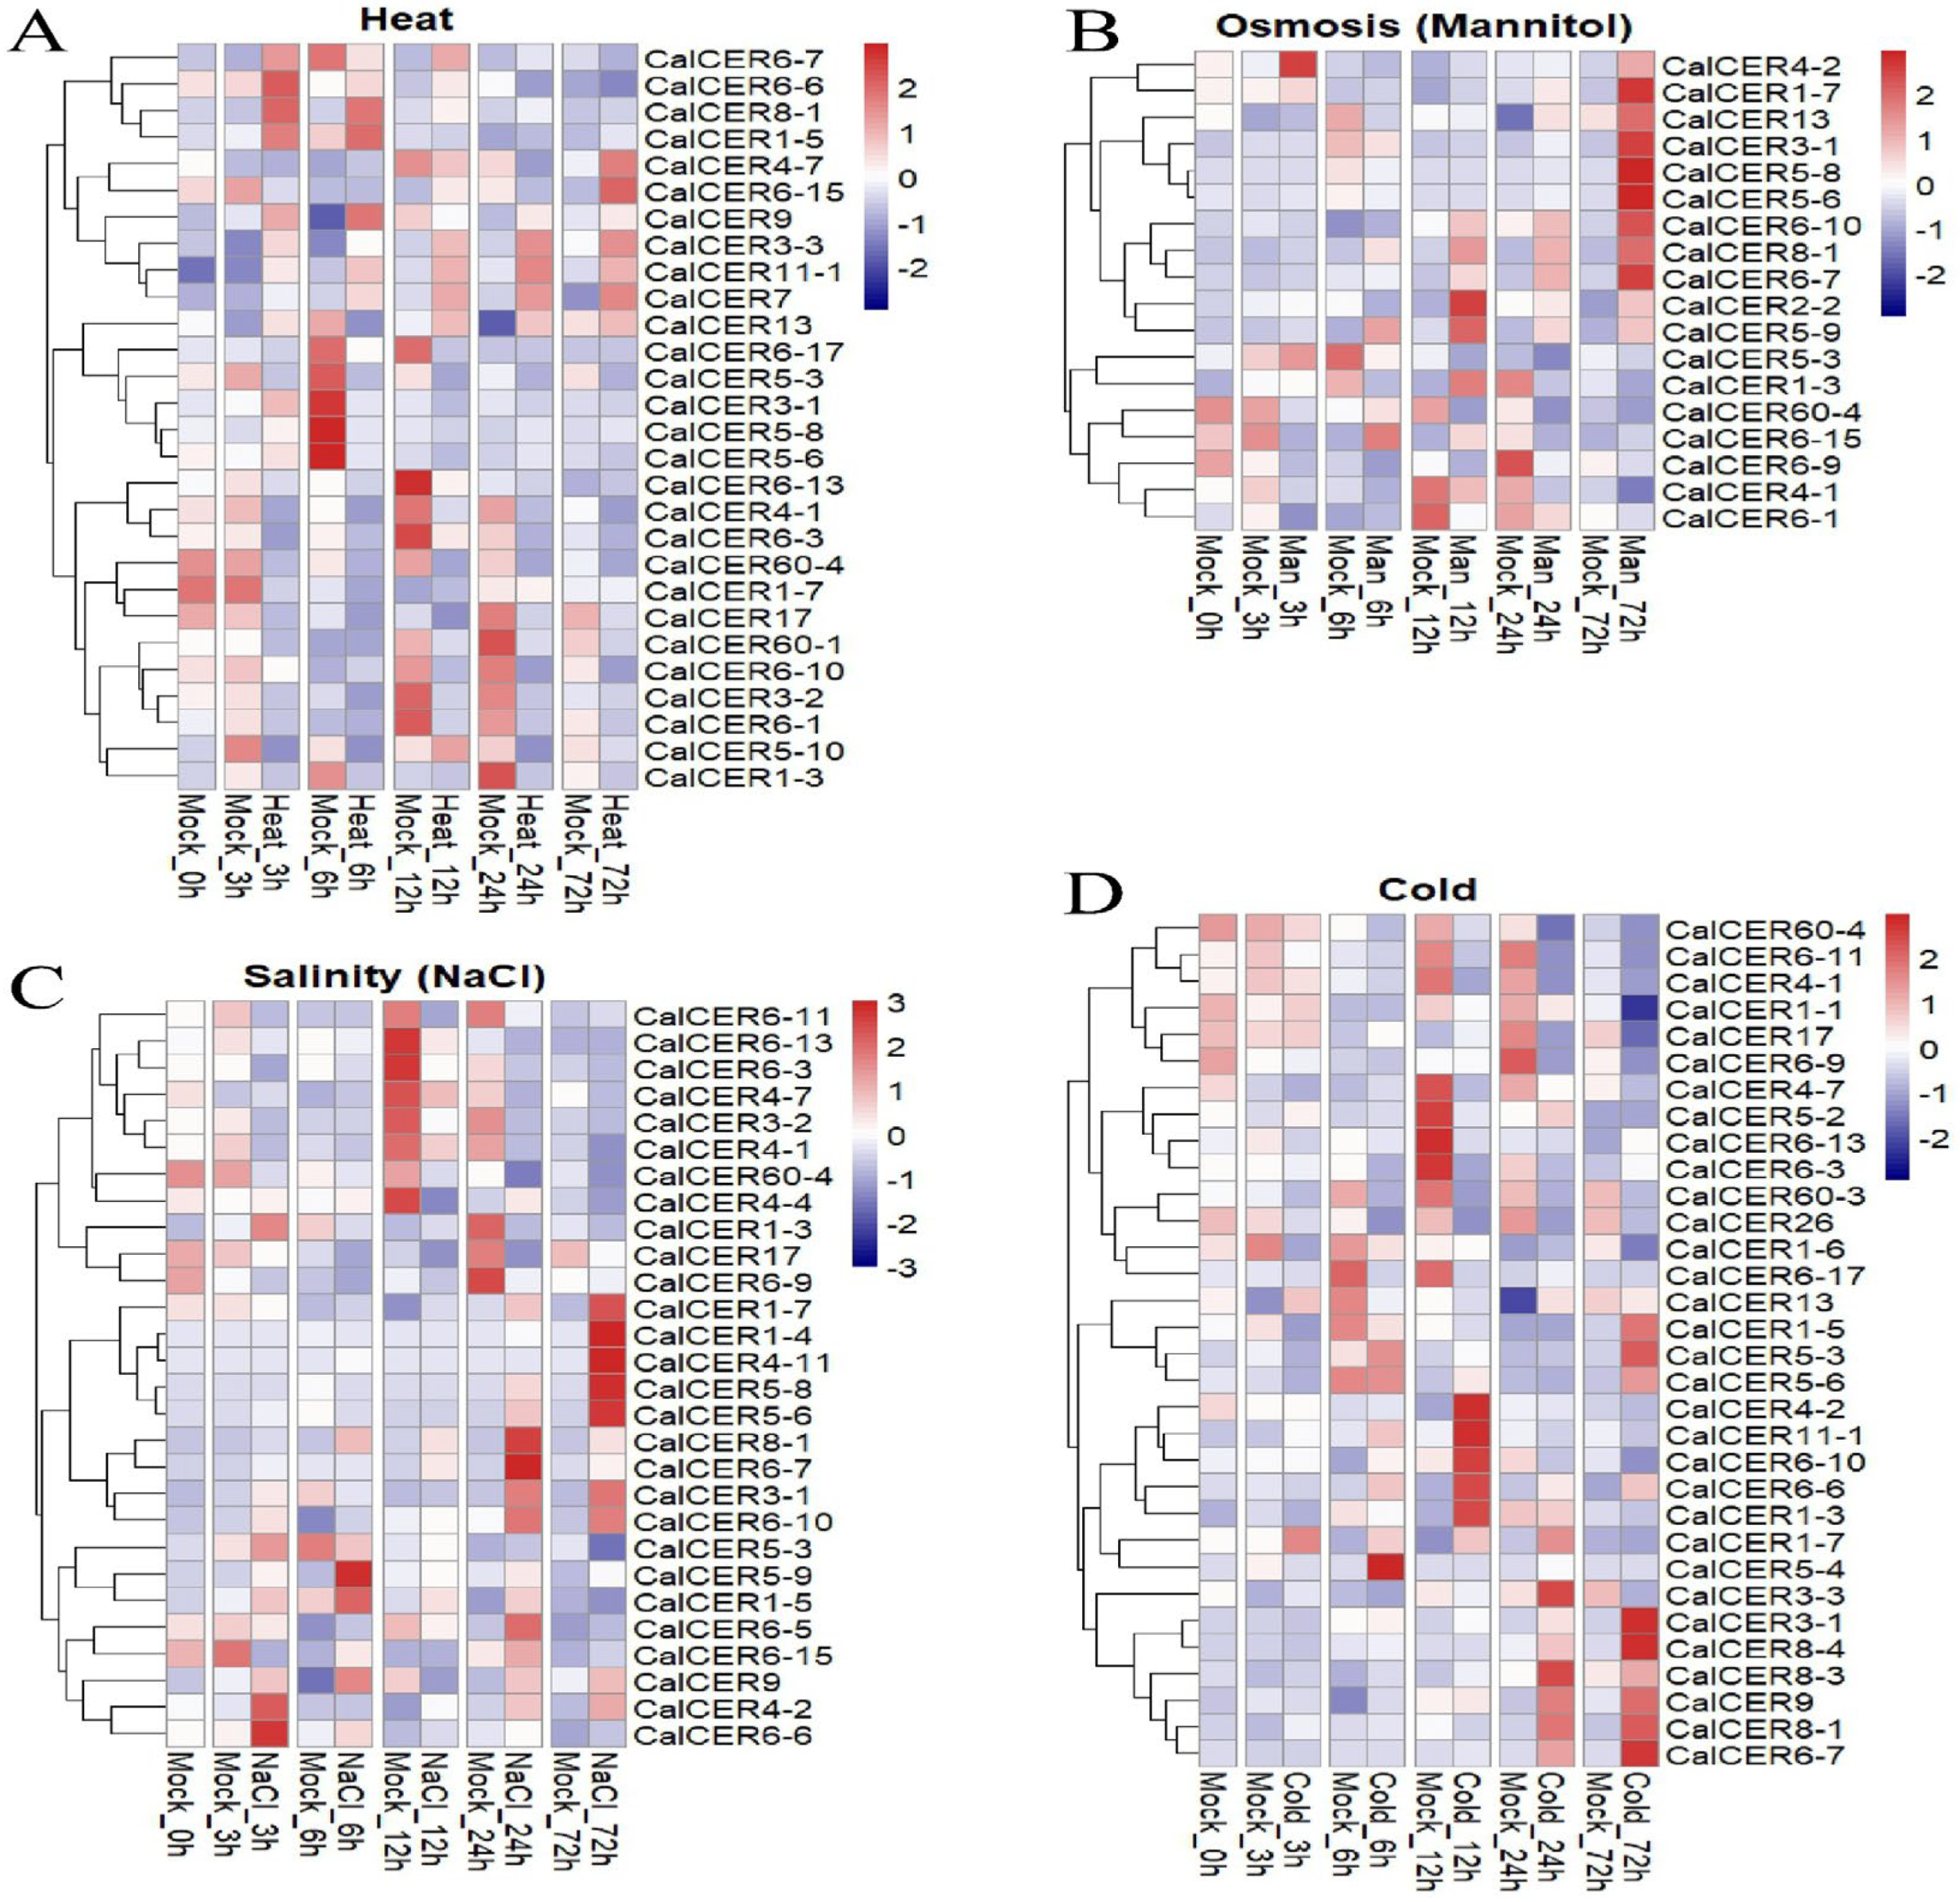
3.6. Expression Profiles of CalCERs Under Abiotic Stress

CER genes have been reported to play important roles in abiotic stress conditions. In order to explore the expression patterns of CalCER genes under heat, osmosis, salt, and cold stresses, we downloaded the transcriptome sequencing data of pepper under environmental stresses on the NCBI website. Genes without significant expression change among treatments were excluded from the analysis (Kruskal–Wallis test, |log2Foldchange| > 1, and p < 0.05) (Tables S5 and S6). Further, 28, 18, 28, and 32 CalCER genes showed changes in their expression levels under heat, osmosis, salt, and cold stress treatments, respectively (Figure 6). Comprehensive analysis revealed that members of this gene family exhibit intricate differential expression patterns under diverse abiotic stresses (heat, osmosis, salt, and cold stresses). Under osmosis stress, CalCER4-2, CalCER6-1, CalCER6-7, and CalCER6-15 displayed rapid responsiveness (fold change > 2 within 3 h of treatment), whereas most of the differentially expressed genes began to show significant differences 12 h after treatment. Similarly, high-salinity treatment triggered expression of CalCER4-2 and CalCER6-6 within 3 h of treatment, and most of the differentially expressed genes also began to show significant differences after 12 h of treatment. Among the differentially expressed genes (DEGs) under osmotic stress, all except CalCER13, CalCER2-2, and CalCER6-1 exhibited highly concordant differential expression patterns under salt stress conditions. Notably, CalCER1-7, CalCER3-1, CalCER4-7, and CalCER5-3 exhibited bidirectional regulation under low- and high-temperature stresses, suggesting its potential role in decoding temperature-specific signaling.
The rapid induction of CalCER4-2 and CalCER6 subfamily members underscores their potential as early responders to osmotic and ionic stress, possibly through cuticular wax remodeling. Conversely, delayed responses in most genes may reflect secondary adaptive processes, such as systemic wax reinforcement or stress hormone crosstalk. Bidirectional regulation under temperature extremes highlights the functional plasticity of CalCERs in balancing stress tolerance with growth trade-offs.

3.7. Expression Profiles of CalCERs Under Biotic Stress

Transcriptomic analysis revealed distinct expression dynamics of CalCER genes in response to diverse biotic stresses, including bacterial pathogens (Xanthomonas campestris pv. vesicatoria race 1/3, Xanthomonas axonopodis pv. glycines 8ra) and the oomycete Phytophthora capsica (Figure 7; Tables S7 and S8). Notably, CalCER3-1 and CalCER5-3 were significantly upregulated after inoculation for all tested pathogens, suggesting their broad-spectrum involvement in defense signaling (Figure 7). Intriguingly, three CalCER genes, CalCER2-2, CalCER5-9, and CalCER6-10, previously associated with osmotic stress adaptation, exhibited pathogen-specific suppression patterns during distinct pathogen infection: CalCER2-2 showed marked downregulation during Phytophthora capsici infection (Figure 7D), CalCER5-9 demonstrated significant repression in response to Xanthomonas axonopodis (Figure 7C), and CalCER6-10 displayed strong suppression when challenged with Xanthomonas campestris pv. vesicatoria race 1 (Figure 7A). This suppression may reflect pathogen-driven manipulation of cuticular wax biosynthesis to facilitate host penetration. These spatiotemporal expression divergences underscore the functional diversification of CalCERs—while some members act as generalized stress responders, others fine-tune immunity in a pathogen- and pathway-specific manner, likely through modulating cuticle integrity, signal transduction, or direct antimicrobial compound synthesis.

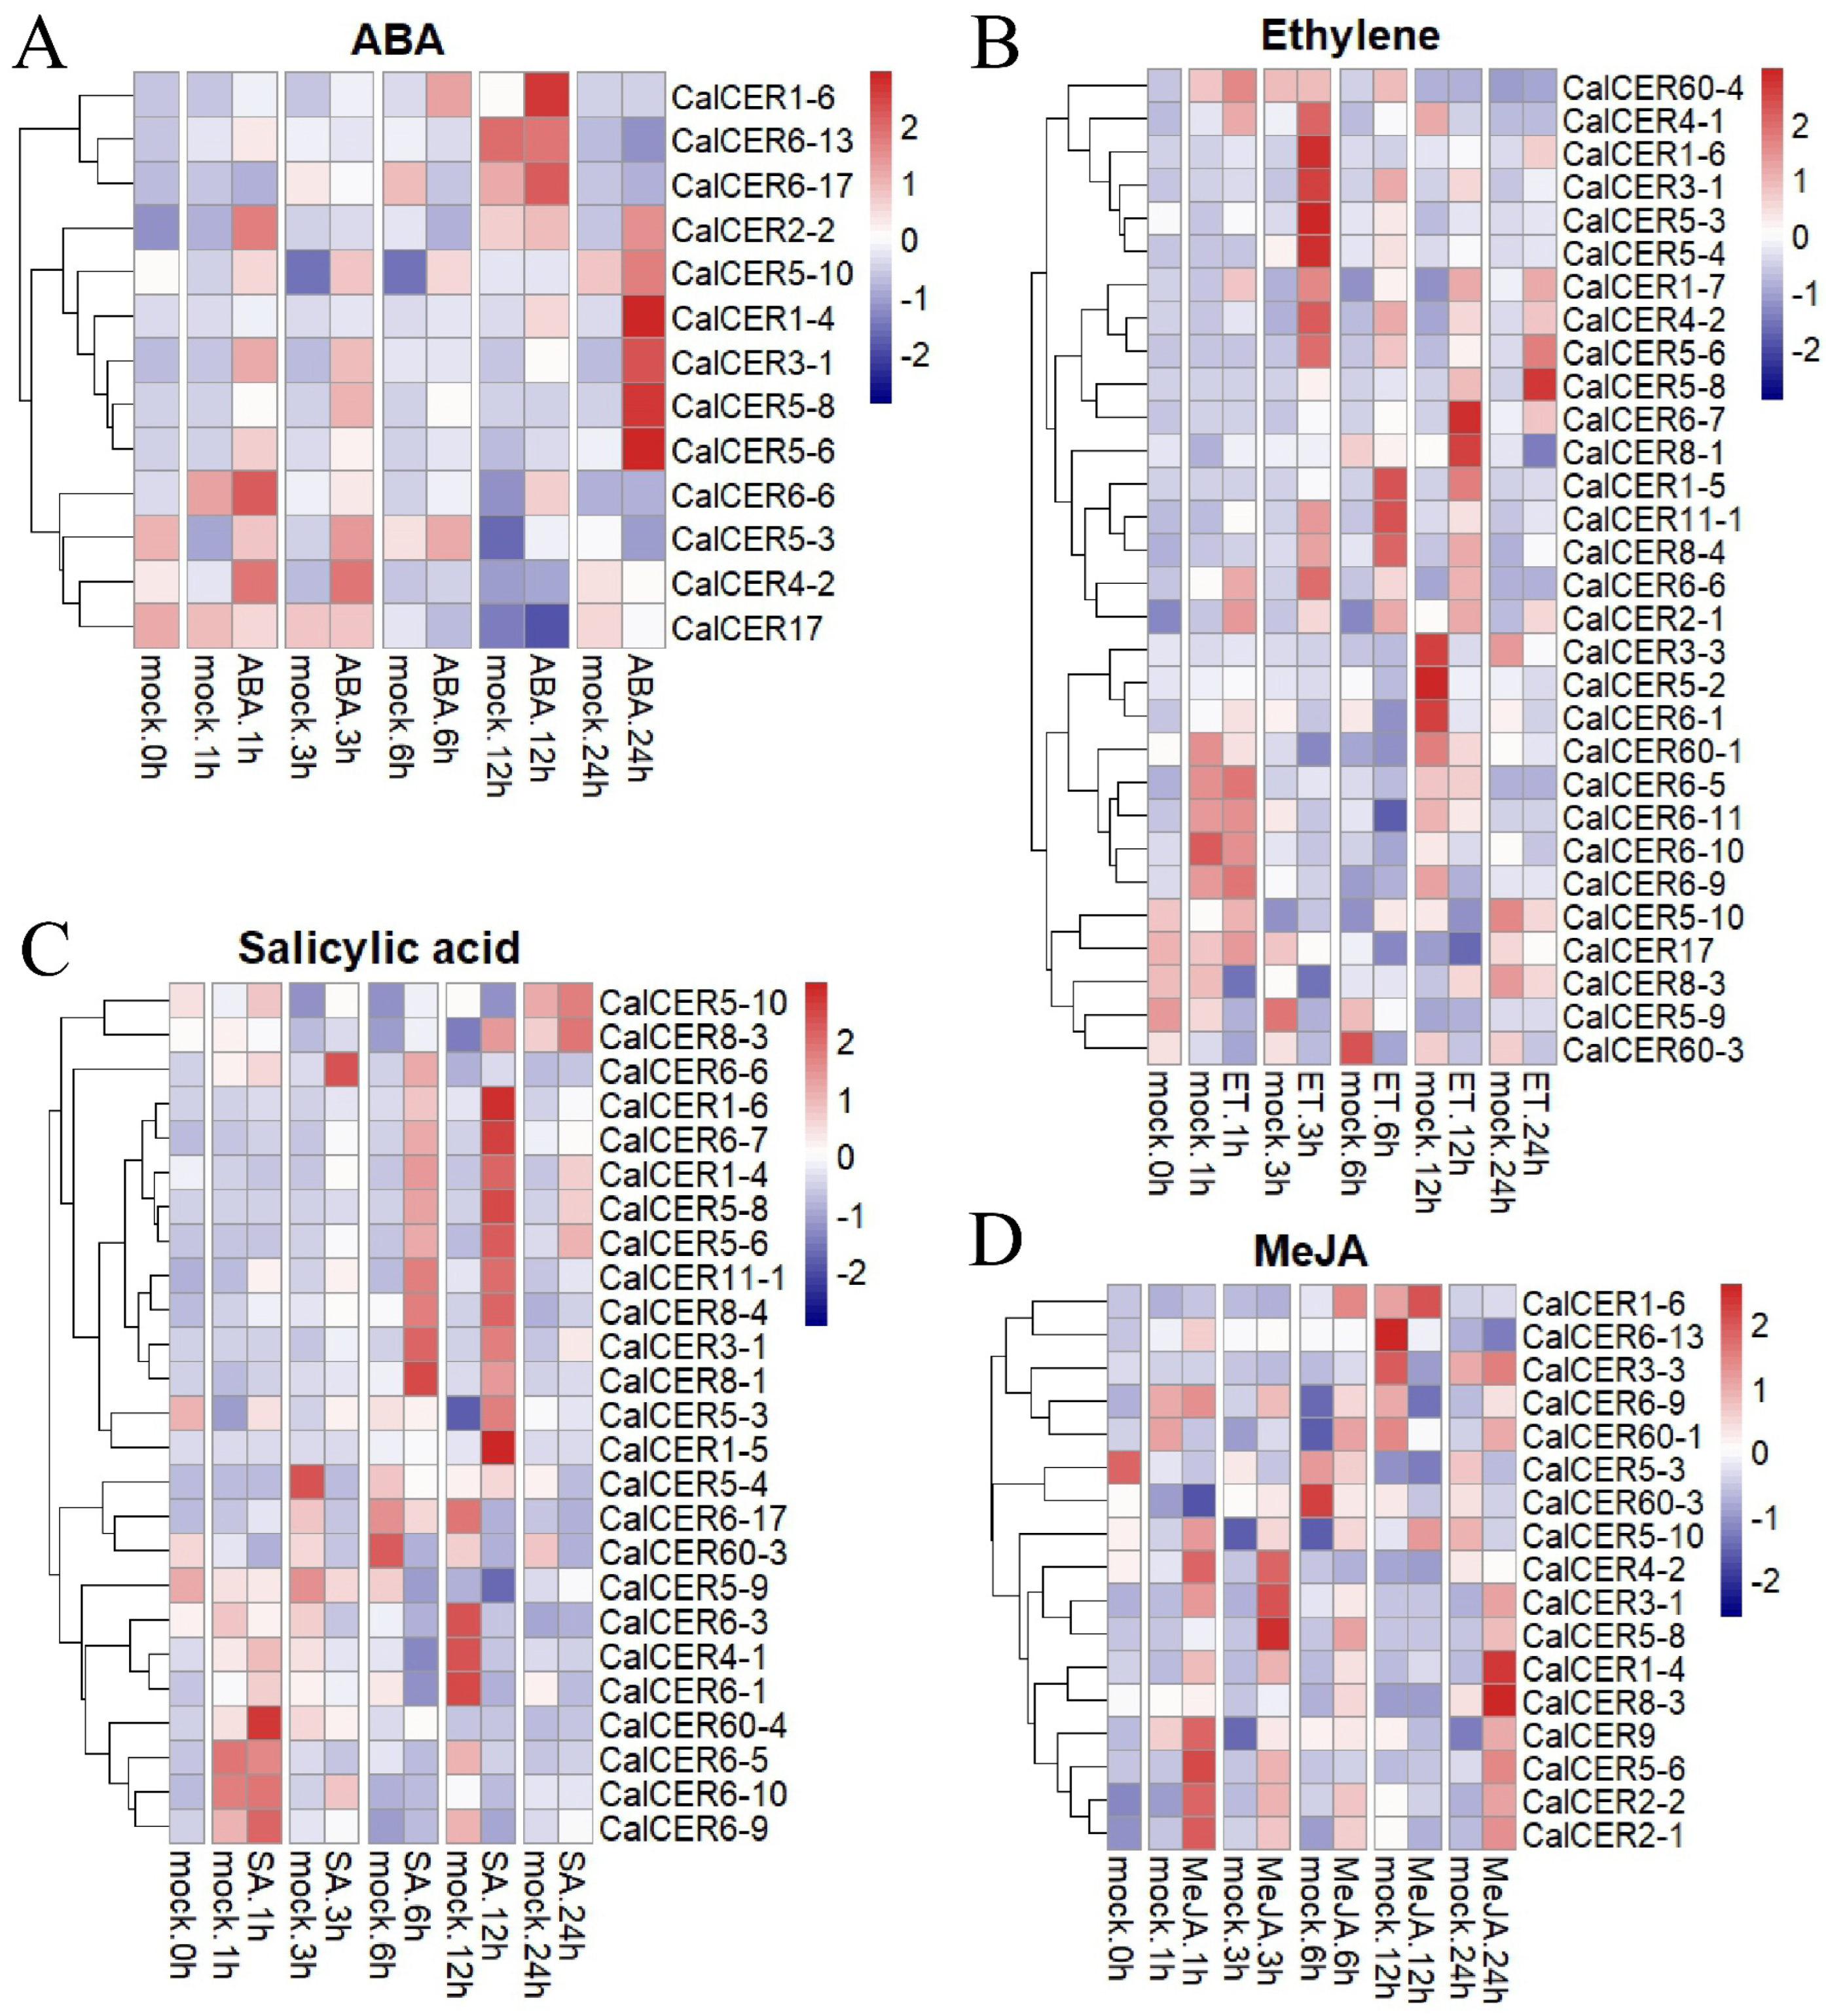
3.8. Expression Profiles of CalCERs Under Phytohormone Treatment

Transcriptomic analyses demonstrated that CalCER family members exhibit hormone-specific expression dynamics in response to key phytohormones, including abscisic acid (ABA), jasmonic acid (JA), salicylic acid (SA), and ethylene (ET) (Figure 8; Tables S9 and S10). CalCER2-2 displayed rapid and sustained upregulation under ABA treatment (≥2.5-fold induction at 1–24 h post-treatment), correlating with drought stress-responsive patterns, which suggests their dual roles in ABA-mediated abiotic stress adaptation and stomatal regulation (Figure 8A). Notably, CalCER3-1 exhibited significant upregulation specifically in response to jasmonic acid (JA), showing an 8-fold induction within 1 h of treatment (Figure 8D). This rapid and selective transcriptional activation strongly suggests its functional specialization in plant defense mechanisms, potentially mediating resistance against pathogens through JA-dependent signaling pathways. Notably, CalCER6-10, CalCER8-1, and CalCER8-3 exhibited hormone antagonism: it was strongly activated by SA but suppressed by ET, mirroring the SA-ET signaling conflict observed in hemibiotrophic pathogen responses (Figure 8B,C). Promoter analysis revealed that ABA/JA-responsive CalCERs (e.g., CalCER4-2, CalCER5-6) are enriched with cis-elements such as ABRE (ABA-responsive element) and G-box (JA-responsive element), while SA/ET-regulated members (e.g., CalCER5-8) harbor TGA- and ERE-binding motifs.

4. Discussion

The CER gene family, as a key regulator of plant cuticular wax biosynthesis, plays a pivotal role in plant resistance to biotic and abiotic stresses [6,7]. Combined with findings from other species (e.g., apple [26], sunflower [27], jujube [28], passion fruit [29], and chestnut [30]), the results of this study further elucidate the evolutionary conservation and functional diversity of the CER gene family in plant adaptation to environmental stresses.
The number of CalCER genes in pepper (79) is significantly higher than that in apple (10) [26], sunflower (37) [27], and jujube (29) [28], likely due to the complexity of the pepper genome and species-specific gene duplication events (e.g., tandem and segmental duplications). Phylogenetic reconstruction classified CalCER genes into five distinct clades, with clades 1 and 4 containing orthologs of Arabidopsis alkane biosynthesis regulators (AtCER1/AtCER3) and fatty acid elongase components (AtCER6/AtCER60), respectively [6,22,48,49]. Gene structure and motif analyses indicated that CalCER genes within the same clade share similar motif compositions and exon–intron structures (Figure 3). For example, CalCER6s and CalCER60s both harbor multiple conserved motifs, whereas CalCER2s and CalCER8s exhibit unique motif losses, possibly linked to functional divergence. These structural features align with those of CER genes in apple [26] and sunflower [27], highlighting that conserved gene architecture underpins functional diversification within the CER family.
Tissue-specific expression profiling revealed significant differences in CalCER gene expression across organs. For instance, CalCER1-2 and CalCER5-3 were highly expressed in roots, while CaCER3-1 showed flower-specific expression, likely reflecting their roles in cuticular wax synthesis in specific tissues (Figure 5). Similarly, apple MdCER genes are highly expressed in stems and leaves, and cucumber CsCER1 is expressed in fruit peels, indicating conserved expression patterns across species [26,50]. Under abiotic stresses (drought, salt, heat, and cold), CalCER4-2 and CalCER6-6 were rapidly upregulated at 3 h post-treatment, while most genes responded after 12 h (Figure 6), mirroring the stress-induced patterns of sunflower HanCER10 and passion fruit PeCER [27,29]. This suggests that CER genes may enhance cuticular barrier functions by rapidly modulating wax components (e.g., alkanes). Additionally, bidirectional regulation of CalCER1-7 and CalCER3-1 under high- and low-temperature stresses implies their involvement in temperature-specific signaling (Figure 6A,D), a phenomenon also observed in tomato SlCER genes, though the precise mechanisms require further exploration [31].
Cis-element analysis demonstrated that CalCER promoters are enriched in hormone-responsive elements (e.g., ABA, JA, and SA) and stress-related elements (e.g., drought or low temperature), consistent with their roles in hormone-mediated stress responses. For example, CalCER2-2 showed sustained upregulation under ABA treatment (Figure 8A), resembling the ABA-dependent regulation of AtCER2 in Arabidopsis [11,51,52]. Furthermore, pathogen-specific suppression of CalCER2-2 and CalCER6-10 during pathogen infection may reflect pathogen strategies to disrupt wax synthesis for enhanced invasion (Figure 7), a phenomenon also observed in tomato [31] and passion fruit [29], highlighting the dual roles of CER genes in plant–pathogen interactions. Notably, functional conservation of CER genes across species is evident: AtCER1 in Arabidopsis [7], MdCER1 in apple, and CalCER1 in pepper all enhance drought resistance by regulating alkane synthesis, while the CER3-CER1 complex in fatty acid decarbonylation is highly conserved between Arabidopsis and pepper.
While this study systematically deciphered the evolutionary and expression characteristics of the CalCER family in pepper, several limitations remain: (1) Functional validation of CalCER genes via transgenic or gene-editing approaches is pending; (2) The interaction network among CalCER genes and their precise mechanisms in wax biosynthesis pathways require further elucidation; (3) The regulatory roles of CalCER genes in fruit quality traits remain underexplored. Future research could employ CRISPR/Cas9 to generate CalCER mutants and integrate metabolomics to analyze wax composition changes. Additionally, the regulatory relationships between CalCER genes and transcription factors and their selection signals during domestication warrant deeper investigation.

5. Conclusions

This study presents the first genome-wide identification of the CER gene family in pepper (Capsicum annuum), uncovering 79 CalCER genes. Phylogenetic analysis grouped the CalCER genes into five clades, each characterized by conserved structural features, including conserved motifs and exon–intron organizations. Promoter cis-element analysis revealed a significant enrichment of light-responsive elements, as well as regulatory motifs associated with abscisic acid (ABA), jasmonic acid (JA), and various stress responses (e.g., drought, cold, and salt stress). Transcriptomic data further highlighted tissue-specific expression patterns of CalCER genes, implicating their critical roles in stress adaptation and cuticle development—particularly in fruit epidermal wax formation and responses to abiotic stresses. Cross-species comparative analyses highlight both functional conservation and species-specific diversification of CalCER genes during evolution, offering a theoretical foundation for their application in stress-resilient crop breeding. Future functional validation and mechanistic studies may enable targeted manipulation of CalCER genes to enhance stress tolerance and fruit quality in pepper.

Supplementary Materials

The following supporting information can be downloaded at: https://www.mdpi.com/article/10.3390/horticulturae11060571/s1, Figure S1: Principal components analysis (PCA) of RNA-seq data at 3 h (A), 6 h (B), 12 h (C), 24 h (D), and 72 h (E) under abiotic stress conditions; Figure S2: Principal components analysis (PCA) of RNA-seq data after inoculation for Xanthomonas axonopodis pv. glycines 8ra (A), Xanthomonas campestris pv. vesicatoria race 1 (B), Xanthomonas campestris pv. vesicatoria race 3 (C), and Phytophthora capsica (D); Figure S3: Principal components analysis (PCA) of RNA-seq data at 1 h (A), 3 h (B), 6 h (C), 12 h (D), and 24 h (E) under phytohormone treatment; Table S1: The Results of CalCER identification with BLASTP and Pfam searching; Table S2: The physicochemical properties and subcellular localization prediction of CalCERs; Table S3: The cis-regulatory element prediction in CalCER gene promoters; Table S4: Expression profiles of CalCER genes in different tissues and during different fruit development stages; Table S5: Expression profiles of CalCER genes under abiotic stress; Table S6: Differentially expressed genes of CalCERs under abiotic stress; Table S7: Expression profiles of CalCER genes under biotic stress; Table S8: Differentially expressed genes of CalCERs under biotic stress; Table S9: Expression profiles of CalCER genes under phytohormone treatment; Table S10: Differentially expressed genes of CalCERs under phytohormone Ttreatment.

Author Contributions

Conceptualization, F.Y., K.W., Q.Y. and H.X.; methodology, F.Y., K.W., Y.Z., X.C., W.Y., Q.Y. and H.X.; software, K.W.; validation, F.Y., Y.Z., W.Y. and X.C.; formal analysis, K.W.; writing—original draft preparation, K.W.; writing—review and editing, F.Y., Y.Z., X.C., W.Y., Q.Y. and H.X.; visualization, K.W.; supervision, F.Y., Y.Z., X.C., W.Y., Q.Y. and H.X.; funding acquisition, F.Y., Q.Y. and H.X. All authors have read and agreed to the published version of the manuscript.

Funding

This research was funded by the S&T Breakthrough Projects of Henan Province (252102111094); China Agriculture Research System (CARS-24-G-15); the Key R&D Projects in Henan Province (251111111100); Joint Research on Agricultural Varieties Improvement of Henan Province (2022010502); the Innovation Team of Henan Academy of Agricultural Sciences (2024TD43); and the Self-dependent Innovation Program in Henan Academy of Agricultural Sciences (2025ZC32).

Data Availability Statement

All datasets presented in this study are included in the article.

Acknowledgments

Thanks go to Feng Pan of Tianjin Academy of Agricultural Sciences for his guidance and support in data analysis.

Conflicts of Interest

The authors declare no conflicts of interest.

References

  1. Waters, E.R. Molecular adaptation and the origin of land plants. Mol. Phylogenetics Evol. 2003, 29, 456–463. [Google Scholar] [CrossRef]
  2. Borisjuk, N.; Hrmova, M.; Lopato, S. Transcriptional regulation of cuticle biosynthesis. Biotechnol. Adv. 2014, 32, 526–540. [Google Scholar] [CrossRef]
  3. Wang, X.; Guan, Y.; Zhang, D.; Dong, X.; Tian, L.; Qu, L.Q. A β-Ketoacyl-CoA synthase is involved in rice leaf cuticular wax synthesis and requires a CER2-LIKE protein as a cofactor. Plant Physiol. 2016, 173, 944–955. [Google Scholar] [CrossRef]
  4. Hannoufa, A.; McNevin, J.; Lemieux, B. Epicuticular waxes of eceriferum mutants of Arabidopsis thaliana. Phytochemistry 1993, 33, 851–855. [Google Scholar] [CrossRef]
  5. Samuels, L.; Kunst, L.; Jetter, R. Sealing plant surfaces: Cuticular wax formation by epidermal cells. Annu. Rev. Plant Biol. 2008, 59, 683–707. [Google Scholar] [CrossRef]
  6. Bourdenx, B.; Bernard, A.; Domergue, F.; Pascal, S.; Léger, A.; Roby, D.; Pervent, M.; Vile, D.; Haslam, R.P.; Napier, J.A.; et al. Overexpression of Arabidopsis ECERIFERUM1 promotes wax very-long-chain alkane biosynthesis and influences plant response to biotic and abiotic stresses. Plant Physiol. 2011, 156, 29–45. [Google Scholar] [CrossRef]
  7. Aarts, M.G.; Keijzer, C.J.; Stiekema, W.J.; Pereira, A. Molecular characterization of the CER1 gene of Arabidopsis involved in epicuticular wax biosynthesis and pollen fertility. Plant Cell 1995, 7, 2115–2127. [Google Scholar] [CrossRef]
  8. Gao, Y.; Zhang, Z.; Cheng, J.; Xian, X.; Li, C.; Wang, Y. Genome-wide identification of the CER1 gene family in apple and response of MdCER1-1 to drought stress. Funct. Integr. Genom. 2023, 23, 17. [Google Scholar] [CrossRef]
  9. Ni, E.; Zhou, L.; Li, J.; Jiang, D.; Wang, Z.; Zheng, S.; Qi, H.; Zhou, Y.; Wang, C.; Xiao, S.; et al. OsCER1 plays a pivotal role in very-long-chain alkane biosynthesis and affects plastid development and programmed cell death of tapetum in rice (Oryza sativa L.). Front. Plant Sci. 2018, 9, 1217. [Google Scholar] [CrossRef]
  10. Haslam, T.M.; Haslam, R.; Thoraval, D.; Pascal, S.; Delude, C.; Domergue, F.; Fernández, A.M.; Beaudoin, F.; Napier, J.A.; Kunst, L.; et al. ECERIFERUM2-LIKE proteins have unique biochemical and physiological functions in very-long-chain fatty acid elongation. Plant Physiol. 2015, 167, 682–692. [Google Scholar] [CrossRef]
  11. Zhong, M.S.; Jiang, H.; Cao, Y.; Wang, Y.X.; You, C.X.; Li, Y.Y.; Hao, Y.J. MdCER2 conferred to wax accumulation and increased drought tolerance in plants. Plant Physiol. Biochem. 2020, 149, 277–285. [Google Scholar] [CrossRef]
  12. McNevin, J.P.; Woodward, W.; Hannoufa, A.; Feldmann, K.A.; Lemieux, B. Isolation and characterization of eceriferum (cer) mutants induced by T-DNA insertions in Arabidopsis thaliana. Genome 1993, 36, 610–618. [Google Scholar] [CrossRef]
  13. Jenks, M.A.; Tuttle, H.A.; Eigenbrode, S.D.; Feldmann, K.A. Leaf epicuticular waxes of the eceriferum mutants in Arabidopsis. Plant Physiol. 1995, 108, 369–377. [Google Scholar] [CrossRef]
  14. Wang, Y.; Jin, S.; Xu, Y.; Li, S.; Zhang, S.; Yuan, Z.; Li, J.; Ni, Y. Overexpression of BnKCS1-1, BnKCS1-2, and BnCER1- 2 promotes cuticular wax production and increases drought tolerance in Brassica napus. Crop J. 2019, 8, 12. [Google Scholar] [CrossRef]
  15. Rowland, O.; Zheng, H.; Hepworth, S.R.; Lam, P.; Jetter, R.; Kunst, L. CER4 encodes an alcohol-forming fatty acyl-coenzyme a reductase involved in cuticular wax production in Arabidopsis. Plant Physiol. 2006, 142, 866–877. [Google Scholar] [CrossRef]
  16. Pighin, J.A.; Zheng, H.; Balakshin, L.J.; Goodman, I.P.; Western, T.L.; Jetter, R.; Kunst, L.; Samuels, A.L. Plant cuticular lipid export requires an ABC transporter. Science 2004, 306, 702–704. [Google Scholar] [CrossRef]
  17. Nawrath, C.; Schreiber, L.; Franke, R.B.; Geldner, N.; Reina-Pinto, J.J.; Kunst, L. Apoplastic diffusion barriers in Arabidopsis. Arab. Book 2013, 11, e0167. [Google Scholar] [CrossRef]
  18. Lü, S.; Song, T.; Kosma, D.K.; Parsons, E.P.; Rowland, O.; Jenks, M.A. Arabidopsis CER8 encodes LONG-CHAIN ACYL-COA SYNTHETASE 1 (LACS1) that has overlapping functions with LACS2 in plant wax and cutin synthesis. Plant J. 2009, 59, 553–564. [Google Scholar] [CrossRef]
  19. Lee, S.B.; Suh, M.C. Regulatory mechanisms underlying cuticular wax biosynthesis. J. Exp. Bot. 2022, 73, 2799–2816. [Google Scholar] [CrossRef]
  20. Lü, S.; Zhao, H.; Des Marais, D.L.; Parsons, E.P.; Wen, X.; Xu, X.; Bangarusamy, D.K.; Wang, G.; Rowland, O.; Juenger, T.; et al. Arabidopsis ECERIFERUM9 involvement in cuticle formation and maintenance of plant water status. Plant Physiol. 2012, 159, 930–944. [Google Scholar] [CrossRef]
  21. Zheng, H.; Rowland, O.; Kunst, L. Disruptions of the Arabidopsis Enoyl-CoA reductase gene reveal an essential role for very-long-chain fatty acid synthesis in cell expansion during plant morphogenesis. Plant Cell 2005, 17, 1467–1481. [Google Scholar] [CrossRef]
  22. Trenkamp, S.; Martin, W.; Tietjen, K. Specific and differential inhibition of very-long-chain fatty acid elongases from Arabidopsis thaliana by different herbicides. Proc. Natl. Acad. Sci. USA 2004, 101, 11903–11908. [Google Scholar] [CrossRef]
  23. Pascal, S.; Bernard, A.; Sorel, M.; Pervent, M.; Vile, D.; Haslam, R.P.; Napier, J.A.; Lessire, R.; Domergue, F.; Joubès, J. The Arabidopsis cer26 mutant, like the cer2 mutant, is specifically affected in the very long chain fatty acid elongation process. Plant J. 2013, 73, 733–746. [Google Scholar] [CrossRef]
  24. Zhukov, A.; Popov, V. Synthesis of C20-38 Fatty Acids in Plant Tissues. Int. J. Mol. Sci. 2022, 23, 4731. [Google Scholar] [CrossRef]
  25. Cameron, K.D.; Teece, M.A.; Smart, L.B. Increased accumulation of cuticular wax and expression of lipid transfer protein in response to periodic drying events in leaves of tree tobacco. Plant Physiol. 2006, 140, 176–183. [Google Scholar] [CrossRef]
  26. Qi, C.; Jiang, H.; Zhao, X.; Mao, K.; Liu, H.; Li, Y.; Hao, Y. The Characterization, Authentication, and Gene Expression Pattern of the MdCER Family in Malus domestica. Hortic. Plant J. 2019, 5, 1–9. [Google Scholar] [CrossRef]
  27. Ahmad, H.M.; Wang, X.; Fiaz, S.; Nadeem, M.A.; Khan, S.A.; Ahmar, S.; Azeem, F.; Shaheen, T.; Mora-Poblete, F. Comprehensive genomics and expression analysis of eceriferum (CER) genes in sunflower (Helianthus annuus). Saudi J. Biol. Sci. 2021, 28, 6884–6896. [Google Scholar] [CrossRef]
  28. Li, N.; Li, X.; Song, Y.; Yang, S.; Li, L. Genome-wide identification, characterization, and expression profiling of the ECERIFERUM (CER) gene family in Ziziphus jujube. Russ. J. Plant Physiol. 2021, 68, 828–837. [Google Scholar] [CrossRef]
  29. Rizwan, H.M.; Waheed, A.; Ma, S.; Li, J.; Arshad, M.B.; Irshad, M.; Li, B.; Yang, X.; Ali, A.; Ahmed, M.A.A.; et al. Comprehensive Genome-Wide Identification and Expression Profiling of Eceriferum (CER) Gene Family in Passion Fruit (Passiflora edulis) Under Fusarium kyushuense and Drought Stress Conditions. Front. Plant Sci. 2022, 13, 898307. [Google Scholar] [CrossRef]
  30. Zhao, S.; Nie, X.; Liu, X.; Wang, B.; Liu, S.; Qin, L.; Xing, Y. Genome-wide identification of the CER Gene Family and significant features in Climate Adaptation of Castanea mollissima. Int. J. Mol. Sci. 2022, 23, 16202. [Google Scholar] [CrossRef]
  31. Pan, F.; Li, X.; Zhong, D.; Lu, X.; Pan, C.; Hu, J.; Su, W.; Zhang, H.; Zhang, C.; Shi, L.; et al. Eceriferum Genes in Tomato (Solanum lycopersicum): Genome-Wide Identification and Expression Analysis Reveal Their Potential Functions during Domestication. Horticulturae 2023, 9, 748. [Google Scholar] [CrossRef]
  32. Hamid, R.; Ghorbanzadeh, Z.; Jacob, F.; Nekouei, M.K.; Zeinalabedini, M.; Mardi, M.; Sadeghi, A.; Ghaffari, M.R. Decoding drought resilience: A comprehensive exploration of the cotton Eceriferum (CER) gene family and its role in stress adaptation. BMC Plant Biol. 2024, 24, 468. [Google Scholar] [CrossRef]
  33. Cao, W.; Sun, H.; Wang, C.; Yang, L.; Zhang, Y.; Zhuang, M.; Lv, H.; Wang, Y.; Liu, F.; Ji, J. Genome-wide identification of the ECERIFERUM (CER) gene family in cabbage and critical role of BoCER4.1 in wax biosynthesis. Plant Physiol. Biochem. 2025, 222, 109718. [Google Scholar] [CrossRef]
  34. Schreiber, L. Transport barriers made of cutin, suberin and associated waxes. Trends Plant Sci. 2010, 15, 546–553. [Google Scholar] [CrossRef] [PubMed]
  35. Chen, G.; Komatsuda, T.; Ma, J.F.; Li, C.; Yamaji, N.; Nevo, E. A functional cutin matrix is required for plant protection against water loss. Plant Signal. Behav. 2011, 6, 1297–1299. [Google Scholar] [CrossRef]
  36. Ahmad, H.M.; Azeem, F.; Shaheen, T.; Irshad, M.A. Genome-wide analysis of long chain Acyl-CoA synthetase (LACS) genes in sunflower (Helianthus annuus) suggests their role in drought stress. Int. J. Agric. Biol. 2020, 12, 6884–6896. [Google Scholar] [CrossRef]
  37. Duan, Y.; Jiang, Y.; Ye, S.; Karim, A.; Ling, Z.; He, Y.; Yang, S.; Luo, K. PtrWRKY73, a salicylic acid-inducible poplar WRKY transcription factor, is involved in disease resistance in Arabidopsis thaliana. Plant Cell Rep. 2015, 34, 831–841. [Google Scholar] [CrossRef]
  38. Zhang, K.; Wang, X.; Chen, S.; Liu, Y.; Zhang, L.; Yang, X.; Yu, H.; Cao, Y.; Zhang, L.; Cai, C.; et al. The gap-free genome of pepper reveals the transposable element-driven expansion and rapid evolution of Pericentromeres. Plant Commun. 2024, 6, 101177. [Google Scholar] [CrossRef]
  39. Rhee, S.Y.; Beavis, W.; Berardini, T.Z.; Chen, G.; Dixon, D.; Doyle, A.; Garcia-Hernandez, M.; Huala, E.; Lander, G.; Montoya, M. The Arabidopsis Information Resource (TAIR): A model organism database providing a centralized, curated gateway to Arabidopsis biology, research materials and community. Nucleic Acids Res. 2003, 31, 224–228. [Google Scholar] [CrossRef]
  40. Mistry, J.; Chuguransky, S.; Williams, L.; Qureshi, M.; Salazar, A.G.; Sonnhammer, E.L.L.; Tosatto, S.C.E.; Paladin, L.; Raj, S.; Richardson, L.J.; et al. Pfam: The protein families database in 2021. Nucleic Acids Res. 2020, 49, D412–D419. [Google Scholar] [CrossRef]
  41. Chen, C.; Chen, H.; Zhang, Y.; Thomas, H.R.; Frank, M.H.; He, Y.; Xia, R. TBtools: An Integrative Toolkit Developed for Interactive Analyses of Big Biological Data. Mol. Plant 2020, 13, 1194–1202. [Google Scholar] [CrossRef] [PubMed]
  42. Thompson, J.D.; Higgins, D.G.; Gibson, T.J. CLUSTAL W: Improving the sensitivity of progressive multiple sequence alignment through sequence weighting, position-specific gap penalties and weight matrix choice. Nucleic Acids Res. 1994, 22, 4673–4680. [Google Scholar] [CrossRef] [PubMed]
  43. Lee, J.; Yeom, S.I. Global co-expression network for key factor selection on environmental stress RNA-seq dataset in Capsicum annuum. Sci. Data 2023, 10, 692. [Google Scholar] [CrossRef]
  44. Kim, D.; Paggi, J.M.; Park, C.; Bennett, C.; Salzberg, S.L. Graph-based genome alignment and genotyping with HISAT2 and HISAT-genotype. Nat. Biotechnol. 2019, 37, 907–915. [Google Scholar] [CrossRef]
  45. Pertea, M.; Pertea, G.M.; Antonescu, C.M.; Chang, T.C.; Mendell, J.T.; Salzberg, S.L. StringTie enables improved reconstruction of a transcriptome from RNA-seq reads. Nat. Biotechnol. 2015, 33, 290–295. [Google Scholar] [CrossRef]
  46. Love, M.I.; Huber, W.; Anders, S. Moderated estimation of fold change and dispersion for RNA-seq data with DESeq2. Genome Biol. 2014, 15, 550. [Google Scholar] [CrossRef] [PubMed]
  47. Qin, C.; Yu, C.; Shen, Y.; Fang, X.; Chen, L.; Min, J.; Cheng, J.; Zhao, S.; Xu, M.; Luo, Y.; et al. Whole-genome sequencing of cultivated and wild peppers provides insights into Capsicum domestication and specialization. Proc. Natl. Acad. Sci. USA 2014, 111, 5135–5140. [Google Scholar] [CrossRef]
  48. Bernard, A.; Domergue, F.; Pascal, S.; Jetter, R.; Renne, C.; Faure, J.-D.; Haslam, R.P.; Napier, J.A.; Lessire, R.; Joubès, J. Reconstitution of plant alkane biosynthesis in yeast demonstrates that Arabidopsis ECERIFERUM1 and ECERIFERUM3 are core components of a very-long-chain alkane synthesis complex. Plant Cell 2012, 24, 3106–3118. [Google Scholar] [CrossRef] [PubMed]
  49. Fiebig, A.; Mayfield, J.A.; Miley, N.L.; Chau, S.; Fischer, R.L.; Preuss, D. Alterations in CER6, a gene identical to CUT1, differentially affect long-chain lipid content on the surface of pollen and stems. Plant Cell 2000, 12, 2001–2008. [Google Scholar] [CrossRef]
  50. Wang, W.; Zhang, Y.; Xu, C.; Ren, J.; Liu, X.; Black, K.; Gai, X.; Wang, Q.; Ren, H. Cucumber ECERIFERUM1 (CsCER1), which influences the cuticle properties and drought tolerance of cucumber, plays a key role in VLC alkanes biosynthesis. Plant Mol. Biol. 2015, 87, 219–233. [Google Scholar] [CrossRef]
  51. Xia, Y.; Nikolau, B.J.; Schnable, P.S. Cloning and characterization of CER2, an Arabidopsis gene that affects cuticular wax accumulation. Plant Cell 1996, 8, 1291–1304. [Google Scholar] [CrossRef] [PubMed]
  52. Xia, Y.; Nikolau, B.J.; Schnable, P.S. Developmental and Hormonal Regulation of the Arabidopsis CER2 Gene That Codes for a Nuclear-Localized Protein Required for the Normal Accumulation of Cuticular Waxes. Plant Physiol. 1997, 115, 925–937. [Google Scholar] [CrossRef] [PubMed]
Figure 1. Chromosomal distribution of CalCER genes in the pepper (Capsicum annuum) genome. Physical mapping of CalCER loci across all 12 chromosomes. Chromosomes are represented as yellow bars, with scale markers (red) indicating gene density. The Zunla-1_v3.0 reference genome assembly was used for positional annotation.
Horticulturae 11 00571 g001
Figure 2. Phylogenetic relationships of CER proteins across Arabidopsis thaliana, Solanum lycopersicum, and Capsicum annuum. Branches are color-coded by species: A. thaliana (AtCERs, pink), S. lycopersicum (SlCERs, brown), and C. annuum (CalCERs, cyan).
Horticulturae 11 00571 g002
Figure 3. Distribution of conserved motifs in CalCERs and the gene structures of CalCERs. Motif composition of CalCER proteins predicted using the MEME Suite (E-value < 0.05). Fifteen conserved motifs (motifs 1–15) are represented as color-coded boxes, with motif positions annotated relative to protein domains. Genes lacking motifs are denoted by blank tracks. Exon–intron structures of CalCER genes are annotated using the pepper reference genome. Yellow color indicates the CDS, green color shows the 5′ and 3′ untranslated regions, and black tracks indicate the introns.
Horticulturae 11 00571 g003
Figure 4. Cis-regulatory element analysis of CalCER promoters. (A) Phylogenetic tree (left) and cis-element distribution (right) across CalCER promoter regions (2000 bp upstream of transcription start sites). Elements are color-coded by functional category. (B) Quantitative distribution of cis-element categories. Detailed element annotations are provided in Table S3.
Horticulturae 11 00571 g004
Figure 5. Expression profiles of CalCER genes in different tissues and during different fruit development stages. Global perspective of expression levels during the different development stages in cv. Zunla-1. The data are normalized by reads per kilobase of exon model per million mapped reads (RPKM). The grey color indicates that no expression was detected.
Horticulturae 11 00571 g005
Figure 6. Expression profiles of differentially expressed CalCER genes under abiotic stress. The data are normalized by reads per kilobase of exon model per million mapped reads (RPKM). (A) Expression profiles of CalCERs under heat stress. (B) Expression profiles of CalCERs under osmosis stress. (C) Expression profiles of CalCERs under sallnity stress. (D) Expression profiles of CalCERs under cold stress.
Horticulturae 11 00571 g006
Figure 7. Expression profiles of differentially expressed CalCER genes under biotic stress. The data are normalized by reads per kilobase of exon model per million mapped reads (RPKM). (A) Expression profiles of CalCERs after inoculation for Xanthomonas campestris pv. vesicatoria race 1. (B) Expression profiles of CalCERs after inoculation for Xanthomonas campestris pv. vesicatoria race 3. (C) Expression profiles of CalCERs after inoculation for Xanthomonas axonopodis pv. glycines 8ra. (D) Expression profiles of CalCERs after inoculation for Phytophthora capsica.
Horticulturae 11 00571 g007
Figure 8. Expression profiles of differentially expressed CalCER genes under phytohormone treatment. The data are normalized by reads per kilobase of exon model per million mapped reads (RPKM). (A) Expression profiles of CalCERs under ABA treatment. (B) Expression profiles of CalCERs under ethylene treatment. (C) Expression profiles of CalCERs under salicylic acid treatment. (D) Expression profiles of CalCERs under MeJA treatment.
Horticulturae 11 00571 g008
Disclaimer/Publisher’s Note: The statements, opinions and data contained in all publications are solely those of the individual author(s) and contributor(s) and not of MDPI and/or the editor(s). MDPI and/or the editor(s) disclaim responsibility for any injury to people or property resulting from any ideas, methods, instructions or products referred to in the content.

