Article

Genome-Wide Analysis of the EIN3/EIL Transcription Factors in Osmanthus fragrans and Their Stress Response to Azacytidine (AZA) and Ethylene (ETH) Treatment

1
School of Pharmacy, Hubei University of Science and Technology, Xianning 437100, China
2
National Forestry and Grassland Administration Engineering Research Center for Osmanthus Fragrans, Hubei University of Science and Technology, Xianning 437100, China
3
Research Center for Osmanthus Fragrans, Xianning Research Academy of Industrial Technology of Osmanthus Fragrans, Xianning 437100, China
*
Authors to whom correspondence should be addressed.
Horticulturae 2025, 11(6), 572; https://doi.org/10.3390/horticulturae11060572
Submission received: 8 April 2025 / Revised: 2 May 2025 / Accepted: 16 May 2025 / Published: 23 May 2025

Abstract

:
Ethylene-insensitive 3/ethylene-insensitive 3-like (EIN3/EIL) transcription factors are central regulators of ethylene signaling and stress adaptation in plants. However, their roles in Osmanthus fragrans, a globally cherished ornamental and aromatic plant with significant economic value, remain poorly characterized. Here, we identified nine OfEIL genes across eight chromosomes in the O. fragrans “Liuye Jingui” genome. Conserved motif analysis revealed core domains (Motif1/2/4/7), and promoter cis-elements highlighting hormone-related, stress-related, and growth-related regulatory potential. During late flowering stages, six OfEILs (3/4/5/6/7/9) were significantly upregulated. Under 5-azacytidine (AZA, a DNA demethylation agent), OfEIL2 and OfEIL7 were downregulated, whereas the ETH treatment activated OfEIL3/7/8/9. Strikingly, OfEIL7 exhibited dual regulatory roles, correlating strongly with natural flowering progression, AZA-induced demethylation, and ETH responses. Functional divergence was observed in petal senescence, with OfEIL2–5 and OfEIL7–9 showing stage-specific and tissue-specific expression patterns. These results position OfEIL7 as a key hub integrating epigenetic and hormonal signals to modulate floral longevity and stress adaptation. Our study provides the first genome-wide characterization of the EIL family in O. fragrans, offering critical insights for molecular breeding aimed at enhancing ornamental traits and environmental resilience in this economically significant species.

1. Introduction

Ethylene-insensitive 3/EIN3-like (EIN3/EIL) transcription factors are a core transcription factor family in the ethylene signal transduction pathway. Their N-termini have a highly conserved amino acid sequence, including several important structural features, such as an acidic amino acid region, a proline-rich region, and five clusters of basic amino acids (BD I-V). The C-termini are relatively less conserved [1,2]. The EIN3/EIL transcription factors are widely present in various higher plants and are expressed in almost all detected parts, but they exhibit differences in expression patterns and levels [3]. Although EIN3/EIL is a relatively small gene family in the genomes of higher plants, with six, five, four, and six members in Arabidopsis thaliana, Nicotiana tabacum, Solanum lycopersicum, and Oryza sativa, respectively [4,5,6], it plays a crucial role in plant growth, development, and stress response [7].
Regarding stress resistance, EIN3/EIL1 enhances plant adaptation to environmental stresses through multiple mechanisms. Under salt stress, EIN3/EIL1 activates the expression of downstream target genes, like ESE1, to promote the synthesis of ROS-scavenging enzymes, significantly improving plant salt tolerance [8]. In drought resistance, EIN3/EIL1 regulates stomatal closure-related genes, reducing the stomatal aperture by up to 60% in ebf1-1 mutants, and markedly enhancing the water retention capacity [9]. Additionally, under cold stress, EIN3 negatively regulates freezing tolerance by suppressing the CBF pathway [10]. In disease resistance, EIN3/EIL1 participates in plant defense responses against pathogens by inhibiting SID2 gene expression to negatively regulate the salicylic acid signaling pathway [11]. In plant growth and development, EIN3/EIL1 demonstrates multifaceted regulatory functions. During seed germination, it inhibits DOG1 gene expression, increasing germination rates by over 40% in transgenic lines [12]. At the seedling stage, it collaborates with gibberellin signaling to regulate HLS1 expression, promoting apical hook formation and enhancing soil emergence efficiency [13]. In root development, it activates genes, such as RSL4, increasing root hair density by 35–50% in transgenic plants [14]. Notably, in leaf senescence, EIN3/EIL1 suppresses miR164 expression, releasing inhibition on senescence-related genes, such as ORE1, and accelerating senescence by 7–10 days in transgenic lines [15]. Furthermore, EIN3/EILs are also critical for flowering and senescence regulation. Suppressing multiple LeEILs in tomatoes prolongs the flower longevity [4]; while in carnations, an exogenous ethylene (ETH) treatment induces DcEIL3 accumulation in the petals, whereas the DcEIL1 transcripts decline during the natural petal senescence of cut flowers [16]. In the petunia, PhEIN2 delays flower senescence; while in the tree peony, Ps-EIN3-1 is constitutively expressed during natural flower senescence but suppressed by exogenous ethylene [17]. These studies not only reveal the central role of EIN3/EIL1 in plant life activities but provide important molecular targets for crop stress-resistance breeding and growth regulation. Currently, functional studies on the EIN3/EIL genes have primarily focused on annual plants, while relatively few have reported on their functions in perennial woody plants.
Ethylene, as a core signaling molecule in stress responses, directly influences plant stress tolerance through dynamic regulation of its biosynthesis and signaling pathways. For example, ethylene enhances oxidative stress tolerance by inducing the expression of antioxidant enzyme genes, or promotes salt ion efflux by regulating ion channel proteins. In A. thaliana salt stress responses, the ethylene transcription factors EINs directly effect the expression of the Na+ transporter gene SOS, thereby maintaining ion homeostasis [18]. As a key mode of epigenetic regulation, DNA methylation modulates the expression of critical genes in the ethylene pathway by modifying their promoter regions. Under salt stress, DNA hypomethylation activates the transcription of the ethylene synthase gene ACS6, promoting ethylene accumulation to enhance salt tolerance [19]. In drought stress, however, DRM2-mediated hypermethylation suppresses the expression of the ethylene receptor gene ETR1, inhibiting excessive ethylene signaling activation and maintaining stomatal opening balance [20]. These interactions between epigenetic modifications and ethylene signaling constitute an essential molecular network for regulating plant stress resistance.
O. fragrans, a renowned traditional woody flower in China, is widely used in landscaping, food, medicine, and skincare due to its intense fragrance, possessing significant ornamental and economic value [21]. Its short flowering period (less than one week), however, restricts its utilization and esthetic appeal [22]. Ethylene regulates multiple aspects of natural petal senescence in O. fragrans, including abscission, cellular structural changes, nucleic acid degradation, and redox homeostasis [23]. Previous studies have shown that DNA hypomethylation-mediated epigenetic modification influences senescence through ethylene biosynthesis and signaling pathways in O. fragrans, and the EIL transcription factor exhibits obvious expression during the senescence period. This indicates that EIL may be an important transcription factor in this process [24]. As key nuclear transcription factors in ethylene signal transduction, EIN3/EILs in O. fragrans remain poorly characterized. Using O. fragrans “Liuye Jingui” as our experimental material, this study systematically identifies the OfEIL family via bioinformatics approaches, analyzing their phylogeny, gene structure, and expression patterns during natural development and under treatments with 5-azacytidine (AZA) and ethylene (ETH). These investigations aim to provide guidance for the further exploration of the OfEIL candidate genes involved in regulating plant stress resistance and growth development in O. fragrans.

2. Materials and Methods

2.1. Plant Material and Related Treatment Methods

Samples of O. fragrans “Liuye Jingui” (a widely cultivated cultivar in China) were obtained from the nursery at Huazhong Agricultural University campus (Wuhan, China) (30°29′ N, 114°21′ W). Flowers at six flowering stages (S1, bud stage; S2, initial flowering stage; S3, early full flowering stage; S4, full flowering stage; S5, late full flowering stage; S6, abscission stage), as described in the previous studies [25], were collected for the gene expression pattern analysis of flowering development.
The 5′-azacytidine (AZA, CAS: 320-67-2; purity ≥ 98%) was purchased from Coolaber (Beijing Coolaber Science & Technology Co., Ltd., Beijing, China), and ethephon (CAS: 16672-87-0; purity ≥ 95%) was purchased from Solarbio (Beijing Solarbio Science & Technology Co., Ltd., Beijing, China). In order to analyze gene expression patterns in response to stress, we selected isolated shoots bearing S1-stage flowers and treated them with 10 mM of AZA (an effective DNA demethylation concentration) and 50 mg·L−1 of ethephon (a common ethylene releaser concentration) based on previous experimental results and the literature reports [24]. As a control, cut flowers were placed in individual dishes containing distilled water. After 24 h, all samples were transferred to distilled water and kept at 25 °C under a 12 h photoperiod with cool white fluorescent lighting at an intensity of 10 mol m−2 s−1. Samples of flowers at the six flowering stages and treated flowers collected after 1 day (1 d) and 2 days (2 d) were stored at −80 °C for further analyses. All treatments were triplicate biological replicates.
To determine the optimal sampling timepoints, triplicate control groups (untreated cut branches in vases) were monitored: Petals reached stage S6 (abscission stage, characterized by water loss and partial abscission) by day 3 (d3), at which time active substance degradation rendered them unsuitable for analysis. Consequently, RNA-seq and subsequent analyses focused on d1 (early-to-mid flowering, corresponding to S2–S3 post-cut) and d2 (mid-to-late flowering, initiating petal senescence, equivalent to S4–S5). Freshly harvested S1-stage buds (tightly closed and unopened) were used as the initial material, with d1/d2 defined as 24/48 h post-cut insertion into treatment containers (disk insertion). This design enabled the characterization of OfEIL expression under the senescence-inhibiting (AZA) and the senescence-promoting (ETH) treatments at critical transitional stages.

2.2. Identification and Synteny Analysis of the O. fragrans OfEIL Gene Family

Based on the genome of O. fragrans “Liuye Jingui” obtained by our research group [25], nine OfEIL gene members and their protein sequences were identified. Because EIN3/EILs have a specific domain—EIN3 (accession number: PF04873)—the SMART database (https://smart.embl.de/, accessed on 18 January 2025) was used to align and screen for genes with complete and specific domains [26]. The chromosome FASTA files and gene annotation gff3 files of O. fragrans “Liuye Jingui” and A. thaliana (TAIR10) were downloaded from NCBI. The One-Step MCScanX-Super Fast function in TBtools (v2.154) [27] (based on the MCScanX algorithm [28]) was used to analyze the syntenic relationships of the EIN3/EIL gene family members between O. fragrans and A. thaliana.

2.3. Physicochemical Information, Gene Family Structure, and Conserved Motif Analysis of OfEILs

The ProtParam online tool in the Expasy database (https://web.expasy.org/protparam/, accessed on 17 January 2025) was used to analyze basic encoded amino acid information, including the number of amino acids, isoelectric point, amino acid size, molecular weight, and instability index. The MEME (http://meme-suite.org/, accessed on 17 January 2025) was used to predict the conserved motifs in OfEILs, with the number of motifs set to 20. The gene structure and motifs were visualized using TBtools [27] based on the gff annotation files. The PlantCARE website (http://bioinformatics.psb.ugent.be/webtools/plantcare/html/, accessed on 17 January 2025) was used to analyze the distribution of cis-acting elements in the 2 kb upstream region of the start codon of the EIN3/EIL transcription factor family in O. fragrans.

2.4. Phylogenetic Tree and Ka/Ks Analysis

The multiple sequence alignment of O. fragrans (OfEIL) and A. thaliana (AtEIL) protein sequences was performed using MUSCLE v3.8.1551 [29]. The neighbor-joining (NJ) phylogenetic tree was constructed based on these aligned sequences, with bootstrap values set to 1000 replicates to assess branch confidence. In addition, the maximum likelihood (ML) method was used to construct an auxiliary tree using the same combined dataset, verifying the reliability of the clustering results across both species. The Ka/Ks Calculator in TBtools [27] was used to calculate the selection pressure of OfEIL gene pairs in O. fragrans.

2.5. Expression Analysis of OfEILs at Different Flowering Stages and Under Demethylation and ETH Treatments

The transcriptome sequencing data of O. fragrans at different flowering stages (PRJNA679852) were downloaded from the NCBI database. Gene expression levels were calculated using the FPKM (fragments per kilobase of transcript per million mapped reads) value and visualized using TBtools [27]. The RNA-seq data of hormone-treated O. fragrans petals were obtained from our research group.
Petals from different flowering stages (S1–S6) and those treated with AZA, ETH, and CK for 1 and 2 days were collected. RNA was extracted using the HiPure Universal RNA Kit (Magen Bio, Guangzhou Magen Biotechnology Co., Ltd., Guangzhou, China) according to the manufacturer’s instructions. The RNA was reverse-transcribed into cDNA using the StarScript II RT Kit (GenStar, Beijing GenStar Biotechnology Co., Ltd., Beijing, China) after confirming that the RNA was undegraded by agarose gel electrophoresis. The cDNA was stored in a −80 °C freezer and thawed on ice and diluted tenfold when needed.
The concentration of the reverse-transcribed cDNA was adjusted to a consistent level through semi-quantitative experiments. A PCR (LongGene. (n.d.). A300 Fast Thermal Cycler. Hangzhou, China) test was performed using the Actin gene as a reference gene, with the following reaction system: 5.0 µL of Taq Super Mix, 0.5 µL of each primer, 2.0 µL of cDNA, and 2 µL of ddH2O. The PCR program was as follows: 94 °C for 5 min; 25 cycles of 94 °C for 10 s, 60 °C for 30 s, and 72 °C for 15 s. This was followed by 72 °C for 10 min and 4 °C indefinitely. For OfEIL genes with FPKMmax > 1, primers for quantitative PCR were designed using Primer Premier 5 Software (Premier Biosoft International, Palo Alto, CA, USA) with NCBI BLAST (https://blast.ncbi.nlm.nih.gov/Blast.cgi, accessed on 16 January 2025) validation for specificity, ensuring a product length of 100–200 bp and an annealing temperature of 60 ± 2 °C [30]. Referring to Zhang et al. [31], OfACT was reported as the best reference gene for different flower development stages; thus, OfACT was selected as the internal reference gene.All primers were synthesized by Tsingke Biological Technology Co., Ltd. (Beijing, China). Primer information is shown in Table 1.
Real-time fluorescent quantitative PCR (RT-qPCR) was performed using the SYBR dye method with a 2× RealStar Fast premix on an automated medical PCR system (Xian Tianlong Science and Technology. (n.d.). Gentier 96 Real-time PCR System. Xi’an, China). The RT-qPCR reaction system consisted of 5.0 µL of 2× RealStar Fast SYBR qPCR Mix (GenStar, Beijing GenStar Biotechnology Co., Ltd., Beijing, China), 0.2 µL of each primer, 2.0 µL of cDNA, and 2.6 µL of ddH2O. The RT-qPCR reaction program was as follows: 94 °C for 30 s, followed by 40 cycles of 94 °C for 10 s, 60 °C for 30 s, and 72 °C for 10 s. The Actin gene was used as an internal reference. For treated samples, CK (distilled water) was used as the control within each group; while for natural flowering stages, data from the S1 stage were used as the control within each group. The relative expression levels of genes were calculated using the 2−ΔΔCT method [32]. Each gene in each tissue was analyzed in triplicate.

2.6. Statistical Analysis

Each treatment in the experiment was performed in triplicate (three biological replicates). Experimental data were organized using Excel 2010, and the results are presented as the mean ± standard error. All heatmaps in this study were created using the OmicShare bioinformatics learning platform (www.omicshare.com/tools, accessed on 17 January 2025) [33]. All data were subjected to analysis of variance (ANOVA) and multiple comparison analysis using SPSS Statistics V30.0. Duncan’s multiple range test was performed at the 0.05 significance level.

3. Results

3.1. Identification and Synteny Analysis of O. fragrans OfEIL Genes

Through the conserved domain annotation analysis using the PF04873 domain from the pfam database, a total of nine OfEIL gene family members were identified in the O. fragrans genome (Figure 1A). These nine OfEIL genes are distributed across eight chromosomes. Chromosome 21 harbors the most OfEIL genes, with two members (OfEIL7 and OfEIL8). The other seven chromosomes each contain one OfEIL gene: OfEIL1 on Chr1; OfEIL2 on Chr3; OfEIL3 on Chr5; OfEIL4 on Chr9; OfEIL5 on Chr10; OfEIL6 on Chr15; and OfEIL9 on Chr23. This distribution indicates that OfEIL is widely dispersed across the eight chromosomes.
The results of the intragenomic synteny analysis (Figure 1A) revealed that chromosomal duplication events occurred on six chromosomes in O. fragrans. Chromosome 21 had the most duplication pairs, with four pairs, while chromosomes 3, 10, and 23 each had two pairs, and chromosome 15 had one pair. A total of five synteny pairs were identified among the OfEIL genes: OfEIL4 and OfEIL6; OfEIL7 and OfEIL2/OfEIL5/OfEIL9; and OfEIL9 and OfEIL5.
Interspecies synteny analyses between the EIN3/EIL gene families of O. fragrans and A. thaliana identified five synteny pairs (Figure 1B): AtEIL2 and OfEIL7; AtEIL2 and OfEIL9; AtEIL4 and OfEIL1; AtEIL1 and OfEIL2; and AtEIN3 and OfEIL3. Chromosome 5 of A. thaliana had the most interspecies gene duplication pairs, with three pairs, while two other A. thaliana chromosomes each had one synteny pair.

3.2. Physicochemical Properties of OfEILs in O. fragrans, Gene Family Structure, and Conserved Motif Analysis

Analyses of the amino acid sequences of nine OfEILs using ProtParam revealed distinct physicochemical properties (Table 2). The protein encoded by OfEIL9 stood out with the fewest total atoms (1/2 to 1/3 of the other family members), the highest isoelectric point (8.64), and the lowest average hydrophilicity (−0.904). Excluding OfEIL9, the remaining proteins shared similar properties—total atoms (8000–11,000), molecular mass (57–78 kDa), isoelectric point (5.02–5.88), average hydrophilicity (−0.83 to −0.6), and instability index (48–60)—with all predicted as unstable hydrophilic proteins consistent with nuclear localization (Table 2).
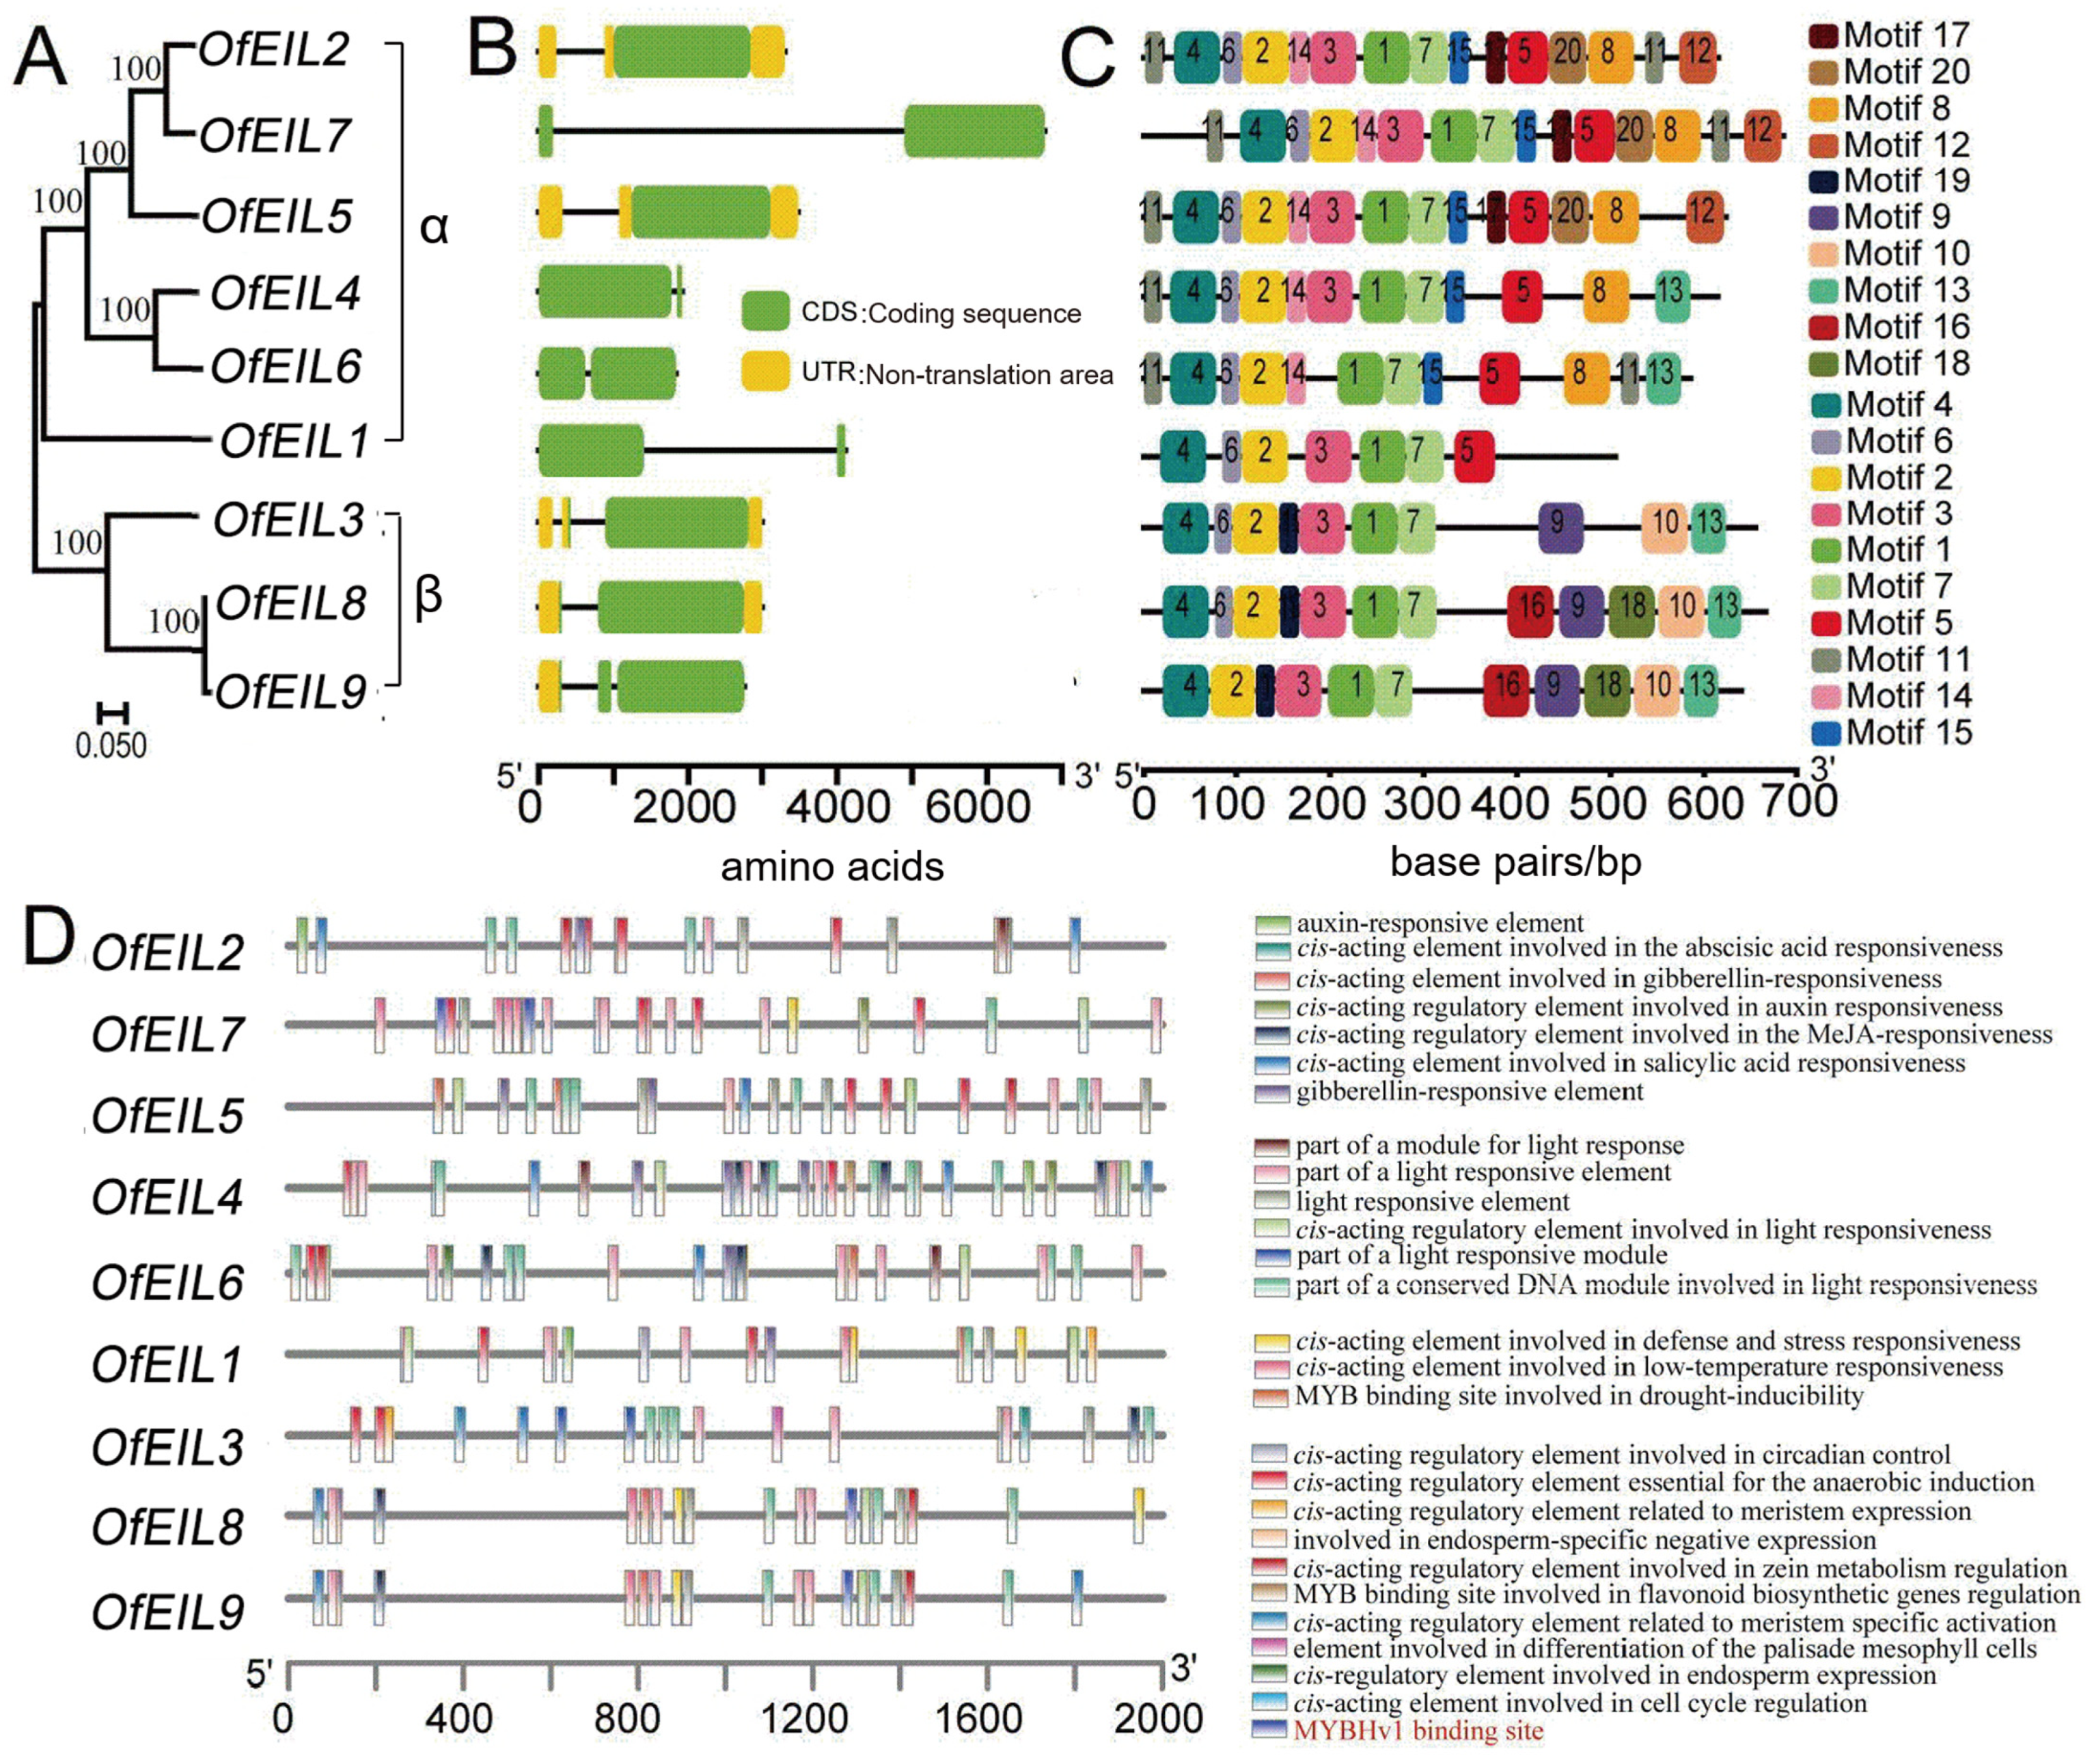
A phylogenetic analysis of OfEILs (Figure 2A) classified them into two subclades: Subclade α, comprising OfEIL1–2 and 4–7 and characterized by 1–2 coding sequence (CDS) regions and 7–15 conserved motifs, including Motif 5 (Figure 2B,C); Subclade β, including OfEIL3 and 8–9 and containing 2–3 CDS regions and 10–12 motifs, such as Motifs 9, 13, and 19 (Figure 2B,C). All OfEILs harbored four core conserved motifs (Motif 1, 2, 4, and 7), forming the canonical EIN3/EIL functional domain (Figure 2C). Subclade-specific motifs suggested functional divergence: Subclade α members (e.g., OfEIL1–2) likely engage in early developmental regulation, while Subclade β members (e.g., OfEIL3, 8–9) may specialize in stress or hormone responses. Cis-acting element analysis (Figure 2D) revealed diverse regulatory potentials. One such potential includes light and hormone responses. All OfEILs contained light-responsive elements (3–6 per gene, except OfEIL2 with 1) and zein metabolism regulators. Gibberellin-responsive elements were absent in OfEIL3 and OfEIL7, aligning with their roles in ethylene-mediated senescence. Another potential is related to stress and development: Defense/stress-responsive elements were enriched in OfEIL1, 7, 8, and 9, while meristem-specific activation elements occurred in all except OfEIL1 and OfEIL7. Notable exclusions included MeJA-responsive elements (absent in OfEIL1, 2, 5, and 7) and flavonoid biosynthesis-related MYB sites (unique to OfEIL4). A third potential relates to epigenetic and signaling hubs: OfEIL7, 8, and 9 uniquely harbored MYBHv1 binding sites (linked to histone demethylation), while OfEIL4 and OfEIL7 contained auxin-response elements, and OfEIL5 and 6 carried drought-inducible MYB sites, indicating specialized stress adaptation roles. These findings highlight structural conservation (core motifs) and functional diversification (subclade-specific elements) among OfEILs, providing a molecular basis for their roles in hormone signaling, stress response, and growth regulation. The identified cis-elements offer epigenetic targets for functional validation in A. thaliana overexpression studies, bridging the genotype to the phenotype in O. fragrans. Analyses of the amino acid sequences of nine OfEILs using ProtParam revealed distinct physicochemical properties (Table 2). The protein encoded by OfEIL9 stood out with the fewest total atoms (1/2 to 1/3 of other family members), the highest isoelectric point (8.64), and the lowest average hydrophilicity (−0.904). Excluding OfEIL9, the remaining proteins shared similar properties: total atoms (8000–11,000), molecular mass (57–78 kDa), isoelectric point (5.02–5.88), average hydrophilicity (−0.83 to −0.6), and instability index (48–60). All were predicted as unstable hydrophilic proteins consistent with nuclear localization (Table 2).
A phylogenetic analysis of OfEILs (Figure 2A) classified them into two subclades. Subclade α comprises OfEIL1–2 and 4–7, and it is characterized by 1–2 coding sequence (CDS) regions and 7–15 conserved motifs, including Motif 5 (Figure 2B,C). Subclade β includes OfEIL3 and 8–9, and it contains 2–3 CDS regions and 10–12 motifs, such as Motifs 9, 13, and 19 (Figure 2B,C). All OfEILs harbored four core conserved motifs (Motif 1, 2, 4, and 7), forming the canonical EIN3/EIL functional domain (Figure 2C). Subclade-specific motifs suggested functional divergence: Subclade α members (e.g., OfEIL1–2) likely engage in early developmental regulation, while Subclade β members (e.g., OfEIL3, 8–9) may specialize in stress or hormone responses.
A cis-acting element analysis (Figure 2D) revealed diverse regulatory potentials, including light and hormone response, stress and development, and epigenetic and signaling hubs, as detailed below.
Light and hormone responses: All OfEILs contained light-responsive elements (3–6 per gene, except OfEIL2 with 1) and zein metabolism regulators. Notably, previous studies have demonstrated that the ethylene-responsive elements (EREs) are closely associated with ethylene signaling. For example, Li et al. [34] found that EREs can bind to ethylene-responsive transcription factors, mediating gene responses to ethylene signals. Gibberellin-responsive elements were absent in OfEIL3 and OfEIL7, aligning with their roles in ethylene-mediated senescence.
Stress and development: Defense/stress-responsive elements were enriched in OfEIL1, 7, 8, and 9, while meristem-specific activation elements occurred in all except OfEIL1 and OfEIL7. Notable exclusions included MeJA-responsive elements (absent in OfEIL1, 2, 5, and 7) and flavonoid biosynthesis-related MYB sites (unique to OfEIL4).
Epigenetic and signaling hubs: OfEIL7, 8, and 9 uniquely harbored MYBHv1 binding sites (linked to histone demethylation), while OfEIL4 and OfEIL7 contained auxin-response elements, and OfEIL5 and 6 carried drought-inducible MYB sites, indicating specialized stress adaptation roles.
These findings highlight structural conservation (core motifs) and functional diversification (subclade-specific elements) among OfEILs, providing a molecular basis for their roles in hormone signaling, stress response, and growth regulation. The identified cis-elements offer epigenetic targets for functional validation in A. thaliana overexpression studies, bridging the genotype to phenotype in O. fragrans.

3.3. Phylogenetic and Selection Pressure Analysis of EIN3/EILs in O. fragrans and A. thaliana

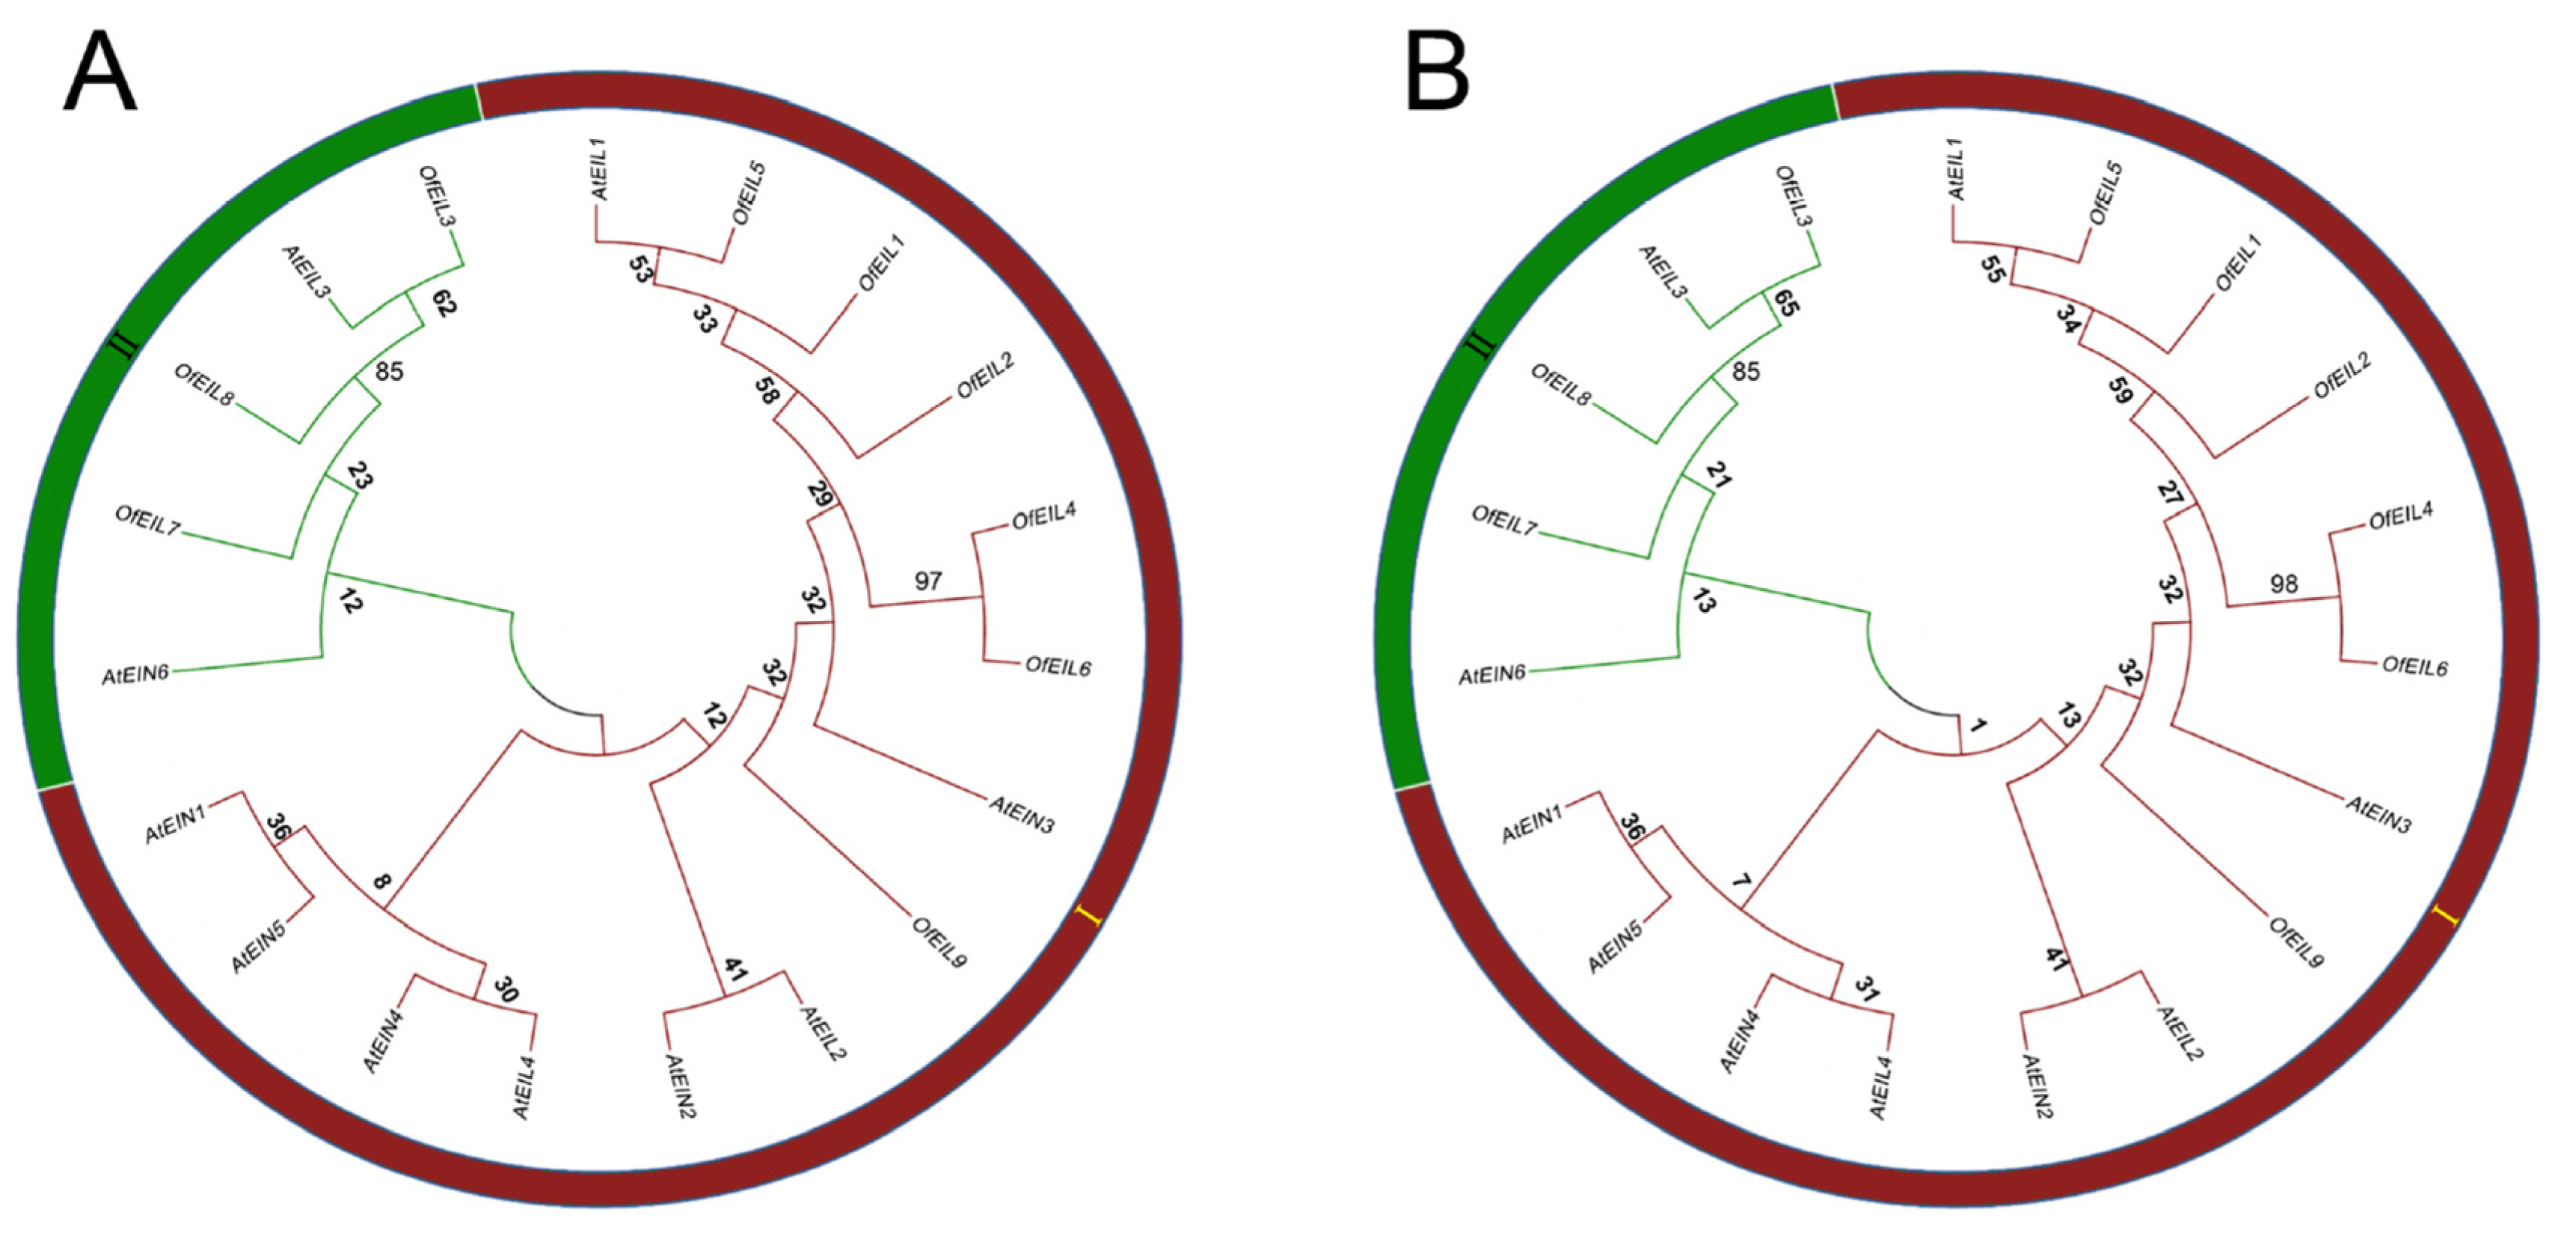
As depicted in Figure 3, a comparative co-clustering analysis of the EIN3/EIL gene families in O. fragrans and A. thaliana reveals that the evolutionary branching pattern of O. fragrans EIN3/EILs is consistent with that of A. thaliana. To ensure the reliability of phylogenetic relationships, both ML and NJ methods were utilized. Notably, the phylogenetic trees generated by ML and NJ exhibited striking consistencies with respect to branching topologies and cluster distributions (as shown in Figure 3A,B). This high degree of congruence between these two distinct computational approaches strongly corroborates the stability and authenticity of the inferred evolutionary relationships. It indicates that the observed phylogenetic patterns are not artifacts of a specific method, but rather robust reflections of the true evolutionary history among the sequences analyzed, thereby enhancing confidence in the phylogenetic conclusions drawn. Clade I (OfEIL1, 2, 4, 5, 6, and 9) and Clade II (OfEIL3, 7, and 8) in O. fragrans exhibit conserved clustering characteristics with respect to the corresponding branches in A. thaliana. Specifically, OfEIL3 and 8 in Clade II were clustered most closely with AtEIL3 (bootstrap support of 85), indicating high sequence homology levels; OfEIL1, 2, and 5 in Clade I were clustered most closely with AtEIL1; OfEIL7 in Clade II was clustered most closely with AtEIN6; OfEIL4, 6, and 9 in Clade I were clustered most closely with AtEIN3 (bootstrap support of 97 for OfEIL4/6 clustering with AtEIN3-related branches). This consistency in branching pattern, combined with specific homology values (bootstrap supports), indicates that the evolutionary divergence mode of the EIN3/EIL gene families in both species is comparable. Such sequence-level homology provides a basis for suggesting that their functional divergence during evolution may follow a similar structural logic. Therefore, when conducting overexpression validation in A. thaliana in subsequent studies, the functions of the corresponding A. thaliana genes can indeed serve as valuable references based on the evolutionary conservation of their branching, and their sequence homology implies potential functional similarities.
Based on the Ka/Ks analysis of the collinear gene pairs of OfEILs in O. fragrans, the values of synonymous codon substitutions (Ks) are greater than those of nonsynonymous codon substitutions (Ka), and the Ka/Ks ratios are all less than 1, indicating that the genes are subject to purifying selections (Table 3).

3.4. Expression Profiles and Real-Time Quantitative Fluorescence Analysis of O. fragrans During Natural Flowering Development

Based on the RNA-seq data from petals of O. fragrans at six representative flowering and senescence stages (S5 and S6), an expression profile analysis was conducted. As shown in Figure 4, eight genes were found to be expressed (FPKMmax > 1), including OfEIL2–9. Compared with the early stages (S1 to S4), the OfEIL2, OfEIL6, and OfEIL9 genes of the ethylene-insensitive 3 (EIL) family in Olea europaea exhibited significantly higher expression levels at stage S6 (a defined senescence-associated stage). By contrast, OfEIL3 to OfEIL5 and OfEIL7 exhibited upregulated expression as early as stage S5 (Figure 4). On the contrary, the expression levels of OfEIL1 and OfEIL8 during the early developmental stages (S1 to S4) were higher than those during the senescence stages (S5 and S6). Based on these stage-specific expression profiles, which highlighted the genes that were induced during senescence, we selected OfEIL2 to OfEIL7 and OfEIL9 for quantitative fluorescence analysis to validate their expression dynamics at the transcriptional level.
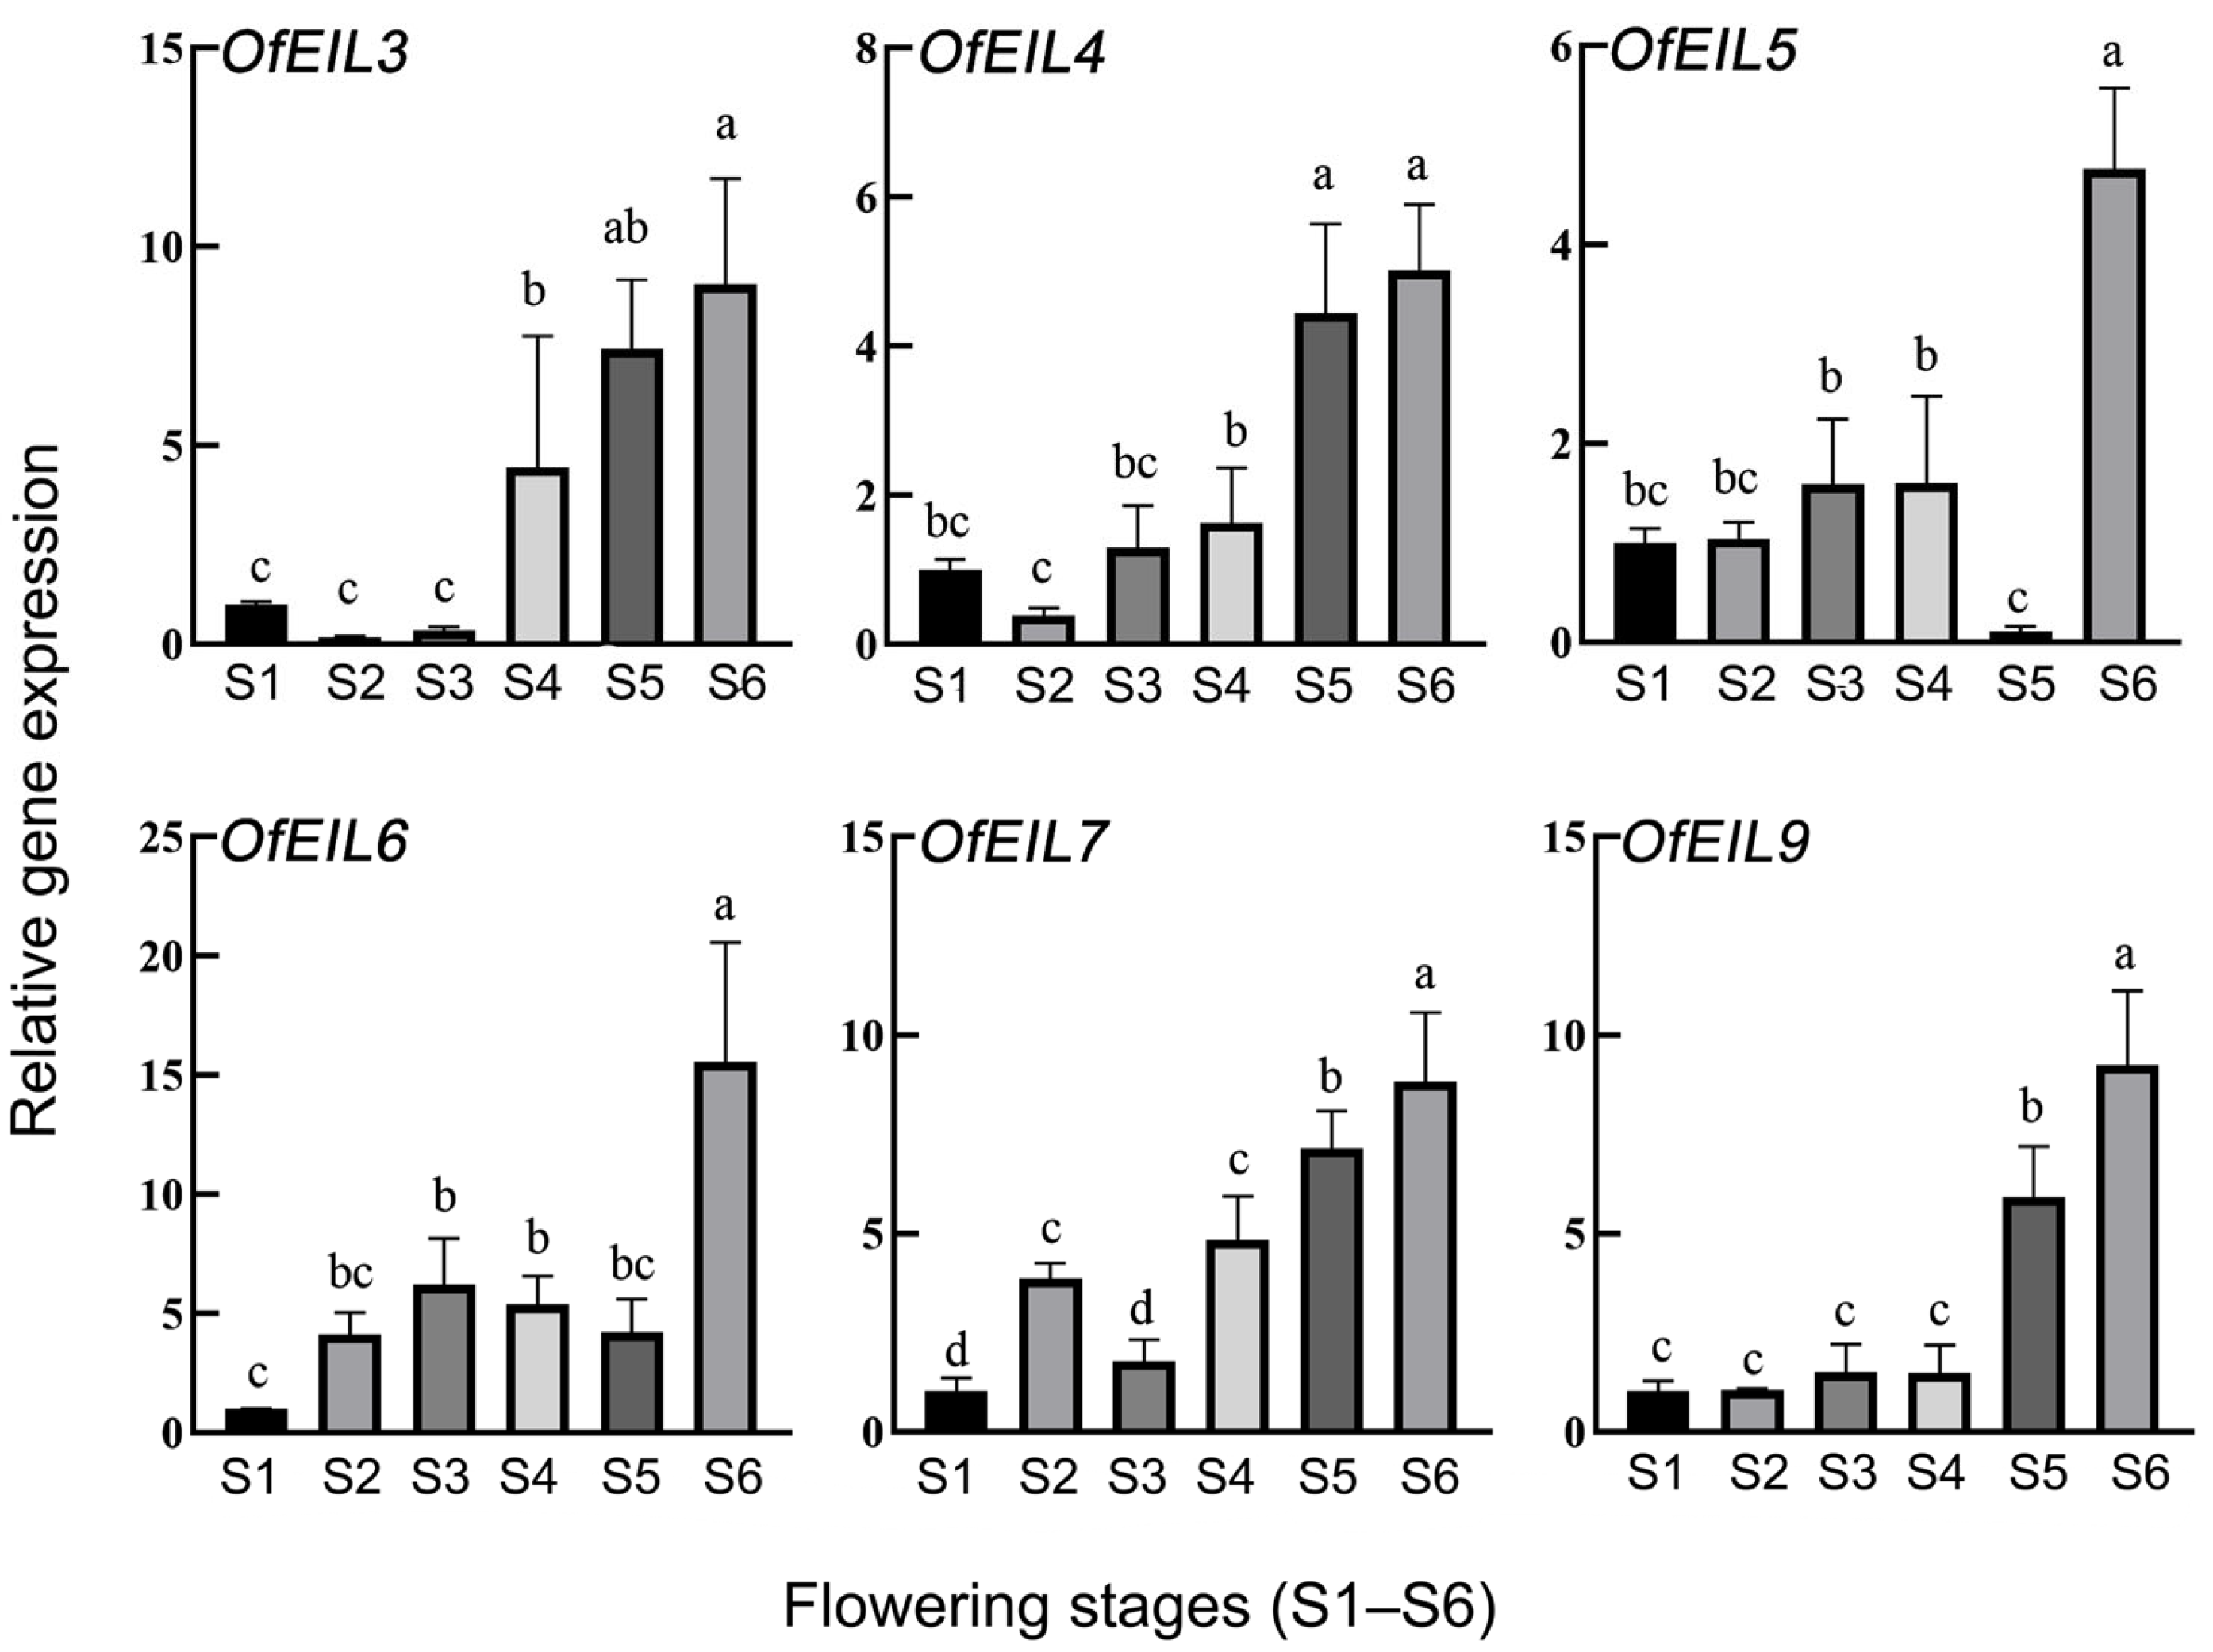
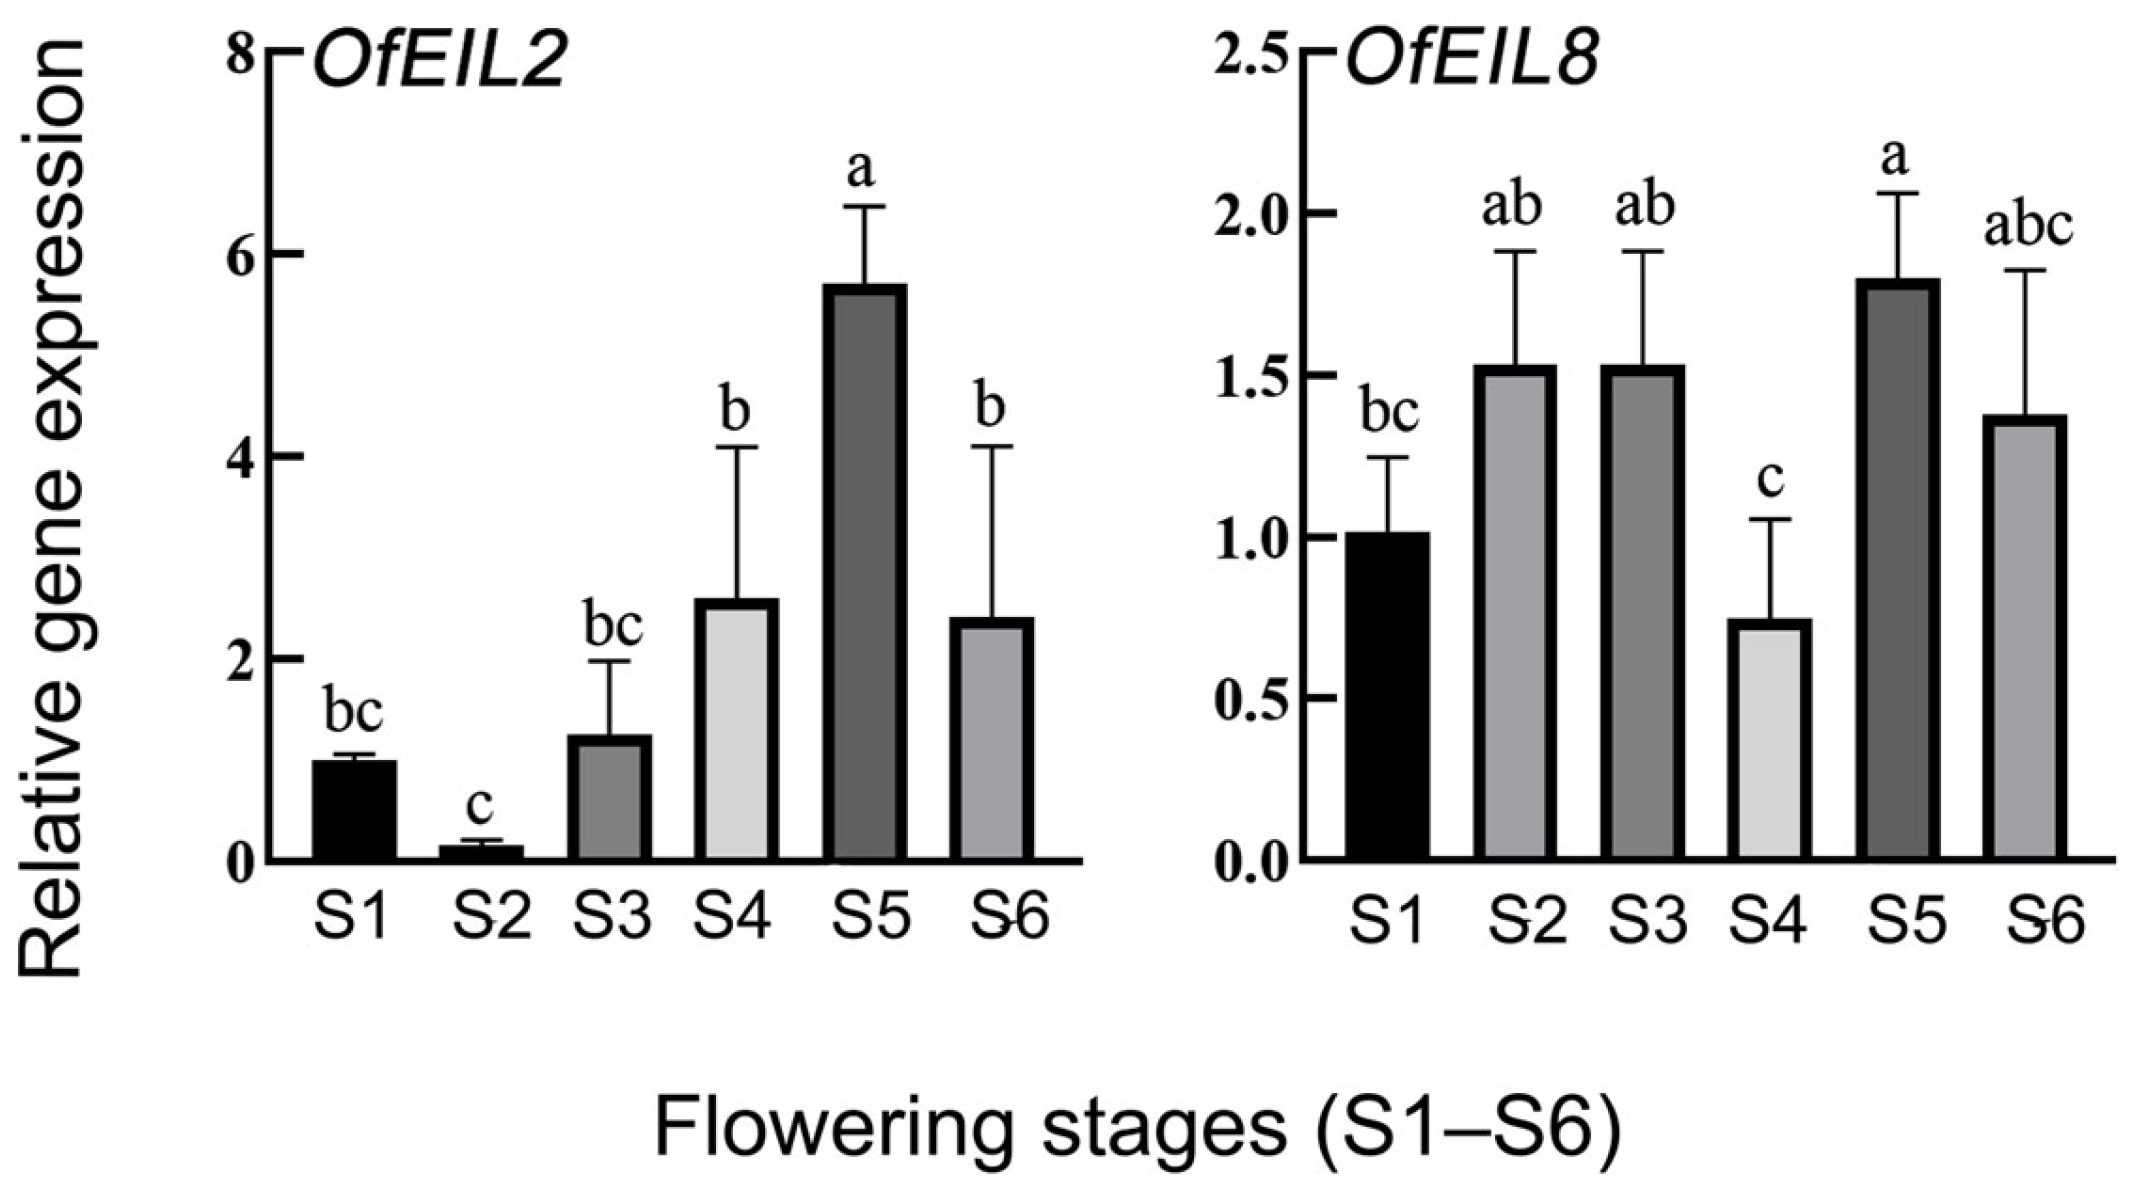
The expression levels of the eight genes, OfEIL2–9, in the petals of O. fragrans during the six stages (S1–S6) of natural senescence were analyzed via RT-qPCR. Six candidate OfEIL genes in O. fragrans were screened, and they exhibited significant upregulation (p < 0.05) during the senescence stages (S5 and S6), as shown in Figure 5. These genes are OfEIL3, 4, 5, 6, 7, and OfEIL9. Another gene, OfEIL2, which did not show significant upregulation during the flowering and senescence stages, is shown in Figure 6.
Among them, the relative expression levels of OfEIL4 and OfEIL9 were more than twice as high as those in the early and middle flowering stages throughout the entire senescence period. OfEIL3 exhibited low early-stage expression (relative expression level ≤1), followed by a 15-fold change during full bloom, a 1.6-fold change at late full bloom, and a sustained increase until abscission. The relative expression pattern of OfEIL7 is similar to that of OfEIL3, but the difference in relative expression levels between the middle and late stages and the early stage of OfEIL7 is smaller. In stage S2, its expression level is only slightly lower than that in stage S4 and approximately twice as high as that in stage S3. This significant differential expression pattern strongly suggests that it plays a crucial role in promoting the initial stage of the flower opening. After the flowers open, the relative expression level decreases to half, and then steadily increases from the full bloom stage to the abscission stage. The relative expression patterns of OfEIL5 and 6 are similar, with low relative expression in the early stages and 2–3 times higher relative expression during the abscission stage, promoting flower abscission. The relative expression level of OfEIL5 is very low at the end of full bloom, and it is speculated that it may have a significant inhibitory effect at stage S5.
The expression patterns of OfEIL2 and OfEIL8 are shown in Figure 6. For OfEIL2, no significant upregulation was observed during the senescence stages (S5 and S6) (p > 0.05). A significant upward trend was observed from S2 to S5. Expression levels were reduced back to S4 levels at the S6 stage. For OfEIL8, no significant differences in relative expression levels were observed across the developmental stages. Moreover, no notable fluctuations in relative expression were observed during senescence.

3.5. Expression Profiles and Real-Time Quantitative Fluorescence Analysis of O. fragrans Under Aza and ETH Treatments

3.5.1. Expression Profile and Fluorescence Quantitative Expression Analysis of Disk-Inserted O. fragrans After Demethylation Treatment

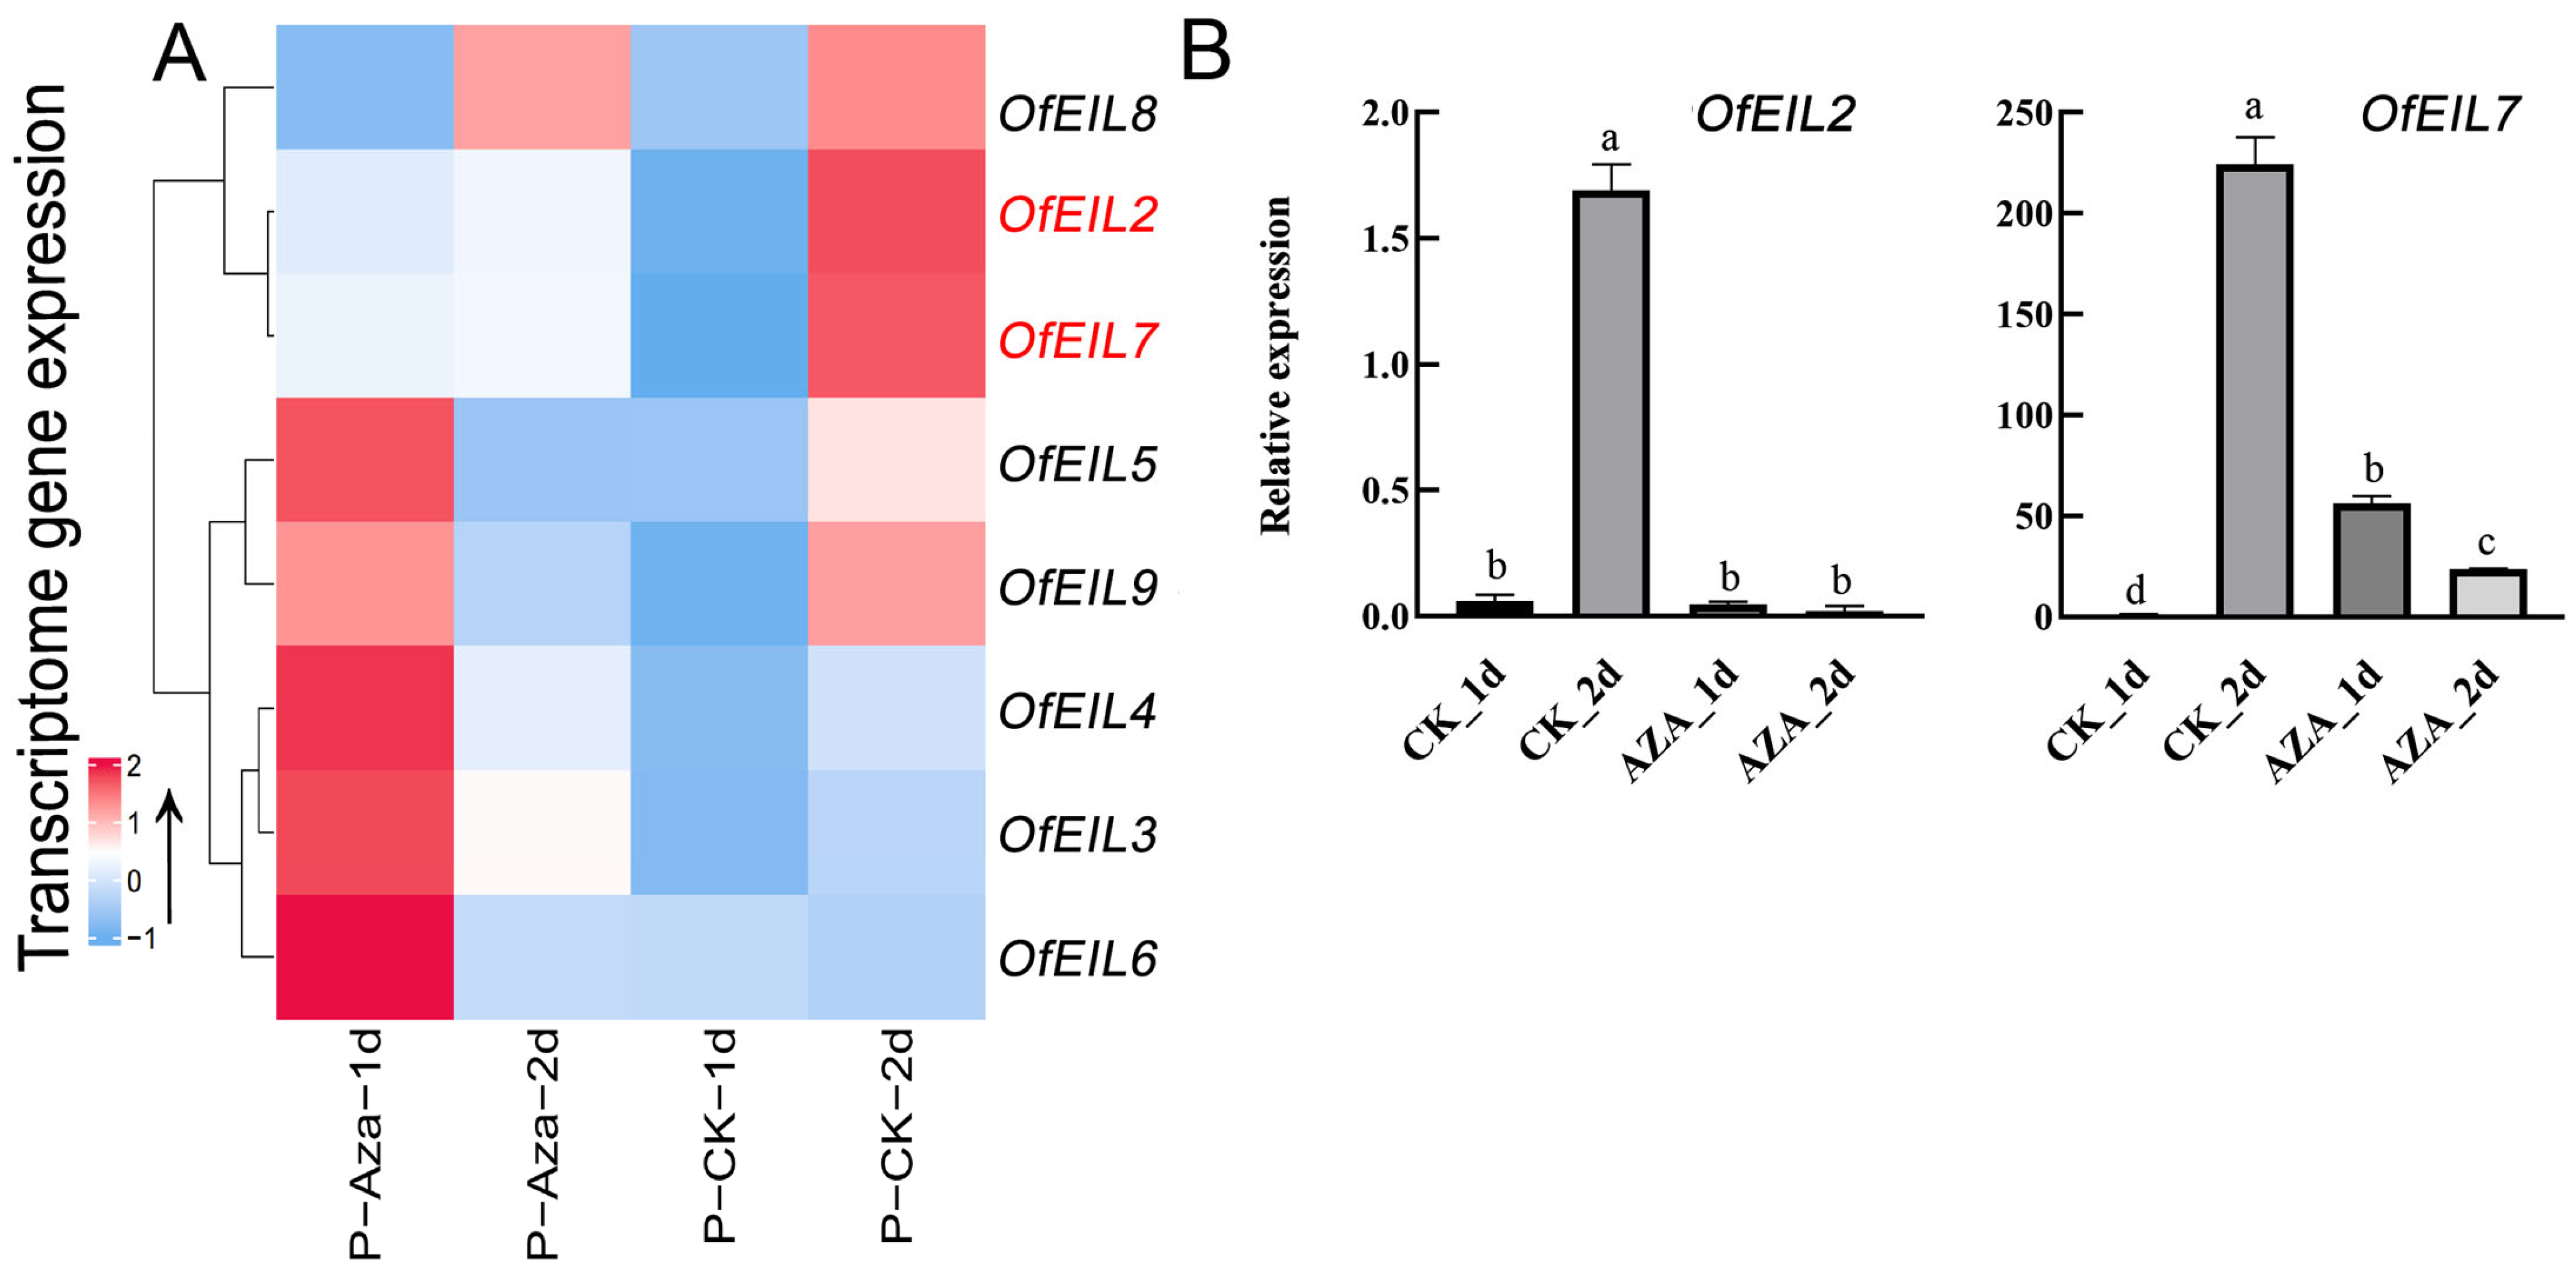
Based on the RNA-seq data of O. fragrans petals treated with demethylation (AZA) and the blank control group (CK), a relative expression profile analysis was conducted. It was observed that the relative expression of OfEIL2 and OfEIL7 was significantly inhibited under the demethylation treatment (Figure 7A), suggesting that OfEIL2 and OfEIL7 may play important regulatory roles in the senescence process of O. fragrans. The relative expression levels of OfEIL3, 4, 5, 6, and OfEIL9 were significantly higher than those of the blank control group (CK) on the first day of the AZA treatment (1d). Although the relative expression levels of the OfEILs decreased on the second day of the AZA treatment, the excessive abnormal relative expression on the first day cannot be explained. OfEIL8 did not exhibit a significant difference compared to the blank treatment. In summary, OfEIL2 and OfEIL7 were selected for fluorescence quantitative experiments in the AZA treatment group.
According to the results of fluorescence quantitative analysis, the highest relative expression levels of CK-OfEIL were compared with those of AZA-OfEIL, as shown in Figure 7B. The AZA treatment significantly repressed OfEIL2 and OfEIL7 expression, inducing a >3-fold decrease in relative expression compared to the control. Specifically, the relative expression of OfEIL2 was inhibited by about 20 times after 1 day of the AZA treatment and by about 3 times after 2 days of the treatment. The relative expression of OfEIL7 exhibited a decreasing trend after the AZA treatment, with the highest relative expression level (CK_2d) being reduced to below one-third of the original level after 2 days of the AZA treatment (AZA_2d).

3.5.2. Expression Profile and Fluorescence Quantitative Expression Analysis of Disk-Inserted O. fragrans After Ethephon Treatment

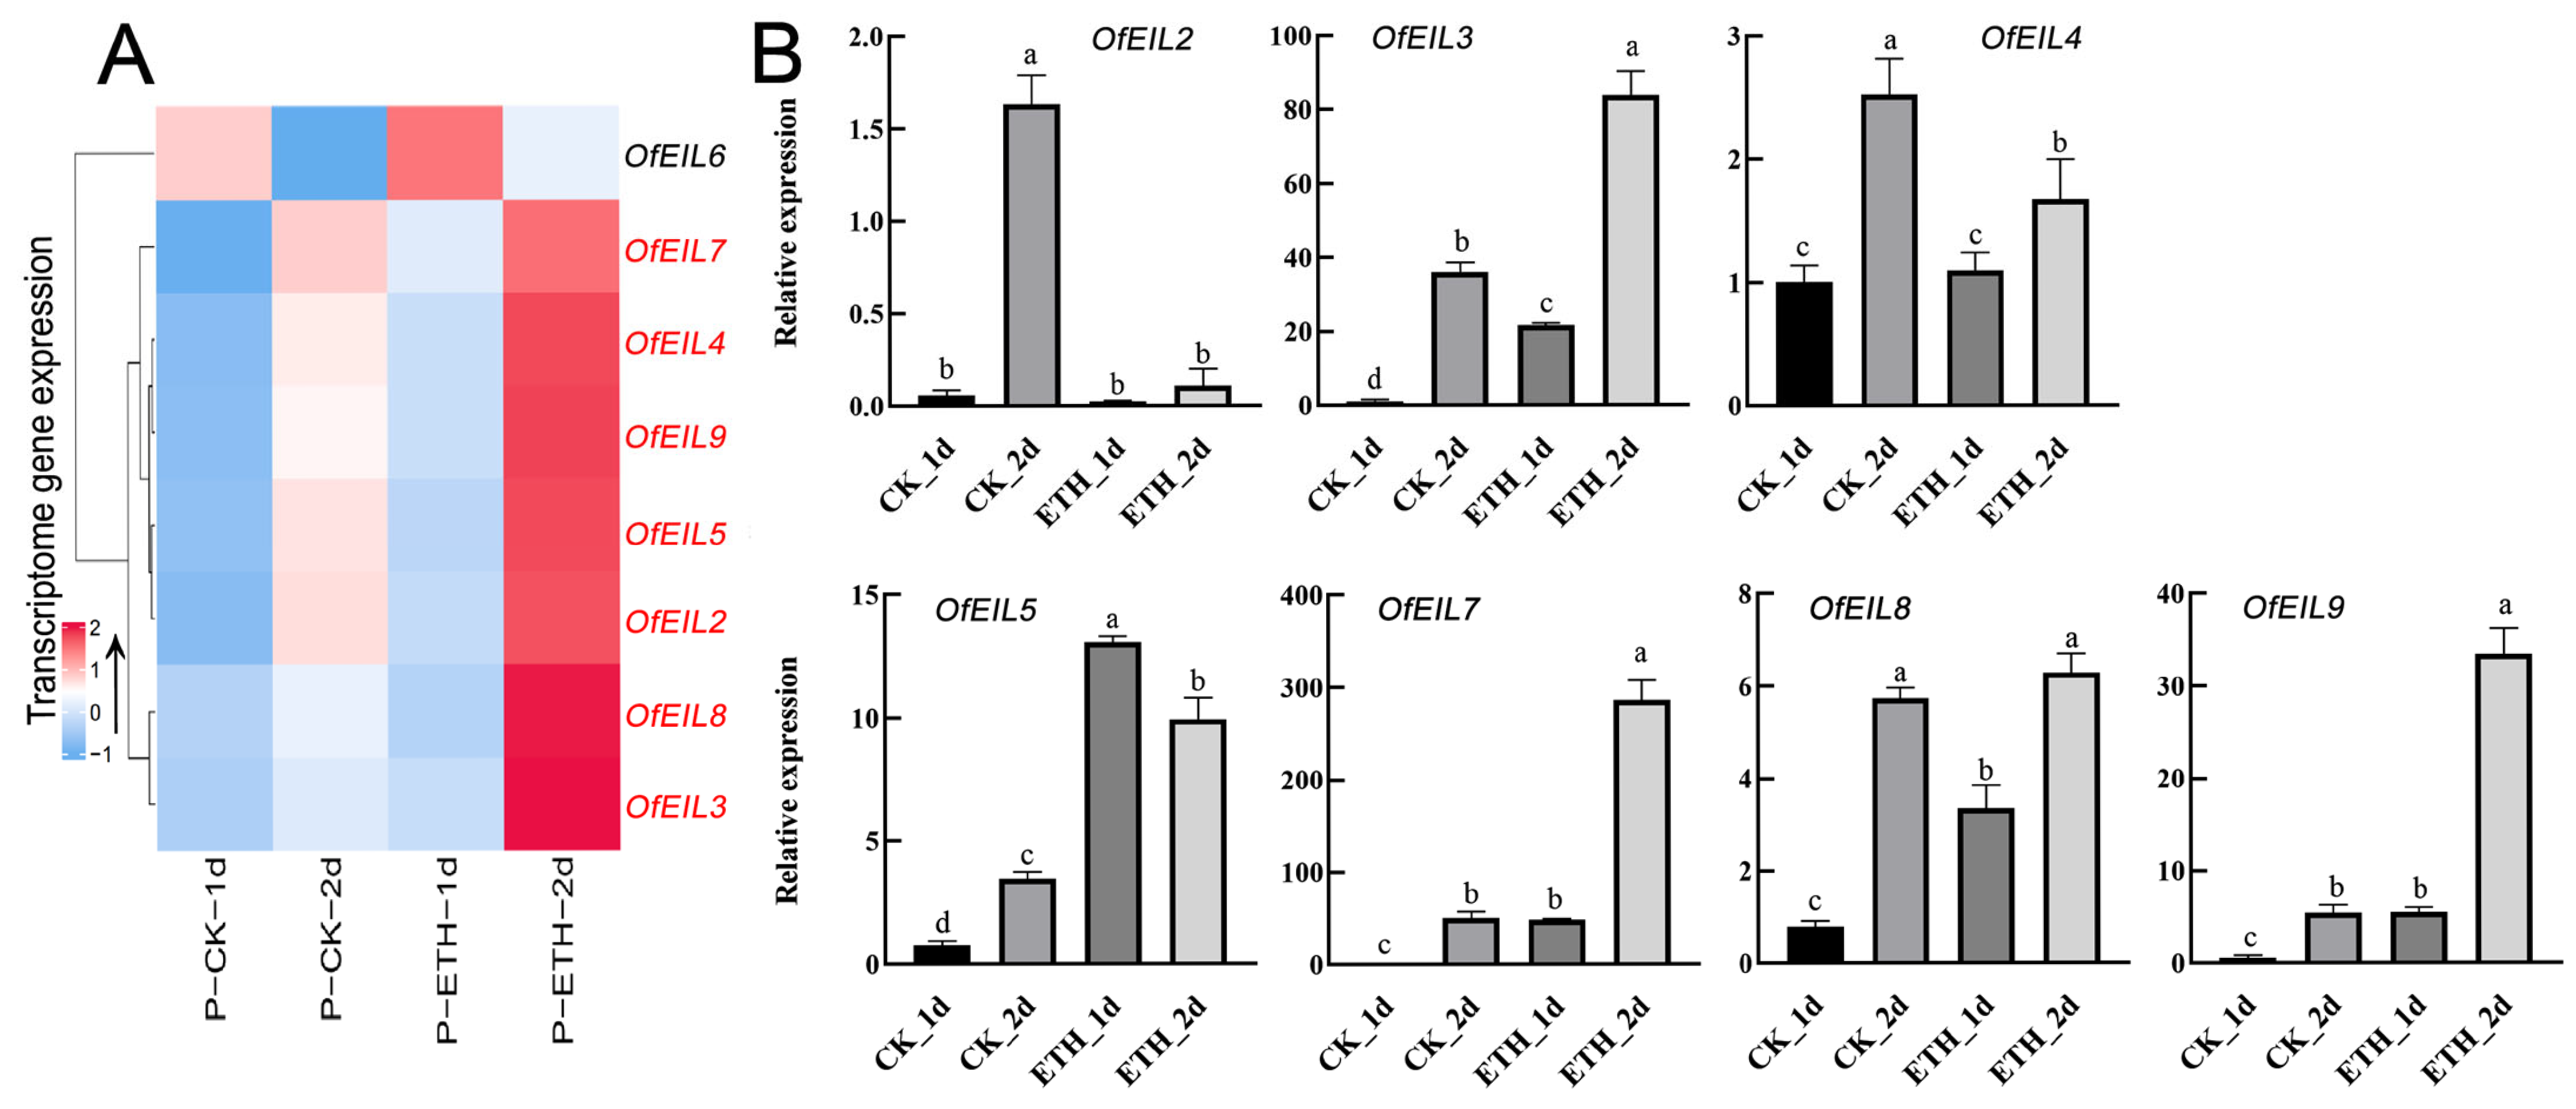
In Figure 8A, after treating the disk-inserted O. fragrans with ethephon, all OfEIL2–9 genes showed significantly enhanced relative expression. Among them, OfEIL6 exhibited higher relative expression levels on day 1 (1d) compared to day 2 (2d) under both the blank and ethephon treatments, with a more pronounced difference between 1d and 2d under the ethephon treatment. Because the branches collected at 0d were from the same period—during the bud stage of the tree—it is likely that OfEIL6 plays a role in the early to mid-stages (S2–S3) of the flower’s ex planta senescence process, but it has little or no effect on the later stages of senescence. Another possibility is that the relative expression of the OfEIL6 gene depends on the overall hormonal regulation of the tree. Once detached from the tree, or in the absence of nutrients or hormonal regulation from other parts of the tree, the gene may lose its relative expression activity. Based on the above analysis, OfEIL2–5 and OfEIL7–9 were selected for fluorescence quantitative analysis.
As shown in Figure 8B of the fluorescence quantification results, the ETH treatment improved the gene relative expression of OfEIL 3, 5, 7, 8, and 9. Among them, the ETH treatment induced a 20-fold change in OfEIL3 expression at 1d and a 2.3-fold change at 2d relative to the control. OfEIL5 was expressed about 17 times that of the control when ETH was treated for 1d and about 2.8 times that of the control when treated for 2d, but the relative expression of d2 was only 76% of that of d1, which decreased and did not match the transcriptome data. OfEIL7 was expressed about 45 times that of the control when ETH was treated for 1d and about 5.7 times that of the control when treated for 2d. OfEIL8 was expressed about 4.1 times that of the control when ETH was treated for 1d, and it slightly increased when treated for 2d. OfEIL9 was expressed about 10 times that of the control when ETH was treated for 1d and about 6 times that of the control when treated for 2d. The OfEIL2 and OfEIL4 exogenous ETH treatment at 1 and 2d did not increase the relative expression: the OfEIL2 ETH treatment at 1d compared to the control group exhibited no significant differences; by comparison, the control group’s relative expression decreased to about 1/16 of the level of treatment 2d. OfEIL4 is also reduced to about 66% of the level of the ETH treatment 2d.

4. Discussion

This study aimed to elucidate the roles of EIN3/EILs in responding to AZA and ETH in O. fragrans. By integrating phylogenetic, syntenic, and expression analyses, we identified distinct evolutionary and functional characteristics of the OfEIL family, as detailed below.

4.1. Evolutionary Conservation and Functional Divergence of OfEILs

Using the online analysis website ProtParam (https://web.expasy.org/protparam/, accessed on 17 January 2025) to analyze the physicochemical properties of the amino acid sequences of nine OfEILs, it was observed that the protein encoded by the OfEIL9 gene has the lowest total number of atoms (only 1/2 to 1/3 of that of other members), and it has the highest isoelectric point and the lowest average hydrophilicity values. Such structural differences may endow it with a special function in stress response [35]. Except for OfEIL9, the physicochemical property values of the remaining OfEILs are relatively close. The total number of atoms ranges from 8000 to 11,000, and the molecular mass is within a stable range of 57 to 78 ku, providing a structural basis for participating in basic physiological processes, such as intracellular substance transport and signal transduction, and indirectly enhancing stress resistance [35]. The isoelectric point is concentrated between five and six, which helps maintain the stability of the protein structure when the soil pH changes or regulates the intracellular acid–base balance [36]. The average hydrophilicity value is between −0.83 and −0.6, indicating that, as hydrophilic proteins, they can bind to cellular water, prevent excessive water loss during drought, and regulate water metabolism during waterlogging [37]. The instability coefficient is between 48 and 60, suggesting that they are easily induced by stress to undergo conformational changes, and they rapidly activate downstream stress resistance signaling pathways (such as the expression of genes related to antioxidant enzymes and osmotic adjustment substances) [38]. Based on the comprehensive prediction results, all proteins encoded by OfEILs are unstable hydrophilic proteins, and their physicochemical properties provide a potential molecular basis for O. fragrans stress resistance from multiple dimensions, such as structural stability, charge regulation, water maintenance, and signal response.
Phylogenetic analyses revealed that the OfEIL family in O. fragrans can be precisely divided into two subfamilies (Figure 3), supported by both gene structure and interspecies synteny evidence. Clade I (OfEIL1–2, 4–6, and 9) clusters closely with A. thaliana AtEIL1/AtEIN3, featuring 2–3 CDS and Motifs 9/13 (Figure 2B,C), and it is enriched in gibberellin-responsive elements (GARE motif) in promoters (e.g., OfEIL1/2/5), suggesting roles in floral organ development via gibberellin signaling [16]. These genes may also play a role in stress adaptation through their involvement in gibberellin-mediated responses. Clade II (OfEIL3 and 7–8) forms an independent branch with AtEIL3/AtEIN6, and it is dominated by the core conserved domain (Motif 1/2/4/7). OfEIL3, the closest homolog of AtEIL3, harbors ethylene-responsive elements (EREs) in its promoter, explaining its extreme upregulation (40 fold at 1d) under the ETH treatment—consistent with AtEIL3’s role in activating ethylene-responsive genes to accelerate senescence [14,39]. Ethylene is a key hormone involved in stress responses, and the upregulation of OfEIL3 under the ETH treatment suggests its potential role in mediating stress-induced senescence.

4.2. Interspecies Synteny and Functional Homology

A collinearity analysis identified five orthologous gene pairs between O. fragrans and A. thaliana, underscoring evolutionary conservation (Figure 1B). For example, AtEIL1 homologs (OfEIL1/2/5) likely share functions in ethylene signaling, sulfate starvation response, and bacterial defense [4,15]. These functions are crucial for plant survival under nutrient-limited or pathogen-infected conditions. The AtEIN3 homologs (OfEIL3/4/6/9) are enriched in ethylene-activated signaling pathway motifs, aligning with their roles in regulating senescence-related gene expression [40]. Senescence is a natural process that can be accelerated under stress conditions, and these genes may play a key role in mediating stress-induced senescence.
OfEIL7, the closest homolog of AtEIN6, uniquely contains a MYBHv1 binding site (Figure 2D), a marker for histone H3K27me3 demethylase activity [41]. This epigenetic regulatory element, combined with its “dual responsiveness” to AZA (inhibition) and ETH (induction), positions OfEIL7 as a hub integrating ethylene signaling and chromatin remodeling. Wang et al. [42] reported that, in A. thaliana, the H3K27me3 demethylase REF6 promotes leaf senescence by directly activating major regulatory and functional senescence genes. Given that OfEIL7 has a MYBHv1 binding site associated with H3K27me3 demethylase activity, it is reasonable to speculate that OfEIL7 may interact with H3K27me3 demethylases in a similar manner. When ethylene signals are received, OfEIL7 is highly upregulated. It could potentially recruit H3K27me3 demethylases to specific genomic loci related to senescence-associated genes. This recruitment would result in the removal of the H3K27me3 repressive marks on these genes, thus activating their transcription. Epigenetic modifications, such as histone demethylation, can play a crucial role in stress adaptation by modulating gene expression without changing the DNA sequence [43]. The presence of this binding site in OfEIL7 suggests that it may be involved in the epigenetic regulation of stress responses in O. fragrans.

4.3. Functional Divergence Driven by Cis-Element Remodeling

A Ka/Ks analysis (Table 3) showed purifying selection across all gene pairs (Ka/Ks < 1), with Clade II members (OfEIL3/7–8) exhibiting stronger conservation (Ka/Ks = 0.12–0.18), which is critical for maintaining core ethylene signaling functions. By contrast, Clade I members (e.g., OfEIL4/6) display functional diversification. OfEIL4 and 6 harbor drought-inducible MYB sites (Figure 2D), indicating stress response roles. These genes may be involved in regulating the plant’s response to drought stress, a common environmental challenge for plants. By contrast, OfEIL9 integrates ethylene (ERE) and light-responsive modules, suggesting its involvement in photo-regulated flowering [11]. Light is a crucial environmental factor, and the ability to regulate flowering in response to light conditions can be an important adaptation strategy for plants.
Expression patterns further reflect subfamily specialization. Clade II genes (OfEIL3/7) act as “early senescence triggers”, rapidly activating under the ETH treatment (1d), whereas Clade I’s OfEIL9 functions as a “late-senescence executor”, and it is highly expressed during petal abscission (S6, Figure 5). OfEIL8, a Clade II member, exhibits moderate ethylene-inducibility and stress-responsive element enrichment, likely serving as an auxiliary factor in ethylene-mediated defense responses (Figure 6).
In summary, the evolutionary divergence of OfEILs has established a “core signaling (Clade II)–multi-pathway integration (Clade I)” network, with OfEIL7 emerging as a pivotal node linking ethylene signaling to epigenetic regulation via histone demethylation. This framework provides a foundation for decoding the molecular mechanisms underlying floral longevity and stress adaptation in woody plants.

4.4. Hormonal Cross-Talk and Regulatory Specificity in Flowering and Senescence Under Stress

From an analysis of the cis-elements, gibberellin response elements—promoting flower bud opening—are present in all OfEILs except OfEIL3 and OfEIL7. The ethephon treatment enhances OfEIL3, 7, 8, and 9 expression, with OfEIL3 (40 fold) and OfEIL7 (45 fold, Figure 8B) exhibiting the most robust early responses (1d, early–mid-flowering). Ethylene delays flowering by inhibiting gibberellin accumulation via the EIN3/EIL1 pathway [44], suggesting that OfEIL3/7 may act as key nodes in this regulatory axis. In A. thaliana overexpression studies, non-OfEIL3/7 family members might promote early flowering, while OfEIL3/7 could delay it, offering genetic targets for flowering time regulation. DNA demethylation regulates flowering and senescence in O. fragrans. By contrast, AZA can effectively inhibit the demethylation process [23]. Through an osmanthus disk insertion experiment, it was observed that AZA potently inhibits OfEIL2/7 expression. The ethephon (ETH) treatment can promote the release of endogenous ethylene and cause the senescence of O. fragrans [45]. The ETH treatment strongly induces OfEIL3 and 7–9, whereas OfEIL2, 4, and 5 exhibit incomplete or decreasing responses, highlighting subfamily divergence. Notably, OfEIL7 integrates ethylene and epigenetic signals: its promoter harbors a MYBHv1 binding site, a hallmark of H3K27me3 demethylase recruitment [42], and its ethylene-induced 45-fold surge (Figure 8B) aligns with natural late-flowering upregulation (S5–S6). This suggests that OfEIL7 cooperates with REF6-like demethylases to remove repressive chromatin marks, activating senescence genes via an “ethylene–epigenetic remodeling” pathway [42].
By contrast, OfEIL2 exhibits early ethylene-responsive negative feedback, with only modest mid–late upregulation, indicating distinct regulatory kinetics. Collectively, OfEIL2–5 (likely via gibberellin/hormone crosstalk) and OfEIL7–9 (via ethylene–epigenetic integration) contribute to senescence at different stages, with OfEIL7 serving as a pivotal hub due to its dual responsiveness and chromatin-modifying potential. This framework enhances our understanding of flowering time regulation in O. fragrans, offering targets for extending floral longevity via molecular breeding.

5. Conclusions

This study provides the first comprehensive genome-wide analysis of the EIN3/EIL transcription factor family in O. fragrans, identifying nine OfEIL genes distributed across eight chromosomes. Phylogenetic and synteny analyses revealed evolutionary conservation and functional divergence among OfEILs, with OfEIL7 emerging as a key regulator integrating ethylene signaling and epigenetic modulation. Expression profiling demonstrated that six OfEILs (3/4/5/6/7/9) were significantly upregulated during late flowering stages, while OfEIL7 exhibited dual responsiveness to both the ETH and DNA demethylation (AZA) treatments, highlighting its pivotal role in floral senescence and stress adaptation. These findings underscore the potential of OfEILs, particularly OfEIL7, as targets for molecular breeding to enhance ornamental traits and environmental resilience in O. fragrans. Future research should focus on the functional validation of these genes to elucidate their precise mechanisms in ethylene-mediated flowering and stress responses. In view of the core response characteristics of OfEIL7 in the treatment of AZA and ETH, subsequent research will prioritize the verification of its molecular mechanisms in the regulation of osmanthus flowering periods and stress response through CRISPR-Cas9-mediated gene knockout and overexpression experiments.
Although EIN3/EILs have been studied in model plants, their functional elucidation in the perennial woody plant O. fragrans sinensis is still lacking. Through genome-level systematic analysis, this study fills the research gap with respect to the core transcription factors of the O. fragrans sinensis ethylene signaling pathway, and it provides a new perspective on the molecular mechanism of flowering regulation and the stress response of woody plants.

Author Contributions

Conceptualization, X.C.; methodology, D.P., C.X. and W.M.; software, D.P.; validation, X.Z. (Xinyi Zhu); formal analysis, Y.Z.; investigation, Q.Y.; resources, J.Y.; data curation, X.Z. (Xiangling Zeng); writing—original draft, D.P.; writing—review and editing, X.C.; visualization, Y.Z.; supervision, J.Z.; project administration, X.C. and J.Z.; funding acquisition, X.C., Y.Z., J.Y., X.Z. (Xiangling Zeng) and J.Z. All authors have read and agreed to the published version of the manuscript.

Funding

This research was funded by Hubei Province Natural Science Foundation (2023AFB1063), National Natural Science Foundation of China (32271951, 32372754 and 32401647), Hubei Province Natural Science Foundation (2024AFB1057 and 2025AFB857) and PhD grant from Hubei University of Science and Technology (BK202002).

Data Availability Statement

Data are contained within the article.

Conflicts of Interest

The authors declare no conflicts of interest.

References

  1. Li, M.; Wang, R.; Liang, Z.; Wu, X.; Wang, J. Genome-wide identification and analysis of the EIN3/EIL gene family in allotetraploid Brassica napus reveal its potential advantages during polyploidization. BMC Plant Biol. 2019, 19, 110. [Google Scholar] [CrossRef] [PubMed]
  2. Mao, K.; Zhang, M.; Kong, Y.; Dai, S.; Wang, Y.; Meng, Q.; Ma, N.; Lv, W. Origin, expansion, and divergence of ETHYLENE-INSENSITIVE 3 (EIN3)/EIN3-LIKE transcription factors during streptophytes evolution. Front. Plant Sci. 2022, 13, 858477. [Google Scholar] [CrossRef] [PubMed]
  3. Cao, Y.; Han, Y.; Meng, D.; Li, D.; Jin, Q.; Lin, Y.; Cai, Y. Genome-wide analysis suggests high level of microsynteny and purifying selection affect the evolution of EIN3/EIL family in Rosaceae. PeerJ 2017, 5, e3400. [Google Scholar] [CrossRef]
  4. Rieu, I.; Mariani, C.; Weterings, K. Expression analysis of five tobacco EIN3 family members in relation to tissue-specific ethylene responses. J. Exp. Bot. 2003, 54, 2239–2244. [Google Scholar] [CrossRef]
  5. Mao, C.; Wang, S.; Jia, Q.; Wu, P. OsEIL1, a rice homolog of the Arabidopsis EIN3 regulates the ethylene response as a positive component. Plant Mol. Biol. 2006, 61, 141–152. [Google Scholar] [CrossRef]
  6. Li, J.; Li, Z.; Tang, L.; Yang, Y.; Zouine, M.; Bouzayen, M. A conserved phosphorylation site regulates the transcriptional function of Ethylene-Insensitive3-like1 in tomato. J. Exp. Bot. 2012, 63, 427–439. [Google Scholar] [CrossRef]
  7. Zhang, Y.; Zang, Y.; Chen, J.; Feng, S.; Zhang, Z.; Hu, Y.; Zhang, T. A truncated ethylene insensitive3-like protein, GhLYI, regulates senescence in cotton. Plant Physiol. 2023, 193, 1177–1196. [Google Scholar] [CrossRef]
  8. Zhang, L.; Li, Z.; Quan, R.; Li, G.; Wang, R.; Huang, R. An AP2 domain-containing gene, ESE1, targeted by the ethylene signaling component EIN3 is important for the salt response in Arabidopsis. Plant Physiol. 2011, 157, 854–865. [Google Scholar] [CrossRef]
  9. Liu, C.; Li, J.; Zhu, P.; Yu, J.; Hou, J.; Wang, C.; Long, D.; Yu, M.; Zhao, A. Mulberry EIL3 confers salt and drought tolerances and modulates ethylene biosynthetic gene expression. PeerJ 2019, 7, e6391. [Google Scholar] [CrossRef]
  10. Shi, Y.; Tian, S.; Hou, L.; Huang, X.; Zhang, X.; Guo, H.; Yang, S. Ethylene signaling negatively regulates freezing tolerance by repressing expression of CBF and type-A ARR genes in Arabidopsis. Plant Cell 2012, 24, 2578–2595. [Google Scholar] [CrossRef]
  11. Chen, H.; Xue, L.; Chintamanani, S.; Germain, H.; Lin, H.; Cui, H.; Cai, R.; Zuo, J.; Tang, X.; Li, X.; et al. Ethylene insensitive3 and ethylene insensitive3-like1 repress salicylic acid induction deficient2 expression to negatively regulate plant innate immunity in Arabidopsis. Plant Cell 2009, 21, 2527–2540. [Google Scholar] [CrossRef]
  12. Li, Y.; Jiang, F.; Shi, X.; Liu, X.; Yang, H.; Zhang, Z. Identification and Characterization of the Cyclin-Dependent Kinases Gene Family in Silkworm, Bombyx mori. DNA Cell Biol. 2016, 35, 13–23. [Google Scholar] [CrossRef] [PubMed]
  13. An, F.; Zhang, X.; Zhu, Z.; Ji, Y.; He, W.; Jiang, Z.; Li, M.; Guo, H. Coordinated regulation of apical hook development by gibberellins and ethylene in etiolated Arabidopsis seedlings. Cell Res. 2012, 22, 915–927. [Google Scholar] [CrossRef]
  14. Li, Z.; Peng, J.; Wen, X.; Guo, H. Ethylene-insensitive3 is a senescence-associated gene that accelerates age-dependent leaf senescence by directly repressing miR164 transcription in Arabidopsis. Plant Cell 2013, 25, 3311–3328. [Google Scholar] [CrossRef]
  15. Zhang, Y.; Tan, S.; Gao, Y.; Kan, C.; Wang, H.L.; Yang, Q.; Xia, X.; Ishida, T.; Sawa, S.; Guo, H.; et al. CLE42 delays leaf senescence by antagonizing ethylene pathway in Arabidopsis. New Phytol. 2022, 235, 550–562. [Google Scholar] [CrossRef]
  16. Zhu, C.; Huang, Z.; Sun, Z.; Feng, S.; Wang, S.; Wang, T.; Yuan, X.; Zhong, L.; Cheng, Y.; Bao, M.; et al. The mutual regulation between DcEBF1/2 and DcEIL3-1 is involved in ethylene induced petal senescence in carnation (Dianthus caryophyllus L.). Plant J. Cell Mol. Biol. 2023, 114, 636–650. [Google Scholar] [CrossRef]
  17. Shibuya, K.; Barry, K.G.; Ciardi, J.A.; Loucas, H.M.; Underwood, B.A.; Nourizadeh, S.; Ecker, J.R.; Klee, H.J.; Clark, D.G. The central role of PhEIN2 in ethylene responses throughout plant development in petunia. Plant Physiol. 2004, 136, 2900–2912. [Google Scholar] [CrossRef]
  18. Vaseva, I.I.; Simova-Stoilova, L.; Kirova, E.; Mishev, K.; Depaepe, T.; Van Der Straeten, D.; Vassileva, V. Ethylene signaling in salt-stressed Arabidopsis thaliana ein2-1 and ctr1-1 mutants–A dissection of molecular mechanisms involved in acclimation. Plant Physiol. Biochem. 2021, 167, 999–1010. [Google Scholar] [CrossRef]
  19. Lu, X.F.; Liu, Y.Z.; Xu, J.R.; Liu, X.J.; Chi, Y.Z.; Li, R.X.; Mo, L.J.; Shi, L.Y.; Liang, S.J.; Yu, W.J.; et al. Recent progress of molecular mechanisms of DNA methylation in plant response to abiotic stress. Environ. Exp. Bot. 2024, 218, 105599. [Google Scholar] [CrossRef]
  20. Gao, H.Y.; Xia, X.Y.; An, L.J. Critical roles of the activation of ethylene pathway genes mediated by DNA demethylation in Arabidopsis hyperhydricity. Plant Genome 2022, 15, e20202. [Google Scholar] [CrossRef]
  21. Wang, B.; Luan, F.; Bao, Y.; Peng, X.; Rao, Z.; Tang, Q.; Zeng, N. Traditional uses, phytochemical constituents and pharmacological properties of Osmanthus fragrans: A review. J. Ethnopharmacol. 2022, 293, 115273. [Google Scholar] [CrossRef] [PubMed]
  22. Zou, J.J.; Zhou, Y.; Cai, X.; Wang, C.Y. Increases in DNA fragmentation and role of ethylene during the petal senescence of Osmanthus fragrans. Postharvest Biol. Technol. 2014, 93, 97–105. [Google Scholar] [CrossRef]
  23. Zou, J.J.; Cai, X.; Wang, C.Y. The spatial and temporal distribution of programmed cell death (PCD) duringpetal senescence of Osmanthus fragrans. Acta Hortic. 2017, 1185, 315–324. [Google Scholar] [CrossRef]
  24. Zou, J.J.; Cai, X.; Yang, J.; Zeng, X.; Liu, D.X.; Huang, S.; Chen, X.; Yang, Q.Y.; Wang, C.; Chen, H. DNA hypomEthylation mediates flower opening and senescence in sweet osmanthus through auxin and Ethylene responsive pathways. Postharvest Biol. Technol. 2023, 198, 112250. [Google Scholar] [CrossRef]
  25. Chen, H.G.; Zeng, X.L.; Yang, J.; Cai, X.; Shi, Y.M.; Zheng, R.R.; Wang, Z.Q.; Liu, J.Y.; Yi, X.X.; Xiao, S.W.; et al. Whole-genome resequencing of Osmanthus fragrans provides insights into flower color evolution. Hortic. Res. 2021, 8, 98. [Google Scholar] [CrossRef]
  26. El-Gebali, S.; Mistry, J.; Bateman, A.; Eddy, S.R.; Luciani, A.; Potter, S.C.; Qureshi, M.; Richardson, L.J.; Salazar, G.A.; Smart, A.; et al. The Pfam protein families database in 2019. Nucleic Acids Res. 2019, 47, D427–D432. [Google Scholar] [CrossRef]
  27. Chen, C.; Chen, H.; Zhang, Y.; Thomas, H.R.; Frank, M.H.; He, Y.; Xia, R. TBtools: An Integrative Toolkit Developed for Interactive Analyses of Big Biological Data. Mol. Plant 2020, 13, 1194–1202. [Google Scholar] [CrossRef]
  28. Wang, Y.; Tang, H.; Debarry, J.D.; Tan, X.; Li, J.; Wang, X.; Lee, T.H.; Jin, H.; Marler, B.; Guo, H.; et al. MCScanX: A toolkit for detection and evolutionary analysis of gene synteny and collinearity. Nucleic Acids Res. 2012, 40, e49. [Google Scholar] [CrossRef]
  29. Pei, J. Multiple protein sequence alignment. Curr. Opin. Struct. Biol. 2008, 18, 382–386. [Google Scholar] [CrossRef]
  30. Yang, X.; Scheffler, B.E.; Weston, L.A. Recent developments in primer design for DNA polymorphism and mRNA profiling in higher plants. Plant Methods 2006, 2, 4. [Google Scholar] [CrossRef]
  31. Zhang, C.; Fu, J.X.; Wang, Y.G.; Bao, Z.Y.; Zhao, H.B. Identification of Suitable Reference Genes for Gene Expression Normalization in the Quantitative Real-Time PCR Analysis of Sweet Osmanthus (Osmanthus fragrans Lour.). PLoS ONE 2015, 10, e0136355. [Google Scholar] [CrossRef] [PubMed]
  32. Livak, K.J.; Schmittgen, T.D. Analysis of relative gene expression data using real-time quantitative PCR and the 2(-Delta Delta C(T)) Method. Methods 2001, 25, 402–408. [Google Scholar] [CrossRef] [PubMed]
  33. Mu, H.Y.; Chen, J.Z.; Huang, W.J.; Huang, G.; Deng, M.Y.; Hong, S.M.; Ai, P.; Gao, C.; Zhou, H.K. OmicShare Tools: A Zero-Code Interactive Online Platform for Biological Data Analysis and Visualization. iMeta 2024, 3, e228. [Google Scholar] [CrossRef]
  34. Li, T.; Peng, Z.; Kangxi, D.; Inzé, D.; Dubois, M. ETHYLENE RESPONSE FACTOR6, A Central Regulator of Plant Growth in Response to Stress. Plant Cell Environ. 2025, 48, 882–892. [Google Scholar] [CrossRef]
  35. Kerk, D.; Bulgrien, J.; Smith, D.W.; Gribskov, M. Arabidopsis Proteins Containing Similarity to the Universal Stress Protein Domain of Bacteria. Plant Physiol. 2003, 131, 1209–1219. [Google Scholar] [CrossRef]
  36. Rakhra, G.; Dev Sharma, A.; Singh, J.P. Drought-Induced Changes in the Accumulation of Boiling-Soluble Proteins (p40, GST, HSP90) in the Grains of Drought-Tolerant and Drought-Sensitive Cultivars of Triticum aestivum. Crop and Pasture Science. 2015, 66, 904–911. [Google Scholar] [CrossRef]
  37. Meng, L.; Zhang, J.; Clarke, N. A Critical Review of Recent Advances in Maize Stress Molecular Biology. Int. J. Mol. Sci. 2024, 25, 12383. [Google Scholar] [CrossRef]
  38. Kulichikhin, K.Y.; Greenway, H.; Byrne, L.; Colmer, T.D. Regulation of intracellular pH during anoxia in rice coleoptiles in acidic and near neutral conditions. J. Exp. Bot. 2009, 60, 2119–2128. [Google Scholar] [CrossRef]
  39. Wang, C.Y.; Lin, T.T.; Wang, M.Q.; Qi, X.T. An AC-Rich Bean Element Serves as an Ethylene-Responsive Element in Arabidopsis. Plants 2020, 9, 1033. [Google Scholar] [CrossRef]
  40. Binder, B.M.; Walker, J.M.; Gagne, J.M.; Emborg, T.J.; Hemmann, G.; Bleecker, A.B.; Vierstra, R.D. The Arabidopsis EIN3 binding F-Box proteins EBF1 and EBF2 have distinct but overlapping roles in ethylene signaling. Plant Cell 2007, 19, 509–523. [Google Scholar] [CrossRef]
  41. Chowdhury, Z.; Mohanty, D.; Giri, M.K.; Venables, B.J.; Chaturvedi, R.; Chao, A.; Petros, R.A.; Shah, J. Dehydroabietinal promotes flowering time and plant defense in Arabidopsis via the autonomous pathway genes flowering locus D, FVE, and relative of early flowering 6. J. Exp. Bot. 2020, 71, 4903–4913. [Google Scholar] [CrossRef] [PubMed]
  42. Wang, X.; Gao, J.; Gao, S.; Song, Y.; Yang, Z.; Kuai, B. The H3K27me3 demethylase REF6 promotes leaf senescence through directly activating major senescence regulatory and functional genes in Arabidopsis. PLoS Genet. 2019, 15, e1008068. [Google Scholar] [CrossRef]
  43. Antunez-Sanchez, J.; Naish, M.; Ramirez-Prado, J.S.; Ohno, S.; Huang, Y.; Dawson, A.; Opassathian, K.; Manza-Mianza, D.; Ariel, F.; Raynaud, C.; et al. A new role for histone demethylases in the maintenance of plant genome integrity. eLife 2020, 9, e58533. [Google Scholar] [CrossRef]
  44. Fernández-Milmanda, G.L. Touch me not! Jasmonic acid and ethylene converge on gibberellins breakdown to regulate touch-induced morphogenesis. Plant Physiol. 2024, 194, 601–603. [Google Scholar] [CrossRef]
  45. Zou, J.J.; Zhang, J.; Wang, X.Q.; Xia, H.; Zeng, X.L.; Cai, X.; Yang, J.; Zeng, J.; Li, Z.Q.; Zhang, G.F.; et al. Comprehensive transcriptome analysis of AP2/ERFs in Osmanthus fragrans reveals the role of OfERF017-mediated organic acid metabolism pathway in flower senescence. Front. Plant Sci. 2024, 15, 1467232. [Google Scholar] [CrossRef]
Figure 1. (A) Collinearity analysis of OfEILs and chromosomal mapping of genes. (B) Collinearity analysis between O. fragrans OfEILs and A. thaliana AtEILs. From the outside to the inside, the layers are arranged as follows: gene density, GC content, repeat density, and collinear regions.
Horticulturae 11 00572 g001
Figure 2. OfEIL gene structure and protein conserved motif analysis: (A) gene evolutionary analysis: number 100—represents the bootstrap support value; scale 0.050—represents genetic distance; (B) gene structure analysis: green indicates the CDS (coding sequence); yellow indicates the UTR (non-translational area); (C) OfEIL protein motif composition (different motifs numbered and colored); (D) analysis of the cis-acting elements of the OfEIL promoter. The abscissa is the base pairs/pb, and the short bars with different colors represent different cis-acting elements.
Horticulturae 11 00572 g002
Figure 3. Evolutionary analysis of the EIN3/EIL family in O. fragrans and A. thaliana: (A) NJ phylogenetic tree; (B) MJ phylogenetic tree. Red represents Clade I, and green represents Clade II.
Horticulturae 11 00572 g003
Figure 4. Heatmap of the expression patterns of OfEILs during natural flowering development: S1, bud stage; S2, initial flowering stage; S3, early full flowering stage; S4, full flowering stage; S5, late full flowering stage; S6, abscission stage. The transcriptome expression level (TPM) is normalized according to the normalization of the clustering pattern and the consistency of expression fluctuations. The red gene is emphasized as the upregulating gene in the senescence period; the black gene is the upregulated gene in the non-senescence period; the red period is the S5/S6 senescence period; the black period is S1~S4 in the middle stages of flowering.
Horticulturae 11 00572 g004
Figure 5. The qRT—PCR analysis of the OfEIL genes during natural flowering development with similar relative expression trends: S1, bud stage; S2, initial flowering stage; S3, early full flowering stage; S4, full flowering stage; S5, late full flowering stage; S6, abscission stage. Error bars represent the standard error of three replicates. Different letters (a, b, c, d, etc.) indicate significant differences between groups. Groups with the same letter have no significant difference, while those with different letters show statistically significant differences.
Horticulturae 11 00572 g005
Figure 6. The qRT—PCR analysis of the OfEIL genes during natural flowering development with different relative expression trends. S1, bud stage; S2, initial flowering stage; S3, early full flowering stage; S4, full flowering stage; S5, late full flowering stage; S6, abscission stage. Error bars represent the standard error of three replicates. Different letters (a, b, c, d, etc.) indicate significant differences between groups. Groups with the same letter have no significant difference, while those with different letters show statistically significant differences.
Horticulturae 11 00572 g006
Figure 7. The relative expression levels of OfEILs under the AZA treatment: (A) heatmap of the relative expression patterns of the OfEILs under the AZA treatment; (B) qRT—PCR analysis of the OfEIL genes under the AZA treatment. Error bars represent the standard error of three replicates. The transcriptome expression level (TPM) was normalized, and the clustering pattern was clustered according to the consistency of expression fluctuations, with the red gene word emphasizing the lower expression of the AZA treatment and the blank group expressing highly expressed genes; the black gene word indicates the lower expression of the non-AZA treatment and the high expression of the blank group. Different letters (a, b, c, d, etc.) indicate significant differences between groups. Groups with the same letter have no significant difference, while those with different letters show statistically significant differences.
Horticulturae 11 00572 g007
Figure 8. The relative expression levels of OfEILs under the ETH treatment: (A) heatmap of the relative expression patterns of the OfEILs under the ETH treatment; (B) qRT—PCR analysis of the OfEIL genes under the ETH treatment. Error bars represent the standard error of three replicates. The transcriptome expression level (TPM) was treated according to normalization, and the clustering pattern was clustered according to the consistency of expression fluctuations. The red gene word emphasized that the expression of the ETH treatment was higher than that of the blank group, and the expression of genes increased over time. The black gene word denotes the gene that did not meet the above conditions. Different letters (a, b, c, d, etc.) indicate significant differences between groups. Groups with the same letter have no significant difference, while those with different letters show statistically significant differences.
Horticulturae 11 00572 g008
Table 1. OfEIL fluorescence quantitative primers.
Gene NumberPrimerPrimer Sequences (5′→3′)
OfEIL2LYG006439-FATTTCTTCTCGTCTGCTCCTCCA
LYG006439-RTCTTTTTCCTCCTCGCTTGTTCT
OfEIL3LYG010377-FGGAAGAGTTGGAGAGACGAATGTG
LYG010377-RATTGGCAGAAGAAAAAGTGGATAA
OfEIL4LYG016518-FCGGTAATCTTGATTTCCTCTCTACT
LYG016518-RACTGACTCCTTGTTCTTCTTCTGCT
OfEIL5LYG018604-FTGGTGATTTTGATTTCTTTTCCTCT
LYG018604-RTCATTTCTTTCAGTCTTTTGTGTCG
OfEIL6LYG028598-FAATGGGTTTTTGTGGTAATCTTGA
LYG028598-RTGGACTCCTTGTTCTTTTTCTGCT
OfEIL7LYG035007-FATTTCTTTTCGTCTGCTCCTCTCA
LYG035007-RTCAACACCGTCCTTACCTTTATTC
OfEIL8LYG035276-FCCAAAAGTTAGCCGTAGTAACAAACA
LYG035276-RGCACAAAAAAAGTCACAATCAGAATC
OfEIL9LYG038346-FAGCCGGTTGTGGATGATGATTA
LYG038346-RTGAGATTGCCGTTGTTTGGAA
/OfACT-FAGTCCTCTTCCAGCCTTCTTT
OfACT-RATTTCCTTGCTCATACGGTCA
Table 2. Physicochemical properties of OfEILs.
Gene NameTotal Number of AtomsMolecular
mass/ku
Theoretical
Isoelectric Point
Hydrophilicity
Average
Instability IndexProtein PropertiesSubcellular
Localization
OfEIL1811657.92 5.51−0.76654.3Unstable hydrophilic proteinsNucleus
OfEIL2962669.69 5.63−0.75756.67Unstable hydrophilic proteinsNucleus
OfEIL310,21673.53 5.88−0.82752.52Unstable hydrophilic proteinsNucleus
OfEIL4962469.70 5.02−0.71848.6Unstable hydrophilic proteinsNucleus
OfEIL5966970.21 5.84−0.82352.66Unstable hydrophilic proteinsNucleus
OfEIL6915866.07 5.38−0.67354.22Unstable hydrophilic proteinsNucleus
OfEIL710,82977.88 5.66−0.77759.9Unstable hydrophilic proteinsNucleus
OfEIL810,31674.17 5.8−0.77559.43Unstable hydrophilic proteinsNucleus
OfEIL9392767.91 8.64−0.90448.66Unstable hydrophilic proteinsNucleus
Table 3. OfEIL selection pressure analysis.
Gene PairsNon-Synonymous, KaSynonymous, KsKa/KsEvolutionary Direction
OfEIL2&OfEIL70.050.310.16Purify selection
OfEIL5&OfEIL70.130.710.18Purify selection
OfEIL5&OfEIL90.110.350.31Purify selection
OfEIL4&OfEIL60.070.360.2Purify selection
OfEIL7&OfEIL90.110.920.12Purify selection
Disclaimer/Publisher’s Note: The statements, opinions and data contained in all publications are solely those of the individual author(s) and contributor(s) and not of MDPI and/or the editor(s). MDPI and/or the editor(s) disclaim responsibility for any injury to people or property resulting from any ideas, methods, instructions or products referred to in the content.