Article

Consequences of Micro- and Macronutrient Deficiencies on Physiological and Growth Metrics in Hydroponic ‘Thompson Seedless’ Grapevines

1
College of Landscape and Horticulture, Yunnan Agricultural University, Kunming 650500, China
2
Department of Plant Science, School of Agriculture and Biology, Shanghai Jiao Tong University, Shanghai 200240, China
3
Guangxi Key Laboratory of Germplasm Innovation and Utilization of Specialty Commercial Crops in North Guangxi, Guangxi Academy of Specialty Crops, Guilin 541004, China
4
Kaga Township Agricultural and Animal Husbandry Comprehensive Service Center, Angren County, Shigatse 858516, China
5
Integrative Agriculture, College of Agriculture and Veterinary Medicine, United Arab Emirates University, Al Ain P.O. Box 15551, United Arab Emirates
6
Guangxi Zhuang Autonomous Region Engineering Research Center of Marine Food Nutrition and Processing Technology Innovation, Guangxi College and University Key Laboratory of High-Value Utilization of Seafood and Prepared Food in Beibu Gulf, College of Food Engineering, Beibu Gulf University, Qinzhou 531011, China
*
Authors to whom correspondence should be addressed.
Horticulturae 2025, 11(5), 543; https://doi.org/10.3390/horticulturae11050543 (registering DOI)
Submission received: 10 April 2025 / Revised: 3 May 2025 / Accepted: 13 May 2025 / Published: 18 May 2025
(This article belongs to the Special Issue Research Progress on Grape Genetic Diversity)

Abstract

:
(1) Background: Mineral nutrient deficiencies are a major constraint on grapevine growth and productivity, yet the clear identification of deficiency symptoms and their physiological impacts remains challenging. (2) Methods: In this study, ‘Thompson Seedless’ grapevines were grown hydroponically under the controlled omission of ten essential nutrients (N, P, K, Ca, Mg, Fe, Mn, B, Zn, Cu) to assess their impact on growth, leaf morphology, chlorophyll content, photosynthesis, respiration, and tissue nutrient concentrations. (3) Results: Deficiencies in N, P, K, Mn, and B caused distinct leaf symptoms: nitrogen (N) deficiency led to pale leaves with bluish-green veins, phosphorus (P) deficiency caused yellowing in apical leaves followed by interveinal chlorosis, and potassium (K) deficiency induced pale yellow discoloration, curling, and rotting of the leaves. Manganese (Mn) and boron (B) deficiencies showed symptoms such as irregular leaf shapes and brittle, glossy leaves, respectively. These deficiencies resulted in reduced dry matter accumulation, decreased shoot length, and lower chlorophyll content. In contrast, iron (Fe) and copper (Cu) deficiencies had minimal effects, closely resembling those of the control conditions with only slight growth suppression. Notably, N, B, and Mg deficiencies led to significant reductions in Cu, Mg, B, and N levels, particularly evident through distinct symptoms in newly formed leaves. (4) Conclusions: Deficiencies in N, P, K, Mg, and B significantly affect grapevine growth, physiological processes, and nutritional quality. These findings emphasize the importance of maintaining balanced mineral nutrition for optimal grapevine health and productivity.

1. Introduction

Plant nutrition is an essential aspect of agriculture that directly impacts crop yield and quality [1]. Seventeen essential nutrients, crucial for plant growth, have been identified. Among these, carbon (C), hydrogen (H), and oxygen (O), which are non-mineral elements, are acquired mainly from the atmosphere and water. In contrast, elements such as N, P, K, Ca, Mg, Fe, Mn, B, Zn, molybdenum (Mo), Cu, nickel (Ni), sulfur (S), and chloride (Cl) are absorbed from the soil through the root system [2]. These nutrients are categorized into macronutrients, including N, P, K, Ca, Mg, and S, which have relatively high demands (>0.1%), and micronutrients, such as Fe, Mn, B, Zn, Mo, Cu, Ni, and Cl, which are required in relatively small quantities (<100 ppm) [3]. However, nutrient deficiencies can lead to various symptoms in plants, including stunted growth, chlorosis, and necrosis, which can have detrimental effects on plant health and yield.
The identification of essential elements in plants remains a subject of ongoing debate. Researchers believe that only three elements, N, P, and K, are necessary for plant growth [4] and that their proper administration can significantly affect growth and metabolite accumulation [5]. Research has demonstrated that N and P deficiency affect plant productivity by reducing photosynthesis, leaf area, and green leaf longevity [6,7]. In grape cultivation, micronutrient deficiency is a common challenge that prevents optimal growth and development. The application of micronutrients has been shown to increase grapevine biomass, production, winter hardiness, and drought resistance [8,9,10]. Among micronutrients, B and Mn deficiency reduce growth, leaf area, dry matter content, chlorophyll content, and photosynthetic activity [11,12].
Each crop has specific minimal nutrient requirements, and falling below these thresholds results in growth disturbances and deficiency symptoms. The main objective of many studies conducted by plant nutritionists is to determine the minimal amount of nutrients required for maximum plant growth or maximum yield [13]. Nutrient management is a critical aspect of grape production. Optimizing the nutrient composition of grapevines significantly affects the growth, development, yield, and quality of grapes. Many factors, including excessive growth and soil composition, can contribute to nutritional imbalances in vineyards [14].
Typically, growers assess nutrient requirements by analyzing the nutrient composition in annual growth volumes, a process that is time-consuming and costly. Nutrient deficiencies become apparent when specific symptoms manifest, allowing for targeted nutrient supplementation [15]. There is no standard procedure for diagnosing and remedying nutrient deficiency symptoms.
Globally, grape production is impacted by imbalances in mineral nutrition, which often lead to deficiency-related disorders. However, nutritional deficiency symptoms under field conditions can manifest as a diverse range of issues, with multiple elements showing varying degrees of deficiency simultaneously. This complexity makes it challenging for farmers to accurately identify nutrient deficiency solely based on symptoms and take appropriate corrective actions. Therefore, this study utilizes Thompson seedless grapes under a hydroponic system to precisely identify various deficiency symptoms in grape production.
Based on the assumption that different nutrient deficiencies manifest distinct and quantifiable morphological and physiological changes, we hypothesize that a hydroponic setup can be used to systematically characterize these responses. The study examines whether the deficiency of each essential nutrient (N, P, K, Ca, Mg, Fe, Mn, B, Zn, and Cu) results in distinguishable symptoms that can be used for an accurate diagnosis. By recording leaf appearance, shoot length, leaf area, biomass, photosynthetic rate, and chlorophyll content, we aim to provide practical insights for the accurate and convenient identification of nutrient deficiencies and timely remediation in grapevine management.

2. Materials and Methods

In this study, the following analytical-grade chemicals were utilized for the preparation of the nutrient solution: calcium nitrate tetrahydrate (≥99.98%, Thermo Scientific Chemicals, USA), potassium nitrate (99.8%, Yingfengyuan Industrial Group Limited, China), ammonium dihydrogen phosphate (99%, various suppliers, China), magnesium sulfate heptahydrate (99%, CDH Fine Chemical, India), sodium ferric EDTA (14.0% Fe, various suppliers, China/India/USA), boric acid (Kishida Chemical Co. Ltd., Osaka, Japan), manganese(II) sulfate tetrahydrate (Nike Chemical India, Muzaffarnagar, India), zinc sulfate heptahydrate (Vinipul Inorganics Pvt. Ltd., Mumbai, India), copper(II) sulfate pentahydrate (99%, Xuke Chemical, Shandong, China), and ammonium molybdate tetrahydrate (99%, WonderLand Herbs, Bellingham, WA, USA). All chemicals were of adequate purity for the preparation of the nutrient solution and were used as received, without any further purification.
The experiment was conducted in a modern glass greenhouse (31°11′ N, 121°29′ E) at the Agricultural Engineering Training Center, Shanghai Jiao Tong University, China. The hydroponic nutrient solution, formulated based on Hogland’s solution [16], was divided into 11 groups: Group 1 (control, with all nutrients), and Groups 2–11, each lacking one of the following elements, respectively: nitrogen (N), phosphorus (P), potassium (K), calcium (Ca), magnesium (Mg), iron (Fe), manganese (Mn), boron (B), zinc (Zn), and copper (Cu). The nutrient solutions were prepared using ultrapure water, and the concentrations of each element were calculated in mg/L (Table 1). The solutions met the deficiency criteria, with the omitted elements nearly absent and all other nutrients at levels comparable to the control.
Self-rooted annual seedlings of ‘Thompson Seedless’ grapes (Vitis vinifera L.) were thoroughly washed with ultrapure water and soaked for two days to remove soil residues. For each treatment, 18 grapevines were used, with six plants per replicate grown in 15 L plastic tanks (380 × 277 × 145 mm), which were covered to minimize evaporation. Super Pond air pumps (AC-002) delivered oxygen to the tanks via 30 cm bubble hoses, with each pump serving three tanks. The nutrient solutions were replaced every 15 days. Two new shoots per plant were marked, and photographs were taken every five days to monitor growth and visual symptoms. All nutrients used in the preparation of the hydroponic solutions were sourced from Sigma-Aldrich (AR grade, Analytical Reagent, Waltham, MA, USA).

2.1. Determination of New Shoot Length

Six new shoots from each treated grapevine were chosen for labeling, and every 10 days, from 40 days after budding until 70 days later, the length of each treated shoot was measured.

2.2. Determination of Leaf Area

After bud break (80 days post budding), the width and length of 100 randomly selected leaves from six new shoots per treatment were measured. Furthermore, the leaf area of each leaf (Y, accuracy, 0.01 cm2) was scanned with the LI-3000A leaf area analyzer, and the total leaf area of each leaf was subsequently calculated according to the regression equation using the length (L) and width (W).

2.3. Determination of Photosynthesis

The daily level of leaf photosynthesis was measured after the appearance of obvious symptoms in each treatment. Under favorable weather conditions, the net photosynthetic rate, transpiration rate, stomatal conductance, and intercellular CO2 concentration were measured on the 4th and 7th leaves from the base of the new shoot at two-hour intervals between 7:00 and 17:00, and the values were measured every 3 min once the instruments had stabilized. A total of 9 points were recorded.

2.4. Determination of Chlorophyll Content

The relative chlorophyll content of the leaves was measured every 15 days after the appearance of obvious symptoms in each treatment. For each treatment, four new shoots were chosen, and the average chlorophyll content of all selected shoot leaves was determined via a SPAD-502 chlorophyll meter (Handy PEA+, Hansantech Instruments Ltd., King’s Lynn, Norfolk, UK).

2.5. Sample Collection and Processing

All treated grapevines were harvested and transferred to the laboratory for analysis. Each plant was separated into distinct components: roots, trunk, new shoots (1-year-old), basal leaves (older leaves from the lower section of new shoots), and apical leaves (younger leaves from the upper section). Each part was washed three times with tap water and then rinsed thoroughly with deionized water. Excess moisture was removed using filter paper, and the fresh weight was recorded. The samples were then oven-dried at 105 °C for 15 min, followed by drying at 80 °C until a constant weight was achieved. The dried material was ground using a pulverizer, passed through a 34-mesh (0.5 mm) sieve, and stored in a desiccator for subsequent elemental analysis.

2.6. Determination of Mineral Element Contents

The total nitrogen (N) content was determined using an automatic Kjeldahl Analyzer Unit (Kjeltec TM2300; Foss Tecator, Höganäs, Sweden). A 0.2 g dry sample was digested at 360 °C with concentrated H2SO4 and a mixed catalyst (K2SO4:CuSO4·5H2O = 9:1) until an emerald-green, transparent solution was obtained.
The phosphorus (P) content was measured using the molybdenum blue method [17], while the boron (B) concentration was determined by curcumin spectrophotometry (national standard: GB12298-90). Potassium (K), calcium (Ca), magnesium (Mg), iron (Fe), manganese (Mn), zinc (Zn), copper (Cu), and other metal elements were analyzed using an AA-6800F atomic absorption spectrophotometer.
For the metal analysis, 0.5 g of the dried sample was placed into a digestion tube with 10 mL of concentrated nitric acid and 2 mL of 62% perchloric acid. The mixture was shaken, mixed, and then digested in a high-temperature furnace (DigiPREP HT 100-40, SCP Science, Baie-D’Urfé, QC, Canada) under a fume hood. The temperature was held at 95 °C for 20 min, maintained for another 30 min, increased to 140 °C for 20 min, and, finally, raised to 180 °C over 20 min. This stage was sustained for 3 h until white fumes were emitted and the solution turned clear and colorless. The digested samples were diluted to 50 mL in a volumetric flask for final analysis via atomic absorption spectrophotometry.

2.7. Statistical Analysis

The mean and standard error (SE) were used to represent the data. Statistical analysis was performed using SPSS statistical software (version 16.0; SPSS, Inc., Chicago, IL, USA). The effects of nutrient deficiency treatments on shoot length, leaf area, dry matter, chlorophyll content, respiration activity, and nutrient levels were analyzed using a randomized complete block design (RCBD) at a significance level of p < 0.05. An analysis of variance (ANOVA) was conducted to determine the statistical significance between treatments. The normality of errors and homogeneity of variance were verified using the Shapiro-Wilk test and Levene’s test, respectively. Significant differences were further evaluated using the post hoc Tukey’s test.

3. Results

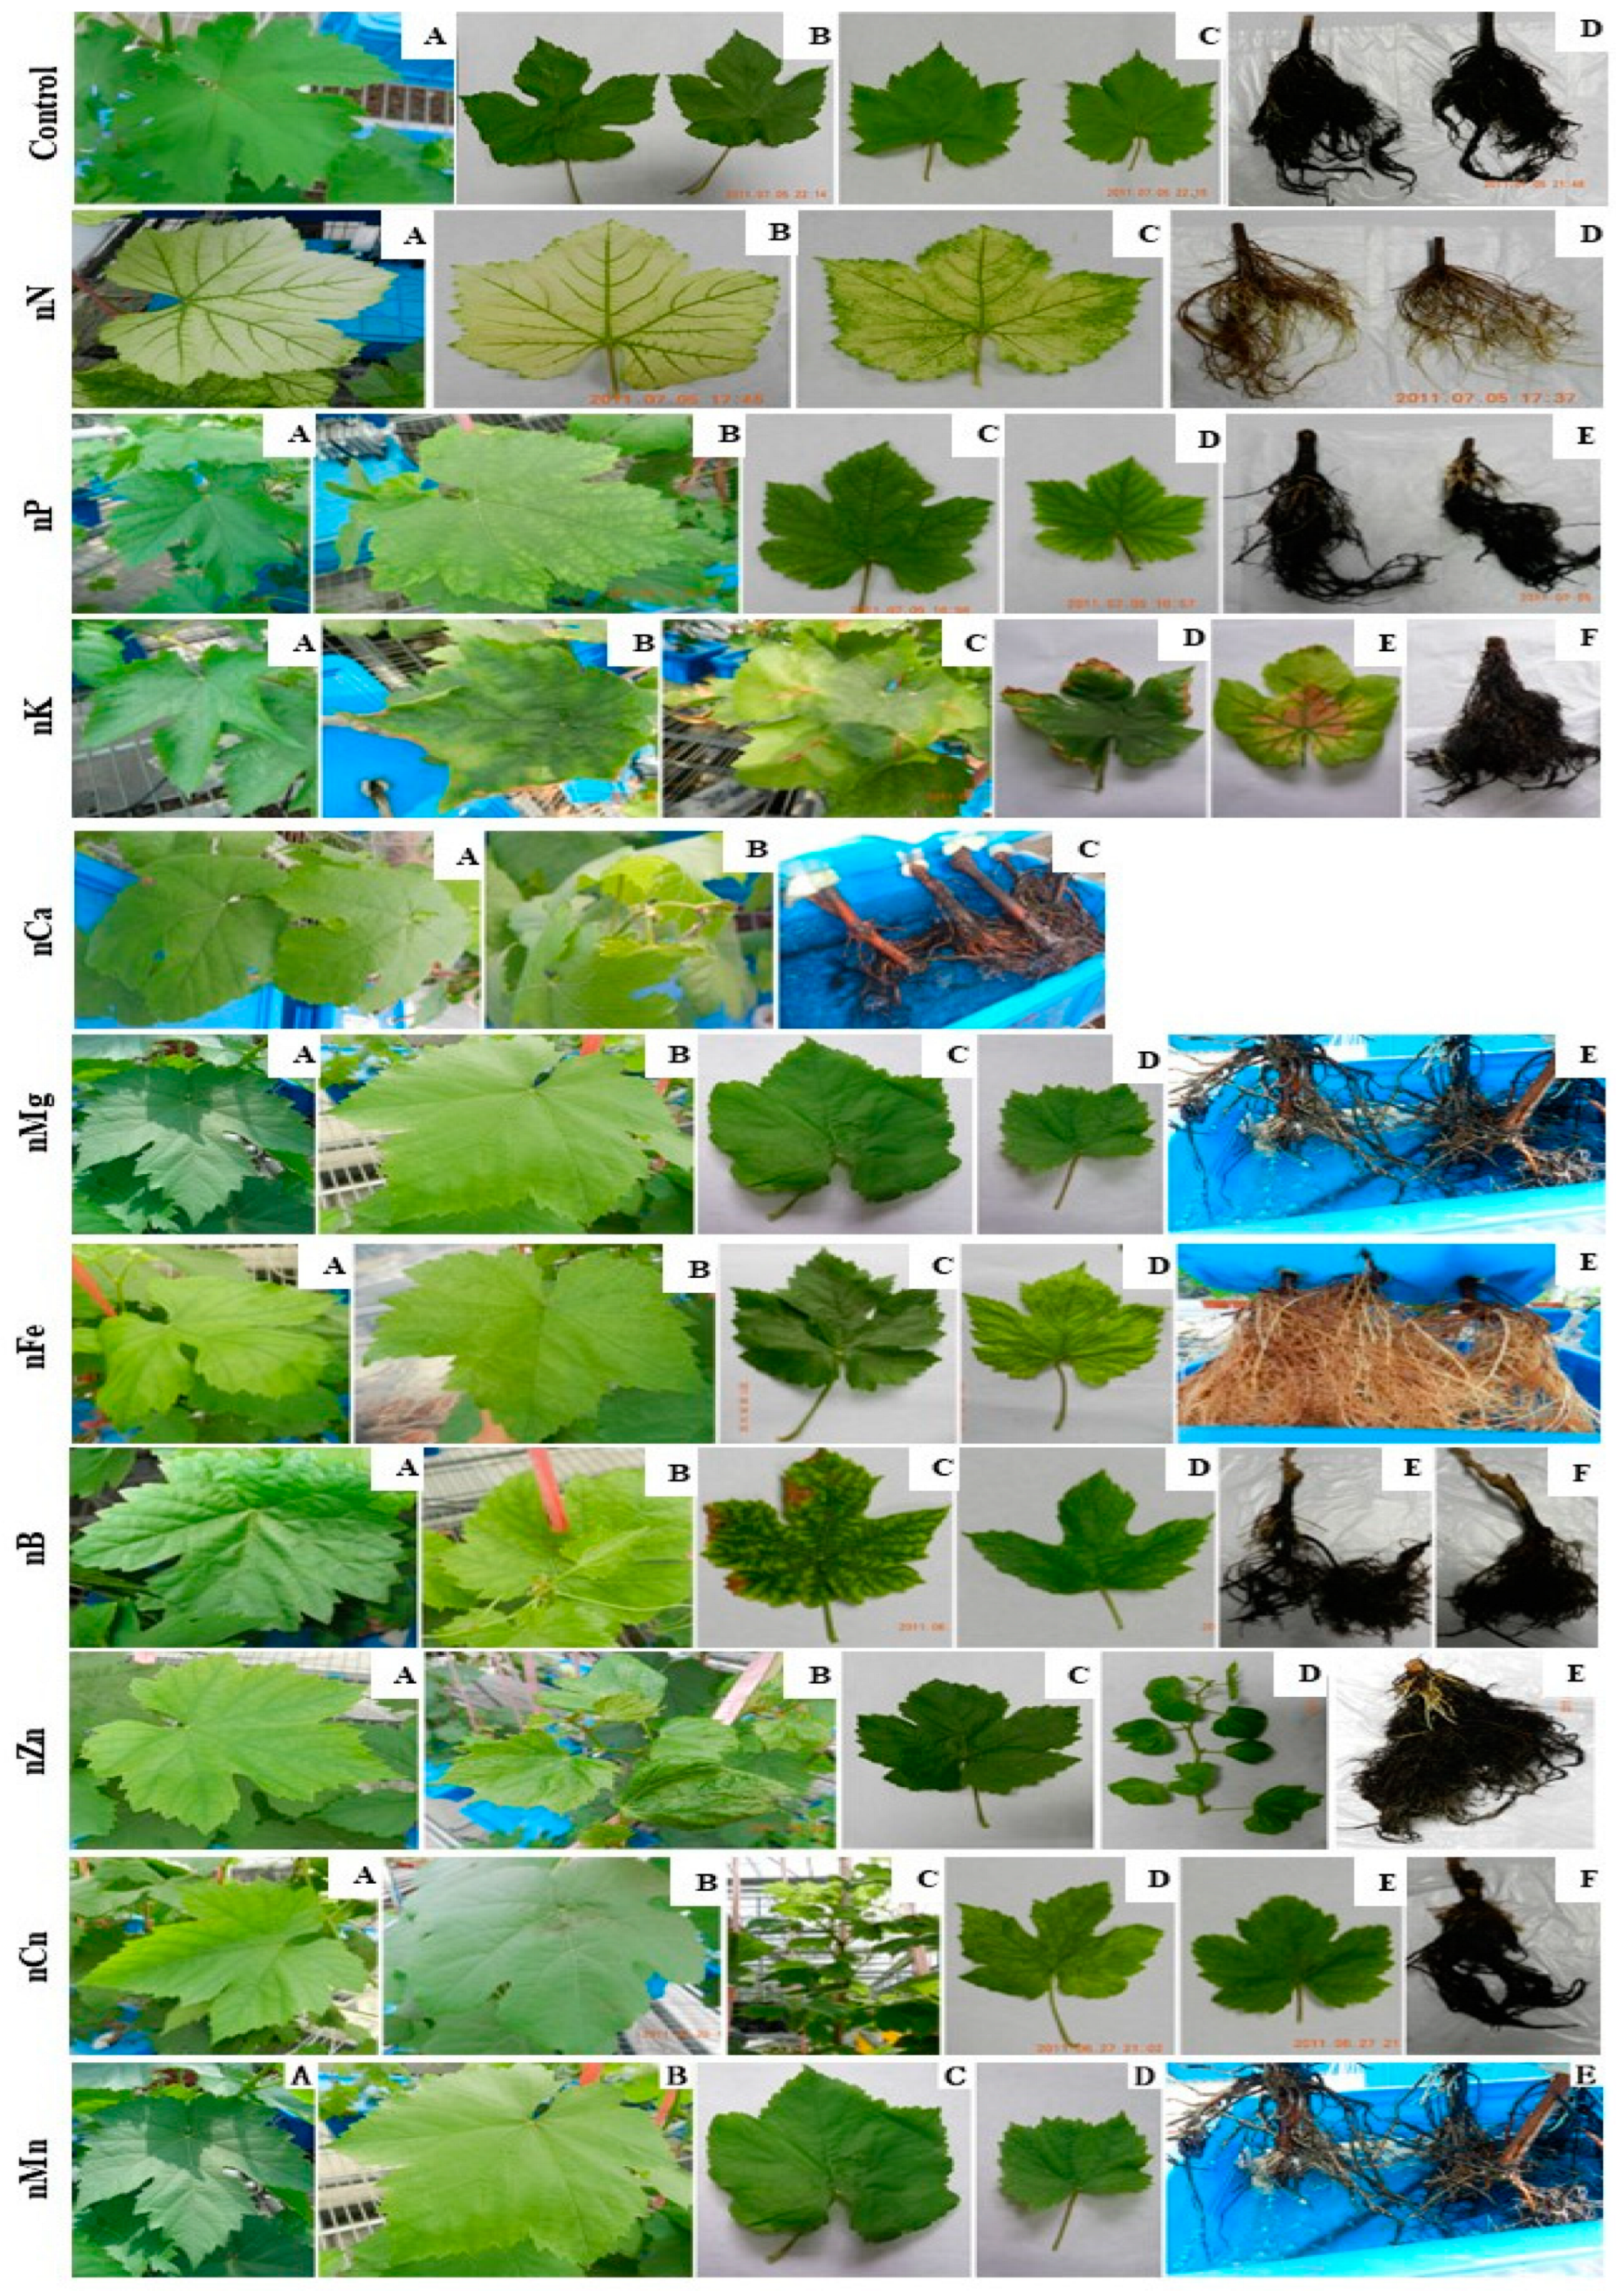
3.1. Leaf and Root Visual Symptoms Under Deficiency Conditions

Under controlled conditions, Thompson Seedless grapevines grown in Hoagland’s nutrient solution showed vigorous growth. New shoots developed rapidly, with dark green basal leaves and lush, fully unfolded apical leaves free of any deficiency symptoms throughout the three-month cultivation period. The root system was healthy and consistently produced white roots (Figure 1(control–A–D)). In contrast, nitrogen deficiency symptoms emerged by day 28, becoming more pronounced by day 60, as most leaves turned pale with only a few bluish-green veins remaining. The roots appeared light yellow-brown and showed noticeably slower growth (Figure 1(nN—A–D)). Phosphorus deficiency was evident after 24 days, initially causing yellowing in apical leaves. By day 34, interveinal chlorosis and uneven growth became visible, and symptoms intensified over time (Figure 1(nP—B)).
Potassium, calcium, and magnesium deficiencies produce distinct symptoms. Potassium deficiency began after 27 days, marked by pale yellow discoloration, spotting, upward curling, and eventually severe chlorosis with burnt patches and leaf rotting (Figure 1(nK—A–D)). Calcium deficiency appeared after 24 days as wilting of upper leaves, followed by necrosis, leaf drop, and complete root death by day 40 (Figure 1(nCa—A–C)). Magnesium deficiency developed later, around day 38, starting with basal leaf yellowing. By day 45, interveinal chlorosis appeared, followed by wrinkling and necrotic spots, although young leaves remained unaffected (Figure 1(nMg—A–E)).
Micronutrient deficiencies showed varying effects. Iron deficiency caused chlorosis in young leaves by day 40, progressing downward, while basal leaves stayed mostly green; apical leaves became pale and translucent, and roots turned pale brown (Figure 1(nFe—A–E)). Boron deficiency symptoms appeared within 18 days as glossy, light-colored apical leaves, eventually causing leaf thickening, brittleness, and necrosis of the growing tips (Figure 1(nB—A–C)). Zinc deficiency took longer to manifest (42 days), showing as scattered yellow patches and leaf deformation (Figure 1(nZn—A–D)). Copper deficiency caused mild yellowing in the upper leaves after 40 days, progressing to leaf wrinkling and mold development by day 80 (Figure 1(nCu—A–D)). Manganese deficiency appeared by day 18, with irregular midribs and asymmetrical upper leaves, followed by gradual drying and early leaf senescence (Figure 1(nMn—A–D)).

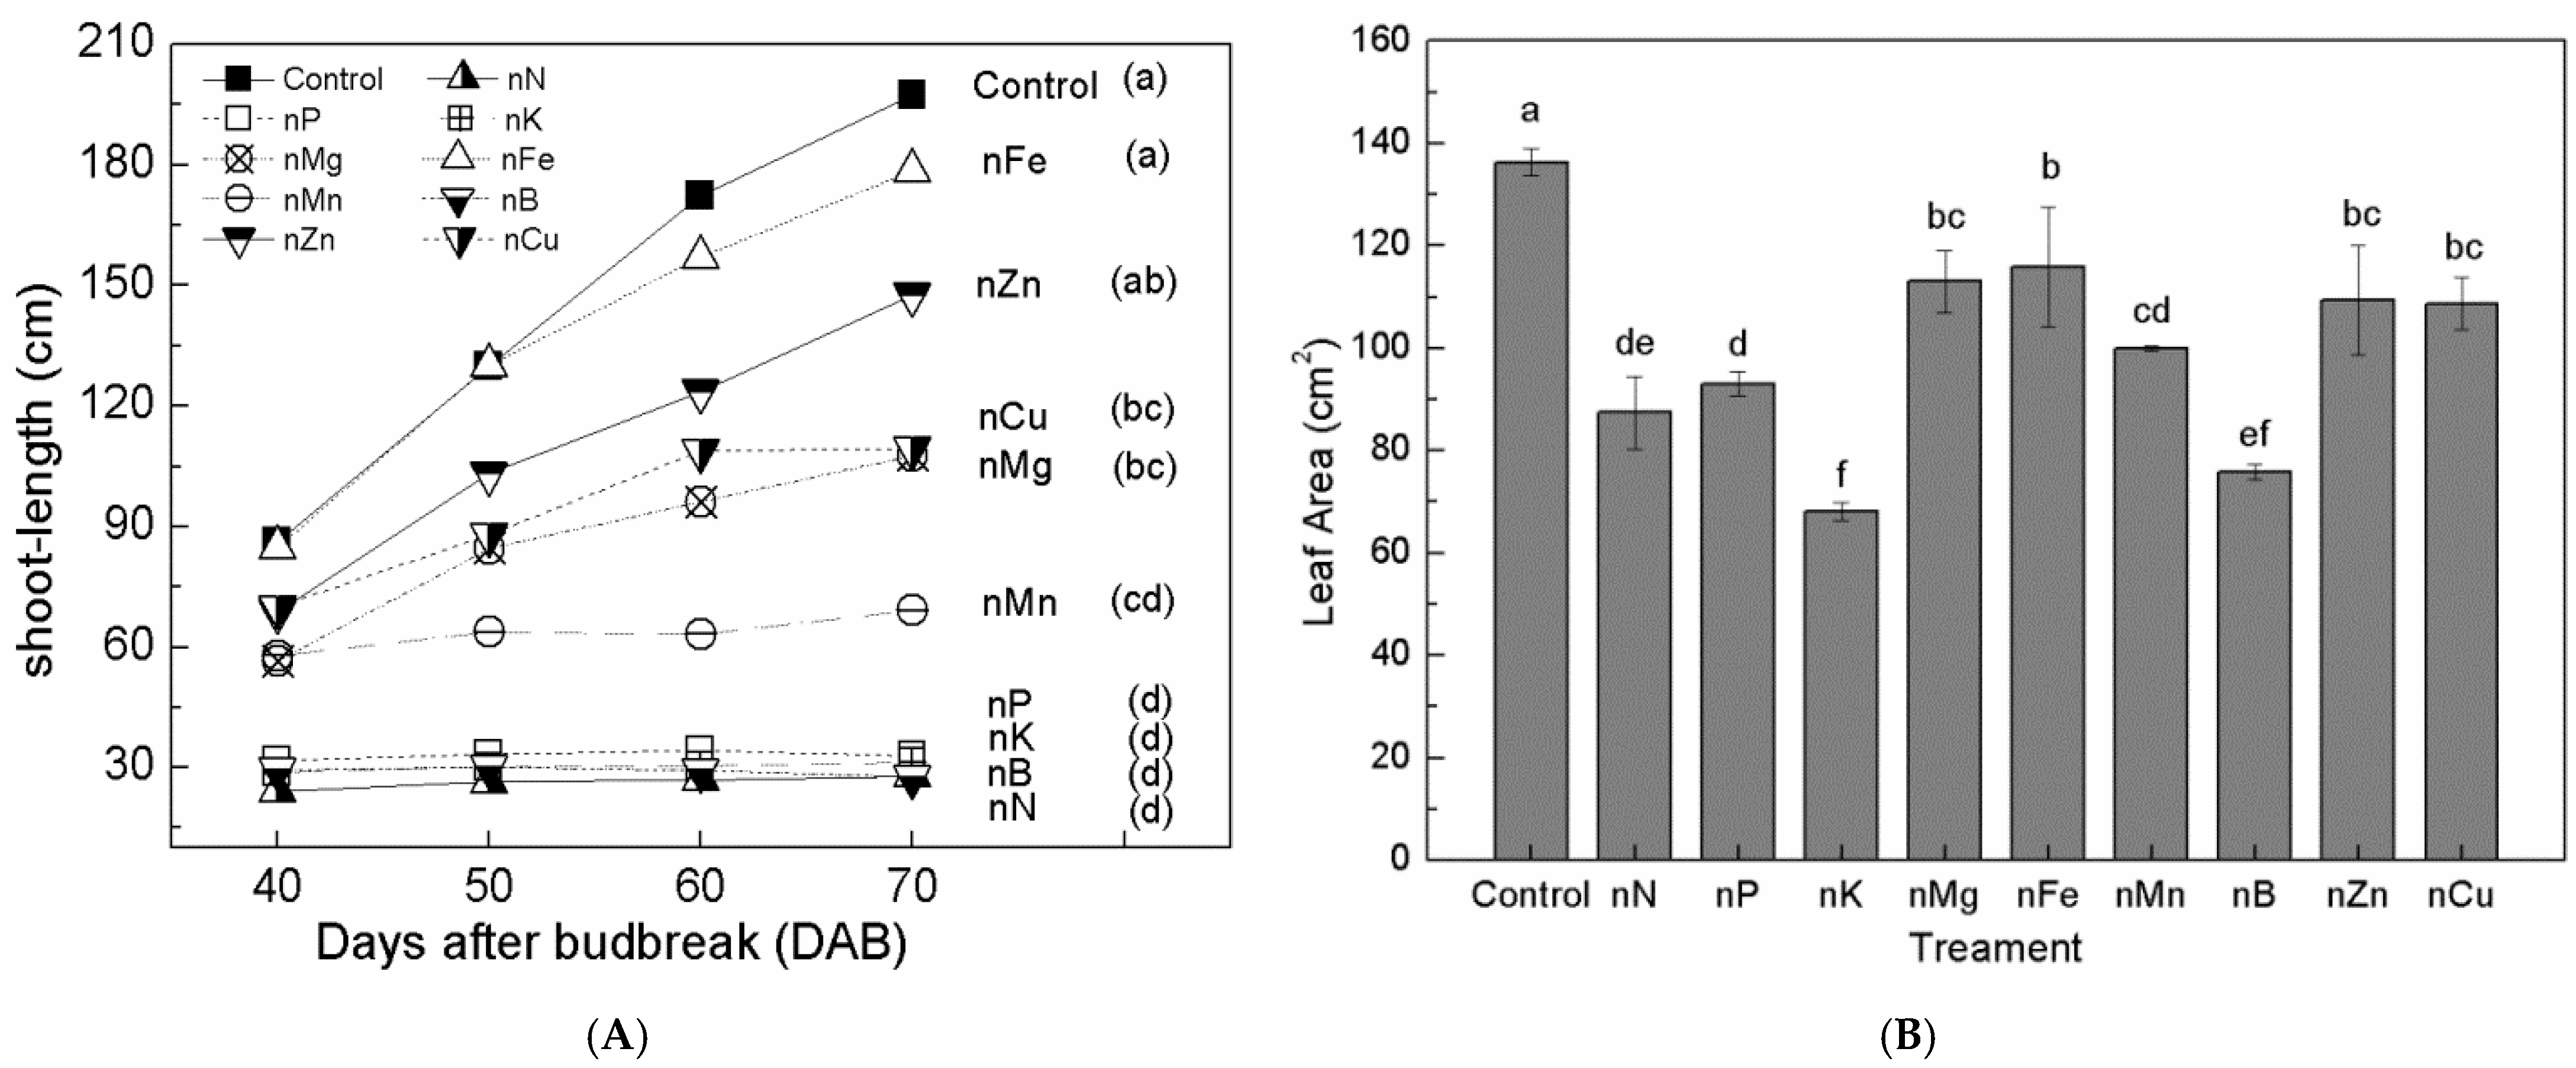
3.2. Effect of Nutrient Deficiency on Shoot Length

To evaluate the effect of nutrient deficiencies on shoot length, four out of six shoots per treatment were selected for measurement, excluding the most vigorous and the weakest shoots to ensure consistency. As shown in Figure 2A, shoot growth varied significantly across treatments. Under control conditions using Hoagland’s complete nutrient solution, grapevines exhibited the most vigorous growth, with shoot lengths reaching 86.0 ± 19.7 cm at 40 days and 197.3 ± 47.4 cm at 70 days. In Fe- and Zn-deficient treatments, shoot growth was only slightly reduced and remained statistically similar to the control, with average lengths of 109.4 ± 39.3 cm and 107.7 ± 66.3 cm at 70 days, respectively.
In contrast, deficiencies in Cu and Mn significantly reduced shoot length compared to the control. Deficiencies in phosphorus (P), potassium (K), and nitrogen (N)—three essential macronutrients—led to marked growth suppression, with little increase in shoot length between 40 and 70 days. Notably, boron (B), although a micronutrient, had a profound impact on vine growth. In B-deficient plants, shoot length was 29.4 ± 11.7 cm at 40 days and declined to 27.6 ± 12.4 cm at 70 days, as the shoot tips died and broke off. Mn deficiency also significantly reduced shoot growth, though to a lesser extent than for the N, P, K, and B deficiencies.

3.3. Effects of Nutritional Deficiency on the Leaf Area

Leaf area measurements were taken from three newly developed shoots of Thompson Seedless grapevines in each treatment group, 60 days after bud break. Overall, grape vines exposed to deficiencies in any of the nine essential nutrients exhibited smaller leaf areas compared to the control. Among these, deficiencies in nitrogen (N), phosphorus (P), potassium (K), and boron (B) had the most pronounced impact, significantly reducing both leaf area and shoot growth. Notably, leaf area decreased by up to 50% under K and B deficiency treatments relative to the control. Interestingly, vines grown under zinc (Zn) deficiency maintained a significantly larger leaf area than those under N, P, K, or B deficiencies. A common visual symptom associated with Zn deficiency was the appearance of “lobular disease” (Figure 2B).

3.4. Biomass of Leaves, Stems, and Roots of Thompson Seedless Plants

Root biomass in vines grown under iron (Fe), manganese (Mn), and zinc (Zn) deficiency did not differ significantly from the control (Figure 3A). In contrast, nitrogen (N) and copper (Cu) deficiencies led to a significant reduction in root biomass, though still higher than that observed under phosphorus (P), potassium (K), magnesium (Mg), and boron (B) deficiency treatments.
New shoot biomass was significantly reduced in N-, P-, K-, and B-deficient vines, consistent with the observed suppression in shoot elongation. In contrast, Fe- and Zn-deficient treatments maintained higher shoot biomass compared to other nutrient-deficient groups, though still lower than the control (Figure 3B).
A dry weight analysis of individual leaves under nutrient-deficient conditions revealed reductions across all treatments. The most severe declines occurred under K, P, and N deficiencies, while Zn deficiency had a comparatively smaller impact (Figure 3C). Leaves from B-deficient plants also showed reduced biomass, slightly less than that of N-, P-, and K-deficient plants. Fe-deficient leaves retained approximately 41.9% of the dry weight seen in the control, with fewer leaves and longer, thinner internodes observed. Notably, N-, P-, and Cu-deficient plants failed to produce secondary tips, whereas Zn-deficient plants developed more secondary tips, mainly concentrated in the upper shoots, forming clusters.

3.5. Effects of Nutrient Deficiency on Chlorophyll Content

In this study, grapevines cultivated in Hoagland’s complete nutrient solution exhibited significantly higher chlorophyll concentrations compared to those grown under nutrient-deficient conditions. Across all treatments, relative chlorophyll content declined progressively during plant development, with the most substantial reduction occurring in the final stage of maturation. This trend corresponded with the visible loss of green pigmentation in leaves around day 90, particularly under nitrogen (N) deficiency. Additionally, grapevines grown under phosphorus (P), potassium (K), and magnesium (Mg) deficiencies showed markedly lower chlorophyll levels than the control. Except for the N-deficient group, chlorophyll concentrations during the late growth stage were generally higher than in earlier stages, but still significantly lower than those observed in the control plants (Figure 4D).

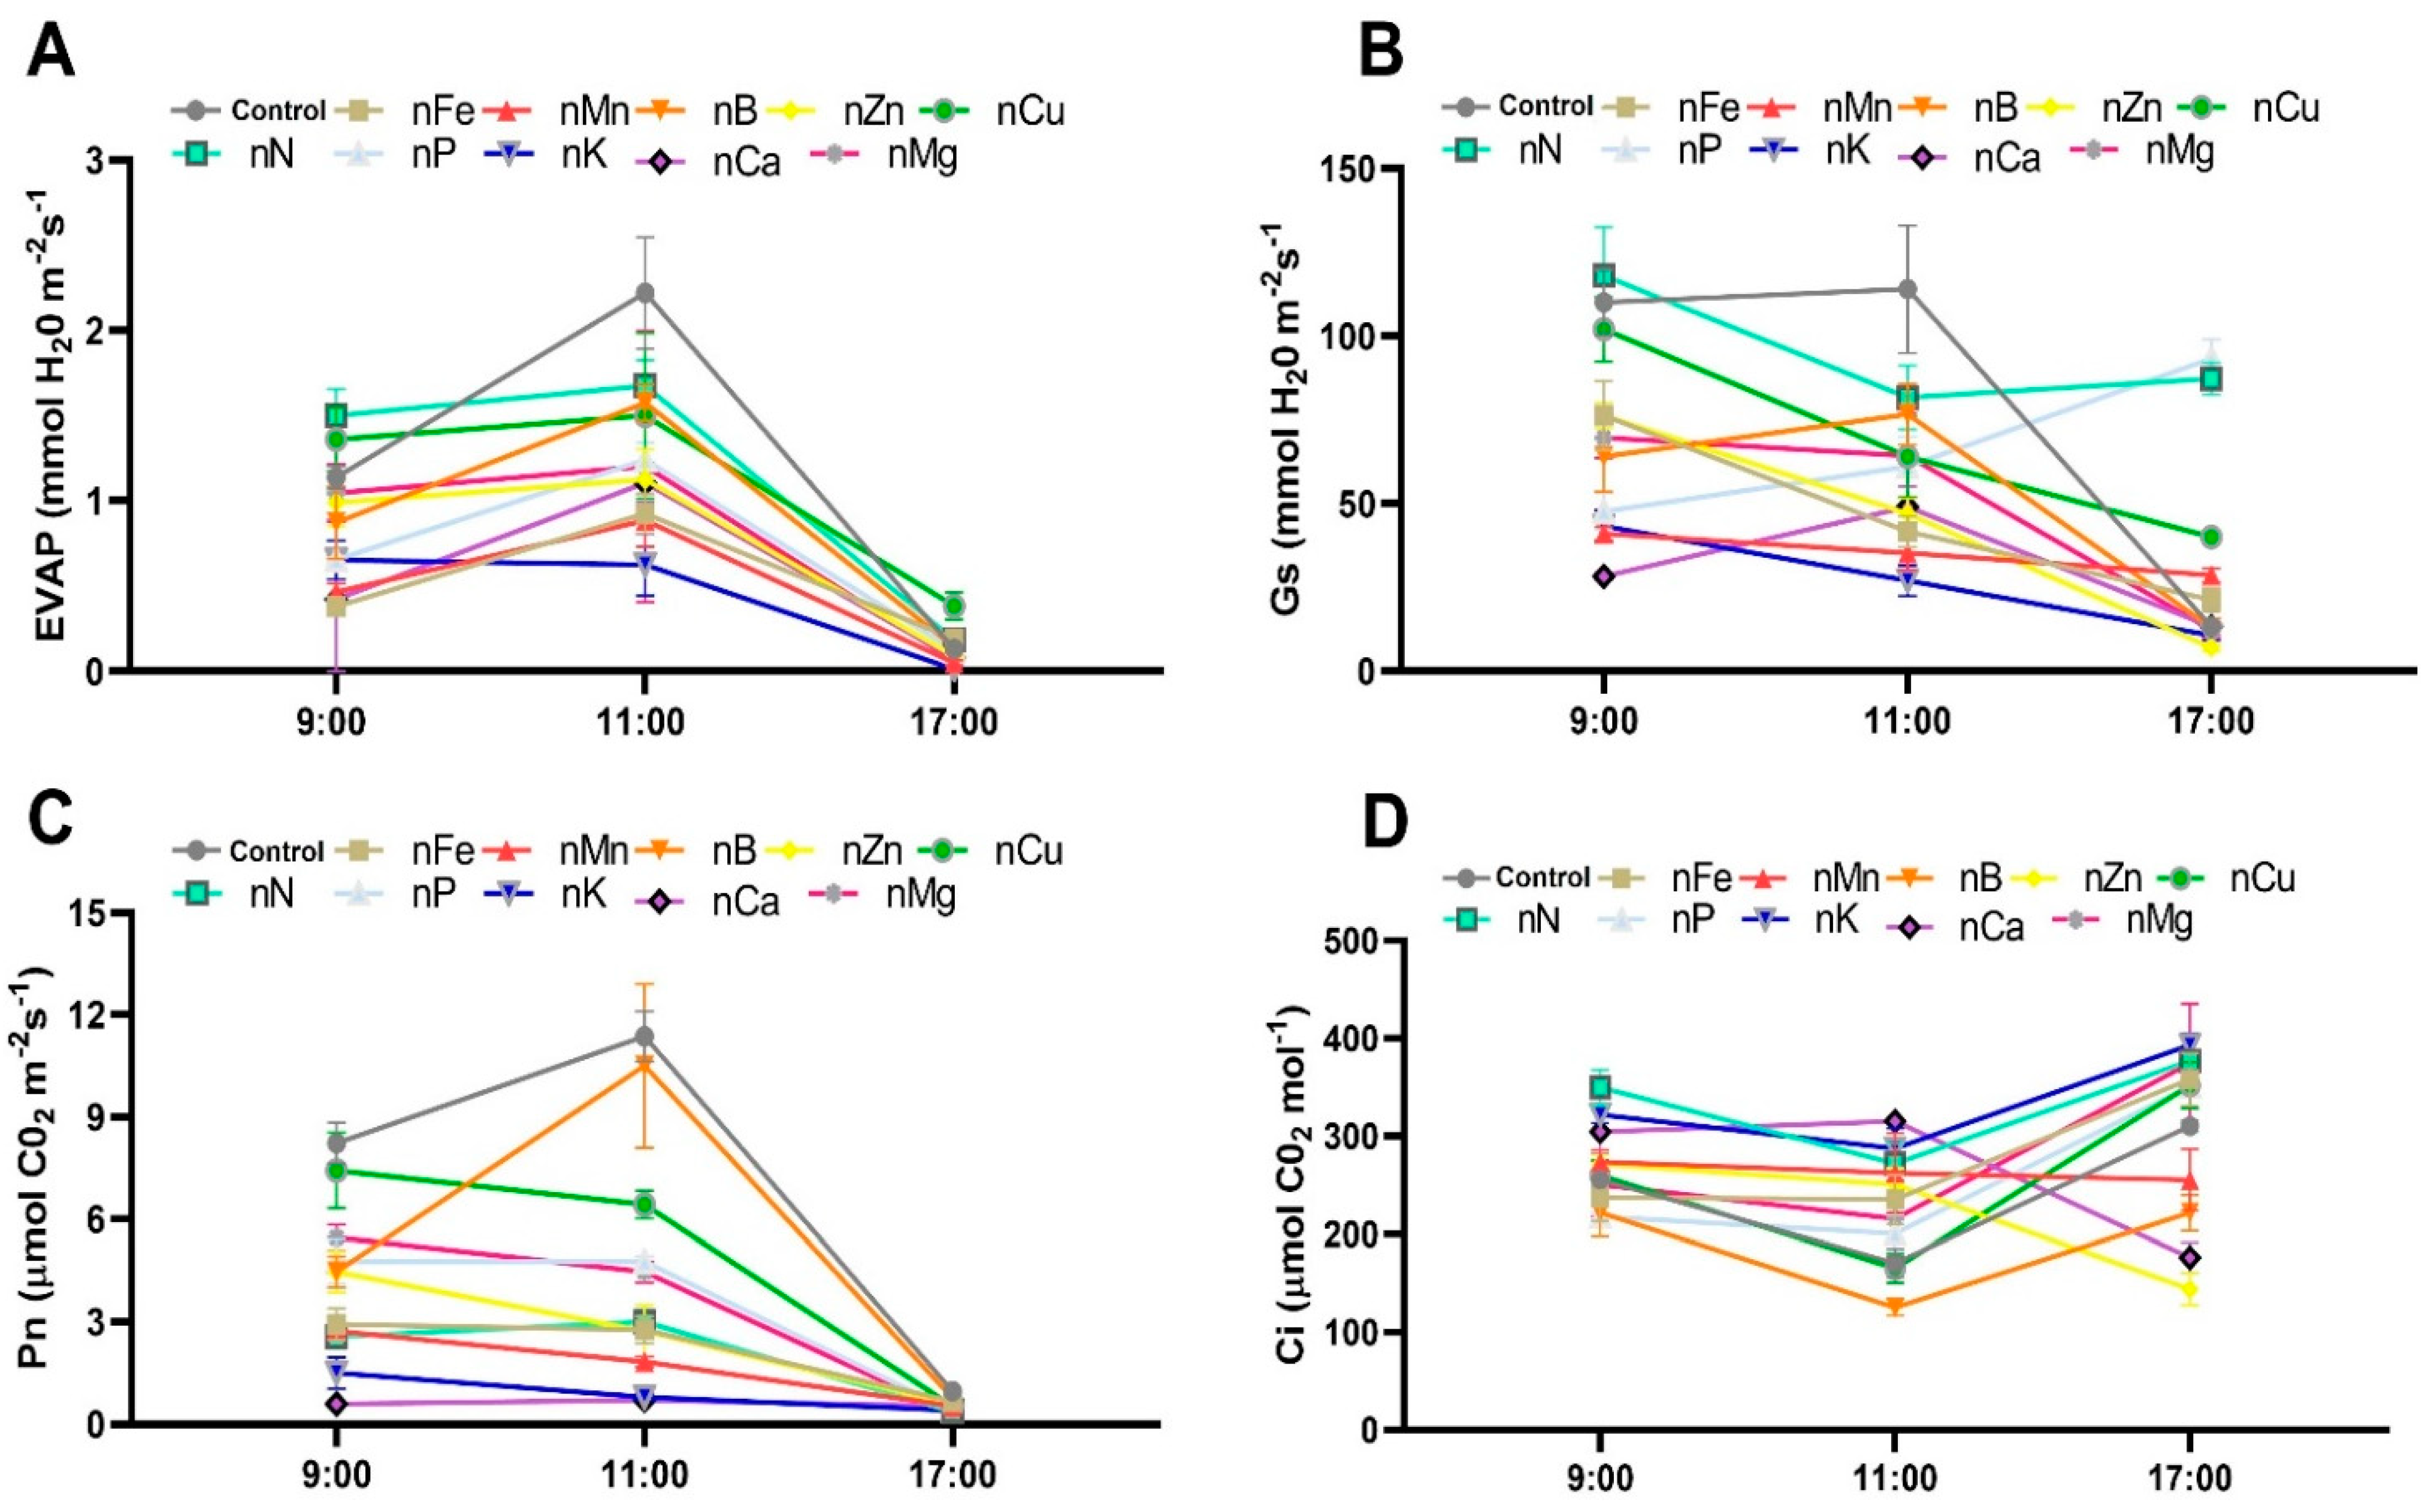
3.6. Effect of Nutritional Deficiency on Respiration

This study examined the gas exchange parameters of Thompson Seedless grapevines grown hydroponically under various nutrient deficiency conditions. Vines cultivated with the complete Hoagland nutrient solution (control) exhibited relatively high transpiration rates (EVAP) and stomatal conductance (Gs), peaking at 11:00 when the leaves were fully open. In contrast, grapevines subjected to potassium (K) deficiency showed significantly reduced transpiration and stomatal conductance (Figure 5A,B). Intercellular CO2 concentration (Ci) displayed an inverse relationship with EVAP and Gs throughout the study (Figure 5D). Among the treatments, the highest photosynthetic rates (Pn) were recorded in the control and boron (B)-deficient groups at multiple time points (9:00, 11:00, and 17:00). In comparison, grapevines grown under other nutrient deficiencies consistently exhibited lower photosynthetic activity, with the most severe reductions observed in K- and calcium (Ca)-deficient treatments (Figure 5C).

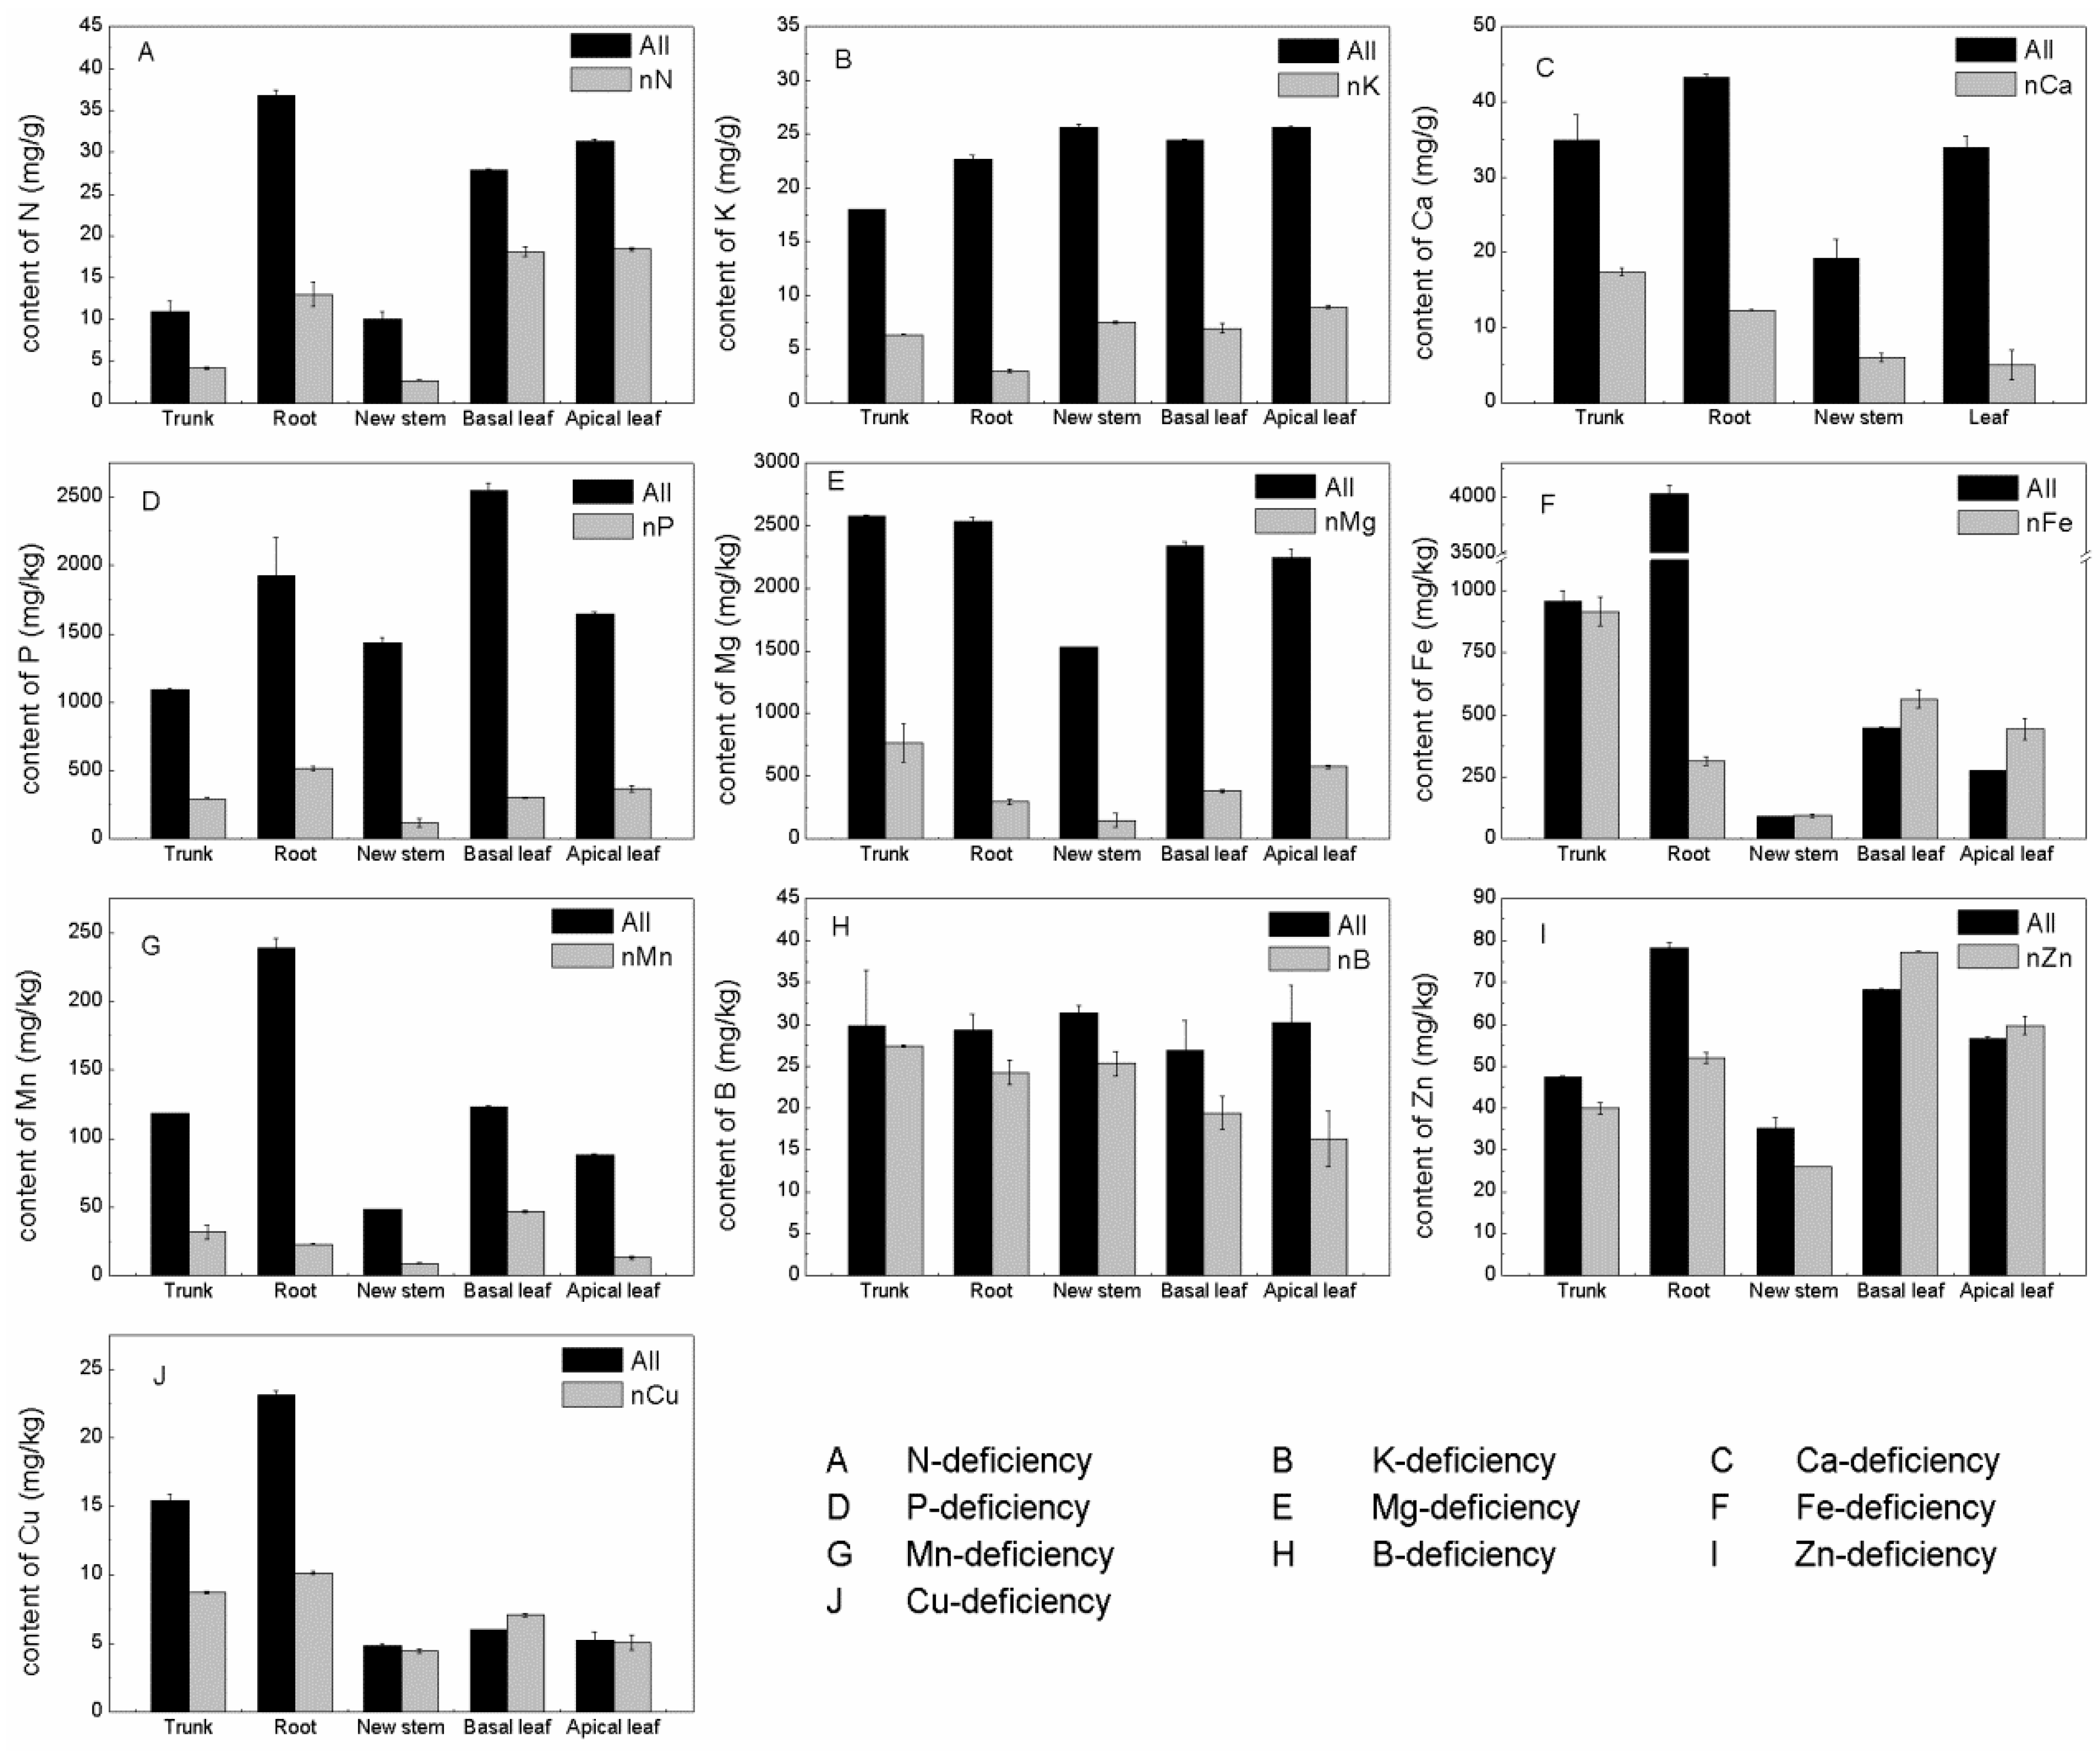
3.7. Effect of Nutrient Deficiency on the Mineral Content of Thompson Seedless

3.7.1. Effect of Nitrogen Deficiency

Nitrogen (N) content analysis revealed that grapevine roots had the highest N concentration, while its distribution in the shoots was more variable, with minimal differences between old and young leaves (Figure 6A). In N-deficient vines, the overall N content was significantly reduced compared to the control. However, the N levels in the leaves still exceeded those in the roots, suggesting the preferential allocation of nitrogen to leaf tissues under deficiency conditions.

3.7.2. Effect of Phosphorus Deficiency

All plant parts of P-deficient grapevines showed markedly lower phosphorus levels than those in the control. Under normal conditions, the highest P concentrations were found in old leaves, new leaves, roots, and trunks. In P-deficient vines, however, roots retained the highest P levels, while new shoots showed lower concentrations. Interestingly, young leaves contained more phosphorus than older leaves (Figure 6B).

3.7.3. Effect of Potassium Deficiency

In the control group, potassium (K) was uniformly distributed across all vine parts except the trunk, which had the lowest concentration. In contrast, all organs in K-deficient vines exhibited significantly reduced K levels compared to the control, with roots showing the lowest K concentration among all parts (Figure 6C).

3.7.4. Effect of Calcium Deficiency

Calcium (Ca) levels were significantly lower across all tissues in Ca-deficient grapevines compared to the control. The most pronounced reductions were observed in the leaves and new shoots, while trunks and roots maintained relatively higher Ca levels. This pattern suggests a potential loss of elasticity in developing organs due to calcium deficiency (Figure 6D).

3.7.5. Effect of Magnesium Deficiency

Magnesium (Mg) was generally evenly distributed throughout the vine, although new shoots had lower Mg content. In Mg-deficient plants, all tissues showed significantly reduced Mg levels compared to the control, with the lowest concentrations in young shoots. Notably, new leaves had higher Mg content than old leaves (Figure 6E). These results are consistent with visual symptoms, which began in older leaves and later progressed to younger tissues. Importantly, newly emerging leaves showed minimal or no visible signs of Mg deficiency (Figure 1(nMg—B–D)).

3.7.6. Effect of Iron Deficiency

Iron (Fe) was most concentrated in the root system under control conditions, with the lowest levels in new shoots. Under Fe deficiency, apical and basal leaves showed an unexpectedly high Fe content, while root concentrations dropped significantly. Despite this, typical deficiency symptoms were still present in the leaves, suggesting that the Fe present may have been in an inactive form. These findings imply that leaf Fe analysis alone may not reliably diagnose Fe deficiency (Figure 6F). No significant differences were observed in Fe concentrations in the shoots and trunks between the control and Fe-deficient vines.

3.7.7. Effect of Boron Deficiency

Boron (B) was evenly distributed throughout grapevine tissues under normal conditions, except for a slightly lower concentration in the trunk. In B-deficient vines, B levels were reduced in all parts compared to the control, with the sharpest decline occurring in new leaves. This reduction corresponds to the visible deficiency symptoms observed in young leaves (Figure 1(nB—A–D)).

3.7.8. Effect of Zinc Deficiency

Both apical and basal leaves, along with roots, maintained relatively high Zn concentrations in the control group. Under Zn deficiency, significant reductions were observed in trunks, roots, and shoots, while apical and basal leaves retained relatively high Zn levels (Figure 6I). Although Zn deficiency had minimal impact on overall plant growth, symptoms such as smaller apical leaves and uneven margins were still evident. This may be due to the vine’s relatively low Zn requirement during development.

3.7.9. Effect of Copper Deficiency

The copper (Cu) concentrations were highest in the roots, followed by the trunks, leaves, and shoots. Cu deficiency mainly affected the roots and trunks, where Cu levels dropped significantly compared to the control. However, Cu content in new shoots and apical leaves remained largely unaffected (Figure 6J).

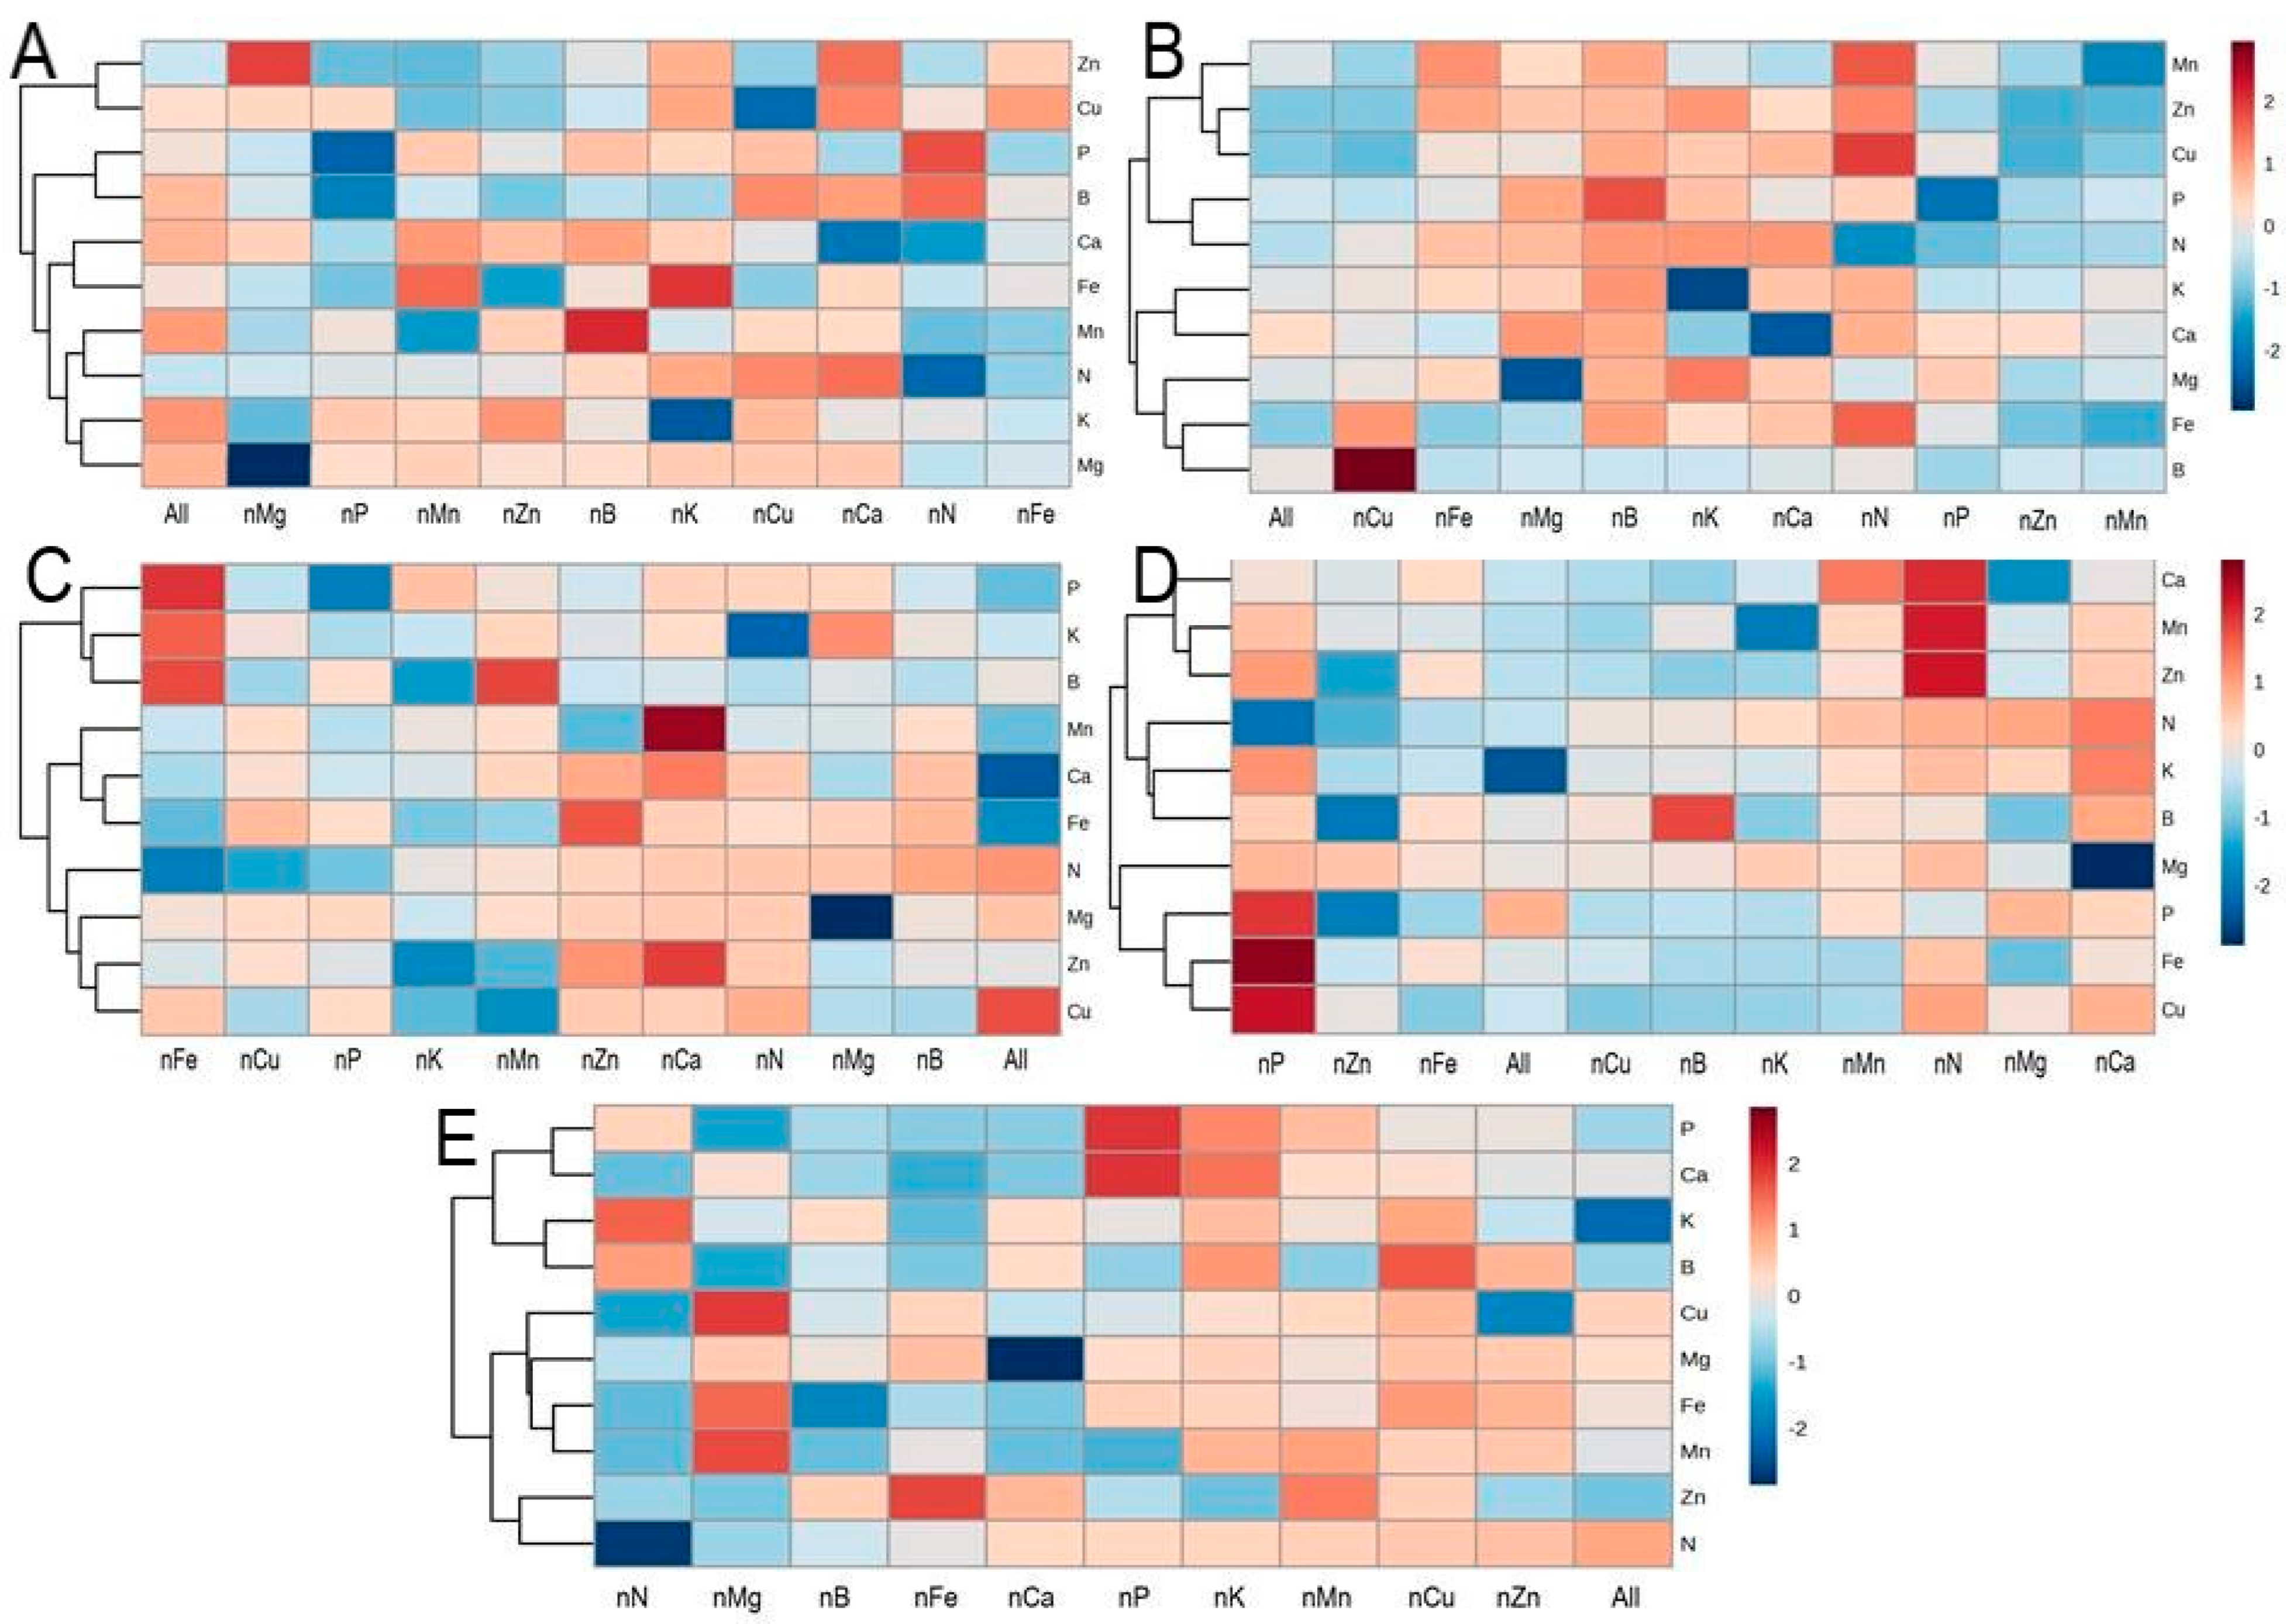
3.8. Hierarchical Cluster Analysis of Nutrient Deficit Elements

Nutrient accumulation patterns across different grapevine organs—stem, new shoot, old leaf, new leaf, and root—are illustrated in Figure 7A–E, respectively. Hierarchical cluster analysis was employed to categorize nutrient content, revealing the varied impact of nutritional deficiencies on macro- and micronutrient distribution within the plant. In most deficiency treatments, the concentrations of nitrogen (N), phosphorus (P), and potassium (K) were higher compared to the Hoagland control solution, except in the N, P, and K deficiency groups themselves. A reciprocal relationship between magnesium (Mg) and potassium (K) was observed throughout the plant.
In new leaves, nearly all nutrients—including N, K, Mg, Fe, Zn, and Cu—were found at lower concentrations under K deficiency, with the exception of phosphorus (P), manganese (Mn), and calcium (Ca), which remained relatively higher (Figure 7D). These imbalances corresponded with the visual symptoms seen in newly developed leaves under K deficiency (Figure 1, K-deficient A). In boron (B)-deficient vines, both copper (Cu) and boron levels were markedly reduced in the new leaves (Figure 7C). This comprehensive analysis highlights the complex and tissue-specific effects of nutrient deficiencies on the internal nutrient balance in grapevines.

4. Discussion

Grapes are economically important crops in China [18]. Like all plants, grapevines require specific macro- and micronutrients to optimize growth, development, yield, and quality [19]. According to Li’s research team [20], nutrients such as nitrogen (N), phosphorus (P), potassium (K), magnesium (Mg), boron (B), zinc (Zn), manganese (Mn), iron (Fe), and copper (Cu) are essential for vine health and cannot be substituted by other elements. These nutrients directly influence the physiological and metabolic processes that drive grapevine growth and productivity [21]. However, mineral nutrition imbalances are becoming a major challenge for global grape production. As a result, effective nutritional management has emerged as a cost-effective strategy to boost yields while minimizing inputs [22]. In this study, we explored the differential responses of Thompson Seedless grapevines to various nutrient deficiencies, focusing on leaf area, shoot length, chlorophyll content, net photosynthesis rate, and nutrient accumulation.
Essential nutrients are classified as macro- or micronutrients based on their concentration in plant dry matter [23]. Dry matter content serves as a critical indicator of nutrient status. Among these nutrients, N is particularly vital for organ formation, metabolism, fruit production, and fruit tree quality [24,25]. In our experiment, N deficiency significantly reduced dry matter in new shoots (Figure 3A) and leaves (Figure 3B), as well as shoot length (Figure 2A), in agreement with previous findings in barley [26]. Leaf dry weight declined under all deficiency treatments, with the most severe reductions observed under N, P, and K deficiencies. By contrast, Zn deficiency had a comparatively mild effect. It is also well established that roots typically have higher dry matter content than leaves [26]. Interestingly, although B-deficient vines showed shoot growth inhibition similar to N-, P-, and K-deficient vines, the reduction in leaf dry weight was less pronounced. This matches findings by Han et al. [13], who reported that B deficiency in citrus reduced dry matter and growth but increased leaf thickness and weight.
Under complete Hoagland nutrient solution, grapevines displayed vigorous growth, with rapid shoot elongation and deep green mature leaves (Figure 1, control A–C). No deficiency symptoms appeared during the three months, and the root system remained healthy with continuous white root formation (Figure 1, control D). Numerous studies have shown that deficiencies in Mn, K, Mo, N, Mg, and Ca reduce photosynthetic capacity. Nutrients like N, S, Mg, Mn, Fe, and Cu directly or indirectly contribute to chlorophyll biosynthesis [27]. For instance, Fageria and their coworkers observed that B, Mn, molybdenum, and Cu deficiencies impaired chloroplast development, lowered chlorophyll levels, and reduced amino acid synthesis in maize [28].
In our study, N deficiency had the most substantial impact on chlorophyll content, reducing it to the lowest levels observed among all treatments (Figure 4A). N-deficient leaves and roots turned yellow-brown (Figure 1(nN–A–D)), consistent with earlier findings that link N deficiency with reduced net photosynthesis, chlorophyll levels, and biomass [29,30,31]. Nitrogen uptake is also highly water-dependent, as it is transported in dissolved form [32,33]. Chlorophyll distribution patterns varied by nutrient type: N deficiency caused uniform chlorophyll loss, Mg deficiency caused interveinal chlorosis, and K deficiency reduced chlorophyll density along leaf margins [27].
Photosynthetic efficiency is a key physiological marker of plant growth, biomass production, and yield potential [34,35]. The net photosynthesis rate (Pn), intercellular CO2 concentration, transpiration, and stomatal conductance were all significantly affected by nutrient availability (Figure 5). The highest Pn values were observed in the control and B-deficient treatments. In contrast, K deficiency led to a notable decline in photosynthetic activity and transpiration, along with reduced stomatal conductance and increased intercellular CO2 levels. These findings are consistent with previous research linking K deficiency to reduced photosynthetic rates [36,37,38,39,40].
Our results also highlighted nutrient interaction effects. For example, N concentrations were elevated in the stem and new shoots under Ca deficiency, a trend also noted by Garza-Alonso et al. [41]. We observed significant changes in K and Mg accumulation under respective deficiency conditions (Supplementary Table S1), supporting previous reports of K–Mg ion competition [42]. This interaction has been documented in several crops, including lemongrass [43] and sugarcane [44]. Guo et al. [45] proposed that K+ competes with Mg2+ for apoplastic binding sites and transporters, potentially explaining the elevated K levels in stems, leaves, and roots under Mg deficiency. In B-deficient grapevines, leaf necrosis and yellowing were likely due to sharply reduced concentrations of all nutrients in the new leaves, except B (Figure 7D).
Distinct visual symptoms, physiological changes, and mineral imbalances were observed in grapevines subjected to different nutrient deficiencies. Deficiencies in N, K, Ca, Mg, Fe, and B resulted in clear leaf symptoms, enabling preliminary visual diagnosis. N, P, K, Ca, Mn, and B deficiencies also significantly reduced shoot growth. In these cases, nutrient content in the leaves was consistently lower than in control plants, supporting the use of leaf analysis as a diagnostic tool. However, for Fe, Zn, and Cu deficiencies, leaf nutrient levels did not reliably reflect the plant’s nutritional status. In such cases, root tissue analysis is recommended for accurate diagnosis.

5. Conclusions

One-year-old grapevines grown hydroponically exhibited clear visual deficiency symptoms in response to the absence of specific essential elements, particularly nitrogen, phosphorus, potassium, calcium, magnesium, iron, and boron. Among these, deficiencies in N, P, K, B, and Mg not only caused visible symptoms, but also significantly reduced biomass across plant organs and led to a marked decrease in shoot length. Nitrogen deficiency, in particular, resulted in a substantial decline in chlorophyll content. Additionally, the absence of certain nutrients triggered complex antagonistic and synergistic interactions, altering the accumulation patterns of other ions within plant tissues. These findings highlight the intricate nutrient dynamics in grapevines and emphasize the importance of balanced mineral nutrition to support healthy growth, physiological function, and the accurate diagnosis of nutrient deficiencies.

Supplementary Materials

The following supporting information can be downloaded at: https://www.mdpi.com/article/10.3390/horticulturae11050543/s1, Table S1: Changes of nutritional composition in different parts of Thompson Seedless vine under different deficiency applications.

Author Contributions

L.W., H.U.J., and S.W. conceived the project and designed the experiments. M.Z. performed most of the experiments. J.H., J.S., and L.L. assisted in the experiment and analysis. H.U.J. wrote the article, and F.H. reviewed it. All authors have read and agreed to the published version of the manuscript.

Funding

We gratefully acknowledge the following agencies for funding this research article: (1) Ningbo Science and Technology Development Special Fund (2024S018). (2) Fujian Province Science and Technology Plan Project (2024S0051). (3) China Agriculture Research System (CARS-29-zp-7).

Data Availability Statement

All of the data are represented in the form of tables and figures. Raw data can be provided on request.

Conflicts of Interest

The authors declare no conflicts of interest.

Abbreviations

NNitrogen
PPhosphorus
KPotassium
CaCalcium
MgMagnesium
FeIron
MnManganese
BBoron
ZnZinc
CuCopper
SPADSoil Plant Analysis Development
RCBDRandomized Complete Block Design
MoMolybdenum
NiNickel
ClChloride
ppmParts Per Million

References

  1. Dobermann, A.; Bruulsema, T.; Cakmak, I.; Gerard, B.; Majumdar, K.; McLaughlin, M.; Reidsma, P.; Vanlauwe, B.; Wollenberg, L.; Zhang, F.; et al. Responsible Plant Nutrition: A New Paradigm to Support Food System Transformation. Glob. Food Secur. 2022, 33, 100636. [Google Scholar] [CrossRef]
  2. Nath, M.; Tuteja, N. NPKS Uptake, Sensing, and Signaling and MiRNAs in Plant Nutrient Stress. Protoplasma 2016, 253, 767–786. [Google Scholar] [CrossRef]
  3. Kumar, S.; Kumar, S.; Mohapatra, T. Interaction Between Macro- and Micro-Nutrients in Plants. Front. Plant Sci. 2021, 12, 665583. [Google Scholar] [CrossRef] [PubMed]
  4. Bernstein, N.; Gorelick, J.; Zerahia, R.; Koch, S. Impact of N, P, K, and Humic Acid Supplementation on the Chemical Profile of Medical Cannabis (Cannabis sativa L). Front. Plant Sci. 2019, 10, 736. [Google Scholar] [CrossRef] [PubMed]
  5. Sun, J.; Luo, H.; Jiang, Y.; Wang, L.; Xiao, C.; Weng, L. Influence of Nutrient (NPK) Factors on Growth, and Pharmacodynamic Component Biosynthesis of Atractylodes Chinensis: An Insight on Acetyl-CoA Carboxylase (ACC), Reductase (HMGR), and Farnesyl Pyrophosphate Synthase (FPPS) Signaling Responses. Front. Plant Sci. 2022, 13, 799201. [Google Scholar] [CrossRef]
  6. Mu, X.; Chen, Y. The Physiological Response of Photosynthesis to Nitrogen Deficiency. Plant Physiol. Biochem. 2021, 158, 76–82. [Google Scholar] [CrossRef]
  7. Reddy, P.R.V.; Aski, M.S.; Prakash, G.; Id, M.; Id, K.D.; Singh, A.; Id, R.P.; Singh, M.P. Genetic Variation for Root Architectural Traits in Response to Phosphorus Deficiency in Mungbean at the Seedling Stage. PLoS ONE 2020, 15, e0221008. [Google Scholar] [CrossRef]
  8. Grechi, I.; Vivin, P.; Hilbert, G.; Milin, S.; Robert, T.; Gaudill, J. Effect of Light and Nitrogen Supply on Internal C: N Balance and Control of Root-to-Shoot Biomass Allocation in Grapevine. Environ. Exp. Bot. 2007, 59, 139–149. [Google Scholar] [CrossRef]
  9. Terra, M.M.; Brasil Sobrinho, M.O.C.; Pires, E.J.P.; Nagai, V. Six years of NPK fertilizer experimentation with grapevine cultivar Niagara rosada, growing in a podzol soil, in Indaiatuba, SP, Brazil. Acta Hortic. 2000, 526, 235–240. [Google Scholar] [CrossRef]
  10. Frost, S.; Lerno, L.A.; Zweigenbaum, J.; Heymann, H.; Ebeler, S.E. Characterization of Red Wine Proanthocyanidins Using a Putative Proanthocyanidin Database, Amide Hydrophilic Interaction Liquid Chromatography (HILIC), and Time-of-Flight Mass Spectrometry. Molecules 2018, 23, 2687. [Google Scholar] [CrossRef]
  11. Zhao, D.; Oosterhuis, D.M. Cotton Growth and Physiological Responses to Boron Deficiency. J. Plant Nutr. 2003, 26, 855–867. [Google Scholar] [CrossRef]
  12. Singh, P.; Misra, A.; Srivastava, N. Influence of Mn Deficiency on Growth, Chlorophyll Content, Physiology, and Essential Monoterpene Oil(s) in Genotypes of Spearmint (Mentha spicata L.). Photosynthetica 2001, 39, 473–476. [Google Scholar] [CrossRef]
  13. Han, S.; Chen, L.; Jiang, H.; Smith, B.R.; Yang, L.; Xie, C. Boron Deficiency Decreases Growth and Photosynthesis, and Increases Starch and Hexoses in Leaves of Citrus Seedlings. J. Plant Physiol. 2008, 165, 1331–1341. [Google Scholar] [CrossRef]
  14. Zhao, Z.; Chu, C.; Zhou, D.; Sha, Z.; Wu, S. Soil Nutrient Status and the Relation with Planting Area, Planting Age and Grape Varieties in Urban Vineyards in Shanghai. Heliyon 2019, 5, e02362. [Google Scholar] [CrossRef] [PubMed]
  15. Balamurugan, M.; Kalaiarasi, K.; Shanmugam, J.; Dhairiyasamy, R. Comparative Analysis of Spectroradiometric and Chemical Methods for Nutrient Detection in Black Gram Leaves. Results Eng. 2024, 24, 103065. [Google Scholar] [CrossRef]
  16. Hoagland, D.R.; Arnon, D.I. The Water-Culture Method for Growing Plants Without Soil. California Agricultural Ecperiment Station, Circular-347. 1950. Available online: https://www.cabidigitallibrary.org/doi/full/10.5555/19500302257 (accessed on 20 March 2025).
  17. Powlson, D.S.; Prookes, P.C.; Christensen, B.T. Measurement of Soil Microbial Biomass Provides an Early Indication of Changes in Total Soil Organic Matter Due to Straw Incorporation. Soil. Biol. Biochem. 1987, 19, 159–164. [Google Scholar] [CrossRef]
  18. Mu, W.; Gong, S.; Stankovski, S.; Zhang, X.; Kanianska, R.; Feng, J. WebGIS-Based Suitability Evaluation System for Chinese Table Grape Production. Comput. Electron. Agric. 2019, 165, 104945. [Google Scholar] [CrossRef]
  19. Fan, X.; Zhou, X.; Chen, H.; Tang, M.; Xie, X. Cross-Talks Between Macro- and Micronutrient Uptake and Signaling in Plants. Front. Plant Sci. 2021, 12, 663477. [Google Scholar] [CrossRef] [PubMed]
  20. Li, J.; Wang, L.; Javed, H.U.; Zahid, M.S.; Wu, Z.; Ma, C.; Jiu, S.; Xu, W.; Zhang, C.; Wang, S. Nutrient Solution with High Nitrogen Content, a Suitable Facilitator of Growth and Berry Quality in Hydroponic ‘Shine Muscat’ Grapevine (Vitis vinifera × V. Labrusca). Sci. Hortic. 2023, 310, 111749. [Google Scholar] [CrossRef]
  21. Zareei, E.; Javadi, T.; Aryal, R. Biochemical Composition and Antioxidant Activity Affected by Spraying Potassium Sulfate in Black Grape (Vitis vinifera L. Cv. Rasha). J. Sci. Food Agric. 2018, 98, 5632–5638. [Google Scholar] [CrossRef]
  22. Veazie, P.; Cockson, P.; Henry, J.; Perkins-veazie, P.; Whipker, B. Characterization of Nutrient Disorders and Impacts on Chlorophyll and Anthocyanin Concentration of Brassica Rapa Var. Chinensis. Agronomy 2020, 10, 461. [Google Scholar] [CrossRef]
  23. de Bang, T.C.; Husted, S.; Laursen, K.H.; Persson, D.P.; Schjoerring, J.K. The Molecular–Physiological Functions of Mineral Macronutrients and Their Consequences for Deficiency Symptoms in Plants. New Phytol. 2021, 229, 2446–2469. [Google Scholar] [CrossRef] [PubMed]
  24. Liu, L.; Peng, F.; Wang, X. Effect of Bag-Controlled Release Fertelizer on Nitrogen Utilization Rate, Growth and Fruiting of the ‘Fuji ’Apple. J. Plant Nutr. 2010, 33, 1904–1913. [Google Scholar] [CrossRef]
  25. Bai, L.; Deng, H.; Zhang, X.; Yu, X.; Li, Y. Gibberellin Is Involved in Inhibition of Cucumber Growth and Nitrogen Uptake at Suboptimal Root-Zone Temperatures. PLoS ONE 2016, 5, 0156188. [Google Scholar] [CrossRef]
  26. Cai, J.; Jiang, D.; Wollenweber, B.; Dai, T.; Cao, W. Effects of Nitrogen Application Rate on Dry Matter Redistribution, Grain Yield, Nitrogen Use Efficiency and Photosynthesis in Malting Barley. Acta Agric. Scand. B Soil. Plant Sci. 2012, 62, 410–419. [Google Scholar] [CrossRef]
  27. Ye, J.Y.; Tian, W.H.; Jin, C.W. Nitrogen in Plants: From Nutrition to the Modulation of Abiotic Stress Adaptation. Stress Biol. 2022, 2, 4. [Google Scholar] [CrossRef]
  28. Fageria, N.K.; Baligar, V.C.; Clark, R.B. Micronutrients in Crop Production. In Advances in Agronomy; Sparks, D.L., Ed.; Academic Press: Cambridge, MA, USA, 2002; pp. 185–268. [Google Scholar] [CrossRef]
  29. Wang, Q.; Liu, C.-H.; Huang, D.; Dong, Q.-L.; Li, P.-M.; van Nocker, S.; Ma, F.-W. Physiological Evaluation of Nitrogen Use Efficiency of Different Apple Cultivars under Various Nitrogen and Water Supply Conditions. J. Integr. Agric. 2020, 19, 709–720. [Google Scholar] [CrossRef]
  30. Jia, Z.; Giehl, R.F.H.; Meyer, R.C.; Altmann, T.; von Wirén, N. Natural Variation of BSK3 Tunes Brassinosteroid Signaling to Regulate Root Foraging under Low Nitrogen. Nat. Commun. 2019, 10, 2378. [Google Scholar] [CrossRef]
  31. Hu, B.; Jiang, Z.; Wang, W.; Qiu, Y.; Zhang, Z.; Liu, Y.; Li, A.; Gao, X.; Liu, L.; Qian, Y.; et al. Nitrate–NRT1.1B–SPX4 Cascade Integrates Nitrogen and Phosphorus Signalling Networks in Plants. Nat. Plants 2019, 5, 401–413. [Google Scholar] [CrossRef]
  32. Rennenberg, H.; Loreto, F.; Polle, A.; Brilli, F.; Fares, S.; Beniwal, R.S.; Gessler, A. Physiological Responses of Forest Trees to Heat and Drought. Plant Biol. 2006, 8, 556–571. [Google Scholar] [CrossRef]
  33. Xia, H.; Xu, T.; Zhang, J.; Shen, K.; Li, Z. Drought-Induced Responses of Nitrogen Metabolism in Ipomoea Batatas. Plants 2020, 9, 1341. [Google Scholar] [CrossRef] [PubMed]
  34. Kalaji, H.M.; Bosa, K.; Ko, J.; Zuk-gołaszewska, K. Effects of Salt Stress on Photosystem II Efficiency and CO2 Assimilation of Two Syrian Barley Landraces. Environ. Exp. Bot. 2011, 73, 64–72. [Google Scholar] [CrossRef]
  35. Kalaji, M.H.; Pietkiewicz, S. Review: Some Physiological Indices to Be Exploited as a Crucial Tool in Plant Breeding. Plant Breed. Seed Sci. 2004, 49, 19–39. [Google Scholar]
  36. Liu, B.H.; Cheng, L.; Liang, D.; Zou, Y.J.; Ma, F.W. Growth, Gas Exchange, Water-Use Efficiency, and Carbon Isotope Composition of ‘Gale Gala’ Apple Trees Grafted onto 9 Wild Chinese Rootstocks in Response to Drought Stress. Photosynthetica 2012, 50, 401–410. [Google Scholar] [CrossRef]
  37. Bottrill, D.E.; Possingham, J.V.; Kriedemann, P.E. The effect of nutrient deficiencies on photosynthesis and respiration in spinach. Plant Soil. 1970, 32, 424–438. [Google Scholar] [CrossRef]
  38. Humble, G.D.; Raschke, K. Stomatal Opening Quantitatively Related to Potassium Transport: Evidence from Electron Probe Analysis. Plant Physiol. 1971, 48, 447–453. [Google Scholar] [CrossRef] [PubMed]
  39. Marschner, H. High Light Intensity Enhances Chlorosis and Necrosis in Leaves of Zinc, Potassium, and Magnesium Deficient Bean (Phaseolus vulgaris) Plants. J. Plant Physiol. 1989, 134, 308–315. [Google Scholar] [CrossRef]
  40. Peoples, T.R.; Koch, D.W. Role of Potassium in Carbon Dioxide Assimilation in Medicago sativa L. Plant Physiol. 1979, 63, 878–881. [Google Scholar] [CrossRef]
  41. Garza-Alonso, C.A.; Olivares-Sáenz, E.; Gutiérrez-Díez, A.; Vázquez-Alvarado, R.E.; López-Jiménez, A. Visual Symptoms, Vegetative Growth, and Mineral Concentration in Fig Tree (Ficus carica L.) under Macronutrient Deficiencies. Agronomy 2019, 9, 787. [Google Scholar] [CrossRef]
  42. Farhat, N.; Elkhouni, A.; Zorrig, W.; Smaoui, A.; Abdelly, C.; Rabhi, M. Effects of Magnesium Deficiency on Photosynthesis and Carbohydrate Partitioning. Acta Physiol. Plant 2016, 38, 145. [Google Scholar] [CrossRef]
  43. Lima, T.C.; Freitas, M.S.M.; Mendonça, L.V.P.; de Souza Gonçalves, Y.; Pereira, J.A.P.; Lima, K.F. Visual Symptoms of Macronutrient and Boron Deficiency in Cymbopogon citratus. J. Plant Nutr. 2019, 42, 1430–1438. [Google Scholar] [CrossRef]
  44. Rhodes, R.; Miles, N.; Hughes, J.C. Interactions between Potassium, Calcium and Magnesium in Sugarcane Grown on Two Contrasting Soils in South Africa. Field Crops Res. 2018, 223, 1–11. [Google Scholar] [CrossRef]
  45. Guo, W.; Nazim, H.; Liang, Z.; Yang, D. Magnesium Deficiency in Plants: An Urgent Problem. Crop J. 2016, 4, 83–91. [Google Scholar] [CrossRef]
Figure 1. Visual symptoms of leaves and roots of Thompson Seedless grapevine cultivated in nutrient solution. Treatments include Control (all nutrients; (AC) leaves; (D) roots), nN (nitrogen; (AC) leaves; (D) roots), nP (phosphorus; (AD) leaves; (E) roots), nK (potassium; (AE) leaves; (F) roots), nCa (calcium; (A,B) leaves; (C) roots), nMg (magnesium; (AD) leaves; (E) roots), nFe (iron; (AD) leaves; (E) roots), nB (boron; (AD) leaves; (E,F) roots), nZn (zinc; (AD) leaves; (E) roots), nCu (copper; (AE) leaves; (F) roots), and nMn (manganese; (AD) leaves; (E) roots) deficiencies.
Horticulturae 11 00543 g001
Figure 2. Effect of nutrient deficiency on shoot length of Thompson seedless (A); Effect of nutrient deficiency on leaf area of Thompson seedless (B). Replicates (n = 3) with 6 plants per replicate, different small letters (a–f) indicate statistically significant differences between treatments at p < 0.05 based on post hoc Tukey’s test, and data presented as mean ± standard deviation (SD).
Horticulturae 11 00543 g002
Figure 3. Effects of nutrient deficiency culture on dry weight of Thompson Seedless roots (A), new shoots (B), and leaves (C). Replicates (n = 3) with 6 plants per replicate, different small letters (a–f) indicate statistically significant differences between treatments at p < 0.05 based on post hoc Tukey’s test;, and data presented as mean ± standard deviation (SD).
Horticulturae 11 00543 g003
Figure 4. Effect of Nutritional deficiency on chlorophyll content in Thompson Seedless grape leaves at 40 (A), 60 (B), and 90 days (C) after bud break; time period (D). Replicates (n = 3) with 6 plants per replicate, different small letters (a–e) indicate statistically significant differences between treatments at p < 0.05 based on post hoc Tukey’s test;, and data presented as mean ± standard deviation (SD).
Horticulturae 11 00543 g004
Figure 5. Effect of nutritional deficiency on the respiration rate of Thompson Seedless white grape leaves. Measurements of (A) evapotranspiration (EVAP), (B) stomatal conductance (Gs), (C) net photosynthesis (Pn), and (D) intercellular CO2 concentration (Ci) were taken at 9:00, 11:00, and 17:00 under control and nutrient-deficient conditions. Replicates (n = 3) with 6 plants per replicate, significance at p < 0.05, and data presented as standard deviation (SD).
Horticulturae 11 00543 g005
Figure 6. Effect of nutrient deficiency on the nutrient element of different parts of Thompson Seedless. Replicates (n = 3) with 6 plants per replicate, significance at p < 0.05, and data presented as standard deviation (SD).
Horticulturae 11 00543 g006
Figure 7. Hierarchical cluster analysis of deficit nutritional elements on stem (A), new shoot (B), new leaf (C), old leaf (D), and root (E).
Horticulturae 11 00543 g007
Table 1. Preparation and calculation of nutrient solutions (mg/L) based on different elements used for the cultivation of Thompson seedless grapes.
Treatmentsmg/LNPKCaMgFeMnBZnCu
ControlApplied 21031234160482.80.50.50.050.02
Measured 192.631.5249.1133.245.42.60.460.410.0490.021
N-deficientApplied 031234160482.80.50.50.050.02
Applied −0.1035.1264.6118.344.32.90.530.480.0410.028
P-deficientApplied 2100234160482.80.50.50.050.02
Measured 220.5−1.1241.0165.145.22.70.470.470.0550.026
K-deficientApplied210310160482.80.50.50.050.02
Measured204.633.51.6139.145.22.50.500.460.060.028
Ca-deficientApplied 210312340482.80.50.50.050.02
Measured205.035.3227.8−1.7643.22.90.490.490.0410.022
Mg-deficientApplied 2103123416002.80.50.50.050.02
Measured 207.431.3244.9173.70.0412.30.580.490.0410.024
Fe-deficientApplied 210312341604800.50.50.050.02
Measured212.034.0247.7159.244.70.130.520.490.050.022
Mn-deficientApplied21031234160482.800.50.050.02
Measured 197.934.9240.0148.244.62.50.0170.510.0520.024
B-deficientApplied21031234160482.80.500.050.02
Measured 220.535.6248.1143.944.62.70.530.030.0420.023
Zn-deficientApplied21031234160482.80.50.500.02
Measured220.317.6251.9154.944.72.30.510.490.0120.023
Cu-deficientApplied21031234160482.80.50.50.050
Measured217.832.8242.3151.344.42.60.500.520.0570.0098
Disclaimer/Publisher’s Note: The statements, opinions and data contained in all publications are solely those of the individual author(s) and contributor(s) and not of MDPI and/or the editor(s). MDPI and/or the editor(s) disclaim responsibility for any injury to people or property resulting from any ideas, methods, instructions or products referred to in the content.

