Abstract
Pinus tabuliformis is a well-recognized woody mycorrhizae host plant growing in North China. EM fungi contribute to the host health and the stability of the forest ecosystem. However, ectomycorrhiae (EM) fungal community associated with this species is less documented. In this study, we examined EM fungal diversity and composition of P. tabuliformis from three sites in Inner Mongolia, China by using Illumina MiSeq sequencing on the rDNA ITS2 region. Our results showed that a total of 105 EM fungal operational taxonomic units (OTUs) were identified from 15 composite root samples, and the dominant lineages were /suillus-rhizopogon, /tomentella-thelephora, /tricholoma, /amphinema-tylospora, /wilcoxina, /inocybe, and /Sebacina. A high proportion of unique EM fungal OTUs (33, 31.4% of total OTUs) were detected, and some abundant OTUs preferred to exist in specific sites. The composition of EM fungal communities was significantly different among the sites, with soil, climatic, and spatial variables being related to the community variations. The EM fungal community assembly was mainly driven by environmental factors in deterministic processes. These findings suggest that this endemic Pinaceae species in China also harbored a rich and distinctive EM fungal community and deterministic processes played more important roles than stochastic in shaping the symbiotic fungal community. Our study improves our understanding of EM fungal diversity and community structure from the perspective of a single host plant that has not been investigated exclusively before.
1. Introduction
As the symbiosis formed between soil fungi and plant, ectomycorrhiza (EM) played critical roles in forest ecosystem, such as affecting the host plant healthy, provide nutrient in exchange of carbon, contribute to carbon sequestration between individuals of the same or different host plant species via belowground mycelial networks, and thus contributing to plant diversity, ecosystem functions and stability [1,2,3,4,5]. With the rapid development of sequencing techniques, particularly high-throughput sequencing, EM fungal diversity and community at diverse forest ecosystems and various spatial scales received much attention [6,7,8,9]. Researchers explored the EM fungal diversity and variables responsible for community structure. Commonly, the EM fungal community was affected by host plant identity or phylogeny [10,11], spatial scales [12,13], habitat types [8,9,14,15], soil and climatic factors [16,17,18,19], and also host age [20,21]. For example, host plant phylogeny explained the largest variations in EM fungal community associated with Betulaceae, Fagaceae, and Salicaceae plants, and in the permafrost ecosystem of eastern Siberia [6,7,9,10], while climatic conditions dominantly shaped EM fungal communities on two Japanese mountains apart from ~550 km [16]. Certainly, spatial distance, which can be related to latitude differences, and the distribution of tree groups, also participates in predicting EM fungal community at scales ranging from local to global [12,22,23]. Thus, many previous studies investigated variables responsible for EM fungal community. Still, it is evident that the main drivers in determining EM fungal community varied in studies conducted at various scales and backgrounds.
Revealing the mechanisms underlying microbial community assembly is critical to gain a clearer understanding of biodiversity maintenance and predicting the response of microbes to global changes. Commonly, microbes suffer from the selection pressure derived from biotic and abiotic factors (i.e., environmental filtering), because different fungal species preferred specific environmental conditions such as plant, soil, and climatic, which can be regarded as deterministic processes [24]. Meanwhile, dispersal limitation, drift, and speciation also affected the microbial community, which can be defined as stochastic processes [25,26,27]. It has been widely accepted that both deterministic and stochastic processes are important in driving microbial community assembly, but the relative importance of the different processes on community assembly of microbes varied with spatial scales, habitats, and microbial groups [23,28,29]. For instance, soil fungal communities in 18 oceanic islands of China were mainly predicted by deterministic processes [28]; Stochastic processes dominantly drove soil fungal communities along an altitudinal gradient on Tibetan plateau [30]; community assembly of bacteria in natural mountain forests of eastern China was mainly predicted by deterministic processes [31]. Deterministic processes, such as host plant phylogeny, have been shown to significantly influence EM fungal community composition. For example, a study in Inner Mongolia found that EM fungal communities associated with five pine species were influenced by both host plant phylogeny and local environmental conditions [32]. Soil chemistry, including nutrient availability like nitrogen and phosphorus, and climate variables, were key predictors of EM fungal OTU richness and community composition [33]. Stochastic processes, such as dispersal limitation and ecological drift, also contribute to community assembly. Geographic distance, which affects the movement of fungal spores and mycelial fragments between habitats, was found to be a significant factor in community assembly across North American pine specie [32]. In summary, the specific mechanisms are not yet fully understood, and further research is needed to clarify the relative importance of these processes and their interactions in shaping EM fungal communities across different ecosystems.
Pinus tabuliformis is an endemic pine species in North China, with high ecological and economic values as it can provide timbers and be used for afforestation, and it is also the dominant EM woody host plant in temperate forests. However, we know less about EM fungal diversity, community composition, and mechanisms underlying the community assembly of this EM host plant. Thus, under this environmental context, we tried to describe the EM fungal community structure of P. tabuliformis in Inner Mongolia, China. The Illumine high-throughput sequencing was adopted to sequence the EM fungi of root samples collected from three sites in Inner Mongolia. We sought to (1) explore EM fungal diversity and community composition of P. tabuliformis and (2) reveal the mechanisms underlying the EM fungal community assembly of P. tabuliformis. We hypothesized that P. tabuliformis harbor high and some distinct EM fungal groups; the deterministic processes played more critical roles in driving the community assembly of EM fungi associated with P. tabuliformis.
2. Materials and Methods
2.1. Study Sites and Sample Collection
This study conducted root sample collection at three locations, namely Wulashan (WLS), Aohan Banner in Chifeng (CF), and Heilihe Nature Reserve (HLH). Five individual plants were sampled at each location, and 300 g of root samples were collected from each individual plant. Meanwhile, rhizosphere soil was collected, with 200 g of soil from each plant, which were combined for the analysis of physical and chemical properties.
This study was conducted in three typical forests in Inner Mongolia, China, namely Wulashan (WLS), Aohan Banner in Chifeng (CF), and Heilihe Nature Reserve (HLH) (Figure S1). The mean annual temperature (MAT) ranged from 2.42–5.97 °C and mean annual precipitation (MAP) ranged from 312–483 mm, according to the data extracted from the WorldClim dataset at the resolution of 30 arcsecond [34]. In the forests, P. tabuliformis was the dominant woody EM host plants, with some other EM hosts such as Betulaceae and Salicaceae plants. The sampling work was conducted in August 2018, which is the summer season. At each site, five individuals were selected for sampling. The individuals are at least 10 m apart to ensure sample independence. Fine roots were carefully excavated at three points on each individual close to the trunk and then combined into one composite sample. The root samples were transported to the laboratory within 24 h in an ice box and stored at t −80 °C until molecular analysis. Meanwhile, five soil samples were collected at each site when root sampling and were merged as one composite sample. The soil samples were air-dried, sieved by 2 mm mesh, and then used to analyze soil properties. Thus, a total of 15 root samples and three soil samples were obtained from the three sites in our study. The geographic coordinates and altitude were recorded by using a high-sensitivity GPS instrument (M-241, Holux Technology Inc., Taiwan, China). Details on geographic and climatic information and physical and chemical properties of the soil in each site are available in Table S1.
2.2. Soil Properties Analysis
Soil pH was determined using dried soil mixed with distilled water at a 1:2.5 ratio (w/v) using a digital pH meter (Mettler Toledo, Zurich, Switzerland). The total carbon (C) and total nitrogen (N) were measured by direct combustion using a Vario EL III C/N Element Analyzer (Elementar Analysensysteme GmbH, Langenselbold, Germany). Total phosphorus (P), total potassium (K), and total calcium (Ca) were assessed using an iCAP 6300 inductively coupled plasma spectrometer (Thermo Scientific, Wilmington, DE, USA). A detailed descriptions of the soil properties analysis can be found in Wang et al. (2019) [7].
2.3. Molecular Analysis
The roots were firstly washed using tap water and cut into 1–2 cm fragments. The EM root tips were identified according to specific morphological characteristics (e.g., color and emanating hyphae) under a stereomicroscope. About 200 healthy EM root tips were randomly picked from each sample, thus resulting in 30,000 root tips being used for analysis in our study. The EM root tips were cleaned carefully with sterilized distilled water and stored at −80 °C until total DNA extraction.
The total DNA extraction was conducted using the CTAB method. A semi-nested PCR was adopted to amplify the fungal ITS2 region. Primers of ITS1F and ITS4 were first used in the first round of PCR to amplify the entire ITS region, and the primers of fITS7 and ITS4 were used to target the ITS2 region. The primer ITS4 used in the second PCR amplification was equipped with a unique barcode sequence to distinguish each sample in the bioinformatic analysis. Detailed information on PCR step was available in Wang et al. (2021) [11]. Three PCR replicates were conducted for each sample and then pooled to generate a composite PCR product. After the amplification, the PCR products of each sample were purified using the Wizard SV Gel and PCR Clean-Up System (Promega, Madison, WI, USA). The amplicon concentration of each sample was determined using nanodrop spectrophotometer (Nanodrop 2000, NanoDrop Technologies, Wilmington, DE, USA). Thereafter, the purified amplicons were pooled with an equimolar amount (100 ng) for each sample. The sequencing work was performed on an Illumina MiSeq PE250 platform using the paired-end (2 × 250 bp) option at the Environmental Genome Platform of Chengdu Institute of Biology, Chinese Academy of Sciences, China.
2.4. Bioinformatic Analysis
Clean data was generated from raw data after quality control using the QIIME platform (v.v.1.9.0) [35], The raw sequence data were filtered using QIIME v. 1.7.0 to remove low-quality reads with an average quality score < 20, no valid primer sequence or barcode sequence, ambiguous bases > 6, or length < 250 bp. The ITS2 region was extracted using the ITSx software (v. 1.0.3) [36]. The potential chimeras were detected using the chimera.uchime command in Mothur 1.31.2 by comparison with entries in the unified system for the DNA based fungal species linked to the classification (UNITE, 2020) database (v. 8.3) [37]. After that, the high-quality ITS2 sequences were clustered into operational taxonomic units (OTU) based on 97% similarity using the UPARSE pipeline after de-singleton and de-replicates [38]. The representative sequence (most abundant) of each OTU was searched against UNITE database [37] using the basic local alignment search tool (BLAST) (v. 2.2.31+). The taxonomy of each OTU was analyzed based on criteria proposed by Tedersoo et al. (2014) [39]. After this, the EM fungal OTUs were identified according to Tedersoo and Smith (2013) [40], if they matched the known EM fungi and lineages. To eliminate the effect of heterogenous sequence depth among samples on following community analysis, we rarefied the EM fungal reads to 1542 per sample by using the rrarefy command in the vegan package (v. 2.5.7) [41]. Raw sequences have been deposited in the sequence read archive of NCBI under accession no. PRJNA902691.
2.5. Statistical Analysis
All data analyses were conducted in R v. 4.0.1 and RStudio-1.4.1106 (R development core team, 2021). Species accumulation curves of observed EM fungal OTUs in each site were drawn using the specaccum function in the vegan package [41]. Diversity index including OTUs richness, Shannon index, and Simpson index were calculated using the diversity command in the vegan package [41] and then tested for normality and the homogeneity of variance before analysis of variance (ANOVA). One-way ANOVA was performed to examine the effect of the site on the fungal diversity index mentioned above. The interactive Venn diagram and Venn network were generated using the online software Evenn (http://www.ehbio.com/test/venn/#/) [42] to analyze the unique and shared EM fungal OTUs across the three sites.
Based on latitude and longitude, altitude, and soil physicochemical indicators, calculate the pairwise Euclidean distances among three sites, and then use the ‘pcnm’ command in the PCNM software package (v. 2.1-2) [43] to convert them into the principal coordinates of the neighborhood matrix (PCNM). Generalized linear models (GLMs) with Poisson distribution were constructed to test the effect of spatial, climatic, and soil variables on EM fungal OTUs richness. The multi-model inference approach was applied to obtain the best GLM model, which was generated from a set of reduced models by using dredge and model.avg commands in the MuMIn package (v. 1.43.17) [44].
A Krona chart showing the different taxonomic levels of the EM fungal community was generated using the online Krona tool (v.2.6) [45]. A distance matrix for EM fungal community (Hellinger-transformed data) was constructed by calculating dissimilarities using the Bray–Curtis method. Non-metric multi-dimensional scaling (NMDS) analysis was conducted to visualize the difference in the EM fungal communities among the three sites using the metaMDS command in the vegan package [41]. To identify the significant factors that affect the EM fungal community, spatial PCNM eigenvector, climatic, and soil variables were fitted into the NMDS plot using the envfit command in the vegan package [41]. Permutational multivariate analysis of variance (PerMANOVA) was adopted to determine the significance of the difference in the fungal communities among sites using the adonis command in the vegan package based on 999 permutations [41]. Additionally, random forest analysis was performed to identify the significant variables responsible for the fungal community composition by using the randomForest command in the randomForest package (v. 4.6-14) [46]. The importance and significance of each variable were assessed by using the rfPermute and rp.importance command in the rfPermute package (v. 2.1.81) [47], and the rf.significance command in the rfUtilities package (v. 2.1-5) was used to test for model significance [48].
Relative abundances of the abundant fungal OTUs (>0.5% of total reads) among the sited were displayed by using the pheatmap command in the pheatmap package (v. 1.0.10) [49]. Additionally, in order to investigate the distribution difference of EM fungal OTUs across sites, preference analysis designed by Toju et al. (2016) [50] was performed based on the site-OTUs matrix, in which rows represented sampling sites, columns represented fungal OTUs, and the cell entries indicated the numbers of samples of specific site-fungus combinations. The preference analysis designed by Toju et al. (2016) [50] is a statistical method used to determine how organisms (in this case, EM fungal OTUs) respond to specific environmental conditions. or habitats. This analysis helps to determine whether certain fungal OTUs are over- or under-represented at specific sites. The results of the analysis can be used to infer the factors that most influence the distribution of EM fungi. The calculation method for preference involves a series of statistical tests that compare the observed frequency of OTUs at sites with what would be expected under a null model of random distribution. This may include chi-square tests, binary logistic regression, and so on. The analysis of the ecological habits of communities is an important ecological research method, which is a tool for understanding the mechanisms of EM fungal community assembly and is relevant to the goal of this study, which investigates the distribution differences of EM fungal OTUs across different sites. It provides a quantitative assessment of how environmental variables affect the distribution and abundance of different fungal OTUs across spatial scales. By understanding these preferences, one can gain insights into the ecological processes that underpin community assembly. The detailed description of this analysis method was available in Toju et al. (2016) [50]. To quantify the relative importance of the stochastic and deterministic processes to community assembly, the modified normalized stochasticity ratio (MST) index was calculated using the tNST command in the NST package (v. 3.1.9) [51]. The MST index ranges from 0 to 100%, with 50% as the boundary point between more stochastic (>50%) and more deterministic (<50%) assemblies. To increase the robustness of the MST analysis, two distance metrics (Bray and Jaccard) coupled with two null model algorithms of Taxa–Richness constraints of proportional-proportional (PP) and proportional-fixed (PF) were adopted in the analyses.
3. Results
3.1. Fungal Database Summary
In this study, we generated a total of 288,458 high-quality ITS2 sequences from 306,783 raw sequences after quality filtering (Table S2). These high-quality ITS2 sequences were assigned to 299 OTUs, of which 136 OTUs were identified as EM fungi. After rarefying all samples to the same sequencing depth (1542), 105 EM fungal OTUs were retained for subsequent statistical analyses. The 28 most abundant OTUs (>0.5%) accounted for 94.4% of the total EM fungal sequences (Figure S2A), and 81 out of 105 (77.1%) EM fungal OTUs occurred in less than three samples (Figure S2B). These data indicate that while certain OTUs dominate the EM fungal communities, the distribution of the majority of OTUs is relatively sparse, which may reflect the high diversity and specific niche differentiation of EM fungal communities.
3.2. Ectomycorrhizal Fungal Community
Regarding EM fungal diversity, the accumulation curves of the observed EM fungal OTUs at each site did not reach a plateau, suggesting that further sampling could reveal more EM fungi (Figure 1A). The richness of EM fungal OTUs varied among different sites, ranging from 11.2 ± 2.1 (Mean ± SE) in WLS to 16.2 ± 8.8 in CF and 16.4 ± 2.5 in HLH. One-way ANOVA indicated that the diversity indices (observed EM fungal OTUs richness, Shannon, and Simpson values) were not significantly different among the sites (Figure 1B–D). Venn diagrams showed that CF harbored the highest proportion of unique OTUs (33, 31.4% of total OTUs), followed by HLH (28, 26.7%) and WLS (14, 13.3%); meanwhile, only eight OTUs (7.6%) were shared among the three sites (Figure 2). The results of the Generalized Linear Model (GLM) indicated that MAP, MAT, soil potassium, and altitude are the best predictors of EM fungal OTUs richness (Table 1).
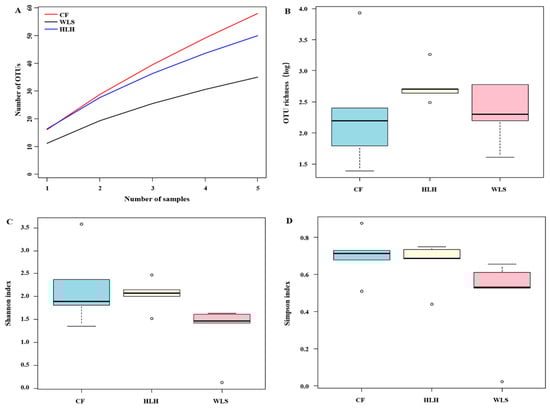
Figure 1.
Ectomycorrhizal (EM) fungal diversity. Accumulation curves of EM fungal operational taxonomic units (OTUs) (A), EM fungal OTUs richness (B), Shannon index (C). and Simpson index (D) at three sites. CF, Chifeng; HLH, Heilihe; WLS, Wulashan.
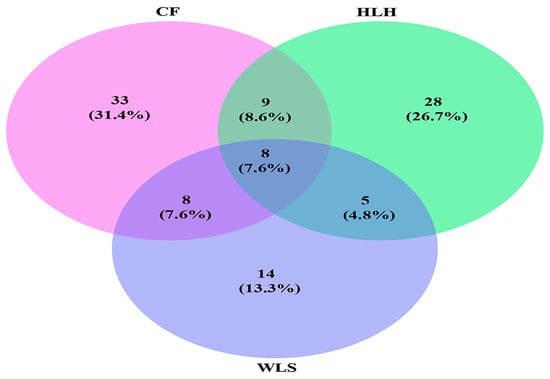
Figure 2.
Venn diagram showing the shared and unique ectomycorrhizal fungal operational taxonomic units (OTUs) of the three sites. Deeper color represents a higher proportion of OTUs. CF, Chifeng; HLH, Heilihe; WLS, Wulashan.

Table 1.
Generalized linear model revealed significant variables responsible for ectomycorrhizal fungal operational taxonomic unit richness.
The Krona diagram revealed that Tomentella, Tricholoma, Rhizopogon, Amphinema, Suillus, Wilcoxina, Inocybe, and Geopora were the dominant fungal genera, accounting for 90% of the total fungal sequences (Figure 3). All EM fungal OTUs were assigned to 21 lineages, among which /suillus-rhizopogon, /tomentella-thelephora, /tricholoma, /amphinema-tylospora, /wilcoxina, /inocybe, and /Sebacina accounted for 90.4% of the total sequences (Table 2 and Figure 4). NMDS ordination showed clear separation between EM fungal communities at each site (Figure 5), and PerMANOVA further demonstrated significant differences in EM fungal communities among sites (adonis: R2 = 0.30, p = 0.001).
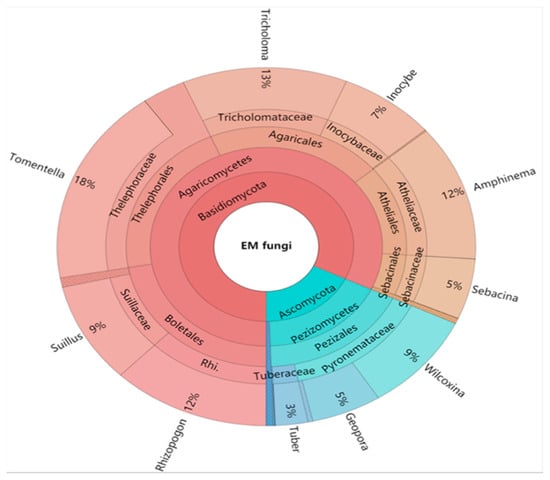
Figure 3.
Krona chart of taxonomic affiliation of ectomycorrhizal fungi and their relative abundances. Inner circles represent higher taxonomic ranks and more detailed taxonomic ranks are presented in outer circles.
Table 2.
All EM fungal lineages and relative abundances in this study.
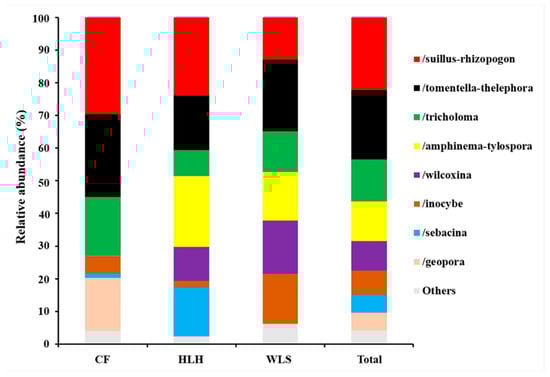
Figure 4.
Ectomycorrhizal fungal lineages and their relative abundances. Only the dominant (>5% of total reads) are showed here. CF, Chifeng; HLH, Heilihe; WLS, Wulashan; ALL, all samples.
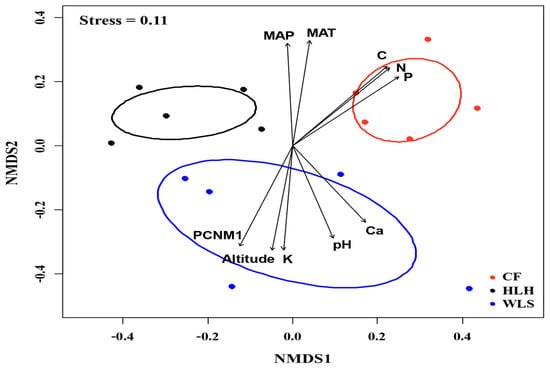
Figure 5.
Non-metric multidimensional scaling (NMDS) of the ectomycorrhizal fungal community. Ellipses indicate 95% confidence intervals around centroids for each site. Significant spatial, soil, and climatic variables were fitted onto the NMDS ordination. PCNM, principal coordinates of neighbor matrices; MAT, mean annual temperature; MAP, mean annual precipitation; C, soil total carbon; N, soil total nitrogen; P, soil total phosphorus; Ca, soil total calcium; K, soil total potassium.
3.3. Ectomycorrhizal Fungal Community Assembly Processes
The environmental fitting test indicated that spatial, climatic, and soil variables were significantly correlated with the structure of EM fungal communities (Figure 5 and Table S3). Similarly, the random forest analysis indicated that all spatial, climatic, and soil variables were significant predictors of EM fungal community structure, explaining 18.87% of the variation in communities (Figure 6).
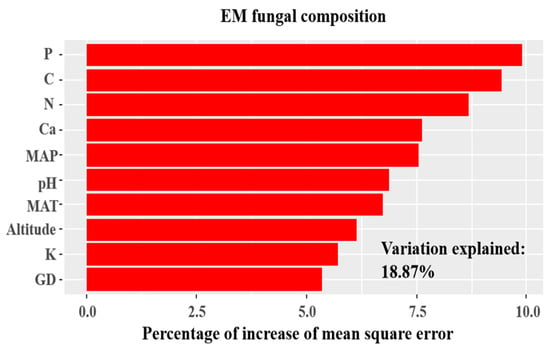
Figure 6.
Random forest model showing relative importance of spatial, soil and climatic variables for variations in ectomycorrhizal (EM) fungal community of three sites. %IncMSE, % of increase of mean square error; MAT, mean annual temperature; MAP, mean annual precipitation; C, soil total carbon; N, soil total nitrogen; P, soil total phosphorus; Ca, soil total calcium; K, soil total potassium; GD, geographic distance.
At the OTU level, the heatmap showed that the relative abundance of some abundant OTUs varied among the three sites (Figure S3). Site/fungus preference analysis indicated that all sites harbored EM fungal OTUs that showed site preference, with 11 out of 41 (26.8%) abundant EM fungal OTUs showing significant preference for specific sites, and 14 out of 123 pairs of site-fungal OTUs exhibiting remarkably strong preferences (Figure 7). The MST model showed that the MST values of all sites were below 50%, indicating that EM fungal communities were primarily shaped by deterministic processes (Figure 8). Particularly, relatively lower MST values were observed in WLS compared to the other two sites, suggesting a stronger deterministic process in WLS in comparison with other sites (Figure 8).
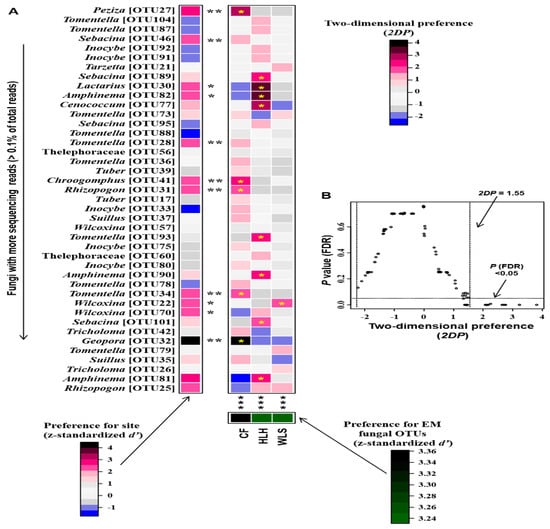
Figure 7.
Distribution preferences of site–fungus pairs. (A) Standardized d’ estimates of preferences for fungal operational taxonomic units (OTUs) for indicated sites (columns). Likewise, the standardized d’ estimate of preferences for sites is indicated for each of the observed fungal OTUs (row). A cell in the matrix indicates a two-dimensional preference (2DP) estimate, indicating the extent an association of a focal site–fungus pair was observed more/less frequently than expected by chance. The cell with asterisk inside represents significant preferences in site–fungus pair. Because multiple species/OTUs were tested, the p values are shown as false discovery rates (FDRs) in the plant/fungus analysis. (B) Relationship between 2DP and FDR-adjusted p values, 2DP values larger than 1.85 represented strong preferences. Significance: *, p < 0.05, **, p < 0.01, ***, p < 0.001. CF, Chifeng; HLH, Heilihe; WLS, Wulashan.
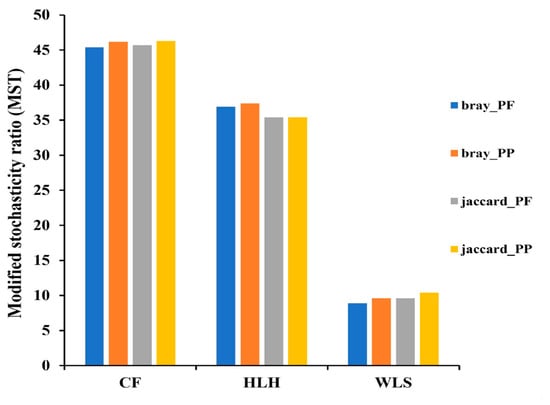
Figure 8.
The modified normalized stochasticity ratio (MST) analysis showing the community assembly of ectomycorrhizal fungi. Different colors represent the average MST values calculated based on one distance matrix in couple with one algorithm. CF, Chifeng; HLH, Heilihe; WLS, Wulashan. Proportional-proportional (PP) and proportional-fixed (PF).
4. Discussion
A total of 105 EM fungal OTUs were detected in our study, and there was no significant difference of EM fungal OTUs across the three sites, although CF and HLH harbored higher EM fungal diversity than that in WLS. GLM result indicated that MAP, MAT, soil K, and altitude were significant predictors for EM fungal diversity, which has also been reported in previous studies [7,11]. As for the geographic locations of our sampling sites, CF and HLS were located in the east of Inner Mongolia, which is the typical temperate forest, while WLS was located in the west of Inner Mongolia which is the semi-arid forest. Indeed, the MAT and MAP of WLS were significantly lower than those in CF and HLH. Thus, EM fungal diversity was lower in this arid area as more precipitation could decrease EM fungal diversity [51], accordingly, climatic conditions have been proven to significantly affect EM fungal diversity [6,7,17]. Additionally, the altitude of WLS was higher than that in CF and WLS, which may be also contributing low EM fungal diversity in WLS due to the fact that the lower energy in higher altitudes could not support high EM fungal diversity, which has been reported in the previous study [8,52].
The /suillus-rhizopogon, /tomentella-thelephora, /tricholoma, /amphinema-tylospora, /wilcoxina, /inocybe, /sebacina, and /geopora were the top eight dominant EM fungal lineages (accounting for 95.8% of total EM fungal sequences), among them, /suillus-rhizopogon and /tomentella-thelephora being the most dominant. /suillus-rhizopogon has been reported to be specific for Pinaceae plants. According to Agerer (2001) [53], suillus and rhizopogon mycorrhizae are typically representatives of the “long-distance exploration type”, which can search for and transport nutrients and water to host plants from a long distance. Due to specificity to certain host plants, suillus can connect and transport nutrients to the same plant species and prevent materials to other tree species [54]. Meanwhile, this lineage was found in most of samples (11 of 15 samples), indicating it is widespread symbiotic partner of P. tabuliformis in Inner Mongolia. Our findings suggest /suillus-rhizopogon should be an important EM fungal lineage for Pinaceae species. Indeed, the dominance of /suillus-rhizopogon has also been reported in studies involved in other Pinaceae species and has been suspected to help Pinaceae species grow well in harsh habitats [21,55]. /tomentella-thelephora has been reported as the dominant EM fungal lineage in many studies conducted on various host plants and diverse forest ecosystems [6], which means that this lineage is widespread group and harbor strong adaptability to environmental changes in the globe. The presence of both host-specialist species such as /suillus-rhizopogon and generalist EM fungi like /tricholoma underscores the complex dynamics of EM fungal community assembly. Our findings diverge from those of Wang et al. (2021) [13], who reported /tricholoma as the most dominant lineage associated with Larix gemelinii Rupr. in the Great Khingan Mountains of Inner Mongolia. This difference in EM fungal dominance may be attributed to the strong host selection pressures that shape these communities, which are likely a result of coevolutionary processes between the host plants and their fungal symbionts. Furthermore, the differences in EM fungal community composition between our study site and that of Wang et al. (2021) [13] highlight the importance of considering the local ecological context when interpreting community assembly patterns. The variation in host plant selection, soil characteristics, and environmental conditions could all contribute to the observed differences in EM fungal community structure. These findings emphasize the need for further research into the factors that drive host selection and the resulting implications for EM fungal community diversity and ecosystem function. This may be due to strong host selection on EM fungal communities derived from coevolution between host plant and EM fungi. Correspondingly, strong host effect on EM fungal communities has been intensively investigated in diverse forests and plant identity [6,7,10,15].
NMDS ordination in couple with PerMANOVA indicated that the EM fungal communities differed significantly among the three sites, mirroring a strong spatial effect. This can be explained by the fact that relative abundances of some abundant EM fungal OTUs varied across sites. Meanwhile, preference analysis indicated that 11 out of 41 (26.8%) abundant EM fungal OTUs showed a significant preference for specific sites, suggesting that these OTUs are particularly adapted to or selectively found in certain environmental conditions. Additionally, Venn diagrams revealed a low level of OTU richness across sites, with only eight OTUs shared among all sites, indicating a high degree of uniqueness in the fungal communities present at each site. Moreover, 71.4% of total EM fungal OTU reads were found in only one site, highlighting the predominance of site-specific OTU occurrences.
This site-specific distribution of EM fungal OTU reads, rather than the OTUs themselves, points to the strong influence of local environmental factors on the composition of EM fungal communities. The high percentage of site-specific OTU reads (71.4%) underscores the importance of localized ecological conditions in shaping the distribution and abundance of EM fungi at each site. These findings collectively contribute to our understanding of how site factors significantly influence the assembly of EM fungal communities. Thus, the differences in relative abundances, site-preference, and frequency of EM fungi contributed to the significant influence of site on EM fungal communities. In the present study, Random Forest analysis also suggested that geographic distance significantly affected EM fungal community. Thus, these results in combination with NMDS ordination indicated that the fungal community of EM fungi associated with P. tabuliformis in Inner Mongolia was spatial structured. This is in accordance with previous studies those implying EM fungi are found to be spatial structed at various scales ranging from local to continental scales [7,10,11,12,13,56]. This may be due to the dispersal limitation of EM fungi impendent by geographic distance, that is, fungal species failed to disperse from one site to other habitats, or dispersal at a limited distance [57,58]. Environmental variables such as soil and climatic factors were significant predictors for the EM fungal community revealed by environmental fitting test and random forest analysis, which implied a strong effect of environmental filtering on EM fungi; that is, deterministic processes drove community assembly of EM fungi. Accordingly, the results of MST analysis based on two models and two algorithms all supported that deterministic process played more important roles in predicting EM fungal community assembly than stochastic process. We suspect that the dominance of deterministic or stochastic processes on EM fungal community assembly was related with community size (i.e., species richness). Indeed, in our study, EM fungal richness in WLS was lower than that in CF and HLH, and deterministic processes played a stronger role in shaping EM fungal community in WLS than that in CF and HLH. This may be related to interactions among EM fungal species, but this needs further investigation in future study.
Supplementary Materials
The following supporting information can be downloaded at: https://www.mdpi.com/article/10.3390/horticulturae11050545/s1, Figure S1. Information on geographic coordinate, climatic and soil variables in this study. Figure S2. Total number of sequences in each sample. Figure S3. Correlations of spatial, soil and climatic variables with non-metric dimensional scale revealed by environmental fitting test.
Author Contributions
Y.F. and Y.W. conceived the project. Y.F., J.M. and Y.W. designed experiments and analysed all data in the paper. Z.Y., J.L. (Jinyan Li), X.L., L.W. and J.L. (Jiani Lu) finished the experiments and obtained the relevant experimental data. Z.Y. and J.L. (Jinyan Li) wrote the manuscripts. Y.F. and Y.W. revised it. All authors have read and agreed to the published version of the manuscript.
Funding
This work was funded by the National Natural Science Foundation of China (no. 32260006 (Yongjun Fan), 32260027 (Yonglong Wang)), the Natural Science Foundation of Inner Mongolia Autonomous Region (no. 2024MS03045 (Yongjun Fan)), the science and technology project of Inner Mongolia Autonomous Region (no. 2019GG002 (Yongjun Fan)), the program for Young Talents of Science and Technology in Universities of Inner Mongolia Autonomous Region (NJYT24051 (Yonglong Wang)), and the Science and Technology Project of Ordos (no. 2022YY008 (Yongjun Fan)), and Basic Scientific Research Business Fee Project for Directly Affiliated Universities in Inner Mongolia Autonomous Region (no. 2023RCTD021 (Yongjun Fan)) and the Open Research Foundation of Yinshanbeilu Grassland Eco-hydrology National Observation and Research Station, China Institute of Water Resources and Hydropower Research (no. YSS2022012 (Yongjun Fan)).
Data Availability Statement
The data presented in this study are openly available in NCBI, reference number PRJNA902691.
Conflicts of Interest
The authors declare that the research was conducted in the absence of any commercial or financial relationships that could be construed as a potential conflict of interest.
References
- Smith, S.E.; Read, D.J. Mycorrhizal Symbiosis, 3rd ed.; Academic Press: New York, NY, USA, 2008. [Google Scholar]
- Tedersoo, L.; Bahram, M.; Zobel, M. How mycorrhizal associations drive plant population and community biology. Science 2020, 367, 6480. [Google Scholar] [CrossRef]
- Anthony, M.A.; Crowther, T.W.; van der Linde, S.; Suz, L.M.; Bidartondo, M.I.; Cox, F.; Schaub, M.; Rautio, P.; Ferretti, M.; Vesterdal, L.; et al. Forest tree growth is linked to mycorrhizal fungal composition and function across Europe. ISME J. 2022, 16, 1327–1336. [Google Scholar] [CrossRef]
- Averill, C.; Fortunel, C.; Maynard, D.S.; van den Hoogen, J.; Dietze, M.C.; Bhatnagar, J.M.; Crowther, T.W. Alternative stable states of the forest mycobiome are maintained through positive feedbacks. Nat. Ecol. Evol. 2022, 6, 375–382. [Google Scholar] [CrossRef]
- Cahanovitc, R.; Livne-Luzon, S.; Angel, R.; Klein, T. Ectomycorrhizal fungi mediate belowground carbon transfer between pines and oaks. ISME J. 2022, 16, 1420–1429. [Google Scholar] [CrossRef]
- Tedersoo, L.; Mett, M.; Ishida, T.A.; Bahram, M. Phylogenetic relationships among host plants explain differences in fungal species richness and community composition in ectomycorrhizal symbiosis. New Phytol. 2013, 199, 822–831. [Google Scholar] [CrossRef] [PubMed]
- Wang, Y.L.; Gao, C.; Chen, L.; Ji, N.N.; Wu, B.W.; Li, X.C.; Lü, P.P.; Zheng, Y.; Guo, L.D. Host plant phylogeny and geographic distance strongly structure Betulaceae-associated ectomycorrhizal fungal communities in Chinese secondary forest ecosystems. FEMS Microbiol. Ecol. 2019, 95, fiz037. [Google Scholar] [CrossRef] [PubMed]
- Gong, S.; Feng, B.; Jian, S.P.; Wang, G.S.; Ge, Z.W.; Yang, Z.L. Elevation Matters More than Season in Shaping the Heterogeneity of Soil and Root Associated Ectomycorrhizal Fungal Community. Microbiol. Spectr. 2022, 10, e01950-21. [Google Scholar] [CrossRef] [PubMed]
- Miyamoto, Y.; Maximov, T.C.; Bryanin, S.V.; Kononov, A.; Sugimoto, A. Host phylogeny is the primary determinant of ectomycorrhizal fungal community composition in the permafrost ecosystem of eastern Siberia at a regional scale. Fungal Ecol. 2022, 55, 101117. [Google Scholar] [CrossRef]
- Wu, B.W.; Gao, C.; Chen, L.; Buscot, F.; Goldmann, K.; Purahong, W.; Ji, N.N.; Wang, Y.L.; Lü, P.P.; Li, X.C.; et al. Host phylogeny is a major determinant of Fagaceae-associated ectomycorrhizal fungal community assembly at a regional scale. Front. Microbiol. 2018, 9, 2409. [Google Scholar] [CrossRef]
- Wang, Y.L.; Zhang, X.; Xu, Y.; Babalola, B.J.; Xiang, S.M.; Zhao, Y.L.; Fan, Y.J. Fungal diversity and community assembly of ectomycorrhizal fungi associated with five pine species in Inner Mongolia, China. Front. Microbiol. 2021, 12, 646821. [Google Scholar] [CrossRef]
- Glassman, S.I.; Peay, K.G.; Talbot, J.M.; Smith, D.P.; Chung, J.A.; Taylor, J.W.; Vilgalys, R.; Bruns, T.D. A continental view of pine-associated ectomycorrhizal fungal spore banks: A quiescent functional guild with a strong biogeographic pattern. New Phytol. 2015, 205, 1619–1631. [Google Scholar] [CrossRef]
- Wang, Y.L.; Zhao, Y.L.; Xu, Y.; Ma, J.J.; Babalola, B.J.; Fan, Y.J. Ectomycorrhizal fungal communities associated with Larix gemelinii Rupr. in the Great Khingan Mountains, China. PeerJ 2021, 9, e11230. [Google Scholar] [CrossRef] [PubMed]
- Mundra, S.; Bahram, M.; Eidesen, P.B. Alpine bistort (Bistorta vivipara) in edge habitat associates with fewer but distinct ectomycorrhizal fungal species: A comparative study of three contrasting soil environments in Svalbard. Mycorrhiza 2016, 26, 809–818. [Google Scholar] [CrossRef] [PubMed]
- Yang, T.; Song, L.Y.; Lin, H.Y.; Dong, K.; Fu, X.; Gao, G.F.; Adams, J.M.; Chu, H.Y. Within-species plant phylogeny drives ectomycorrhizal fungal community composition in tree roots along a timberline. Soil Biol. Biochem. 2022, 176, 108880. [Google Scholar] [CrossRef]
- Miyamoto, Y.; Sakai, A.; Hattori, M.; Nara, K. Strong effect of climate on ectomycorrhizal fungal composition: Evidence from range overlap between two mountains. ISME J. 2015, 9, 1870–1879. [Google Scholar] [CrossRef]
- Miyamoto, Y.; Terashima, Y.; Nara, K. Temperature niche position and breadth of ectomycorrhizal fungi: Reduced diversity under warming predicted by a nested community structure. Glob. Change Biol. 2018, 24, 5724–5737. [Google Scholar] [CrossRef]
- Glassman, S.I.; Wang, I.J.; Bruns, T.D. Environmental filtering by pH and soil nutrients drives community assembly in fungi at fine spatial scales. Mol. Ecol. 2017, 26, 6960–6973. [Google Scholar] [CrossRef]
- Kwatcho, S.K.; Peršoh, D.; Schindlbacher, A.; Heinzle, J.; Tian, Y.; Wanek, W.; Borken, W. Long-term soil warming alters fine root dynamics and morphology, and their ectomycorrhizal fungal community in a temperate forest soil. Glob. Change Biol. 2022, 28, 3441–3458. [Google Scholar] [CrossRef]
- Gao, C.; Zhang, Y.; Shi, N.N.; Zheng, Y.; Chen, L.; Wubet, T.; Bruelheide, H.; Both, S.; Buscot, F.; Ding, Q.; et al. Community assembly of ectomycorrhizal fungi along a subtropical secondary forest succession. New Phytol. 2015, 205, 771–785. [Google Scholar] [CrossRef]
- Mandolini, E.; Bacher, M.; Peintner, U. Ectomycorrhizal fungal communities of Swiss stone pine (Pinus cembra) depend on climate and tree age in natural forests of the Alps. Plant Soil 2022, 502, 167–180. [Google Scholar] [CrossRef]
- Wang, Z.H.; Jiang, Y.; Deane, D.C.; He, F.L.; Shu, W.S.; Liu, Y. Effects of host phylogeny, habitat and spatial proximity on host specificity and diversity of pathogenic and mycorrhizal fungi in a subtropical forest. New Phytol. 2019, 223, 462–474. [Google Scholar] [CrossRef] [PubMed]
- Prieto-Rubio, J.; Garrido, J.L.; Pérez-Izquierdo, L.; Alcántara, J.M.; Azcón-Aguilar, C.; López-García, A.; Rincón, A. Scale dependency of ectomycorrhizal fungal community assembly processes in Mediterranean mixed forests. Mycorrhiza 2022, 32, 315–325. [Google Scholar] [CrossRef]
- Vellend, M.; Agrawal, A. Conceptual synthesis in community ecology. Q. Rev. Biol. 2010, 85, 183–206. [Google Scholar] [CrossRef]
- Stegen, J.C.; Lin, X.; Konopka, A.E.; Fredrickson, J.K. Stochastic and deterministic assembly processes in subsurface microbial communities. ISME J. 2012, 6, 1653–1664. [Google Scholar] [CrossRef] [PubMed]
- Zhou, J.Z.; Ning, D.L. Stochastic community assembly: Does it matter in microbial ecology. Microbiol. Mol. Biol. Rev. 2017, 81, e00002-17. [Google Scholar] [CrossRef]
- Chen, W.D.; Ren, K.X.; Isabwe, A.; Chen, H.H.; Liu, M.; Yang, J. Stochastic processes shape microeukaryotic community assembly in a subtropical river across wet and dry seasons. Microbiome 2019, 7, 138. [Google Scholar] [CrossRef]
- Zheng, Y.; Maitra, P.; Gan, H.Y.; Chen, L.; Li, S.C.; Tu, T.Y.; Chen, L.; Mi, X.C.; Gao, C.; Zhang, D.X.; et al. Soil fungal diversity and community assembly: Affected by island size or type? FEMS Microbiol. Ecol. 2021, 97, fiab062. [Google Scholar] [CrossRef]
- Wang, Y.L.; Xu, Y.; Maitra, P.; Babalola, B.J.; Zhao, Y.L. Temporal variations in root-associated fungal communities of Potaninia mongolica, an endangered relict shrub species in the semi-arid desert of Northwest China. Front. Plant Sci. 2022, 13, 975369. [Google Scholar] [CrossRef]
- Hussain, S.; Liu, H.; Liu, S.L.; Yin, Y.F.; Yuan, Z.Y.; Zhao, Y.G.; Cao, H. Distribution and Assembly Processes of Soil Fungal Communities along an Altitudinal Gradient in Tibetan Plateau. J. Fungi 2021, 7, 1082. [Google Scholar] [CrossRef]
- Ni, Y.Y.; Yang, T.; Ma, Y.Y.; Zhang, K.P.; Soltis, P.S.; Soltis, D.E.; Gilbert, J.A.; Zhao, Y.P.; Fu, C.X.; Chu, H.Y. Soil pH determines bacterial distribution and assembly processes in natural mountain forests of eastern China. Glob. Ecol. Biogeogr. 2021, 30, 2164–2177. [Google Scholar] [CrossRef]
- Buscardo, E.; Geml, J.; Nagy, L. Seasonal dependence of deterministic versus stochastic processes influencing soil fungal community composition in a lowland Amazonian rain forest. Commun. Earth Environ. 2024, 5, 334. [Google Scholar] [CrossRef]
- Zhu, Y.X.; Huo, Q.B.; Wen, T.; Wang, X.Y.; Zhao, M.Y.; Du, Y.Z. Mechanisms of fungal community assembly in wild stoneflies moderated by host characteristics and local environment. npj Biofilms Microbiomes 2022, 8, 31. [Google Scholar] [CrossRef] [PubMed]
- Hijmans, R.J.; Cameron, S.E.; Parra, J.L.; Jones, P.G.; Jarvis, A. Very high resolution interpolated climate surfaces for global land areas. Int. J. Climatol. 2005, 25, 1965–1978. [Google Scholar] [CrossRef]
- Caporaso, J.G.; Kuczynski, J.; Stombaugh, J.; Bittinger, K.; Bushman, F.D.; Costello, E.K.; Fierer, N.; Pena, A.G.; Goodrich, J.K.; Gordon, J.I.; et al. QIIME allows analysis of high-throughput community sequencing data. Nat. Methods 2010, 7, 335–336. [Google Scholar] [CrossRef]
- Bengtsson-Palme, J.; Ryberg, M.; Hartmann, M.; Branco, S.; Wang, Z.; Godhe, A.; Wit, P.D.; Sánchez-García, M.; Ebersberger, I.; Sousa, F.D.; et al. Improved software detection and extraction of ITS1 and ITS2 from ribosomal ITS sequences of fungi and other eukaryotes for analysis of environmental sequencing data. Methods Ecol. Evol. 2013, 4, 914–919. [Google Scholar] [CrossRef]
- Kõljalg, U.; Nilsson, R.H.; Abarenkov, K.; Tedersoo, L.; Taylor, A.F.; Bahram, M.; Bates, S.T.; Bruns, T.D.; Bengtsson-Palme, J.; Callaghan, T.M.; et al. Towards a unified paradigm for sequence-based identification of fungi. Mol. Ecol. 2013, 22, 5271–5277. [Google Scholar] [CrossRef]
- Edgar, R.C. UPARSE: Highly accurate OTU sequences from microbial amplicon reads. Nat. Methods 2013, 10, 996–998. [Google Scholar] [CrossRef]
- Tedersoo, L.; Bahram, M.; Polme, S.; Koljalg, U.; Yorou, N.S.; Wijesundera, R.; Villarreal Ruiz, L.; Vasco-Palacios, A.M.; Thu, P.Q.; Suija, A.; et al. Global diversity and geography of soil fungi. Science 2014, 346, 1256688. [Google Scholar] [CrossRef]
- Tedersoo, L.; Smith, M.E. Lineages of ectomycorrhizal fungi revisited: Foraging strategies and novel lineages revealed by sequences from belowground. Fungal Biol. Rev. 2013, 27, 83–99. [Google Scholar] [CrossRef]
- Oksanen, J.; Blanchet, F.G.; Kindt, R.; Legendre, P.; Minchin, P.R.; O’Hara, R.B.; Simpson, G.L.; Solymos, P.; Stevens, M.H.H.; Wagner, H. Vegan: Community Ecology Package. R Package Version 2.0-7. 2013. Available online: http://CRAN.R-project.org/package=vegan (accessed on 29 January 2013).
- Chen, T.; Zhang, H.Y.; Liu, Y.; Liu, Y.X.; Huang, L.Q. EVenn: Easy to create repeatable and editable Venn diagrams and Venn networks online. J. Genet. Genom. = Yi Chuan Xue Bao 2021, 48, 863–866. [Google Scholar] [CrossRef]
- Dray, S.; Legendre, P.; Peres-Neto, P.R. Spatial modelling: A comprehensive framework for principal coordinate analysis of neighbour matrices (PCNM). Ecol. Model. 2006, 196, 483–493. [Google Scholar] [CrossRef]
- Barton, K. MuMIn: Multi-Model Inference. R Package Version 1.42.1. 2018. Available online: http://cran.r-project.org/package=MuMIn (accessed on 11 March 2019).
- Ondov, B.D.; Bergman, N.H.; Phillippy, A.M. Interactive metagenomic visualization in a Web browser. BMC Bioinform. 2011, 12, 385. [Google Scholar] [CrossRef]
- Liaw, A.; Wiener, M. Classification and Regression by randomForest. R News 2002, 2, 18–22. [Google Scholar]
- Archer, E. rfPermute: Estimate Permutation P-Values for Random Forest Importance Metrics. 2013. Available online: http://CRAN.Rproject.org/package=rfPermute (accessed on 3 November 2013).
- Evans, J.S.; Melanie, M.A. Package ‘rfUtilities’; R Package Version; R Core Team: Vienna, Austria, 2019; Volume 2, pp. 1–4. [Google Scholar]
- Kolde, R. Pheatmap: Pretty Heatmaps. R Package Version 1.0.8. 2015. Available online: http://cran.r-project.org/package=pheatmap (accessed on 4 January 2015).
- Toju, H.; Tanabe, A.S.; Ishii, H.S. Ericaceous plant-fungus network in a harsh alpine-subalpine environment. Mol. Ecol. 2016, 25, 3242–3257. [Google Scholar] [CrossRef]
- Põlme, S.; Bahram, M.; Yamanaka, T.; Nara, K.; Dai, Y.C.; Grebenc, T.; Kraigher, H.; Toivonen, M.; Wang, P.H.; Matsuda, Y.; et al. Biogeography of ectomycorrhizal fungi associated with alders (Alnus spp.) in relation to biotic and abiotic variables at the global scale. New Phytol. 2013, 198, 1239–1249. [Google Scholar] [CrossRef]
- Bahram, M.; Põlme, S.; Kõljalg, U.; Zarre, S.; Tedersoo, L. Regional and local patterns of ectomycorrhizal fungal diversity and community structure along an altitudinal gradient in the Hyrcanian forests of northern Iran. New Phytol. 2012, 193, 465–473. [Google Scholar] [CrossRef] [PubMed]
- Agerer, R. Exploration types of ectomycorrhizae. Mycorrhiza 2001, 11, 107–114. [Google Scholar] [CrossRef]
- Kennedy, P.G.; Hortal, S.; Bergemann, S.E.; Bruns, T.D. Competitive interactions among three ectomycorrhizal fungi and their relation to host plant performance. J. Ecol. 2007, 95, 1338–1345. [Google Scholar] [CrossRef]
- Zhang, R.; Shi, X.F.; Liu, P.G.; Wilson, A.W.; Mueller, G.M. Host Shift Speciation of the Ectomycorrhizal Genus Suillus (Suillineae, Boletales) and Biogeographic Comparison With Its Host Pinaceae. Front. Microbiol. 2022, 13, 831450. [Google Scholar] [CrossRef]
- Pickles, B.J.; Genney, D.R.; Anderson, I.C.; Alexander, I.J. Spatial analysis of ectomycorrhizal fungi reveals that root tip communities are structured by competitive interactions. Mol. Ecol. 2012, 21, 5110–5123. [Google Scholar] [CrossRef]
- Peay, K.G.; Garbelotto, M.; Bruns, T.D. Evidence of dispersal limitation in soil microorganisms: Isolation reduces species richness on mycorrhizal tree islands. Ecology 2010, 91, 3631–3640. [Google Scholar] [CrossRef] [PubMed]
- Peay, K.G.; Schubert, M.G.; Nguyen, N.H.; Bruns, T.D. Measuring ectomycorrhizal fungal dispersal: Macroecological patterns driven by microscopic propagules. Mol. Ecol. 2012, 21, 4122–4136. [Google Scholar] [CrossRef] [PubMed]
Disclaimer/Publisher’s Note: The statements, opinions and data contained in all publications are solely those of the individual author(s) and contributor(s) and not of MDPI and/or the editor(s). MDPI and/or the editor(s) disclaim responsibility for any injury to people or property resulting from any ideas, methods, instructions or products referred to in the content. |
© 2025 by the authors. Licensee MDPI, Basel, Switzerland. This article is an open access article distributed under the terms and conditions of the Creative Commons Attribution (CC BY) license (https://creativecommons.org/licenses/by/4.0/).