Article

The Identification of Regulatory Genes Involved in Light-Induced Anthocyanin Accumulation in Aft Tomato Developing Fruits

1
College of Life Science, Northeast Forestry University, Harbin 150040, China
2
Horticulture Science and Engineering, Shandong Agricultural University, Taian 271018, China
3
Modern Industrial College of Biomedicine and Great Health, Youjiang Medical University for Nationalities, Baise 533000, China
*
Authors to whom correspondence should be addressed.
Horticulturae 2025, 11(5), 535; https://doi.org/10.3390/horticulturae11050535
Submission received: 9 April 2025 / Revised: 3 May 2025 / Accepted: 12 May 2025 / Published: 15 May 2025

Abstract

:
Anthocyanins, which accumulate in fruits, flowers, and vegetative organs, play a critical role in plant reproduction, disease resistance, stress tolerance, and promoting human health. Although light significantly influences the development of various fruit pigments, the specific mechanisms through which it regulates anthocyanin accumulation during fruit ripening are not yet fully understood. This study aimed to investigate the role of light in anthocyanin biosynthesis using Aft tomato fruits, which accumulate pigments in the epidermis. To explore the effects of light on anthocyanin biosynthesis, half of each fruit was covered with aluminum foil to establish light-exposed and bagged conditions for comparative analysis. The results showed that the bagged treatment led to a significant decrease in the total anthocyanin content of the fruits. Transcriptome analysis revealed a notable upregulation of several structural genes involved in the anthocyanin biosynthetic pathway, specifically Sl4CL, SlCHS, SlCHI, SlF3H, SlDFR, and Sl3GT in the light-exposed fruits. Additionally, the expression levels of light-responsive genes and transcription factors, such as SlCRY1, SlSPA, SlUVR3, SlHY5, SlBBX24, SlMYB11, MADS-box transcription factor 23, SlHD-ZIP I/II, SlAN2-like, SlbHLH and SlWD40 proteins, were significantly higher in the light-exposed samples compared to those subjected to the bagged treatment. Weighted Gene Co-Expression Network Analysis (WGCNA) demonstrated a strong association between light-induced gene expression such as SlPAL, SlCHS1, SlDFR, SlF3H, SlF3′5′H, SlANS, SlHY5, and SlAN2-like quantified by qRT-PCR analysis and anthocyanin biosynthesis. Moreover, as the fruit matured, both anthocyanin accumulation and the expression of genes related to its biosynthetic pathway increased. These findings contribute to a foundational understanding of the regulatory network that influences light-induced processes and fruit development impacting anthocyanin accumulation, which will facilitate in-depth study of the functions of these identified genes and provide a foundation for breeding anthocyanin-rich tomato varieties.

1. Introduction

Fruits are crucial for seed development, which is necessary for plant reproduction, and they also provide a major source of food and nutrition for humans. Polyphenol-rich fruits, including apples, strawberries, and tomatoes, are known for their antioxidant properties. The colors of fruits are mainly determined by anthocyanins. Anthocyanins, glycosides of anthocyanidins, within the flavonoid subgroup, derive their red, purple, and blue hues in fruits from the arrangement and amount of conjugated sugars, methyl, and hydroxyl groups [1,2]. Unlike most plants, tomato fruit coloration is mainly determined by the accumulation of carotenoids, lycopene, and chlorophyll in the peel [3,4]. These tomatoes have been genetically modified or selectively bred to enhance anthocyanin content, such as the tomato LA1996 anthocyanin fruit (Aft), offering not only abundant colors but also health benefits [3].
External factors such as light, water, temperature, and hormones affect anthocyanin accumulation in plants [5]. Recent studies indicate that light plays a pivotal role in the induction of anthocyanin biosynthesis in fruits. The process is primarily mediated by photoreceptors that perceive light signals, activating various pathways responsible for anthocyanin production. Research indicates that phytochrome signaling enhances the expression of crucial genes involved in the anthocyanin biosynthesis pathway in apples (Malus domestica) [6]. UV/blue light photoreceptors, such as cryptochromes and phototropin, contribute to anthocyanin accumulation in pear [7] and Fragariax ananassa fruits [8]. UV-B photoreceptors (UVR8) enhance anthocyanin accumulation in blue berries [9]. The synthesis of anthocyanins during fruit maturation is tightly regulated by light [10]. Blue light simulates the expression of MiBBX24 or MiBBX27, which enhances anthocyanin and carotenoid biosynthesis in mango (Mangifera indica L.) fruit [11]. In malus, MdGST12 regulated by MdWRKY26 and MdHY5 also enhances the expression of MdDFR and promotes anthocyanin accumulation under light [12]. Conversely, in strawberry fruit, FaANL2 responds to light stimuli and represses FaMYB10 to inhibit anthocyanin biosynthesis [13]. HY5 (ELONGATED HYPOCOTYL 5) is a crucial transcription factor in the light signaling pathway [14], influencing anthocyanin accumulation in Camellia sinensis [15] and tomato fruit ripening at the transcriptional and translational levels [16]. In tomatoes, red and blue lights enhance fruit coloration by modulating hormone balance and pigment accumulation [17].
Anthocyanin synthesis is metabolically regulated through several enzymatic steps, involving genes such as phenylalanine ammonia-lyase (PAL), chalcone synthase (CHS), flavanone 3-hydroxylase (F3H), flavonoid 3′-hydroxylase (F3′H), flavonoid 3′,5′-hydroxylase (F3′5′H), dihydroflavonol reductase (DFR), anthocyanidin synthase (ANS), and uridine diphosphate (UDP)-glucose:flavonoid-O-glycosyl-transferase (UFGT), which facilitate the conversion of substrates into anthocyanins [10]. The expression of these key genes is regulated by transcription factors, such as R2R3 MYB, basic helix–loop–helix (bHLH), and WD40, which can assemble into an MBW ternary complex to control anthocyanin biosynthesis [18,19,20,21]. Besides the MBW complex, transcription factors such as bZIP, NAC, ERF, BBX and WRKY also regulate the anthocyanin biosynthetic pathway [22,23,24,25]. Given the complexity of the molecular mechanisms regulating light-induced anthocyanin accumulation, the key regulatory genes’ response to light and anthocyanin biosynthesis in Aft tomato fruit have not been fully determined. The molecular mechanisms regulating light-induced anthocyanin accumulation in Aft tomato fruit remain to be elucidated.
The fruit of Aft tomato LA1996 accumulates anthocyanin in the epidermis with light-dependent induction. Efficiently controlling anthocyanin biosynthesis in tomato fruits is highly significant. This study investigates the roles of essential genes and molecular regulatory mechanisms in anthocyanin biosynthesis during Aft tomato fruit development. Our research identifies the genes involved in light-induced anthocyanin biosynthesis and demonstrates the differential expression regulation of genes in the developing fruits of light-exposed or bagged tomatoes. The results provide a theoretical basis for understanding the regulatory mechanism of light-induced regulators on anthocyanin accumulation and practical evidence for fruit quality improvement in tomatoes.

2. Materials and Methods

2.1. Plant Material and Light Treatment

Aft (anthocyanin fruit tomato) LA1996 seedlings were cultivated in 20 cm pots in a greenhouse in Northeast Forestry University, Harbin, China (126°37′ E, 45°42′ N). When the tomato bore fruit, the three phases of differently developing fruits were selected for treatment without exposure to light. Half of each fruit was exposed to daylight and half was covered with aluminum foil. After 7 days of daylight treatment, the epidermis of the fruits began to accumulate obvious pigment. The fruits in developmental stage (S1), the fruits in the breaker stage (S2), and the fruits in the red ripening stage (S3) were collected as materials. For each fruit treatment, epidermal tissues from three different points were pooled as one sample, and three fruits from the treatment were taken as biological replicates. They were used as samples for RNA isolation and anthocyanin measurements.

2.2. Anthocyanin Content Measurement

Approximately 0.1 g of fruit peel (1 cm2 of epidermis from light or dark treatment) was weighed, ground in liquid nitrogen, and the pigments were extracted overnight at 4 °C in 1 mL of 1% HCl in methanol (v/v) with continuous shaking. Each sample’s extraction solution was centrifuged at 12,000 rpm for 2 min. The anthocyanin content was calculated using the formula (A530 − 0.25 × A637) per grams of fresh mass. Vertical bars represent the standard error (SE) with n = 3. Data analysis employed Student’s t-tests, with statistical significance set at p < 0.05.

2.3. RNA Extraction, Library Construction and Illumina High-Throughput Sequencing

Tomato fruit’s total RNA was isolated using TRNzol Universal Reagent (TianGen Biotech Co., Ltd., Beijing, China) following the provided protocol. The integrity and quantity of the extracted RNA were evaluated using electrophoresis and the Agilent 2100 bioanalyzer (Agilent, Santa Clara, CA, USA). cDNA synthesis was performed using 20 ng of RNA per sample. The NEB Next Ultra Directional RNA Library Prep Kit for Illumina (NEB, Ipswich, MA, USA) was employed to reverse-transcribe RNA fragments following mRNA Seq guidelines. Indexed adapters were ligated to A-tailed fragmented DNA, and the ligated products were amplified using PCR. The average insert size for the libraries was 175 bp (±25 bp). The PCR products were purified to produce the final cDNA library. The cDNA library underwent paired-end sequencing (125 PE) on an Illumina Hiseq2500 at LC-Bio Technology Co., Ltd., Hangzhou, China.

2.4. RNA-Seq and DEGs Annotation

Clean reads, obtained by eliminating low-quality reads and adapters using Cutadapt were aligned to the Solanum lycopersicum genome (ITAG4.0) [26] utilizing HISAT2 software (Ver. 2.2.1, https://daehwankimlab.github.io/hisat2/download/, accessed on 1 January 2025) [27]. Mapped transcripts were identified using the R package edgeR (https://bioconductor.org/packages/release/bioc/html/edgeR.html, accessed on 1 January 2025) [28] to analyze differentially expressed genes (DEGs), with gene expression levels calculated and normalized to FPKM (Fragments Per Kilobase of transcript sequence per Millions of base pairs sequenced). Differentially expressed genes (DEGs) were identified between treated and control samples using the criteria of an FDR-adjusted p-value < 0.05 and an absolute log2 (Fold Change) ≥ 1. Gene Ontology (GO) terms and Kyoto Encyclopedia of Genes and Genomes (KEGG) pathways with corrected p-values of less than 0.5 were analyzed to confirm biological significance enriched by DEGs. The bardot plot of GO and KEGG was created on the site https://www.bioinformatics.com.cn/ (accessed on 24 September 2024). The heatmap of DEGs was analyzed through the site https://www.omicstudio.cn/tool (accessed on 4 September 2024). The bar and line plot were analyzed on the site https://www.bic.ac.cn/BIC/#/ (accessed on 27 September 2024) [29].

2.5. qRT-PCR Analysis

Each sample of fruits subjected to the light-exposed and bagged treatments was collected for total RNA isolation using TRNzol Universal reagent. Total RNA concentration and quality were assessed using 1% agarose gel electrophoresis and a NanoDrop 2000 Spectrophotometer (Thermo Fisher Scientific, Wilmington, NC, USA). For cDNA synthesis, 2 µg of total RNA of each sample was reverse-transcribed using PrimeScript™ RT Reagent Kit with gDNA Eraser (Takara, Dalian, China). Primer sequences are detailed in Table S1. The qRT-PCR was conducted with the POWER SYBR GREEN PCR Master Mix (Applied Biosystems, Foster City, CA, USA) and ABI 7500 real-time system (Applied Biosystems). Each reaction comprised 10 µL of PCR Master Mix, 1 µL of the first-strand cDNA template, 0.5 µM of each primer, and 8 µL of purified water. The amplification protocol consisted of an initial step at 95 °C for 30 s, followed by 40 cycles of 95 °C for 15 s, 60 °C for 35 s, and 72 °C for 35 s, concluding with melt gradient–dissociation curves. Each sample underwent triplicate analysis, using the Actin gene as an internal reference for data normalization. The relative transcript levels were analyzed using the comparative CT (∆∆CT) method [30]. Data from three biological replicates were analyzed using Student’s t-tests, with statistical significance determined at p < 0.05.

2.6. Co-Expression Network Analysis

Weighted total gene network analysis (WGCNA) was conducted with the TBtools software (https://github.com/ShawnWx2019/WGCNA-shinyApp, accessed on 27 September 2024) to analyze gene co-modules and networks [31]. The DEGs with FPKM values greater than 10 in 12 transcriptome samples (3 time points, 2 replicates and 2 treatments) were filtered for analysis. The correlation analysis between identified modules and traits utilized a signed network and Pearson’s correlation, coding pigmented samples as “1” and unpigmented samples as “0”. Based on pigment presence, a correlation analysis was performed between light-dependent pigments and the derived modules, selecting candidate modules with a correlation coefficient greater than 0.6 [32].

3. Results

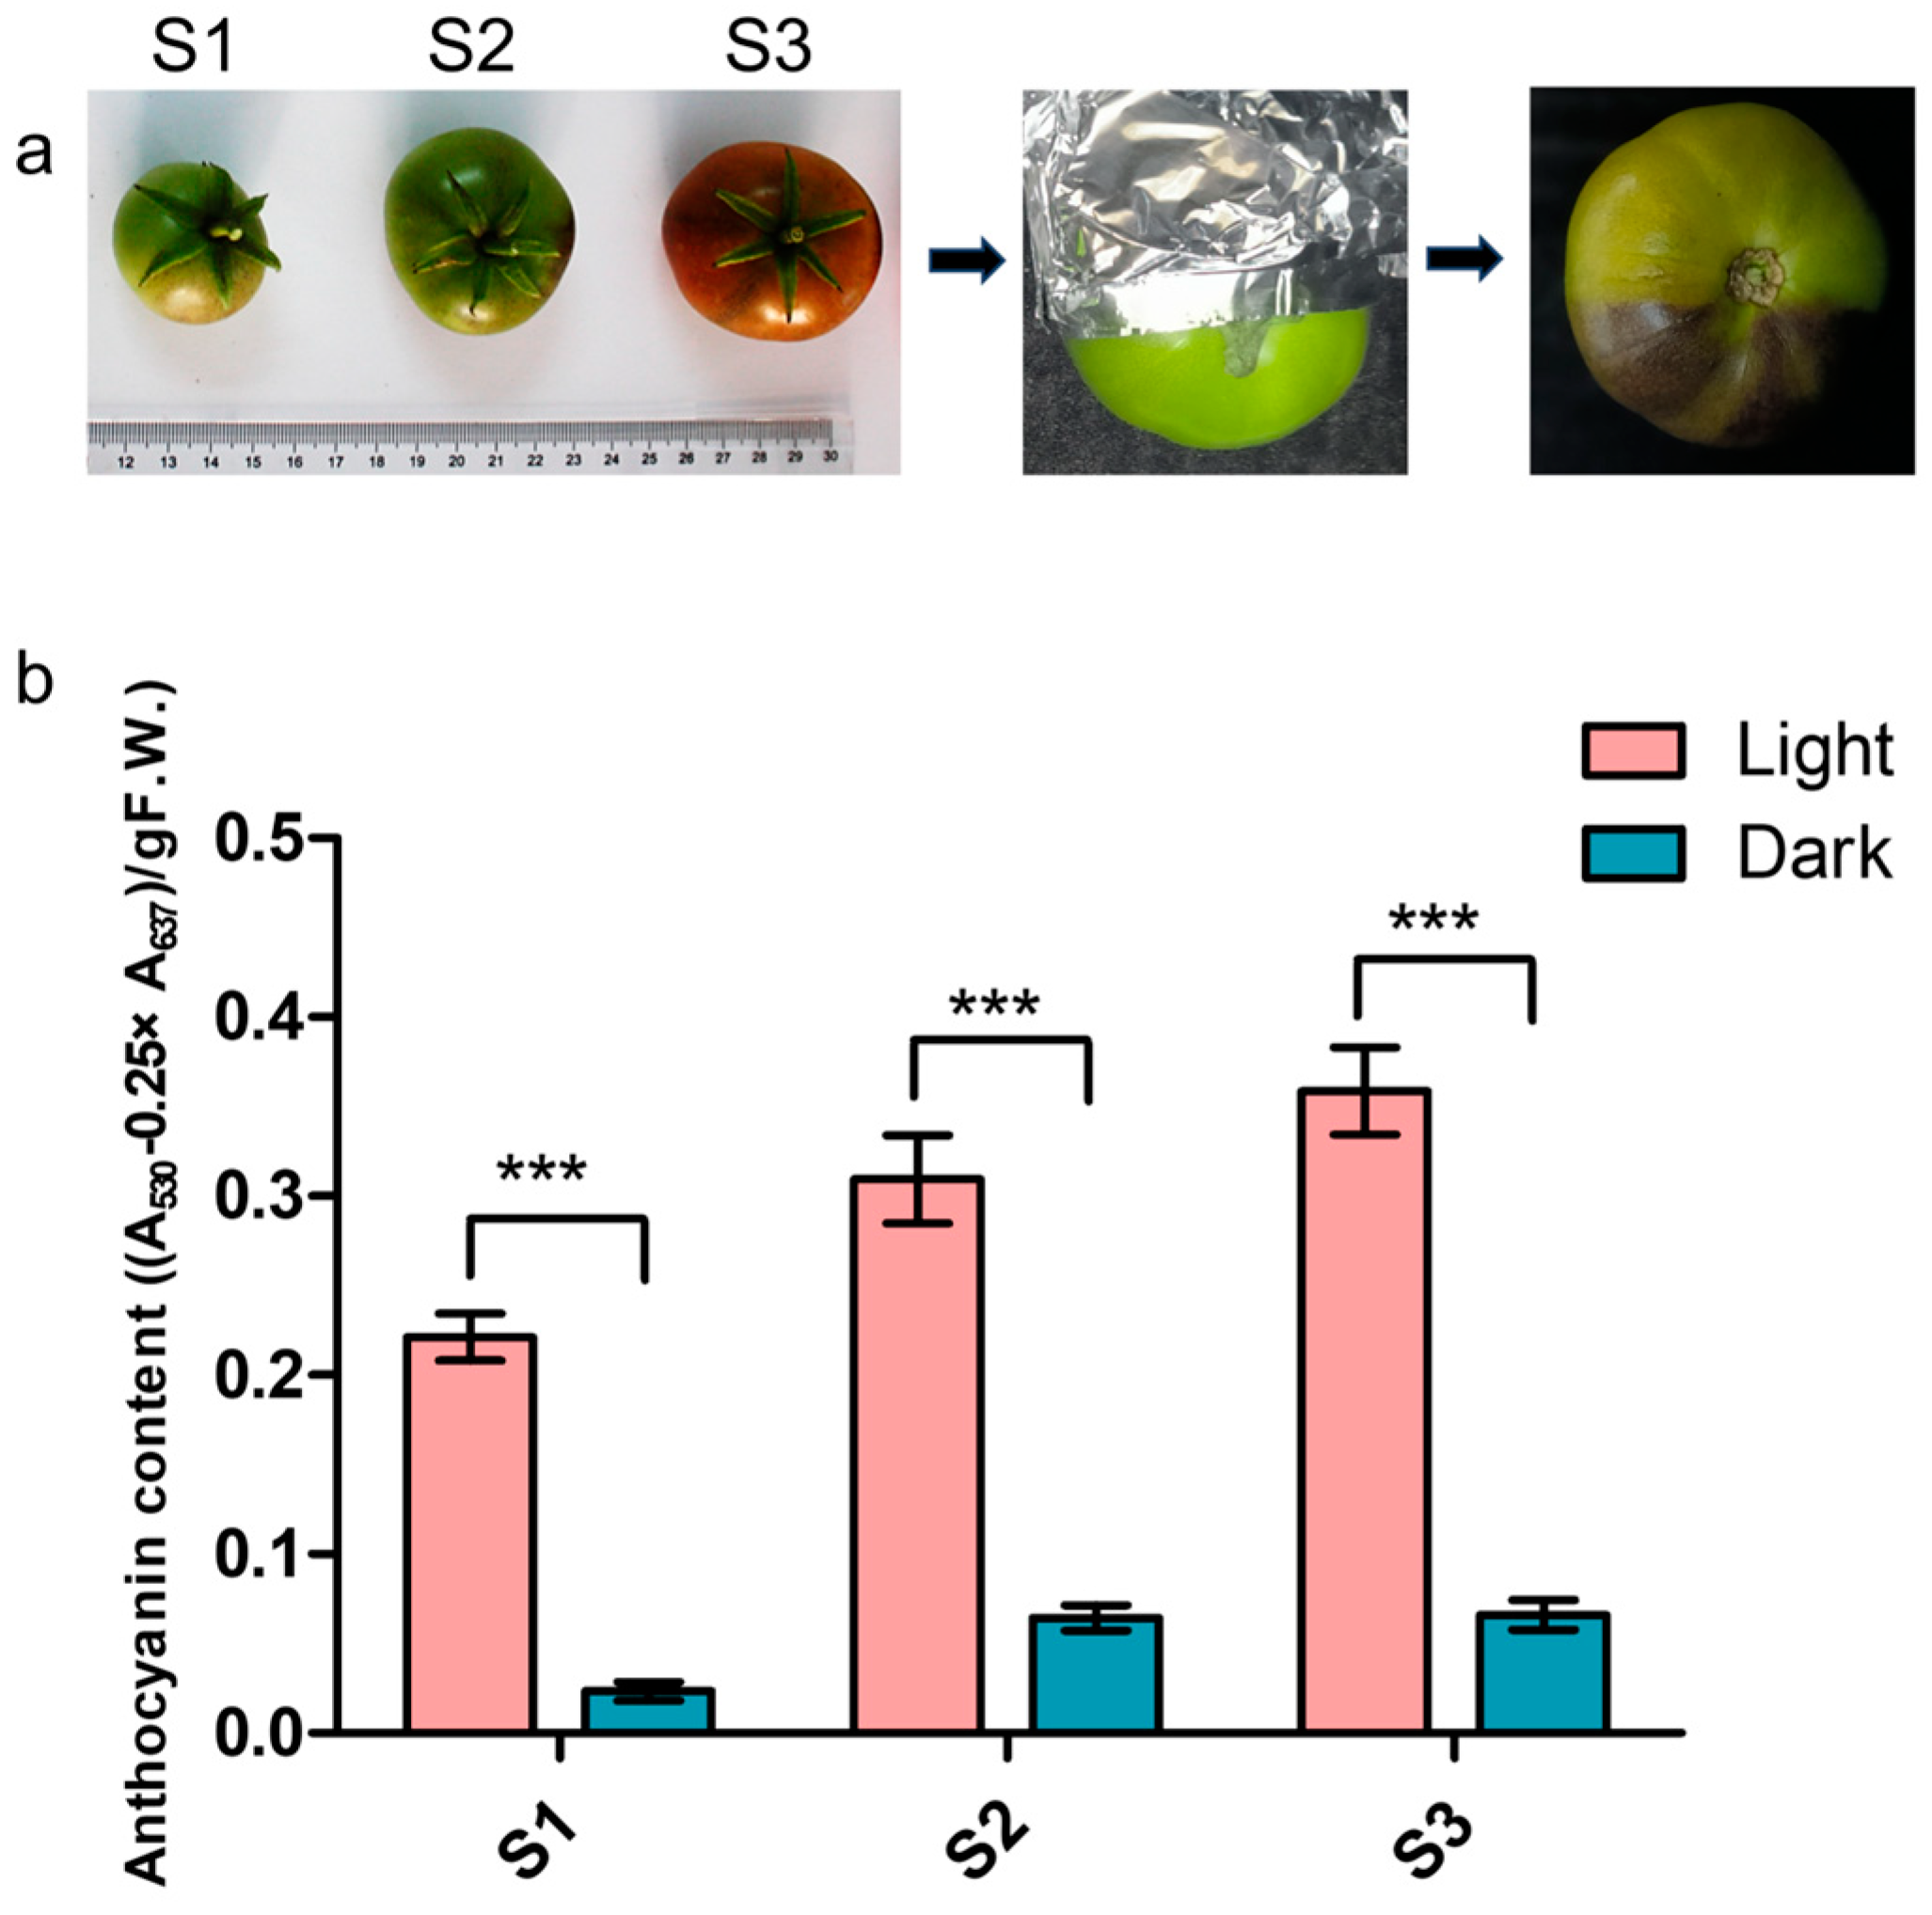
3.1. Light-Induced Anthocyanin Accumulation in Fruits of Aft Tomato

The Aft tomato fruits in three developmental stages (S1; S2; S3) were induced by light-exposed or treated by the bagged treatment (Figure 1a) to detect the content of anthocyanins. Data analysis showed that the content of anthocyanin is much higher in light-induced fruits than in bagged fruits. In addition, pigment accumulation increases with fruit development; however, the difference in anthocyanin content is not significant from the S1 to S3 developmental stages (Figure 1b). The findings suggest that light plays a crucial role in anthocyanin biosynthesis.

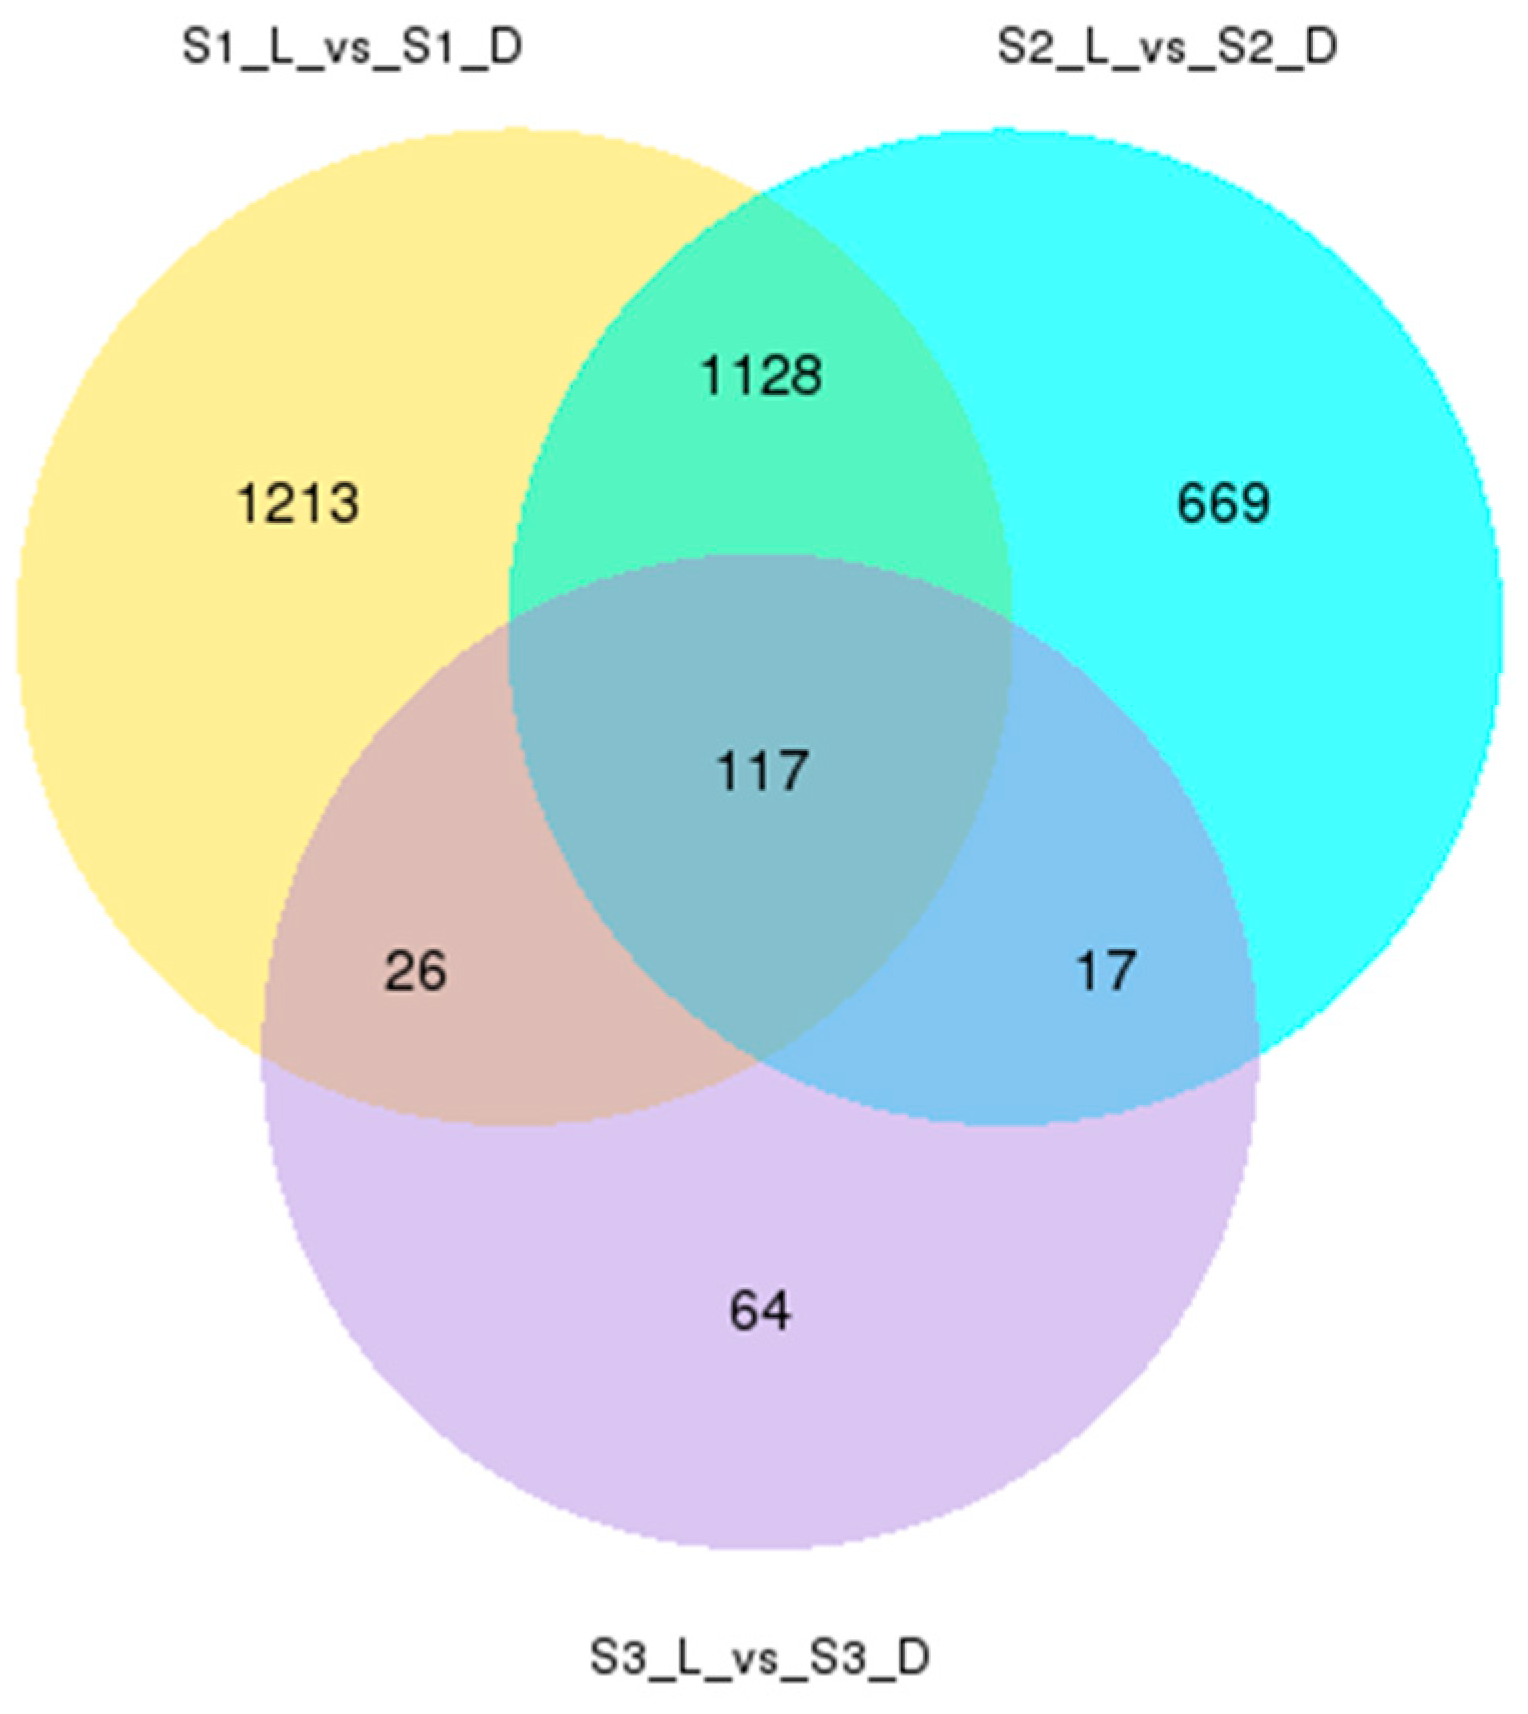
3.2. Analysis of Transcriptome Sequencing and Differential Gene Expression

The 12 RNA-seq libraries of light-exposed or bagged tomato fruit at three developmental stages were sequenced with HiSeq 2500. From 1,228,774,220 raw reads, 1,210,407,612 high-quality clean reads were obtained after eliminating adapters and low-quality sequences. The clean reads were aligned to the reference genome with match ratios between 80.86% and 87.67% (Table S2), identifying a total of 8566 expressed genes (FPKM > 0) (Table S3). Through the differential expression analysis in the three fruit development stages between light-exposed and bagged, a total of 3234 DEGs were identified. By pairwise comparison, 2484, 1913, and 224 differential genes were produced in three combinations (S1_L_vs_S1_D, S2_L_vs_S2_D, S3_L_vs_S3_D, respectively). For DEGs in samples S1_L (light-exposed) and S1_D (bagged), a total of 1131 and 1353 unigenes were up- and downregulated, respectively. In samples S2_L and S2_D, 1682 and 249 unigenes were, respectively, up- and downregulated. Additionally, 178 and 46 unigenes were up- and downregulated in S3_L and S_D, respectively (Figure S1). In the S1_L_vs_S1_D, S2_L_vs_S2_D, and S3_L_vs_S3_D combinations, 1213, 669, and 64 genes were uniquely expressed, respectively, with 117 genes being co-expressed across all three combinations (Figure 2). The results suggested that the same light-responsive genes participate in the same metabolic process during different stages of fruit development.

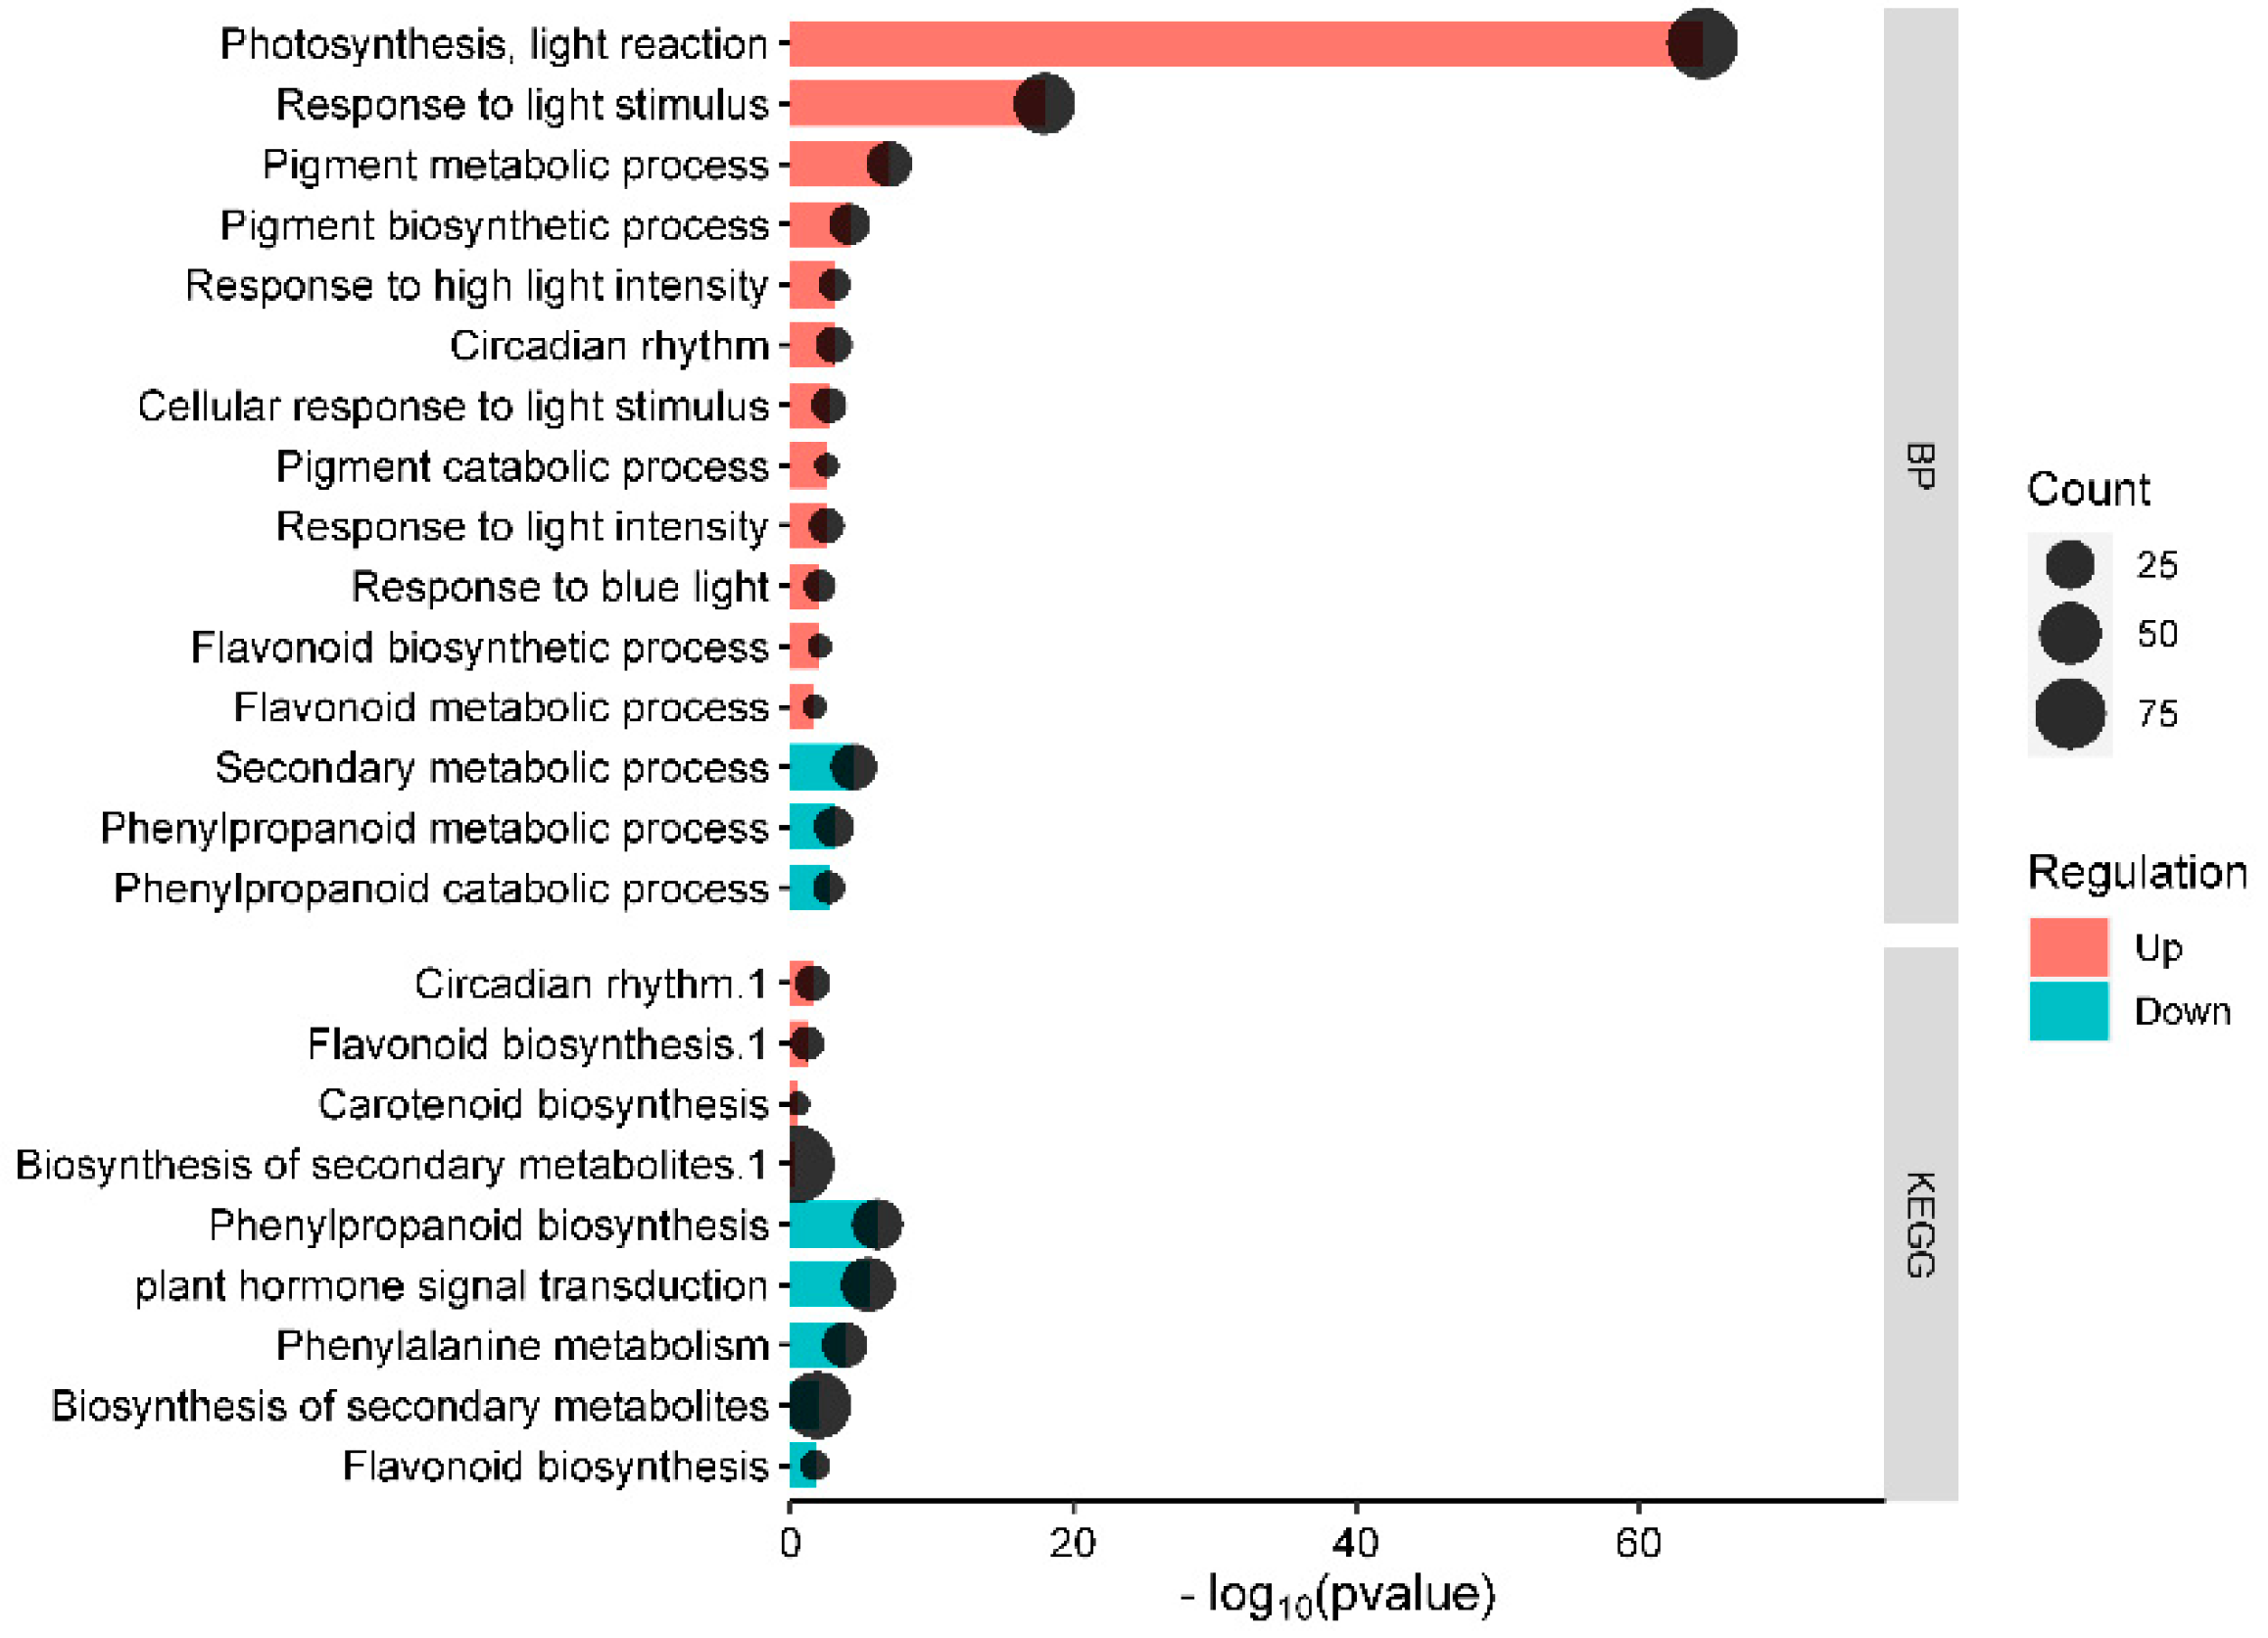
3.3. GO and KEGG Analysis of DEGs

GO and KEGG were used to classify the functions of the DEGs. The DEGs between light-exposed and bagged samples were categorized based on their molecular function, biological process, and cellular composition (Figure S2). GO enrichment analysis revealed 198, 120, and 62 significant functional categories (p-value ≤ 0.05) for S1_L_vs_S1_D, S2_L_vs_S2_D, and S3_L_vs_S3_D, respectively. In the three comparison groups, categories associated with light-regulated anthocyanin accumulation, including flavonoid metabolic process (GO:0009812), metabolic process (GO:0008152), response to light stimulus (GO:0009416), pigment biosynthetic process (GO:0046148), flavonoid biosynthetic process (GO:0009813), and transporter activity (GO:0005215) were enriched (Table S4). KEGG enrichment analysis mapped the DEGs to 38, 37 and 24 pathways in S1_L_vs_S1_D, S2_L_vs_S2_D, and S3_L_vs_S3_D, respectively (p-value ≤ 0.5) (Table S5). The pathways related to light response and anthocyanin biosynthesis include flavonoid biosynthesis (sly00941), secondary metabolite biosynthesis (sly01110), phenylpropanoid biosynthesis (sly00940), and circadian rhythm (sly04712) (Figure 3). The findings suggest that light treatment significantly influences structural genes and metabolites involved in anthocyanin biosynthesis, specifically within the phenylpropanoid and flavonoid biosynthesis pathways in fruit.

3.4. Identification of Candidate Genes

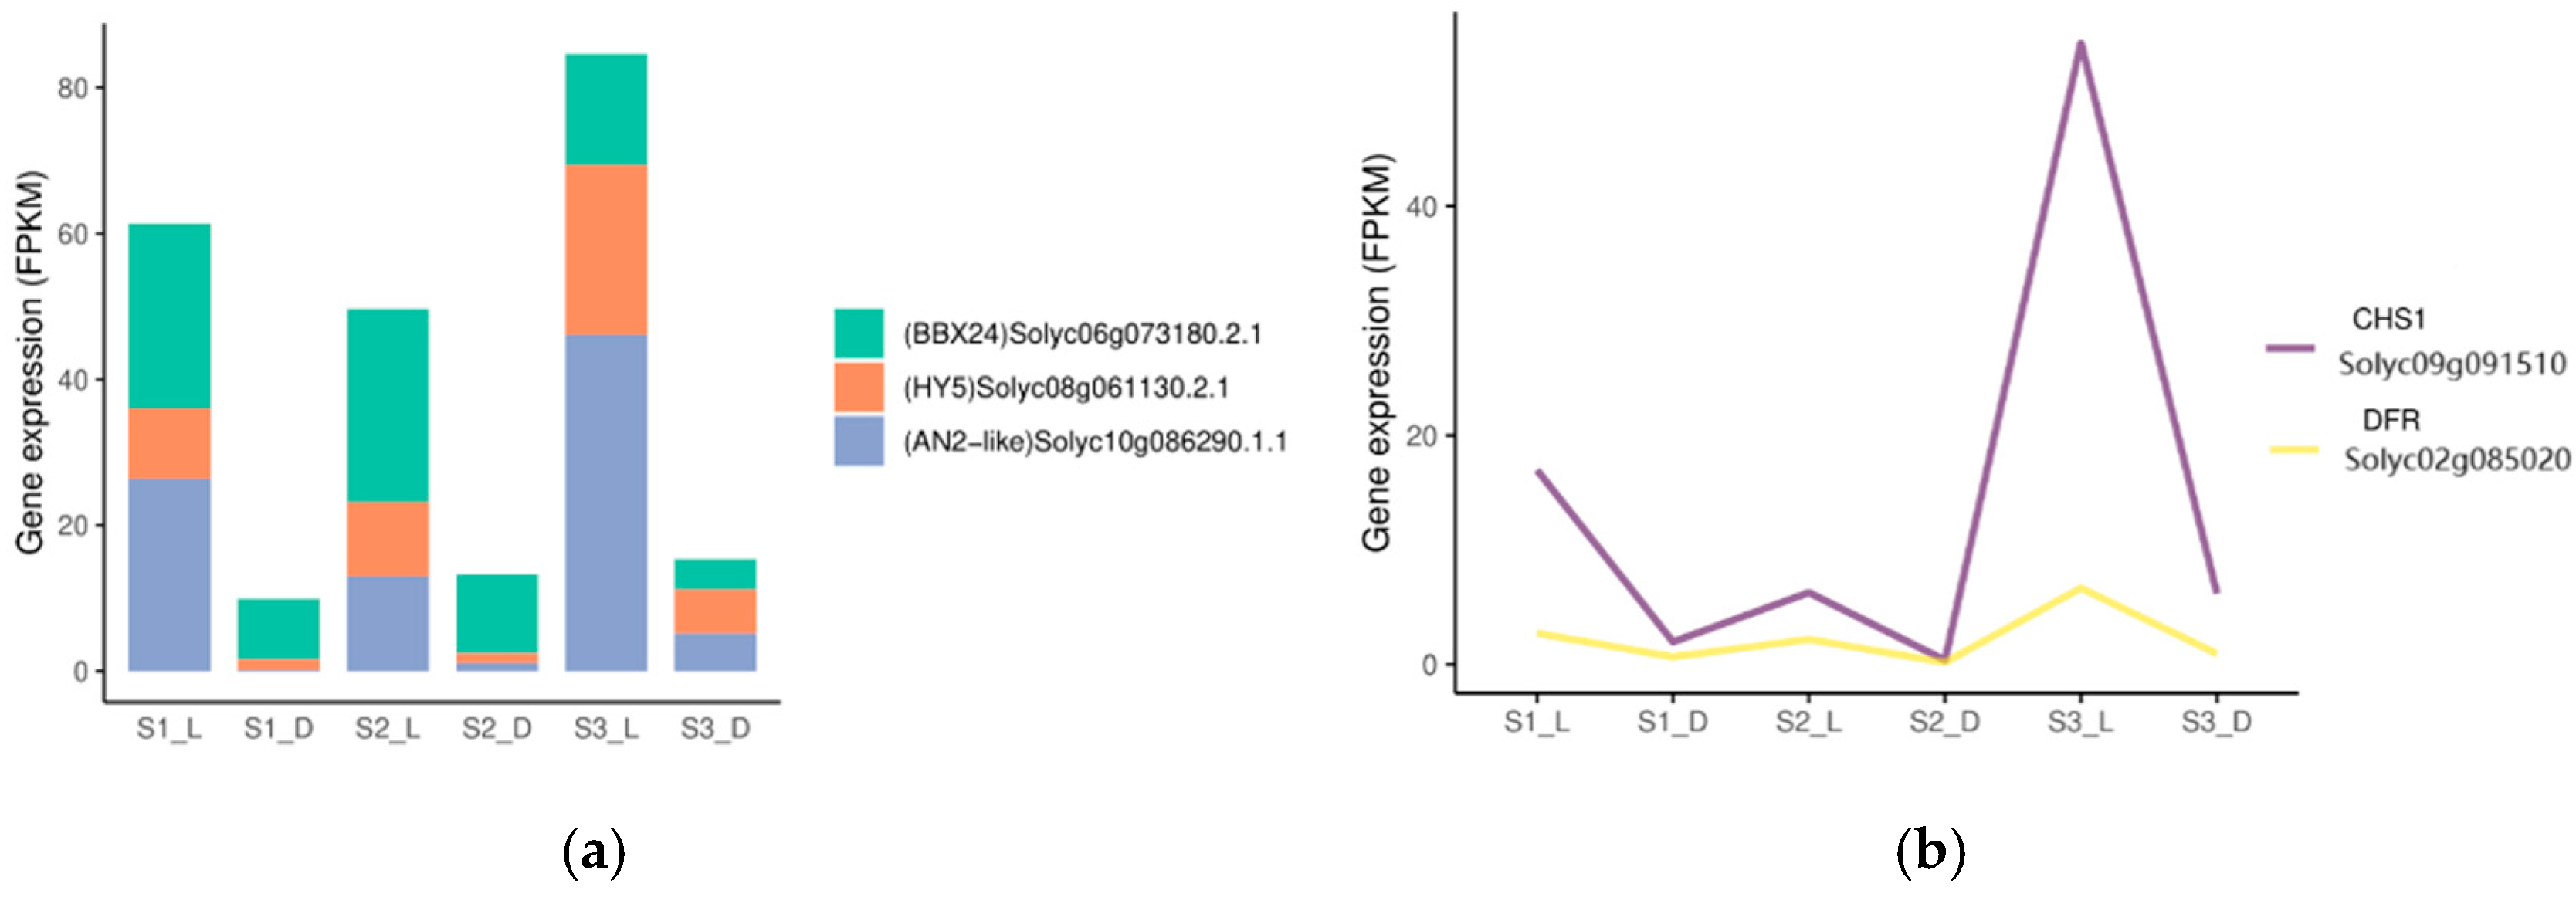
3.4.1. Genes Related to the Light Response and Signal Transduction

Based on GO enrichment and KEGG analysis, 95 genes related to response to light stimulus between the light-exposed and bagged S1 samples were obtained. In the S2 and S3 light-exposed and bagged samples, 109 and 28 genes were also enriched to response to light stimulus, respectively (Table S6). Many of these genes are mainly involved in photosystems such as Solyc03g005760.1.1, Solyc05g056050.2.1, Solyc04g082920.2.1, Solyc05g056070.2.1, Solyc12g011450.1.1, which have been annotated to the light-harvesting complex (SlLHC) and function as light receptors to capture and deliver excitation energy to photosystems. Some of these genes, such as Blue/Ultraviolet sensing protein (CRY1, Solyc12g057040.1.1), cryptochrome-interacting protein (bHLH1, Solyc01g109700.2.1), COP1-SPA E3 ligase subcomplex (SPA, Solyc12g013840.1.1), and transcription factor (HY5, Solyc08g061130.2.1), function as light receptors and light signal transduction factors responding to light stimulus. Other genes belonging to transcription factors such as MADS-box protein (Solyc10g080030.1.1), R2R3MYB protein (Solyc12g049350.1.1), SlBBX Zinc finger protein (Solyc06g073180.2.1 and Solyc03g119540.2.1), and HD-ZIP I/II protein (Solyc04g005800.2.1 and Solyc01g090460.2.1) have also been identified in response to light stimulus of GO enrichment. Transcriptome analysis revealed higher gene expression in light-exposed fruit samples compared to bagged ones (Figure 4).

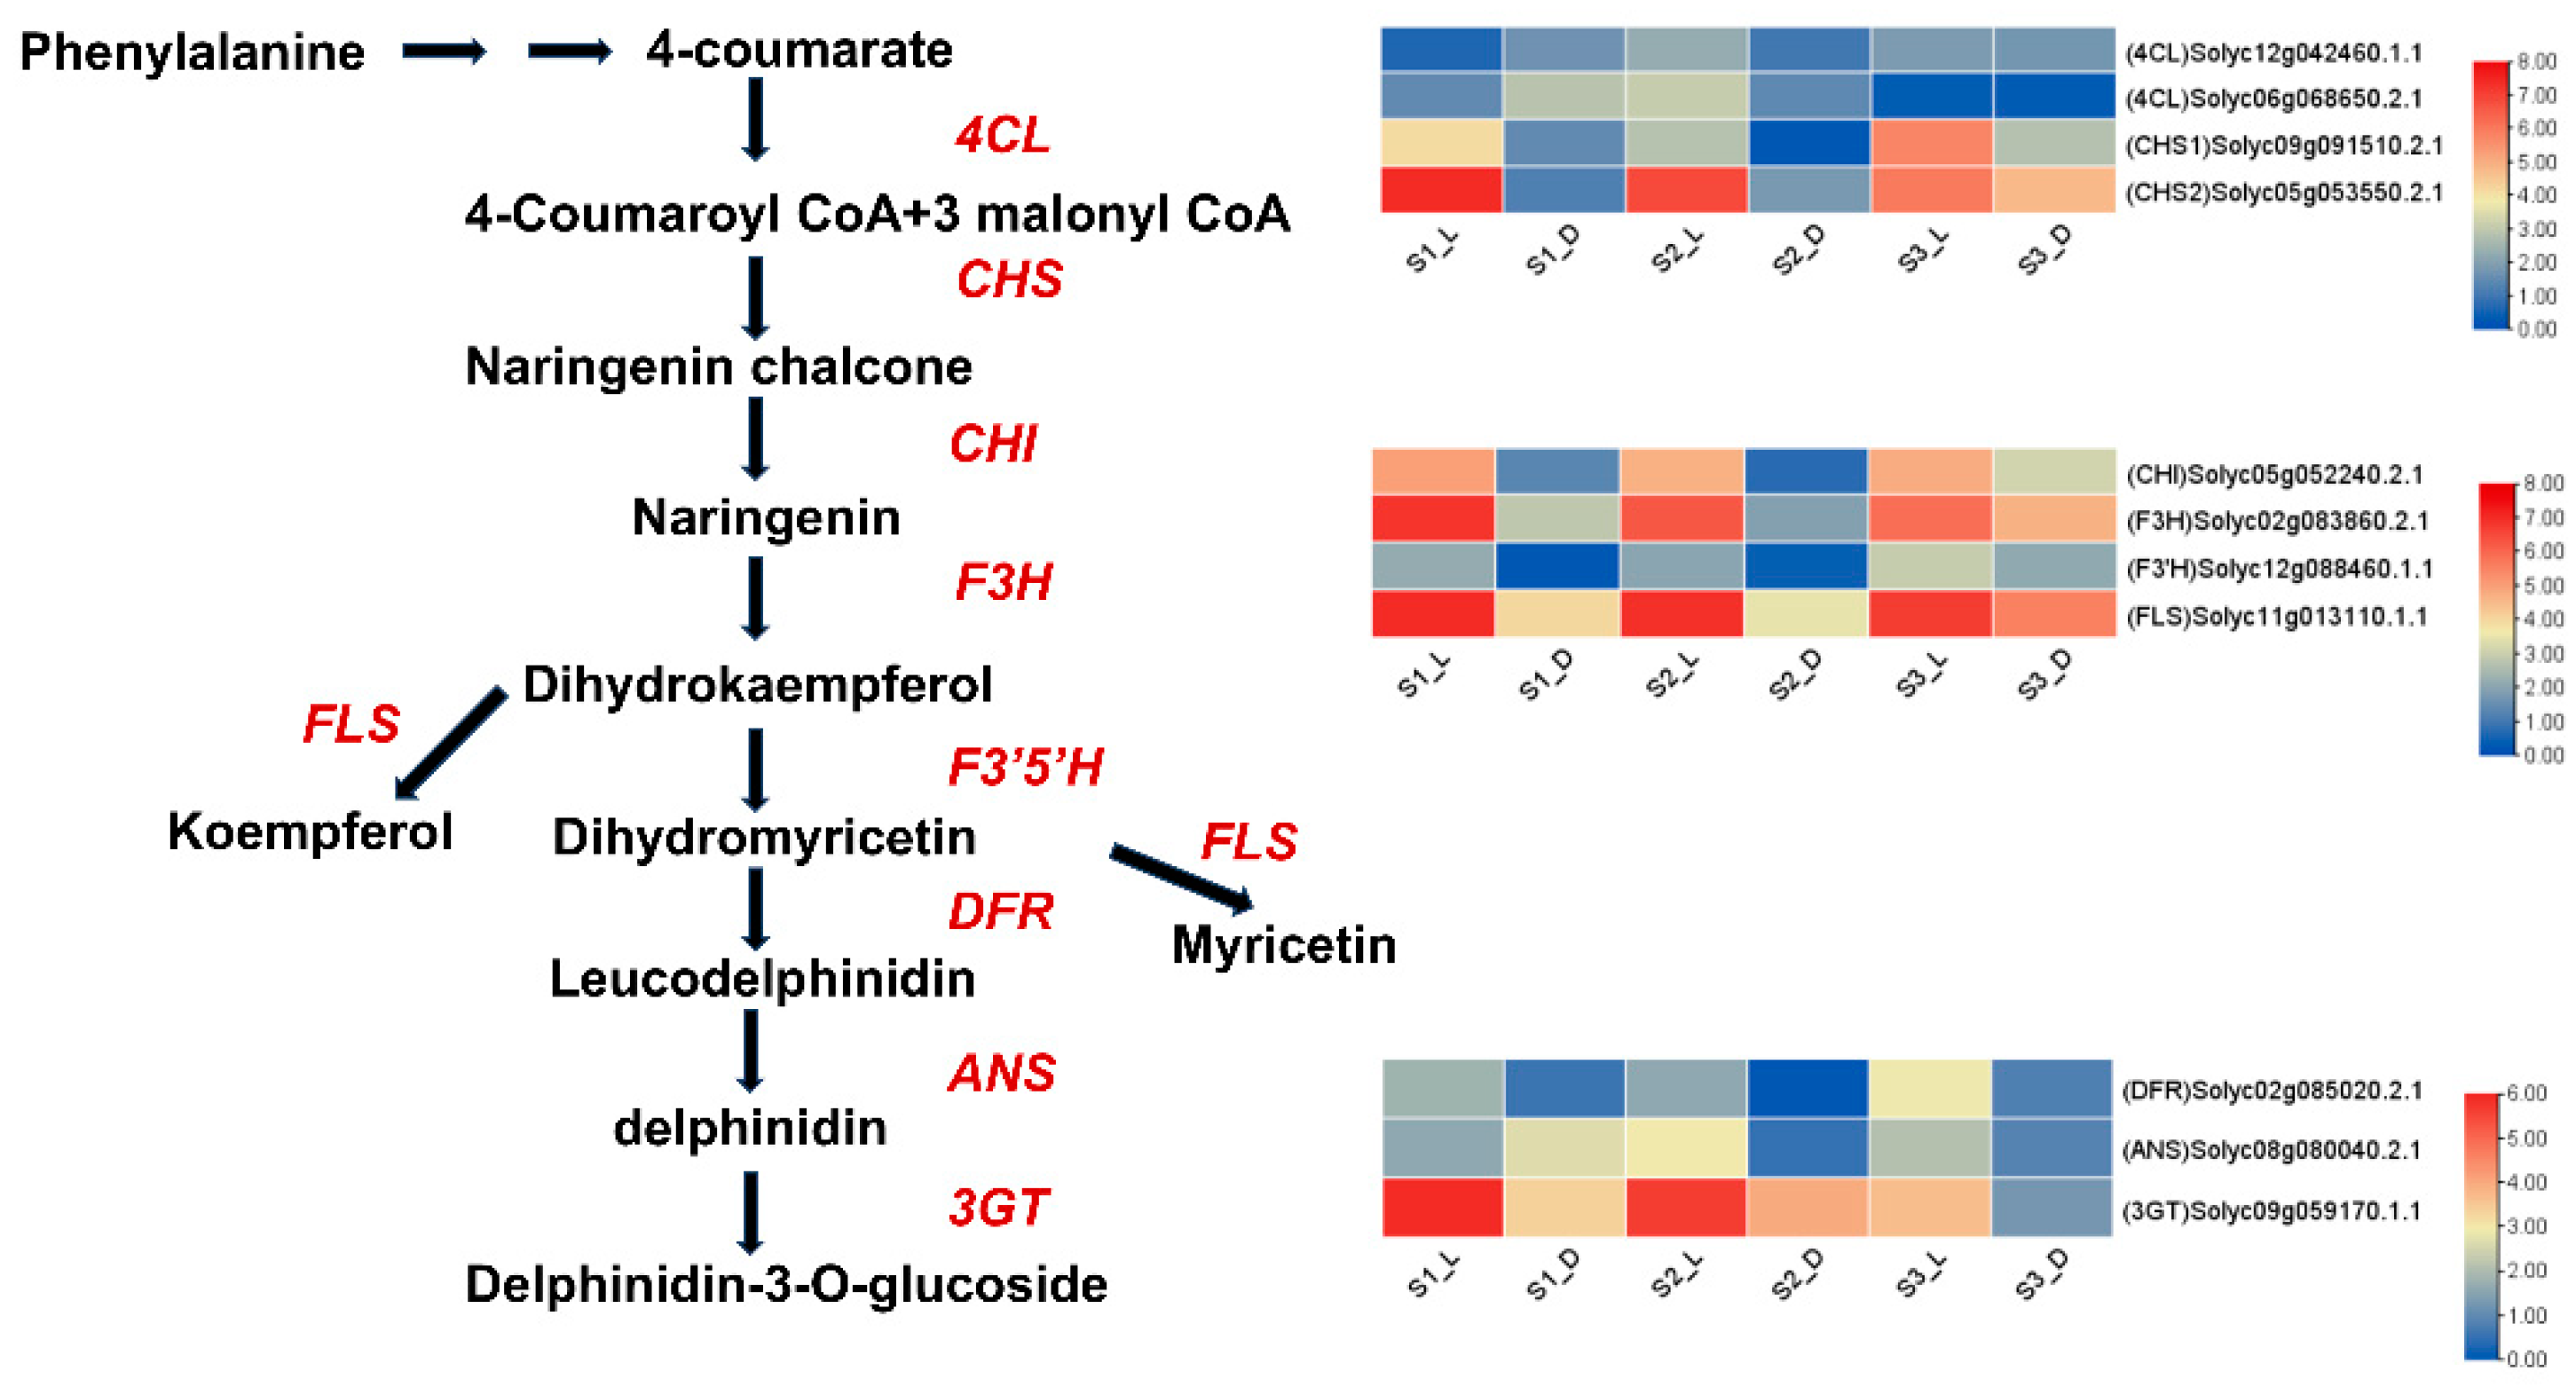
3.4.2. Genes Involved in Anthocyanin Biosynthesis

Anthocyanins originate from the phenylpropanoid pathway. According to GO enrichment and KEGG analysis of DEGs, 94, 82 and 22 genes were enriched to be involved in phenylpropanoid and flavonoid biosynthetic and metabolic process in light-exposed and bagged S1, S2 and S3 samples, respectively (Table S7). The genes 4-coumarate-CoA ligase (4CL, Solyc06g068650.2.1, Solyc12g042460.1.1), chalcone isomerase (CHI, Solyc05g052240.2.1), chalcone stilbene synthases (CHS1, Solyc09g091510.2.1; CHS2, Solyc05g053550.2.1), Glutathione S-transferase (GST, Solyc02g081340.2.1), UDP-glucosyl transferase (3-O-GT, Solyc02g085660.1.1) and anthocyanin acyltransferase (SDH29, Solyc07g008390.1.1) are annotated as participants in the anthocyanin biosynthesis pathway. Additionally, the R2R3MYB transcription factor MYB11 (Solyc12g049350.1.1) and MYB32 (Solyc10g055410.1.1), the WD40 protein SlRUP/LeCOP1Like (Solyc11g005190.1.1), and the bZIP transcription factor HY5 (Solyc08g061130.2.1) have been identified as regulators of structural gene expression in the anthocyanin biosynthetic pathway. Transcriptome data analysis revealed that gene expression levels were higher in light-exposed fruit samples compared to bagged fruit samples (Figure 5).

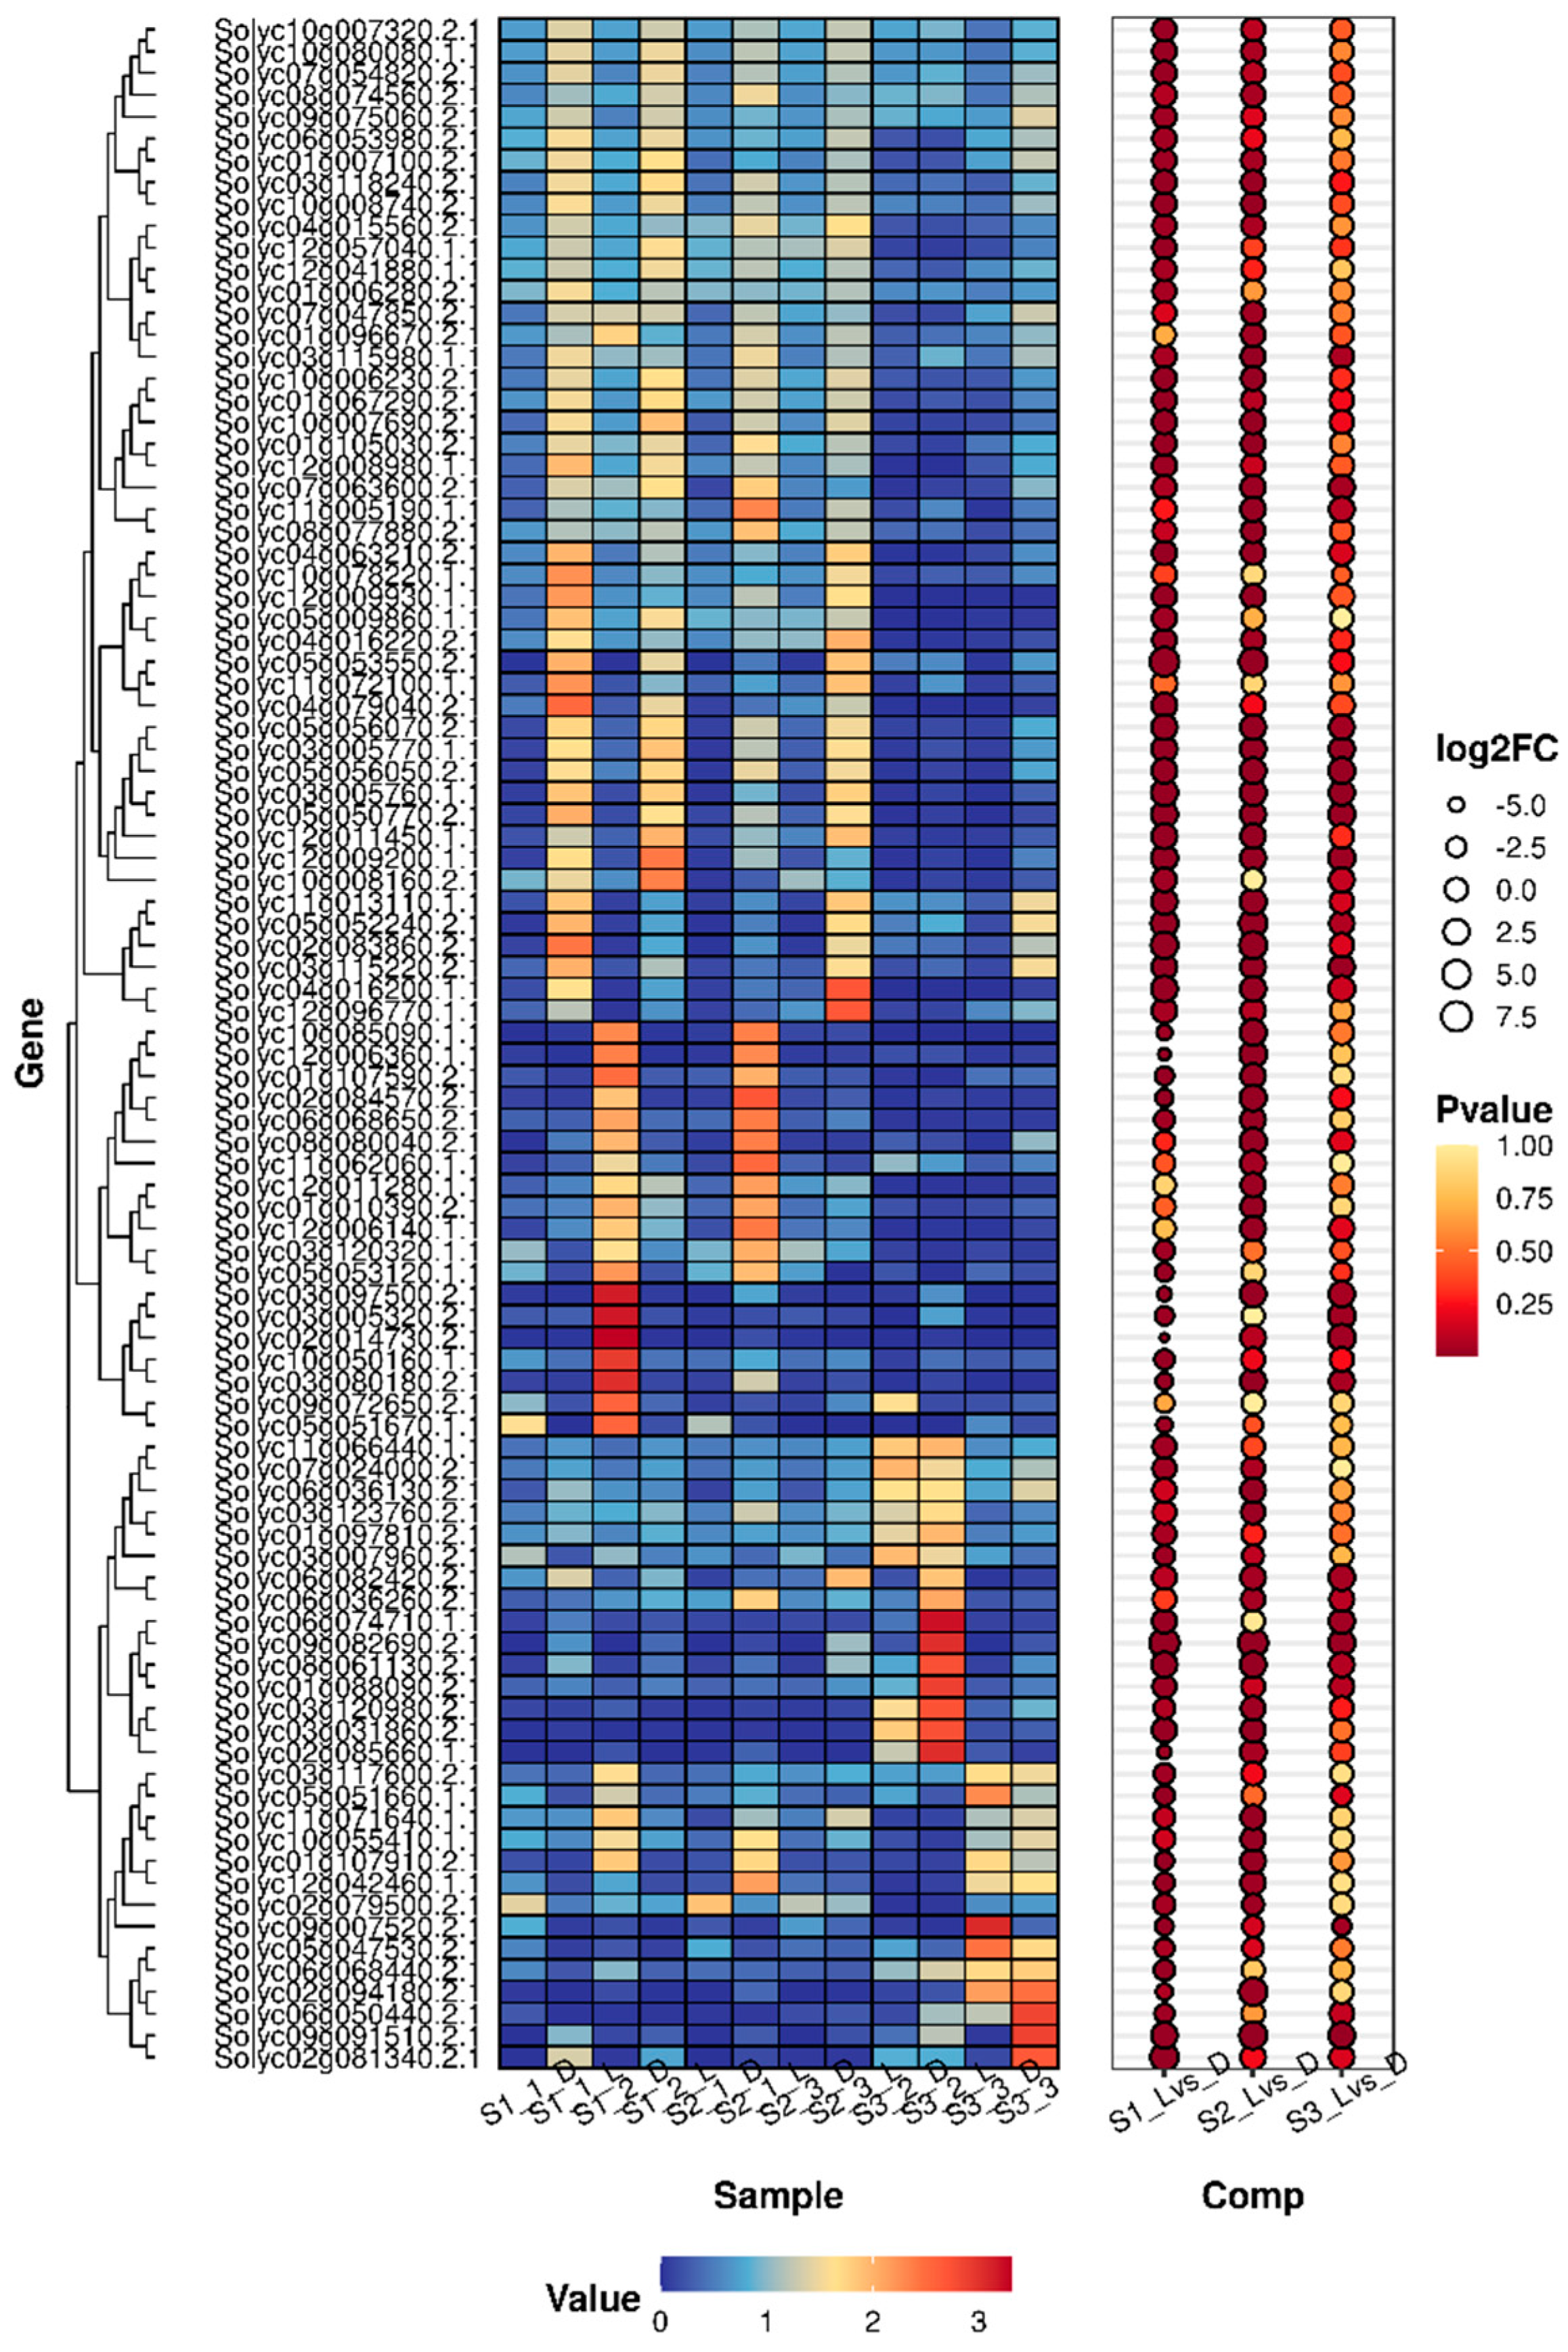
3.4.3. Gene Expression Associated with Anthocyanin Biosynthesis During Various Fruit Development Stages

In the present study, we found that the pigment deepens with fruit development, especially in mature fruit (S3 stage of development). Light treatment during fruit development led to an increased relative anthocyanin content and elevated expression of key anthocyanin biosynthesis genes. With the development of fruit to maturation, the expression of genes encoding HY5 (Solyc08g061130.2.1) and AN2-like (Solyc10g086290.1.1) transcription factors greatly increased under light induction. However, the transcription level of the negative transcription factor BBX24 decreased at the S3 stage of fruit development. The expression levels of the key structural genes CHS1 (Solyc09g091510.2.1) and DFR (Solyc02g085020.2.1), which are involved in the anthocyanin biosynthetic pathway, increased as the fruit matured (Figure 6). The results indicated that the light specifically induced anthocyanin biosynthesis in Aft tomato fruits. Simultaneously, the regulation of anthocyanin biosynthesis in fruits by light is also dependent on the development stages of tomato fruits.

3.4.4. Analysis of Differentially Expressed Genes (DEGs) Through Co-Expression Networks

Light plays a crucial role in regulating anthocyanin biosynthesis in Aft tomato fruit. We utilized weighted gene co-expression network analysis (WGCNA) on 6680 unique expression genes (Table S8) to pinpoint genes linked to light-dependent anthocyanin biosynthesis. The unique genes were organized into seven primary clusters, each representing a module of highly correlated genes, distinguished by different colors (Figure 7A). The analysis revealed a strong positive correlation (correlation coefficient > 0.6 and 0 < p < 0.05) between co-expressed genes in the black and brown modules and the light-exposed pigment (Figure 7B). The black module contained 100 genes, while the brown module contained 328 genes (Table S9), and they showed a strong correlation between light induction and anthocyanin synthesis (Figure 7C,D). The findings suggest that genes within the black and brown modules are crucial for anthocyanin synthesis in Aft tomato fruits. In the black module, anthocyanin biosynthesis structural genes, including Solyc09g091510.2.1 (CHS1), Solyc05g053550.2.1 (CHS2), Solyc05g052240.2.1 (CHI), Solyc02g083860.2.1 (F3H), Solyc02g085020.2.1 (DFR), and Solyc12g088460.1.1 (F3′H), were strongly associated with light response. Furthermore, the bZIP TF SlHY5 was also involved in light response and anthocyanin accumulation. The SlAN2-like gene, part of the MYB family, was identified as responsive to anthocyanin biosynthesis triggered by light exposure. In the brown module, genes associated with anthocyanin biosynthesis were identified, including Solyc01g067290.2.1 (SlIFR, Isoflavone reductase), Solyc09g059170.1.1 (Sl3GT, Anthocyanidin 3-O-glucosyltransferase), the regulatory gene Solyc06g073180.2.1 (SlBBX24), and light signal transduction genes Solyc08g074270.2.1 (SlCRY) and Solyc11g005190.1.1 (SlRUP), in light-treated tomato fruit. These genes are believed to be involved in light-induced pigment accumulation in Aft tomato fruits.

3.4.5. Verification of Related Genes in Tomato Fruits Under Light Treatment Using qRT-PCR

To validate RNA-seq data accuracy and identify genes involved in light signal transduction and anthocyanin biosynthesis, we selected nine differentially expressed genes: six related to anthocyanin synthesis (PAL, CHS, F3H, DFR, F3′5′H, ANS), two regulatory genes (AN2 and AN2-like), and one positive regulator of light signal transduction (HY5). qRT-PCR analysis was conducted to examine the transcription levels of these genes in both light-exposed and bagged fruits during the S2 developmental stage (Breaker stage), which is crucial for color transition (Figure 8). The expression of the SlHY5 gene in light-exposed fruits is twice that of tomato fruits subjected to the bagged treatment. The expression of SlAN2-like was elevated in fruits exposed to light compared to those treated with bags. However, the transcription level of SlAN2 was too low to be detected in the fruit. Light induction led to a 3- to 160-fold increase in the expression profiles of all six anthocyanin-synthesis-related genes, suggesting that SlAN2-like, rather than SlAN2, is crucial for anthocyanin biosynthesis in tomato fruits. Simultaneously, these genes also display high expression in the light-exposed S1 to S3 fruits, except for the SlAN2 gene. The findings confirmed that the gene expression patterns aligned with the RNA-seq results, demonstrating the validity and reliability of the RNA data. These genes are considered crucial in the influence of light on anthocyanin biosynthesis.

4. Discussion

The pigment in the fruit of Aft tomato was significantly decreased under the bagged treatment. Light significantly influences anthocyanin biosynthesis in plants [10]. Many studies have demonstrated that the bagging treatment prevented anthocyanin buildup in fruits, but when exposed to light, anthocyanins accumulated quickly [33,34]. Aft tomato could accumulate anthocyanin in the light-exposed fruits, and the key gene encoding an R2R3 MYB transcription factor, SlAN2-like, regulates the pathway of anthocyanin biosynthesis [35,36]. In our research, we found the pigment in different developmental stages of fruits is inhibited by the bagged treatment. The accumulation of anthocyanins in tomato fruits at the S1 (GR), S2 (BR), and S3 (RR) stages is primarily influenced by light induction. Moreover, the pigment in S3 stage fruits is slightly higher than that in the S1 or S2 stages. This study found that Aft tomato fruit coloration is primarily influenced by light, while fruit maturation impacts the anthocyanin biosynthesis pathway. This is consistent with the pigment of peach fruit maturation [37].

4.1. Factors Involved in Light Signal Transduction That Activate Anthocyanin Biosynthesis

Plants utilize various photoreceptors to respond to light conditions, influencing their development. These include PHYs (PHYA, PHYB, PHYC, PHYD, and PHYE) for red/far-red light absorption, CRYs (CRY1, CRY2, and CRY3) and PHOTs (PHOT1 and PHOT2) for UV-A/blue light detection, and UVR8 for UV-B perception [38,39,40,41]. In our study, SlPHYB/E, SlCRY1B, SlRUP (REPRESSOR OF UV-B PHOTOMORPHOGENESIS, the UVR8 interactor) and SlCIB1 (cryptochrome-interacting basic helix–loop–helix) were prominent among the differentially expressed genes (Figure 5). Exposure to light led to increased transcription levels of SlPHYE, SlCRY1B, and SlRUP, whereas the expression of SlPHYB and SlCIB1 was downregulated. In tomato plants, PHYE is essential for shade avoidance when PHYB1 and PHYB2 are absent, while PHYB1 and PHYB2 serve overlapping functions in safeguarding against continuous light exposure [42,43]. SlCRY1a and SlCRY2 regulate leaf photosynthetic pigment levels, with SlCRY2 playing a key role in fruit pigmentation [44]. In Arabidopsis, blue light promotes the accumulation of the CRY2-CIB1 complex, influencing transcription and floral initiation [45]. CRYs influence gene expression by interacting with the SPA1/COP1 complex, impacting photoreceptor signal transduction and plant photomorphogenesis [46]. UVR8, the photoreceptor of UV-B radiation, was negatively regulated by RUP proteins and affected the formation of UVR8-COP1-SPA [47]. In tomatoes, SlRUP transcription is stimulated by UV-B through SlUVR8 and SlHY5, and it negatively influences UVR8-mediated UV-B photomorphogenesis [48]. Furthermore, the UV8-COP1-SPA complex stabilizes the HY5 transcription factor to regulate the genes involved in UVR8-mediated responses [49]. HY5-COP1 interaction is pivotal in light signaling, facilitating cross-talk among various plant developmental pathways, including seedling photomorphogenesis, shade avoidance, anthocyanin biosynthesis, root architecture, flowering time, stomata development, hormone signaling, and stress responses [50,51]. SlCOP1 can also mediate degradation of SlJAF13 under light-induced anthocyanin biosynthesis in tomato [52]. In our results, the expression of SlHY5 was light-dependent and the transcription of SlSPA1 was also induced by light, but the expression of SlBBX24 was contrary to the expression trend of SlHY5. Under light conditions, the COP1/SPA complex promotes photomorphogenesis by destabilizing PIFs [53,54]. B-box proteins (BBX20, BBX21, and BBX22) are crucial for HY5-mediated regulation of hypocotyl elongation, anthocyanin accumulation, and transcriptional control [55]. BBX24 interacts with HY5 to inhibit its transcriptional activity [56], suggesting that SlPHYB/E, SlCRY1B, SlCIB1, SlRUP, SlSPA1, SlHY5, and SlBBX24 may be involved in regulating anthocyanin biosynthesis (Figure 9). SlHY5 is likely the key regulator in light-induced anthocyanin biosynthesis in Aft tomato fruits. This aligns with prior findings indicating that SlHY5, a key regulator in the light signaling pathway, is essential for typical tomato fruit ripening, with its loss of function hindering pigment accumulation and ethylene production [16].

4.2. Expression of Regulatory and Structural Genes in the Anthocyanin Metabolic Pathway Is Influenced by Light

The accumulation of anthocyanins in fruits is controlled by transcription factors including R2R3-MYB, bHLH, and WD40. MYB transcription factors collaborate with bHLH and WD40 proteins to form the MBW complex, which regulates the anthocyanin biosynthesis pathway [57,58]. MYB transcription factors may independently regulate anthocyanin biosynthesis, separate from the MBW complex [37,59,60]. In Aft tomato, the R2R3-MYB transcription factor SlAN2-like governs the Aft (Anthocyanin fruit) phenotype [35]. This study demonstrates that SlAN2-like transcription is light-dependent and closely associated with anthocyanin synthesis. The structural genes involved in the anthocyanin biosynthetic pathway, such as SlCHS, SlCHI, SlF3H, SlF3′5′H, SlFLS, SlDFR, and Sl3GT, exhibit elevated expression levels when exposed to light and reduced expression when subjected to bagged treatment (Figure 10). Exposure to light led to an increase in both the relative anthocyanin content and the expression levels of key genes involved in anthocyanin biosynthesis. This study found that light is essential for anthocyanin biosynthesis in Aft tomato fruits. Light is essential for fruit pigmentation in Aft tomato during development, with SlHY5 likely serving as the transcription factor for light signal transduction, regulating anthocyanin biosynthetic gene expression and light-induced pigmentation. Overexpressing SlMYB75 (SlAN2) in tomatoes induces anthocyanin accumulation in various tissues, resulting in a purple phenotype [61], suggesting the presence of additional regulators that control anthocyanin biosynthesis independently of HY5. Qiu (2019) identified both HY5-dependent and independent regulators of anthocyanin biosynthesis in tomato [51]. We identified the transcription factor MYB32 (Solyc10g055410.1.1), known as a negative regulator of anthocyanin, which inhibits the activation of the DFR promoter when co-expressed with SlAN2-like [62]. SlMYBs are key regulators of light-induced anthocyanin accumulation and fruit coloration in tomatoes. Our study also identified other transcription factors, including HD-bZIP, WRKY, R3 MYB, and NAC, which have been reported to respond to light signals and modulate anthocyanin accumulation through upregulation or downregulation [10,63]. Numerous studies have shown that light signal transduction affects anthocyanin gene expression and accumulation in fruits like grapes [64,65], sweet cherry [66], apple [34], pear [67,68], peach [69], pepper [70], blueberry [71], and litchi [72,73]. Our research results will provide theoretical and practical basis for using light to enhance fruit pigment in production, thereby increasing the commercial value of the fruits. However, the specific functions of the identified light-signal-mediated regulatory factors in anthocyanin synthesis, as well as their regulatory networks, require further investigation. Understanding these mechanisms in greater depth will be crucial for optimizing light treatments and maximizing pigment production in fruit crops. We believe that future studies will shed light on these intricate interactions and help establish more effective strategies for enhancing fruit quality.

4.3. Developmental Signals Also Regulate Anthocyanin Accumulation in Fruits

Our study revealed that pigment accumulation and transcription levels of key anthocyanin biosynthesis genes both increased as the fruit developed. The findings align with previous research on apple [74,75], peach [37], pineapple [76], and eggplant [77], suggesting a link between fruit development and pigmentation. Plant hormones are essential in regulating fruit development and ripening. In strawberries, ABA regulates anthocyanin biosynthesis during ripening [78]. Jasmonates (JAs) influence apple color development [79]. Auxin and gibberellins have been shown to inhibit anthocyanin accumulation in both grapevine [80] and apple [81]. Moreover, ethylene has been reported to be involved in ethylene-induced anthocyanin accumulation. In climacteric fruits like apples and plums, ethylene stimulates anthocyanin biosynthesis [82,83], whereas in ‘Red Zaosu’ pears, it reduces anthocyanin content [84]. In non-climacteric fruits like strawberries, ethylene treatment delays anthocyanin production [85]. Ethylene influences anthocyanin biosynthesis during fruit maturation, exhibiting a dual effect. We also found the expression of ACO and ACS genes in the ethylene biosynthesis pathway was higher in the S3 mature stage than that of the S1 and S2 unripe stages (Figure S3). The molecular mechanism through which ethylene regulates light-induced anthocyanin in mature fruits requires further investigation. Understanding this mechanism will contribute to a better comprehension of how plant hormones influence fruit development and maturation, particularly in their role in the accumulation of anthocyanins. By elucidating the interactions between ethylene and light signaling pathways, we can gain insights into the hormonal regulation of pigmentation, which is essential for improving fruit quality and marketability.

5. Conclusions

This study investigated potential regulatory genes involved in light-induced anthocyanin biosynthesis in Aft tomato fruits across different developmental stages. GO and KEGG enrichment, along with WGCNA analysis, identified numerous genes linked to light signal transduction and flavonoid accumulation. Transcription factors like SlHY5, SlAN2-like, and SlSPA1 are predicted to participate in light signal transduction and the regulation of anthocyanin biosynthetic genes. In the fruit’s light-induced pigmentation process, the key structural genes SlCHS, SlCHI, SlF3H, SlF3′5′H, SlFLS, SlDFR, and Sl3GT play crucial roles in the anthocyanin biosynthesis pathway, with their expression potentially being influenced by a developmental regulatory network. Further investigation is required to understand the regulatory network of fruit development and identify specific regulators of anthocyanin biosynthesis during fruit ripening.

Supplementary Materials

The following supporting information can be downloaded at: https://www.mdpi.com/article/10.3390/horticulturae11050535/s1, Figure S1: Volcano plot of DEGs in S1, S2, S3 fruits with light-exposed and bagged treatment; Figure S2: Statistical chart of GO function analysis in S1, S2, S3 fruits with light-exposed and bagged treatment; Figure S3: The transcription level of candidate genes in ethylene biosynthesis pathway related to anthocyanin biosynthesis and fruit development; Table S1: Primers for real-time PCR; Table S2: Summary statistics of sequencing and reference genome mapping; Table S3: The total identified expressed genes; Table S4: Significant functional categories enriched through GO analysis; Table S5: Significant pathways enriched through KEGG analysis; Table S6: Candidate light-responsed DEGs identified from Aft tomato fruits with light-exposed and light-shading treatment at S1, S2 and S3 development stages; Table S7: Candidate anthocyanin biosynthesis related DEGs identified from Aft tomato fruits with light-exposed and light-shading treatment at S1, S2 and S3 development stages; Table S8: The unique DEGs identified in Aft tomato fruits with light-exposed and light-shading treatment at S1, S2 and S3 development stages; Table S9: The genes enriched in black module and brown module through WGCNA analysis.

Author Contributions

J.L. (Jiazhen Li) and J.L. (Ji Li) detected the expression of genes by qRT-PCR. R.S. treated the samples and extracted total RNA. B.Z. designed this study, wrote the manuscript and analyzed the data of sequencing. F.Z. and H.Y. took part in the interpretation of data for this work. Q.X. took part in data analysis, reviewed and edited the manuscript. All authors have read and agreed to the published version of the manuscript.

Funding

This research was supported by the Heilongjiang Provincial Natural Science Foundation of China (LH2022C006).

Institutional Review Board Statement

Not applicable.

Informed Consent Statement

Not applicable.

Data Availability Statement

All the raw sequencing data have been deposited into the Genome Sequence Archive (GSA) database (http://bigd.big.ac.cn/gsa, accessed on 19 December 2024) in BIG Data Center under accession number CRA019276.

Conflicts of Interest

The authors declare that they have no known competing financial interests or personal relationships that could have appeared to influence the work reported in this paper.

References

  1. Belwal, T.; Singh, G.; Jeandet, P.; Pandey, A.; Giri, L.; Ramola, S.; Bhatt, I.D.; Venskutonis, P.R.; Georgiev, M.I.; Clement, C.; et al. Anthocyanins, multi-functional natural products of industrial relevance: Recent biotechnological advances. Biotechnol. Adv. 2020, 43, 107600. [Google Scholar] [CrossRef] [PubMed]
  2. Wu, Y.; Han, T.; Lyu, L.; Li, W.; Wu, W. Research progress in understanding the biosynthesis and regulation of plant anthocyanins. Sci. Hortic. 2023, 321, 112374. [Google Scholar] [CrossRef]
  3. Jones, C.M.; Mes, P.; Myers, J.R. Characterization and inheritance of the Anthocyanin fruit (Aft) tomato. J. Hered. 2003, 94, 449–456. [Google Scholar] [CrossRef]
  4. Mes, P.J.; Boches, P.; Myers, J.R.; Durst, R. Characterization of tomatoes expressing anthocyanin in the fruit. J. Am. Soc. Hortic. Sci. 2008, 133, 262–269. [Google Scholar] [CrossRef]
  5. Jaakola, L. New insights into the regulation of anthocyanin biosynthesis in fruits. Trends Plant Sci. 2013, 18, 477–483. [Google Scholar] [CrossRef] [PubMed]
  6. Liu, Y.; Zhang, X.W.; Liu, X.; Zheng, P.F.; Su, L.; Wang, G.L.; Wang, X.F.; Li, Y.Y.; You, C.X.; An, J.P. Phytochrome interacting factor MdPIF7 modulates anthocyanin biosynthesis and hypocotyl growth in apple. Plant Physiol. 2022, 188, 2342–2363. [Google Scholar] [CrossRef]
  7. Tao, R.; Bai, S.; Ni, J.; Yang, Q.; Zhao, Y.; Teng, Y. The blue light signal transduction pathway is involved in anthocyanin accumulation in ‘Red Zaosu’ pear. Planta 2018, 248, 37–48. [Google Scholar] [CrossRef] [PubMed]
  8. Kadomura-Ishikawa, Y.; Miyawaki, K.; Noji, S.; Takahashi, A. Phototropin 2 is involved in blue light-induced anthocyanin accumulation in Fragaria × ananassa fruits. J. Plant Res. 2013, 126, 847–857. [Google Scholar] [CrossRef]
  9. Li, T.; Yamane, H.; Tao, R. Preharvest long-term exposure to UV-B radiation promotes fruit ripening and modifies stage-specific anthocyanin metabolism in highbush blueberry. Hortic. Res. 2021, 8, 67. [Google Scholar] [CrossRef]
  10. Ma, Y.; Ma, X.; Gao, X.; Wu, W.; Zhou, B. Light Induced Regulation Pathway of Anthocyanin Biosynthesis in Plants. Int. J. Mol. Sci. 2021, 22, 11116. [Google Scholar] [CrossRef]
  11. Pan, C.; Liao, Y.; Shi, B.; Zhang, M.; Zhou, Y.; Wu, J.; Wu, H.; Qian, M.; Bai, S.; Teng, Y.; et al. Blue light-induced MiBBX24 and MiBBX27 simultaneously promote peel anthocyanin and flesh carotenoid biosynthesis in mango. Plant Physiol. Biochem. 2025, 219, 109315. [Google Scholar] [CrossRef] [PubMed]
  12. Hu, Y.; Wang, X.; Wu, H.; Yao, Y. The nuclear and cytoplasmic colocalization of MdGST12 regulated by MdWRKY26 and MdHY5 promotes anthocyanin accumulation by forming homodimers and interact with MdUFGT and MdDFR under light conditions in Malus. Int. J. Biol. Macromol. 2025, 289, 138666. [Google Scholar] [CrossRef]
  13. Sun, Y.; Shou, J.; Dai, Z.; Yang, X.; Jiang, G.; Shi, Y.; Chen, K. The HD-Zip transcription factor FaANL2 represses FaMYB10 to inhibit anthocyanin biosynthesis in strawberry fruit. Plant Growth Regul. 2025, 105, 515–527. [Google Scholar] [CrossRef]
  14. Chen, D.; Xu, G.; Tang, W.; Jing, Y.; Ji, Q.; Fei, Z.; Lin, R. Antagonistic basic helix-loop-helix/bZIP transcription factors form transcriptional modules that integrate light and reactive oxygen species signaling in Arabidopsis. Plant Cell 2013, 25, 1657–1673. [Google Scholar] [CrossRef] [PubMed]
  15. Chen, J.H.; Liu, Y.H.; Zhao, H.B.; Xu, J.M.; Zheng, P.; Liu, S.Q.; Sun, B.M. CsHY5 Regulates Light-Induced Anthocyanin Accumulation in. Int. J. Mol. Sci. 2025, 26, 3253. [Google Scholar] [CrossRef]
  16. Wang, W.; Wang, P.; Li, X.; Wang, Y.; Tian, S.; Qin, G. The transcription factor SlHY5 regulates the ripening of tomato fruit at both the transcriptional and translational levels. Hortic. Res. 2021, 8, 83. [Google Scholar] [CrossRef]
  17. Xu, Y.; You, C.; Xu, C.; Zhang, C.; Hu, X.; Li, X.; Ma, H.; Gong, J.; Sun, X. Red and blue light promote tomato fruit coloration through modulation of hormone homeostasis and pigment accumulation. Postharvest Biol. Technol. 2024, 207, 112588. [Google Scholar] [CrossRef]
  18. Sun, C.; Deng, L.; Du, M.; Zhao, J.; Chen, Q.; Huang, T.; Jiang, H.; Li, C.B.; Li, C. A Transcriptional Network Promotes Anthocyanin Biosynthesis in Tomato Flesh. Mol. Plant 2020, 13, 42–58. [Google Scholar] [CrossRef]
  19. Li, Y.; Shan, X.; Gao, R.; Han, T.; Zhang, J.; Wang, Y.; Kimani, S.; Wang, L.; Gao, X. MYB repressors and MBW activation complex collaborate to fine-tune flower coloration in Freesia hybrida. Commun. Biol. 2020, 3, 396. [Google Scholar] [CrossRef]
  20. Yang, S.Y.; Wang, Y.; Wang, W.X.; Wang, N.; Yan, R.; Li, S.Y.; Zhang, T.L.; Liu, J.L.; Zeng, X.F.; Zhao, S.N.; et al. Analysis of WD40 genes in kiwifruit reveals the key role of the light-induced AcTTG1-AcMYB75-AcbHLH2 complex in anthocyanin accumulation. Int. J. Biol. Macromol. 2025, 297, 139758. [Google Scholar] [CrossRef]
  21. Xu, X.W.; Zhu, Y.; Yuan, Y.; Sohail, H.; He, S.Y.; Ye, Y.; Wang, M.X.; Lv, M.; Qi, X.H.; Yang, X.D.; et al. R2R3-MYB transcription factor controls mature fruit skin color by regulating flavonoid accumulation in cucumber. Plant J. 2024, 119, 796–813. [Google Scholar] [CrossRef] [PubMed]
  22. Zhang, T.; Xu, H.; Yang, G.; Wang, N.; Zhang, J.; Wang, Y.; Jiang, S.; Fang, H.; Zhang, Z.; Chen, X. Molecular mechanism of MYB111 and WRKY40 involved in anthocyanin biosynthesis in red-fleshed apple callus. Plant Cell Tissue Organ Cult. (PCTOC) 2019, 139, 467–478. [Google Scholar] [CrossRef]
  23. Liu, W.; Mei, Z.; Yu, L.; Gu, T.; Li, Z.; Zou, Q.; Zhang, S.; Fang, H.; Wang, Y.; Zhang, Z.; et al. The ABA-induced NAC transcription factor MdNAC1 interacts with a bZIP-type transcription factor to promote anthocyanin synthesis in red-fleshed apples. Hortic. Res. 2023, 10, uhad049. [Google Scholar] [CrossRef]
  24. Li, D.L.; Zhu, M.L.; Li, S.H.; Wang, P.Q.; Li, J.Y.; Ge, H.Y.; Liu, Y.; Chen, H.Y. Eggplant transcription factor SmERF118 mediates light signaling regulation of anthocyanin synthesis. Plant Physiol. Biochem. 2025, 221, 109584. [Google Scholar] [CrossRef] [PubMed]
  25. Nie, Y.X.; Lei, Y.Y.; Jiao, H.B.; Zhang, Z.; Yao, J.X.; Li, H.; Dai, H.Y.; Zhang, Z.H.; Zhang, J.X. Ubiquitin-mediated degradation of the inhibitor FvMYB1 and the activator FvBBX20 by FvCSN5 balances anthocyanin biosynthesis in strawberry fruit. Plant J. 2025, 121, e70021. [Google Scholar] [CrossRef]
  26. Hosmani, P.S.; Flores-Gonzalez, M.; van de Geest, H.; Maumus, F.; Bakker, L.V.; Schijlen, E.; van Haarst, J.; Cordewener, J.; Sanchez-Perez, G.; Peters, S.; et al. An improved de novo assembly and annotation of the tomato reference genome using single-molecule sequencing, Hi-C proximity ligation and optical maps. bioRxiv 2019, 767764. [Google Scholar] [CrossRef]
  27. Kim, D.; Paggi, J.M.; Park, C.; Bennett, C.; Salzberg, S.L. Graph-based genome alignment and genotyping with HISAT2 and HISAT-genotype. Nat. Biotechnol. 2019, 37, 907–915. [Google Scholar] [CrossRef]
  28. Robinson, M.D.; McCarthy, D.J.; Smyth, G.K. edgeR: A Bioconductor package for differential expression analysis of digital gene expression data. Bioinformatics 2010, 26, 139–140. [Google Scholar] [CrossRef]
  29. Chen, T.; Liu, Y.X.; Huang, L. ImageGP: An easy-to-use data visualization web server for scientific researchers. Imeta 2022, 1, e5. [Google Scholar] [CrossRef]
  30. Livak, K.J.; Schmittgen, T.D. Analysis of relative gene expression data using real-time quantitative PCR and the 2−ΔΔCT Method. Methods 2001, 25, 402–408. [Google Scholar] [CrossRef]
  31. Langfelder, P.; Horvath, S. WGCNA: An R package for weighted correlation network analysis. BMC Bioinform. 2008, 9, 559. [Google Scholar] [CrossRef] [PubMed]
  32. Song, Z.Y.; Chao, F.; Zhuo, Z.; Ma, Z.; Li, W.; Chen, G. Identification of hub genes in prostate cancer using robust rank aggregation and weighted gene co-expression network analysis. Aging 2019, 11, 4736–4756. [Google Scholar] [CrossRef]
  33. Yang, T.; Ma, H.; Li, Y.; Zhang, Y.; Zhang, J.; Wu, T.; Song, T.; Yao, Y.; Tian, J. Apple MPK4 mediates phosphorylation of MYB1 to enhance light-induced anthocyanin accumulation. Plant J. 2021, 106, 1728–1745. [Google Scholar] [CrossRef]
  34. Xing, Y.; Sun, W.; Sun, Y.; Li, J.; Zhang, J.; Wu, T.; Song, T.; Yao, Y.; Tian, J. MPK6-mediated HY5 phosphorylation regulates light-induced anthocyanin accumulation in apple fruit. Plant Biotechnol. J. 2023, 21, 283–301. [Google Scholar] [CrossRef] [PubMed]
  35. Yan, S.; Chen, N.; Huang, Z.; Li, D.; Zhi, J.; Yu, B.; Liu, X.; Cao, B.; Qiu, Z. Anthocyanin Fruit encodes an R2R3-MYB transcription factor, SlAN2-like, activating the transcription of SlMYBATV to fine-tune anthocyanin content in tomato fruit. New Phytol. 2020, 225, 2048–2063. [Google Scholar] [CrossRef]
  36. Colanero, S.; Tagliani, A.; Perata, P.; Gonzali, S. Alternative Splicing in the Anthocyanin Fruit Gene Encoding an R2R3 MYB Transcription Factor Affects Anthocyanin Biosynthesis in Tomato Fruits. Plant Commun. 2019, 1, 100006. [Google Scholar] [CrossRef] [PubMed]
  37. Khan, I.A.; Rahman, M.; Sakhi, S.; Nawaz, G.; Khan, A.; Ahmad, T.; Adnan, M.; Khan, S. PpMYB39 Activates PpDFR to Modulate Anthocyanin Biosynthesis during Peach Fruit Maturation. Horticulturae 2022, 8, 332. [Google Scholar] [CrossRef]
  38. Xu, P.B.; Lian, H.L.; Wang, W.X.; Xu, F.; Yang, H.Q. Pivotal Roles of the Phytochrome-Interacting Factors in Cryptochrome Signaling. Mol. Plant 2016, 9, 496–497. [Google Scholar] [CrossRef]
  39. Pierik, R.; Ballare, C.L. Control of Plant Growth and Defense by Photoreceptors: From Mechanisms to Opportunities in Agriculture. Mol. Plant 2022, 15, 1825. [Google Scholar] [CrossRef]
  40. Tissot, N.; Ulm, R. Cryptochrome-mediated blue-light signalling modulates UVR8 photoreceptor activity and contributes to UV-B tolerance in Arabidopsis. Nat. Commun. 2020, 11, 1323. [Google Scholar] [CrossRef]
  41. Legris, M.; Ince, Y.C.; Fankhauser, C. Molecular mechanisms underlying phytochrome-controlled morphogenesis in plants. Nat. Commun. 2019, 10, 5219. [Google Scholar] [CrossRef] [PubMed]
  42. Schrager-Lavelle, A.; Herrera, L.A.; Maloof, J.N. Tomato phyE Is Required for Shade Avoidance in the Absence of phyB1 and phyB2. Front. Plant Sci. 2016, 7, 1275. [Google Scholar] [CrossRef]
  43. Velez-Ramirez, A.I.; Vreugdenhil, D.; Millenaar, F.F.; van Ieperen, W. Phytochrome A Protects Tomato Plants from Injuries Induced by Continuous Light. Front. Plant Sci. 2019, 10, 19. [Google Scholar] [CrossRef] [PubMed]
  44. Fantini, E.; Sulli, M.; Zhang, L.; Aprea, G.; Jimenez-Gomez, J.M.; Bendahmane, A.; Perrotta, G.; Giuliano, G.; Facella, P. Pivotal Roles of Cryptochromes 1a and 2 in Tomato Development and Physiology. Plant Physiol. 2019, 179, 732–748. [Google Scholar] [CrossRef]
  45. Liu, H.; Yu, X.; Li, K.; Klejnot, J.; Yang, H.; Lisiero, D.; Lin, C. Photoexcited CRY2 interacts with CIB1 to regulate transcription and floral initiation in Arabidopsis. Science 2008, 322, 1535–1539. [Google Scholar] [CrossRef]
  46. Liu, H.; Liu, B.; Zhao, C.; Pepper, M.; Lin, C. The action mechanisms of plant cryptochromes. Trends Plant Sci. 2011, 16, 684–691. [Google Scholar] [CrossRef] [PubMed]
  47. Wang, L.; Wang, Y.; Chang, H.; Ren, H.; Wu, X.; Wen, J.; Guan, Z.; Ma, L.; Qiu, L.; Yan, J.; et al. RUP2 facilitates UVR8 redimerization via two interfaces. Plant Commun. 2023, 4, 100428. [Google Scholar] [CrossRef]
  48. Zhang, C.; Zhang, Q.; Guo, H.; Yu, X.; Liang, W.; Chen, Y.; Yin, R.; Lin, L. Tomato SlRUP is a negative regulator of UV-B photomorphogenesis. Mol. Hortic. 2021, 1, 8. [Google Scholar] [CrossRef]
  49. Liu, W.; Giuriani, G.; Havlikova, A.; Li, D.; Lamont, D.J.; Neugart, S.; Velanis, C.N.; Petersen, J.; Hoecker, U.; Christie, J.M.; et al. Phosphorylation of Arabidopsis UVR8 photoreceptor modulates protein interactions and responses to UV-B radiation. Nat. Commun. 2024, 15, 1221. [Google Scholar] [CrossRef]
  50. Bhatnagar, A.; Singh, S.; Khurana, J.P.; Burman, N. HY5-COP1: The central module of light signaling pathway. J. Plant Biochem. Biotechnol. 2020, 29, 590–610. [Google Scholar] [CrossRef]
  51. Qiu, Z.; Wang, H.; Li, D.; Yu, B.; Hui, Q.; Yan, S.; Huang, Z.; Cui, X.; Cao, B. Identification of Candidate HY5-Dependent and -Independent Regulators of Anthocyanin Biosynthesis in Tomato. Plant Cell Physiol. 2019, 60, 643–656. [Google Scholar] [CrossRef] [PubMed]
  52. Cao, Z.Q.; Chen, Y.Z.; Chen, Y.S.; Wang, X.; Phyon, J.M.; Zhou, S.P.; Cao, Z.Q.; Wang, Y.; Yang, J.F. Light regulates SlCOP1-mediated degradation of SlJAF13, a transcription factor essential for anthocyanin biosynthesis in tomato fruit. Plant Physiol. Biochem. 2025, 221, 109572. [Google Scholar] [CrossRef] [PubMed]
  53. Zhu, L.; Bu, Q.; Xu, X.; Paik, I.; Huang, X.; Hoecker, U.; Deng, X.W.; Huq, E. CUL4 forms an E3 ligase with COP1 and SPA to promote light-induced degradation of PIF1. Nat. Commun. 2015, 6, 7245. [Google Scholar] [CrossRef]
  54. Paik, I.; Chen, F.; Ngoc Pham, V.; Zhu, L.; Kim, J.I.; Huq, E. A phyB-PIF1-SPA1 kinase regulatory complex promotes photomorphogenesis in Arabidopsis. Nat. Commun. 2019, 10, 4216. [Google Scholar] [CrossRef] [PubMed]
  55. Bursch, K.; Toledo-Ortiz, G.; Pireyre, M.; Lohr, M.; Braatz, C.; Johansson, H. Identification of BBX proteins as rate-limiting cofactors of HY5. Nat. Plants 2020, 6, 921–928. [Google Scholar] [CrossRef]
  56. Xu, D. COP1 and BBXs-HY5-mediated light signal transduction in plants. New Phytol. 2020, 228, 1748–1753. [Google Scholar] [CrossRef]
  57. Xu, W.; Dubos, C.; Lepiniec, L. Transcriptional control of flavonoid biosynthesis by MYB-bHLH-WDR complexes. Trends Plant Sci. 2015, 20, 176–185. [Google Scholar] [CrossRef]
  58. Lloyd, A.; Brockman, A.; Aguirre, L.; Campbell, A.; Bean, A.; Cantero, A.; Gonzalez, A. Advances in the MYB-bHLH-WD Repeat (MBW) Pigment Regulatory Model: Addition of a WRKY Factor and Co-option of an Anthocyanin MYB for Betalain Regulation. Plant Cell Physiol. 2017, 58, 1431–1441. [Google Scholar] [CrossRef]
  59. Sun, C.; Wang, C.; Zhang, W.; Liu, S.; Wang, W.; Yu, X.; Song, T.; Yu, M.; Yu, W.; Qu, S. The R2R3-type MYB transcription factor MdMYB90-like is responsible for the enhanced skin color of an apple bud sport mutant. Hortic. Res. 2021, 8, 156. [Google Scholar] [CrossRef]
  60. Zhong, C.; Tang, Y.; Pang, B.; Li, X.; Yang, Y.; Deng, J.; Feng, C.; Li, L.; Ren, G.; Wang, Y.; et al. The R2R3-MYB transcription factor GhMYB1a regulates flavonol and anthocyanin accumulation in Gerbera hybrida. Hortic. Res. 2020, 7, 78. [Google Scholar] [CrossRef]
  61. Jian, W.; Cao, H.; Yuan, S.; Liu, Y.; Lu, J.; Lu, W.; Li, N.; Wang, J.; Zou, J.; Tang, N.; et al. SlMYB75, an MYB-type transcription factor, promotes anthocyanin accumulation and enhances volatile aroma production in tomato fruits. Hortic. Res. 2019, 6, 22. [Google Scholar] [CrossRef] [PubMed]
  62. Menconi, J.; Perata, P.; Gonzali, S. Novel R2R3 MYB transcription factors regulate anthocyanin synthesis in Aubergine tomato plants. BMC Plant Biol. 2023, 23, 148. [Google Scholar] [CrossRef] [PubMed]
  63. Yang, J.; Chen, Y.; Xiao, Z.; Shen, H.; Li, Y.; Wang, Y. Multilevel regulation of anthocyanin-promoting R2R3-MYB transcription factors in plants. Front. Plant Sci. 2022, 13, 1008829. [Google Scholar] [CrossRef]
  64. Li, H.; Bai, Y.; Yang, Y.; Zheng, H.; Xu, X.; Li, H.; Wang, W.; Tao, J. Transcriptomic analyses reveal light-regulated anthocyanin accumulation in ‘ZhongShan-HongYu’ grape berries. Sci. Hortic. 2023, 309, 111669. [Google Scholar] [CrossRef]
  65. Sun, L.; Li, S.; Tang, X.; Fan, X.; Zhang, Y.; Jiang, J.; Liu, J.; Liu, C. Transcriptome analysis reveal the putative genes involved in light-induced anthocyanin accumulation in grape ‘Red Globe’ (V. vinifera L.). Gene 2020, 728, 144284. [Google Scholar] [CrossRef] [PubMed]
  66. Zhang, Y.; Chen, C.; Cui, Y.; Du, Q.; Tang, W.; Yang, W.; Kou, G.; Tang, W.; Chen, H.; Gong, R. Potential regulatory genes of light induced anthocyanin accumulation in sweet cherry identified by combining transcriptome and metabolome analysis. Front. Plant Sci. 2023, 14, 1238624. [Google Scholar] [CrossRef]
  67. Liu, H.; Su, J.; Zhu, Y.; Yao, G.; Allan, A.C.; Ampomah-Dwamena, C.; Shu, Q.; Lin-Wang, K.; Zhang, S.; Wu, J. The involvement of PybZIPa in light-induced anthocyanin accumulation via the activation of PyUFGT through binding to tandem G-boxes in its promoter. Hortic. Res. 2019, 6, 134. [Google Scholar] [CrossRef]
  68. Liu, H.; Shu, Q.; Lin-Wang, K.; Allan, A.C.; Espley, R.V.; Su, J.; Pei, M.; Wu, J. The PyPIF5-PymiR156a-PySPL9-PyMYB114/MYB10 module regulates light-induced anthocyanin biosynthesis in red pear. Mol. Hortic. 2021, 1, 14. [Google Scholar] [CrossRef]
  69. Zhao, L.; Sun, J.; Cai, Y.; Yang, Q.; Zhang, Y.; Ogutu, C.O.; Liu, J.; Zhao, Y.; Wang, F.; He, H.; et al. PpHYH is responsible for light-induced anthocyanin accumulation in fruit peel of Prunus persica. Tree Physiol. 2022, 42, 1662–1677. [Google Scholar] [CrossRef]
  70. Liu, Y.; Schouten, R.E.; Tikunov, Y.; Liu, X.; Visser, R.G.F.; Tan, F.; Bovy, A.; Marcelis, L.F.M. Blue light increases anthocyanin content and delays fruit ripening in purple pepper fruit. Postharvest Biol. Technol. 2022, 192, 112024. [Google Scholar] [CrossRef]
  71. Guo, X.L.; Hu, J.B.; Wang, D.L. Effect of Light Intensity on Blueberry Fruit Coloration, Anthocyanin Synthesis Pathway Enzyme Activity, and Gene Expression. Russ. J. Plant Physiol. 2023, 70, 136. [Google Scholar] [CrossRef]
  72. Zhang, H.N.; Li, W.C.; Wang, H.C.; Shi, S.Y.; Shu, B.; Liu, L.Q.; Wei, Y.Z.; Xie, J.H. Transcriptome Profiling of Light-Regulated Anthocyanin Biosynthesis in the Pericarp of Litchi. Front. Plant Sci. 2016, 7, 963. [Google Scholar] [CrossRef] [PubMed]
  73. Zou, S.C.; Zhuo, M.G.; Abbas, F.; Hu, G.B.; Wang, H.C.; Huang, X.M. Transcription factor LcNAC002 coregulates chlorophyll degradation and anthocyanin biosynthesis in litchi. Plant Physiol. 2023, 192, 1913–1927. [Google Scholar] [CrossRef] [PubMed]
  74. Honda, C.; Kotoda, N.; Wada, M.; Kondo, S.; Kobayashi, S.; Soejima, J.; Zhang, Z.; Tsuda, T.; Moriguchi, T. Anthocyanin biosynthetic genes are coordinately expressed during red coloration in apple skin. Plant Physiol. Biochem. 2002, 40, 955–962. [Google Scholar] [CrossRef]
  75. Do, V.G.; Kim, S.; Lee, Y.; Yang, S.; Kim, J.-H.; Win, N.M.; Kwon, Y.-S.; Park, J.; Park, J.-T. Differential Coloration, Pigment Biosynthesis-Related Gene Expression, and Accumulation According to Developmental Stage in the ‘Enbu’ Apple. Horticulturae 2023, 9, 1072. [Google Scholar] [CrossRef]
  76. Luan, A.; Zhang, W.; Yang, M.; Zhong, Z.; Wu, J.; He, Y.; He, J. Unveiling the molecular mechanism involving anthocyanins in pineapple peel discoloration during fruit maturation. Food Chem. 2023, 412, 135482. [Google Scholar] [CrossRef]
  77. Yang, Q.; Wang, Y.; Zhang, G.; Wang, Y.; Huang, J.; Feng, Y.; Li, Y.; Jiang, J.; Zhang, Y. Overexpression of a BR inactivating enzyme gene GhPAG1 impacts eggplant fruit development and anthocyanin accumulation mainly by altering hormone homeostasis. Plant Sci. 2024, 341, 112014. [Google Scholar] [CrossRef]
  78. Jia, H.F.; Chai, Y.M.; Li, C.L.; Lu, D.; Luo, J.J.; Qin, L.; Shen, Y.Y. Abscisic acid plays an important role in the regulation of strawberry fruit ripening. Plant Physiol. 2011, 157, 188–199. [Google Scholar] [CrossRef]
  79. Rudell, D.R.; Fellman, J.K.; Mattheis, J.P. Preharvest Application of Methyl Jasmonate to ‘Fuji’ Apples Enhances Red Coloration and Affects Fruit Size, Splitting, and Bitter Pit Incidence. HortScience 2005, 40, 1760–1762. [Google Scholar] [CrossRef]
  80. Jeong, S.T.; Goto-Yamamoto, N.; Kobayashi, S.; Esaka, M. Effects of plant hormones and shading on the accumulation of anthocyanins and the expression of anthocyanin biosynthetic genes in grape berry skins. Plant Sci. 2004, 167, 247–252. [Google Scholar] [CrossRef]
  81. Awad, M.A.; de Jager, A. Formation of flavonoids, especially anthocyanin and chlorogenic acid in ‘Jonagold’ apple skin: Influences of growth regulators and fruit maturity. Sci. Hortic. 2002, 93, 257–266. [Google Scholar] [CrossRef]
  82. An, J.P.; Wang, X.F.; Li, Y.Y.; Song, L.Q.; Zhao, L.L.; You, C.X.; Hao, Y.J. EIN3-LIKE1, MYB1, and ETHYLENE RESPONSE FACTOR3 Act in a Regulatory Loop That Synergistically Modulates Ethylene Biosynthesis and Anthocyanin Accumulation. Plant Physiol. 2018, 178, 808–823. [Google Scholar] [CrossRef] [PubMed]
  83. Cheng, Y.; Liu, L.; Yuan, C.; Guan, J. Molecular Characterization of Ethylene-Regulated Anthocyanin Biosynthesis in Plums During Fruit Ripening. Plant Mol. Biol. Report. 2016, 34, 777–785. [Google Scholar] [CrossRef]
  84. Ni, J.B.; Bai, S.L.; Zhao, Y.; Tao, R.Y.; Teng, Y.W. Ethylene Suppresses Anthocyanin Accumulation in ‘Red Zaosu’ Pear; International Society for Horticultural Science (ISHS): Leuven, Belgium, 2020; pp. 513–520. [Google Scholar]
  85. Figueroa, N.E.; Gatica-Meléndez, C.; Figueroa, C.R. Ethylene application at the immature stage of Fragaria chiloensis fruit represses the anthocyanin biosynthesis with a concomitant accumulation of lignin. Food Chem. 2021, 358, 129913. [Google Scholar] [CrossRef]
Figure 1. Effect of light induction on the anthocyanin accumulation of Aft tomato fruits. (a) The fruit development stages at S1 (green), S2 (break), S3 (mature). The fruit samples were bagged and light-exposed. (b) The anthocyanin content of developing fruits under bagged treatment and light-exposed treatment. (*** indicates significant difference (p < 0.001)).
Horticulturae 11 00535 g001
Figure 2. Venn diagram of the number of DEGs identified in light-exposed and bagged samples of S1, S2, S3 fruit development stages.
Horticulturae 11 00535 g002
Figure 3. Significantly enriched Gene Ontology Biological Process and KEGG pathways revealed by DAVID analysis of the transcripts up- (in red shade in the figure) or down (in blue shade in the figure)-regulated in tomato fruit of light-exposed compared to bagged fruit. The vertical axis represents the terms, while the horizontal axis displays the transformed FPKM values as −log10 p-Value.
Horticulturae 11 00535 g003
Figure 4. Analysis of gene expression heat maps related to light response and signal transduction in fruits. Gene expression patterns are depicted using a color gradient from blue to red, indicating log2 FPKM values. Higher gene expression levels are indicated by redder colors. Bubble plots illustrate the fold change and statistical significance of the specified genes. S1, S2, and S3 represent three developmental stages of the fruit: developmental stage (S1), breaker stage (S2), and red ripening stage (S3). L vs. D indicates a comparison between fruits exposed to light (L) and those bagged without exposure to light (D).
Horticulturae 11 00535 g004
Figure 5. Heat map illustrating anthocyanin biosynthesis expression patterns in Aft tomato fruits. The heat map’s columns and rows depict samples collected at various developmental stages under both light-exposed and bagged conditions. The bottom color scale illustrates the log-transformed FPKM values. Bubble plots illustrate the fold change and statistical significance of the specified genes. S1, S2, and S3 represent three developmental stages of the fruit: developmental stage (S1), breaker stage (S2), and red ripening stage (S3). L vs. D indicates a comparison between fruits exposed to light (L) and those bagged without exposure to light (D).
Horticulturae 11 00535 g005
Figure 6. The expression level of genes associated with anthocyanin biosynthesis and fruit development. (a) Expression levels of regulatory genes (SlBBX24, SlHY5 and SlAN2-like) at fruit development stages (S1, S2 and S3). RPKM stands for reads per kilobase per million reads. (b) The expression levels of anthocyanin biosynthetic genes, SlDFR and SlCHS1, were analyzed across various fruit development stages: S1, S2, and S3. L indicates the samples of fruits exposed to light and D indicates those bagged without exposure to light.
Horticulturae 11 00535 g006
Figure 7. Weighted gene co-expression network analysis of upregulated genes in Aft tomato fruits subjected to light exposure and bagging treatments. (A) The lower panel displays a hierarchical cluster tree with seven distinct co-expression modules, each represented by a different color. Each DEG is depicted as a leaf in the tree. (B) Correlation coefficients between module pigments and their respective p-values (noted in parentheses). The module–trait correlations are represented on a color scale ranging from blue to red on the right. (C) The identified genes with significance for pigment and their module membership in the black and brown modules are presented. (D) The expression patterns of each candidate gene within these modules are depicted using a color gradient from blue to red, indicating log2 FPKM values. Increased grid values correspond to elevated gene expression levels. S1, S2, and S3 represent three developmental stages of the fruit: developmental stage (S1), breaker stage (S2), and red ripening stage (S3). L indicates the samples of fruits exposed to light and D indicates those bagged without exposure to light.
Horticulturae 11 00535 g007
Figure 8. Validation of gene expression levels using qRT-PCR. The relative gene expression level is indicated on the left y-axis. The x-axis displays the genes associated with anthocyanin biosynthesis. Dark is representative of the bagged treatment and light is representative of the light-exposed treatment at the breaker stage of fruit development. (* indicates significant difference (p < 0.05); ** indicates significant difference (p < 0.01); *** indicates significant difference (p < 0.001)).
Horticulturae 11 00535 g008
Figure 9. A simplified diagram and heat map illustrating the expression of genes involved in light signal transduction in tomato fruit. Gene expression patterns are depicted using a color gradient from blue to red, indicating log2 FPKM values. Higher gene expression levels are indicated by redder colors. S1, S2, and S3 represent three developmental stages of the fruit: developmental stage (S1), breaker stage (S2), and red ripening stage (S3). L indicates the samples of fruits exposed to light and D indicates those bagged without exposure to light.
Horticulturae 11 00535 g009
Figure 10. The expression pattern of genes involved in the anthocyanin accumulation pathway. The heatmaps illustrate gene expression levels across three developmental stages in both light-exposed and bagged treatment tomato fruits. The transition from blue to red signifies a progressive rise in gene expression levels. Log2 FPKM values indicate gene expression levels, with redder colors signifying higher expression.
Horticulturae 11 00535 g010
Disclaimer/Publisher’s Note: The statements, opinions and data contained in all publications are solely those of the individual author(s) and contributor(s) and not of MDPI and/or the editor(s). MDPI and/or the editor(s) disclaim responsibility for any injury to people or property resulting from any ideas, methods, instructions or products referred to in the content.

