Article

Comparative Transcriptome Profiling Reveals Differential Defense Responses of Resistant and Susceptible Phalaenopsis to Dickeya fangzhongdai

Key Laboratory of Quality and Safety Control for Subtropical Fruit and Vegetable, Ministry of Agriculture and Rural Affairs, Collaborative Innovation Center for Efficient and Green Production of Agriculture in Mountainous Areas of Zhejiang Province, College of Horticulture Science, Zhejiang A&F University, Hangzhou 311300, China
*
Author to whom correspondence should be addressed.
These authors contributed equally to this work.
Horticulturae 2025, 11(5), 534; https://doi.org/10.3390/horticulturae11050534
Submission received: 27 March 2025 / Revised: 27 April 2025 / Accepted: 6 May 2025 / Published: 15 May 2025

Abstract

:
Soft rot caused by Dickeya fangzhongdai is a destructive disease in Phalaenopsis production that seriously impacts the quality and yield of Phalaenopsis. To explore the molecular mechanisms underlying disease resistance, transcriptome analysis was conducted on resistant and susceptible Phalaenopsis varieties. By comparing the transcriptomes of the resistant variety ‘ES L20’ and the susceptible variety ‘Zishuijing’ after D. fangzhongdai infection, Gene Ontology and Kyoto Encyclopedia of Genes and Genomes pathway analyses were performed. The results revealed that the differentially expressed genes were mainly enriched in pathways related to plant–pathogen interaction, plant hormone signal transduction, and the phenylpropanoid biosynthetic pathway. In the resistant variety ‘ES L20’, some genes in the Ca2+ pathway, PAMP-triggered immunity pathway, and Effector-triggered immunity pathway were significantly up-regulated. Analysis of the transcriptome levels of genes in the phytohormone-related pathways showed that genes associated with IAA (indole-3-acetic acid), salicylic acid, and jasmonic acid signal transduction pathways were all up-regulated in the resistant variety after inoculation. Furthermore, the analysis of genes in the phenylpropanoid biosynthesis pathway demonstrated significant up-regulation in the resistant variety. The determination of lignin content validated this result, confirming the crucial role of lignin synthesis in Phalaenopsis defense against soft rot. These findings suggest that the differentially expressed genes in phytopathogenic interaction pathways, along with those involved in hormone-related and lignin synthesis pathways, play important roles in Phalaenopsis resistance to soft rot. This study provides valuable insights into the molecular basis of Phalaenopsis resistance to soft rot and may contribute to the development of effective disease control strategies.

1. Introduction

Phalaenopsis, prized for its ornamental value, dominates the global potted flower market [1]. However, industry expansion has been constrained by soft rot disease, particularly under cultivation conditions of elevated humidity and temperature that favor pathogen proliferation [2]. This highly contagious disease thrives in the warm, humid conditions preferred by Phalaenopsis, causing rapid plant decay within days and significant industry losses. This disease is mainly transmitted through wounds, and the pathogens causing soft rot in Phalaenopsis primarily include Pectobacterium and Dickeya. Among these, Dickeya fangzhongdai is the most widespread and severe globally [3,4]. D. fangzhongdai is a facultative anaerobic, Gram-negative pathogen with a wide host range, capable of inducing soft rot in various plants, including orchids, konjac, and onions [4,5].
Currently, pesticide spraying is the main preventive measure against Phalaenopsis soft rot in production. However, once the pathogen infiltrates, common pesticides are unable to inhibit the spread of disease spots. Moreover, excessive use of pesticides not only increases pathogen resistance, but also poses risks to human health and the environment. Given the infectious nature of soft rot, physical or chemical management strategies are often inadequate. Therefore, the development of soft-rot-resistant varieties represents the most cost-effective, sustainable, and environmentally friendly approach to disease control. To accelerate molecular breeding and gene editing efforts, a deeper understanding of the molecular mechanisms underlying Phalaenopsis’ resistance to soft rot is essential.
Plants have evolved a sophisticated defense network in response to microbial attacks. This includes a rapid influx of calcium ions from extracellular stores [6], a burst of reactive oxygen species [7], the activation of mitogen-activated protein kinase (MAPK)-signaling cascades that subsequently induce defense-related genes [8], reinforcement of the cell wall through callose deposition [9], and often, localized cell death [10]. Plant innate immunity is triggered when pathogen-associated molecular patterns (PAMPs), such as flagellin, lipopolysaccharide, peptidoglycan, and elongation factor Tu (EF-Tu), are perceived. These PAMPs are recognized by transmembrane pattern recognition receptors (PRR), triggering a basal resistance response known as PAMP-triggered immunity (PTI) [11,12]. To overcome plant basal defenses, Gram-negative pathogenic bacteria directly inject virulence effector proteins into host cells through the type III secretion system (T3SS) [13]. These effectors suppress PTI and promote pathogenesis. In response, plants have evolved nucleotide-binding leucine-rich repeat (NLR) resistance proteins, which recognize the injected effectors and initiate a second, more potent resistance response called Effector-triggered immunity (ETI) [10,14]. ETI restores and amplifies the PTI basal transcriptional programs and antimicrobial defenses and is often accompanied by localized cell death, known as the hypersensitive response, which eliminates both the pathogen and infected plant cells [15,16]. Additionally, the salicylic acid (SA) metabolic pathway, jasmonic acid (JA) metabolic pathway, and ethylene (ETH) metabolism are also considered crucial components in plant disease resistance [17].
Transcriptome sequencing has emerged as a pivotal tool in plant disease resistance research, enabling comprehensive data mining and mechanistic insights into host–pathogen interactions [18]. This technology facilitates the identification of disease resistance genes and underlying molecular mechanisms through temporal expression profiling during infection [19,20]. For instance, in rice, transcriptome analysis has revealed that the OsMT1a and OsMT1b genes, which are present in both susceptible and resistant rice varieties in response to Magnaporthe oryzae (the causal agent of rice blast), positively regulate rice resistance [21], while in Phalaenopsis amabilis, transcriptome studies have found that the temporal expression patterns of WRKY transcription factors and ethylene response genes are related to pathogen response [22]. However, systematic studies on Phalaenopsis-specific defense mechanisms are still lacking.
In this study, we selected two typical Phalaenopsis varieties: the highly resistant ‘ES L20’ and the highly susceptible ‘Zishuijing’. Manual inoculation experiments confirmed significant differences in disease incidence between these varieties. We then employed RNA-seq to analyze their transcriptional responses within 24 h of inoculation with D. fangzhongdai. To our knowledge, this study is the first application of transcriptome sequencing technology to investigate gene expression in response to soft rot pathogens in different resistant varieties of Phalaenopsis. By comparing RNA-seq data from resistant and susceptible materials, we aimed to identify key differences in defense signaling and metabolic pathways in response to infection. Furthermore, we uncovered a novel mechanism involving alterations in lignin synthesis within the phenylpropanoid metabolic pathway during Phalaenopsis’s resistance to soft rot disease. Our findings provide critical insights into the molecular mechanisms of soft rot resistance in Phalaenopsis and lay the foundation for future molecular breeding and gene editing strategies. Thus, we hypothesized that the resistant variety ‘ES L20’ would exhibit an enhanced activation of defense signaling pathways and an up-regulation of the genes involved in lignin biosynthesis within the phenylpropanoid metabolic pathway compared to the susceptible ‘Zishuijing’ upon D. fangzhongdai infection. This study aimed to validate these hypotheses through transcriptome analysis and identify key molecular determinants of soft rot resistance in Phalaenopsis.

2. Materials and Methods

2.1. Plant Materials, Bacterial Strain, and Plant Infection

The experimental materials used in this study were the highly resistant variety ‘ES L20’ (R) and the highly susceptible variety ‘Zishuijing’ (S); ‘ES L20’ and ‘Zishuijing’ are both commercial varieties. In preliminary disease resistance investigations, these two varieties were identified, and the research findings indicated a substantial disparity in the diseased spot area between them following inoculation with soft rot bacteria. The soft rot pathogen was isolated from the leaves of Phalaenopsis afflicted with soft rot. Through Koch’s postulates validation, pathogenicity determination, physio-biochemical characterization, and molecular biology techniques, the pathogen was identified as D. fangzhongdai, which has led to widespread Phalaenopsis soft rot globally [3].
The pathogenic bacteria were routinely cultivated in nutrient agar medium at 28 °C. Prior to inoculation, they were cultured in NB liquid medium, after which the bacteria were collected and prepared in a 1 × 10⁸ CFU/mL bacterial suspension. Live plants were employed for inoculation, with the inoculation site designated at the second true leaf counted from the top to the bottom of each plant. Using a sterile inoculation needle, the epidermis on both sides of the midvein of the leaves was gently pierced, and 0.5 μL of the bacterial suspension was aspirated and injected into the wound. Subsequently, the plants were placed into a light incubator set with a daytime temperature of 29 °C, a nighttime temperature of 26 °C, 95% relative humidity, and 10 h of dark culture followed by 14 h of light culture. Leaf tissues surrounding the diseased spot were harvested from the plants at distinct time points, specifically 0 h (before inoculation), 6, 12, and 24 h post-inoculation (hpi), from both the pathogen-inoculated (treated) and mock-inoculated (control) groups of plants, with a minimum of three biological replicates. The collected leaf samples were immediately plunged into liquid nitrogen and subsequently stored at −80 °C.

2.2. Determination of Physiological and Biochemical Indicators

Physiological and biochemical assays were conducted on two representative varieties, namely the highly resistant ‘ES L20’ and the highly susceptible ‘Zishuijing’, which exhibited distinct resistance levels.
Phalaenopsis plants inoculated with D. fangzhongdai were placed in an incubator maintained at 30 °C during the day and 26 °C at night, with a relative humidity of 95%. The incubation regime comprised 10 h of night culture followed by 14 h of day culture. Sampling was carried out at 0 h (before inoculation), 6, 12, and 24 hpi with the bacterial suspension. Each treatment was replicated thrice. Samples were precisely collected using a punch, immediately snap-frozen in liquid nitrogen, and stored at an ultra-low temperature of −80 °C. Physiological activity was determined after sampling at different time points. Malondialdehyde (MDA) content was determined by the thiobarbituric acid (TBA) method [23]. Catalase (CAT) activity was determined by UV colorimetry [24]. Polyphenol oxidase (PPO) activity was determined according to the method of Dalton et al. [25]. Peroxidase (POD) activity was measured by the guaiacol method [26]. Phenylalanine ammonia-lyase (PAL) activity was measured according to the method of Ruiz et al. [27]. Chitinase (CHT) was measured by the Kit method (Boxbio, Bejing, China). The experiment included 3 biological replicates.

2.3. Isolation of Total RNA, Library Preparation, and Sequencing

Total RNA was extracted from the leaf samples collected subsequent to artificial pathogen inoculation, specifically from both resistant and susceptible tissue sets obtained at 0 h (before inoculation), 6, 12, and 24 hpi. The extraction was performed using TRIzol® reagent (Invitrogen™, Carlsbad, CA, USA) in accordance with the standard operating instructions. To remove DNA contamination, the RNA samples were treated with 1 mL of 2U DNase I (RNase-free) (Invitrogen™, Carlsbad, CA, USA) and incubated at 37 °C for 30 min. The quality of the isolated total RNA was assessed by electrophoresis on a denaturing 1% agarose gel. Subsequently, the concentration and purity of the extracted RNA were determined using a NanoDrop™ One/OneC Microvolume UV-Vis spectrophotometer (Thermo Fisher Scientific, Waltham, MA, USA). For all time points, at least three RNA samples were combined from each experimental set. Notably, the total RNA pooled from three biological replicates and extracted from the tissues at 48 and 72 hpi was outsourced to Personal Biotechnology Co., Ltd. (Shanghai, China) for transcriptome sequencing on the Illumina NovaSeq 6000 Platform (San Diego, CA, USA).

2.4. Differentially Expressed Gene (DEG) Analysis

We employed DESeq (v1.38.3) to analyze differentially expressed genes under the following screened conditions: the absolute value of the log2-fold change (|log2FoldChange|) was greater than 1, and the significant p-value was less than 0.05. Meanwhile, the Pheatmap (v1.0.12) software package in R language was utilized to conduct a two-way clustering analysis of all differential genes in the samples. Heatmaps were generated based on the expression levels of the same gene across different samples and the expression patterns of different genes within the same sample. The Euclidean distance metric was used to calculate distances, and the Complete Linkage clustering method was employed for clustering.

2.5. GO and KEGG Enrichment Analysis

All the genes were mapped to the terms within the Gene Ontology (GO) database, and the numbers of differentially enriched genes in each term were calculated. The topGO (v2.50.0) software was employed to conduct GO enrichment analysis on the differential genes (including all differentially expressed genes, up-regulated differentially expressed genes, and down-regulated differentially expressed genes). The p-value was calculated using the hypergeometric distribution method, with a significant enrichment criterion of p-value < 0.05. Subsequently, the GO terms with significantly enriched differential genes were identified to elucidate the main biological functions executed by the differential genes. Additionally, ClusterProfiler (v4.6.0) software was utilized to perform the enrichment analysis of the Kyoto Encyclopedia of Genes and Genomes (KEGG) pathway for the differential genes, with particular attention paid to the pathways exhibiting significant enrichment, i.e., those with a p-value < 0.05.

2.6. Transcription Factor Family Analysis

Transcription factor prediction involved comparing plants and animals with the plant transcription factor database (PlantTFDB) and animal transcription factor dataBase (AnimalTFDB) databases, respectively, to predict the transcription factors and their corresponding family information. Subsequently, the differentially expressed genes (DEGs) predicted to be transcription factors were subjected to statistical analysis.

2.7. Quantitative Real-Time PCR Analysis

To validate the transcriptome analysis results, quantitative real-time PCR (qRT-PCR) was employed to detect the expression levels of 9 DEGs. Each sample had three independent biological replicates. Primers were designed using Primer premier 5.0 software, with Actin selected as the internal reference. The primers employed in this study and descriptions of the genes are presented in Table S1. A total of 500 ng of RNA was utilized to synthesize cDNA via HiScript III RT SuperMix for qRT-PCR (+gDNA wiper) (Vazyme Biotech Co., Ltd., Nanjing, China). qRT-PCR assays were carried out on the Applied Biosystems™ StepOnePlus™ (96-well) Real-Time PCR System (Thermo Fisher Scientific Inc., Waltham, MA, USA). The qRT-PCR reaction conditions were set as follows: an initial denaturation at 95 °C for 30 s, followed by 40 cycles of denaturation at 95 °C for 10 s and annealing/extension at 60 °C for 30 s. To minimize experimental errors arising from handling and instrument variability, all treatments were technically replicated three times. Finally, the qRT-PCR data were analyzed based on melting curve analysis using the 2−ΔΔCT method. The relative gene expression was measured and normalized against the control expression levels, with the S0 group set to 1 for inter-group comparison [28].

2.8. Statistical Analysis

The physiological and biochemical indices were input into Microsoft Excel 2019 for organization and computation. In SPSS 26.0 statistical software, the homogeneity of variance was examined via the Levene test. Significant differences among treatments were determined using Duncan’s method, with a significance level set at p < 0.05. The qRT-PCR validation data of the genes were entered into Microsoft Excel 2020 and graphed subsequent to calculation with the 2−ΔΔCT method [28]. The analysis of transcriptome sequencing data was principally carried out through the Personal Biotechnology Cloud platform (Personal Biotechnology Co., Ltd., Shanghai, China). The DESeq R package (v1.10.1) was employed to conduct differential expression analysis between distinct groups. Fragments per kilobase of transcript per million mapped reads (FPKM) were utilized to validate the transcriptional expression levels of the samples. R 4.1.0 software was utilized to generate the heatmap of differential expression.

3. Results

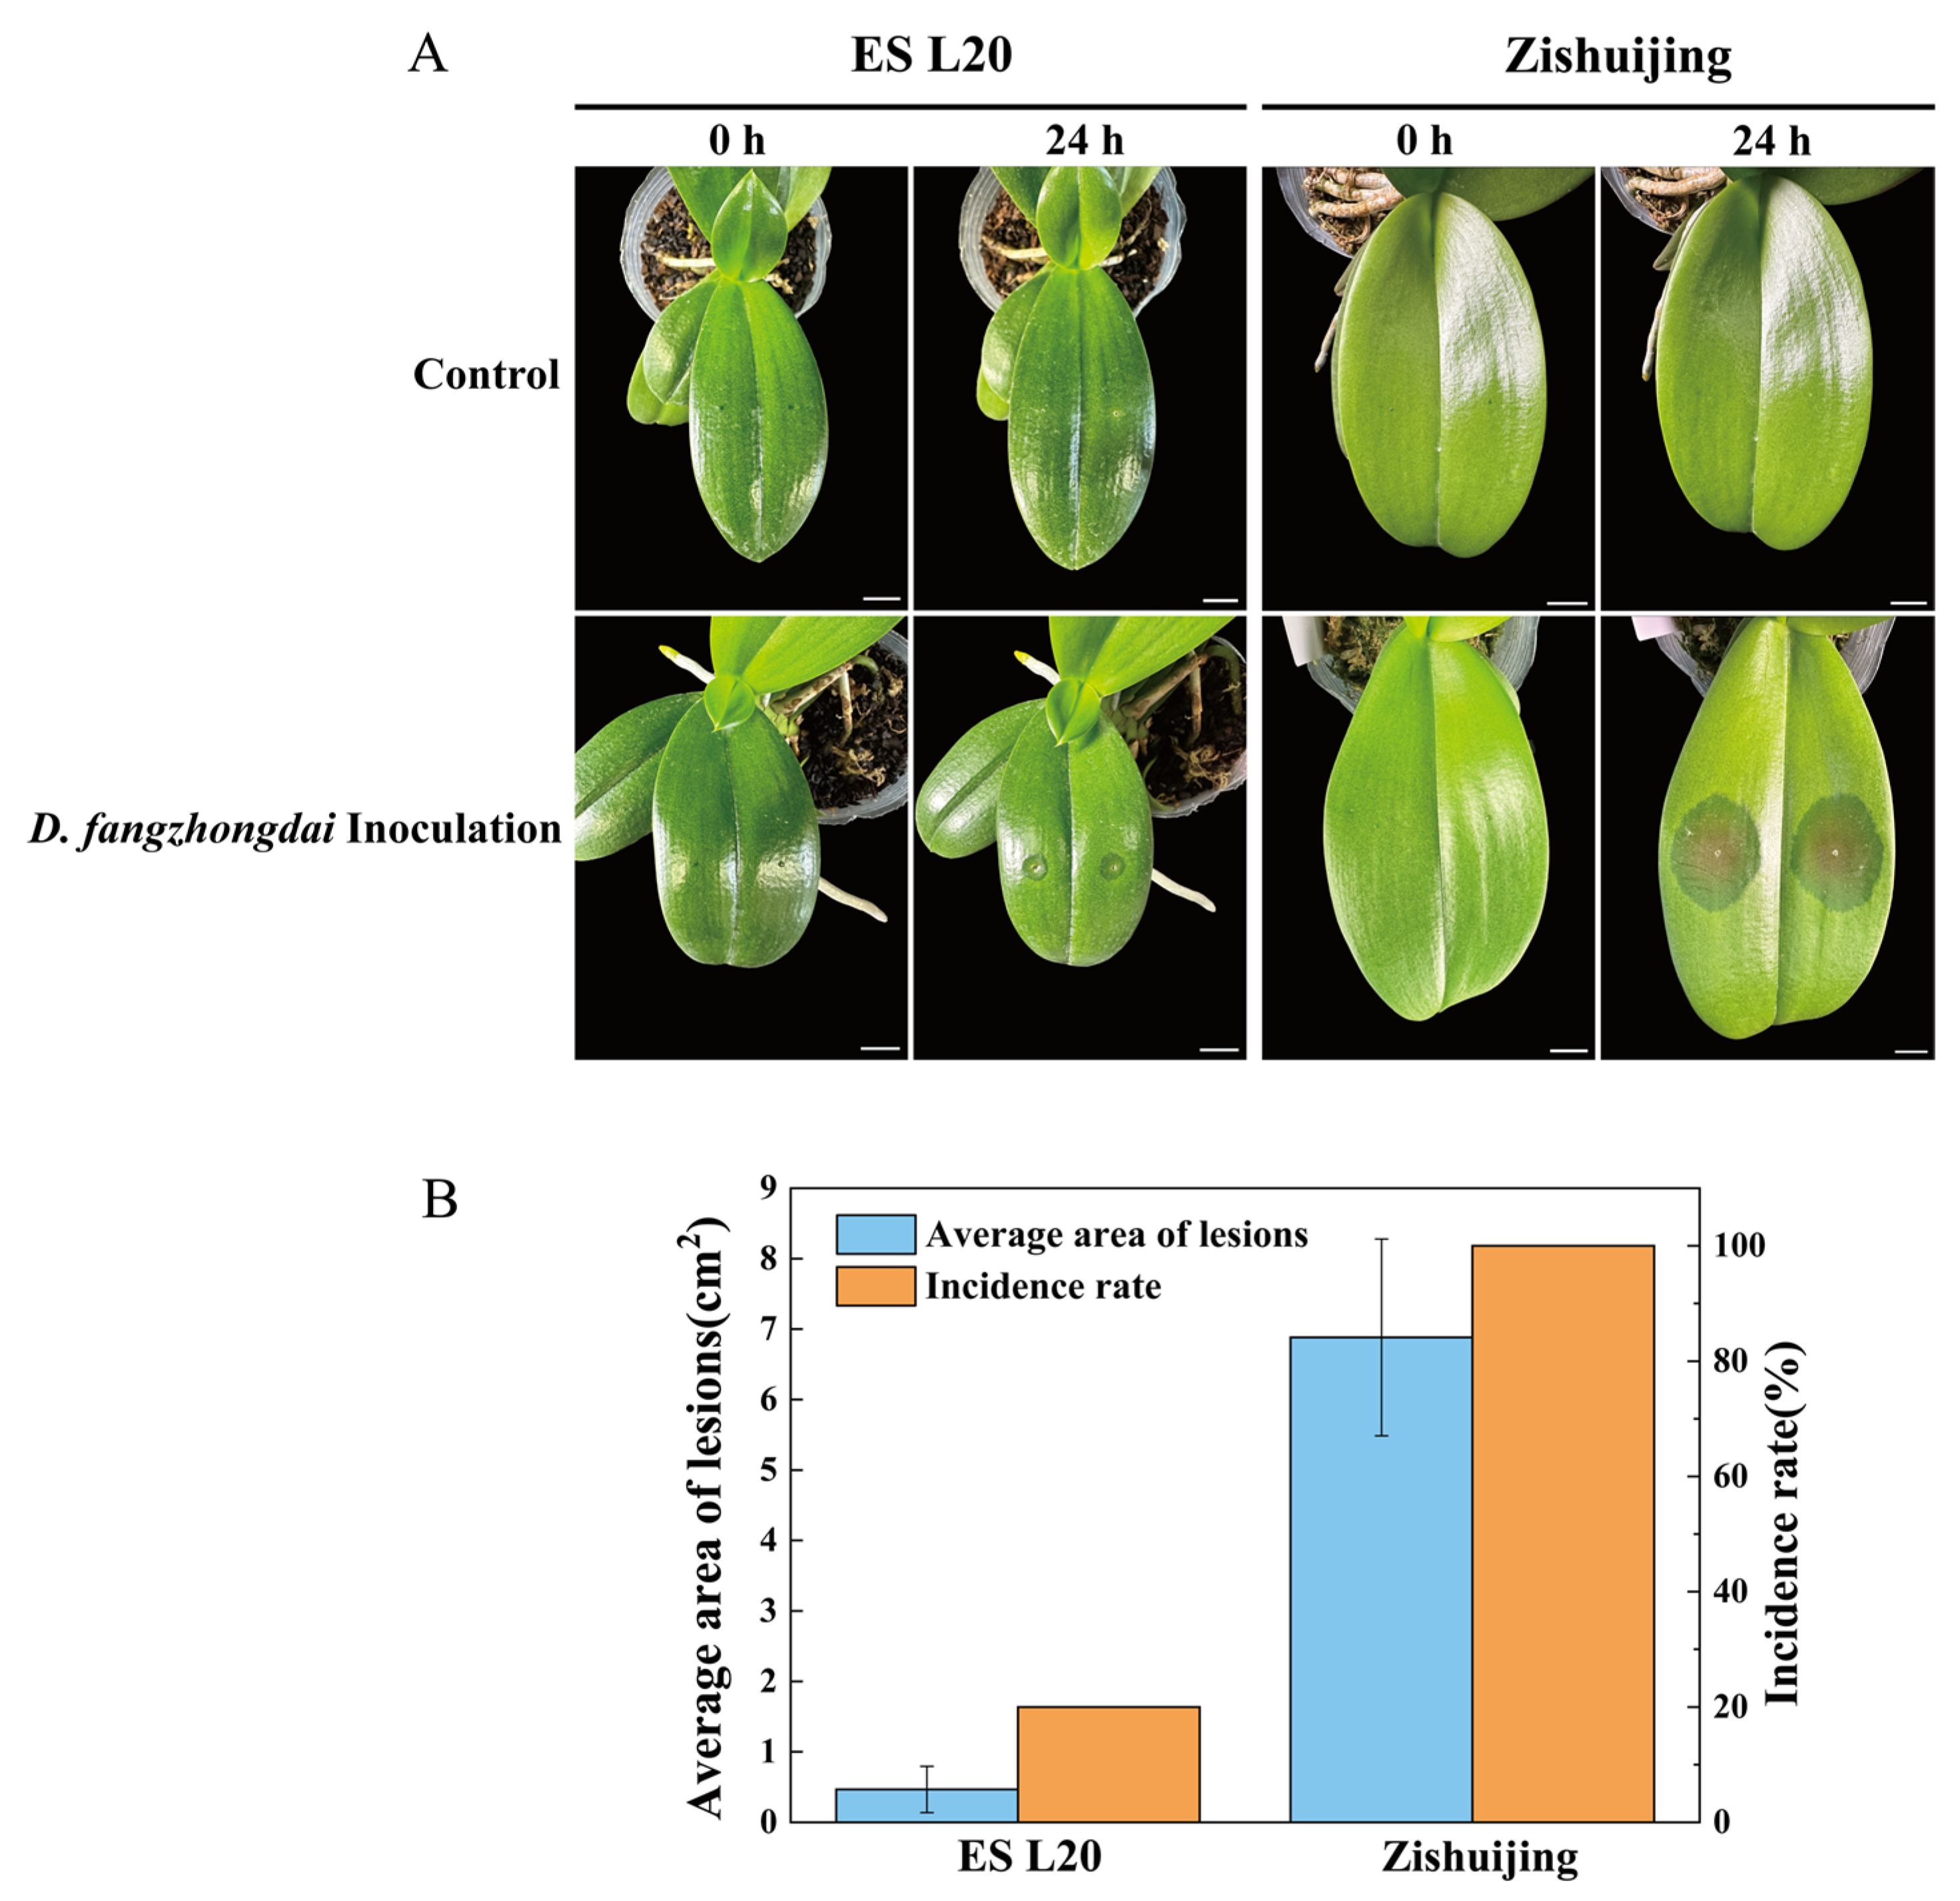
3.1. Evaluation of Phalaenopsis Varieties After Soft Rot Infection

Two Phalaenopsis varieties, namely the resistant cultivar ‘ES L20’ and the susceptible cultivar ‘Zishuijing’, were selected due to their significant differences in symptoms following soft rot infection. The soft rot disease symptoms of these two varieties were examined 24 hpi. In ‘ES L20’, necrotic lesions were predominantly confined to the inoculated area, while in ‘Zishuijing’, rot was evident at the leaf margins, encompassing the inoculation point area (Figure 1A). By observing the lesion areas of the two varieties 24 h after inoculation, it was found that ‘Zishuijing’ exhibited a more severe disease condition at the same time. According to our statistics, of the total of 20 inoculation sites, all ‘Zishuijing’ sites were infected, while the incidence of infection for ‘ES L20’ was only 20% (Figure 1B).

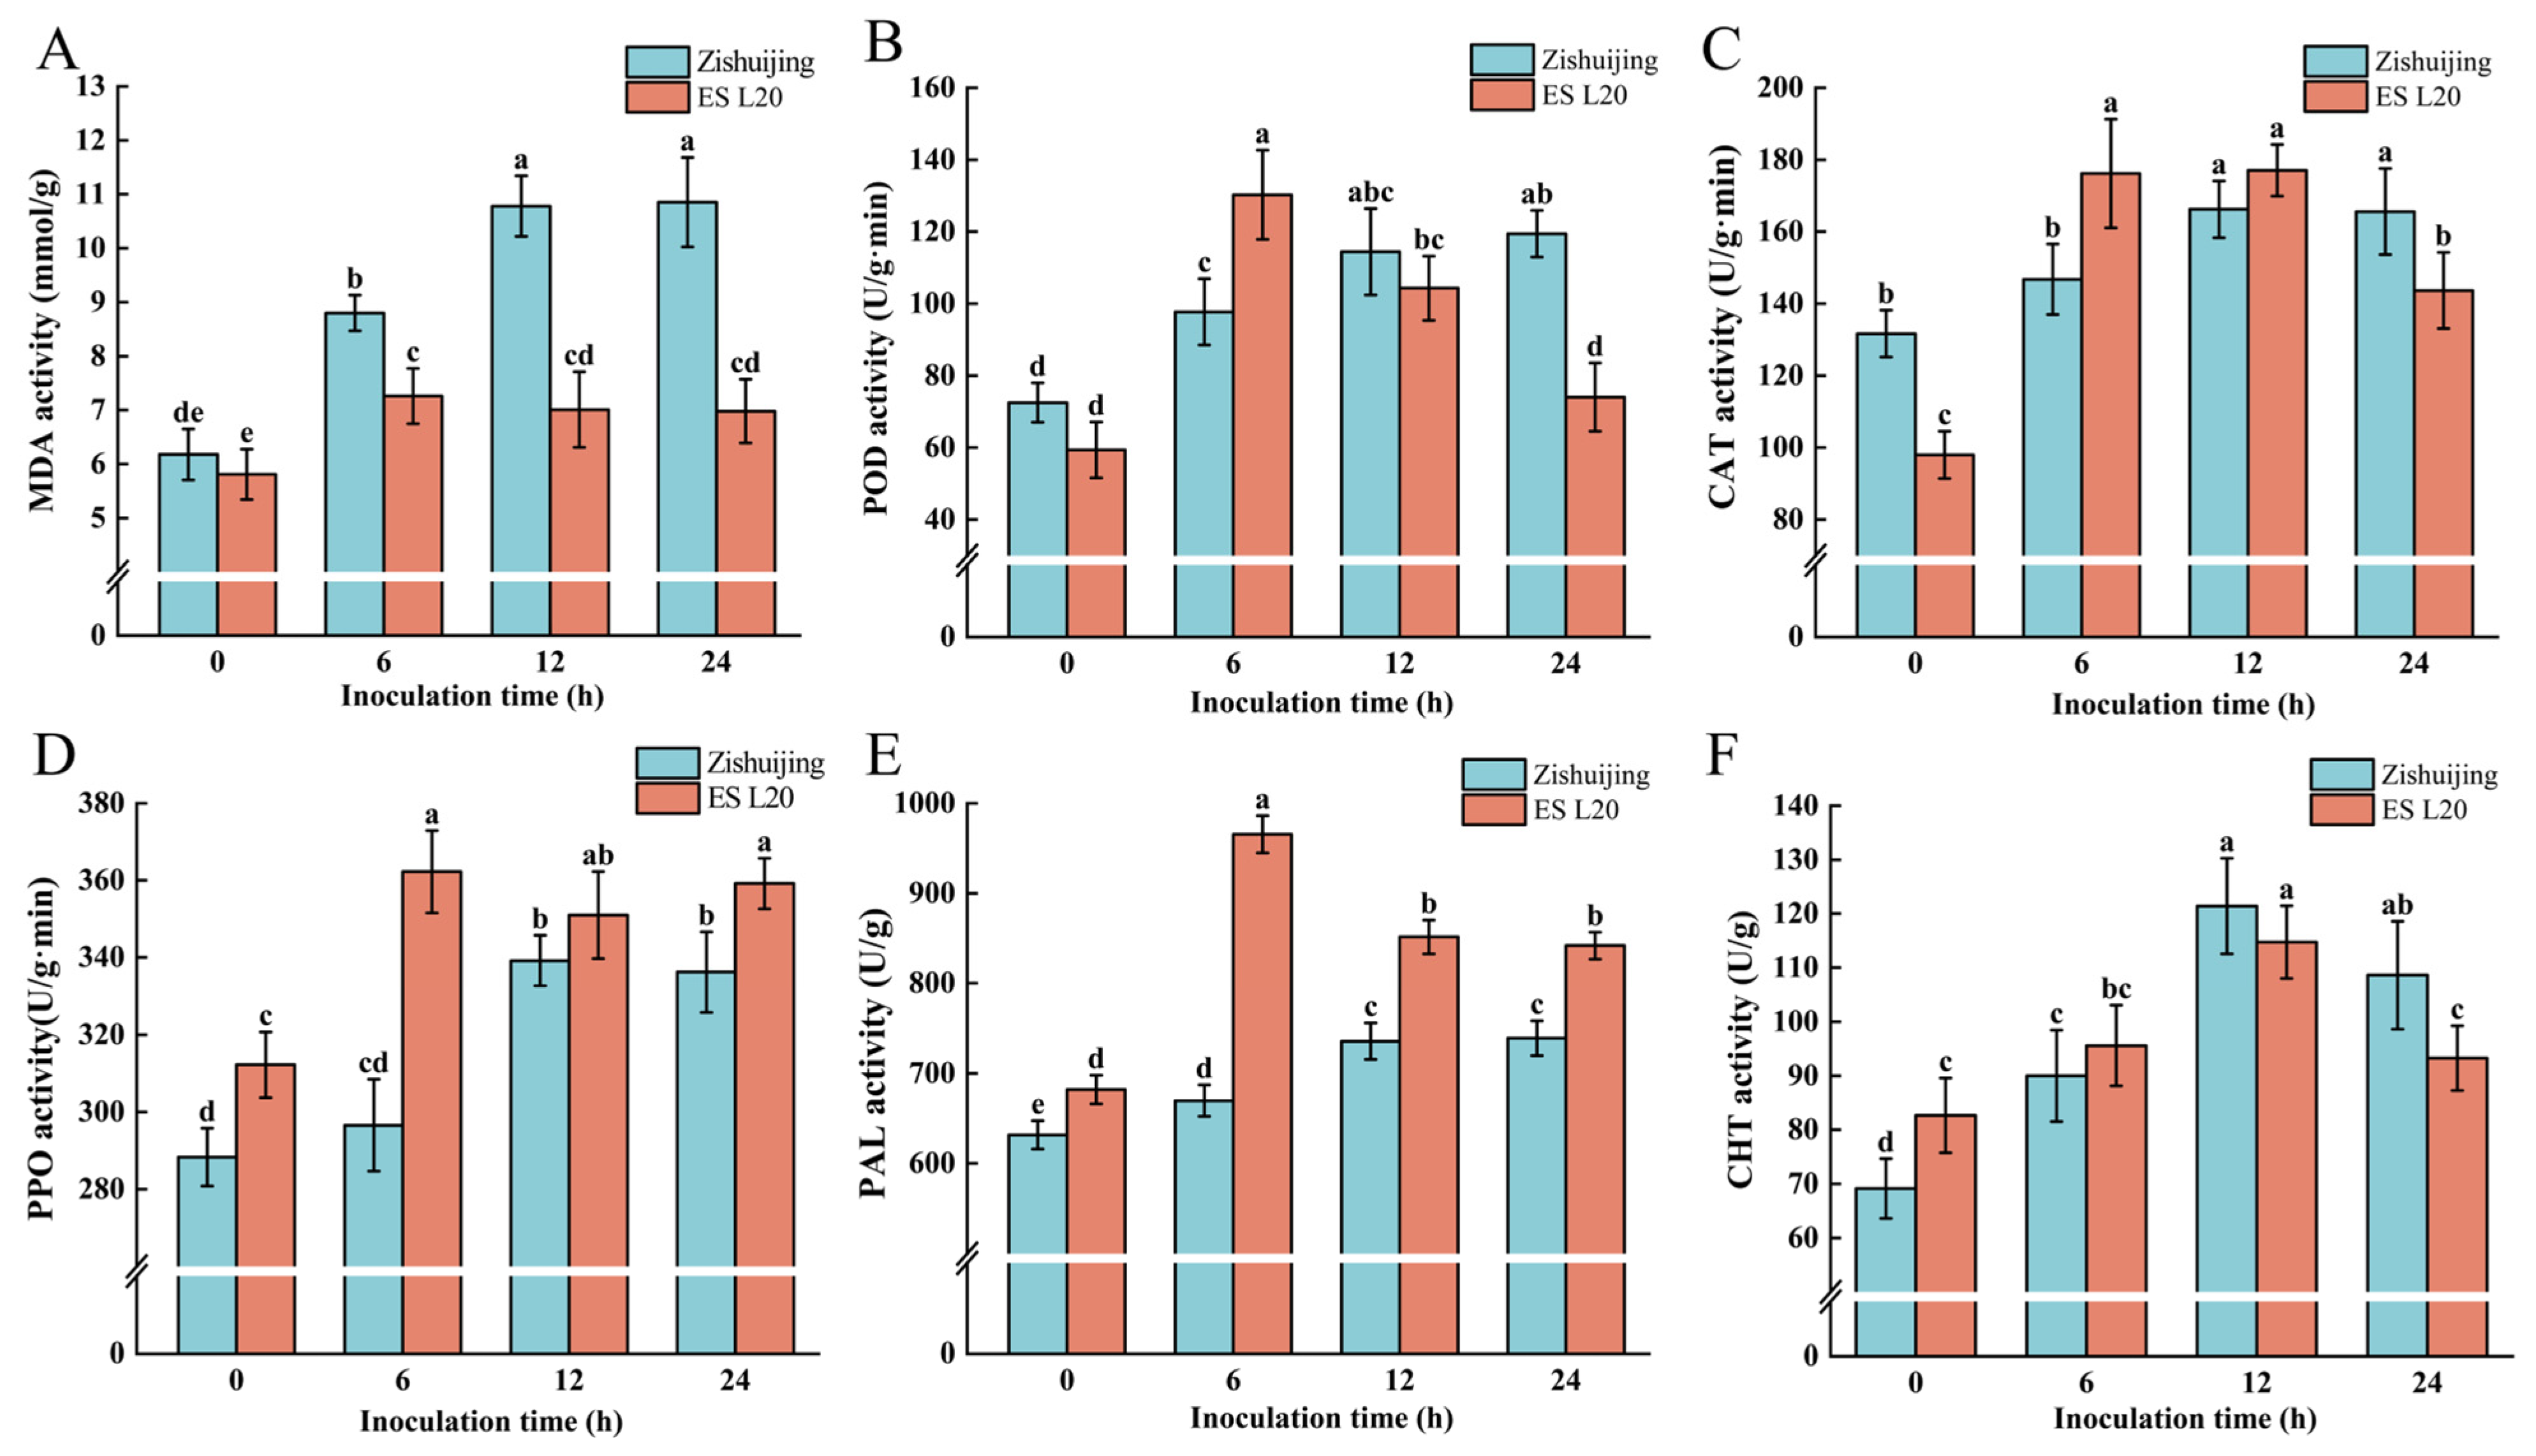
3.2. Physiological Indexes of the Two Varieties After D. fangzhongdai Infection

MDA is a principal marker of lipid peroxidation and oxidative stress, as well as a significant indicator of oxidative damage in plants induced by pathogens [29]. The results of this study revealed that the MDA content in both ‘Zishuijing’ and ‘ES L20’ increased with the progression of infection time (Figure 2A). During the inoculation period, the MDA content in ‘Zishuijing’ was higher than that in ‘ES L20’, peaking at 24 h. In contrast, the MDA content in ‘ES L20’ did not exhibit significant variation between 6 h and 24 h (Figure 2A).
POD and CAT are crucial components of the plant antioxidant system, responsible for eliminating excessive reactive oxygen species (ROS) under stress conditions [30]. As the infection time increased, the activities of POD and CAT in ‘ES L20’ initially rose and then declined, reaching a maximum at 6 h after inoculation. In ‘Zishuijing’, however, the activities of POD and CAT increased steadily with the increase in inoculation time (Figure 2B,C). The activities of POD and CAT in ‘ES L20’ were higher than those in ‘Zishuijing’ (Figure 2B,C), indicating that ‘ES L20’ responds more rapidly to soft rot bacteria in the early stages of infection.
PAL and PPO are two key enzymes in the phenylpropane metabolic pathway. They contribute to the synthesis of lignin and phenolic compounds and play a vital role in plant disease resistance [31]. With the increase in soft rot infection time, the activities of PPO and PAL in ‘ES L20’ initially increased and reached their maxima at 6 h compared to the uninoculated control (Figure 2D,E). In ‘Zishuijing’, the activities of PPO and PAL in the seedlings gradually increased, reaching their maxima at 12 h or 24 h, respectively, relative to the control. Throughout the treatment period, the activities of PPO and PAL in the ‘ES L20’ seedlings were consistently higher than those in the ‘Zishuijing’ seedlings (Figure 2D,E).
As the inoculation time increased, the CHT activity in both ‘ES L20’ and ‘Zishuijing’ first increased and then decreased, reaching a maximum at 12 h (Figure 2F). The difference in CHT activity between the two varieties was not highly significant, leading to the hypothesis that CHT may not be a major determinant of the difference in resistance between the two varieties. Overall, most of the physiological indices demonstrated that ‘ES L20’ exhibited better disease resistance than ‘Zishuijing’ (Figure 2).

3.3. Transcriptome Sequencing Analysis

To further explore the transcriptome dynamics and regulatory mechanisms underlying the responses of Phalaenopsis leaves to D. fangzhongdai, a comparative transcriptome-wide time-series analysis was conducted on two cultivars, namely ‘Zishuijing’ and ‘ES L20’. Three independent biological replicates were prepared for all samples at each time point. In total, 24 cDNA libraries were generated from the leaf tissues of the two varieties, labeled as R0_1, R0_2, R0_3, R6_1, R6_2, R6_3, R12_1, R12_2, R12_3, R24_1, R24_2, R24_3, S0_1, S0_2, S0_3, S6_1, S6_2, S6_3, S12_1, S12_2, S12_3, S24_1, S24_2, and S24_3 (the raw data from the cDNA libraries are listed in Table S2). Subsequently, the raw data were transformed into clean reads, which were then utilized for further analyses. The Q20 value exceeded 98.00%, and the Q30 value surpassed 94.00%. Overall, 0.79 billion clean reads (with an average of approximately 32.9 million reads per sample) were acquired. All clean data are available for download from NCBI (BioProjects: PRJNA1236945). When the clean reads were aligned with the reference genome of P. equestris (the genome sequence of the orchid Phalaenopsis equestris), the alignment percentages of ‘ES L20’ and ‘Zishuijing’ relative to the reference genome were approximately 30% and 50%, respectively. It is presumed that this disparity is due to intraspecies hybridization in Phalaenopsis, as some species are genetically distant from P. equestris. Due to the low matching rate, we used a method without a reference genome, sequenced the constructed library using the Illumina platform for the double-ended PE150 pattern, Trinity-assembled the filtered clean reads, and annotated all Unigenes using the Pearson correlation coefficient to represent the correlation of gene expression levels between samples. For S series, the correlation between different groups is low, and the correlation of biological replicates within the group is high. For R series, the correlation between different groups is high, and the correlation of biological replicates within the group is high (Figure 3A; Table S3). The 3D PCA analysis of 24 samples showed that the explanatory variables of the first principal component (PC1), the second principal component (PC2), and the third principal component (PC3) were 27.77%, 20.11%, and 10.34%, respectively. It can be seen that the distances of the three dots with the same color in the same sample group were very close and highly clustered, indicating that the biological repeatability in the group was good, while the distance between the origin of different colors was far, indicating that the samples in different groups had certain differences (Figure 3B; Table S4). Hence, the results signified that the sequencing data obtained were of reliable quality and suitable for subsequent analyses.

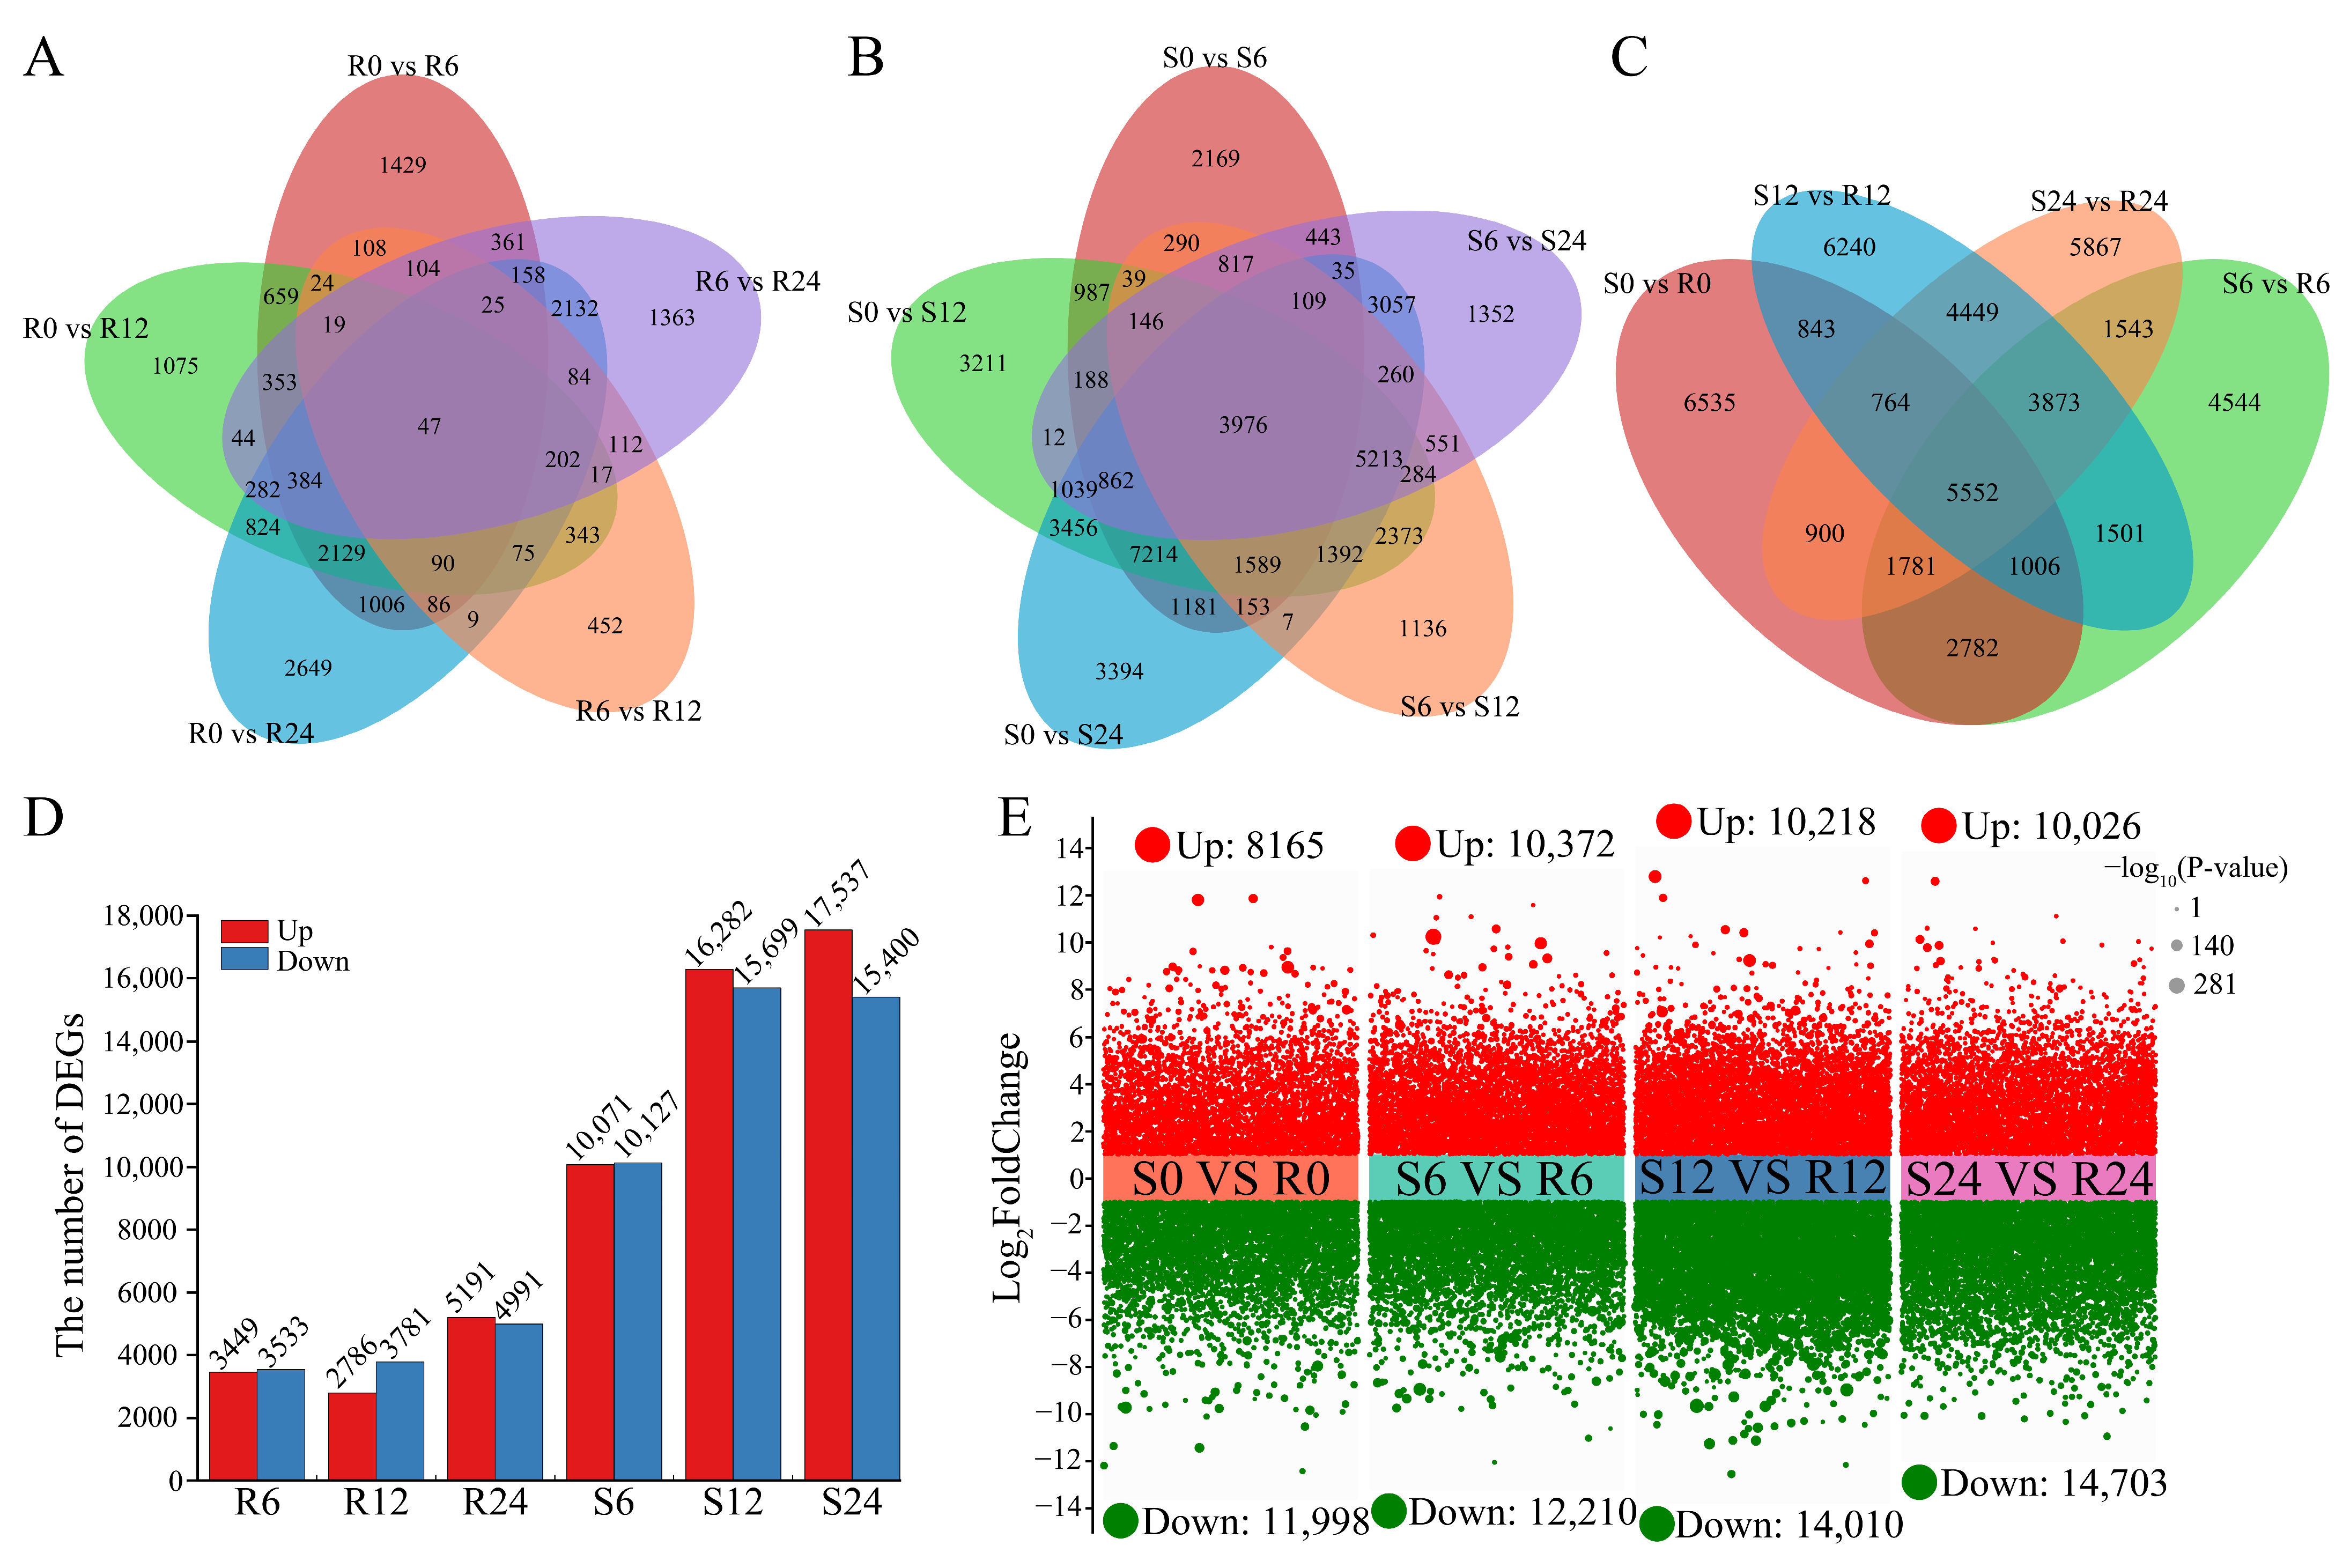
3.4. DEGs Between R (‘ES L20’) and S (‘Zishuijing’) at Four Time Points

To identify genes closely correlated with the disease resistance phenotypes of the two varieties, DEGs were further screened by comparing their expression levels in R and S across four infection stages.
We used DESeq (v1.38.3) to screen the DEGs between samples, where we applied |log2foldchange| > 1 and significant p-value < 0.05 as the standards for DEG screening. We found that 47 DEGs were present in each time period (R0_VS_R6, R0_VS_R12, R0_VS_R24, R6_VS_R12, and R6_VS_R24) of the R series, and 3976 DEGs were present in each time period (S0_VS_S6, S0_VS_S12, S0_VS_S24, S6_VS_S12, and S6_VS_S24) of the S series (Figure 4A,B). By comparing the DEG sets at the same time points in both cultivars, 5552 DEGs were identified in common between the two cultivars (Figure 4C).
Compared to control plants at 0 h, DEGs were detected in both varieties at different time points after inoculation with D. fangzhongdai (Figure 4D). In comparison to the R0 group, the number of DEGs increased with the progression of infection time. The number of up-regulated DEGs within 6 h was 3449, and this number increased to 5191 by 24 h; the number of down-regulated DEGs at 6 h was 3533, and it rose to 4991 at 24 h. Compared with the S0 group, the number of up-regulated DEGs was 10,071 at 6 h and climbed to 17,537 at 24 h; the number of down-regulated DEGs was 10,127 at 6 h, augmented to 15,400 at 24 h (Figure 4D). This indicates that an increasing number of DEGs participate in the response to D. fangzhongdai after infection, and this change is more pronounced in ‘Zishuijing’.
We also compared the gene expression levels between the two varieties at the same time point (Figure 4E). Using S0 as the control, we observed that the two varieties exhibited substantial differences in DEGs as early as 0 h, with a total of 20,163 DEGs in the R series, of which 8165 were up-regulated and 11,998 were down-regulated. Moreover, the differences in DEGs at 6 h, 12 h, and 24 h showed an upward trend (Figure 4E). The results demonstrated that although ‘Zishuijing’ exhibited a more vigorous response to D. fangzhongdai after infection, ‘ES L20’ manifested better resistance due to varietal differences.

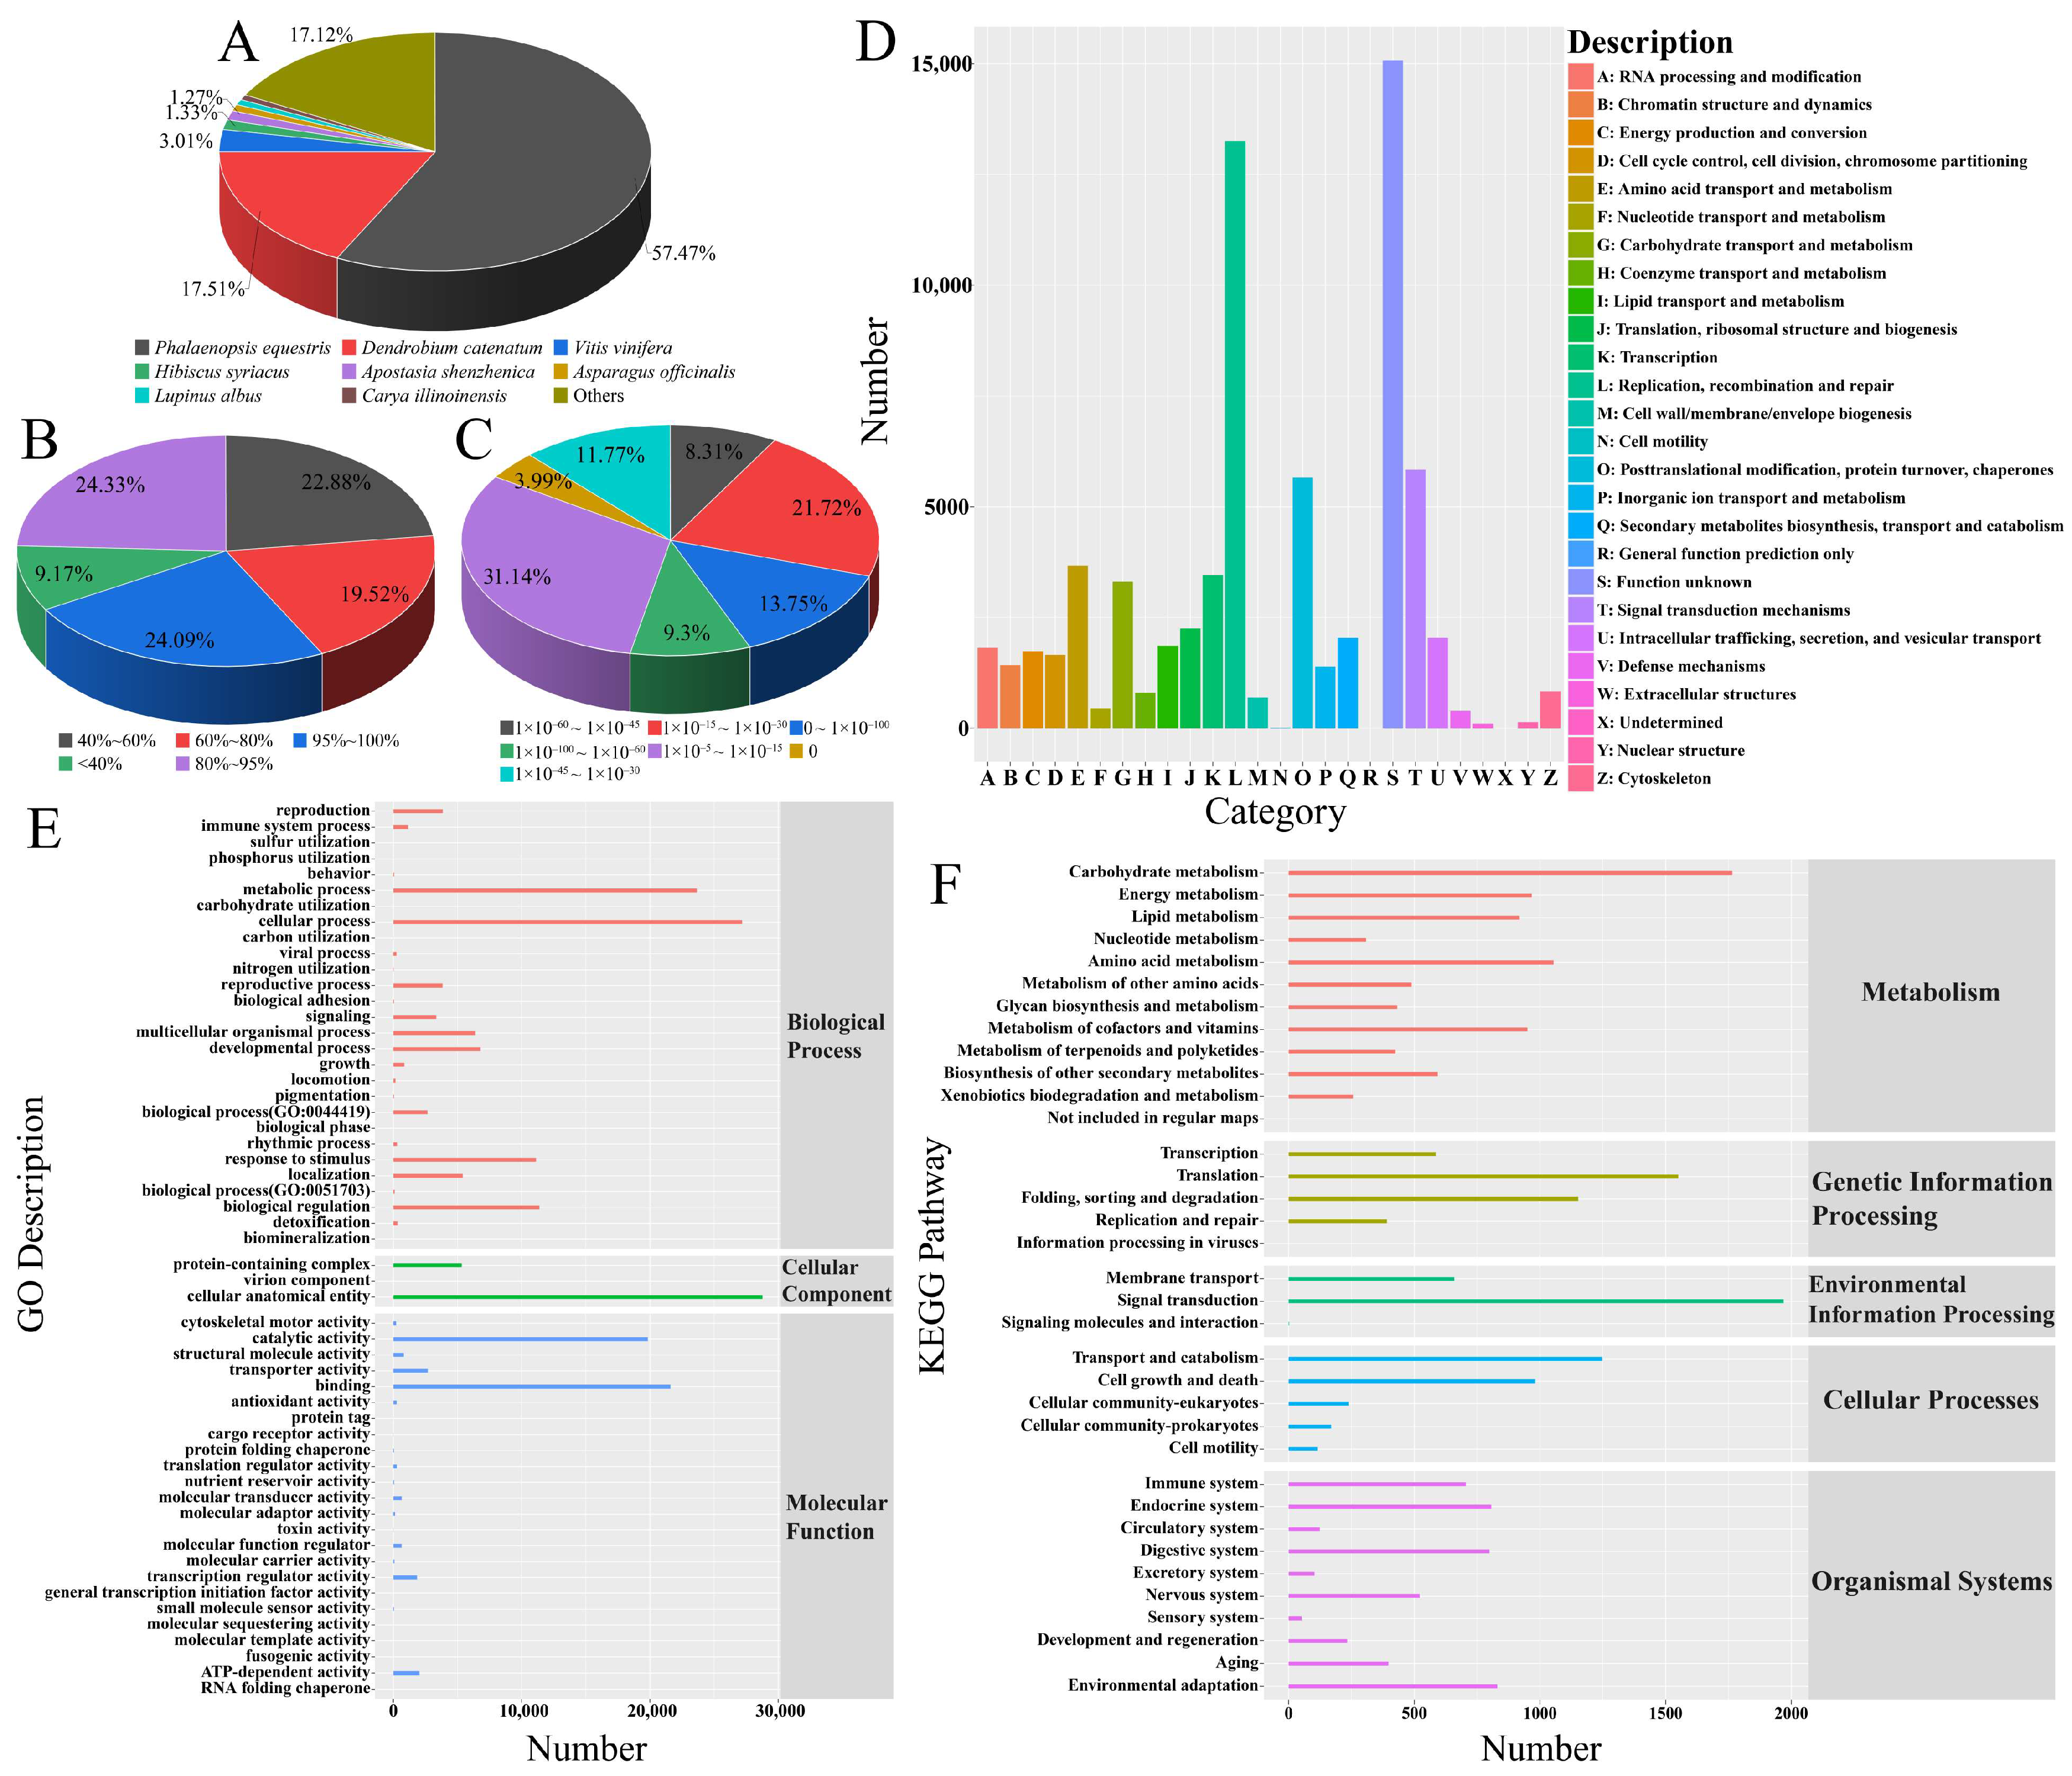
3.5. Unigene Gene Function Annotation

Trinity software was employed to splice the Clean Reads, thereby obtaining transcripts. Subsequently, the longest transcript under each gene was extracted as the representative sequence of the gene, designated as Unigene. In total, 203,141 Unigenes were successfully annotated across six databases: NR, GO, KEGG, Pfam, eggNOG, and Swiss-Prot. Among the species annotated in the NR database, P. equestris accounted for 57.47%, Dendrobium catenatum for 17.51%, Vitis vinifera for 3.01%, Hibiscus syriacus for 1.33%, and Apostasia shenzhenica for 1.27%, representing the top five annotated species (Figure 5A). The sequence similarity of Unigenes in comparison with the NR database was further quantified. Specifically, 19.52% of the Unigenes exhibited a sequence similarity ranging from 60% to 80%; 24.33% had a similarity between 80% and 95%; and 24.09% demonstrated a similarity of 95% to 100% (Figure 5B). The E-value (Expected Value), a statistic calculated based on the comparison score, target sequence length, and library size, was also analyzed. It was found that 68.84% of the Unigene sequences had E-value values less than 1 × 10⁻¹⁵, indicating an extreme match, and 3.99% had E-value values of 0, signifying a perfect match (Figure 5C).
The eggNOG database compiles protein sequence data from a vast array of species, encompassing eukaryotes, prokaryotes, and viruses, and spans a total of 24 functional classes (Table S5). Excluding the unknown functions predicted by class S, class L (“replication, recombination and repair”) encompassed the largest number of Unigenes, followed by class T (“signal transduction mechanisms”), and class O (“post-translational modifications, protein conversion and molecular chaperones”). Functional categories relevant to disease resistance comprised class C (“energy production and conversion”), class P (“Transport and metabolism of inorganic ions”), class T (“signalling mechanisms”), and Class V (“defence mechanisms”) (Figure 5D).
GO annotations enabled the classification of the biological functions of Unigenes (Table S6). The GO-annotated Unigenes were systematically described and categorized into three main classes—“biological process”, “cell component”, and “molecular function”—yielding 24, 2, and 19 respective subcategories. Within the “biological process” category, the majority of sequences were associated with “cellular processes”, “metabolic processes”, “biological regulation”, and “responses to stimulus”. For the “cell component” category, the predominant notes were “cellular anatomical entity” and “protein-containing complex”. The most prevalent subclasses of “molecular function” genes were “binding”, “catalytic activity”, and “transporter activity” (Figure 5E).
The KEGG annotation results provided insights into the more active metabolic pathways of Phalaenopsis in response to soft rot pathogens (Table S7). The KEGG pathway was segmented into five subclasses, namely “metabolism”, “genetic information processing”, “environmental information processing”, “cellular processes”, and “organismal system”. “Metabolism” was annotated into 11 pathways, with the top three Unigene abundances corresponding to “carbohydrate metabolism”, “amino acid metabolism”, and “energy metabolism”. “Genetic information processing” was annotated into four pathways, and the top three Unigene numbers pertained to “translation”, “folding, sorting and degradation”, and “transcription”. “Environmental information processing” was annotated into three pathways, namely “signal transduction” and “membrane transport”. “Cellular processes” were annotated to a total of five pathways, and the top three Unigene numbers were “transport and catabolism”, “cell growth and death”, and “cell community-eukaryotes”. “Organismal system” was annotated to a total of 10 pathways, and the top three Unigene quantities were “environmental adaptation”, “endocrine system”, and “digestive system” (Figure 5F). These pathways are likely to be most intimately associated with the defense response of Phalaenopsis against soft rot.

3.6. GO Enrichment Analysis

In the analysis of Phalaenopsis’s response to D. fangzhongdai, R0 was set as the control group, and the samples at 6, 12, and 24 hpi were used as treatment groups to screen for DEGs. The TopGO software was employed to categorize these DEGs. A total of 14,718 DEGs from three combinations were classified into three cytoarchitectural functions.
For the DEGs specific to the disease-resistant material ‘ES L20’, when sorted by FDR (false discovery rate, FDR ≤ 0.05), they were annotated to 30 functional items. The most representative “cellular components”, “molecular functions”, and “biological processes” were “thylakoid”, “oxidoreductase activity”, and “response to chemical”, respectively (Figure 6A). We identified the top 20 GO pathways with the lowest FDR values, signifying the most significant enrichment, to illustrate that a higher Rich factor is associated with a greater degree of enrichment. It was found that the DEGs were mainly concentrated in pathways such as “photosynthesis-antenna proteins”, “plant hormone signal transduction”, “phenylpropanoid biosynthesis”, and “plant-pathogen interaction” (Figure 6B).
For the disease-susceptible cultivar ‘Zishuijing’, its specific DEGs, when sorted by FDR (FDR ≤ 0.05), were also annotated to 30 functional items. The most representative “cellular components”, “molecular functions”, and “biological processes” were “membrane”, “oxidoreductase activity”, and “response to chemical”, respectively (Figure 6C). After filtering by the degree of enrichment, we observed that the DEGs were mainly concentrated in pathways such as “plant-pathogen interaction”, “plant hormone signal transduction”, “sulfur metabolism”, and “phenylpropanoid biosynthesis” (Figure 6D).

3.7. KEGG Enrichment Analysis

We performed KEGG enrichment analysis on both resistant and susceptible Phalaenopsis cultivars. For the resistant cultivar, with R0 as the control and 6, 12, and 24 hpi as treatment groups, 14,718 DEGs from three combinations were classified into five metabolic pathways using KOBAS software. According to the false discovery rate (FDR ≤ 0.05) for enrichment significance, various pathways were enriched in different functional categories. For example, the “phagosome” pathway was enriched in “cellular processes” (Figure 7A). Among the top 20 most significantly enriched KEGG pathways (where a higher Rich factor indicates a greater enrichment degree), DEGs were mainly concentrated in “photosynthesis-antenna proteins”, “plant hormone signal transduction”, “phenylpropanoid biosynthesis”, “photosynthesis”, and “plant-pathogen interaction” (Figure 7B).
For the susceptible cultivar, when S0 was set as the control group and 43,896 DEGs from the three treatment groups (6, 12, and 24 hpi) were analyzed through mapping to the KEGG database, these DEGs were categorized into three metabolic pathways. Based on the FDR for enrichment significance (FDR ≤ 0.05), “plant hormone signal transduction” was enriched in environmental information processing, and “sulfur metabolism” and “carbon fixation in photosynthetic organisms” were enriched in metabolism (Figure 7C). Judging by the enrichment degree, the DEGs were mainly concentrated in “plant-pathogen interaction”, “plant hormone signal transduction”, “sulfur metabolism”, and “carbon fixation in photosynthetic organisms” (Figure 7D).

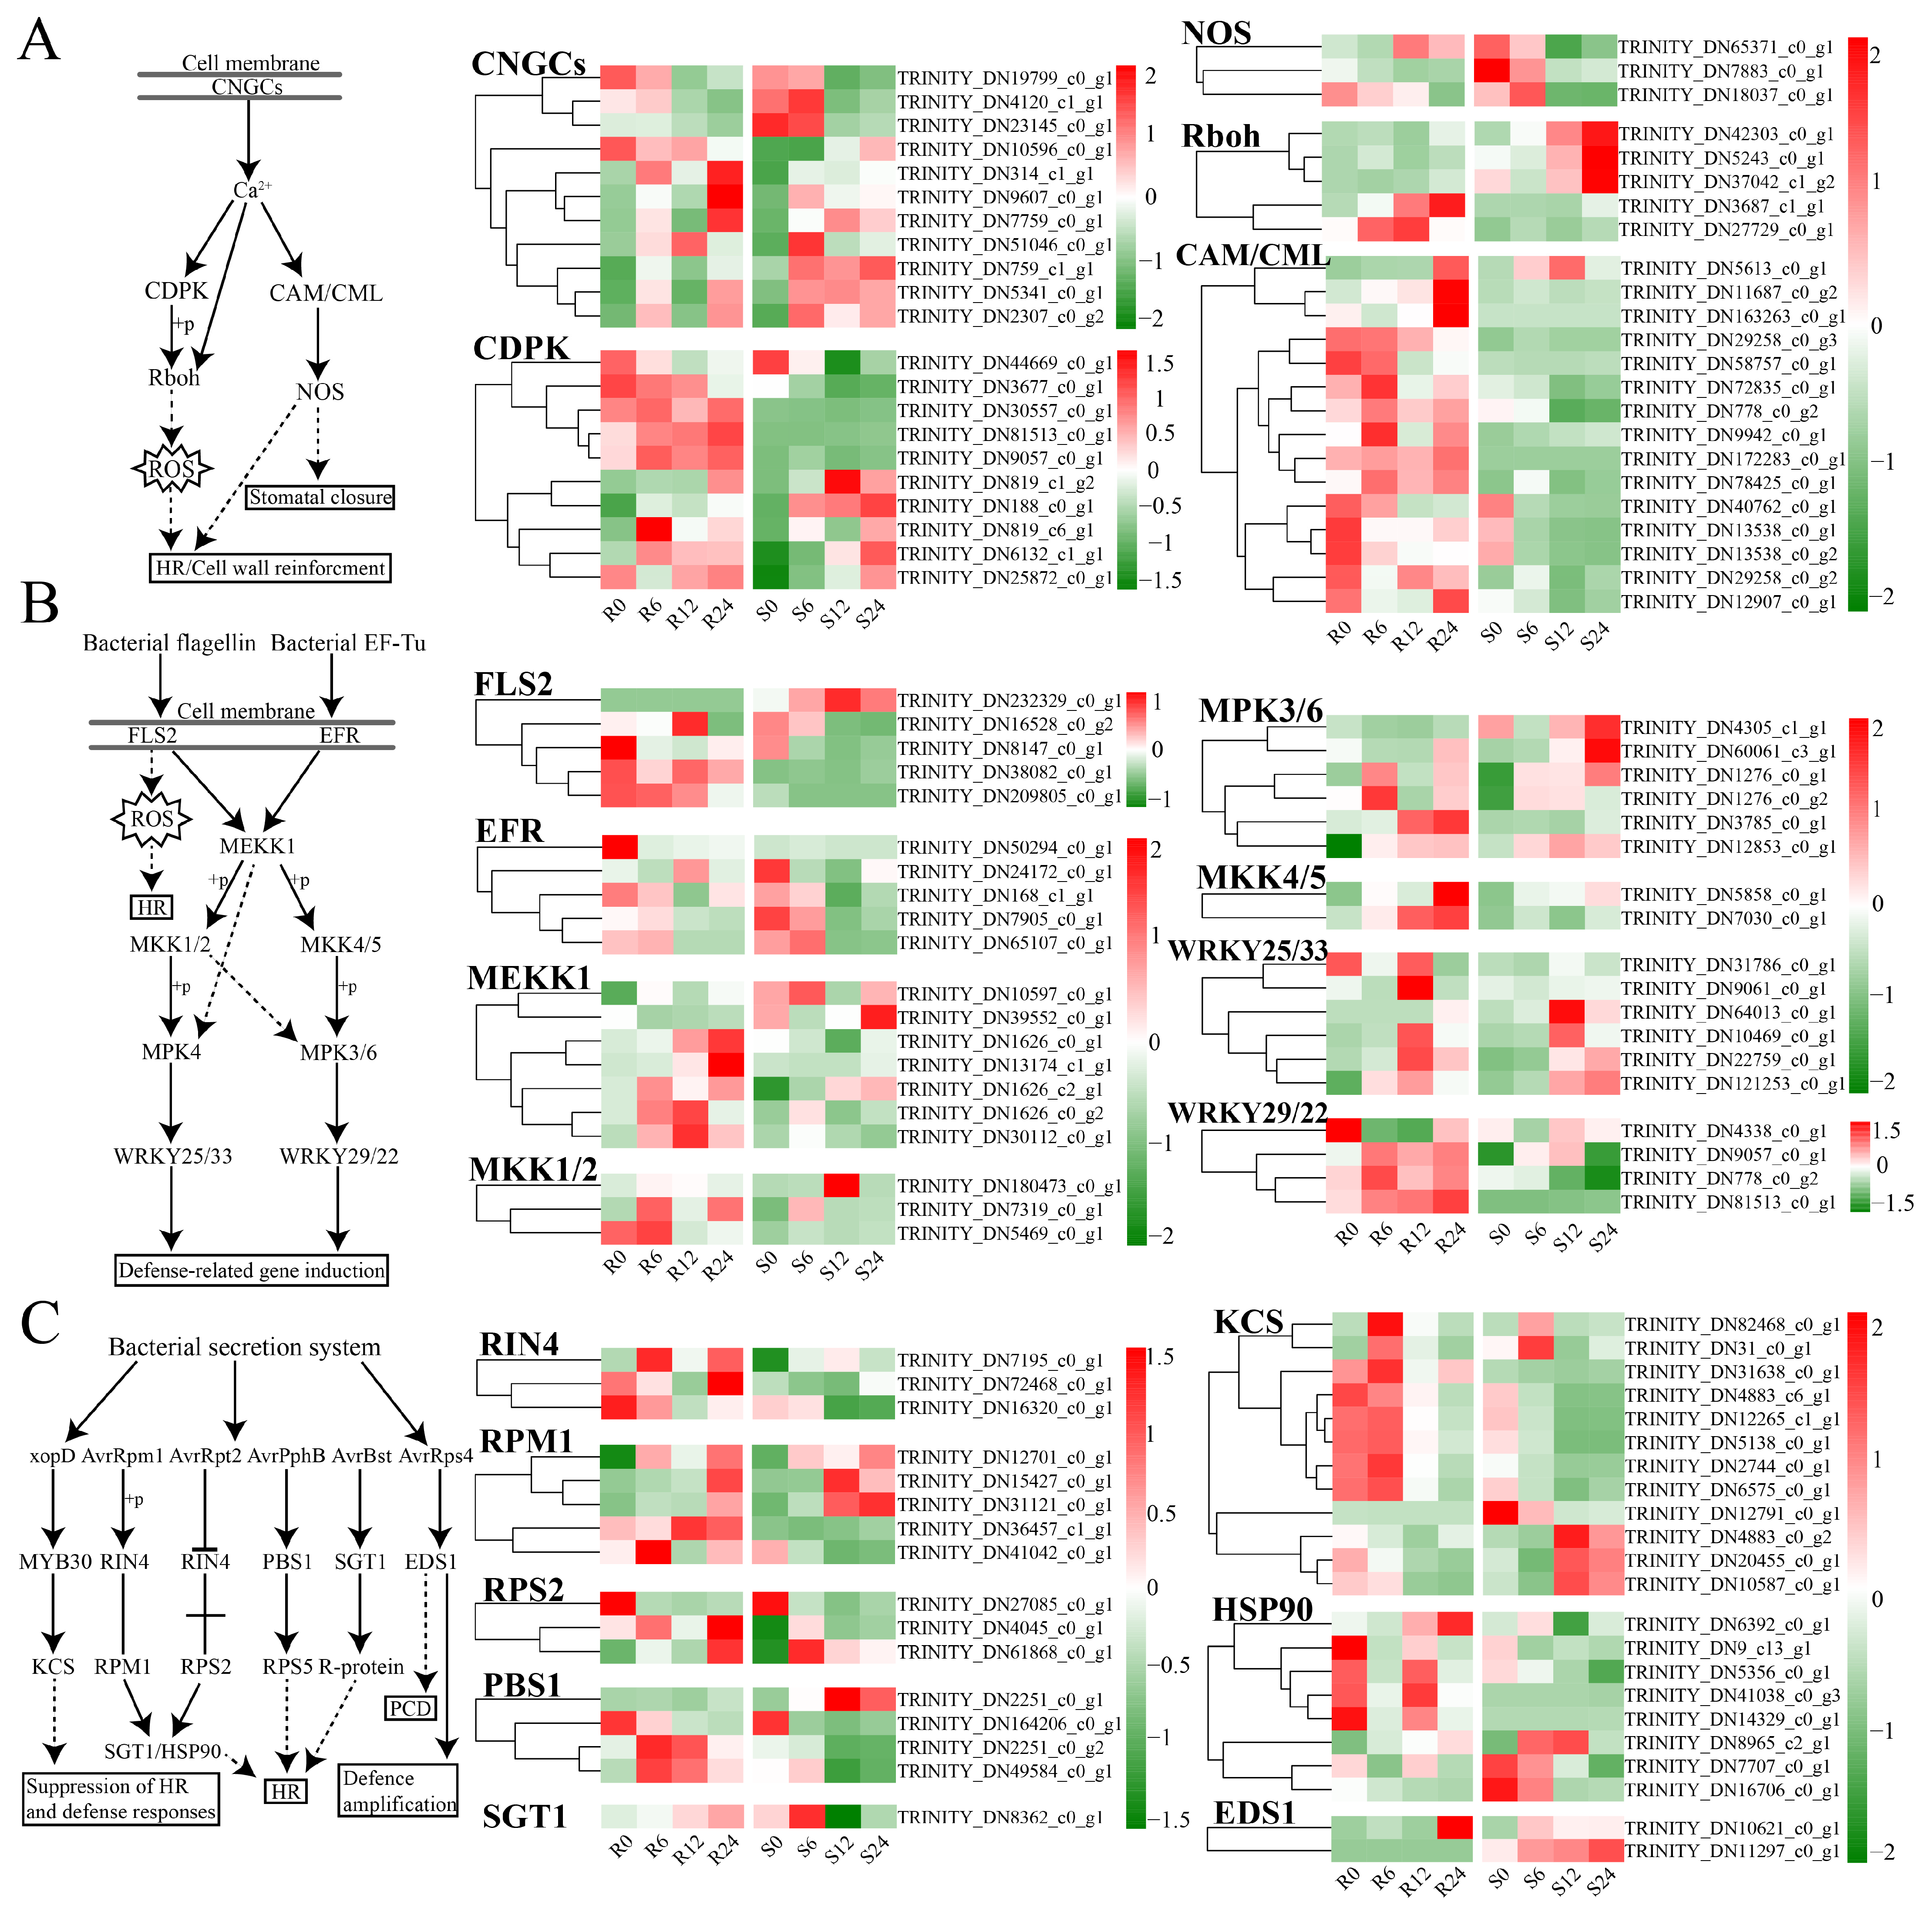
3.8. Plant–Pathogen Interaction

Cyclic Nucleotide-Gated Channels (CNGCs), which are channel proteins, play crucial roles in ion transport, plant growth, and development, as well as pathogen defense responses [32]. Eleven genes encoding this protein were identified. Six hours after inoculation with soft rot bacteria, the expression levels of these genes were observed to be higher in ‘Zishuijing’ compared to ‘ES L20’ (Figure 8A). Ten genes encode calcium-dependent protein kinases (CDPKs), which are pivotal in regulating plant growth and development in response to biotic and abiotic stresses [33]. These genes consistently showed high expression in ‘ES L20’ but not in ‘Zishuijing’ upon induction (Figure 8A). Calmodulin/calmodulin-like proteins (CAM/CML) represent a class of calmodulin proteins [34]. Fifteen genes encoding this protein were identified in the study, and they exhibited significantly elevated expression in ‘ES L20’ relative to ‘Zishuijing’ (Figure 8A).
In the PTI pathway, five DEGs encoding LRR-RLK-like receptor proteins were identified as flagellin-sensing 2 (FLS2) genes. They recognize PAMPs and contribute to ROS production, activating the immune response [35,36,37]. Mitogen-activated protein kinase kinase kinase 1 (MEKK1) is a key protein in the PTI immune pathway. It is responsible for activating the downstream MAPK cascade pathway, which plays a crucial role in defense signaling induced by the recognition of microbe-associated molecular patterns (MAMPs) and regulates several defense responses [38]. Seven genes, including TRINITY_DN1626_c0_g2, TRINITY_DN30112_c0_g1, and TRINITY_DN1626_c2_g1, encoding this protein, were induced 6 h after inoculation in the R series, showing a significant increase in expression. In contrast, the change in ‘Zishuijing’ during the same period was less prominent (Figure 8B). WRKY29/22, a transcription factor, plays a crucial role in inducing the expression of downstream defense-related genes within the PTI immune pathway. Four genes, namely TRINITY_DN4338_c0_g1, TRINITY_DN9057_c0_g1, TRINITY_DN778_c0_g2, and TRINITY_DN81513_c0_g1, encode this transcription factor. As depicted in Figure 8B, in the resistant variety ‘ES L20’, the expression of WRKY29/22 was significantly induced and up-regulated, whereas in the highly susceptible variety, its expression level increased only slightly after inoculation.
In the ETI pathway, several DEGs were also detected. RIN4 is mainly responsible for recognizing the avirulent genes avrB, avrRpm1, and avrRpt2 secreted by the pathogen, while Pseudomonas syringae pv. tomato resistance protein 1 (PBS1) functions similarly, mainly recognizing the avirulent gene AvrPphB [39,40,41]. In this study, TRINITY_DN72468_c0_g1, TRINITY_DN16320_c0_g1, and TRINITY_DN7195_c0_g1 were identified as encoding RIN4. As shown in Figure 8C, the expression of RIN4 was relatively high in the resistant variety, yet it was not induced and activated by the avirulence genes in the susceptible variety. Four PBS1-encoding resistance genes were detected in this study. Among them, TRINITY_DN2251_c0_g2, TRINITY_DN49584_c0_g1, and TRINITY_DN164206_c0_g1 were induced in the R series, reaching their peak expression levels at the initial inoculation time point R6 and then gradually declining. 3-ketoacyl-CoA synthase (KCS), a member of the Fatty Acid Elongase (FAE) complex, is a rate-limiting enzyme that determines the synthesis of very-long-chain fatty acids (VLCFAs) with different chain lengths and inhibits plant hypersensitive (HR) responses in the plant disease interaction pathway [42,43]. In this study, twelve KCS-encoding genes were detected. Six of these genes exhibited relatively high expression levels in the uninoculated R0 group and at R6 after inoculation, but their expression levels remained consistently low in the sensitive variety ‘Zishuijing’. The enhanced disease susceptibility 1 (EDS1) synthesis genes TRINITY_DN10621_c0_g1 and TRINITY_DN11297_c0_g1 were similarly up-regulated after inoculation in the S series.

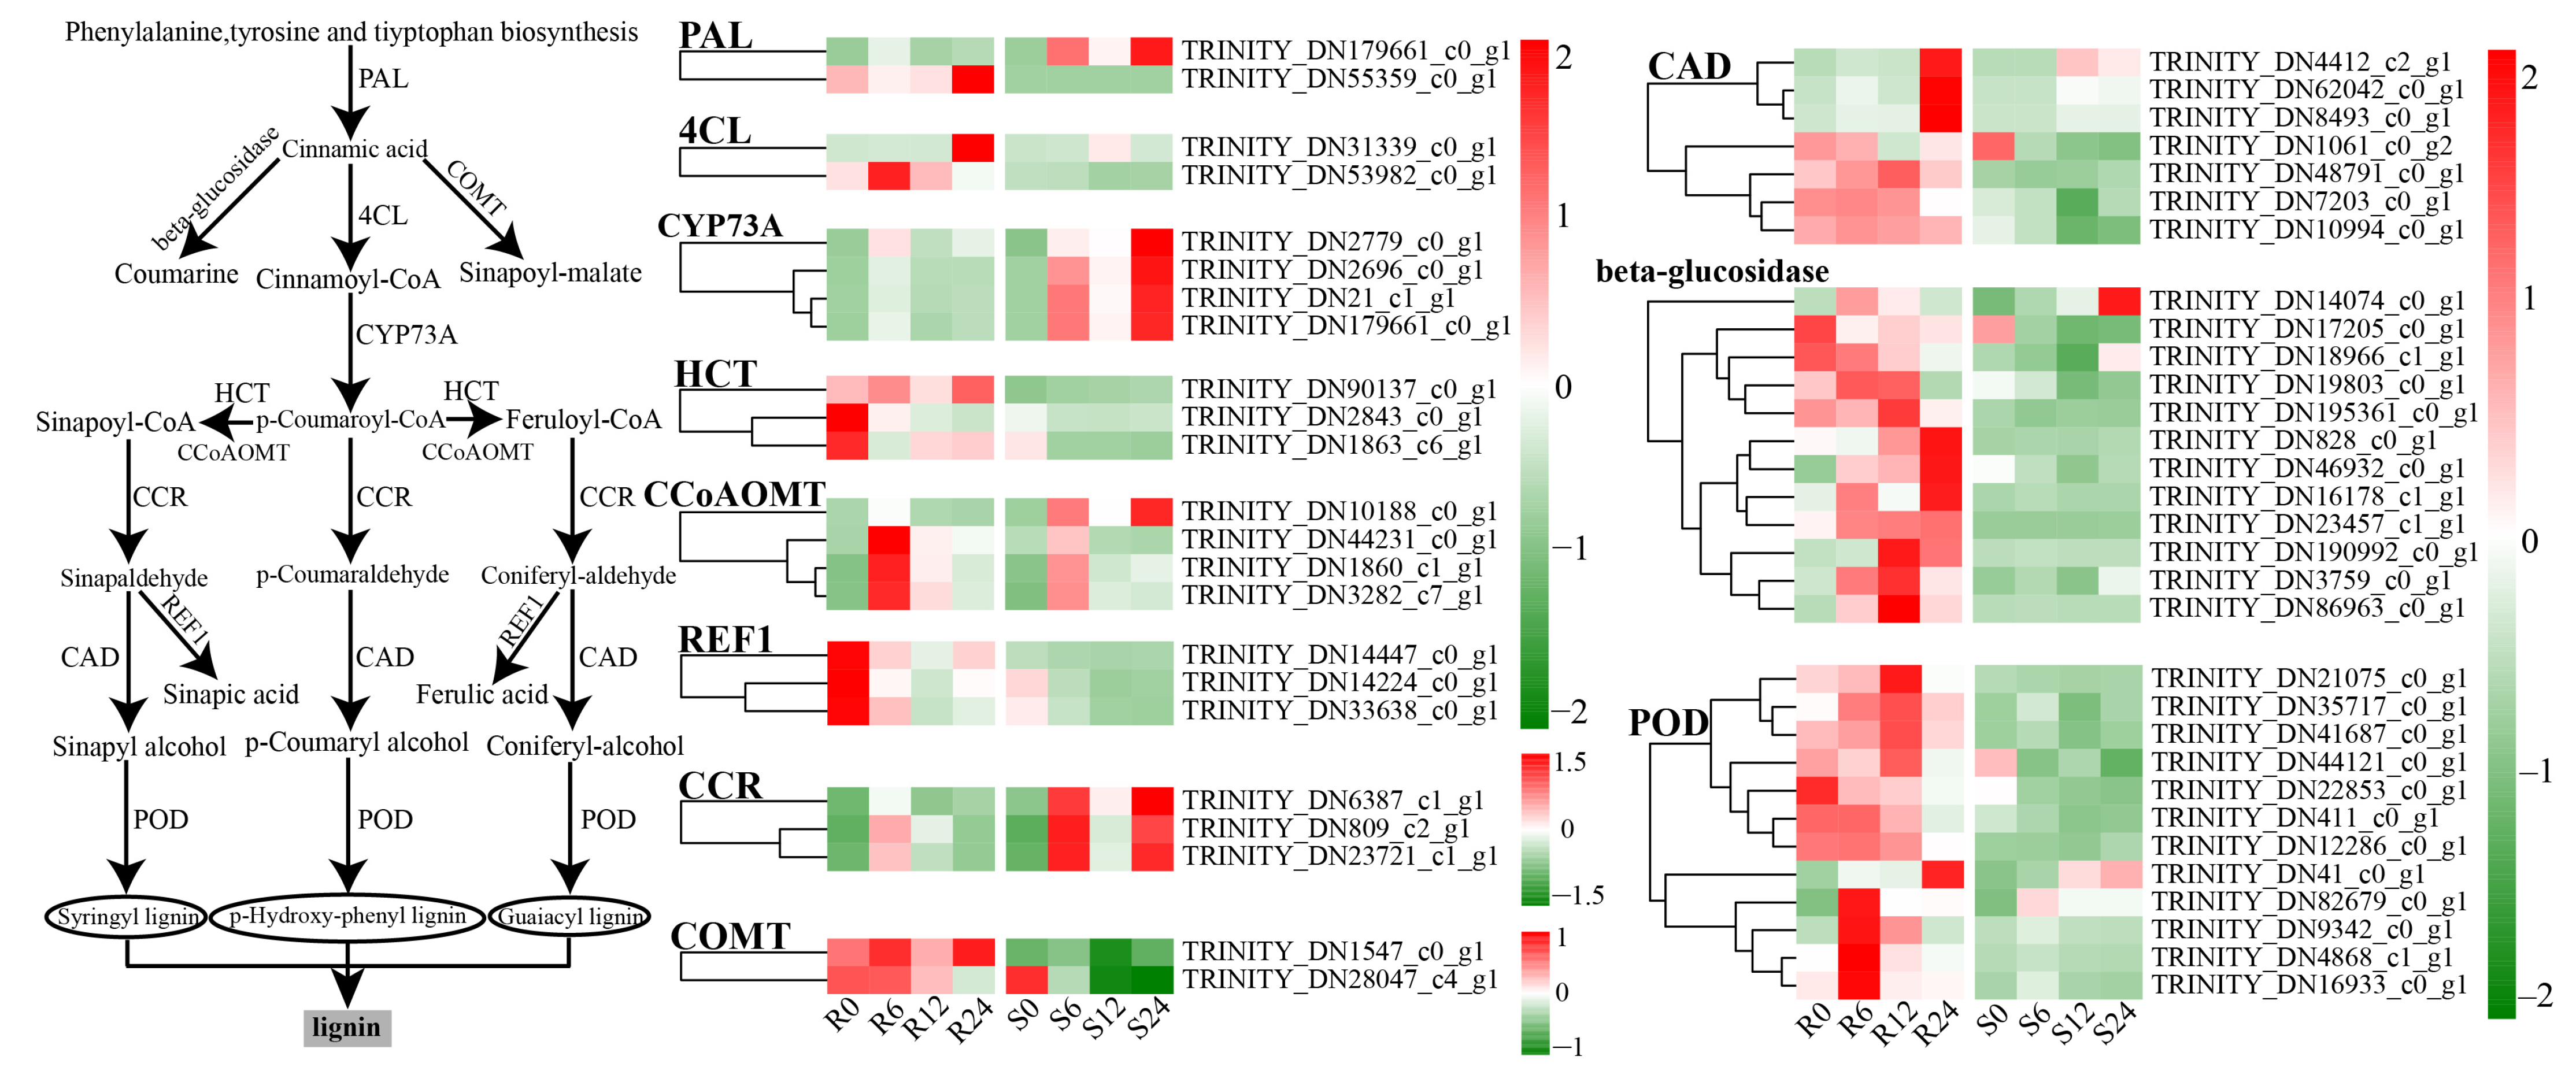
3.9. Differential Expression Analysis of Phenylpropane Metabolism

The phenylpropanoid biosynthetic pathway is of crucial importance in plant responses to biotic stress [44]. The lignins, phytochelatins, and flavonoids it generates possess the capacity to effectively fend off invasions by pathogenic bacteria [45,46]. Differential expression analysis was conducted on the phenylpropanoid biosynthetic pathway, and a gene expression heatmap was constructed. The study’s findings revealed notable disparities in the expression of specific enzyme genes, such as β-glucosidase, POD, and caffeoyl coenzyme A-O-methyltransferase (CCoAOMT), between ‘ES L20’ and ‘Zishuijing’.
CCoAOMT, an S-adenosylmethionine (SAM)-dependent methyltransferase, plays a central role in catalyzing lignin biosynthesis [47,48,49]. In this study, following 6 h of inoculation with D. fangzhongdai, the ‘ES L20’ variety exhibited a significantly elevated expression of the gene encoding this enzyme compared to the same period in ‘Zishuijing’ (Figure 9). This likely led to increased lignin synthesis.
Caffeic acid 3-O-methyltransferase (COMT) is also a key enzyme in lignin production. It participates in the metabolism of lignin substrate formation and modulates the rate and quantity of lignin synthesis [50]. Here, the gene encoding COMT was found to display consistently high expression in ‘ES L20’, whereas the corresponding gene in ‘Zishuijing’ was not induced and maintained a consistently very low expression level.
Cinnamyl alcohol dehydrogenase (CAD) is a crucial enzyme in the synthesis of lignin monomers, including coniferaldehyde, erucic aldehyde, and p-coumaric aldehyde [51,52]. In the presence of NADPH as a cofactor, these monomers can be reduced to produce lignin monomers. In the present study, the genes encoding CAD were also highly expressed in ‘ES L20’. Likewise, the expression of POD was higher in ‘ES L20’ than in ‘Zishuijing’ (Figure 9).
The expression of β-glucosidase was also higher in ‘ES L20’. After inoculation with D. fangzhongdai, the higher expression levels in ‘ES L20’ compared to ‘Zishuijing’ might promote lignin synthesis and bolster resistance to pathogens. β-glucosidase, an essential constituent of cellulase and a derivative of the phenylpropanoid biosynthetic pathway, is prevalent in numerous plant species. It is associated with plant cell growth and development, as well as cell wall relaxation or reinforcement, and is also linked to signal recognition and the production of certain signal molecules in plant cells [53,54,55]. The gene encoding this enzyme was markedly more highly expressed in ‘ES L20’ than in ‘Zishuijing’, potentially contributing substantially to cell wall fortification.

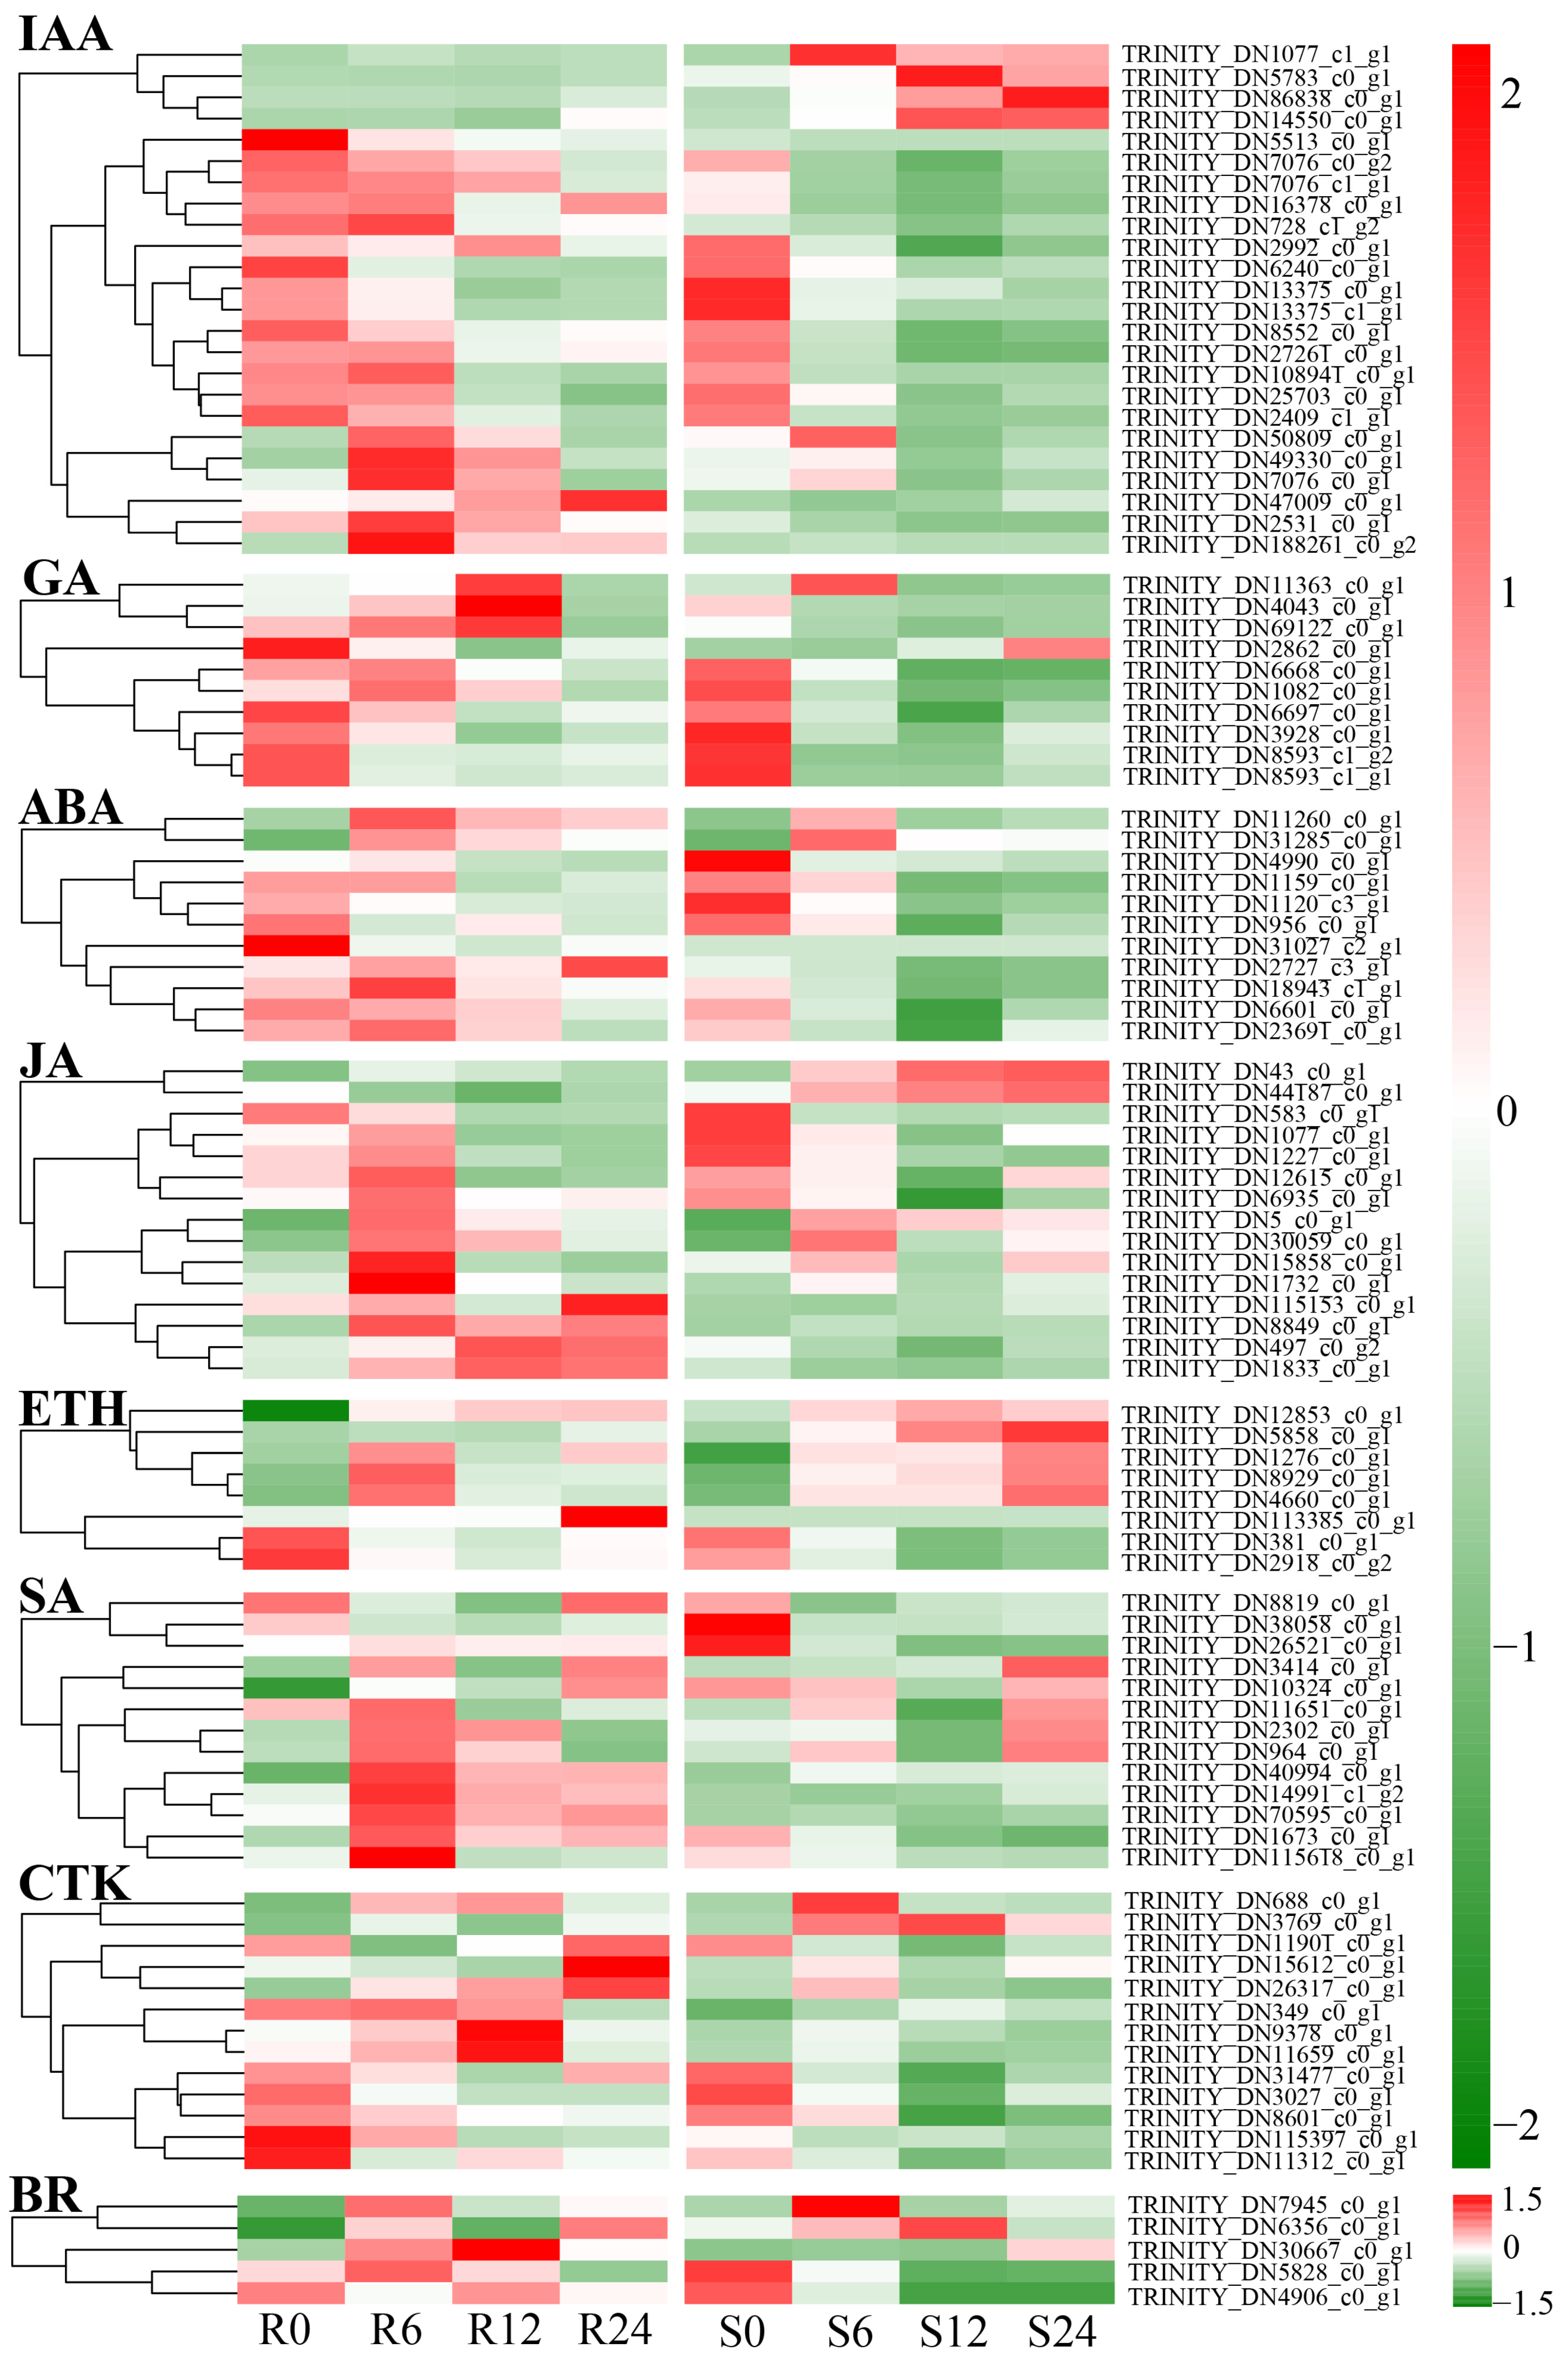
3.10. Differential Expression Analysis of Plant Hormone Signal Transduction Pathways

We observed that ‘ES L20’ and ‘Zishuijing’ displayed differential expressions of various hormones and metabolites, namely IAA (indole-3-acetic acid), gibberellin (GA), cytokinin (CTK), abscisic acid (ABA), brassinosteroid (BR), ethylene (ETH), salicylic acid (SA), and jasmonic acid (JA).
In the IAA signal pathway, 24 DEGs were identified. Out of these, four genes were specifically expressed in ‘Zishuijing’. However, the majority of the 20 DEGs exhibited high expression levels in ‘ES L20’ during the initial 12 h period after inoculation (Figure 10). Ten and eleven DEGs were detected in the GA and ABA signal transduction pathways, respectively. Most of these genes exhibited relatively high expression levels in both varieties before inoculation. Following inoculation with D. fangzhongdai, the expression of these genes in ‘Zishuijing’ demonstrated a significant downward trend. Conversely, although the expression in ‘ES L20’ also decreased, the decline was more gradual, and it still retained a relatively high expression level at R6.
The genes TRINITY_DN2302_c0_g1, TRINITY_DN3414_c0_g1, TRINITY_DN8819_c0_g1, TRINITY_DN38058_c0_g1, TRINITY_DN14991_c1_g2, and TRINITY_DN70595_c0_g1, which encode the nonexpressor of pathogenesis-related gene 1 (NPR1) in the SA pathway, were all induced to express after inoculation, with the R series showing higher expression levels at 6 hpi. Similarly, higher expression in ‘ES L20’ was also noted for the TGA genes encoded by TRINITY_DN40994_c0_g1, TRINITY_DN964_c0_g1, TRINITY_DN10324_c0_g1, TRINITY_DN11651_c0_g1, TRINITY_DN26521_c0_g1, TRINITY_DN1673_c0_g1, and TRINITY_DN115618_c0_g1 (Figure 10).
The JA pathway is mainly catalyzed by jasmonic acid-amino synthetase 1 (JAR1). JA binds to isoleucine (Ile) to form the JA-Ile complex [56]. JA-Ile, as a signal molecule, promotes the combination of coronatine-insensitive 1 (COI1) complex and jasmonate-ZIM-domain (JAZ), leading to the ubiquitination and degradation of JAZ proteins [57]. This process releases MYC2 and other JA-signaling transcription factors, which subsequently activate the transcriptional activity of jasmonate-related early response genes [58]. In this study, a total of 15 genes were identified as differentially expressed within the jasmonate-signaling pathway. The genes encoding JAR1, such as TRINITY_DN12625_c0_g1, TRINITY_DN1077_c0_g1, and TRINITY_DN8849_c0_g1, were found to be up-regulated after inoculation with D. fangzhongdai in both varieties. However, the relative expression levels in ‘Zishuijing’ showed a slight decline compared to those in ‘ES L20’. The genes TRINITY_DN583_c0_g1, TRINITY_DN1227_c0_g1, TRINITY_DN12615_c0_g1, and TRINITY_DN6935_c0_g1 encode COI1, and genes like TRINITY_DN1227_c0_g1, TRINITY_DN115153_c0_g1, TRINITY_DN43_c0_g1, and TRINITY_DN497_c0_g2 were all highly expressed in ‘ES L20’, ultimately facilitating monoterpene and alkaloid biosynthesis and enhancing plant resistance.

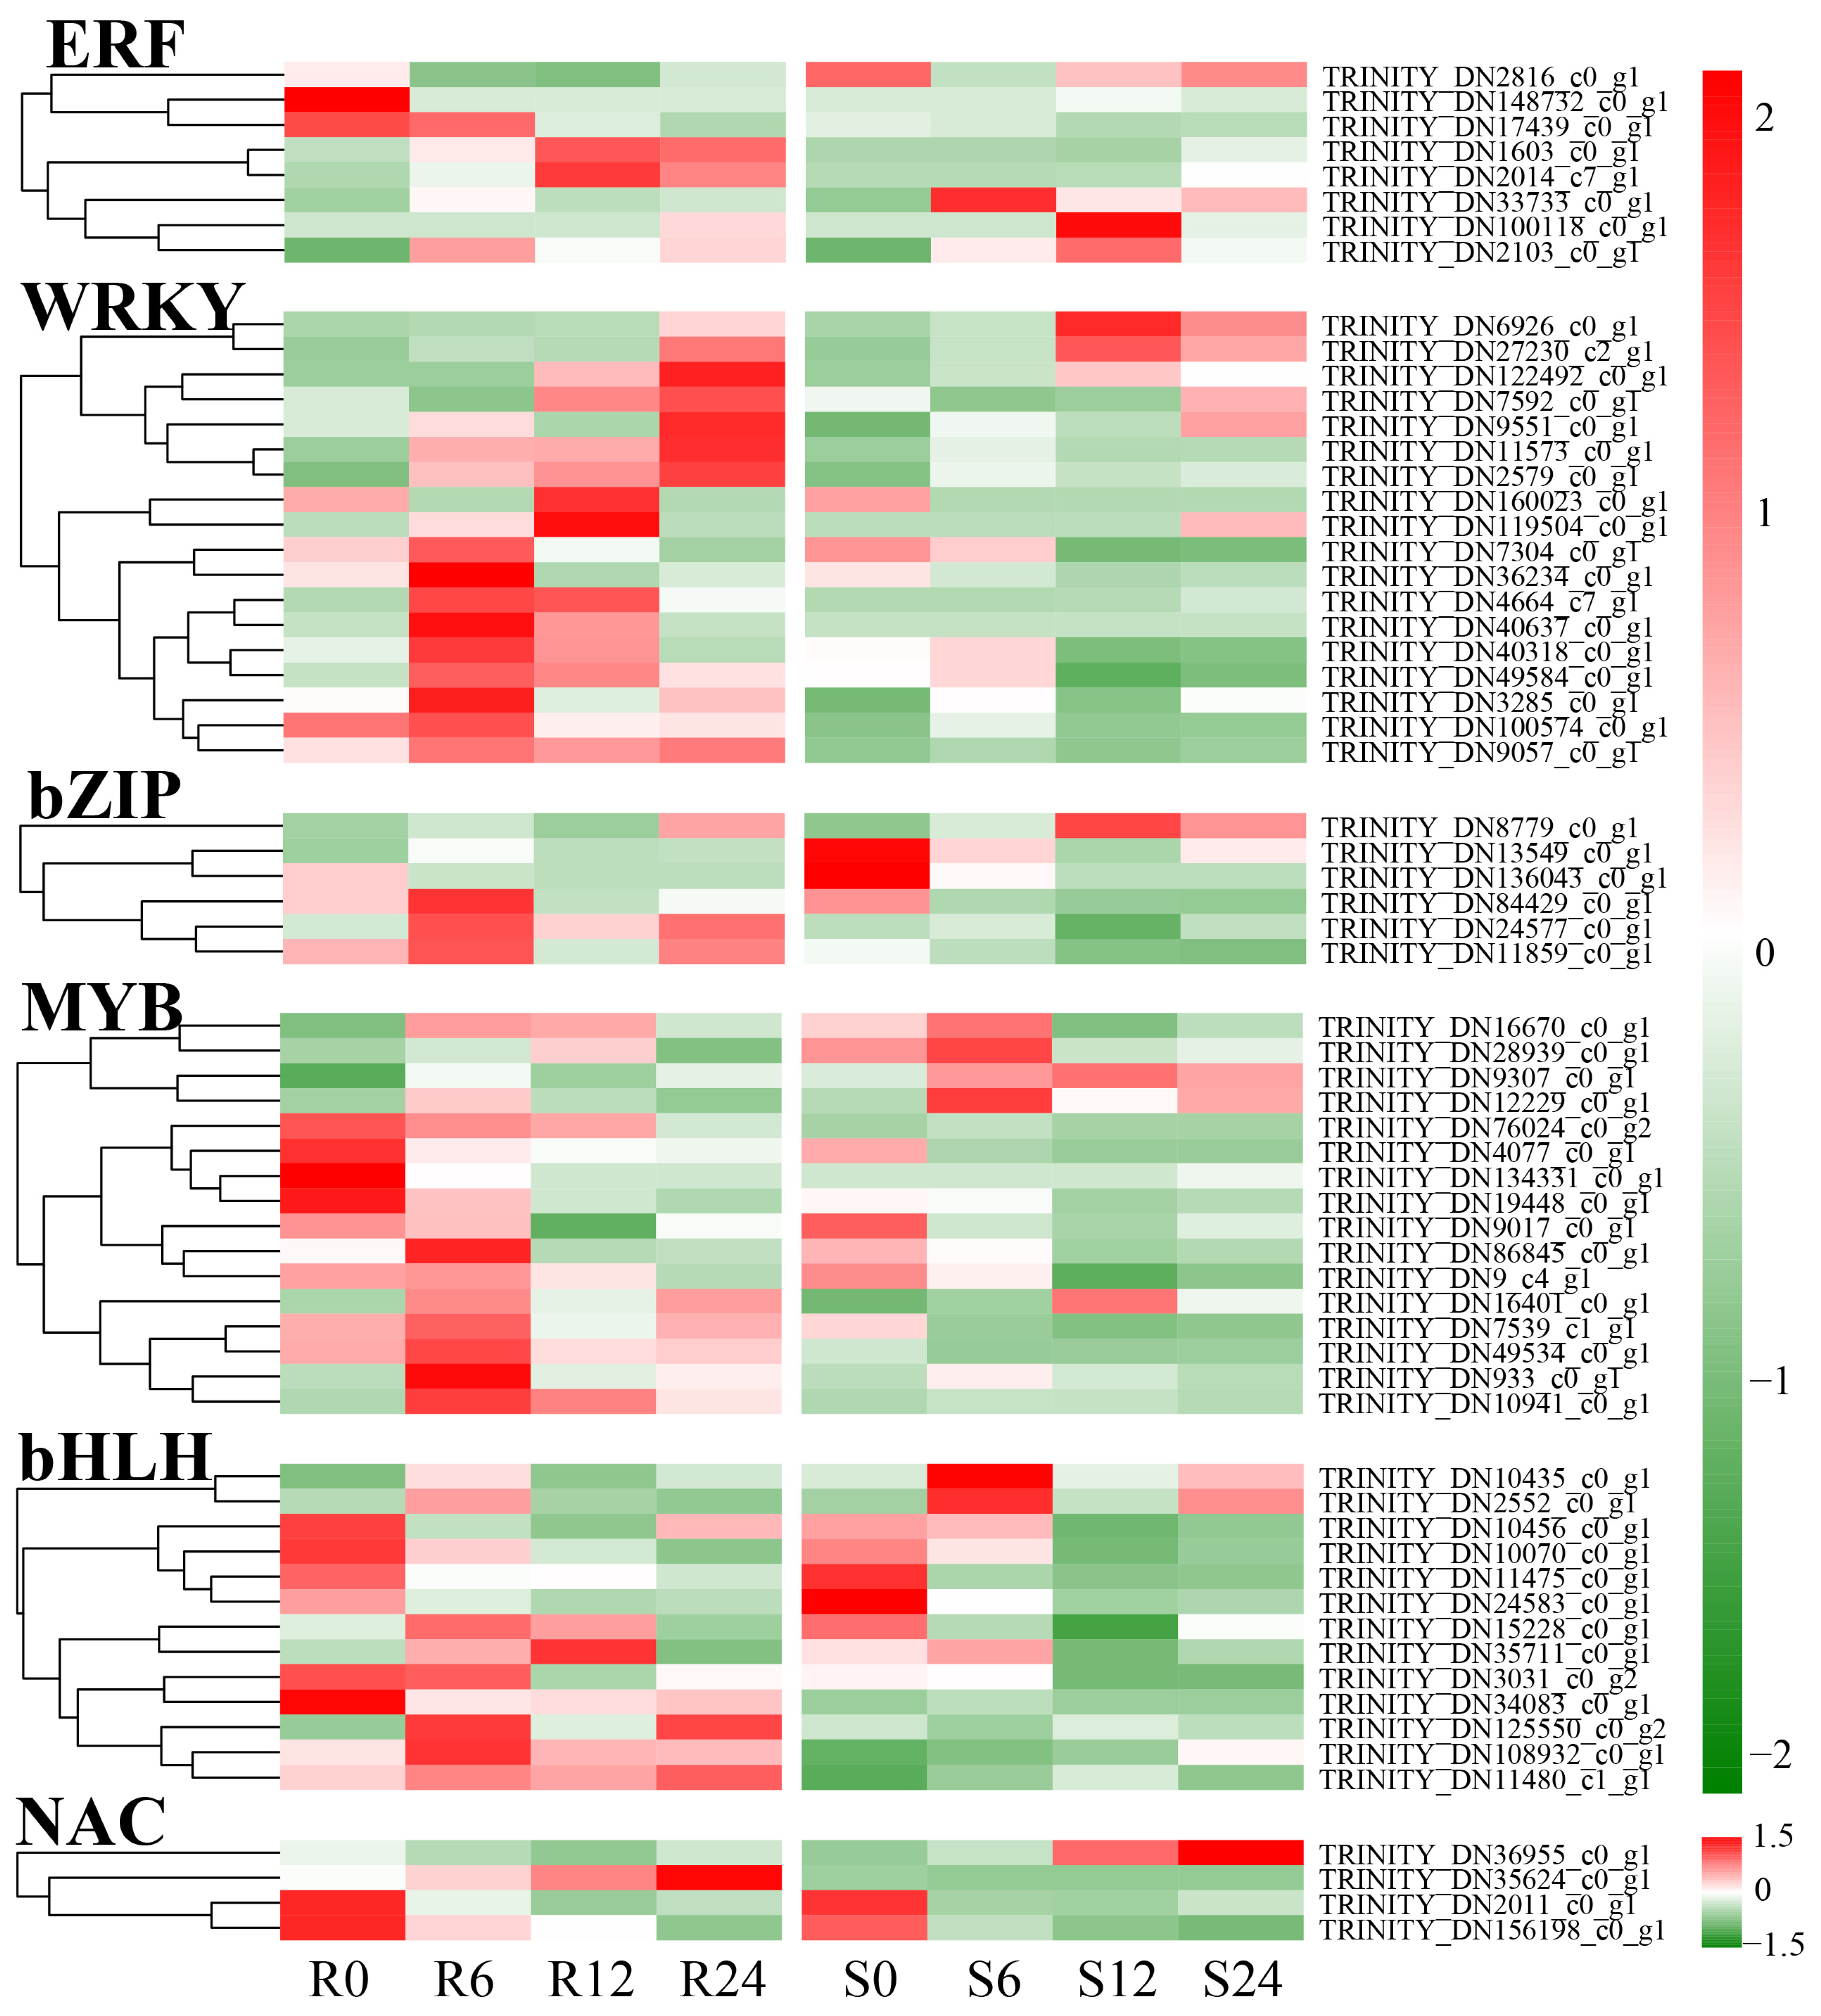
3.11. Transcription Factor Analysis

A plethora of transcription factors are involved in the response to soft rot fungus infestation. In the present study, our focus was placed on the analysis of defense-related transcription factors. The results indicated differential expression patterns of several transcription factor families, namely ERF, WRKY, bZIP, MYB, bHLH, and NAC, at various time points following inoculation in both varieties. Notably, the expression of genes associated with the WRKY transcription factor family was significantly up-regulated at 6 hpi and 12 hpi with soft rot in ‘ES L20’. In contrast, such induction was absent in ‘Zishuijing’ (Figure 11). The genes TRINITY_DN86845_c0_g1, TRINITY_DN933_c0_g1, and TRINITY_DN10941_c0_g1, belonging to the MYB transcription factor family, demonstrated a pronounced increase in expression 6 h after inoculation in ‘ES L20’, while their expression remained negligible in ‘Zishuijing’. Analogous expression trends were also discerned in the ERF, bZIP, bHLH, and NAC transcription factor families, suggesting that these families may play a central role in regulating soft rot resistance immunity.

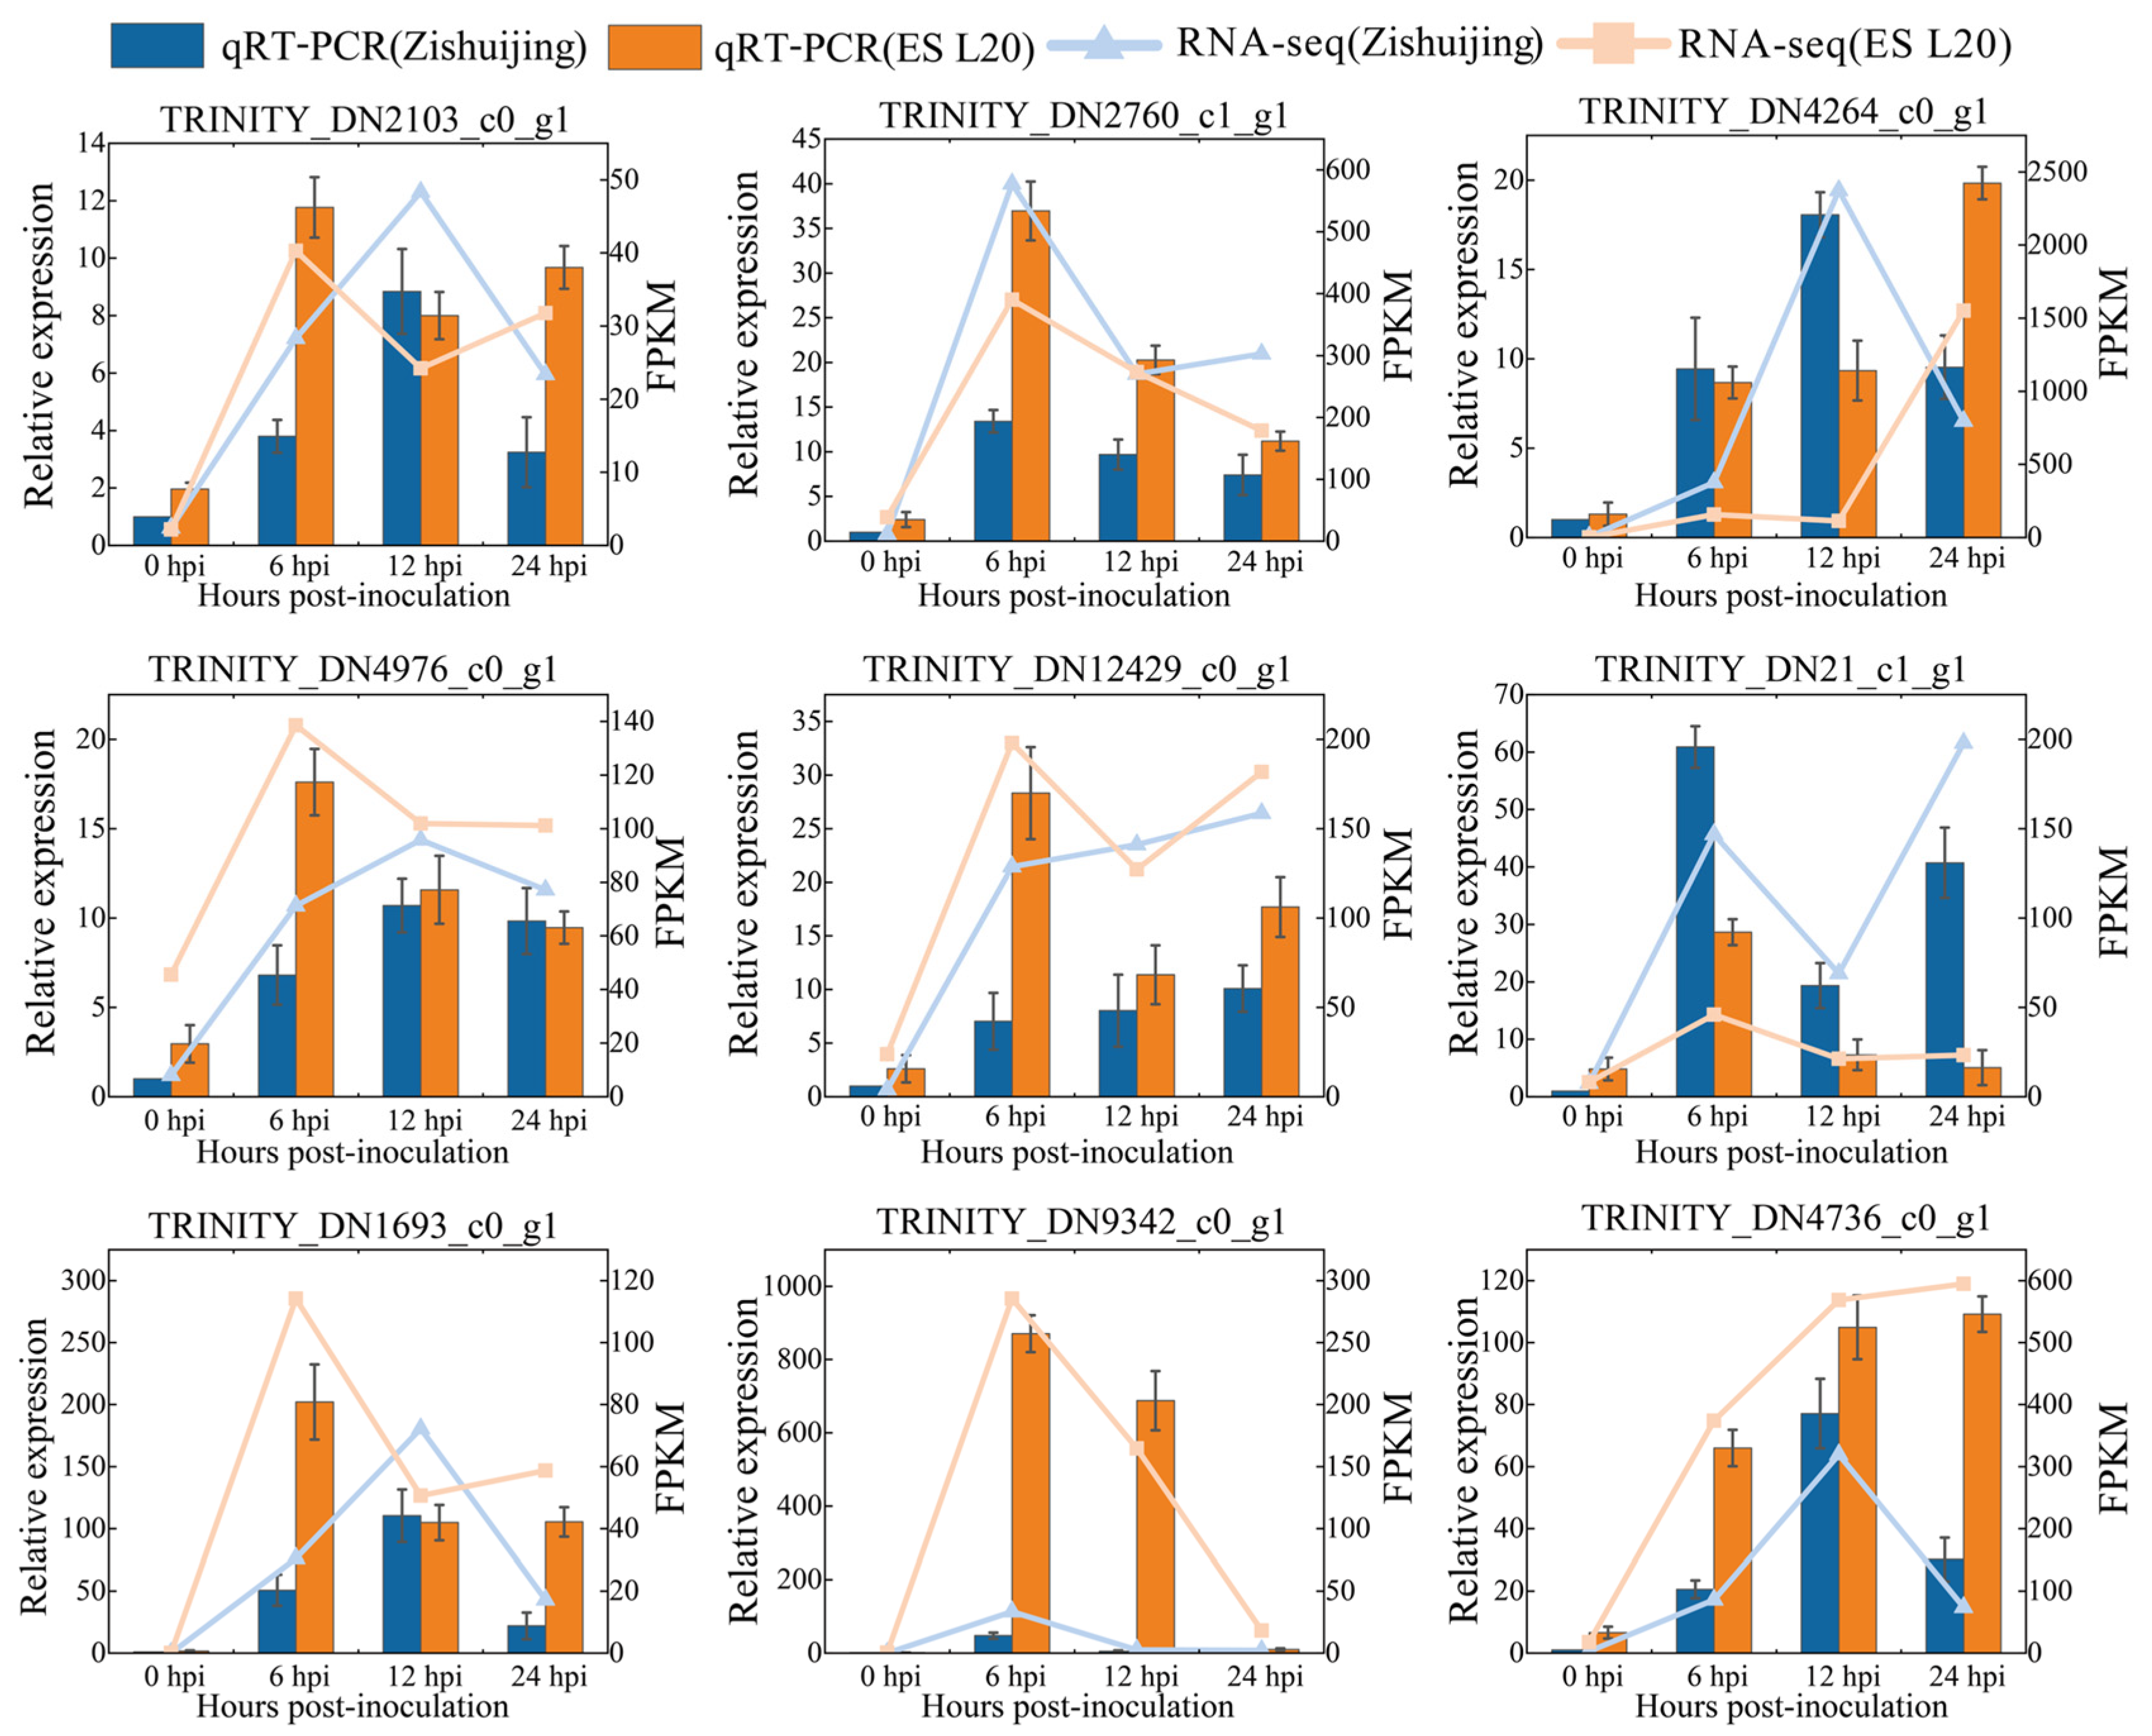
3.12. Transcriptome Results Were Verified by qRT-PCR

To validate the reliability of the RNA-Seq results, we selected nine resistance-related genes, including ERF, PR1, and DMR6 (Table S1), for qRT-PCR verification. The qRT-PCR results were compared with those of RNA-Seq, and the comparison indicated that the expression patterns of the two methods were largely consistent (Figure 12). Considering the correlation analysis between RNA-Seq and qRT-PCR (Table S8; Figure S1), it is evident that the RNA-Seq results of this study are highly reliable and can be used to effectively interpret the transcriptional regulation response of Phalaenopsis to D. fangzhongdai.

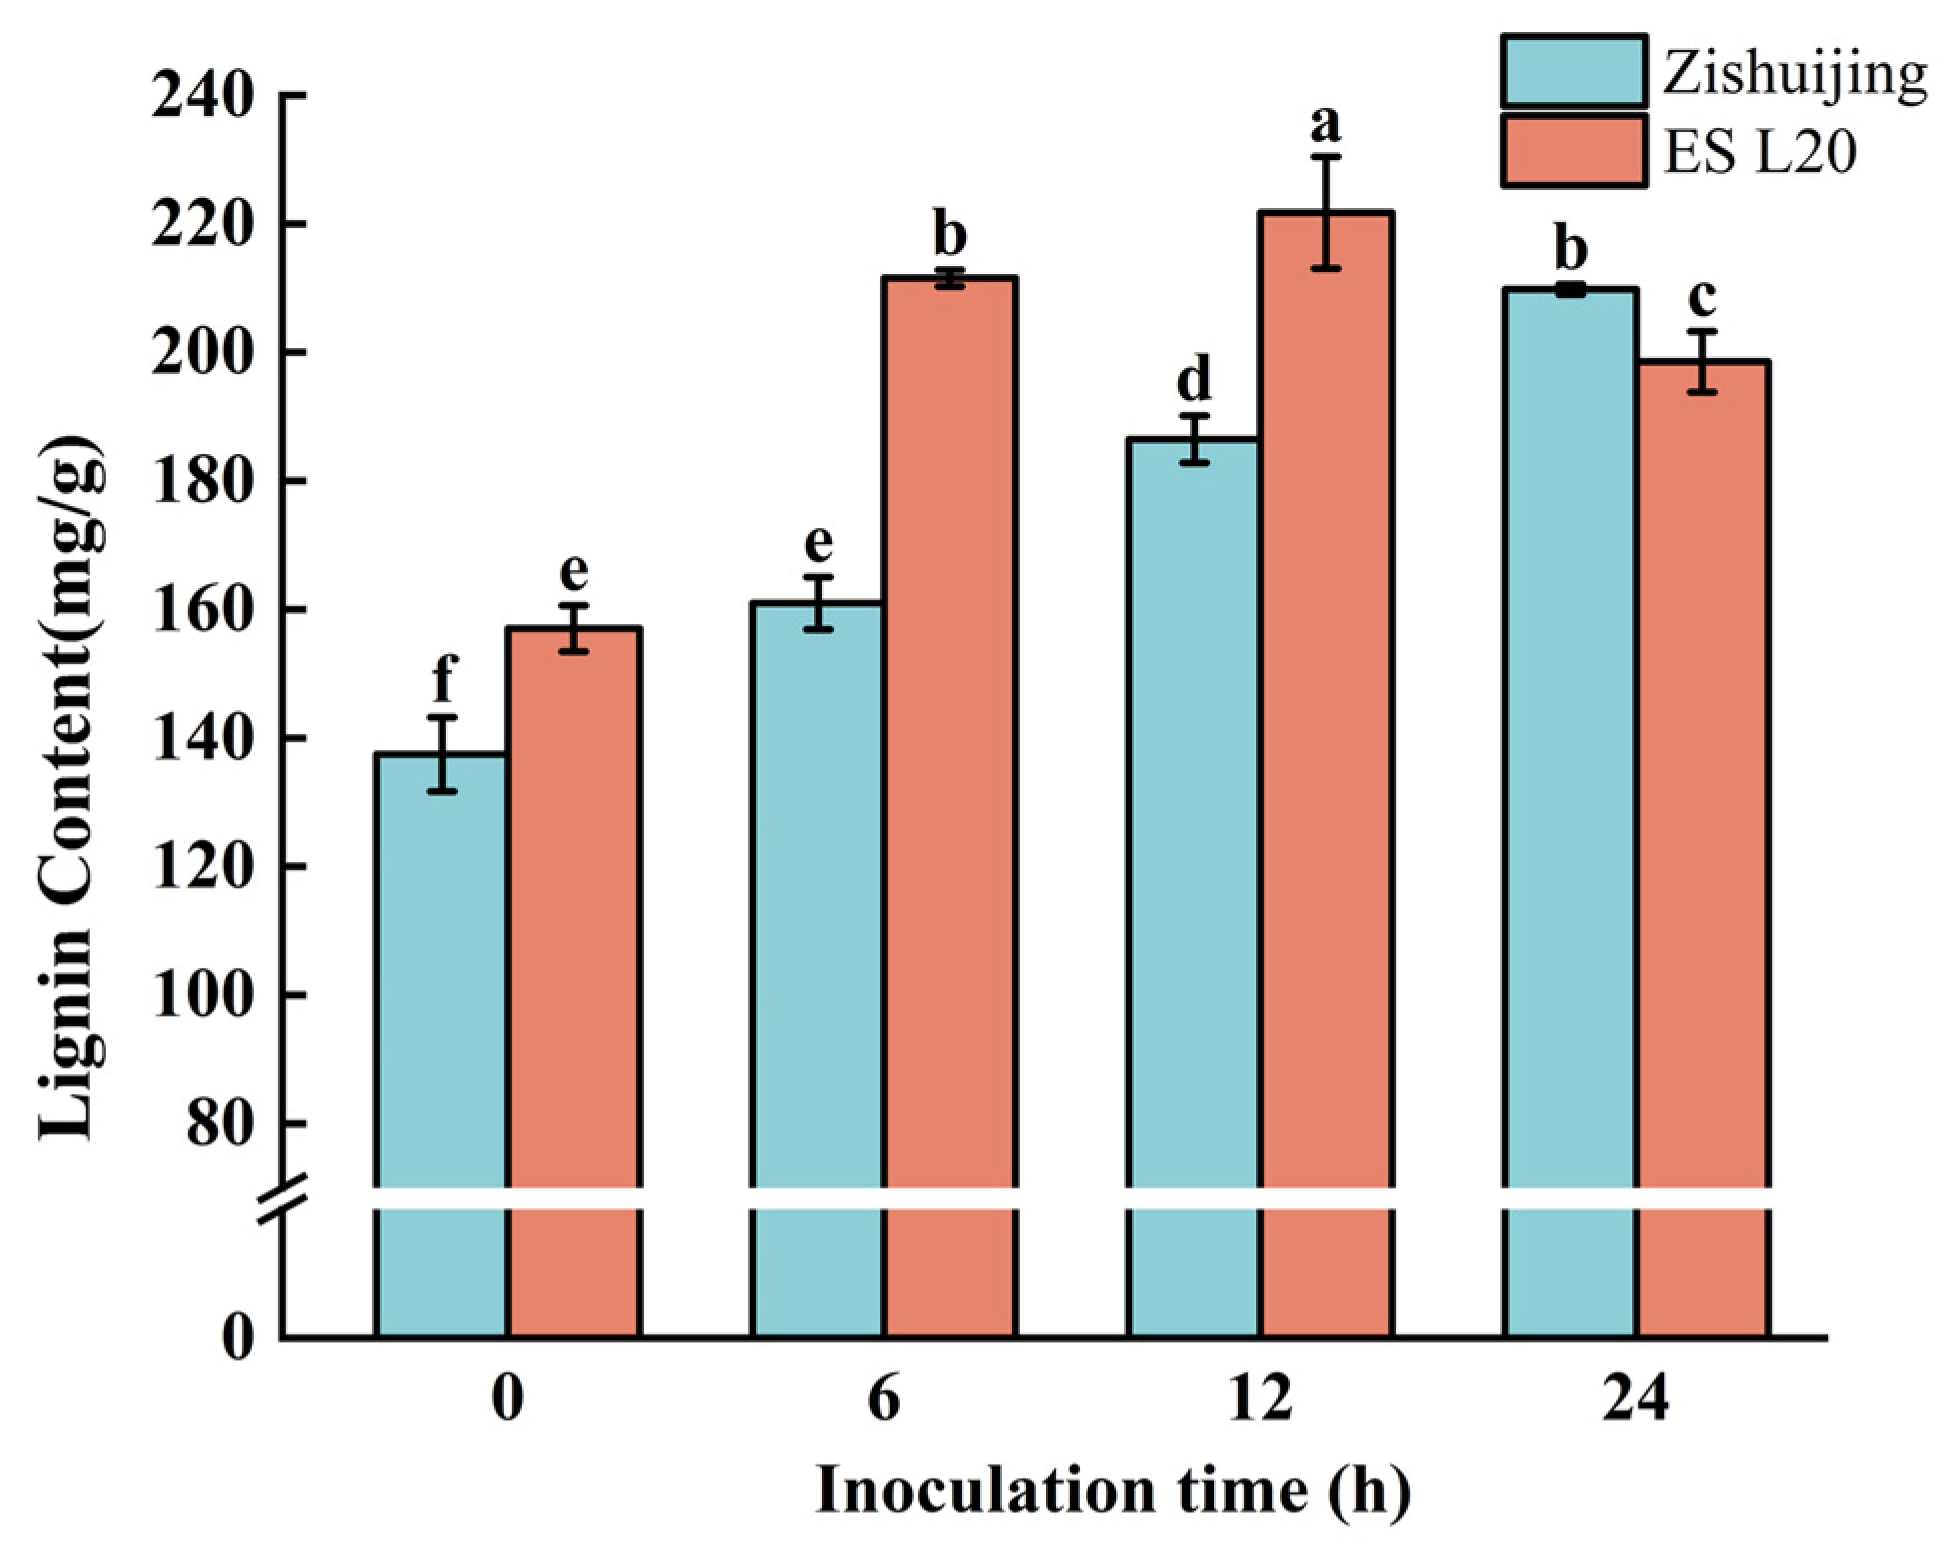
3.13. Determination of Lignin Content at Different Times

In the phenylpropanoid biosynthetic pathway, the DEGs in ‘ES L20’ were significantly induced after inoculation with D. fangzhongdai. These genes potentially catalyze the synthesis of downstream lignin and impact plant stress resistance. To explore this, we measured the lignin content of ‘ES L20’ and the disease-susceptible variety ‘Zishuijing’ at four different time points after inoculation (Figure 13).
After infection, the lignin content of both varieties increased. In ‘ES L20’, the lignin content peaked at 12 hpi and then slightly declined at 24 hpi (Figure 13). In contrast, the lignin content in ‘Zishuijing’ increased steadily after infection but was lower than that in ‘ES L20’ at 6 and 12 hpi. The mid-stage increase in lignin content in ‘ES L20’ may be related to the high expression of genes regulating lignin production in the phenylpropanoid pathway.

4. Discussion

This study delved into the transcriptional responses of the highly resistant Phalaenopsis variety ‘ES L20’ and the highly susceptible variety ‘Zishuijing’ upon inoculation with the soft rot pathogen D. fangzhongdai. By employing transcriptome sequencing, a comprehensive analysis was carried out, which has unearthed valuable insights into the molecular mechanisms underlying the differential resistance of these two varieties.

4.1. Gene Expression Patterns and Pathway Enrichment

After inoculation, distinct differential gene expression patterns emerged in both varieties at various time points. In the early stage of infection, specifically 6 hpi, ‘ES L20’ exhibited a remarkable pattern of gene up-regulation and down-regulation. This rapid response indicates that ‘ES L20’ has an efficient mechanism to detect and initiate countermeasures against pathogen invasion promptly. This early-stage gene expression change might be a crucial factor contributing to its disease-resistant phenotype.
The GO and KEGG enrichment analyses of DEGs unveiled several interesting aspects. In the GO enrichment analysis, when comparing the two varieties at the same inoculation time points, the significantly enriched GO functional terms and their numbers in ‘ES L20’ and ‘Zishuijing’ were strikingly similar in the molecular function, cell composition, and biological process categories. The pathogen inoculation exerted a substantial impact on functions related to “thylakoids”, “membranes”, “binding”, “catalytic activity”, “oxidoreductase activity”, “metabolic processes”, and “responses to stimuli and hormones”. A large number of DEGs were concentrated in these functions, suggesting that these biological processes are directly or indirectly involved in the plant’s response to the pathogen. For instance, the enrichment of genes related to oxidoreductase activity might be associated with the generation and scavenging of ROS during the defense process. ROS are known to play dual roles in plant–pathogen interactions, acting as signaling molecules to activate defense responses and as toxic agents against pathogens [59].
The KEGG enrichment analysis further demonstrated that multiple metabolic pathways were activated in both varieties after inoculation. Among them, the “phenylpropanoid biosynthesis”, “plant hormone signal transduction”, “plant-pathogen interaction”, “flavonoid biosynthesis”, and “photosynthesis-antenna protein” pathways were the ones with the highest enrichment significance and a large number of DEGs. The phenylpropanoid biosynthesis pathway is of particular importance as it leads to the production of lignin, flavonoids, and other secondary metabolites. Lignin, for example, is a key component in strengthening the cell wall, forming a physical barrier against pathogen invasion. Flavonoids, on the other hand, have antibacterial and antioxidant properties, which can directly inhibit pathogen growth and protect plant cells from oxidative damage caused by the pathogen [60].

4.2. Defense-Related Pathways and Gene Functions

Plants have evolved a complex immune defense system to combat pathogen invasion, and the defense responses activated at different infection stages are diverse. In this study, significant differences in gene expression were observed in the plant–pathogen interaction, phenylpropanoid biosynthesis, and plant hormone signal transduction pathways between ‘ES L20’ and ‘Zishuijing’.
In the plant–pathogen interaction pathway, genes in the Ca2+ pathway, such as those encoding CDPK and CaM/CML, were significantly up-regulated in ‘ES L20’ 6 h after inoculation, and their expression levels were conspicuously higher than those in ‘Zishuijing’. CDPKs are crucial in decoding the Ca2+ signals generated during pathogen invasion (Figure 14). They can phosphorylate various downstream target proteins, thereby activating a cascade of defense-related events [33]. CaM/CML proteins, as calcium sensors, also play vital roles in regulating plant defense responses [61]. Their higher expression in ‘ES L20’ may enable more efficient calcium-mediated signaling, leading to a more robust defense response.
In the PTI pathway, which serves as the plant’s first-line broad-spectrum defense, genes encoding FLS2, MEKK1, and WRKY29/22 were highly expressed in ‘ES L20’ both before and after inoculation (6 h, 12 h, and 24 h). FLS2 can recognize the PAMP of flagellin, triggering a series of defense responses, including the production of ROS and the activation of defense-related genes [62]. MEKK1 is a key component in the MAPK cascade, which transmits the defense signals from the cell surface to the nucleus [38]. WRKY29/22 are transcription factors that can regulate the expression of downstream defense-related genes. It has been demonstrated that transgenic plants overexpressing WRKY29 and WRKY22 exhibit enhanced stress and disease resistance [63]. WRKY29 and WRKY22 are also involved in the senescence process of plant leaves by regulating the accumulation of ROS and SA, promoting leaf senescence and resistance to pathogenic bacteria [64]. Additionally, it has been shown that the WRKY29 transcription factor regulates ethylene biosynthesis and response in Arabidopsis [65], potentially accounting for the up-regulation of ethylene synthesis in ‘ES L20’ within the hormone synthesis pathway (Figure 10). Their high expression in ‘ES L20’ implies more efficient PTI activation in the resistant variety.
In the ETI pathway, which is the second line of defense and provides specific immunity [10], genes encoding PBS1 and KCS were induced and up-regulated in ‘ES L20’ after inoculation. In contrast, the EDS1-encoding gene was induced in ‘Zishuijing’. PBS1 is involved in recognizing the pathogen’s effector proteins, while KCS is related to the synthesis of VLCFAs, which may play a role in plant–pathogen interactions [42]. The differential induction of these genes in the two varieties may explain, to some extent, the difference in their disease resistance.
In the phenylpropanoid biosynthesis pathway, genes encoding enzymes such as POD, CAD, and β-glucosidase were strongly induced in ‘ES L20’ after inoculation, with higher expression levels than in ‘Zishuijing’ at the same time points. POD has multiple functions in plant defense, including scavenging ROS, strengthening the cell wall by cross-linking phenolic compounds, and regulating signal transduction pathways. CAD is involved in the final step of lignin monomer synthesis, and its high-level expression in ‘ES L20’ can promote lignin synthesis, which is essential for enhancing the plant’s physical barrier against pathogens. β-glucosidase can hydrolyze glycosidic bonds, releasing bioactive aglycones that may contribute to plant defense [53]. The coordinated high-level expression of these genes in ‘ES L20’ can promote the synthesis of lignin, phytoalexins, and flavonoid secondary metabolites, and enhance the ability to scavenge ROS (Figure 14). This, in turn, significantly contributes to its disease resistance. While lignin serves as a core defense in Phalaenopsis, conserved across monocots and dicots [66], orchids deploy lineage-specific metabolites like phenanthrenes and unique alkaloids (e.g., denbinobin) as supplementary layers, targeting specific threats alongside general defenses. This hierarchical strategy highlights evolutionary adaptation in plant immunity [67]. To further investigate the role of lignin in disease resistance, we measured the lignin content of the two Phalaenopsis varieties—the resistant one (‘ES L20’) and the susceptible one (‘Zishuijing’)—at different time points post-inoculation with D. fangzhongdai. The results showed that, overall, the lignin content in ‘ES L20’ was higher than that in ‘Zishuijing’.

4.3. Role of Plant Hormone Signal Transduction Pathways

The plant hormone signal transduction pathways are integral for plant perception, defense, and disease resistance responses to pathogens [68]. In this study, a large number of DEGs were identified in this pathway in both ‘ES L20’ and ‘Zishuijing’ after inoculation, with distinct differential expression in the IAA, ABA, SA, and JA signal transduction pathways.
SA and JA are two key signaling molecules in plant defense responses. SA is a crucial signal for systemic acquired resistance (SAR), which enables plants to develop resistance not only at the site of infection, but also in distal tissues. JA is involved in insect resistance, disease defense, and growth regulation. Under specific conditions, the SA and JA signaling pathways can act synergistically to enhance plant defense responses [69]. In ‘ES L20’, 6 h after inoculation with D. fangzhongdai, the expression levels of genes related to the SA and JA signal transduction pathways, such as NPR1, JAR1, and JAZ, were significantly up-regulated compared to those in ‘Zishuijing’. NPR1 is a key regulator in the SA-mediated defense pathway. It can translocate into the nucleus upon SA perception and interact with TGA transcription factors to activate the expression of defense-related genes, such as PR genes. JAR1 catalyzes the conjugation of JA with isoleucine to form JA-Ile, which is the bioactive form of JA. JA-Ile can bind to the COI1 receptor, leading to the degradation of JAZ proteins and the activation of JA-responsive genes (Figure 14). The higher expression of these genes in ‘ES L20’ suggests that the SA- and JA-mediated defense pathways are more effectively activated in the resistant variety. This activation may lead to the production of antimicrobial compounds, the induction of defense-related proteins, and the reinforcement of the plant’s immune system.
The results of this study not only lay a solid foundation for understanding the molecular mechanisms of Phalaenopsis resistance to soft rot disease, but also offer valuable research targets in the form of identified differentially expressed genes and key pathways, such as those in plant–pathogen interaction, phenylpropanoid biosynthesis, and plant hormone signal transduction. These can be further explored to breed disease-resistant Phalaenopsis varieties. Future research should focus on validating the functions of these genes using transgenic or gene editing techniques, and studying the interactions and coordination of different defense pathways, like the crosstalk between SA- and JA-mediated defense pathways and their interactions with IAA- and ABA-mediated pathways. This will deepen our understanding of the plant–pathogen interaction network and help develop more comprehensive disease control strategies in Phalaenopsis.
However, this study has several limitations. First, the functional validation of key DEGs via transgenic or CRISPR-based approaches is currently lacking, which is essential to establish causal relationships between gene expression and resistance phenotypes. Second, the study focuses on transcriptional changes at a single time point, potentially missing dynamic regulatory events across early and late infection stages. Additionally, post-transcriptional/translational mechanisms and metabolic adjustments (e.g., phytoalexin production) were not investigated, limiting a holistic understanding of defense networks.

5. Conclusions

In conclusion, the differential gene expression patterns and pathway activation in the resistant and susceptible Phalaenopsis varieties in response to soft rot pathogen infection have been comprehensively analyzed. The findings not only contribute significantly to the understanding of the molecular basis of disease resistance in Phalaenopsis, but also hold great potential for improving the disease resistance of this important ornamental plant through genetic engineering and breeding strategies.
This research paves the way for further exploration in the field of Phalaenopsis disease resistance, with the ultimate goal of enhancing the quality and productivity of Phalaenopsis in the horticultural industry. For future directions, longitudinal multi-omics studies and functional genomics approaches (e.g., gene editing) are recommended to validate regulatory mechanisms and explore hormone crosstalk, ensuring the development of robust disease-resistant varieties.

Supplementary Materials

The following supporting information can be downloaded at: https://www.mdpi.com/article/10.3390/horticulturae11050534/s1: Table S1. qRT-PCR primer and descriptions in this study; Table S2. Raw transcriptome data for each library and filtered data organization; Table S3. Sample correlation test (cor_pearson); Table S4. Principal component analysis of the samples; Table S5. eggNOG category descriptions; Table S6. GO annotation statistical classification; Table S7. KEGG annotation statistical classification; Table S8. qRT-PCR correlation analysis; Figure S1. qRT-PCR correlation analysis.

Author Contributions

J.X. designed the experiment. J.X., J.T. and Y.M. performed the experiment. J.X., J.T. and D.R. analyzed the data and wrote the manuscript. P.L. and Y.C. revised the manuscript. All authors have read and agreed to the published version of the manuscript.

Funding

This work was supported by the National Natural Science Foundation of China (32201610), the Zhejiang Science and Technology Major Program on Agricultural New Variety Breeding (2021C02071-5), and the “Pioneer” and “Leading Goose” R&D Programs of Zhejiang (2023C02028).

Data Availability Statement

All data generated or analyzed during this study are included in this article and its Supplementary Information files.

Conflicts of Interest

The authors declare that they have no conflicts of interest.

References

  1. Arai, S.; Oro, K.; Koseki, Y.; Nagata, J. The Dynamism of the Phalaenopsis Industry in Taiwan and the International Relay Culture System. E-J. GEO 2011, 6, 16–32. [Google Scholar] [CrossRef]
  2. Liao, G.J.; Hsieh, T.F.; Chen, H.R. Effect of chemical treatment on prevention of Fusarium yellow of Phalaenopsis seedlings under simulated conditions of shipment. Taiwan Agric. Res. 2012, 61, 124–131. [Google Scholar] [CrossRef]
  3. Zhou, J.N.; Lin, B.R.; Shen, H.F.; Pu, X.M.; Chen, Z.N.; Feng, J.J. First report of a soft rot of Phalaenopsis aphrodita caused by Dickeya dieffenbachiae in China. Plant Dis. 2012, 96, 760. [Google Scholar] [CrossRef] [PubMed]
  4. Alič, Š.; Naglič, T.; Tušek-Žnidarič, M.; Ravnikar, M.; Dreo, T. Putative new species of the genus Dickeya as major soft rot pathogens in Phalaenopsis orchid production. Plant Pathol. 2017, 66, 1357–1368. [Google Scholar] [CrossRef]
  5. Szulta, S.; Kornicka, A. Pectobacterium and Dickeya genus—A review on structural variations of O-polysaccharides and their role in the pathogenic process of plants. Plant Pathol. 2023, 72, 998–1010. [Google Scholar] [CrossRef]
  6. Lecourieux, D.; Ranjeva, R.; Pugin, A. Calcium in plant defence-signalling pathways. New Phytol. 2006, 171, 249–269. [Google Scholar] [CrossRef]
  7. Devireddy, A.R.; Zandalinas, S.I.; Fichman, Y.; Mittler, R. Integration of reactive oxygen species and hormone signaling during abiotic stress. Plant J. 2021, 105, 459–476. [Google Scholar] [CrossRef]
  8. Zhang, M.; Su, J.; Zhang, Y.; Xu, J.; Zhang, S. Conveying endogenous and exogenous signals: MAPK cascades in plant growth and defense. Curr. Opin. Plant Biol. 2018, 45, 1–10. [Google Scholar] [CrossRef]
  9. Grzyb, M.; Sujkowska-Rybkowska, M.; Mikuła, A. Cell wall remodeling and callose deposition during the embryogenic transition in the tree fern Cyathea delgadii Sternb. Plant Cell Tissue Organ. Cult. 2024, 156, 30. [Google Scholar] [CrossRef]
  10. Dodds, P.N.; Rathjen, J.P. Plant immunity: Towards an integrated view of plant-pathogen interactions. Nat. Rev. Genet. 2010, 11, 539–548. [Google Scholar] [CrossRef]
  11. Zipfel, C. Plant pattern-recognition receptors. Trends Immunol. 2014, 35, 345–351. [Google Scholar] [CrossRef] [PubMed]
  12. Chakravarthy, S.; Velásquez, A.C.; Martin, G.B. Assay for pathogen-associated molecular pattern (PAMP)-triggered immunity (PTI) in plants. J. Vis. Exp. 2009, 31, 1442. [Google Scholar] [CrossRef]
  13. Sanchez-Garrido, J.; Ruano-Gallego, D.; Choudhary, J.S.; Frankel, G. The type III secretion system effector network hypothesis. Trends Microbiol. 2022, 30, 524–533. [Google Scholar] [CrossRef] [PubMed]
  14. Hurley, B.; Subramaniam, R.; Guttman, D.S.; Desveaux, D. Proteomics of effector-triggered immunity (ETI) in plants. Virulence 2014, 5, 752–760. [Google Scholar] [CrossRef]
  15. Cui, H.; Tsuda, K.; Parker, J.E. Effector-triggered immunity: From pathogen perception to robust defense. Annu. Rev. Plant Biol. 2015, 66, 487–511. [Google Scholar] [CrossRef] [PubMed]
  16. Jones, J.D.G.; Staskawicz, B.J.; Dangl, J.L. The plant immune system: From discovery to deployment. Cell 2024, 187, 2095–2116. [Google Scholar] [CrossRef]
  17. Dong, X. SA, JA, ethylene, and disease resistance in plants. Curr. Opin. Plant Biol. 1998, 1, 316–323. [Google Scholar] [CrossRef]
  18. Kimbrel, J.A.; Di, Y.; Cumbie, J.S.; Chang, J.H. RNA-Seq for Plant Pathogenic Bacteria. Genes 2011, 2, 689–705. [Google Scholar] [CrossRef]
  19. Gao, Y.; He, X.; Wu, B.; Long, Q.; Shao, T.; Wang, Z.; Ding, W. Time-course transcriptome analysis reveals resistance genes of Panax ginseng induced by Cylindrocarpon destructans infection using RNA-seq. PLoS ONE 2016, 11, e0149408. [Google Scholar] [CrossRef]
  20. Jain, S.; Chittem, K.; Brueggeman, R.; Osorno, J.M.; Richards, J.; Nelson, B.D., Jr. Comparative transcriptome analysis of resistant and susceptible common bean genotypes in response to soybean cyst nematode infection. PLoS ONE 2016, 11, e0159338. [Google Scholar] [CrossRef]
  21. Yang, D.; Li, S.; Xiao, Y.; Lu, L.; Zheng, Z.; Tang, D.; Cui, H. Transcriptome analysis of rice response to blast fungus identified core genes involved in immunity. Plant Cell Env. 2021, 44, 3103–3121. [Google Scholar] [CrossRef] [PubMed]
  22. Fu, S.F.; Tsai, T.M.; Chen, Y.R.; Liu, C.P.; Haiso, L.J.; Syue, L.H.; Huang, H.J. Characterization of the early response of the orchid, Phalaenopsis amabilis, to Erwinia chrysanthemi infection using expression profiling. Physiol. Plant 2012, 145, 406–425. [Google Scholar] [CrossRef] [PubMed]
  23. Draper, H.H.; Squires, E.J.; Mahmoodi, H.; Wu, J.; Agarwal, S.; Hadley, M. A comparative evaluation of thiobarbituric acid methods for the determination of malondialdehyde in biological materials. Free. Radic. Biol. Med. 1993, 15, 353–363. [Google Scholar] [CrossRef] [PubMed]
  24. Zhang, J.; Kirkham, M.B. Drought-stress-induced changes in activities of superoxide dismutase, catalase, and peroxidase in wheat species. Plant Cell Physiol. 1994, 35, 785–791. [Google Scholar] [CrossRef]
  25. Dalton, D.A.; Hanus, F.J.; Russell, S.A.; Evans, H.J. Purification, properties, and distribution of ascorbate peroxidase in legume root nodules. Plant Physiol. 1987, 83, 789–794. [Google Scholar] [CrossRef]
  26. Fu, J.; Huang, B. Involvement of antioxidants and lipid peroxidation in the adaptation of two cool-season grasses to localized drought stress. Environ. Exp. Bot. 2001, 45, 105–114. [Google Scholar] [CrossRef]
  27. Ruiz, J.M.; Garcia, P.C.; Rivero, R.M.; Romero, L. Response of phenolic metabolism to the application of carbendazim plus boron in tobacco. Physiol. Plant. 1999, 106, 151–157. [Google Scholar] [CrossRef]
  28. Livak, K.J.; Schmittgen, T.D. Analysis of relative gene expression data using real-time quantitative PCR and the 2−ΔΔCT method. Methods 2001, 25, 402–408. [Google Scholar] [CrossRef]
  29. Jiang, Z.; Ma, B.; Erinle, K.O.; Cao, B.; Liu, X.; Ye, S.; Zhang, Y. Enzymatic antioxidant defense in resistant plant: Pennisetum americanum (L.) K. Schum during long-term atrazine exposure. Pestic. Biochem. Physiol. 2016, 133, 59–66. [Google Scholar] [CrossRef]
  30. Liu, N.; Lin, Z.; Guan, L.; Gaughan, G.; Lin, G. Antioxidant enzymes regulate reactive oxygen species during pod elongation in Pisum sativum and Brassica chinensis. PLoS ONE 2014, 9, e87588. [Google Scholar] [CrossRef]
  31. Shahidi, P.; Bahramnejad, B.; Vafaee, Y.; Dastan, D.; Heidari, P. Isolation and characterization of Phenylalanine ammonia lyase (PAL) genes in Ferula pseudalliacea: Insights into the phenylpropanoid pathway. Genes 2024, 15, 771. [Google Scholar] [CrossRef]
  32. Duszyn, M.; Świeżawska, B.; Szmidt-Jaworska, A.; Jaworski, K. Cyclic nucleotide gated channels (CNGCs) in plant signalling-Current knowledge and perspectives. J. Plant Physiol. 2019, 241, 153035. [Google Scholar] [CrossRef]
  33. Boudsocq, M.; Sheen, J. CDPKs in immune and stress signaling. Trends Plant Sci. 2013, 18, 30–40. [Google Scholar] [CrossRef]
  34. Yang, D.; Chen, T.; Wu, Y.; Tang, H.; Yu, J.; Dai, X.; Tan, X. Genome-wide analysis of the peanut CaM/CML gene family reveals that the AhCML69 gene is associated with resistance to Ralstonia solanacearum. BMC Genom. 2024, 25, 200. [Google Scholar] [CrossRef]
  35. Soltabayeva, A.; Dauletova, N.; Serik, S.; Sandybek, M.; Omondi, J.O.; Kurmanbayeva, A.; Srivastava, S. Receptor-like kinases (LRR-RLKs) in response of plants to biotic and abiotic stresses. Plants 2022, 11, 2660. [Google Scholar] [CrossRef] [PubMed]
  36. Yu, G.; Xian, L.; Zhuang, H.; Macho, A.P. SGT1 is not required for plant LRR-RLK-mediated immunity. Mol. Plant Pathol. 2021, 22, 145–150. [Google Scholar] [CrossRef]
  37. Hsiao, Y.C.; Yamada, M. The roles of peptide hormones and their receptors during plant root development. Genes 2020, 12, 22. [Google Scholar] [CrossRef]
  38. Wu, G.; Wang, W. Recent advances in understanding the role of two mitogen-activated protein kinase cascades in plant immunity. J. Exp. Bot. 2024, 75, 2256–2265. [Google Scholar] [CrossRef]
  39. Ray, S.K.; Macoy, D.M.; Kim, W.Y.; Lee, S.Y.; Kim, M.G. Role of RIN4 in regulating PAMP-triggered immunity and effector-triggered immunity: Current status and future perspectives. Mol. Cells 2019, 42, 503–511. [Google Scholar] [CrossRef]
  40. Hou, S.; Yang, Y.; Wu, D.; Zhang, C. Plant immunity: Evolutionary insights from PBS1, Pto, and RIN4. Plant Signal. Behav. 2011, 6, 794–799. [Google Scholar] [CrossRef]
  41. Ahn, Y.J.; Kim, H.; Choi, S.; Mazo-Molina, C.; Prokchorchik, M.; Zhang, N.; Sohn, K.H. Ptr1 and ZAR1 immune receptors confer overlapping and distinct bacterial pathogen effector specificities. New Phytol. 2023, 239, 1935–1953. [Google Scholar] [CrossRef] [PubMed]
  42. Gong, Y.; Wang, D.; Xie, H.; Zhao, Z.; Chen, Y.; Zhang, D.; Sun, Y. Genome-wide identification and expression analysis of the KCS gene family in soybean (Glycine max) reveal their potential roles in response to abiotic stress. Front. Plant Sci. 2023, 14, 1291731. [Google Scholar] [CrossRef]
  43. Wang, Y.; Liu, Y.; Pan, X.; Wan, Y.; Li, Z.; Xie, Z.; Yang, P. A 3-Ketoacyl-CoA Synthase 10 (KCS10) homologue from alfalfa enhances drought tolerance by regulating cuticular wax biosynthesis. J. Agric. Food Chem. 2023, 71, 14493–14504. [Google Scholar] [CrossRef] [PubMed]
  44. Yao, T.; Feng, K.; Xie, M.; Barros, J.; Tschaplinski, T.J.; Tuskan, G.A.; Chen, J.G. Phylogenetic occurrence of the phenylpropanoid pathway and lignin biosynthesis in plants. Front. Plant Sci. 2021, 12, 704697. [Google Scholar] [CrossRef] [PubMed]
  45. Ge, W.; Xin, J.; Tian, R. Phenylpropanoid pathway in plants and its role in response to heavy metal stress: A review. Chin. J. Biotechnol. 2023, 39, 425–445. [Google Scholar] [CrossRef]
  46. Sharma, A.; Shahzad, B.; Rehman, A.; Bhardwaj, R.; Landi, M.; Zheng, B. Response of phenylpropanoid pathway and the role of polyphenols in plants under abiotic stress. Molecules 2019, 24, 2452. [Google Scholar] [CrossRef]
  47. Day, A.; Neutelings, G.; Nolin, F.; Grec, S.; Habrant, A.; Crônier, D.; Hawkins, S. Caffeoyl coenzyme A O-methyltransferase down-regulation is associated with modifications in lignin and cell-wall architecture in flax secondary xylem. Plant Physiol. Biochem. 2009, 47, 9–19. [Google Scholar] [CrossRef]
  48. Ji, P.; Lin, M.; Chen, M.; Kashif, M.H.; Fan, Y.; Ali, T.; Liu, Z. Caffeoyl-coenzyme A O-methyltransferase mediates regulation of carbon flux fluctuations during phenylpropenes and lignin biosynthesis in the vegetative organ roots of Asarum sieboldii Miq. Plant Physiol. Biochem. 2023, 201, 107855. [Google Scholar] [CrossRef]
  49. Zhong, R.; Morrison, W.H., III; Himmelsbach, D.S.; Poole, F.L.; Ye, Z.H. Essential role of caffeoyl coenzyme AO-methyltransferase in lignin biosynthesis in woody poplar plants. Plant Physiol. 2000, 124, 563–578. [Google Scholar] [CrossRef]
  50. Do, C.T.; Pollet, B.; Thévenin, J.; Sibout, R.; Denoue, D.; Barrière, Y.; Jouanin, L. Both caffeoyl Coenzyme A 3-O-methyltransferase 1 and caffeic acid O-methyltransferase 1 are involved in redundant functions for lignin, flavonoids and sinapoyl malate biosynthesis in Arabidopsis. Planta 2007, 226, 1117–1129. [Google Scholar] [CrossRef]
  51. Li, Y.; Wang, R.; Pei, Y.; Yu, W.; Wu, W.; Li, D.; Hu, Z. Phylogeny and functional characterization of the cinnamyl alcohol dehydrogenase gene family in Phryma leptostachya. Int. J. Biol. Macromol. 2022, 217, 407–416. [Google Scholar] [CrossRef] [PubMed]
  52. Muro-Villanueva, F.; Kim, H.; Ralph, J.; Chapple, C. H-lignin can be deposited independently of cinnamyl alcohol dehydrogenase C and D in Arabidopsis. Plant Physiol. 2022, 189, 2015–2028. [Google Scholar] [CrossRef] [PubMed]
  53. Opassiri, R.; Maneesan, J.; Akiyama, T.; Pomthong, B.; Jin, S.; Kimura, A.; Cairns, J.R.K. Rice Os4BGlu12 is a wound-induced β-glucosidase that hydrolyzes cell wall-β-glucan-derived oligosaccharides and glycosides. Plant Sci. 2010, 179, 273–280. [Google Scholar] [CrossRef]
  54. Du, W.; Yang, J.; Li, Q.; Jiang, W.; Pang, Y. Medicago truncatula β-glucosidase 17 contributes to drought and salt tolerance through antioxidant flavonoid accumulation. Plant Cell Env. 2024, 47, 3076–3089. [Google Scholar] [CrossRef] [PubMed]
  55. De Araujo Ribeiro, G.C.; De Assis, S.A. β-glucosidases from Saccharomyces cerevisiae: Production, protein precipitation, characterization, and application in the enzymatic hydrolysis of delignified sugarcane bagasse. Prep. Biochem. Biotechnol. 2024, 54, 317–327. [Google Scholar] [CrossRef]
  56. Hazman, M.; Sühnel, M.; Schäfer, S.; Zumsteg, J.; Lesot, A.; Beltran, F.; Heitz, T. Characterization of Jasmonoyl-Isoleucine (JA-Ile) hormonal catabolic pathways in rice upon wounding and salt stress. Rice 2019, 12, 45. [Google Scholar] [CrossRef]
  57. Sheard, L.; Tan, X.; Mao, H.; Withers, J.; Ben-Nissan, G.; Hinds, T.R.; Zheng, N. Jasmonate perception by inositol-phosphate-potentiated COI1-JAZ co-receptor. Nature 2010, 468, 400–405. [Google Scholar] [CrossRef]
  58. Melotto, M.; Mecey, C.; Niu, Y.; Chung, H.S.; Katsir, L.; Yao, J.; He, S.Y. A critical role of two positively charged amino acids in the Jas motif of Arabidopsis JAZ proteins in mediating coronatine- and jasmonoyl isoleucine-dependent interactions with the COI1 F-box protein. Plant J. 2008, 55, 979–988. [Google Scholar] [CrossRef]
  59. Mittler, R. Oxidative stress, antioxidants and stress tolerance. Trends Plant Sci. 2002, 7, 405–410. [Google Scholar] [CrossRef]
  60. Dixon, R.A.; Paiva, N.L. Stress-induced phenylpropanoid metabolism. Plant Cell 1995, 7, 1085–1097. [Google Scholar] [CrossRef]
  61. Cheval, C.; Aldon, D.; Galaud, J.P.; Ranty, B. Calcium/calmodulin-mediated regulation of plant immunity. Biochim. Biophys. Acta 2013, 1833, 1766–1771. [Google Scholar] [CrossRef] [PubMed]
  62. Zipfel, C.; Robatzek, S.; Navarro, L.; Oakeley, E.J.; Jones, J.D.; Felix, G.; Boller, T. Bacterial disease resistance in Arabidopsis through flagellin perception. Nature 2004, 440, 495–498. [Google Scholar] [CrossRef] [PubMed]
  63. Hsu, F.C.; Chou, M.Y.; Chou, S.J.; Li, Y.R.; Peng, H.P.; Shih, M.C. Submergence confers immunity mediated by the WRKY22 transcription factor in Arabidopsis. Plant Cell 2013, 25, 2699–2713. [Google Scholar] [CrossRef]
  64. Wang, Y.; Cui, X.; Yang, B.; Xu, S.; Wei, X.; Zhao, P.; Jiang, Y.Q. WRKY55 transcription factor positively regulates leaf senescence and the defense response by modulating the transcription of genes implicated in the biosynthesis of reactive oxygen species and salicylic acid in Arabidopsis. Development 2020, 147, dev189647. [Google Scholar] [CrossRef]
  65. Wang, Z.; Wei, X.; Wang, Y.; Sun, M.; Zhao, P.; Wang, Q.; Jiang, Y.Q. WRKY29 transcription factor regulates ethylene biosynthesis and response in Arabidopsis. Plant Physiol. Biochem. 2023, 194, 134–145. [Google Scholar] [CrossRef] [PubMed]
  66. Ai, G.; Yang, D.L.; Dou, D. The warfare for plant highway: Vascular plant–microbe interaction pinpoints lignin. Stress. Biol. 2022, 2, 24. [Google Scholar] [CrossRef]
  67. Mou, Z.; Zhao, Y.; Ye, F.; Shi, Y.; Kennelly, E.J.; Chen, S.; Zhao, D. Identification, biological activities and biosynthetic pathway of Dendrobium alkaloids. Front. Pharmacol. 2021, 12, 605994. [Google Scholar] [CrossRef]
  68. Pieterse, C.M.; Van der Does, D.; Zamioudis, C.; Leon-Reyes, A.; Van Wees, S.C. Hormonal modulation of plant immunity. Annu. Rev. Cell Dev. Biol. 2012, 28, 489–521. [Google Scholar] [CrossRef]
  69. Takahashi, H.; Kanayama, Y.; Zheng, M.S.; Kusano, T.; Hase, S.; Ikegami, M.; Shah, J. Antagonistic interactions between the SA and JA signaling pathways in Arabidopsis modulate expression of defense genes and gene-for-gene resistance to cucumber mosaic virus. Plant Cell Physiol. 2004, 45, 803–809. [Google Scholar] [CrossRef]
Figure 1. ‘ES L20’ and ‘Zishuijing’ phenotypes after inoculation with D. fangzhongdai. (A) Phenotypes of ‘ES L20’ and ‘Zishuijing’ inoculated at 0 h and 24 h. (B) Histogram of mean plaque area and incidence at 20 inoculation sites. The control group was inoculated with sterile NB medium. Bar = 1 cm.
Horticulturae 11 00534 g001
Figure 2. Linear charts of physiological and biochemical indicators of ‘ES L20’ and ‘Zishuijing’ inoculated with soft rot bacteria. (A) Changes of MDA content in different varieties at different time after disease onset. (B) Changes of POD activity in different varieties at different time after disease onset. (C) Changes of CAT activity in different varieties at different time after disease onset. (D) Changes of PPO activity in different varieties at different time after disease onset. (E) Changes of PAL activity in different varieties at different time after disease onset. (F) Changes of CHT activity in different varieties at different time after disease onset. Data indicate means ± standard deviation with three replications. Different letters for the same variety indicate significant differences between treatments as tested by LSD at p < 0.05. LSD, least significant difference.
Horticulturae 11 00534 g002
Figure 3. Sample correlation analysis. (A) Correlation heatmap of 24 samples. (B) Three-dimensional PCA plot of 24 samples.
Horticulturae 11 00534 g003
Figure 4. Analysis of DEGs in different combinations. (A) Venn diagram of different combinations of R series. (B) Venn diagram of different combinations of S series. (C) Venn diagram of different combinations at the same point after S and R series inoculation. (D) Up-regulation of DEGs after R and S series inoculation with R0 and S0 as control. (E) Using each point after inoculation of the S series as a control, the down-regulation of the R series on DEGs at the same point after inoculation.
Horticulturae 11 00534 g004
Figure 5. Unigene annotation results. (A) NR annotated species distribution map; (B) NR annotation sequence similarity distribution diagram; (C) NR annotation E-value distribution diagram; (D) eggNOG database annotation results; (E) GO database annotation results; (F) KEGG database annotation results.
Horticulturae 11 00534 g005
Figure 6. GO enrichment histogram. (A) GO function classification of R series; (B) GO enrichment bubble map at 4 time points of R series; (C) GO function classification of S series; (D) GO enrichment bubble map at 4 time points of S series.
Horticulturae 11 00534 g006
Figure 7. KEGG enrichment analysis. (A) KEGG enrichment bar chart of the R series at four time points; (B) KEGG enrichment bubble map of the R series at four time points; (C) Bar graph of KEGG enrichment at four time points for S series; (D) KEGG enrichment bubble plots at four time points for S series.
Horticulturae 11 00534 g007
Figure 8. Heatmaps of DEGs in plant–pathogen interaction pathway. (A) Ca2+ pathway; (B) PTI pathway; (C) ETI pathway. Heatmaps of the mean FPKM values of the three pathway-related genes normalized at different times after R and S series inoculation.
Horticulturae 11 00534 g008
Figure 9. Heatmaps of DEGs in phenylpropanoid biosynthesis pathway. Heatmaps of the FPKM mean values of genes involved in the phenylpropanoid biosynthesis pathway at different times after inoculation of R and S series.
Horticulturae 11 00534 g009
Figure 10. Heatmaps of DEGs in hormone signal transduction pathway. Heatmaps of the mean FPKM values of genes involved in IAA, GA, ABA, JA, ETH, SA, CTK, and BR signal transduction pathways were normalized at different times after inoculation in R and S series.
Horticulturae 11 00534 g010
Figure 11. Heatmaps of DEGs of major transcription factor families. Heatmaps of FPKM mean values normalized for genes related to ERF, WRKY, bZIP, MYB, bHLH, and NAC transcription factor families at different times after R and S series inoculation.
Horticulturae 11 00534 g011
Figure 12. Verification of RNA-seq results by qRT-PCR. Note: The x-axis represents the inoculation period, the left y-axis represents the relative expression of the gene with S0 as the control, and the right y-axis represents the FPKM value of RNA-seq of the gene. The dark-blue bar graph represents the relative qRT-PCR expression in ‘Zishuijing’, the dark-yellow bar graph represents the relative qRT-PCR expression in ‘ES L20’, the light-blue broken line represents the FPKM average in ‘Zishuijing’, and the broken yellow line represents the FPKM average in ‘ES L20’.
Horticulturae 11 00534 g012
Figure 13. Lignin content at 4 time points in ‘ES L20’ and ‘Zishuijing’ after infection. Data indicate means ± standard deviation with three replications. Different letters for the same variety indicate significant differences between treatments as tested by LSD at p < 0.05. LSD, least significant difference.
Horticulturae 11 00534 g013
Figure 14. Simple schematic diagram illustrating the interaction between D. fangzhongdai and Phalaenopsis. Green spheres represent effectors, blue squares represent PAMPs, pink spheres represent calcium ions, and purple spheres represent reactive oxygen species, the large blue circle represents the nucleus, brown ellipse is the secondary metabolite reaction, The pink ellipse represents the generated hormone response.
Horticulturae 11 00534 g014
Disclaimer/Publisher’s Note: The statements, opinions and data contained in all publications are solely those of the individual author(s) and contributor(s) and not of MDPI and/or the editor(s). MDPI and/or the editor(s) disclaim responsibility for any injury to people or property resulting from any ideas, methods, instructions or products referred to in the content.

