Article

Comprehensive Evaluation of Paprika Instance Segmentation Models Based on Segmentation Quality and Confidence Score Reliability

1
Institute of Agricultural Machinery, National Agriculture and Food Research Organization, Ibaraki 3050856, Japan
2
Graduate School of Agricultural and Life Sciences, The University of Tokyo, Tokyo 1138657, Japan
*
Author to whom correspondence should be addressed.
Horticulturae 2025, 11(5), 525; https://doi.org/10.3390/horticulturae11050525
Submission received: 4 April 2025 / Revised: 8 May 2025 / Accepted: 9 May 2025 / Published: 13 May 2025

Abstract

:
Fruit instance segmentation models are widely researched for inference tasks such as yield prediction and automated harvesting. Previous studies evaluated these models only on the basis of mask average precision; they overlooked segmentation quality and confidence score reliability—both crucial for inference tasks. This study proposes an evaluation method that incorporates, in addition to mask average precision, the Aggregated Jaccard Index to assess segmentation quality and the coefficient of determination between confidence scores and Intersection over Union for reliability evaluation. We compared YOLO11, Mask R-CNN, and their improved variants using a dataset that included stable and comprehensive imaging obtained by monitoring equipment in a large-scale commercial paprika greenhouse. Results show that mask scoring R-CNN excels in segmentation quality, while YOLO11 performs better in mask average precision and confidence score reliability. These findings suggest that when evaluating instance segmentation models for real-world application scenarios, we should not rely solely on mask average precision, but a combination of multiple metrics that assess different aspects of the model must be utilized.

1. Introduction

In horticulture, fruit instance segmentation is used for yield prediction and harvesting in robotic applications [1]. We developed a monitoring device that performs instance segmentation of tomatoes and paprika fruits to enable yield prediction in large-scale commercial greenhouses [2,3]. We used Mask R-CNN [4] and achieved approximately 97% AP for tomatoes [2], but only 64% for paprikas [3]. Unlike tomatoes, paprika fruits are often hidden by lower leaves that are generally not removed before harvest. Such reduced detection quality can negatively affect inference tasks, including yield prediction and automated harvesting.
Various techniques have been proposed to address fruit occlusion in paprika cultivation, with significant improvements reported in the detection quality, as detailed in Section 2. With deep learning advancements, mask AP, which determines detection success based on mask Intersection over Union (IoU), has become the standard metric for instance segmentation [5].
However, two significant problems occur when evaluating instance segmentation using only mask AP. First, AP was designed for detection accuracy and not for segmentation evaluation. Studies have shown that mask AP does not directly correspond to the segmentation quality [6]. Second, AP alone cannot be used to evaluate the reliability of confidence scores. Confidence scores represent the posterior probability or prediction estimation [7]. Typically, the model accepts predictions as the final output when their confidence scores exceed a threshold. We drew a precision–recall (P-R) curve from the confidence thresholds and calculated the AP from this curve. The P-R curve assumes that the confidence scores correlate with the actual segmentation quality; raising the confidence threshold increases precision while decreasing recall. However, confidence scores and actual segmentation quality do not perfectly correlate, resulting in zigzagged P-R plots [8]. For AP calculation, the P-R curve must be smoothed through preprocessing. Consequently, AP does not reflect the correlation between confidence scores and actual segmentation quality.
These aspects of the models may be important for practical applications. For example, automated harvesting tasks [9], which require information on the exact fruit position and pose, require high-quality segmentation. Additionally, if confidence scores are reliable, counting tasks in environments where fruits are frequently occluded can benefit from post-processing techniques such as adaptive thresholding, which allows for the dynamic adjustment of confidence score thresholds to accommodate environmental changes.
This study aimed to demonstrate that using solely mask AP is not sufficient to evaluate the segmentation quality or confidence score reliability in paprika fruit instance segmentation. Further, we propose using the Aggregated Jaccard Index (AJI) for segmentation quality assessment and the correlation coefficient (R) of the confidence–IoU correlation to evaluate confidence score reliability in addition to using mask AP. Moreover, by evaluating and comparing multiple paprika fruit instance segmentation models using these metrics, we aimed to identify models that can be flexibly applied to inference tasks. Figure 1 presents an overview of the proposed method.
This study makes two contributions:
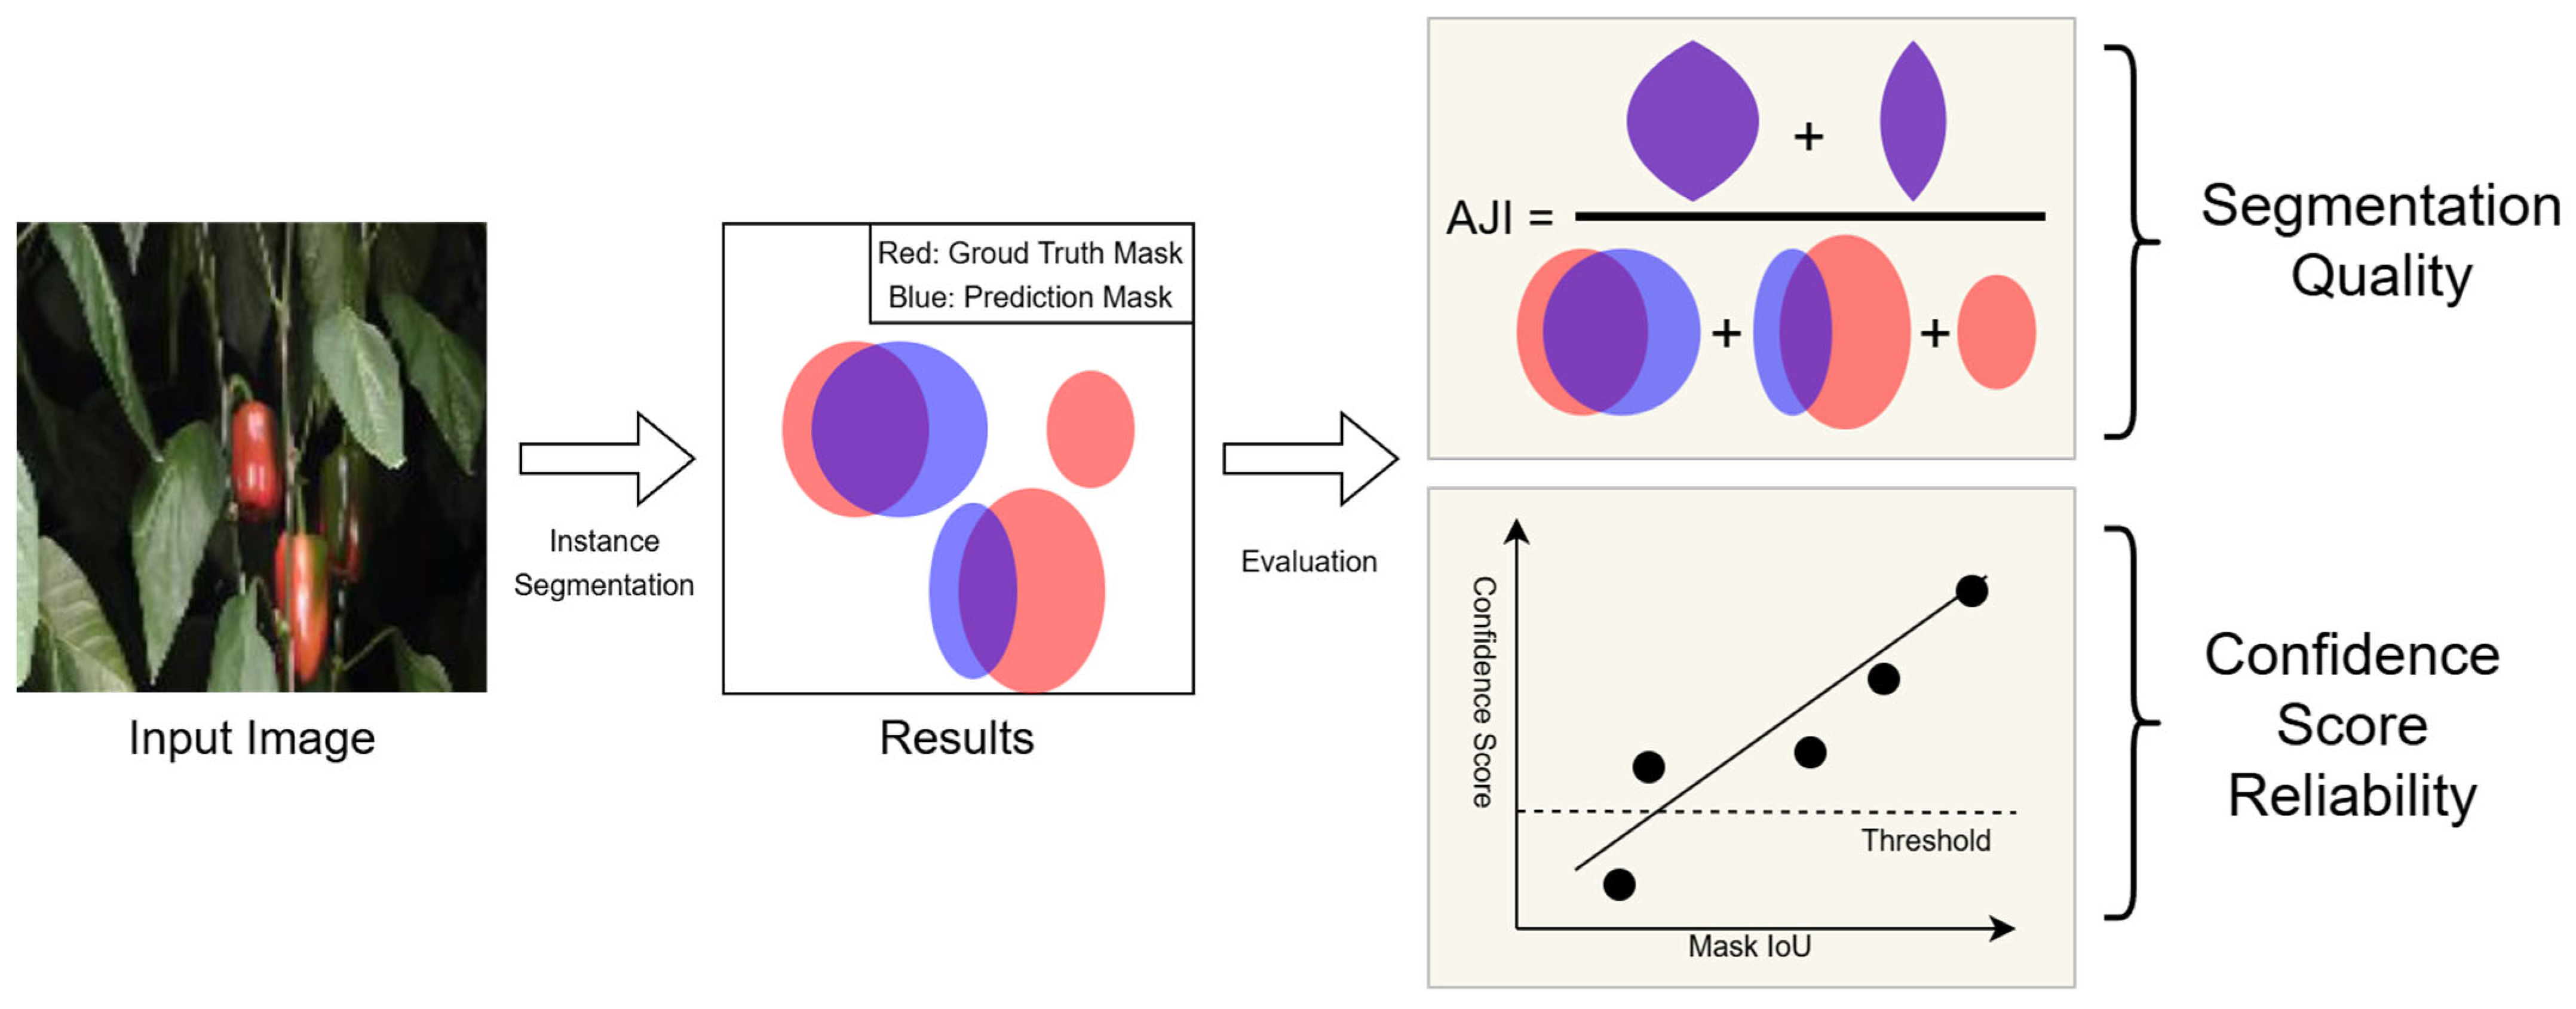
  • We proposed metrics for evaluating various aspects of paprika fruit instance segmentation models. This will enable us to develop flexible and high-performance methods for yield prediction and automated harvesting.
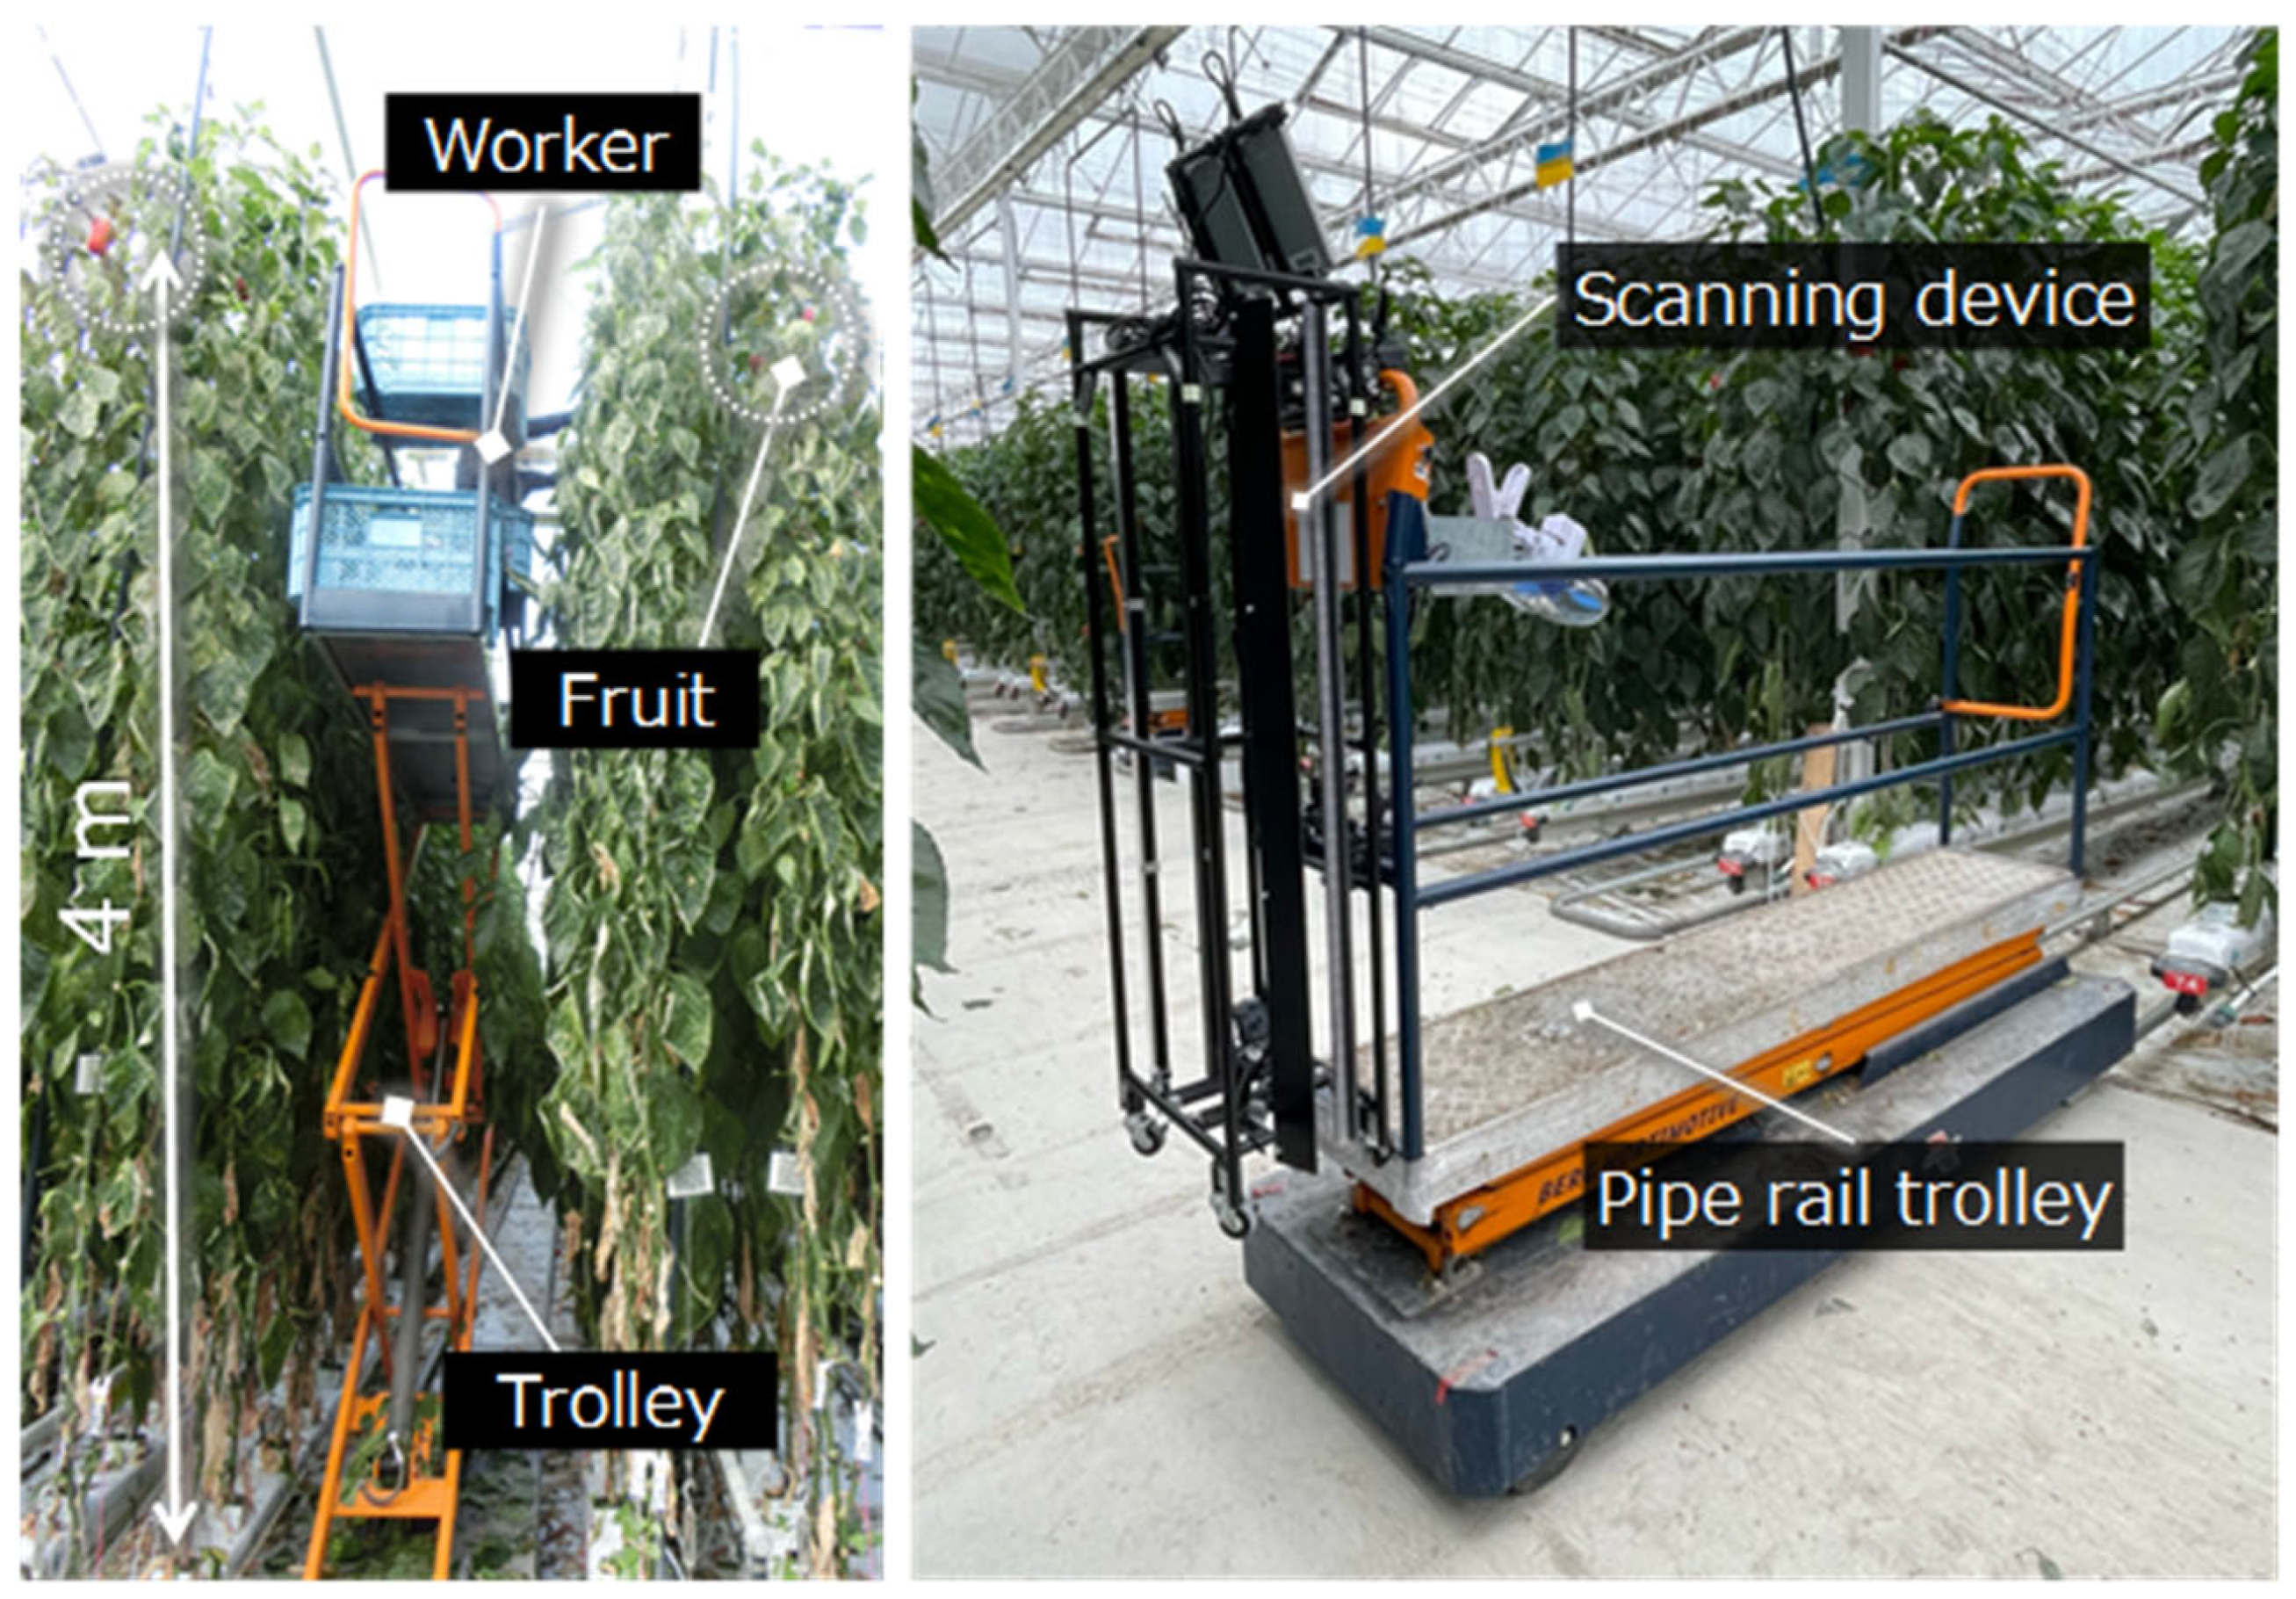
  • We trained and evaluated various instance segmentation models using data obtained from large-scale commercial greenhouses. Previous studies have often used images captured in laboratory environments or manually collected data from greenhouses. These approaches often introduce risks, such as inconsistent camera-to-fruit distances, arbitrary imaging target selection, and unstable lighting. The cultivation rows were captured at night with LED lighting using our monitoring device in a commercial greenhouse. This enabled model evaluation using stable and comprehensive data.

2. Related Works

Researchers have proposed various approaches to address the occlusion problems in paprika cultivation environments by focusing on detection and instance segmentation.
Early research focused on improving imaging techniques to solve occlusion problems. Hemming et al. [10] evaluated detection by varying the position and angle of a single camera and combining multiple viewpoints. Their results revealed that the most favorable single viewpoint came from the front and from a 60-degree zenith angle facing upward.
In addition to imaging techniques, researchers have explored classical image processing methods to improve detection. McCool et al. [11] proposed a two-stage system comprising pixel-level segmentation based on local visual texture features and fruit region detection. Ji et al. [12] suggested using manifold ranking to address the problem of uneven surface color of paprikas under different lighting conditions.
With recent advances in deep learning techniques, instance segmentation quality has dramatically improved, even for partially occluded paprika fruits. Ning et al. [13] embedded a Convolutional Block Attention Module (CBAM) in the object detection model YOLOv4 of a paprika-harvesting robot. They reported that while YOLOv4 without CBAM achieved an F1-score of 82.19%, incorporating the CBAM improved the F1-score to 91.84%. Escamilla et al. [14] achieved highly accurate fruit counting by combining the YOLOv5 model, which detects objects, classifies ripeness, and determines position in real time, with the tracking algorithm DeepSORT. Barrios et al. [15] attempted the simultaneous segmentation of paprika fruits and peduncles using Mask R-CNN. Cong et al. [16] also used Mask R-CNN but significantly improved the detection quality by modifying the backbone of the conventional ResNet to Swin Transformer. They also succeeded in improving segmentation quality by changing the Mask Head to Unet3+.

3. Materials and Methods

3.1. Image Collection and Dataset Construction

We collected images of red paprika (Capsicum annuum L. ’Nagano’) and constructed a dataset for segmentation training and evaluation. Figure 2 presents an overview of the paprika monitoring device [3] used for image collection. To scan the crop canopies, we mounted the device on a trolley running along a pipe rail between the plant rows. The device has two cameras facing the left and right sides. Both cameras were installed at an upward angle to reduce occlusion problems in the paprika. The device performed imaging at night using light-emitting diode (LED) lights and shading plates to adjust the illumination range, enabling stable lighting conditions and effective background removal. Two Tablet PCs on the device converted and stored the captured videos of each cultivation row as panoramic images.
The image data were collected from Ai-Sai Farm Kokonoe in Oita Prefecture between 7 October 2022 and 24 January 2023. The collected images contained paprika at various growth stages, ranging from small immature fruits to fully colored mature fruits. We segmented the panoramic images into 512 × 512 pixel tiles and manually annotated the masks for the paprika fruits. Consequently, we obtained 1042, 190, and 372 images for training, validation, and testing, respectively.

3.2. Instance Segmentation Models
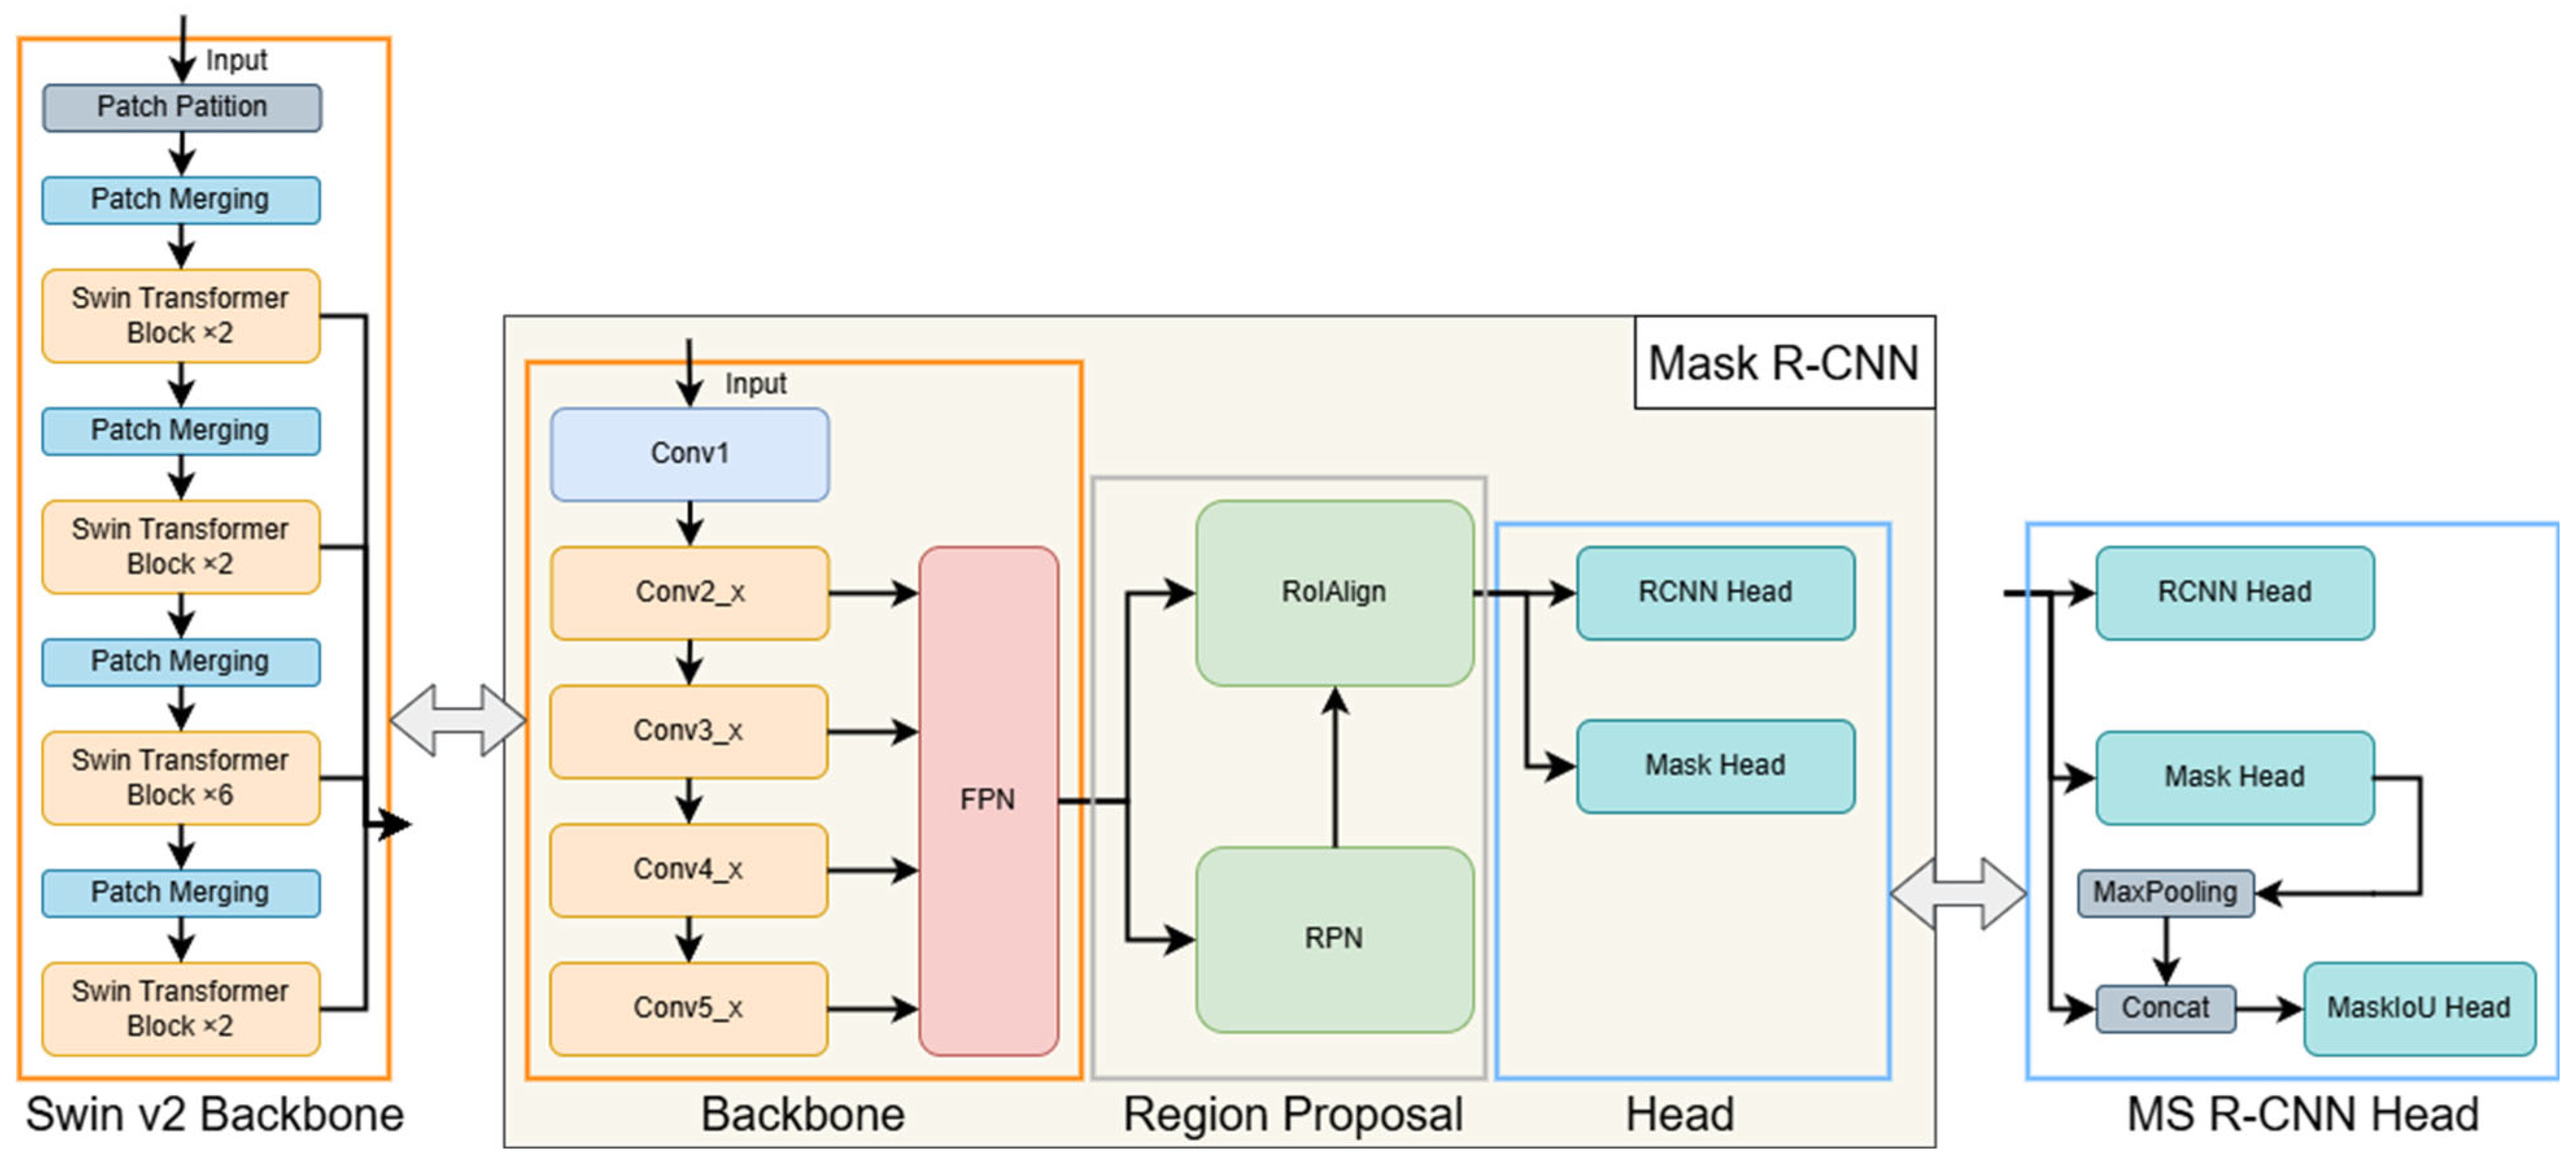
In this section, we introduce the instance segmentation models used in our experiments. We refer to the task of predicting object positions in an image through classes and bounding boxes as “detection” and the task of predicting pixel-level regions occupied by objects using masks, in addition to detection, as “instance segmentation”. We selected Mask R-CNN and YOLO as comparative models. Mask R-CNN is popular in agricultural applications requiring segmentation due to its robustness for small fruits and densely clustered fruits, while YOLO series models are also widely used for their high detection accuracy and faster inference speed [17]. In addition, we evaluated a transformer-enhanced version of Mask R-CNN (Mask R-CNN-SW), and mask dcoring R-CNN, another Mask R-CNN variant.

3.2.1. Mask R-CNN

As shown in Figure 3, Mask R-CNN [4] comprises three components: a backbone layer, region proposal layer, and head layer. The backbone layer extracts feature maps from the images. The original model used was ResNet [18]. The region proposal layer extracts areas suspected of containing objects, called Regions of Interest (RoIs), from feature maps and resizes them to a fixed size. The head layer takes the RoI portion of the feature maps as the input and outputs the classification class, bounding box, and mask for objects within that region. As it includes a step to estimate the RoIs during object detection, it is called a two-stage segmentation model. Because of this structure, it is considered particularly effective for detailed segmentation. Mask R-CNN outputs the class probability, bounding box, and mask for each instance. The class probability output from the head layer is directly used as the confidence score.

3.2.2. Mask Scoring R-CNN

Mask R-CNN uses class probability directly as its confidence score, which provides no inherent correlation with the segmentation quality. To address this limitation, Huang et al. [19] proposed mask scoring R-CNN (MS R-CNN); it adds a Mask IoU Head to predict the IoU between the predicted and ground truth (GT) masks and corrects the confidence score with the predicted IoU. They reported that this improvement increased AP. In this study, we considered MS R-CNN as an improved variation of Mask R-CNN and compared it with other models.

3.2.3. Mask R-CNN with Swin Transformer v2

Cong et al. [16] demonstrated improved paprika detection by replacing the backbone of the Mask R-CNN with Swin Transformer [20]. This transformer, a deep-learning model originating from natural language processing, enables attention between distant contexts by incorporating an attention mechanism. While the CNN convolutional layers extract local features, the attention mechanism can extract global features by focusing on distant positions. This study compared the standard Mask R-CNN with ResNet101 as backbone against a version with Swin Transformer v2 [21] as backbone, an improved transformer variant. We denote this model as Mask R-CNN-SW, which uses the class probability directly as its confidence score.

3.2.4. YOLO11

Mask R-CNN has the disadvantage of a slow inference speed owing to its two-stage design. YOLO [22] achieved faster inference through its single-stage architecture by predicting instances directly from feature maps without a region proposal layer. This advantage makes it popular in agricultural applications, which require real-time performance. As shown in Figure 4, YOLO replaces the region proposal layer with a neck layer to extract features at various scales. Since its introduction, multiple YOLO versions have emerged from different developers, each with a unique methodology. This study employed YOLO11 [23], the latest version that offers segmentation capabilities. YOLO11 uses class probability as its confidence score but differs from Mask R-CNN as it corrects GT values with the bounding box IoU during training. For more details of the model, refer to [24].

3.3. Evaluation Metrics

In this section, we present the instance segmentation evaluation metrics used in the experiments. Both IoU and AJI assess the prediction–GT mask overlap, but IoU is an instance-based evaluation, whereas AJI is an image-based evaluation. We compared the performance evaluations using the AP and AJI metrics. These metrics require annotation data; they cannot be calculated during the inference stage, and the quality of predictions is commonly judged using confidence scores. Therefore, metrics are required to evaluate the reliability of the confidence scores. In this study, we used the R-value between the confidence scores and IoU to assess reliability.

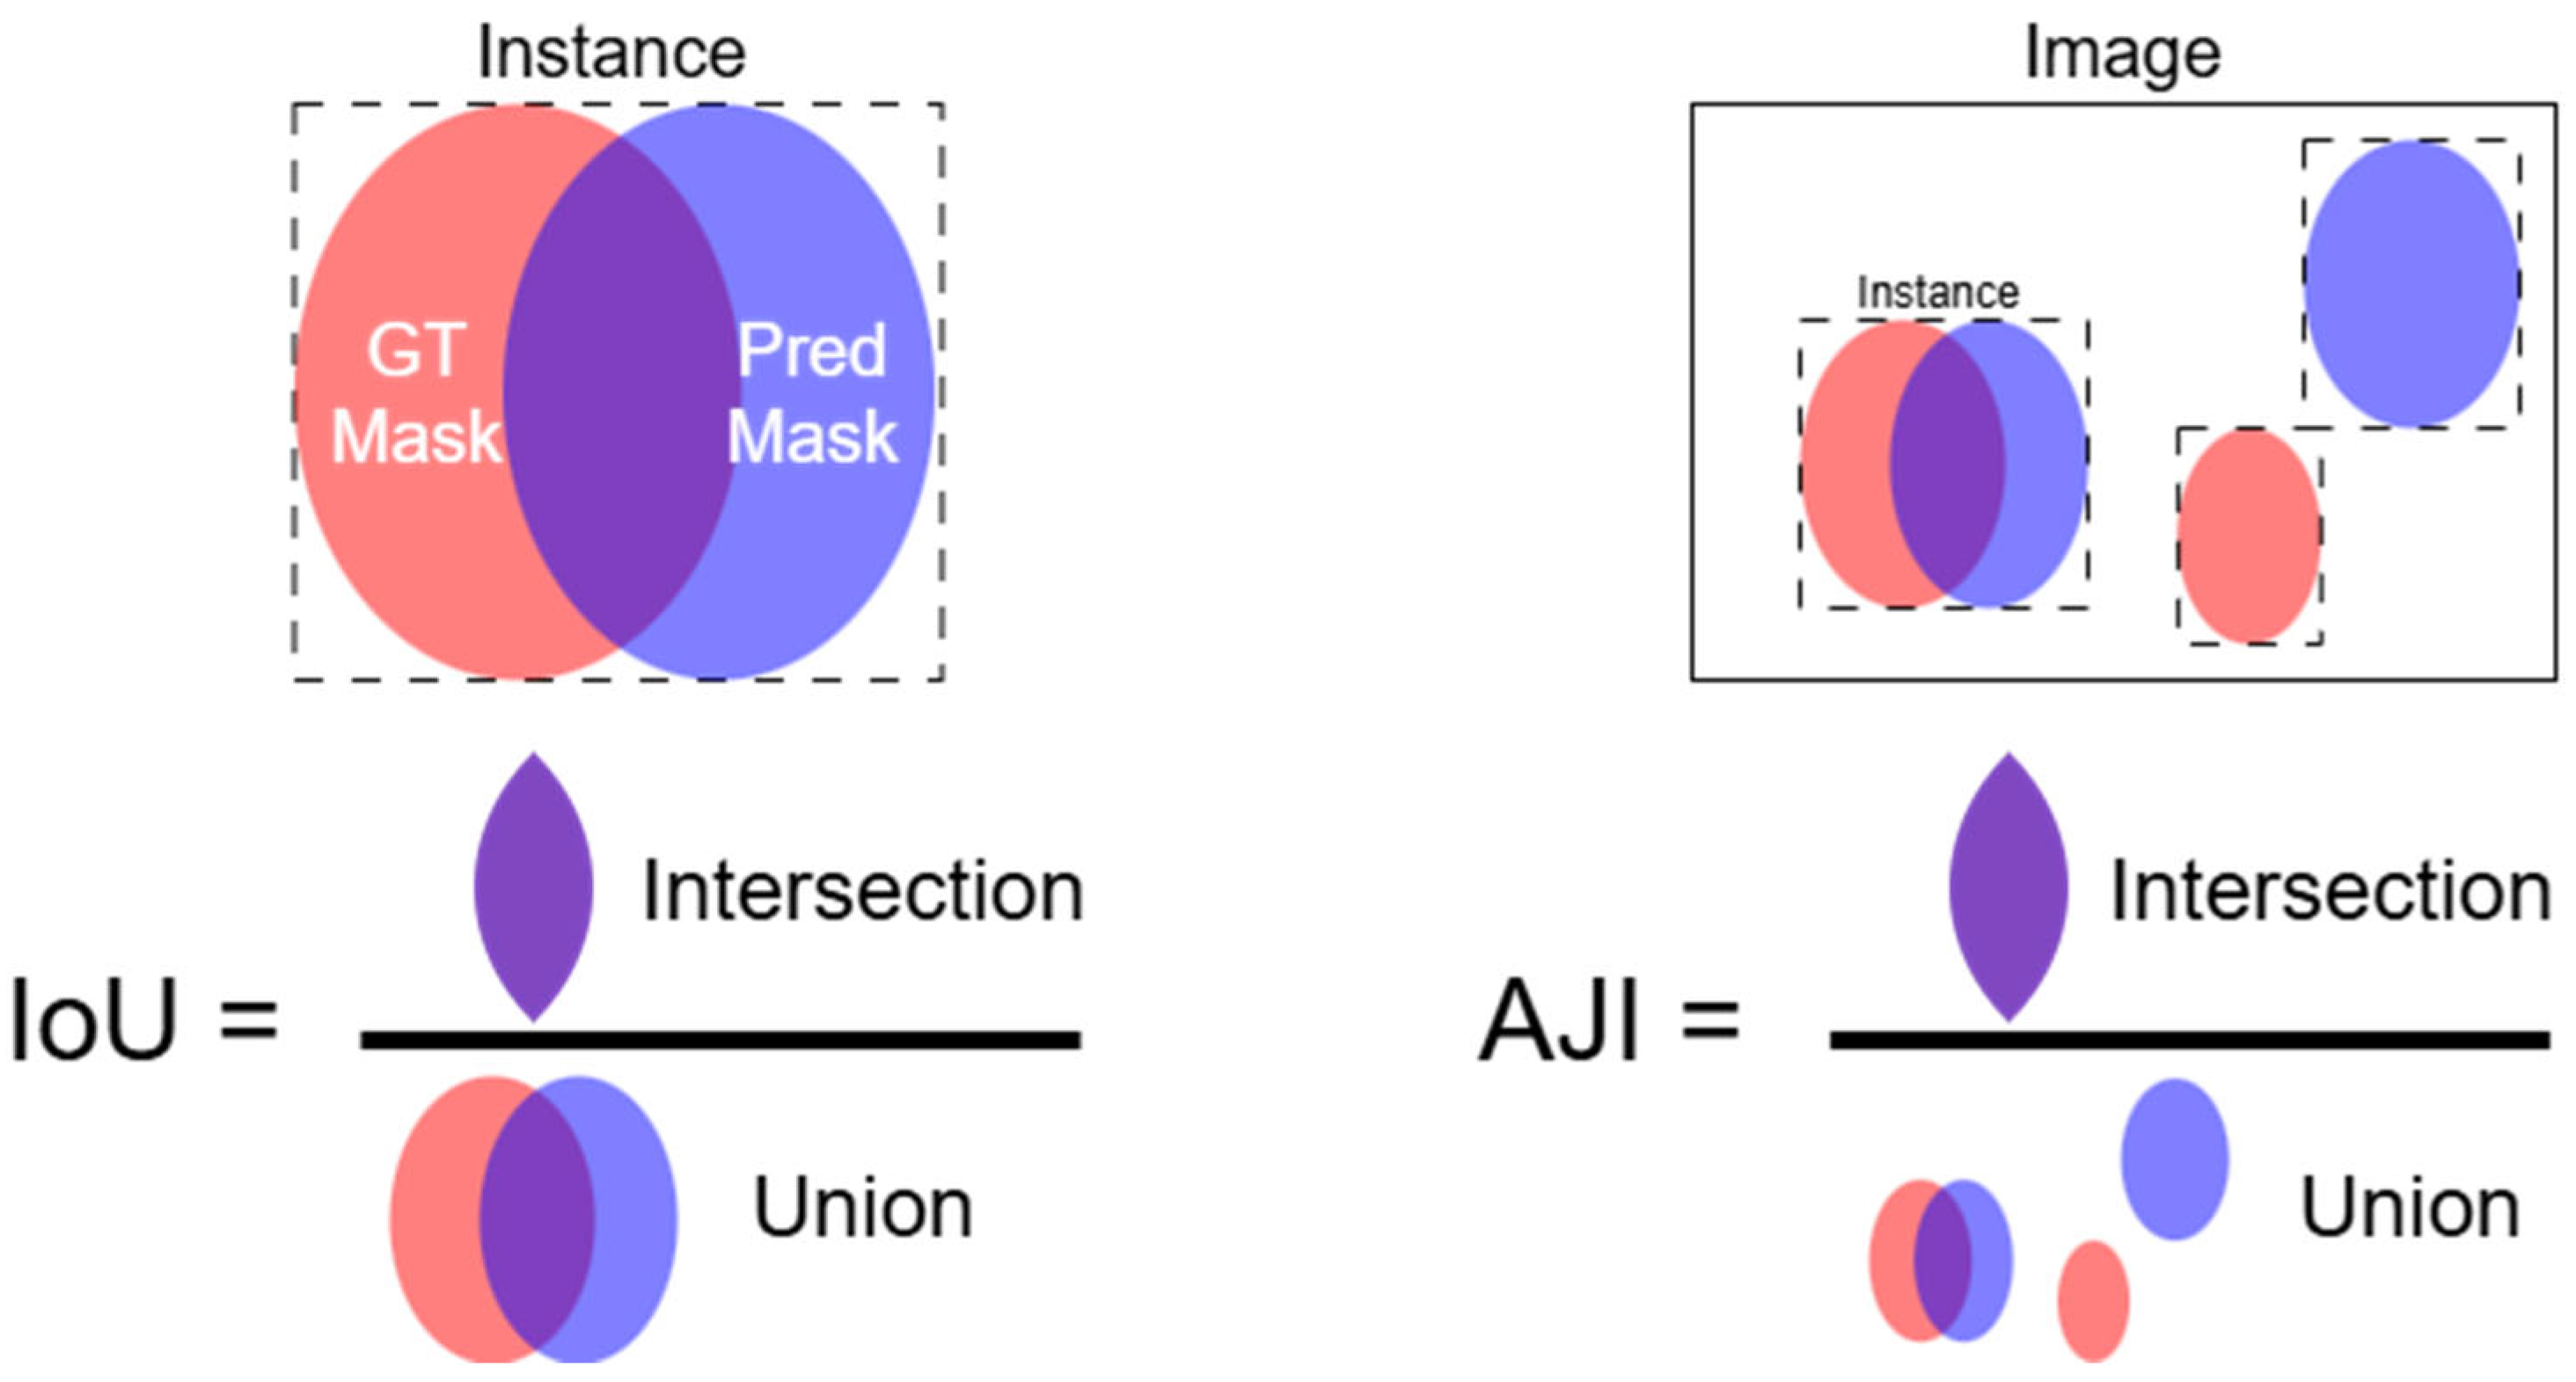
3.3.1. Intersection over Union

IoU measures the ratio of the intersection area to the union area between the predicted mask and GT mask for a given instance. Because it is calculated for each instance during instance segmentation, where there are multiple predicted instances and GT instances in an image, calculations such as the AJI described below are necessary. Figure 5 shows the difference between IoU and the AJI.

3.3.2. Aggregated Jaccard Index

AJI [25] extended the IoU for instance segmentation and provided a more detailed evaluation of the segmentation quality. It accumulates the intersection and union areas at the object level computed between each GT mask and its best-matching predicted mask (the best IoU). The AJI also adds areas of unmatched predicted masks to the union area as a false-positive penalty.
While AP evaluates predictions based on whether the IoU exceeds a threshold, improvements that do not cross this threshold remain unrecognized. However, the AJI captures incremental changes in the IoU for each instance, making it better suited for assessing the segmentation quality. Similar approaches were reported in the strawberry fruit instance segmentation research [26], which used I2oU, a metric comparable to the AJI. This study employed an established AJI metric.

3.3.3. Average Precision

AP has become the standard object detection metric since its adoption in the Pascal VOC Challenge [27]. AP operates by setting the confidence score and IoU thresholds, and by treating the model outputs above the confidence threshold as predictions. The outputs were classified as true positives (TP) when their IoU with GT masks exceeded the IoU threshold, false positives (FP) when they did not match any GT, and false negatives (FN) for missed GT instances. Based on these classifications, the system calculates precision and recall at various confidence thresholds. Because the confidence scores and actual segmentation quality often do not correlate perfectly, P-R plots typically exhibit zigzag patterns [8]. The AP calculation involves smoothing these patterns, which masks the true relationship between the confidence scores and segmentation quality. AP represents the average precision across varying confidence score thresholds, capturing the overall detection performance through this smoothed approximation of the P-R curve.
AP has several variants that address different evaluation requirements. Box AP uses the IoU of bounding boxes, focusing on the localization accuracy, whereas mask AP calculates the IoU of pixel-level masks to evaluate the segmentation quality. Since its adoption in MS-COCO, mask AP has become the de facto standard for evaluating instance segmentation [5]. Other variants include AP@50, which evaluates the performance at a 50% IoU threshold, and AP@50-95, which averages the performance across IoU thresholds from 50% to 95%, providing a more comprehensive assessment of the detection quality.

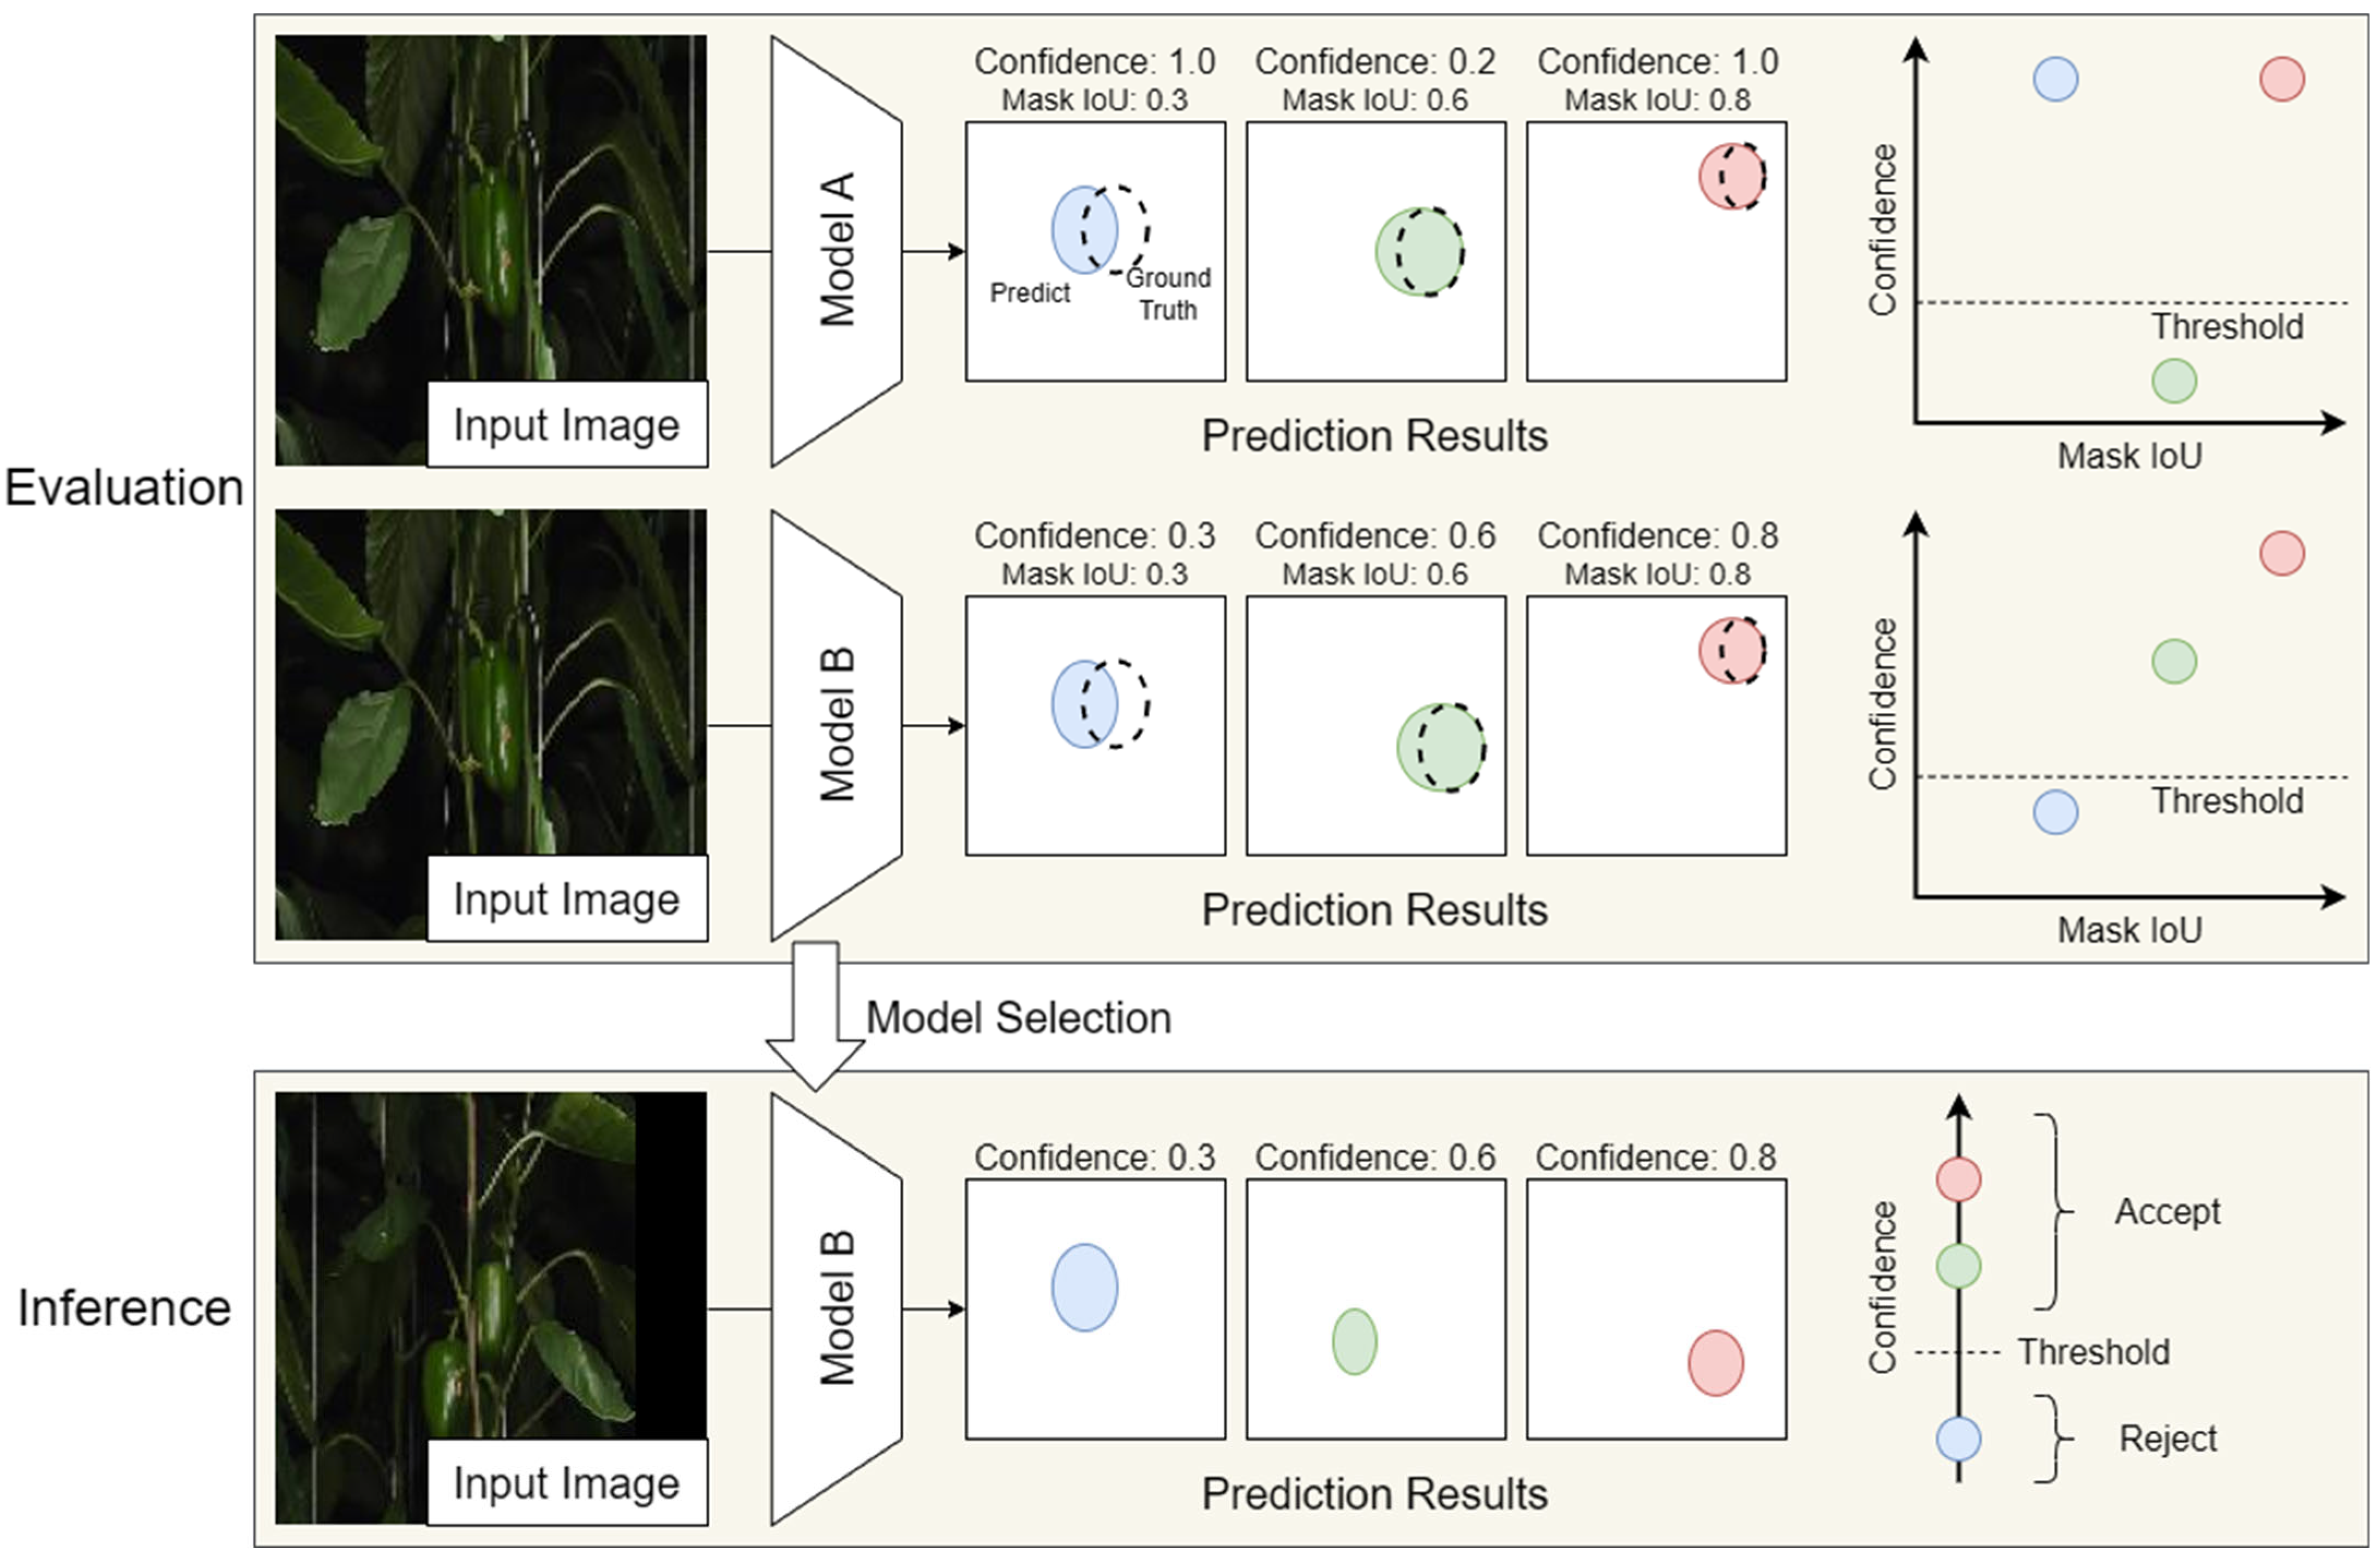
3.3.4. Segmentation Reliability Diagram and Its Coefficient of Determination

We visualized each predicted instance as a data point in a scatter diagram that relates the confidence scores to the IoU values between the predicted masks and their most overlapping correct counterparts. This visualization extends the concept of reliability diagrams used in classification problems [28], where the predicted probabilities are plotted against the actual frequencies. We term this visualization a “segmentation reliability diagram”. Just as a 10% rain forecast should ideally correspond to a 10% actual rainfall frequency, instance segmentation benefits from a strong correlation between the confidence scores and IoU values.
To quantify this correlation, we used R and evaluated the confidence score reliability. Figure 6 illustrates our segmentation reliability diagram during the evaluation and demonstrates threshold processing during inference. During inference, annotation data are unavailable for IoU calculations, making confidence scores the sole determinant of the prediction quality. Consequently, models with unreliable confidence scores cannot effectively filter poorly segmented fruits during threshold-based selection.
To establish the theoretical foundation for using R in reliability assessment, we derive the variance of a confidence score threshold. Assuming a linear relationship between confidence score x and IoU y, we obtain
y = β 0 + β 1 x + ϵ ,
where β 0 is the true intercept, β 1 is the true slope, and ϵ is an error term with zero mean and standard deviation σ ϵ . Using ordinary least squares estimation, we obtain the regression equation
y ^ = β ^ 0 + β ^ 1 x ,
where β ^ 0 and β ^ 1 are the intercept and slope estimated by the least squares method, respectively. For an IoU threshold y t h , the corresponding confidence threshold x t h is defined as
x t h = y t h β ^ 0 β ^ 1 .
Since x t h is a function of random variables β ^ 0 , β ^ 1 , applying error propagation theory, the variance of this confidence threshold is
σ x t h 2 = σ ϵ 2 n β ^ 1 2 ( 1 + ( x t h x ¯ ) 2 σ x 2 ) ,
where x ¯ is the mean of x. Using established relationships from ordinary least squares estimation, we obtain
σ ϵ 2 = σ y 2 ( 1 R 2 ) ,
β ^ 1 2 = σ y 2 σ x 2 R 2 .
From Equations (4)–(6), we derive
σ x t h 2 = 1 n ( 1 R 2 1 ) ( σ x 2 + ( x t h x ¯ ) 2 ) .
This equation demonstrates that higher R reduces threshold variance, providing more reliable confidence-based filtering.

3.4. Experimental Design

We evaluated the instance segmentation models detailed in Section 3.2 using the metrics outlined in Section 3.3: box AP@50, box AP@50-95, mask AP@50, mask AP@50-95, and AJI. We compared the mask AP and AJI values for each model, demonstrating that mask AP does not reflect the segmentation quality based on the difference from AJI, which is a segmentation quality metric. Further, we assessed the effect of architectural improvements on each metric; Mask R-CNN was compared with Mask R-CNN-SW to measure the impact of Swin Transformer v2, and Mask R-CNN was compared with MS R-CNN to evaluate the effects of mask scoring on detection and segmentation. For AJI calculations, we used the maximum value obtained across confidence thresholds ranging from 0.05 to 0.99 in 0.01 increments.
Additionally, to compare with previous studies, we evaluated each model’s F1-score, which is the harmonic mean of precision and recall. The IoU threshold was fixed at 0.5, and the confidence score threshold was varied from 0.05 to 0.99 in 0.01 increments to calculate the maximum F1-score, following the same procedure used for AJI.
We examined the correlation between the confidence scores and mask IoU by plotting segmentation reliability diagrams. To quantitatively evaluate the confidence score reliability and compare the models, we calculated R between these two metrics. The p-value was calculated for a test of no correlation, with a significance level of 5%.
The hardware used for training consisted of an Intel i9-12900 processor, 64 GB RAM, and a GeForce RTX 4070 Ti (NVIDIA, Santa Clara, CA, USA). We used Windows 11 Pro with NVIDIA driver 560.94, CUDA 12.6, Python 3.10.15, PyTorch 2.5.0+cu118, and Torchvision 0.20.0+cu118, which were managed through an Anaconda virtual environment. The correlation coefficient R was calculated using scipy 1.14.1.
Instance segmentation was performed using a binary classification approach to distinguish paprika fruits from other objects. For Mask R-CNN and MS R-CNN implementations, we used Torchvision with pretrained Resnet101_fpn backbone weights. The Swin Transformer v2 implementation used size “t” weights from Torchvision. For YOLO11, we employed the Ultralytics [23] implementation with size “m” and enabled the retina_masks option during prediction. All models were trained for 200 epochs, and the parameters at the point with the highest mask, AP@50-95, were saved and used in the experiments.
Furthermore, to reveal the computational resources required for inference, we calculated the Multiply–Accumulation Operations (MACs) and the number of trainable parameters for each model.

4. Results

4.1. Comparison of AP, F1-Score and AJI for Models

Table 1 lists the model performance metrics for the test dataset. For mask AP@50-95, which is the de facto standard metric for instance segmentation, YOLO11 achieved the highest value (42.90%), followed by Mask R-CNN-SW (36.21%), Mask R-CNN (34.36%), and MS-R-CNN (32.57%). YOLO11 demonstrated the highest performance across all AP-based metrics. Additionally, YOLO11 achieved the highest F1-score (82.28%). However, for the AJI metric, MS R-CNN achieved the highest value (63.57%), followed by Mask R-CNN (63.33%), YOLO11 (63.05%), and Mask R-CNN-SW (59.60%).

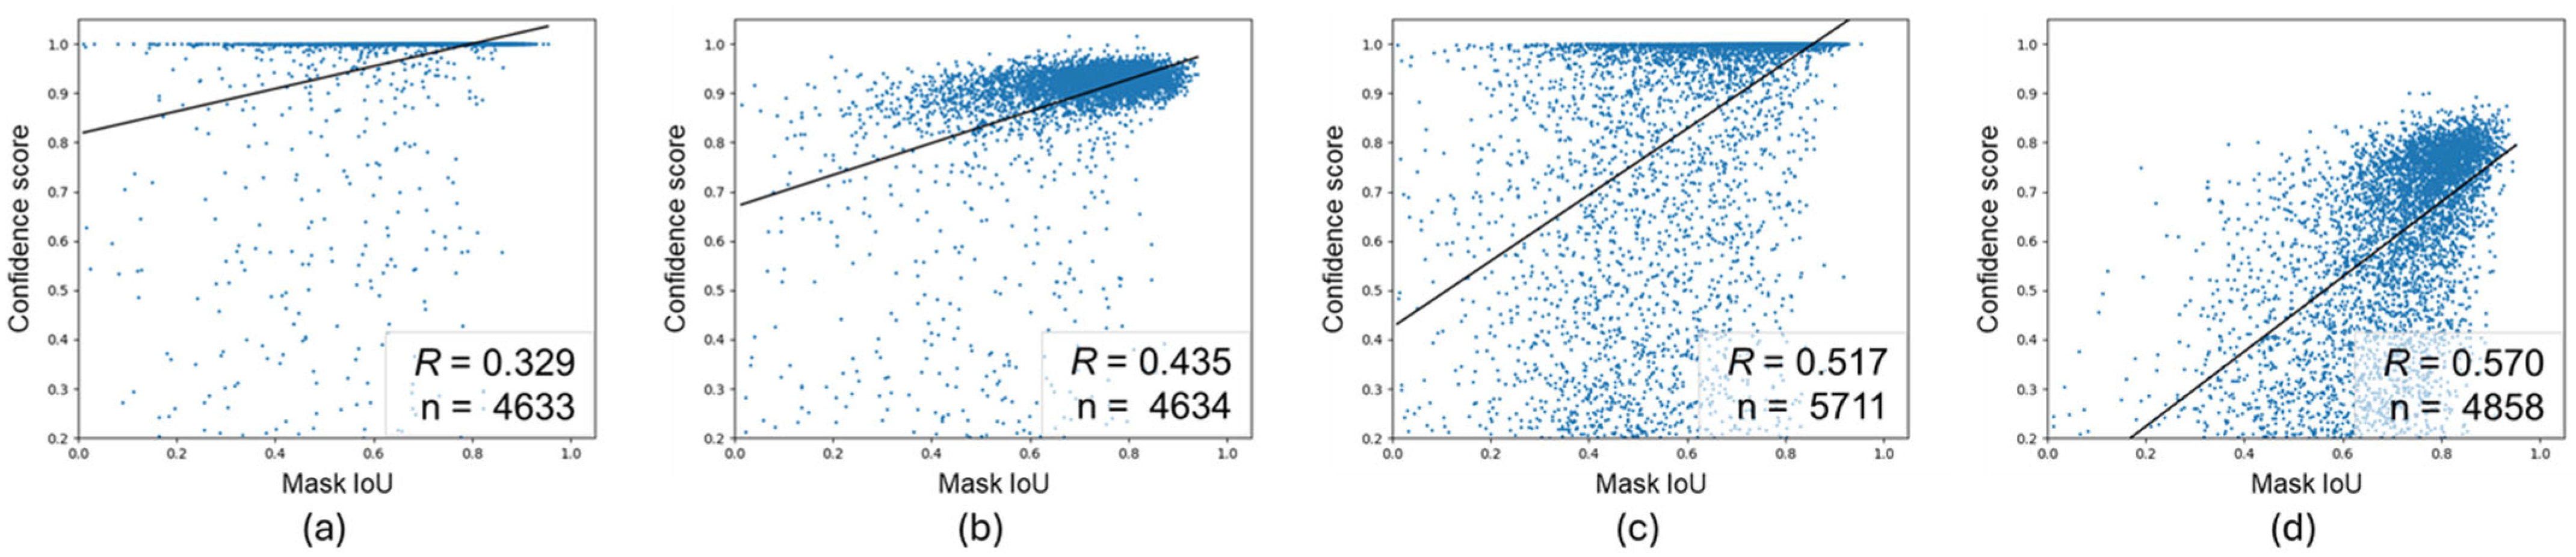
4.2. Correlation Between Confidence Scores and Mask IoU

Figure 7 shows the segmentation reliability diagrams with the corresponding R, p-value, and number of predicted instances (n) for each model. As shown in Figure 7a, Mask R-CNN outputs a confidence score of 1.0 for most predictions, resulting in a low R of 0.381. Figure 7b shows that MS R-CNN exhibits a modest correlation between the confidence scores and mask IoU (R = 0.435). As shown in Figure 7c, Mask R-CNN-SW improves the correlation (R = 0.517) by producing a wider range of confidence scores. As shown in Figure 7d, YOLO11 achieves the highest correlation (R = 0.570) among all tested models. All models show p-values < 0.05, and the null hypothesis of no correlation was rejected at a 5% significance level.
Figure 8 presents samples of actual segmentation results. In the upper row, unoccluded fruits show consistently high performance across all models (IoU > 0.75; confidence score > 0.85). In contrast, the bottom row in Figure 8 shows fruits occluded by lower leaves. Notably, the confidence score of each model responded differently; in Figure 8b, Mask R-CNN drastically reduced its confidence score to 0.14; MS R-CNN (Figure 8c) and Mask R-CNN-SW (Figure 8d) maintained high confidence scores similar to the upper row despite lower quality; and YOLO11 reflected the IoU decrease by lowering its confidence score to 0.53 (Figure 8e).
Figure 9 shows examples of detection failures for Mask R-CNN and YOLO11. In Figure 9b, the detection result for a fruit in the center of the image is shown when Mask R-CNN was applied to the input in Figure 9a. Because the target fruit is small and partially obscured by lower leaves, the IoU is below 0.5, yet the confidence score is 1, resulting in a false positive error. Figure 9d presents the detection result when YOLO11 was applied to the input in Figure 9c. Despite having an IoU of 0.77, which exceeds the IoU threshold of 0.5, the low confidence score of 0.13 results in a false negative error.

4.3. Comparison of Computational Resources Among Models

Table 2 shows the MACs and number of trainable parameters for each model. YOLO11 has the lowest values for both MACs and number of parameters, making it a lightweight model suitable for deployment on edge devices.

5. Discussion

5.1. Analysis of Each Metric

Owing to the lack of correlation between mask AP and the AJI (which represents segmentation quality) across all models, it is evident that mask AP fails to reflect the segmentation quality. MS R-CNN clearly demonstrates this discrepancy—it scored the lowest in Mask AP@50-95, but achieved the highest AJI value. AP classifies objects as true positives, false positives, or false negatives using specific IoU thresholds, which prevent them from considering a segmentation quality that exceeds these thresholds [6]. However, the AJI calculates scores based on areas without object distinction, causing smaller objects to have reduced influence on the final score.
The R-values in segmentation reliability diagrams appear to be consistent with the subjective correlations across all models. Furthermore, as the p-values in all models fell below the 5% significance level, the existence of a correlation between the confidence scores and IoU was confirmed. A high R-value can serve as an indicator of confidence score reliability, suggesting that confidence scores can be used as a proxy for IoU during inference tasks. Because AP cannot account for this correlation, it cannot evaluate the confidence score reliability during inference tasks.

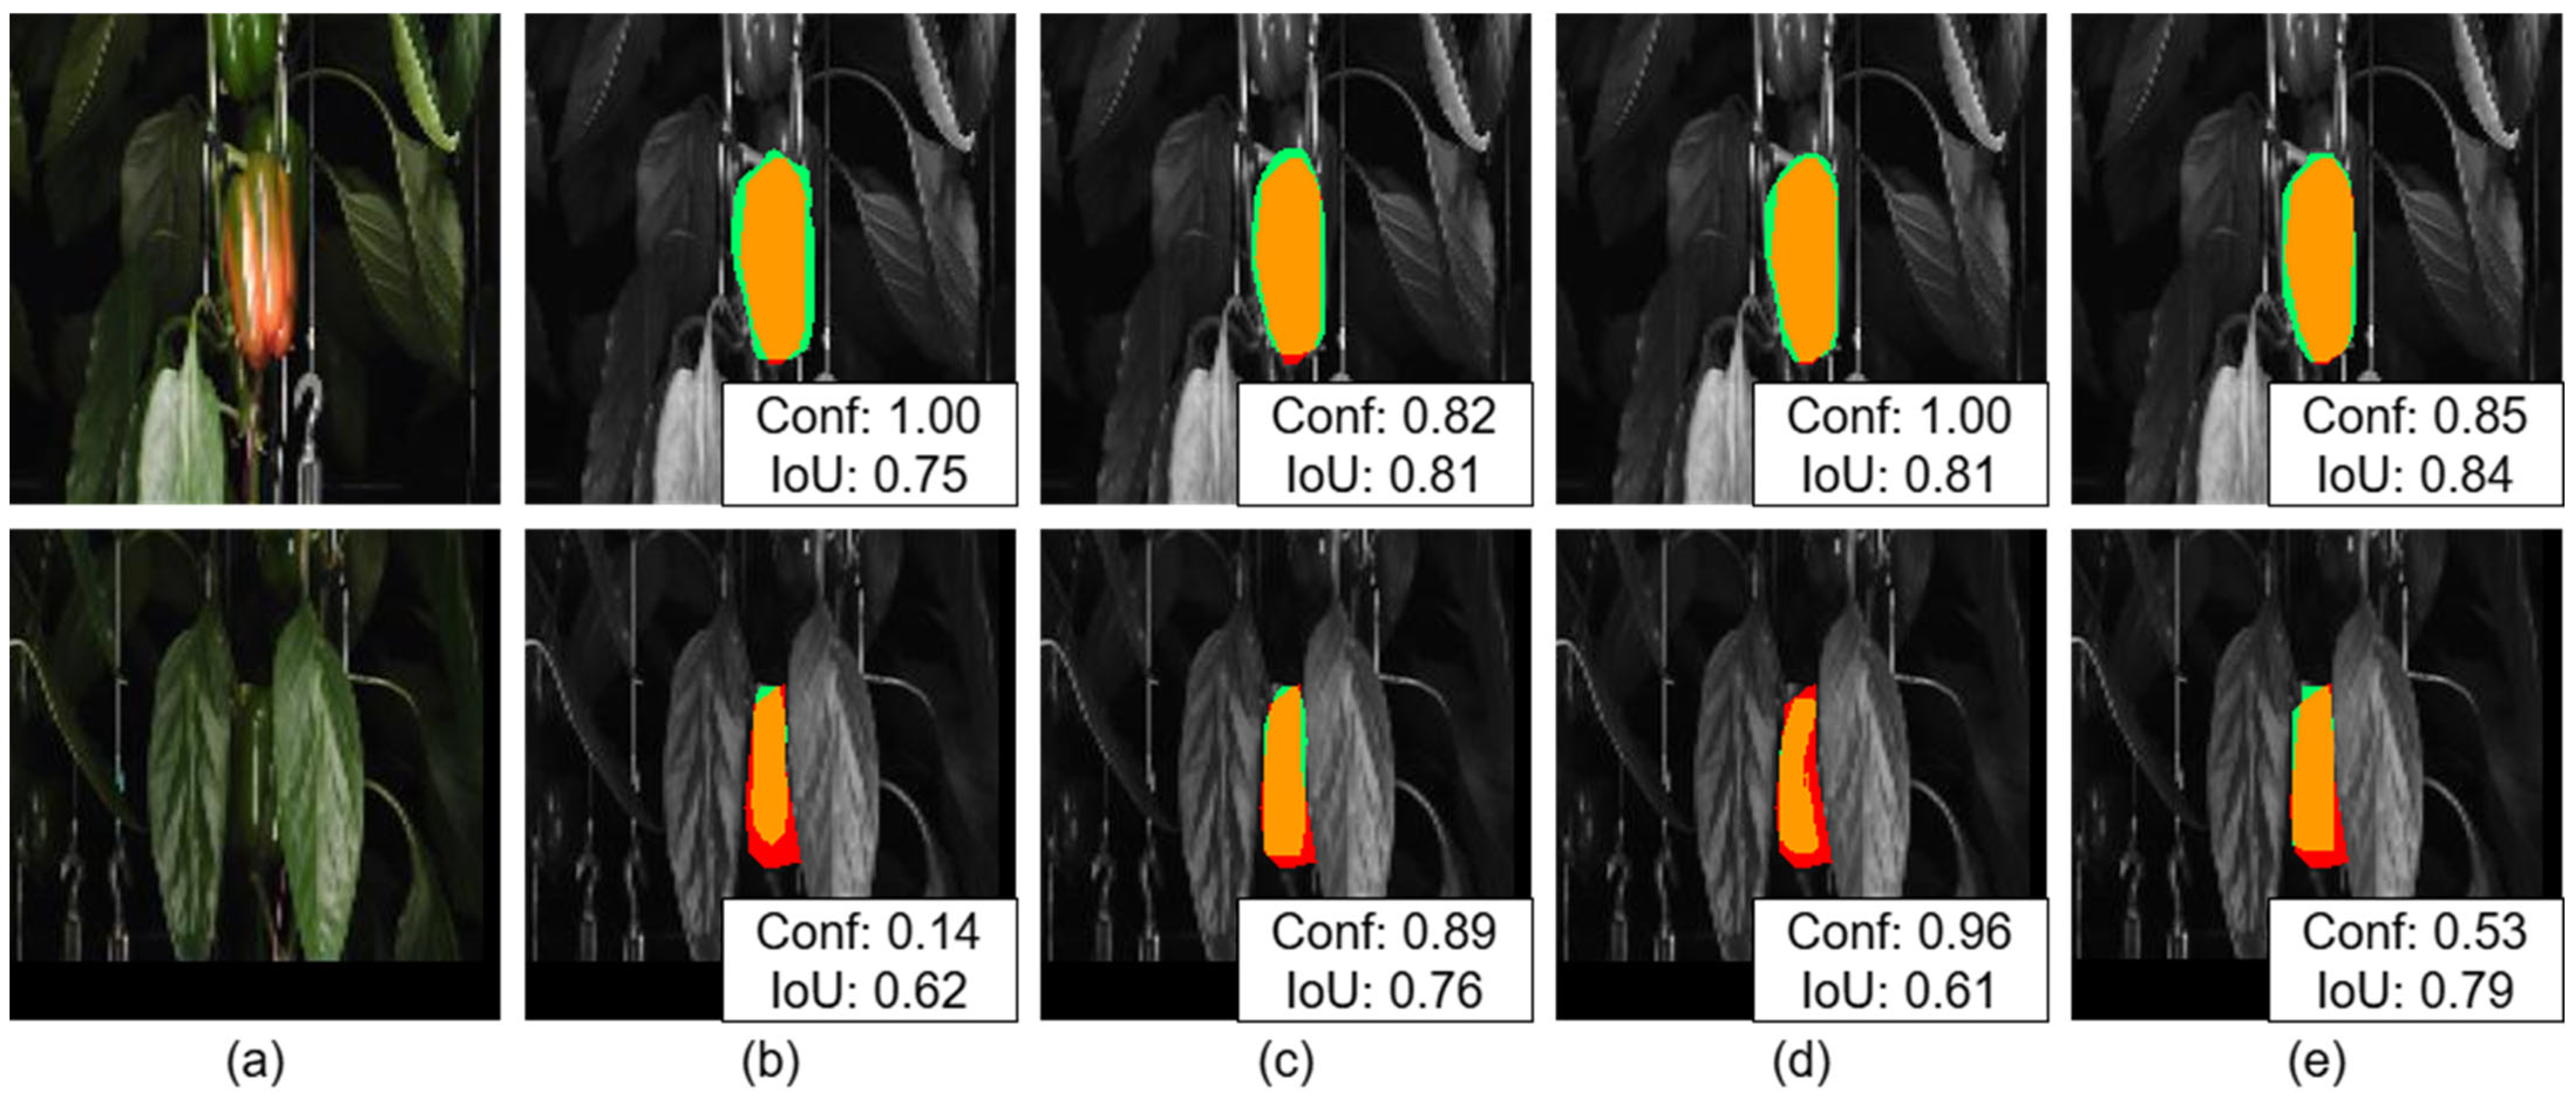
5.2. Interpretation of Results for Each Model

The different metrics reveal the distinct characteristics of each model. YOLO11 achieved higher AP-based metrics and F1-score than the other models but scored lower in AJI than Mask R-CNN and MS R-CNN, suggesting that YOLO11 has slightly lower segmentation quality. YOLO11 also demonstrated the highest R in the segmentation reliability diagrams, indicating a superior ability to adjust the P-R balance. As shown in Figure 8e, YOLO11 successfully reflects the degree of fruit occlusion based on its confidence scores, indicating that occluded fruits can be detected by setting a normal confidence score threshold (approximately 0.2) or rejecting them using a higher confidence score threshold.
In Table 1, the MS R-CNN shows a decreased mask AP compared to Mask R-CNN, contradicting the claim in [19] that mask scoring enhances detection quality. The mask scoring technique multiplies the class probability by the predicted mask IoU (0–1), resulting in lower confidence scores than Mask R-CNN. These lower confidence scores likely reduce recall and, consequently, decrease AP. The study on MS R-CNN [19] reported an R-value of approximately 0.74 between the predicted mask IoU and GT, which is higher than that in this study. This suggests that segmenting paprika is more challenging than segmenting common dataset objects. Therefore, it is necessary to develop models and evaluation metrics suitable for such complex environments.
A comparison of the Mask R-CNN and Mask R-CNN-SW results revealed the effects of replacing ResNet101 with the Swin Transformer v2. The decrease in AJI can be attributed to the overly global feature extraction using Swin Transformer v2, which ignores local features at paprika contours. In addition, Cong et al. [16] found that the Swin Transformer enhanced the detection quality without improving the segmentation quality. Figure 7c shows that Mask R-CNN-SW generates many low-confidence predictions. Therefore, the AP improvement can be attributed to the ability of Swin Transformer to extract various features, which reduced missed fruit detection.
From a computational resource perspective, Table 2 indicates that YOLO11 has a significant advantage compared to other models. This is important for tasks such as automated harvesting that require implementation on edge devices and real-time prediction.
Our analysis indicated that, despite the slightly superior segmentation quality of MS R-CNN, YOLO11 demonstrated the best overall performance, with the highest AP and R-values. We compare our YOLO11 performance with the most recent previous research. Escamilla et al. [14] conducted sweet pepper detection under experimental conditions similar to our study by capturing images from a fixed distance from cultivation rows. However, their approach differs from ours in that they performed imaging during daylight hours, classified peppers into four maturity levels, and used YOLOv5 for detection. In their study, Escamilla et al. reported an AP@50 of 0.803 across all classes, with their highest performance in the mature class (0.831), and an F1-score of 0.77 across all classes. Although a direct comparison is challenging due to our binary classification approach, YOLO11 in our study achieved a Box AP@50 of 87.16% and an F1-score of 82.28% as shown in Table 1, both exceeding the values reported in the previous research. Two factors contributed to our performance improvement. First, we conducted nighttime imaging under stable illumination conditions, unlike Escamilla et al.’s daytime imaging with variable lighting. Second, we adopted the latest YOLO11 model, which offers advantages over the YOLOv5 used in their study.

5.3. Selection of Metrics Based on Application Context

Model suitability varies based on inference tasks, target crops, and imaging environments. In automated harvesting, fruit segmentation quality influences fruit pose estimation accuracy, which guides the robotic arm grasping pose estimation, ultimately determining harvesting success rates [9]. In contrast, fruit counting tasks [14] benefit from models with high AP, which can detect small or partially occluded fruits, rather than relying on the AJI, which inherently underestimates small objects.
Paprika greenhouse environments present unique occlusion challenges for fruit instance segmentation models. Paprika plants are grown without removing the lower leaves, which frequently obscures fruits, creating persistent segmentation challenges. Several factors contribute to occlusion complexity. For instance, fruit position significantly affects detection difficulty, with smaller fruits on the upper branches being more concealed than larger fruits at the harvest level. Another challenge arises from differences in plant varieties, as varieties with different internode lengths create various occlusion patterns. These challenges persist despite ongoing model improvements and imaging optimization.
In these complex occlusion scenarios, the confidence score reliability is critical for effective fruit detection. Models with reliable confidence scores offer significant advantages through flexible post-processing options. These models enable operators to adjust detection counts by modifying confidence thresholds based on changing environmental conditions. As examples of detection with flexible thresholds, researchers have studied methods that vary confidence score thresholds based on detection positions in the image [29] or adjust confidence thresholds according to the statistical properties of input images [30]. Potential future applications could include lowering thresholds in upper image regions where immature fruits might predominate to prevent missed detections, or dynamically adjusting thresholds during seasons with abundant immature fruits. While not yet fully implemented, these theoretical approaches may enhance detection adaptability to varying conditions. Such an adjustment capability prevents false detections while maintaining sensitivity to difficult-to-detect fruits, effectively balancing precision and recall according to specific circumstances in complex paprika cultivation environments.
Identifying effective evaluation metrics for selecting instance segmentation models suitable for specific inference tasks and environments remains an important research challenge. Our study utilized a dataset from stable conditions in a large commercial paprika greenhouse. Future research must address how changes in imaging environments and diverse crop characteristics affect model performance and metric selection.

5.4. Limitations

This study has three main limitations. First, our dataset consists of a single paprika variety photographed during winter nights under controlled lighting. While this approach enabled reliable experiments and clear evaluation of metrics and model characteristics, it limits our ability to assess model performance with other crops, different paprika varieties (such as yellow or elongated types), or under varying environmental conditions (like daylight or different seasons). Second, our research primarily focuses on evaluating segmentation quality and reliability metrics, but does not extend to developing or improving models specifically optimized for complex environments. While we have established robust evaluation methods, we have not investigated model architectures or training strategies that could better handle challenging scenarios such as occlusions, overlapping fruits, or varying lighting conditions commonly found in real greenhouse environments. Third, our research focused on offline analysis of data collected from monitoring devices and processed on servers, rather than real-time detection on edge devices.

6. Conclusions

This study compared the existing paprika fruit instance segmentation models using data from a commercial large-scale greenhouse, focusing on the detection quality, segmentation quality, and confidence score reliability. YOLO11 demonstrated advantages through its superior detection quality and confidence score reliability metrics. However, for inference tasks that prioritize the segmentation quality, such as automated harvesting, MS R-CNN may be more beneficial. Instance segmentation presents challenges because of the integration of multiple tasks (classification, detection, and segmentation). Our experiments revealed that Mask AP alone cannot assess all aspects, such as segmentation quality and confidence score reliability. Therefore, instead of selecting models based on a single metric, we recommend designing evaluation metrics that align with specific application requirements.
As future work for this paper, we aim to address the limitations outlined in Section 5.4. We will focus on improving segmentation quality in complex environments through advanced architectures for handling occlusions, overlapping fruits, and varying lighting conditions. Specifically, we plan to explore optimal models, threshold settings, and metric designs for other crops such as tomatoes, as well as different paprika varieties, including yellow paprikas and elongated paprikas. We will also investigate the applicability of our proposed method during daytime conditions and seasons other than winter. Additionally, aiming for integration with commercial agricultural platforms, we intend to develop a comprehensive system that includes segmentation on edge devices and encompasses the entire network of multiple monitoring devices and servers.

Author Contributions

Conceptualization, N.O., K.S., and T.F.; methodology, N.O. and K.S.; software, N.O.; resources, K.S. and H.N.; data curation, K.S. and M.K.; validation, M.K. and S.Y.; visualization, M.K. and S.Y.; writing—original draft preparation, N.O.; writing—review and editing, K.S., H.N., M.K., S.Y., and T.F.; project administration, T.F.; funding acquisition, K.S. and T.F. All authors have read and agreed to the published version of the manuscript.

Funding

This research was supported by a grant from a commissioned project study on “the research project for future agricultural production utilizing artificial intelligence” from the Ministry of Agriculture, Forestry, and Fisheries, Japan, and JSPS KAKENHI (grant number: JP22K14974).

Data Availability Statement

Data are contained within the article.

Acknowledgments

The authors thank the editor and anonymous reviewers for providing helpful suggestions for improving the quality of this manuscript.

Conflicts of Interest

The authors declare no conflicts of interest.

References

  1. Afonso, M.; Fonteijn, H.; Fiorentin, F.; Lensink, D.; Mooij, M.; Faber, N.; Polder, G.; Wehrens, R. Tomato Fruit Detection and Counting in Greenhouses Using Deep Learning. Front. Plant Sci. 2020, 11, 571299. [Google Scholar] [CrossRef] [PubMed]
  2. Naito, H.; Shimomoto, K.; Fukatsu, T.; Hosoi, F.; Ota, T. Interoperability Analysis of Tomato Fruit Detection Models for Images Taken at Different Facilities, Cultivation Methods, and Times of the Day. AgriEngineering 2024, 6, 1827–1846. [Google Scholar] [CrossRef]
  3. Shimomoto, K.; Shimazu, M.; Matsuo, T.; Kato, S.; Naito, H.; Fukatsu, T. Development of Double-Camera AI System for Efficient Monitoring of Paprika Fruits; International Society for Horticultural Science (ISHS): Leuven, Belgium, 2025; pp. 355–360. [Google Scholar] [CrossRef]
  4. He, K.; Gkioxari, G.; Dollár, P.; Girshick, R. Mask R-CNN. IEEE Trans. Pattern Anal. Mach. Intell. 2020, 42, 386–397. [Google Scholar] [CrossRef] [PubMed]
  5. Lin, T.-Y.; Maire, M.; Belongie, S.; Hays, J.; Perona, P.; Ramanan, D.; Dollár, P.; Zitnick, C.L. Microsoft coco: Common objects in context. In Proceedings of the Computer Vision—ECCV 2014: 13th European Conference, Zurich, Switzerland, 6–12 September 2014; Springer: Berlin/Heidelberg, Germany, 2014; pp. 740–755. [Google Scholar] [CrossRef]
  6. Chen, L.; Wu, Y.; Stegmaier, J.; Merhof, D.; Sorted, A.P. Rethinking evaluation metrics for instance segmentation. In Proceedings of the IEEE/CVF International Conference on Computer Vision, Paris, France, 2–6 October 2023; pp. 3923–3929. [Google Scholar] [CrossRef]
  7. Gauvain, J.; Lamel, L. Large-vocabulary continuous speech recognition: Advances and applications. Proc. IEEE 2000, 88, 1181–1200. [Google Scholar] [CrossRef]
  8. Padilla, R.; Passos, W.; Dias, T.; Netto, S.; da Silva, E. A Comparative Analysis of Object Detection Metrics with a Companion Open-Source Toolkit. Electronics 2021, 10, 279. [Google Scholar] [CrossRef]
  9. Kang, H.; Zhou, H.; Wang, X.; Chen, C. Real-Time Fruit Recognition and Grasping Estimation for Robotic Apple Harvesting. Sensors 2020, 20, 5670. [Google Scholar] [CrossRef] [PubMed]
  10. Hemming, J.; Ruizendaal, J.; Hofstee, J.; van Henten, E. Fruit Detectability Analysis for Different Camera Positions in Sweet-Pepper. Sensors 2014, 14, 6032–6044. [Google Scholar] [CrossRef]
  11. McCool, C.; Sa, I.; Dayoub, F.; Lehnert, C.; Perez, T.; Upcroft, B. Visual detection of occluded crop: For automated harvesting. In Proceedings of the 2016 IEEE International Conference on Robotics and Automation (ICRA), Stockholm, Sweden, 16–21 May 2016; IEEE: Piscataway, NJ, USA, 2016; pp. 2506–2512. [Google Scholar] [CrossRef]
  12. Ji, W.; Gao, X.; Xu, B.; Chen, G.; Zhao, D. Target recognition method of green pepper harvesting robot based on manifold ranking. Comput. Electron. Agric. 2020, 177, 105663. [Google Scholar] [CrossRef]
  13. Ning, Z.; Luo, L.; Ding, X.; Dong, Z.; Yang, B.; Cai, J.; Chen, W.; Lu, Q. Recognition of sweet peppers and planning the robotic picking sequence in high-density orchards. Comput. Electron. Agric. 2022, 196, 106878. [Google Scholar] [CrossRef]
  14. Escamilla, L.; Gómez-Espinosa, A.; Cabello, J.; Cantoral-Ceballos, J. Maturity Recognition and Fruit Counting for Sweet Peppers in Greenhouses Using Deep Learning Neural Networks. Agriculture 2024, 14, 331. [Google Scholar] [CrossRef]
  15. López-Barrios, J.; Cabello, J.; Gómez-Espinosa, A.; Montoya-Cavero, L. Green Sweet Pepper Fruit and Peduncle Detection Using Mask R-CNN in Greenhouses. Appl. Sci. 2023, 13, 6296. [Google Scholar] [CrossRef]
  16. Cong, P.; Li, S.; Zhou, J.; Lv, K.; Feng, H. Research on Instance Segmentation Algorithm of Greenhouse Sweet Pepper Detection Based on Improved Mask RCNN. Agronomy 2023, 13, 196. [Google Scholar] [CrossRef]
  17. Xiao, F.; Wang, H.; Xu, Y.; Zhang, R. Fruit Detection and Recognition Based on Deep Learning for Automatic Harvesting: An Overview and Review. Agronomy 2023, 13, 1625. [Google Scholar] [CrossRef]
  18. He, K.; Zhang, X.; Ren, S.; Sun, J. Deep residual learning for image recognition. In Proceedings of the IEEE Conference on Computer Vision and Pattern Recognition, Las Vegas, NV, USA, 27–30 June 2016; pp. 770–778. [Google Scholar] [CrossRef]
  19. Huang, Z.; Huang, L.; Gong, Y.; Huang, C.; Wang, X. Mask scoring r-cnn. In Proceedings of the IEEE/CVF Conference on Computer Vision and Pattern Recognition, Long Beach, CA, USA, 15–20 June 2019; pp. 6409–6418. [Google Scholar] [CrossRef]
  20. Liu, Z.; Lin, Y.; Cao, Y.; Hu, H.; Wei, Y.; Zhang, Z.; Lin, S.; Guo, B. Swin transformer: Hierarchical vision transformer using shifted windows. In Proceedings of the IEEE/CVF International Conference on Computer Vision, Montreal, QC, Canada, 10–17 October 2021; pp. 10012–10022. [Google Scholar] [CrossRef]
  21. Liu, Z.; Hu, H.; Lin, Y.; Yao, Z.; Xie, Z.; Wei, Y.; Ning, J.; Cao, Y.; Zhang, Z.; Dong, L.; et al. Swin Transformer V2: Scaling Up Capacity and Resolution. In Proceedings of the IEEE/CVF Conference on Computer Vision and Pattern Recognition (CVPR), New Orleans, LA, USA, 18–24 June 2022; pp. 11999–12009. [Google Scholar] [CrossRef]
  22. Redmon, J.; Divvala, S.; Girshick, R.; Farhadi, A. You only look once: Unified, real-time object detection. In Proceedings of the IEEE Conference on Computer Vision and Pattern Recognition, Las Vegas, NV, USA, 27–30 June 2016; pp. 779–788. [Google Scholar] [CrossRef]
  23. Jocher, G.; Qiu, J.; Chaurasia, A. Ultralytics YOLO. 2023. Available online: https://github.com/ultralytics/ultralytics (accessed on 13 March 2025).
  24. Ali, M.; Zhang, Z. The YOLO Framework: A Comprehensive Review of Evolution, Applications, and Benchmarks in Object Detection. Computers 2024, 13, 336. [Google Scholar] [CrossRef]
  25. Kumar, N.; Verma, R.; Sharma, S.; Bhargava, S.; Vahadane, A.; Sethi, A. A Dataset and a Technique for Generalized Nuclear Segmentation for Computational Pathology. IEEE Trans. Med. Imaging 2017, 36, 1550–1560. [Google Scholar] [CrossRef] [PubMed]
  26. Pérez-Borrero, I.; Marín-Santos, D.; Gegúndez-Arias, M.; Cortés-Ancos, E. A fast and accurate deep learning method for strawberry instance segmentation. Comput. Electron. Agric. 2020, 178, 105736. [Google Scholar] [CrossRef]
  27. Everingham, M.; Eslami, S.A.; Van Gool, L.; Williams, C.K.; Winn, J.; Zisserman, A. The pascal visual object classes challenge: A retrospective. Int. J. Comput. Vis. 2015, 111, 98–136. [Google Scholar] [CrossRef]
  28. Degroot, M.H.; Fienberg, S.E. The Comparison and Evaluation of Forecasters. J. R. Stat. Soc. Ser. D Stat. 2018, 32, 12–22. [Google Scholar] [CrossRef]
  29. Wahyono; Wibowo, M.E.; Ashari, A.; Putra, M.P.K. Improvement of Deep Learning-based Human Detection using Dynamic Thresholding for Intelligent Surveillance System. Int. J. Adv. Comput. Sci. Appl. 2021, 12, 1053. [Google Scholar] [CrossRef]
  30. Thatikonda, M.; PK, M.K.; Amsaad, F. A Novel Dynamic Confidence Threshold Estimation AI Algorithm for Enhanced Object Detection. In Proceedings of the NAECON 2024—IEEE National Aerospace and Electronics Conference, Dayton, OH, USA, 15–18 July 2024; pp. 359–363. [Google Scholar] [CrossRef]
Figure 1. Overview of our proposed method.
Horticulturae 11 00525 g001
Figure 2. Overview of the paprika monitoring device (cited from [3]).
Horticulturae 11 00525 g002
Figure 3. Structure of Mask R-CNN and its improved versions: mask scoring R-CNN and Mask R-CNN-SW.
Horticulturae 11 00525 g003
Figure 4. Structure of YOLO11.
Horticulturae 11 00525 g004
Figure 5. Difference between Intersection over Union (IoU) and Aggregated Jaccard Index (AJI).
Horticulturae 11 00525 g005
Figure 6. Relationship between segmentation reliability diagram at evaluation and confidence score filtering during inference. Different colored circles represent predicted fruit results in the image, while dotted circles represent ground truth fruits.
Horticulturae 11 00525 g006
Figure 7. Segmentation reliability diagram and regression line: (a) Mask R-CNN; (b) MS R-CNN; (c) Mask R-CNN-SW; and (d) YOLO11.
Horticulturae 11 00525 g007
Figure 8. Sample of actual segmentation results: (a) input image; (b) Mask R-CNN; (c) MS R-CNN; (d) Mask R-CNN-SW; and (e) YOLO11. The leftmost column shows the two input images, and the four columns on the right show the segmentation results of each model. The red, green, and orange masks represent the GT annotation mask, the predicted mask, and the region where GT annotation and predicted mask overlap, respectively.
Horticulturae 11 00525 g008
Figure 9. Examples of detection failures: (a) input image for Mask R-CNN; (b) Mask R-CNN detection result; (c) input image for YOLO11; and (d) YOLO11 detection result. The red, green, and orange masks represent the GT annotation mask, the predicted mask, and the region where GT annotation and predicted mask overlap, respectively.
Horticulturae 11 00525 g009
Table 1. AP, F1-score and AJI metrics for each model on test data. Bold values indicate maximum values for each metric.
ModelBox AP@50Box AP@50-95Mask AP@50Mask AP@50-95F1-ScoreAJI
Mask R-CNN76.2338.4173.9034.3681.1763.33
MS R-CNN76.0036.7774.0032.5780.7663.57
Mask R-CNN-SW77.1837.8676.3136.2177.4059.60
YOLO1187.1648.2685.8342.9082.2863.05
Table 2. MACs and number of trainable parameters for each model.
ModelMACsParams
Mask R-CNN191.8 G62.6 M
MS R-CNN182.8 G78.9 M
Mask R-CNN-SW127.5 G45.9 M
YOLO1110.4 G2.8 M
Disclaimer/Publisher’s Note: The statements, opinions and data contained in all publications are solely those of the individual author(s) and contributor(s) and not of MDPI and/or the editor(s). MDPI and/or the editor(s) disclaim responsibility for any injury to people or property resulting from any ideas, methods, instructions or products referred to in the content.

