Article

Optimization of Irrigation and Nitrogen Fertilization Improves Biomass, Yield, and Quality of Fertigation Tomatoes

1
Key Laboratory for Technology in Rural Water Management of Zhejiang Province, Zhejiang University of Water Resources and Electric Power, Hangzhou 310018, China
2
Zhejiang Key Laboratory of River-Lake Water Network Health Restoration, Zhejiang University of Water Resources and Electric Power, Hangzhou 310018, China
3
School of Marxism, Zhejiang University of Water Resources and Electric Power, Hangzhou 310018, China
*
Author to whom correspondence should be addressed.
Horticulturae 2025, 11(5), 521; https://doi.org/10.3390/horticulturae11050521
Submission received: 21 March 2025 / Revised: 8 May 2025 / Accepted: 9 May 2025 / Published: 12 May 2025
(This article belongs to the Special Issue Irrigation and Water Management Strategies for Horticultural Systems)

Abstract

:
Enhancing water and fertilizer use efficiencies is pivotal for sustainable tomato production. Adequate nitrogen and water management strategies have shown promise in improving the soil environment and crop productivity. However, the effects of fertigation modes on plant growth, yield, and quality remain largely unknown. To bridge this knowledge gap, an experiment was conducted in a greenhouse to investigate the effects of varied levels of water and nitrogen on the net photosynthetic rate, biomass, yield, and quality of tomatoes. The irrigation treatments included 0.75, 1.0, and 1.25 times the crop water requirement (ETc), designated as W1, W2, and W3, respectively. The nitrogen rates included 120, 220, 320, and 420 kg N·hm−2, designated as N1, N2, N3, and N4, applied in each irrigation treatment. The results showed that the W2N3 treatment achieved the most significant net photosynthetic rate and biomass of leaves. The tomato yield increased with the increase in nitrogen rate and irrigation amount, and the increment peaked at the threshold (1.0 ETc, 320 kg·hm−2), then declined with the further increase in water and nitrogen inputs. Principal component analysis revealed that the W2N3 exhibited superior quality characteristics compared to other treatments. Therefore, the combination of 100% ETc and 320 kg N·hm−2 achieved a triple goal of high quality, yield, and water–nitrogen-use efficiency in greenhouse tomato production. These results provide scientific insights for guiding fertigation for tomato production under greenhouse conditions.

1. Introduction

Tomato (Solanum lycopersicum L.), world-renowned for its nutritional and medicinal value, is a globally significant horticultural crop. In 2021, the harvest area and yield of tomatoes in China reached 1.11 million hectares and 66.09 million tons, respectively. Over the past decades, facility agriculture in China has soared, with tomato cultivation areas under greenhouse conditions accounting for 57.2% of that in the global total [1]. However, farmers are accustomed to the application of excessive irrigation and fertilizer to pursue maximum economic benefits and minimize the risk of yield reduction. Such practices often lead to nitrogen residue and elevated high levels of nitrate-nitrogen in facility fields, resulting in low efficiencies of agricultural resources and environmental pollution [2,3]. This leads to diminishing returns or even negative impacts on both crop yield and quality [4,5]. Therefore, to maximize agricultural resource-use efficiency while stabilizing tomato yield, the proper irrigation and fertilization strategies should be recommended for farmers.
Irrigation regimes play a key role in determining tomato yield. In greenhouse conditions, natural rainfall is unavailable or prevented; thus, irrigation is the sole water source for crop production. Tomatoes are particularly sensitive to water deficits as a shallow-rooted crop with high water requirements [6]. Drought reduces tomato yields, but excessive irrigation negatively inhibits crop growth, leading to substantial nitrogen loss and induced ammonia volatilization [7]. It has been widely accepted that the optimum irrigation scheduling not only reduces production costs but also boosts crop yield and quality. However, producers often conduct irrigation schedules through experience. Numerous studies have investigated the irrigation scheduling of tomato, such as the optimal irrigation volume being 405 mm·hm−2 in Xinjiang, China [8]. A widely standard method for estimating crop reference evapotranspiration (ET0) is evaporation measurements from a 20 cm pan [9]. The optimal drip irrigation water in Ludhiana is 0.5 × Epan for greenhouse tomatoes [10]. The optimal water amount in drip irrigation of tomatoes in Italy is 1.0 times the evaporation [11]. The amount of irrigation can also be determined by setting the upper and lower limits of the field water capacity [12]. Intelligent irrigation systems leverage real-time monitoring data and advanced control algorithms have been developed to precisely optimize water application in a greenhouse [13]. These automated systems maintain optimal root-zone soil moisture conditions by dynamically adapting to crop-specific water requirements across different growth stages [14]. However, utilizing the greenhouse-specific Penman–Monteith equation has received limited attention, particularly in its application to precision irrigation systems.
Nitrogen (N) is one of the essential nutrients for tomato production and quality enhancement. In the past few years, nitrogen fertilizer consumption has increased with annual growth rate of 1.5% in globally, culminating in 140–145 million tons by the end of 2030 [15]. Nevertheless, the unscientific and/or excessive application of nitrogen fertilizer leads to a substantial decline in nitrogen efficiency [16], increases greenhouse gas emissions [17], and forces soil salinization [18], and thus induces several environmental issues, e.g., nitrogen leching and runoff [19]. To address these issues, it is imperative to optimize nitrogen-use efficiency (NUE) in agricultural practices. Drip fertigation, a precision farming technique, has advantages in tailoring nitrogen application to the specific needs of crops, minimizing waste and environmental burden. Thus, this useful approach of water and nitrogen management supports tomato cultivation and contributes to broader efforts in preserving natural resources for future generations.
Drip fertigation technology, which involves dissolving fertilizers in irrigation water for precise application, represents an advanced approach in agricultural production [20]. The method allows for the timely and accurate delivery of water and fertilizers based on requirements of crop growth. Studying the responses of crops with varied water and nitrogen conditions under drip fertigation provides a theoretical framework for making the best water and fertilizer regulation model and management measures. Some researchers have carried out numerous studies on crop growth, yield, and quality under the condition of integrated water and fertilizer [21,22,23,24,25]. Reasonable irrigation can create an ideal soil environment for roots to ensure normal photosynthesis of crops and enhance biomass accumulation and nutrient absorption [26]. Studies have demonstrated that drip fertigation significantly enhances both the yield and marketable fruit rate of tomato in greenhouse conditions compared to conventional furrow irrigation [27]. This improvement is attributed to the precise synchronization of water and nutrient delivery with crop demand, which optimizes resource-use efficiency while minimizing resource losses due to leaching, runoff, or evaporation. Optimal fertilization improves the root uptake efficiency of both macronutrients (N, P, K) and micronutrients (Fe, Zn, Mn et al.). However, either deficiency or excessive application significantly reduce tomato yield and impair fruit quality [28]. Du et al. [29] conducted drip irrigation fertilization trials on greenhouse tomatoes and found that when the nitrogen rate rose beyond 250 kg·hm−2, tomato yield did not increase any more, but it led to excessive nitrate accumulation in the soil. Singandhupe et al. [30] reported that drip fertigation significantly boosted yield and nitrogen utilization compared to the traditional furrow fertilization. Previous studies mainly focused on the macro-level effects of a single fertilization or irrigation practice on tomato growth and yield. However, there were few studies on tomatoes’ physiological indexes, dry biomass, yield, and quality under more sophisticated fertigation management conditions. It is difficult to quantitatively determine precise irrigation and fertilization levels to truly save water and fertilizer. Studies have shown that water–nitrogen interactions can significantly enhance crop yield within a specific range, but beyond this range, the benefits diminish or even become counterproductive [3,31]. The impacts of different water–nitrogen compositions on tomato productivity vary in terms of varieties, management methods, soil structure types, cultivated land fertility, and climatic conditions [32,33,34]. Thus, determining the optimal balance of irrigation and nitrogen application is critical for achieving maximum yield and enhancing crop quality.
The objectives of the present study were as follows: (1) investigate the effects of different irrigation scheduling and fertilization regimes on the net photosynthetic rate, yield, and quality; (2) assess the impacts of irrigation water and nitrogen fertilizer levels on the dry biomass of tomato, as well as IWP and PFPN; (3) identify appropriate water and nitrogen combinations. It was hypothesized that an optimized combination of water and nitrogen improves soil nitrogen and moisture conditions, thereby enhancing photosynthetic efficiency. This synergistic combination boosts total revenue, as reflected in increased tomato yield, and reduces expenditures on critical resources such as water and nitrogen fertilizer.

2. Materials and Methods

2.1. Research Area

The experiment (tested in 2023) was conducted at the YangDu Experimental Base of Zhejiang Academy of Agricultural Sciences in Zhejiang Province, Southeast China. The test area is located at 120°22′ east longitude and 30°32′ north latitude. The region is characterized by a multi-year average temperature of 16.0 °C, a multi-year average evaporation was about 799 mm, a multi-year average precipitation was about 1200 mm, and a frost-free average of 229 days annually. The basic physiochemical characteristics of the soil are shown in Table 1.

2.2. Test Materials

  • Plot layout
The size of the experimental greenhouse was 472 m2 (59 m × 8 m), with a north–south orientation to ensure optimal sunlight exposure for plant growth. The configuration of the drip irrigation pipe and the spatial arrangement of the tomato plants are illustrated in Figure 1. The irrigation system utilized under-mulch drip irrigation, featuring one mulch film paired with two drip irrigation pipes and two parallel plant rows. The tomato plants were spaced at (80 + 40) cm intervals.
  • Crop Management
The tomato cultivar ’Changfeng No. 5’ was used as the tested crop. Tomato seedlings were purchased from a local agricultural seedling company. Tomato plants with five true leaves were transplanted on 20 March 2022, and harvested on 31 July 2022. The planting density was 41,666 plants per hectare. There were four distinct stages, namely the seedling stage (20 March–18 April), early fruiting stage (18 April–1 May), full fruiting stage (2 May–16 July), and final fruiting stage (17 July–31 July), spanning a total of approximately 134 days. Apart from tailored irrigation and fertilization treatments, all plots were treated exactly following local farmers’ practices, including weeding, insecticide application, and pruning, etc. Tomato plants were cultivated and pruned to terminate growth after the fifth truss, with each truss standardized to retain four fruits.
  • Drip irrigationsystem
The greenhouse was equipped with three independent drip irrigation systems, each functioning as a distinct experimental unit. Following standard field preparation procedures (plowing and bedding), each irrigation system comprised a 1000 L water tank and four injectable fertilizers. To ensure precise monitoring, a dedicated flow meter was installed for each treatment to measure irrigation water application. The drip irrigation pipes were placed on the soil surface. Each dripper flow rate was 3 L/h under a 10 m water head with one emitter assigned to each plant.

2.3. Experiment Design

In this study, a two-factor experiment (nitrogen × water) was conducted, organized according to a randomized block design (Table 2). The nitrogen treatments included 120, 220, 320, and 420 kg N·hm−2, designated as N1, N2, N3, and N4, respectively. Urea (46.3% N) was used as a nitrogen source. N4 (420 kg N·hm−2) refers to the conventional nitrogen rate under furrow irrigation conditions adopted by local farmers. The irrigation treatments included 0.75, 1.0, and 1.25 times the crop water requirement (ETc), designated as W1, W2, and W3, respectively. This resulted in 12 treatments in total, each repeated three times (plots). The size of each plot was 7.8 m2 (1.2 m × 6.5 m). To minimize the lateral migration of water and nutrients, a 100 cm deep plastic film was buried perpendicularly in the soil between the nearby plots. Protective rows were placed around the experimental area to reduce the boundary effect.
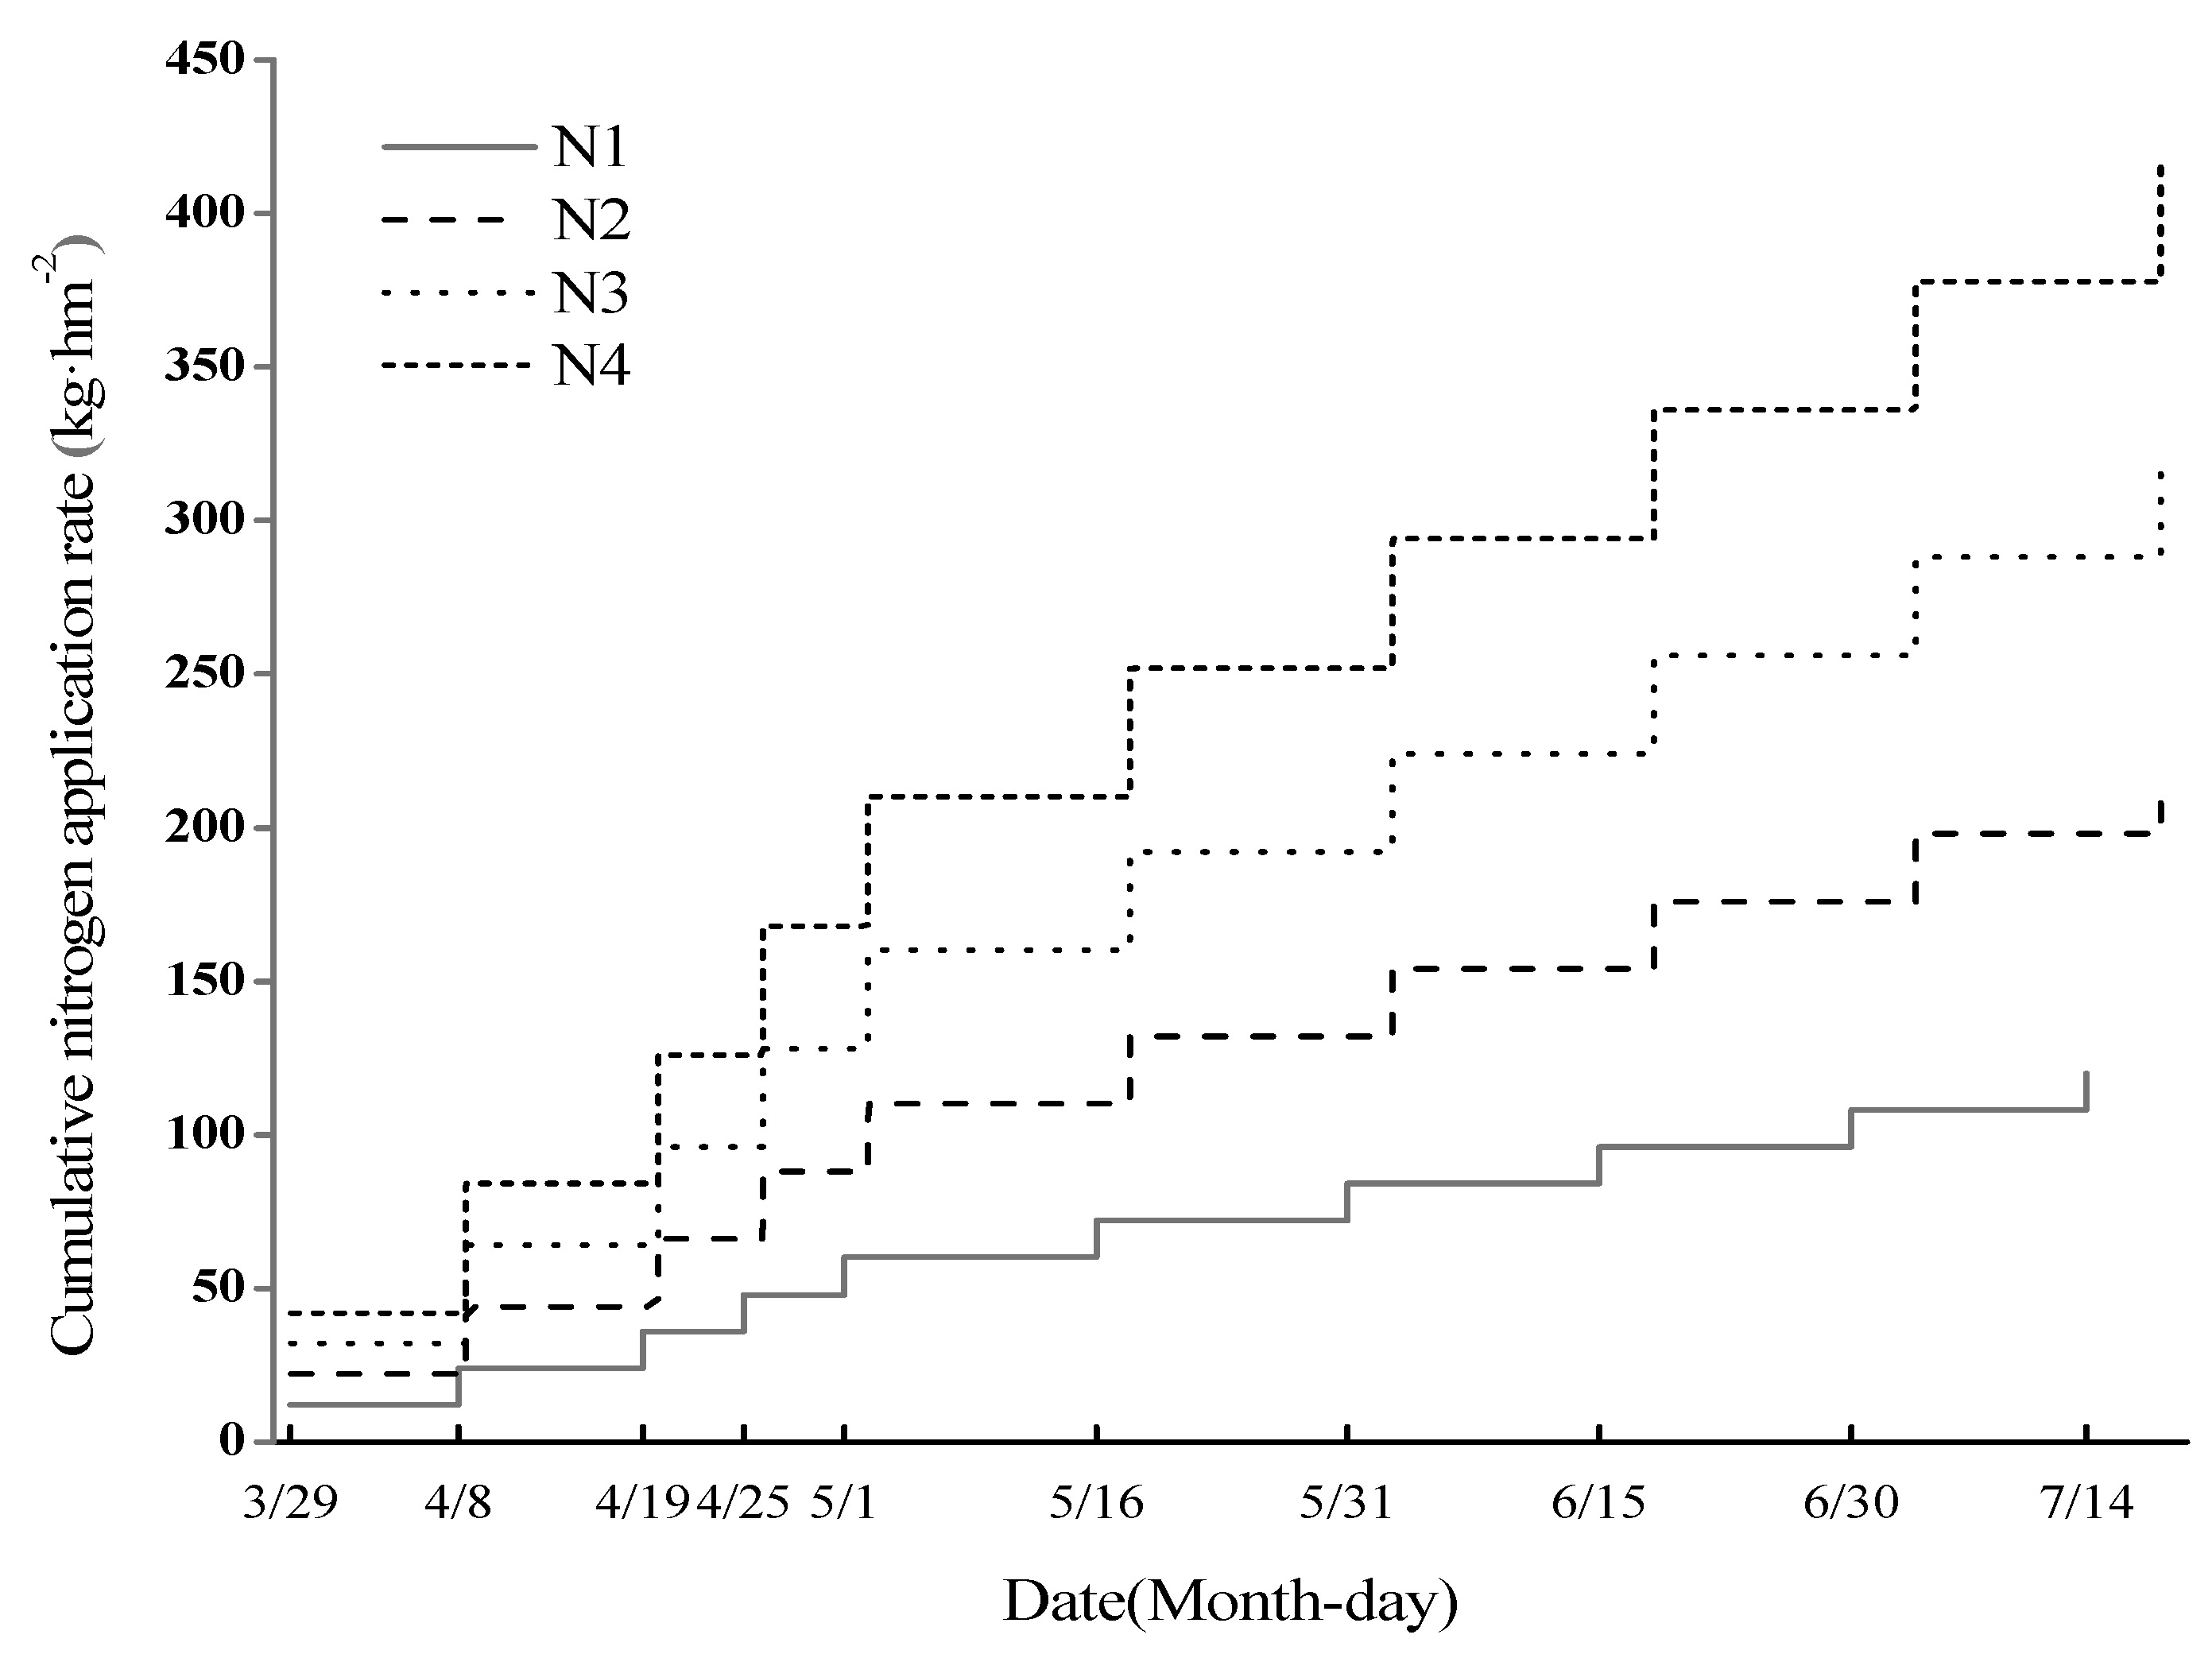
  • Nutrient application
In conventional tomato cultivation practices, fertilization is typically performed in two applications: an initial base fertilizer application followed by a single topdressing during fruit expansion. This study aims to enhance fertilizer-use efficiency by increasing the frequency of fertilizer applications. To ensure practical applicability for local farmers, the total nitrogen application was divided into 10 equal amounts. Nitrogen fertilizer was fully dissolved into water and delivered through the irrigation system at intervals of 10–15 days. Details on the timing and amount of nitrogen fertilizer application are shown in Figure 2. Pre-transplant soil preparation included uniform incorporation (0–20 cm depth) of the following basal fertilizers. Phosphorus: single superphosphate (12%, P2O5) applied at 220 kg P2O5·hm−2. Potassium: potassium sulfate (50%, K2O) applied at 320 kg K2O·hm−2, and well-decomposed cattle manure (1.5% N, 0.8% P2O5, 1.2% K2O by dry weight) at 30,000 kg·hm−2. All fertilizers were uniformly applied as a single basal dose across the entire greenhouse surface one week before transplanting.
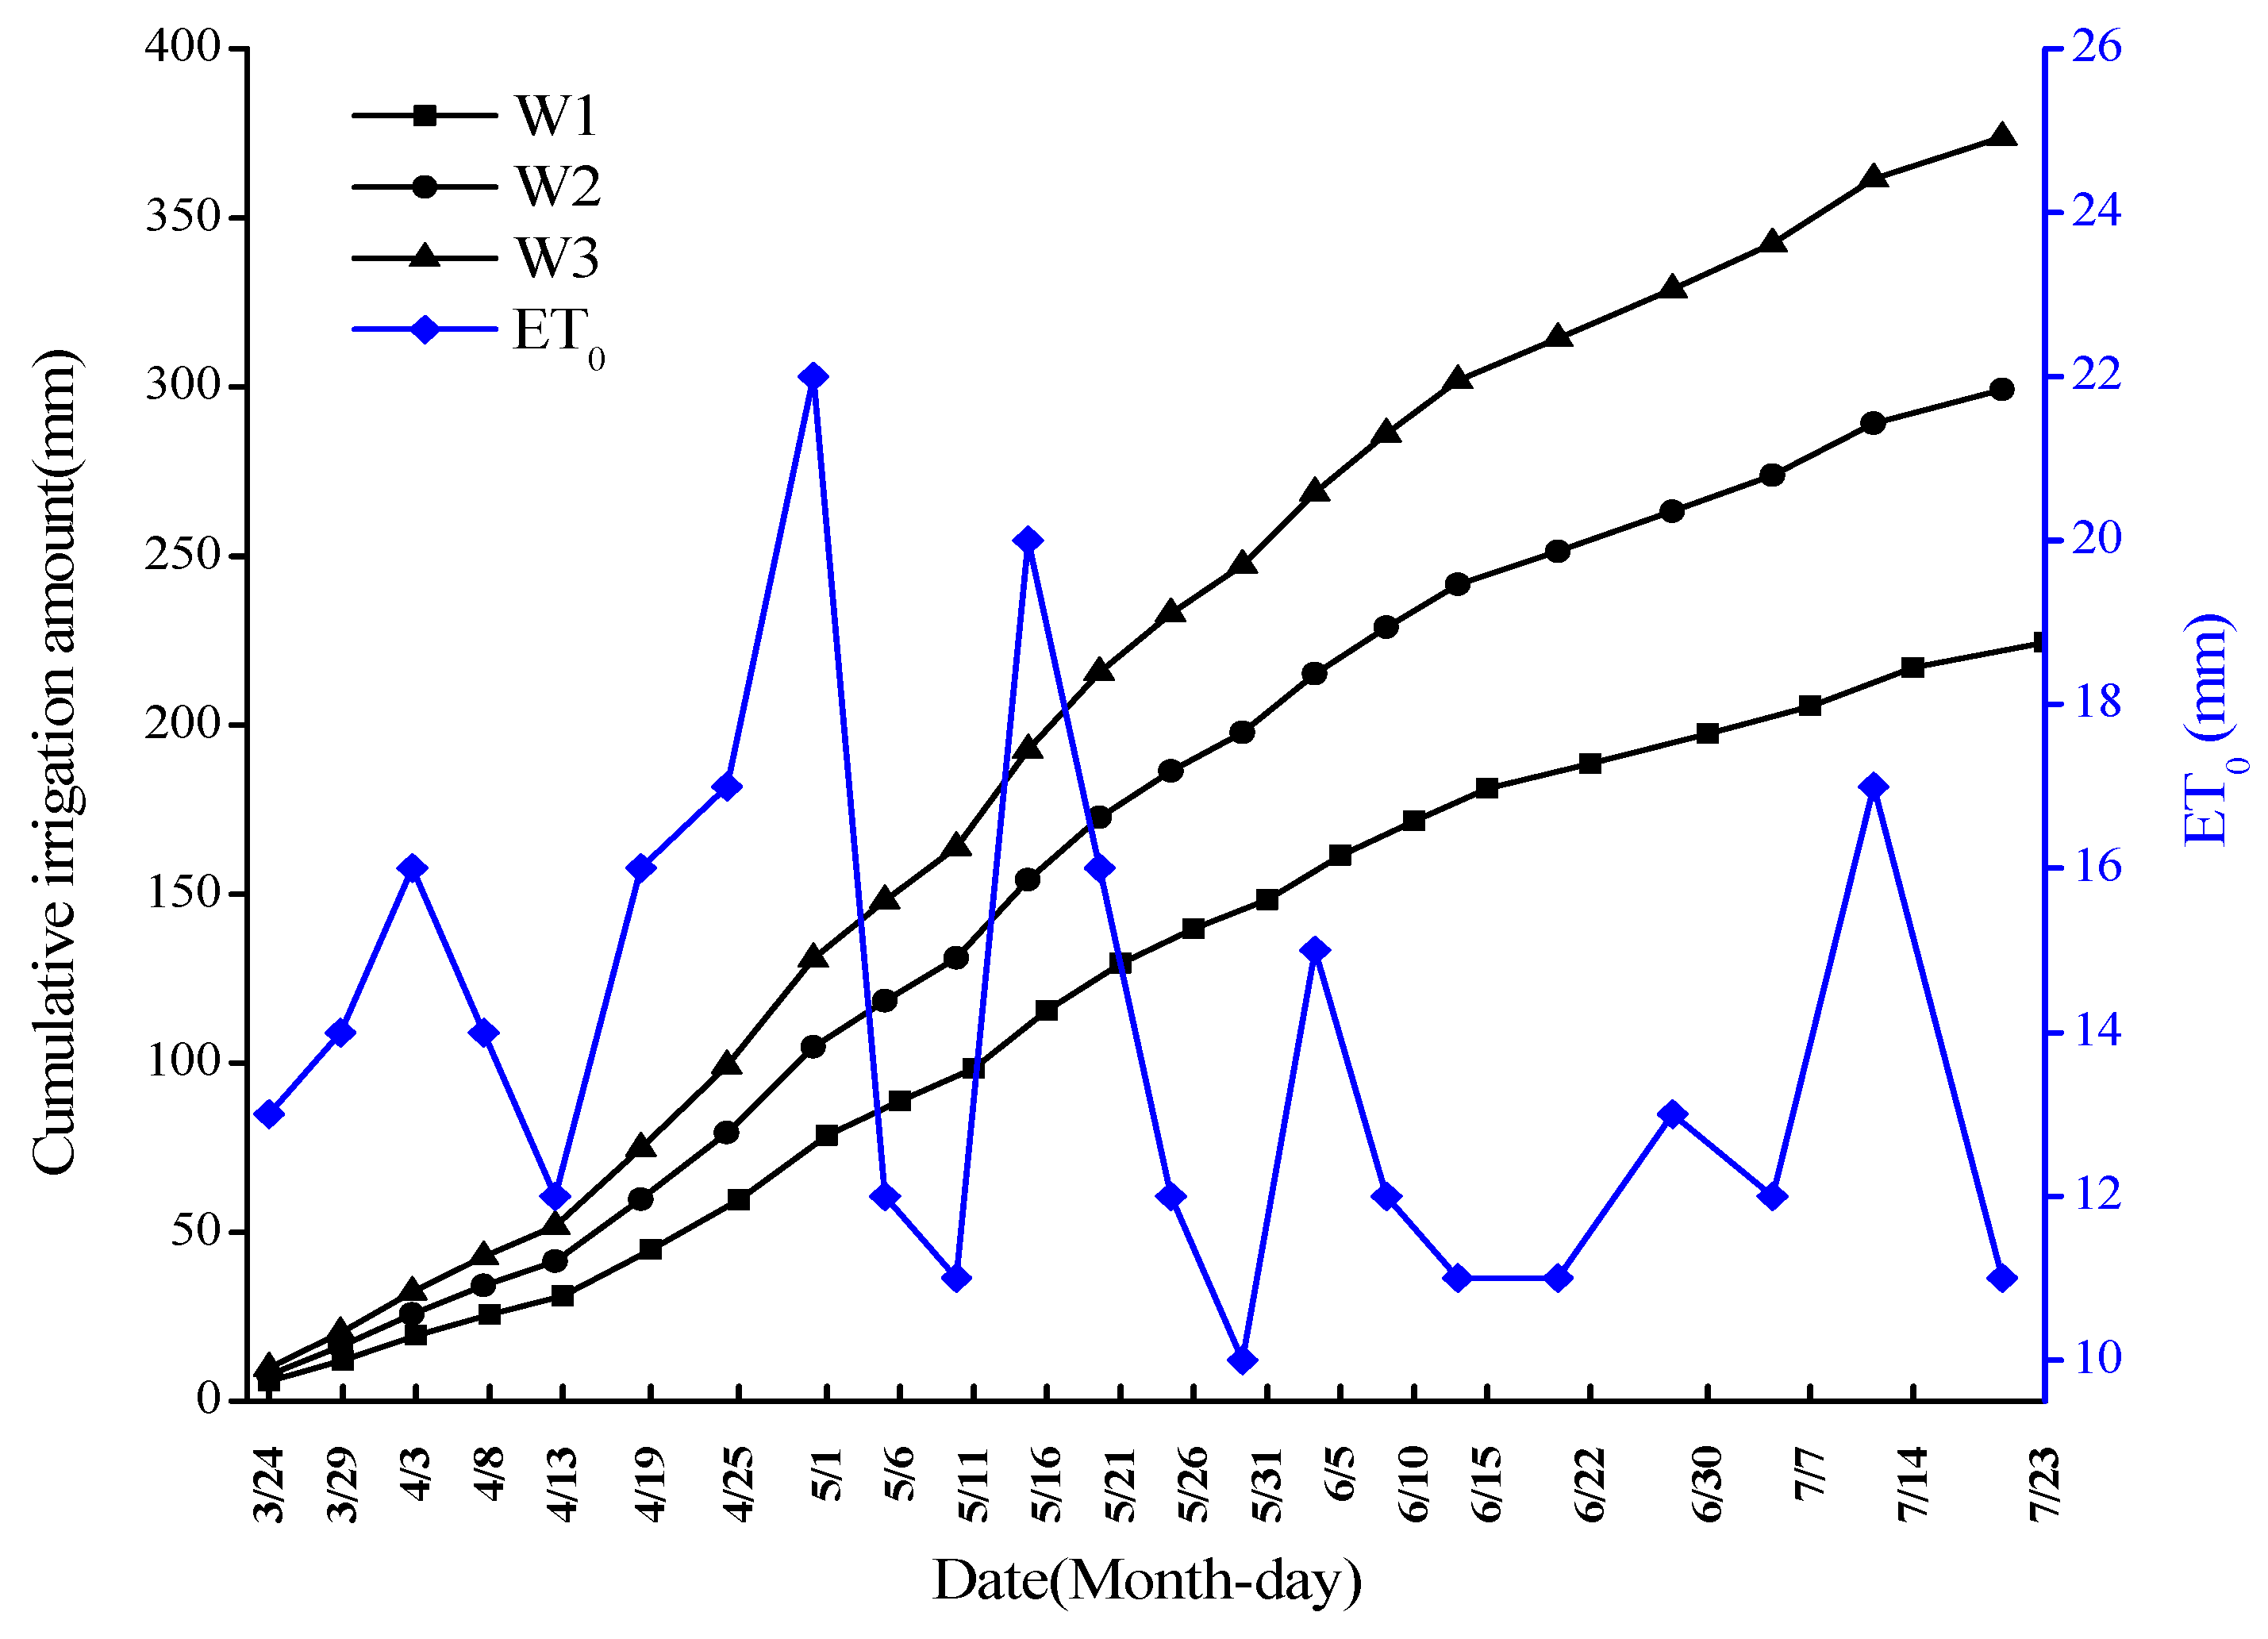
  • Irrigation application
The modified Penman–Monteith formula (Equation (1), see below) and crop coefficient Kc were utilized to estimate the actual water requirements during the crop-growing season. The crop coefficients were 0.6, 1.15, 1.15, and 0.9 for the seedling, early fruiting, full fruiting, and final fruiting stages, respectively, and were based on the different growth stages. A micro-weather station was used to monitor meteorological data and then calculate reference crop evapotranspiration (ET0) to determine the amount of crop water required. The tomatoes were irrigated at intervals of 5–7 days (Figure 3).

2.4. Measurements

(1)
Meteorological data monitoring
An automated weather station (HOBO, Onset Computer Corp., NE, USA) was utilized to continuously monitor and record essential meteorological parameters, including atmospheric pressure, effective radiation, temperature, and relative humidity, at 15 min intervals.
(2)
Determination of soil characteristics
Soil samples were collected one week before transplanting, using a stainless steel auger and cutting ring method, following the standard S-shaped five-point sampling pattern. The soil pH was determined in a 1:2.5 (w/v) soil–water suspension using a calibrated pH meter (pH 3110, WTW GmbH, Weilheim, Germany). The soil organic matter was measured via dichromate oxidation and ferrous ammonium sulfate titration [35]. The total N was analyzed with a Carlo Erba Model 1500 CNS analyzer (Carlo Erba Strumentazione, Milan, Italy). The soil available N was determined by alkali-hydrolysis diffusion. The soil available K was extracted with 1 mol L−1 ammonium acetate (NH4OAc). The concentration of available P in the soil was quantified by sodium bicarbonate extraction (0.5 mol L−1 NaHCO3) and subsequent colorimetric determination. The analytical methods for N, P, and K were performed following the procedures described by Bao [36].
(3)
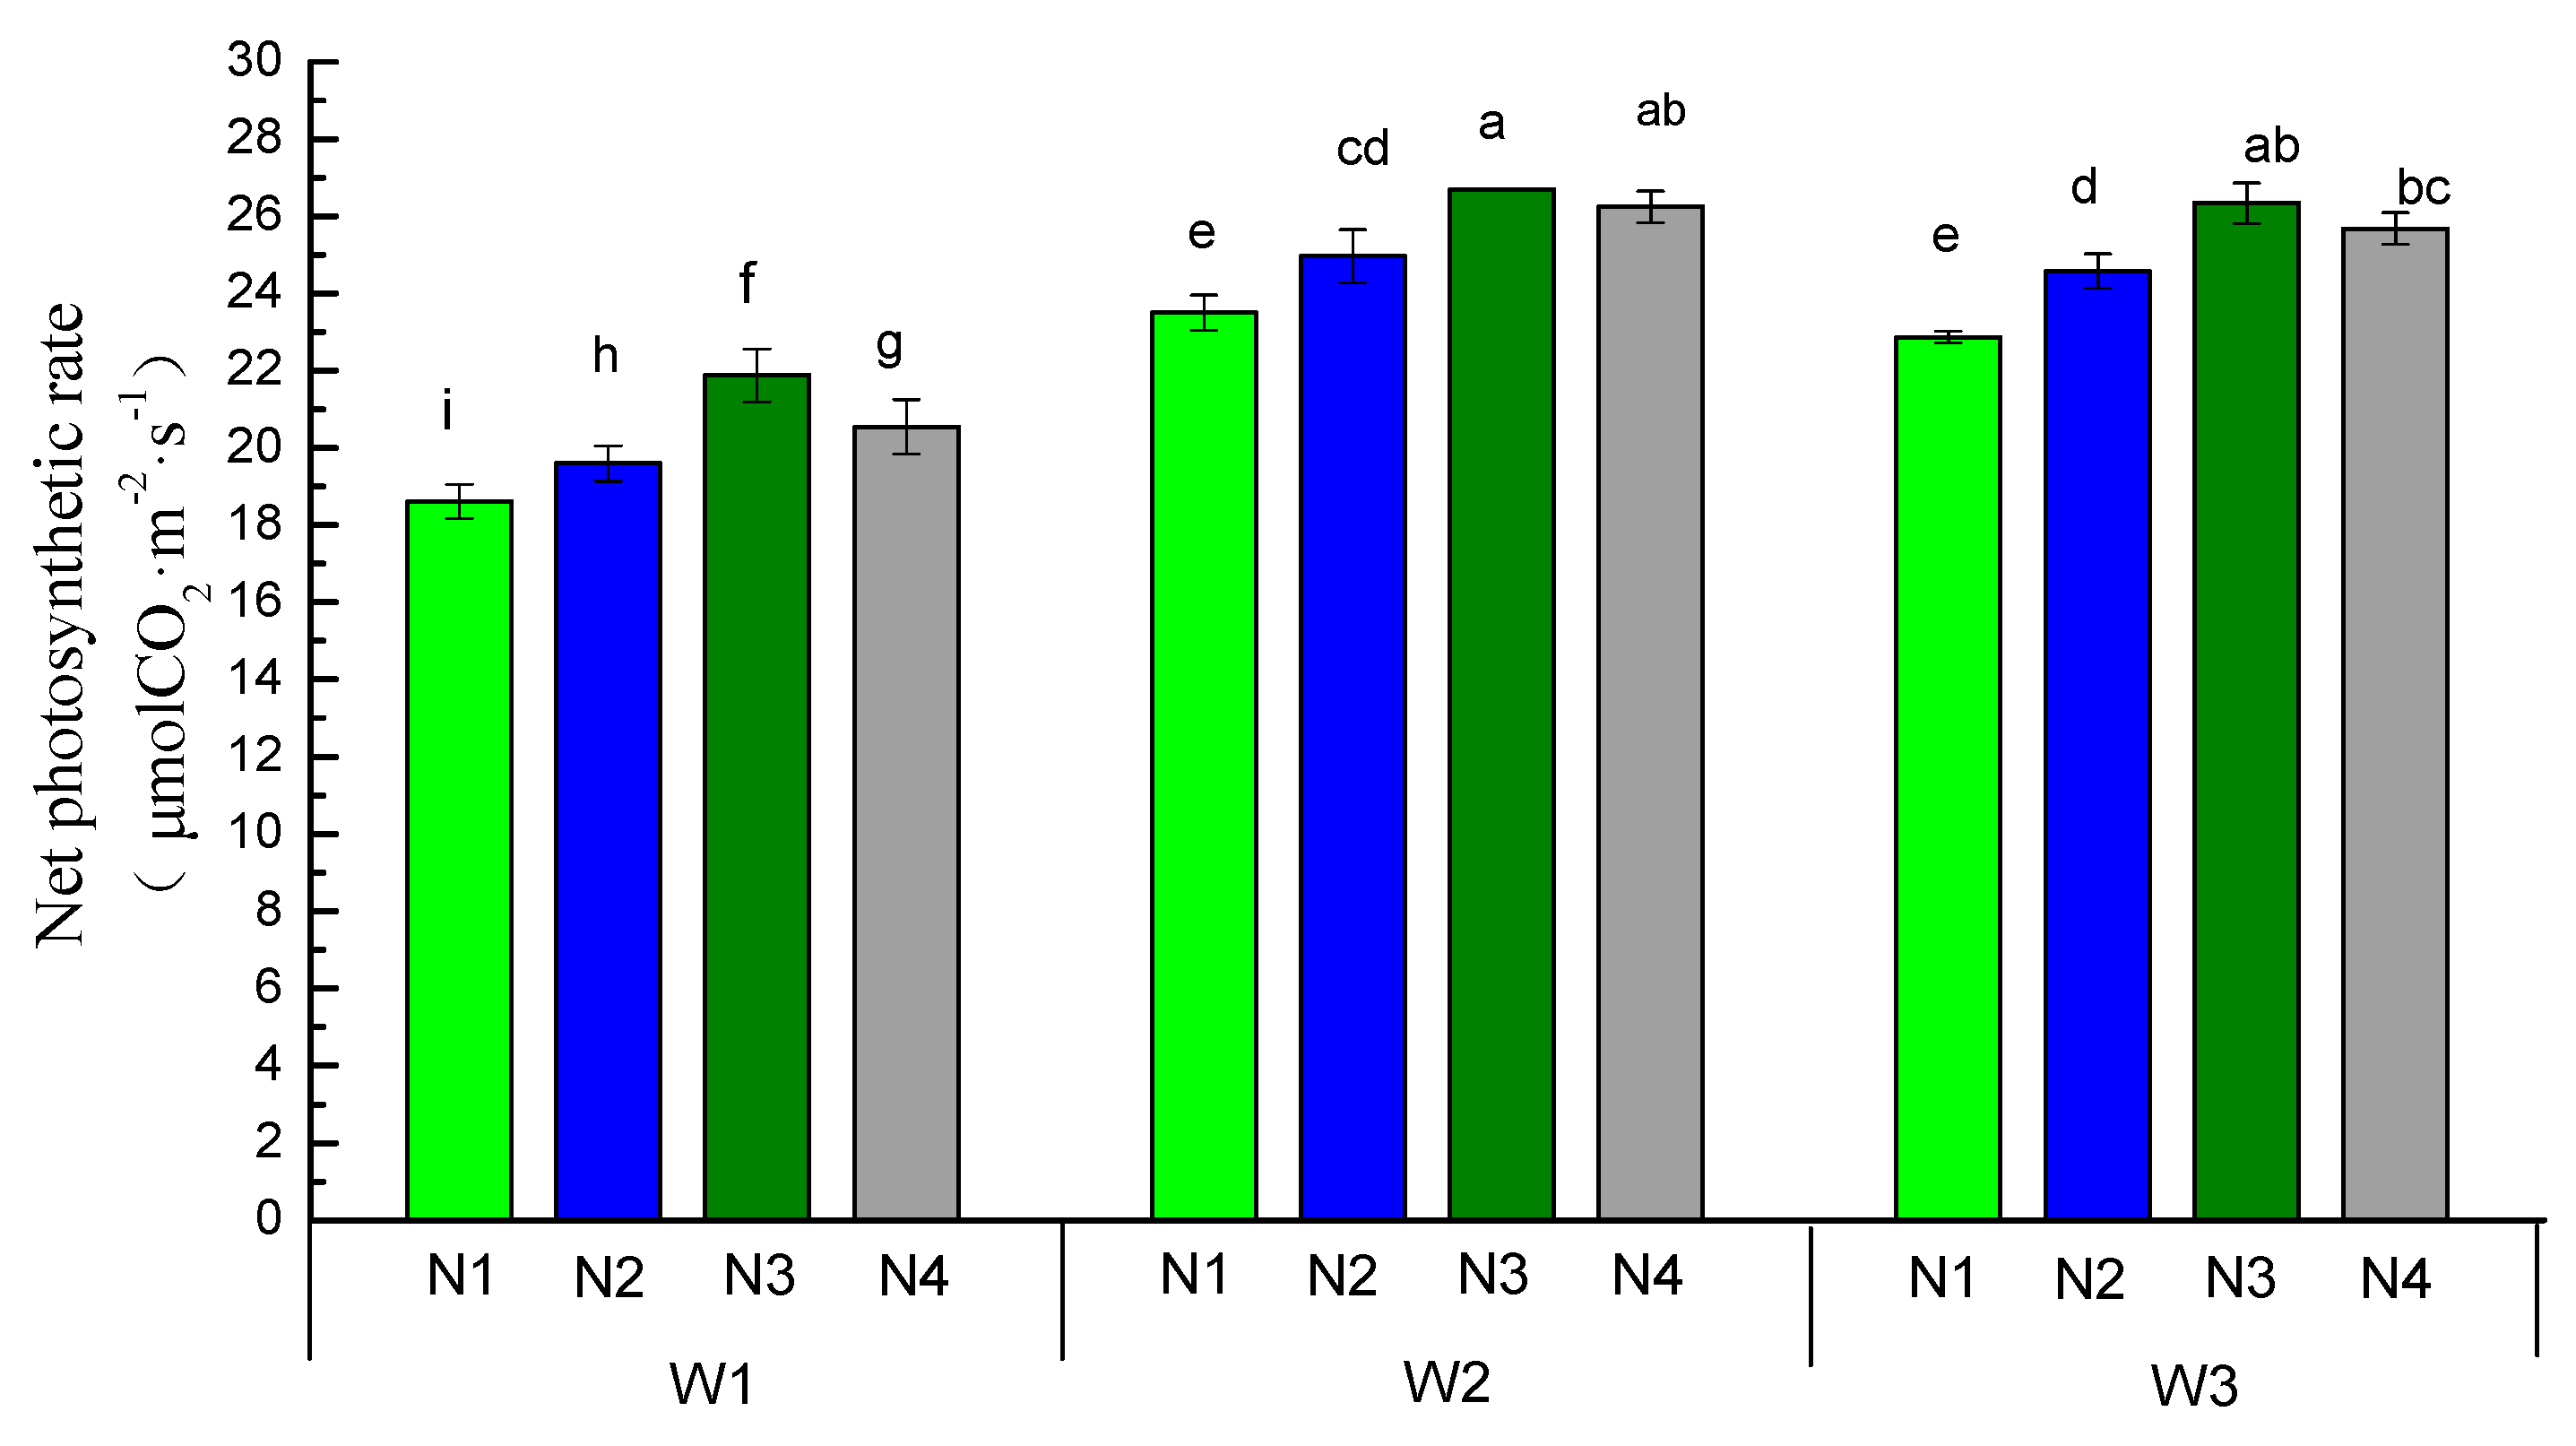
Net photosynthesis rate (Pn) measurements
On the 115th day (a clear, cloud-free day) after the transplanting, three healthy tomato plants were randomly marked up within each treatment. The newly matured functional leaves in the third section below the plant apex were selected for determination of the net photosynthesis rate by portable photo-synthesizer instrument (LI-6400; Li-Cor Inc., Lincoln, NE, USA). Light intensity, CO2 concentration, and temperature were maintained at real-time greenhouse levels. Measurements were conducted from 9:00 to 11:00. Each functional leaf was measured three times to ensure data accuracy.
(4)
Determination of plant biomass
Three disease-free plants exhibiting uniform growth were randomly selected from each treatment as samples. The above-ground plant organs (fresh leaves and stems) were separated and placed into labeled paper bags. Roots were collected by digging, thoroughly washed with running water, and air-dried for 10 min. After recording the fresh weight of all plant organs, they were put into an oven at 100 °C for half an hour to halt biological activity and subsequently dried at 70 °C until reaching a constant weight. The weight of both biomass and fruit was measured using an analytical balance with a sensitivity of ±0.01 g (JCS-1000, KAIFENG GROUP, YK., Jinhua, China).
(5)
Determination of fruit yield
Approximately 50 days after pollination, the fully red-ripened tomato fruits on the first truss were harvested from three marked tomato plants in each plot. Following each harvest, all fruits of the plants were individually weighed to obtain the average yield per plant. Tomato fruits that were undersized, misshapen, or cracked were classified as unmarketable and excluded from yield calculations. The total yield per hectare was then determined by multiplying the mean yield per plant by the planting density.
(6)
Determination of tomato quality
When tomato fruits on the first truss reached maturity, three uniform and disease-free young tomato fruits were randomly selected for quality assessment. Each sample was homogenized into a pulp using a blender, and the pulp extract was immediately analyzed for nutrition indices, such as TSS, Vc, LY, OA, and SP. The specific measurement methods are described in Table 3.

2.5. Calculations

(1)
Reference crop evapotranspiration (ET0)
Due to the limitations of the standard Penman–Monteith equation in greenhouse environments [38], particularly its sensitivity to low wind speeds, which induce high aerodynamic resistance and consequently lead to significant evapotranspiration (ET0) underestimation [39], ET0 was calculated using the greenhouse Penman–Monteith adjusted equation as the following equation:
E T 0 = 0.408 Δ ( R n G ) + γ 1713 T + 273 U 2 ( e a e d ) Δ + 1.64 γ
The crop evapotranspiration (ETc) was calculated using the following equation:
ETc = ET0 × Kc
where ET0 is the reference crop evapotranspiration (mm∙d−1); Δ is the slope of the saturated vapor pressure curve (KPa∙°C−1); Rn is the net radiation at the crop surface (MJ∙m−2∙d−1); G is the soil heat flux density (MJ∙m−2∙d−1); γ is the psychrometric constant (KPa·°C−1); ETc is the actual crop water requirement; Kc is the crop coefficient of tomato [40].
(2)
Determination of IWP and PFPN.
Irrigation water productivity (IWP) was the ratio of yield to irrigation volume (kg·m−3).
Partial factor productivity of nitrogen (PFPN) is the ratio of the yield to nitrogen application.

2.6. Statistical Analysis

Data were analyzed using the SPSS 22.0 software package (IBM, Inc., Armonk, NY, USA). Multiple comparisons were conducted using the least significant differences (LSD) test at the 5% significance level. A one-way ANOVA was employed to evaluate the effects of nitrogen application and irrigation water amounts on the measured data. The regression analysis was used Matlab (R2023a, MathWorks, Natick, MA, USA). Graphical representations were generated using OriginPro 9.0 software(Origin Lab Corp., Northampton, MA, USA).

3. Results

3.1. Net Photosynthetic Rate (Pn)

Pn exhibited distinct patterns under varying nitrogen and water treatment regimes (Figure 4). Under the same nitrogen application, the average Pn value of W2 was consistently observed to be the highest among all water treatments. The average value of W2 increased by 1.9% and 25.8% (the average value of four nitrogen treatments) compared with W3 and W1. Under the same irrigation level, Pn decreased in the following order: N3 > N4 > N2 > N1 (Figure 4). Notably, under W2 and W3 levels, the photosynthetic rate N3 was slightly higher than N4, but there was no significant difference. Under low-water W1 treatment, N4 treatment had a negative effect on the photosynthetic rate. Pn in the N3 treatment showed significant increases compared to the other N treatments (N4, N2, and N1), with improvements of 3.4%, 8.4%, and 15.3%, respectively, across the three irrigation treatments (Figure 4). These findings underscore the critical role of the optimal nitrogen and water combination (W2N3) in enhancing photosynthetic performance.

3.2. Dry Biomass Cumulative

Generally, the dry biomass of tomato organs showed significant variations in response to different water levels and nitrogen application rates (p < 0.05, Table 4). Under the same nitrogen application levels, the dry matter accumulation in the stems and leaves of tomato was W3 > W2 > W1, while root and fruit biomass exhibited a different trend: W2 > W3 > W1. Under the same irrigation levels, the dry biomass accumulation showed similar variations among the different treatments compared to Pn (Figure 4). The findings demonstrated that tomato development was positively impacted by increases in the water and nitrogen application rate in the range of (0.75–1.0) ETc and 0–320 kg·hm−2. Root analysis revealed no significant difference in dry root biomass under the low-water (W1) treatment. Under the same nitrogen level, dry biomass of the root of middle-water treatment (W2) was higher than that of high-water treatment and low-water treatment. In terms of stem analysis, under the low-water treatment (W1), the stem dry biomass increased gradually with the increase in nitrogen application from N1 to N3. In terms of the leaf analysis, there was no significant difference in N3 and N4 under all water treatments. Fruit analysis demonstrated that the W2N2 treatment achieved maximum dry biomass (154.20 G·plant−1), with no significant variations observed between the N3 and N4 treatments at different water levels.

3.3. Yield, IWP, and PFPN

Optimized irrigation and fertilization practices are fundamental prerequisites for achieving high tomato quality and yield, and also effective strategies to improve water- and fertilizer-utilization efficiency. There were significant effects of irrigation and nitrogen on yield (Table 5); under the same irrigation level, tomato yield was the greatest in N3 and N4, followed by N2, and least in N1. Under the same nitrogen application level, the fruit yield of W2 was significantly greater compared to the other irrigation regimes. The results showed that appropriate irrigation amounts and nitrogen application could promote the absorption of water and nitrogen and significantly increase yield.
Under the same irrigation condition, IWP increased first and then decreased with the increase in nitrogen rates, and IWP was comparable between N3 and N4. Under the same nitrogen rate, IWP increased first and then decreased with the increase in the irrigation amount. The smallest IWP (17.59 kg·m−3) was recorded for the W3N1 treatment, while the greatest IWP (30.87 kg·m−3) was achieved by the W2N3 treatment.
Under the N1, N2, and N3 nitrogen treatments, the PFPN values for the W1 irrigation level were significantly lower than those for the W2 and W3 treatments, with increases of 50.14% and 24.42% on average, respectively, compared to W1. The greatest PFPN was achieved in plants irrigated at W2 (1.0 ETc). Under the same irrigation conditions, PFPN declined with the increase in nitrogen rate. The greatest PFPN (664.69 kg·kg−1 N) was observed for the W2N1 treatment.

3.4. Relationship Between Nitrogen Application and Irrigation Amounts and Tomato Yield, Net Pn, and Total Dry Biomass Cumulation

The relationship between nitrogen application rates, irrigation amounts, tomato yield, net photosynthetic rate (Pn), and total dry biomass accumulation was analyzed (Table 6). The mathematical model exhibited strong correlations, with determination coefficients (R2) exceeding 0.97, indicating that the three regression equations were reliable. The regression equations are plotted in Figure 5A–C. The equations were all parabolic surfaces raised upward. The partial derivatives of the three equations were obtained. When the nitrogen application and irrigation amounts were 300.4 (kg hm−2) and 308.5 (mm), the tomato yield reached a maximum of 85.8 t hm−2. Within a certain range, tomato yield, Pn, and total dry biomass accumulation increased with the increase in nitrogen and water supply levels. However, if the increase was beyond the threshold of the proper level of water and nitrogen, the observed parameters decreased.

3.5. Tomato Quality

The analysis revealed that the five quality parameters of tomatoes followed consistent patterns under the different treatments (Table 7), two important parameters were selected for explanation and analysis. Ascorbic acid (Vc), also known as vitamin C, is an essential antioxidant that significantly enhances nutritional quality and provides numerous health benefits. Under the condition of low water (W1), the Vc content of the N3-treated tomato is greater than the other nitrogen treatments, indicating that an appropriate nitrogen rate (as N3) helps to improve the Vc content. Under the same nitrogen rate, the Vc content in W2 was 16.8–25.5% higher than in other irrigation treatments.
The total soluble solids (TSS) is another key quality parameter of tomatoes and is widely used to assess sweetness and overall fruit maturity. It refers to the sum of dissolved sugars, organic acids, minerals, and other soluble compounds in plant tissues. Different water and nitrogen treatments had significant effects on it. Under W2, N3 resulted in the greatest soluble solids (TSS) (increasing by 11.38–29.29% on average compared to the other N treatments). Under the same nitrogen rate, TSS showed similar variations among the treatments compared to Vc.

3.6. Principal Component Analysis and Comprehensive Evaluation of Tomato Quality

Principal component analysis (PCA) can convert multiple indicators into several principal components, and thus, it is widely used in the evaluation of crop quality. Tomatoes have high nutritional value and many quality indexes. Five indexes of tomato fruit quality, Vc (X1), LY (X2), TSS (X3), OA (X4), and SP (X5), were selected as the evaluation factors for principal component analysis. There was a linear correlation between most quality indicators (Table 7), indicating that these factors overlap in information, and common factors can be extracted, which is suitable for factor analysis. The eigenvalues and eigenvector scale are shown in Table 8 and Table 9.
The greater the eigenvalue, the more information involved in the variables of the corresponding principal components. The contribution rates of the principal components from the first to the fifth are 86.23%, 8.23%, 4.56%, 0.82% and 0.16%, respectively.
The selection of the number of principal components in PCA is guided by two key principles: the eigenvalue criterion (eigenvalue > 1) and the cumulative variance contribution rate criterion, which typically falls within a threshold range of 80% to 95%. The results revealed that the first two principal components cumulatively accounted for 94.46% of the variance, effectively capturing the majority of the information from the five original indicators. The equations for the first two principal components are (3) and (4).
P1 = 0.450x1 + 0.460x2 + 0.470x3 + 0.415x4 + 0.439x5
P2 = −0.493x1 − 0.425x2 + 0.197x3 + 0.732x4 + 0.048x5
P = 0.8623 P1 + 0.823 P2
The contribution values of the first two principal components were used to calculate the weight, and finally, the comprehensive score of the principal components was obtained by Equation (5). Table 6 shows the comprehensive scores of five tomato qualities for the different treatments. The W2N3 treatment is the best, and the comprehensive score is higher than that of the other treatment combinations (Table 10).

4. Discussion

4.1. Pn and Dry Biomass

Photosynthesis, a fundamental physiological process in green plants, involves absorbing light energy to produce organic matter. It has profound significance in maintaining the carbon–oxygen balance in the entire ecosystem [41]. Soil water and nitrogen work together to regulate Pn synergistically, and severe drought reduces Pn primarily through ABA-mediated stomatal closure [42]. This response is triggered by root-sourced abscisic acid (ABA) production under soil drought, which translocates to leaves and induces stomatal limitation. However, excessive N under water stress induces oxidative damage, and N deficiency limits electron transport capacity [43,44]. However, Wang et al. [45] demonstrated that reduced hydraulic conductivity under water stress exacerbates nitrogen deficiency and thus induces photosynthetic inhibition. This experiment demonstrated that the W2N3 treatment resulted in the greatest Pn. As water-sensitive crops, tomatoes are easily susceptible to water deficits, as shown by the inhibited plant growth caused by drought [23]. Irrigation can maintain a suitable soil hydrothermal environment for root growth when the water supply increases from W1 to W2. The root systems of tomatoes are sensitive to the soil oxygen content. For W3, the excessive irrigation water contributed to high soil moisture, which reduced the porosity and oxygen content of the soil [46]. This oxygen deficiency restricts aerobic respiration in the roots, ultimately diminishing the photosynthetic rate and inhibiting the biomass accumulation of tomatoes.
The results have shown that proper fertilization can enhance tomato root activities, thereby promoting biomass accumulation. Providing optimal nitrogen rates for crops helps to improve the activity of photosynthetic carbon assimilation enzymes in plant cells [47]. However, when the nitrogen fertilizer application rate exceeds the optimal level, the nitrogen absorption of crops becomes a luxury, inhibiting photosynthetic organs, and disrupting the normal photosynthesis of crops [48]. Our findings align with the consequence of Zhang [23], who conducted similar experiments with tomatoes under fertigation conditions. Studies have demonstrated that yield is closely linked to shoot biomass, and a high yield can be achieved by precise irrigation and fertilization strategies [49]. Liu [50] reported the biomass of tomato ranging from 256 to 361 G·plant−1, while the corresponding values in the present study were 263.56 to 424.66 g·plant−1, and the greatest value was recorded for the W3N3 treatment. The differences might be attributed to the cultivation technique, climate conditions, varietals, and sampling period. Furthermore, it was found that variations in supply levels of irrigation and nitrogen significantly influence the roots’ ability to absorb and utilize water and nutrients. The irrigation amounts increased from 1.0 ETc to 1.25 ETc, and the dry biomass of roots and fruits decreased, while that of stems and leaves increased. Excessive irrigation resulted in redundant growth, and thus lowering the harvest index of tomato.

4.2. Yield, IWP, and PFPN

Scientific irrigation and fertilization represent an effective strategy for optimizing water and fertilizer utilization, serving as a key approach to enhance crop yield and economic benefits. However, excessive or insufficient water/nitrogen application negatively affects yield performance [51]. In this study, the W2 treatment achieved the greatest tomato yield at each nitrogen rate, implying that excessive and inadequate irrigation was not helpful to tomato production. The greatest yield was observed in N3 under the same irrigation treatment. Insufficient nitrogen application led to the depletion of plant-available nitrogen pools in the rhizosphere, creating a diffusion-limited scenario for root uptake [52]. This markedly inhibited both vegetative and reproductive growth. The condition primarily disrupts chlorophyll biosynthesis, resulting in leaf chlorosis and reduced photosynthetic efficiency [53]. However, excessive nitrogen fertilization typically triggers soil acidification, nitrate leaching into groundwater, and disrupted nutrient ratios, reducing crop productivity beyond crop tolerance thresholds [54]. Previous research indicated that tomato yield showed a quadratic parabolic trend with the increase in irrigation and nitrogen supply levels [55,56]. Beyond the specific thresholds, further increases in resource inputs resulted in a reduction in crop yield.
IWP and PFPN can reflect the relationship between irrigation amounts and nitrogen application amounts and yield. Ertek et al. [57] demonstrated that deficit irrigation conditions significantly enhance WUE, emphasizing the critical role of optimizing irrigation water application in agricultural systems. Conversely, they identified excessive irrigation volumes as a primary driver of reduced IWP. This study found that IWP was not high at low irrigation levels, which could be related to the apparent decline in yield. According to Erdem et al. [58], IWP tended to decrease with the increase in irrigation volume. The findings of this study demonstrated the greatest IWP of tomato was observed for the W2N3 treatment. Moreover, these findings align with the principles of green and sustainable agricultural production, emphasizing the efficient utilization of water and nutrients to enhance productivity while minimizing environmental burdens [59]. Excessive irrigation reduces IWP and impairs soil aeration, root respiration, and nutrient uptake, ultimately affecting plant growth and yield [60]. Similarly, high nitrogen application led to nutrient leaching, soil degradation, and environmental pollution, further underscoring the necessity for the precision management of nitrogen fertilizer [61].
Previous studies have demonstrated that PFPN declines significantly with the increase in nitrogen rate [62]. In line with this, we found that the high nitrogen rate (as N4) consistently reduced PFPN irrespective of irrigation regimes compared to low nitrogen treatments. Although more irrigation water generally enhanced PFPN, this positive effect was contingent on the N regime, suggesting an interaction between soil water and N availability. The optimal combination of water and nitrogen (W2N3) could enhance resource-use efficiency and crop yield, contributing to sustainable agricultural practices.

4.3. Fruit Quality

In addition to yield, tomato quality is a key determinant of its nutritional value, with water and nitrogen application being the primary factors influencing crop quality. However, the extent and specific characteristics of these effects varied substantially. Extensive studies [63,64,65] have demonstrated a close relationship between crop quality and irrigation volume. A moderate water deficit has been shown to enhance the contents of soluble sugar, Vc, lycopene, and other parameters in tomato pulp [66]. Moreover, these beneficial effects were highlighted when water stress was maintained within an optimal range. Several studies have confirmed that water stress can enhance TSS accumulation without sacrificing the yield of tomato [67,68]. This study showed that W1 reduced the tomato quality index compared to W2. This is inconsistent with the previous research [63]. The discrepancy is potentially attributable to variations in the degree of water stress. A moderate water deficit reduced fruit water influx, decreasing soluble solids’ dilution (e.g., sugars, organic acids) and increasing their concentration per unit fresh weight. Severe drought had a deleterious effect on the transport pathway (phloem impairment) and disrupted assimilate allocation to fruits, thus lowering quality parameters. Excessive irrigation increased fruit water content and reduced overall fruit quality [69]. Excessive irrigation induced excessive vegetative growth, increased canopy shading, and reduced photosynthetic active radiation (PAR). García-Caparrós et al. [70] demonstrated that irrigation at 125% ETc significantly reduced the tomato fruit Brix value by 1.8°. Based on the hydraulic dilution hypothesis, higher irrigation amounts intensify the water transformation from xylem to fruit. This is supported by W3 negatively influenced tomato quality parameters.
Nitrogen is essential for amino acids, proteins, and chlorophyll, improving leaf vigor, color, and nutritional value. Previous research has shown a distinct correlation between tomato quality and nitrogen rates [71]. Additionally, it was discovered that an appropriate nitrogen rate increased tomato quality by strengthening photosynthesis, accelerating crop root growth, and absorbing nutrients. Min et al. [72] found that nitrogen rates increased from N2 to N3, and a notable decline value was observed for Vc, LY, TSS, OA, and SP. Excessive nitrogen supply interfered with phosphorus and potassium uptake and the absorption of various trace elements and impaired fruit maturation. Moreover, excessive nitrogen assimilated by tomato plants led to aberrant physiological functions and environmental issues, which caused low-quality fruit [73]. Du et al. [29] determined that a combination of 75% Ep (pan evaporation) and 250 kg·hm−2 nitrogen fertilization is suitable for drip-irrigated greenhouse tomato. Wang et al. [74] identified that 75% of reference evapotranspiration (W2: 75% ET0) interacted with a balanced NPK fertilization regime (F1: 240 N-120 P2O5-150 K2O) significantly improved tomato quality under a solar greenhouse. Our results demonstrated that tomato quality exhibited a positive response to the increase in nitrogen (N) rates until it reached 320 kg·hm−2, then further N supplementation (420 kg·hm−2) led to a reduction in the quality index. Wang et al. [75] found a negative correlation between increased fertilization rates and tomato fruit quality, which contrasts with the findings of the present study. The discrepancy may be attributed to variations in experimental conditions, tomato cultivars, fertilizer formulations, and cultivation techniques.

5. Conclusions

In summary, the biomass of tomato plants showed considerable variation across treatments, ranging from 269.53 to 432.57 g·plant−1. N3-treated tomato plants exhibited a significantly higher photosynthetic rate (Pn), biomass, and yield than the lower nitrogen rates. In contrast, PFPN increased with the decrease in the nitrogen rates. Notably, W2N3 achieved the greatest Pn and tomato yield. Proportionate supply levels of nitrogen and irrigation water could boost Pn and create an optimal soil environment for root growth. The PCA-derived model revealed distinct optimal thresholds for irrigation (100% ETc) and nitrogen fertilization (320 kg·hm−2), establishing an evidence-based approach for precision irrigation and nitrogen management in greenhouse tomato production. The combination of 100% ETc and 320 kg/hm2 enhanced the greenhouse tomato yield, quality, IWP, and PFPN under fertigation in greenhouse conditions. Thus, the fertigation technique described in this study emerges as a highly effective and sustainable strategy to improve irrigation water- and nutrient-utilization efficacy. Biological experiments are highly susceptible to environmental variables (temperature, humidity, light, etc.), necessitating controlled conditions or long-term studies to ensure accuracy. Conducting a single-year greenhouse experiment may limit the generalizability of results due to seasonal and climatic variability.

Author Contributions

Writing—original draft preparation, software, data curation, W.Y. and L.L.; Methodology, investigation, writing—review and editing, visualization, D.Q.; Software, project administration, formal analysis, C.D. and L.G.; project administration, supervision, data curation, S.C. All authors have read and agreed to the published version of the manuscript.

Funding

We are grateful for the grant support from Scientific Research Foundation of Zhejiang University of Water Resources and Electric Power (xky2023010); Huzhou Science and Technology Plan Project (2024GN08).

Data Availability Statement

The original contributions presented in the study are included in the article, further inquiries can be directed to the corresponding author.

Conflicts of Interest

The authors declare no conflict of interest.

References

  1. Chu, X.; Zheng, L.; Ye, G.; Chen, J. Comparison of greenhouse gas emissions between open field and facility tomato production in China. J. Agric. Environ. Sci. 2023, 42, 1870–1881. [Google Scholar]
  2. Guo, R.; Yang, Y.; Li, J. Comparative study of nitrogen budget in three different vegetable planting patterns under greenhouse condition. Chin. J. Eco Agric. 2014, 22, 10–15. [Google Scholar] [CrossRef]
  3. Luo, Q.; Chen, Z.; Yan, B.; Lei, J.; Zhang, X.; Bai, X.; Zhou, J. Effects of reducing water and fertilizer rates on soil moisture and yield and quality of tomato in solar greenhouse. J. Plant Nutr. 2015, 21, 449–457. [Google Scholar]
  4. Liu, H.; Duan, A.; Li, F.; Sun, J.; Wang, Y.; Sun, C. Drip irrigation scheduling for tomato grown in solar greenhouse based on pan evaporation in North China Plain. J. Integr. Agric. 2013, 12, 520–531. [Google Scholar] [CrossRef]
  5. Li, Y.; Wu, X.; Wu, Q.; Wu, H. Effects of irrigation and nitrogen application on ammonia volatilization loss from vegetable fields under greenhouse cultivation. J. Plant Nutr. 2016, 22, 949–957. [Google Scholar]
  6. Boyacı, S.; Kocięcka, J.; Atilgan, A.; Niemiec, M.; Liberacki, D.; Rolbiecki, R. Determination of the Effects of Different Irrigation Levels and Vermicompost Doses on Water Consumption and Yield of Greenhouse-Grown Tomato. Water 2024, 16, 1095. [Google Scholar] [CrossRef]
  7. Song, C.; Jiao, Y.; Yang, W.; Yu, Y.; Zhang, J.; Liu, Y. Research progress on the influence of irrigation methods on ammonia volatilization in farmland. IOP Conf. Ser. Earth Environ. Sci. 2021, 647, 012170. [Google Scholar] [CrossRef]
  8. Wang, Z.; Chen, X.; Lv, D.; Li, W.; Wang, T.; Wei, C. Effects of water and fertilizer coupling on the yield and quality of processing tomato under aerated drip irrigation. Trans. Chin. Soc. Agric. Eng. 2020, 36, 66–75. [Google Scholar]
  9. He, Z.H.; Li, M.N.; Cai, Z.L.; Zhao, R.S.; Hong, T.T.; Yang, Z.; Zhang, Z. Optimal irrigation and fertilizer amounts based on multi-level fuzzy comprehensive evaluation of yield, growth and fruit quality on cherry tomato. Agric. Water Manag. 2021, 243, 106360. [Google Scholar] [CrossRef]
  10. Mahajan, G.; Singh, K. Response of Greenhouse tomato to irrigation and fertigation. Agric. Water Manag. 2006, 84, 202–206. [Google Scholar] [CrossRef]
  11. Volpi, I.; Bosco, S.; Ragaglini, G.; Laville, P.; Bonari, E. Tomato productivity and soil greenhouse gas emissions under reduced water and N fertilizers in a Mediterranean environment. Agric. Ecosyst. Environ. 2022, 326, 107819. [Google Scholar] [CrossRef]
  12. Cui, J.; Liu, W.; Li, B. Effects of different water and nitrogen treatments on greenhouse tomato yield, water use efficiency, and physiological responses. Irrig Sci. 2024, 42, 509–523. [Google Scholar] [CrossRef]
  13. Abioye, E.A.; Abidin, M.S.Z.; Aman, M.N.; Mahmud, M.S.A.; Buyamin, S. A model predictive controller for precision irrigation using discrete lagurre networks. Comput. Electron. Agric. 2021, 181, 105953. [Google Scholar] [CrossRef]
  14. Gu, Z.; Qi, Z.M.; Burghate, R.; Yuan, S.Q.; Jiao, X.Y.; Xu, J.Z. Irrigation scheduling approaches and applications: A review. J. Irrig. Drain. Eng. 2020, 146, 04020007. [Google Scholar] [CrossRef]
  15. Li, Y.; Xu, J.; Liu, X.; Liu, B.; Liu, W.; Jiao, X.; Zhou, J. Win-win for monosodium glutamate industry and paddy agriculture: Replacing chemical nitrogen with liquid organic fertilizer from wastewater mitigates reactive nitrogen losses while sustaining yields. J. Clean. Prod. 2022, 347, 131287. [Google Scholar] [CrossRef]
  16. Wu, Y.; Yan, S.; Fan, J.; Zhang, F.; Zhao, W.; Zheng, J.; Guo, J.; Xiang, Y.; Wu, L. Combined effects of irrigation level and fertilization practice on yield, economic benefit and water-nitrogen use efficiency of drip-irrigated greenhouse tomato. Agric. Water Manag. 2022, 262, 107401. [Google Scholar] [CrossRef]
  17. Zhang, Z.; Yu, Z.; Zhang, Y.; Shi, Y. Finding the fertilization optimization to balance grain yield and soil greenhouse gas emissions under water-saving irrigation. Soil Tillage Res. 2021, 214, 105167. [Google Scholar] [CrossRef]
  18. Cecilio, F.; Nascimento, C.; Pereira, B.; Nascimento, C. Nitrogen fertilisation impacts greenhouse gas emissions, carbon footprint, and agronomic responses of beet intercropped with arugula. J. Environ. Manag. 2022, 307, 114568. [Google Scholar] [CrossRef]
  19. Xiao, C.; Zhang, F.; Li, Y.; Fan, J.; Ji, Q.; Jiang, F.; He, Z. Optimizing drip irrigation and nitrogen fertilization regimes to reduce greenhouse gas emissions, increase net ecosystem carbon budget and reduce carbon footprint in saline cotton fields. Agr. Ecosyst. Environ. 2024, 366, 108912. [Google Scholar] [CrossRef]
  20. Wu, Y.; Si, W.; Yan, S.; Wu, L.; Zhao, W.; Zhang, J.; Zhang, F.; Fan, J. Water consumption, soil nitrate-nitrogen residue and fruit yield of drip-irrigated greenhouse tomato under various irrigation levels and fertilization practices. Agric. Water Manag. 2023, 277, 108092. [Google Scholar] [CrossRef]
  21. Rajput, T.; Patel, N. Water and nitrate movement in drip-irrigated onion under fertigation and irrigation treatments. Agric. Water Manag. 2006, 79, 293–311. [Google Scholar] [CrossRef]
  22. Xin, L.; Ma, J.; Liu, R.; Tang, M.; Jiang, M.; Wang, P. Effects of alternate irrigation with salt and fresh water on enzyme activity, yield and quality of protected tomato in southern Xinjiang. Water Sav. Irrig. 2023, 1, 33–39. [Google Scholar]
  23. Zhang, M.; Xiao, N.; Li, Y.; Li, Y.; Zhang, D.; Xu, Z.; Zhang, Z. Growth and Fruit Yields of Greenhouse Tomato under the Integrated Water and Fertilizer by Moistube Irrigation. Agronomy 2022, 12, 1630. [Google Scholar] [CrossRef]
  24. Yue, W.; Chen, S.; Gao, L.; Li, N.; Liu, L. Effects of Water and Nitrogen Coupling on Yield, Quality, Water and Nitrogen Use Efficiencies of Greenhouse Muskmelon. Water 2023, 15, 2603. [Google Scholar] [CrossRef]
  25. Qi, D.; Hu, T. Effects of nitrogen application rates and irrigation regimes on root growth and nitrogen-use efficiency of maize under alternate partial root-zone irrigation. J. Soil. Sci. Plant Nutr. 2022, 22, 2793–2804. [Google Scholar] [CrossRef]
  26. Wang, H.; Cao, H.; Hao, S.; Pan, X. Responses of Plant Nutrient and Photosynthesis in Greenhouse Tomato to Water-Fertilizer Coupling and Their Relationship with Yield. Sci. Agric. Sin. 2019, 52, 1761–1771. [Google Scholar]
  27. Xing, Y.; Zhang, F.; Zhang, Y.; Li, Z.; Qiang, S.; Wu, L. Effect of Irrigation and Fertilizer Coupling on Greenhouse Tomato Yield, Quality, Water and Nitrogen Utilization Under Fertigation. Sci. Agric. Sin. 2015, 48, 713–726. [Google Scholar]
  28. Zhang, Y.; Zhang, F.; Yuan, Y.; Qiang, C.; Fang, D. The effect of irrigation and fertilization on growth and quality of tomato under fertigation in greenhouse. Agric. Res. Arid. Areas 2014, 32, 206–212. [Google Scholar]
  29. Du, Y.; Cao, H.; Liu, S.; Gu, X.; Cao, Y. Response of yield, quality, water and nitrogen use efficiency of tomato to different levels of water and nitrogen under drip irrigation in Northwestern China. J. Integr. Agric. 2017, 16, 1153–1161. [Google Scholar] [CrossRef]
  30. Singandhupe, R.; Rao, G.; Patil, N.; Brahmanand, P. Fertigation studies and irrigation scheduling in drip irrigation system in tomato crop (Lycopersicum esculentum L.). Eur. J. Agron. 2003, 19, 327–340. [Google Scholar] [CrossRef]
  31. Fan, Y.; He, L.; Liu, Y.; Wang, S. Spatiotemporally optimize water-nitrogen management of crop planting in response to carbon emissions mitigation. J. Clean. Prod. 2022, 380, 134974. [Google Scholar] [CrossRef]
  32. Hu, Q.; Liu, T.; Ding, H.; Guo, L.; Li, C.; Jiang, Y.; Cao, C. Application rates of nitrogen fertilizers change the pattern of soil organic carbon fractions in a rice-wheat rotation system in China. Agric. Ecosyst. Environ. 2022, 338, 108081. [Google Scholar] [CrossRef]
  33. Li, J.; Li, Y.; Wan, Y.; Wang, B.; Cai, W.; Qin, X.; Zhou, Z.; Wang, X.; Yuan, J.; Deng, Q. Annual greenhouse gas emissions from a rice paddy with different water-nitrogen management strategies in Central China. Soil Tillage Res. 2024, 235, 105906. [Google Scholar] [CrossRef]
  34. Kamran, M.; Yan, Z.; Chang, S.; Chen, X.; Ahmad, I.; Jia, Q.; Ghani, M.; Nouman, M.; Hou, F. Enhancing resource use efficiency of alfalfa with appropriate irrigation and fertilization strategy mitigate greenhouse gases emissions in the arid region of Northwest China. Field Crops Res. 2022, 289, 108715. [Google Scholar] [CrossRef]
  35. Si, G.; Peng, C.; Yuan, J.; Xu, X.; Zhao, S.; Xu, D.; Wu, J. Changes in soil microbial community composition and organic carbon fractions in an integrated rice–crayfish farming system in subtropical China. Sci. Rep. 2017, 7, 2856. [Google Scholar] [CrossRef]
  36. Bao, S. Soil and agricultural chemistry analysis; China Agricultural Press: Beijing, China, 2005. [Google Scholar]
  37. Allen, R.; Pereira, L.; Raes, D.; Smith, M. Crop evapotranspiration: Guidelines for Computing Crop Water Requirements; Irrigation and Drainage Paper 56; Food and Agriculture Organization of the United Nations: Rome, Italy, 1998. [Google Scholar]
  38. Fernández, M.; Bonachela, S.; Orgaz, F.; Thompson, R. Measurement and estimation of plastic greenhouse reference evapotranspiration in a Mediterranean climate. Irrig. Sci. 2010, 28, 497–509. [Google Scholar] [CrossRef]
  39. Wang, J.; Cai, H.; Li, H.; Chen, X. Study and evaluation of the calculation methods of reference crop evapotranspiration in solar-heated greenhouse. Irrig. Drain. 2006, 25, 1–14. [Google Scholar]
  40. Li, H. Principles and Techniques of Plant Physiological and Biochemical Experiment; Higher Education Press: Beijing, China, 2000. [Google Scholar]
  41. Li, J.; Pan, T.; Wang, L.; Du, Q.; Chang, Y.; Zhang, D.; Liu, Y. Effects of water-fertilizer coupling on tomato photosynthesis, yield and water use efficiency. Trans. Chin. Soc. Agric. Eng. 2014, 30, 82–90. [Google Scholar]
  42. Mofokeng, M.; Steyn, J.; Plooy, C.; Prinsloo, G.; Araya, H. Growth of Pelargonium sidoides DC. in response to water and nitrogen level. S. Afr. J. Bot. 2015, 100, 183–190. [Google Scholar] [CrossRef]
  43. Li, X.; Zhang, L.; Ahammed, G.; Li, Z.; Wei, J.; Shen, C.; Yan, P.; Zhang, L.P.; Han, W. Nitrogen excess exacerbates oxidative stress and photosynthetic inhibition in maize under drought conditions. Environ. Exp. Bot. 2021, 182, 104333. [Google Scholar]
  44. Chen, R.; Cheng, W.; Cui, J.; Fan, H.; Zheng, Z.; Ma, F. Lateral spacing in drip-irrigated wheat: The effects on soil moisture, yield, and water use efficiency. Field Crops Res. 2015, 179, 52–62. [Google Scholar] [CrossRef]
  45. Wang, X.; Zhang, Y.; Liu, J.; Chen, X.; Li, Z. Drought-induced reduction in nitrogen allocation to photosynthesis is more critical than stomatal limitation in maize. Field Crops Res. 2023, 302, 109075. [Google Scholar]
  46. Li, Y.; Niu, W.; Cao, X.; Wang, J.; Zhang, M.; Duan, X.; Zhang, Z. Effect of soil aeration on root morphology and photosynthetic characteristics of potted tomato plants (Solanum lycopersicum) at different NaCl salinity levels. BMC Plant Biol. 2019, 19, 331. [Google Scholar] [CrossRef]
  47. Xu, L.; Huang, S.; Tao, H.; Wang, Y.; Qi, L.; Pan, W. Effects of Different Nitrogen Regimes on Canopy Structure and Partial Physiological and Agronomic Traits in Summer Maize. Acta Agron. Sin. 2012, 38, 301–306. [Google Scholar] [CrossRef]
  48. Shen, R.; Wang, K. Field Test and Study on Yield, Water Use and N Uptake under Varied Irrigation and Fertilizer in Crops. Trans. Chin. Soc. Agric. Eng. 2001, 17, 40–43. [Google Scholar]
  49. Marcelis, L. Sink strength as a determinant of dry matter partitioning in the whole plant. J. Exp. Bot. 1996, 47, 1281–1291. [Google Scholar] [CrossRef] [PubMed]
  50. Liu, S.; Cao, H.; Yang, H.; Liu, S. The Correlation Analysis between Tomato Yield, Growth Characters and Water and Nitrogen Supply. Sci. Agric. Sin. 2014, 47, 4445–4452. [Google Scholar]
  51. Ma, Z.; Du, S.; Xue, L. Coupling Effects of Water and Fertilizer on tomato in Plastic Greenhouse of Gravel-Mulched Field Under Drip Fertigation. Sci. Agric. Sin. 2016, 49, 2164–2173. [Google Scholar]
  52. Nye, P.; Tinker, P. Solute Movement in the Soil-Root System; University of California Press: Oakland, CA, USA, 1977. [Google Scholar]
  53. Stefan, H.; Bernhard, K. Chlorophyll Breakdown: Current Status and Future Challenges. Annu. Rev. Plant Biol. 2011, 62, 1–24. [Google Scholar]
  54. Guo, J.H.; Liu, X.J.; Zhang, Y.; Shen, J.L.; Han, W.X.; Zhang, W.F.; Christie, P.; Goulding, K.W.T.; Vitousek, P.M.; Zhang, F.S. Significant acidification in major Chinese croplands. Science 2010, 327, 1008–1010. [Google Scholar] [CrossRef]
  55. Song, N.; Wang, F.; Yang, C.; Yang, K. Coupling effects of water and nitrogen on yield, quality and water use of potato with drip irrigation under plastic film mulch. Trans. Chin. Soc. Agric. Eng. 2013, 29, 98–105. [Google Scholar]
  56. Chen, R.; Meng, R.; Liang, H.; Zhang, J.; Wang, Y.; Wang, C. Effects of Different Treatments of Irrigation and Fertilization on the Yield and Nitrogen Utilization Characteristic of Potato. Chin. Agric. Sci. Bull. 2012, 28, 196–201. [Google Scholar]
  57. Ertek, A.; Sensoy, S. Irrigation frequency and amounts affect yield components of summer squash (Cucurbita pepo L.). Agric. Water Manag. 2004, 67, 63–76. [Google Scholar] [CrossRef]
  58. Erdem, T.; Arin, L.; Erdem, Y.; Polat, S.; Deveci, M.; Okursoy, H. Yield and quality response of drip irrigated broccoli (Brassica oleracea L. var. italica) under different irrigation regimes, nitrogen applications and cultivation periods. Agric. Water Manag. 2010, 97, 681–688. [Google Scholar] [CrossRef]
  59. Rockström, J.; Williams, J.; Daily, G.; Noble, A.; Matthews, N.; Gordon, L. Sustainable intensification of agriculture for human prosperity and global sustainability. Ambio 2017, 46, 4–17. [Google Scholar] [CrossRef]
  60. Li, Y.; Niu, W.; Dyck, M.; Zhang, M. The effects of soil aeration, irrigation, and nitrogen fertilization on root morphology, soil water status, and yield of tomato plants. Agric. Water Manag. 2016, 176, 226–236. [Google Scholar]
  61. Ju, X.; Xing, G.; Chen, X.; Zhang, S.; Zhang, L.; Liu, X. Reducing environmental risk by improving N management in intensive Chinese agricultural systems. Proc. Natl. Acad. Sci. USA 2009, 106, 3041–3046. [Google Scholar] [CrossRef] [PubMed]
  62. Wang, H.D.; Li, J.; Cheng, M.H.; Zhang, F.C.; Wang, X.K.; Fan, J.L.; Wu, L.F.; Fang, D.P.; Zou, H.Y.; Xiang, Y.Z. Optimal drip fertigation management improves yield, quality, water and nitrogen use efficiency of greenhouse cucumber. Sci. Hortic. 2019, 243, 357–366. [Google Scholar] [CrossRef]
  63. Yin, S.; Hu, X.; Kang, S.; Cai, H.; Liang, B. Effects of Deficit Irrigation on Yields and Quality of Tomato in Green House at Maturing Stage. J. Irrig. Drain. 2011, 30, 39–42+81. [Google Scholar]
  64. An, S.; Wang, Y.; Li, H.; Wang, S.; Gao, L. Effects of Different Irrigation Quantities on Growth, Yield and Fruit Quality of Tomato in Solar Greenhouse. Acta Agric. Bor. Occid. Sin. 2010, 19, 188–192. [Google Scholar]
  65. Zhen, R.; Kang, S.; Hu, X.; Li, S. Effects of water and nitrogen conditions on the diurnal variation of photosynthesis characteristic and yield of grapevine in arid oasis region. Trans. Chin. Soc. Agric. Eng. 2013, 29, 133–141. [Google Scholar]
  66. Chen, J.; Kang, S.; Du, T.; Qiu, R.; Guo, P.; Chen, R. Quantitative response of greenhouse tomato yield and quality to water deficit at different growth stages. Agric. Water Manag. 2013, 129, 152–162. [Google Scholar] [CrossRef]
  67. Cheng, M.H.; Wang, H.D.; Fan, J.L.; Xiang, Y.Z.; Tang, Z.J.; Pei, S.Z.; Zeng, H.L.; Zhang, C.; Dai, Y.L.; Li, Z.J.; et al. Effects of nitrogen supply on tomato yield, water use efficiency and fruit quality: A global meta-analysis. Sci. Hortic. 2021, 290, 110553. [Google Scholar] [CrossRef]
  68. Patan`e, C.; Tringali, S.; Sortino, O. Effects of deficit irrigation on biomass, yield, water productivity and fruit quality of processing tomato under semi-arid Mediterranean climate conditions. Sci. Hortic. 2011, 129, 590–596. [Google Scholar] [CrossRef]
  69. Liu, X.; Zhang, Y.; Zhang, F.; Cai, H.; Li, Z.; Yang, Q.; Yang, J. Effect of Water and Nitrogen Supply on Tomato Yield and Quality Under Alternative Irrigation. J. Soil Water Conserv. 2013, 27, 283–287. [Google Scholar]
  70. García-Caparrós, P.; Romero, M.; Llanderal, A.; Lao, M. Irrigation at 125%ETc alters sugar metabolism and volatile profiles in tomato fruits: A targeted metabolomics approach. Food Chem. 2023, 408, 135231. [Google Scholar]
  71. Zeng, B.; Sun, Q.; Liu, Z.; Wang, L.; Dai, P.; Jie, H. Effects of different nitrogen application rates on growth, quality and nitrogen accumulation of cherry tomato. Jiangsu Agric. Sci. 2024, 52, 148–154. [Google Scholar]
  72. Min, J.; Shi, W. Effects of different N rates on the yield, N use efficiency and fruit quality of vegetables cultivated in plastic greenhouse in Taihu lake region. Plant Nutr. Fert. Sci. 2009, 15, 151–157. [Google Scholar]
  73. Wu, W.; Lin, Z.; Zhu, X.; Li, G.; Zhang, W.; Chen, Y.; Ren, L.; Luo, S.; Lin, H.; Zhou, H. Improved tomato yield and quality by altering soil physicochemical properties and nitrification processes in the combined use of organic-inorganic fertilizers. Eur. J. Soil Biol. 2022, 109, 103384. [Google Scholar] [CrossRef]
  74. Wang, X.; Xing, Y. Evaluation of the effects of irrigation and fertilization on tomato fruit yield and quality: A principal component analysis. Sci. Rep. 2017, 6, 3975. [Google Scholar] [CrossRef]
  75. Wang, Y.; Liu, R.; Huang, S.; Jin, J. Effects of potassium application on flavor compounds of cherry tomato fruits. J. Plant Nutr. 2009, 32, 1451–1468. [Google Scholar] [CrossRef]
Figure 1. Layout of drip irrigation pipe and tomato planting.
Horticulturae 11 00521 g001
Figure 2. Nitrogen application scheduling. Note: N1, N2, N3, and N4 represent 120, 220, 320, and 420 kg N hm−2, respectively.
Horticulturae 11 00521 g002
Figure 3. Irrigation scheduling and sum of ET0 in 5–7 days. Note: W1, W2, and W3 represent 0.75, 1.0, and 1.25 times the crop water requirement (ETc).
Horticulturae 11 00521 g003
Figure 4. The Pn at the full fruiting stage as affected by different water and nitrogen treatments. Note: W1, W2, and W3 represent 0.75, 1.0, and 1.25 times the crop water requirement (ETc), respectively; N1, N2, N3, and N4 represent 120, 220, 320, and 420 kg N hm−2, respectively. Values followed by different letters are significantly different at the 0.05 probability level.
Horticulturae 11 00521 g004
Figure 5. Relationship of nitrogen application rates and irrigation amounts with yield (A), net photosynthetic rate (B), and total dry biomass cumulative (C).
Horticulturae 11 00521 g005
Table 1. Soil physiochemical characteristics of the experimental site.
Soil
Depth (cm)
PH Total N
(g·kg−1)
Available N
(mg·kg−1)
Available P
(mg·kg−1)
Available K
(mg·kg−1)
Organic
(g·kg−1)
FC (Vw)Soil Conductivity
(dS·m−1)
Soil Density
(g·cm−3)
Soil Texture
0–406.91.177.174.3131.217.824.310.42 1.38Sandy-loam
Note: FC, field capacity; N, nitrogen; P, phosphorus; K, potassium.
Table 2. Experimental treatment.
Processing NumberW1N1W1N2W1N3W1N4W2N1W2N2W2N3W2N4W3N1W3N2W3N3W3N4
Nitrogen (kg·hm−2)120220320420120220320420120220320420
Irrigation Regime0.75 ETc0.75 ETc0.75 ETc0.75 ETc1.0 ETc1.0 ETc1.0 ETc1.0 ETc1.25 ETc1.25 ETc1.25 ETc1.25 ETc
Note: W1, W2, and W3 represent 0.75, 1.0, and 1.25 times the crop water requirement (ETc), respectively; N1, N2, N3, and N4 represent 120, 220, 320, and 420 kg N hm−2, respectively.
Table 3. Measurement methods of tomato quality [37].
Nutrition IndexMeasurement Methods
Total soluble solids (TSS)Hand-held refractometer (BX-1, KEM, SHH., China)
Ascorbic acid (Vc)Titration method
Soluble protein (SP)Titration method
Lycopene (LY)spectrophotometer
Organic acid (OA)spectrophotometer
Table 4. Dry biomass of tomato organs variations across different treatments at the final harvest.
Irrigation
Volume
Nitrogen
Application Rate
Dry Weight of Different Organs (g·Plant−1)
RootStemLeafFruitTotal
W1 (0.75 ETc)N19.05 ± 0.06 e81.46 ± 4.15 g87.56 ± 1.40 g85.49 ± 4.20 f263.56 ± 3.33 h
N29.38 ± 0.33 e90.82 ± 2.34 f98.96 ± 2.83 f93.49 ± 4.41 f292.66 ± 9.28 g
N39.53 ± 0.46 e98.53 ± 2.37 e111.22 ± 1.17 de105.55 ± 3.56 e324.83 ± 5.08 f
N49.34 ± 0.47 e97.47 ± 2.24 e107.37 ± 6.30 e103.64 ± 1.96 e317.82 ± 5.09 f
W2(1.0 ETc)N112.20 ± 0.64 cd95.74 ± 2.95 ef114.00 ± 4.43 de134.33 ± 5.98 c356.26 ± 13.66 e
N213.13 ± 1.44 bc116.94 ± 4.79 c118.13 ± 6.54 cd143.94 ± 4.84 b392.13 ± 12.10 cd
N314.73 ± 0.91 a129.22 ± 4.27 b126.51 ± 6.95 bc154.20 ± 5.27 a424.66 ± 6.62 a
N414.06 ± 0.89 ab121.32 ± 1.74 c118.53 ± 5.59 cd152.20 ± 3.68 a406.11 ± 8.79 bc
W3 (1.25 ETc)N110.91 ± 0.74 d109.73 ± 6.63 d126.40 ± 5.57 bc111.26 ± 6.95 e358.29 ± 14.81 e
N212.15 ± 0.80 cd121.62 ± 2.34 c133.51 ± 3.76 ab121.14 ± 5.46 d388.41 ± 7.69 d
N313.02 ± 0.74 bc137.28 ± 2.59 a139.82 ± 3.23 a123.52 ± 4.80 d413.65 ± 7.82 ab
N412.26 ± 1.13 cd128.84 ± 4.26 b138.63 ± 2.30 a121.17 ± 2.26 d400.90 ± 9.23 bcd
Note: Note: W1, W2, and W3 represent 0.75, 1.0, and 1.25 times the crop water requirement (ETc), respectively; N1, N2, N3, and N4 represent 120, 220, 320, and 420 kg N hm−2, respectively. Values within the same column followed by different letters denote that there is significant difference among the different treatments at the 0.05 probability level.
Table 5. Tomato yield, IWP, and PFPN variations across different treatments at the final harvest.
Irrigation
Volume
Nitrogen
Amounts
Yield (t hm−2)IWP (kg m−3)PFPN (kg kg−1 N)
W1 (0.75 ETc)N151.45 ± 1.45 f22.94 ± 0.65 e 428.78 ± 12.12 c
N255.64 ± 2.62 f24.80 ± 1.17 d 252.92 ± 11.92 g
N362.62 ± 2.49 e 27.91 ± 1.11 bc195.69 ± 7.78 ij
N461.49 ± 1.45 e 27.41 ± 0.65 bc146.40 ± 3.45 k
W2(1.0 ETc)N179.76 ± 4.65 c26.67 ± 1.55 c664.69 ± 8.72 a
N285.34 ± 2.49 b28.53 ± 0.83 b 387.89 ± 11.34 d
N392.32 ± 3.28 a30.87 ± 1.10 a 288.50 ± 10.24 f
N490.95 ± 1.88 a30.41 ± 0.63 a 216.54 ± 4.48 hi
W3 (1.25 ETc)N165.77 ± 4.05 e17.59 ± 1.08 g 548.08 ± 12.76 b
N271.67 ± 2.75 d 19.17 ± 0.73 fg 325.79 ± 12.48 e
N372.96 ± 3.14 d19.51 ± 0.84 f 227.99 ± 9.81 gh
N472.20 ± 0.90 d19.31 ± 0.24 f171.90 ± 2.15 jk
Note: Note: W1, W2, and W3 represents 0.75, 1.0, and 1.25 times the crop water requirement (ETc), respectively; N1, N2, N3 and N4 represent 120, 220, 320 and 420 kg N hm−2, respectively. IWP: Irrigation water productivity. PFPN: Partial factor productivity of nitrogen. Values within the same column followed by different letters denote that there is significant difference among the different treatments at the 0.05 probability level.
Table 6. Regression equations of nitrogen application and irrigation amounts with yield, net photosynthetic rate, and total dry biomass cumulative of tomato.
Dependent VariableRegression EquationR2
YieldY1 = −0.0041 × X12 − 0.0002 × X22 − 0.0001 × X1 × X2 + 2.56 × X1 + 0.151 × X2 − 331.5210.9918
Net photosynthetic rateY2 = −0.0005 × X12 − 0.0001 × X22 + 0.3311 × X1 + 0.0348 × X2 − 34.16050.9780
Total dry biomass cumulativeY3 = −0.0089 × X12 − 0.0011 × X22 − 0.0003 × X1 × X2 + 6.0029 × X1 + 0.8607 × X2 − 719.66850.9897
Note: X1 and X2 represent nitrogen application rates (kg·hm−2) and irrigation amounts (mm), respectively.
Table 7. Effects of water and nitrogen treatments on the contents of Vc, LY, TSS, OA, and SP at the ripening phase of the first truss.
Irrigation
Volume
Nitrogen
Amounts
Vc (mg·kg−1)LY (mg·kg−1)TSS (%)OA(%)SP (%)
W1 (0.75 ETc)N114.20 ± 0.22 h23.48 ± 2.20 e4.93 ± 0.18 g0.43 ± 0.02 h15.9 ± 2.32 c
N214.33 ± 0.37 gh24.64 ± 1.15 e5.12 ± 0.19 g0.49 ± 0.01 efg17.40 ± 1.93 bc
N315.11 ± 0.30 g25.99 ± 1.88 de5.75 ± 0.30 de0.54 ± 0.02 cd19.19 ± 2.70 ab
N414.77 ± 0.44 gh24.54 ± 1.62 e5.22 ± 0.10 fg0.51 ± 0.02 def18.13 ± 2.26 abc
W2 (1.0 ETc)N117.63 ± 0.74 cd30.53 ± 1.28 bc5.60 ± 0.22 ef0.47 ± 0.02 fgh18.69 ± 1.39 abc
N218.52 ± 0.39 ab32.56 ± 1.56 ab6.40 ± 0.30 bc0.56 ± 0.03 cd19.47 ± 1.21 ab
N319.12 ± 0.23 a34.91 ± 1.86 a7.24 ± 0.19 a0.65 ± 0.03 a20.74 ± 0.77 a
N418.07 ± 0.47 bc32.98 ± 2.44 ab6.50 ± 0.26 bc0.62 ± 0.02 ab19.81 ± 0.99 ab
W3 (1.25 ETc)N116.16 ± 0.34 f28.56 ± 1.00 cd5.19 ± 0.10 fg0.45 ± 0.03 gh18.30 ± 0.67 abc
N216.85 ± 0.78 def29.69 ± 2.63 bc5.75 ± 0.37 de0.53 ± 0.02 de19.10 ± 0.88 ab
N317.43 ± 0.39 cde31.35 ± 1.79 bc6.63 ± 0.19 b0.58 ± 0.03 bc20.61 ± 0.69 a
N416.74 ± 0.29 ef30.19 ± 1.92 bc6.09 ± 0.41 cd0.48 ± 0.05 efg20.45 ± 1.04 a
Note: TSS, total soluble solids (°Brix); Vc, ascorbic acid; SP, soluble protein; LY, lycopene; OA, organic acids. W1, W2, and W3 represent 0.75, 1.0, and 1.25 times the crop water requirement (ETc), respectively; N1, N2, N3, and N4 represent 120, 220, 320, and 420 kg N hm−2, respectively. Values within the same column followed by different letters denote that there is significant difference among the different treatments at the 0.05 probability level.
Table 8. Eigenvalues and cumulative contribution proportions.
Serial NumberEigenvalueContribution (%)Cumulative Contribution (%)
P14.31186.2386.23
P20.4128.2394.46
P30.2284.5699.02
P40.0410.8299.84
P50.0080.16100
Table 9. Eigenvectors of correlation matrix.
IndicatorsEigenvectors
P1P2P3P4P5
X10.450−0.4930.3150.1450.659
X20.460−0.4250.1800.133−0.747
X30.4700.197−0.013−0.8600.022
X40.4150.7320.3760.389−0.001
X50.4390.048−0.8530.2660.085
Table 10. Comprehensive evaluation of tomato quality across different treatments at the ripening stage of the first truss.
Irrigation AmountsNitrogen
Application Rate
The First Principle Component (P1)The Second Principle Component (P2)Comprehensive Principle Component (P)Rank
W1 (0.75 ETc)N1−3.498−0.054−3.02112
N2−2.3620.528−1.99311
N3−0.7100.919−0.5368
N4−1.8420.678−1.53210
W2 (1.00 ETc)N1−0.151−1.161−0.2267
N21.660−0.4341.3964
N33.6110.3693.1441
N42.1300.3391.8652
W3 (1.25 ETc)N1−1.304−0.844−1.1949
N20.128−0.1290.1006
N31.8430.3441.6183
N40.495−0.5560.3815
Note: W1, W2, and W3 represent 0.75, 1.0, and 1.25 times the crop water requirement (ETc), respectively; N1, N2, N3, and N4 represent 120, 220, 320, and 420 kg N hm−2, respectively.
Disclaimer/Publisher’s Note: The statements, opinions and data contained in all publications are solely those of the individual author(s) and contributor(s) and not of MDPI and/or the editor(s). MDPI and/or the editor(s) disclaim responsibility for any injury to people or property resulting from any ideas, methods, instructions or products referred to in the content.

