Article

Metabolomic and Transcriptomic Analyses Reveal the Response Mechanism of Seed Germination in Macadamia

1
Guizhou Institute of Subtropical Crops, Guiyang 550025, China
2
Yunnan Institute of Tropical Crops, Jinghong 666100, China
3
Key Laboratory of Tropical Fruit Biology, Ministry of Agriculture & Rural Affairs, South Subtropical Crops Research Institute, Chinese Academy of Tropical Agricultural Sciences, Zhanjiang 524091, China
4
Guangxi South Subtropical Agricultural Science Research Institute, Longzhou 532415, China
*
Authors to whom correspondence should be addressed.
These authors contributed equally to this work.
Horticulturae 2025, 11(5), 519; https://doi.org/10.3390/horticulturae11050519
Submission received: 25 March 2025 / Revised: 6 May 2025 / Accepted: 8 May 2025 / Published: 11 May 2025
(This article belongs to the Section Propagation and Seeds)

Abstract

:
Seed germination is a crucial developmental event in the plant life cycle. Proper germination significantly impacts the yield and quality. This study focuses on macadamia nuts, exploring the physiological, metabolic, and molecular biological characteristics during seed germination. The water content of macadamia seeds reached a peak in the seed imbibition stage, followed by a gradual decline. Key components such as fats, proteins, and soluble sugars decreased consistently. The enzyme activities of superoxide dismutase (SOD), peroxidase (POD), catalase (CAT), and glutathione peroxidase (GPX) increased throughout seed germination, reaching peak levels in leaf growth stages. A total of 1523 metabolites and 13,035 differentially expressed genes (DEGs) were detected by transcriptomic and metabolomic analyses, among which 1320 were transcription factors. The transcriptome and metabolome integration analysis showed significant overlaps between DEGs and differential metabolites in pathways such as phenylpropanoid biosynthesis. Quercetin, trifolin, rutin, myricetin, and quercetin 3-beta-D-sophoroside may play important roles in seed germination. FG2 and CYP75A/CYP75B1 were key genes in the flavonoid pathway. Hormones such as auxin (IAA), cytokinin (CTK), gibberellin (GA), and abscisic acid (ABA) exhibited stage-specific changes during germination. This study provided important theoretical basis and practical guidance for optimizing seed germination rates and enhancing stress resistance capabilities.

1. Introduction

Seed germination serves as the bridge connecting seed formation to seedling growth. The embryo absorbs water and expands under favorable environmental conditions, triggering internal biochemical processes. Eventually, it breaks through the seed coat and develops into a new plant organism. This process is crucial for the reproduction of plants because the success rate and speed of seed germination directly impact the population ability to spread and maintain genetic diversity [1]. For cash crops, a high germination rate means fewer wasted seeds and increased seedling output, which is particularly crucial for large-scale cultivation. By selecting seeds with high germination rates, growers can effectively manage planting resources and reduce costs. In orchard farming, accelerating seed germination allows for earlier transplantation and establishment of seedlings, thereby shortening the production cycle and achieving economic benefits more quickly [2]. Optimizing the seed germination process through scientific research and technological innovation is crucial. It enhances planting efficiency, ensures crop yield and quality, and strengthens market competitiveness [3].
The process of seed germination is complete when the embryonic root emerges. A radicle develops into roots, which begin to grow into the soil to absorb water and nutrients. A cotyledon develops into a shoot, growing upwards through the soil surface to initiate photosynthesis. This process is influenced by various internal and external factors, including the inherent conditions (phytohormones, endosperm decay) and environmental factors (temperature, moisture, light, soil properties) [4]. Energy metabolism plays a dominant role in regulating seed development by controlling the synthesis, hydrolysis, and transformation of storage compounds such as starch, storage proteins, and lipids, providing the material and energy foundation for seed development [5]. In the early stages of seed germination, anaerobic respiration is the primary source of energy. As seeds absorb water and increase their ability to exchange oxygen, aerobic metabolic pathways such as glycolysis and the tricarboxylic acid (TCA) cycle gradually become the main energy sources [6]. Plant hormones such as gibberellins (GAs), abscisic acid (ABA), and ethylene play crucial roles in regulating these metabolic processes [7]. They influence enzyme activity and gene expression, thereby regulating the breakdown of storage materials and energy production. GA, cytokinin (CK), and ABA are particularly important in regulating early seed germination, while auxin (IAA) and related growth substances primarily participate in the later stages of seed germination [1]. GA is one of the key hormones that promotes seed germination [8]. It enhances the synthesis of hydrolytic enzymes such as amylases, promoting the breakdown of stored reserves like starch and proteins in seeds, thereby providing the energy and material foundation for seed germination [9]. ABA, in contrast, acts antagonistically to GA. It mainly maintains seed dormancy and inhibits premature germination [10]. Under favorable germination conditions, the concentration of ABA decreases, thereby relieving its inhibition on germination. The balance between ABA and GA is a crucial factor determining whether seeds germinate or remain dormant [11].
Transcriptomic and metabolomic co-analysis can link phenotypic changes to molecular mechanisms, revealing the complex biological processes and regulatory networks involved in seed germination. It has revealed that differences in the reactive oxygen species (ROS) scavenging capacity mediated by ascorbate peroxidase (APX), glutathione peroxidase (GPX), and glutathione S-transferase (GST) may directly lead to variations in seed germination and seedling growth rates between two rice varieties [12]. The regulation of plant hormones and the accumulation of flavonoids could play a significant role in enhancing the survival of Tamarix hispida seeds under salt or arid desert conditions [13]. The plant hormone signaling, the metabolism of starch and sucrose, and photosynthetic processes play a crucial role in the seedlings’ establishment and subsequent growth [14], because they jointly participate in the generation, storage, and transportation of energy, as well as the synthesis and transformation of substances, all of which are necessary processes for the formation and development of seedlings. Pathways involved in phenylpropanoid and flavonoid biosynthesis, as well as starch and sucrose metabolism, play crucial roles in seed germination [15]. In another study on poplar trees, it was found that during the growth process from early seed germination to later stages of germination, genes associated with carbohydrate metabolism were activated first, followed by genes related to lipid metabolism, and subsequently, genes involved in protein metabolism [16]. The seed germination of Michelia chapensis was regulated by the synergies of biological pathways of hormonal signal transduction, starch and sucrose metabolism, energy supply (glycolysis, pyruvate metabolism, the tricarboxylic acid cycle, and oxidative phosphorylation), and the biosynthesis of secondary metabolites (phenylpropanoid, flavonoid, stilbenoid, diarylheptanoid and gingerol), etc. [17].
Macadamia integrifolia, native to Australia, are globally recognized as high-value nuts renowned for their rich nutritional value and distinctive flavor. They contain high-quality plant fats, proteins, vitamins, minerals, and antioxidants, offering various health benefits to humans [18]. Besides their nutritional value, Macadamia spp. also hold significant economic value and serve as a crucial income source for many farmers. China’s macadamia cultivation area exceeds 330,000 hectares, and the macadamia industry has played a pivotal role in the poverty alleviation campaign in Southwest China, driving economic growth and rural revitalization in ecologically fragile regions [19]. Seed germination directly impacts the propagation and nut yield of macadamia trees. This study aims to use transcriptomic and metabolomic co-analysis to reveal key molecular events and metabolic pathway changes during the seed germination process of macadamia. It aims to provide scientific insights for improving germination rates, optimizing cultivation practices, and promoting the sustainable development of the macadamia industry.

2. Materials and Methods

2.1. Plant Materials and Treatment

On 22 September 2022, seeds of the macadamia nut variety O.C were collected from the germplasm repository at the Subtropical Crops Research Institute in Guizhou Province. After removing the green husks, the seeds were coated with carbendazim, which has antifungal activity, and immediately sown onto sand beds. The sand beds were watered at 9:00 a.m. every day to keep the sand moist and allow the seeds to fully absorb water and germinate. Samples were collected in different stages: the seeding stage (A), the seed imbibition stage (B), the radicle growth stage (C), and the leaf growth stage (D)—for physiological indexes, transcriptomic analysis, and metabolomic analysis.

2.2. Determination of Physiological Indexes

The water content of seeds was measured according to the method described by Wei et al. [20]. The soluble sugars, soluble proteins, crude fats, crude proteins, the total amino and the activities of superoxide dismutase (SOD), peroxidase (POD), catalase (CAT), ascorbate peroxidase (APX), and glutathione peroxidase (GPX) of the macadamia seeds were measured using the commercial kits. The contents of ABA, GA, CTK, and IAA were assayed by indirect enzyme-linked immunosorbent assay (ELISA). All kits are sourced from Shanghai Preferred Biology Co., Ltd. (Shanghai, China).

2.3. Metabolite Profiling and Data Analysis

Tissues (100 mg) were individually grounded with liquid nitrogen and the homogenate was resuspended with prechilled 80% methanol by well vortex. After being incubated on ice for 5 min, the samples were centrifuged at 15,000× g for 20 min at 4 °C. A portion of the supernatant was diluted to achieve a final methanol concentration of 53% using LC-MS-grade water. The samples were subsequently transferred to a fresh tube and then were centrifuged at the same speed and temperature for an additional 20 min. Finally, the supernatant was injected into the LC-MS/MS system for analysis [21]. Metabolites were ranked based on their OPLS model VIP scores, with p < 0.05 and VIP ≥ 1 denoting significant differential metabolites.

2.4. Transcriptome Sequencing and Analysis

The RNA extraction from macadamia nut seeds was carried out with the RNAprep Pure Plant Plus Kit, following the standard protocol. RNA quality was assessed for purity using the NanoPhotometer®® spectrophotometer (IMPLEN, Westlake Village, CA, USA) and for integrity using the RNA Nano 6000 Assay Kit on the Bioanalyzer 2100 system (Agilent Technologies, Santa Clara, CA, USA). Sequencing libraries were generated using NEBNext®® UltraTM RNA Library Prep Kit for Illumina®® (NEB, Ipswich, MA, USA) following the manufacturer’s recommendations and index codes were added to attribute sequences to each sample. The library preparations were sequenced on an Illumina Novaseq platform and 150 bp paired-end reads were generated. FPKM (Fragments Per Kilobase of Exon Per Million Mapped Reads) of each gene was calculated based on the length of the gene and read count d to this gene. Differential expression analysis was performed using the DESeq2 R package [22]. Corrected p-value of 0.05 and absolute fold change of 2 were set as the threshold for significantly differential expression.

2.5. GO and KEGG Enrichment Analysis of Differentially Expressed Genes

Gene Ontology (GO) enrichment analysis of differentially expressed genes was implemented by the cluster Profiler R package (R 4.2.0). GO terms with corrected p value less than 0.05 were considered significantly enriched by differentially expressed genes. We used KOBAS database and cluster R package (R 4.2.0) to analyze the enrichment of differentially expressed genes in the Kyoto Encyclopedia of Genes and Genomes (KEGG) pathway.

2.6. Quantitative Real-Time PCR (qRT-PCR)

The same RNA samples used in RNA-Seq were used for qRT-PCR. Four DEGs were selected for qRT-PCR analysis with actin (β-actin) as the internal reference gene. The cDNAs were obtained with the reverse transcription kit (R223; Vazyme Biotech, Nanjing, China) following the instructions. The 20 µL reaction system and procedure refer to the previously reported paper [23]. Relative gene expression levels were analyzed according to the 2−ΔΔCt method. Each sample included three biological replicates. The primer pairs are listed in Supplementary Table S1.

2.7. Statistical Analysis

The average value and standard error of the biological replicates (n = 3) were calculated using Microsoft Excel 2019. SPSS 22.0 software was used for the difference analysis (ANOVA) between samples, and significant differences were calculated by Duncan–s test at p < 0.05. On 24 September 2024, principal component analysis (PCA) and orthogonal partial least square discriminant analysis (OPLS-DA) of the sample metabolite data were conducted by using online software (https://www.bioinformatics.com.cn/). We used TBtools software (version 1.068) to draw heat maps and conduct joint analysis. Graphs were plotted using Microsoft Excel 2019 and GraphPad Prism (Version 8.0.2).

3. Results

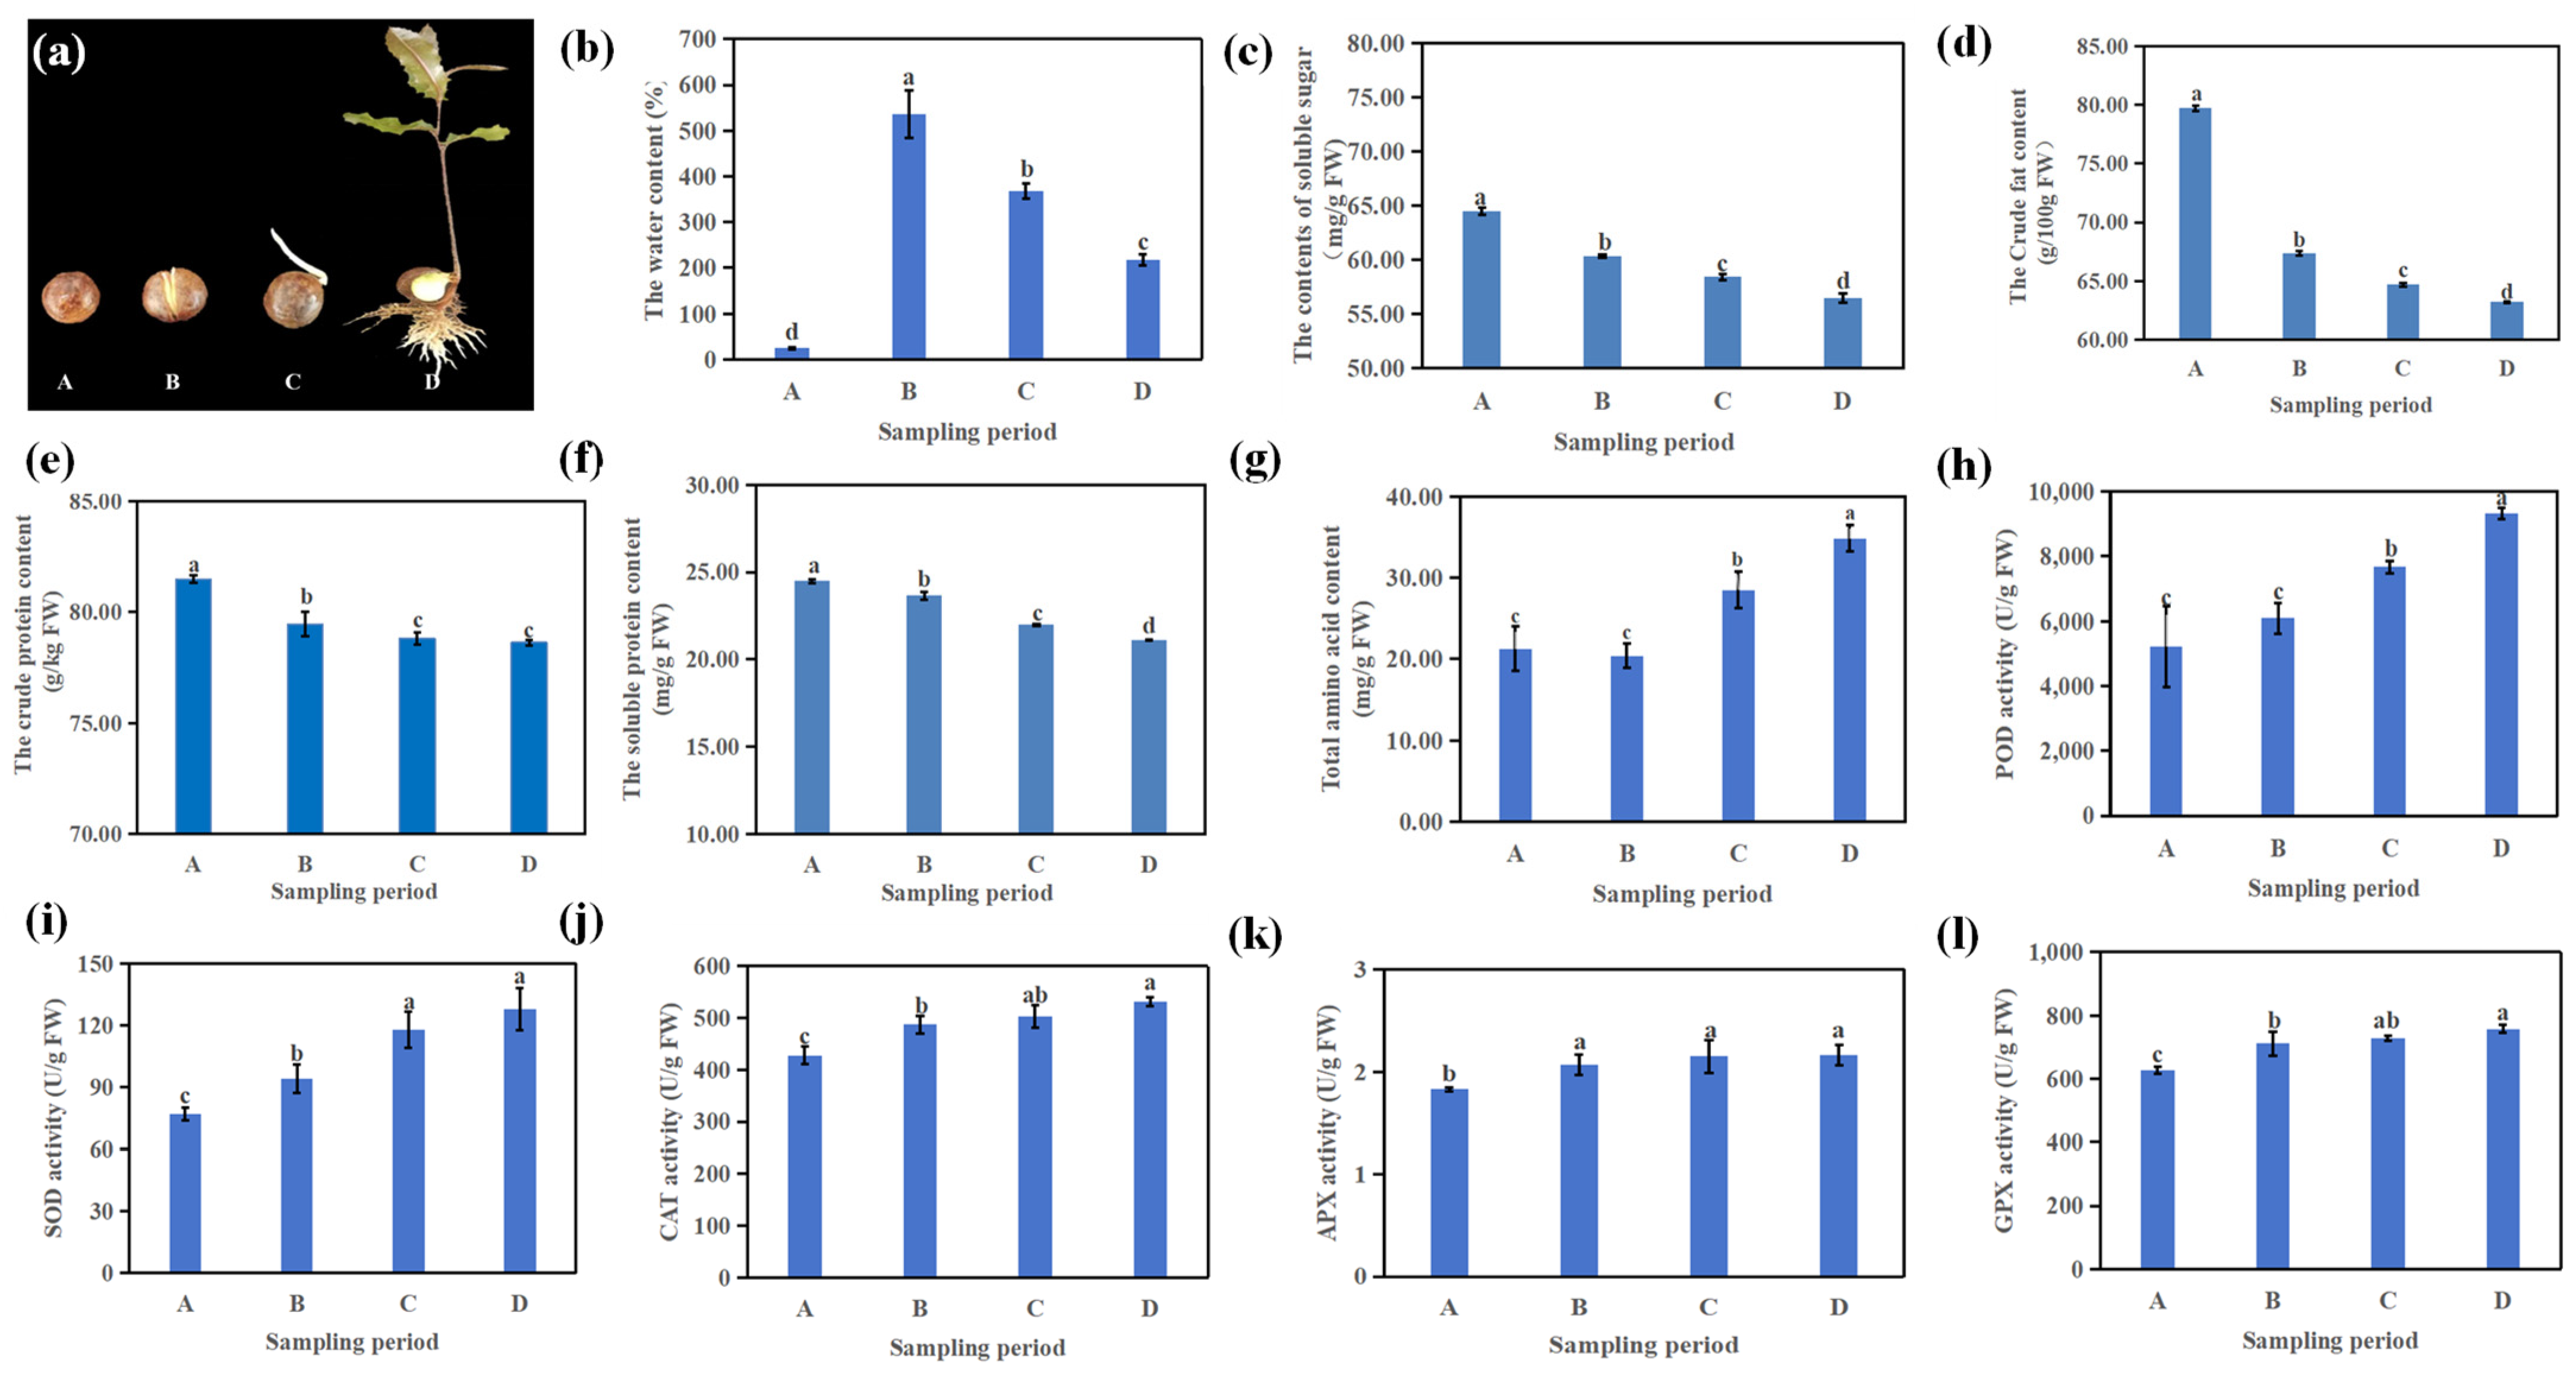
3.1. Physiological Changes During Macadamia Seed Germination

This study selected four stages during the germination process of macadamia for investigation: the seeding stage (A), the seed imbibition stage (B), the radicle growth stage (C), and the leaf growth stage (D) (Figure 1a). The results shows that the seed water content initially increased and then decreased, reaching its peak in the seed imbibition stage. As essential components of macadamia seeds, the content of soluble sugar, the crude fats, crude proteins, and soluble protein contents gradually decreased during the germination of macadamia seeds, but the total amino acid content increased gradually with the germination of seeds. Compared to the seeding stage, the soluble sugar, crude fat, crude protein and soluble protein of the leaf growth stage decreased by 12.42%, 20.29%, 8.15%, and 3.50%, respectively, and the total amino acid content increased by 63.79%. Overall, these results indicated that macadamia seed germination requires substantial consumption of proteins, sugars, and fats for energy supply. The activities of SOD, POD, CAT, and GPX increased with macadamia seed germination, reaching their highest levels in the leaf growth stage. Plant hormones play an important role in the process of seed germination. In general, the contents of IAA, CTK, and GA increased with the process of seed germination, but the contents of ABA decreased gradually.

3.2. Metabolomic Analysis During Macadamia Seed Germination

Based on non-targeted metabolomic analysis, we identified a total of 1523 accumulated metabolites across all samples, with 944 metabolites detected in positive ion mode (POS) and 579 in negative ion mode (NEG). OPLS-DA, a supervised multivariate statistical method, effectively filters out irrelevant influences to identify differential metabolites. Using OPLS-DA, pairwise comparisons of A, B, C, and D were analyzed and plotted on score plots, which clearly indicated significant separation among different comparison groups (Figure 2a). All metabolites were annotated using the KEGG database br08001 to assign biological roles, and the percentage composition of each biological role was calculated and plotted in a stacked bar chart. The main components of metabolites included organic acids, peptides, carbohydrates, lipids, vitamins and cofactors, nucleic acids, steroids, hormones and signaling substances, antibiotics, etc. (Figure 2b). Among the top 20 metabolites, the levels of oleamide, L-glutathione (reduced form), DL-tryptophan, DL-arginine, L-glutamic acid, and proline were relatively high, indicating their importance during seed germination (Figure 2c). Further screening of differential metabolites revealed that from A to B, 114 metabolites were up-regulated and 225 were down-regulated; from B to C, 95 metabolites were up-regulated and 38 were down-regulated; and from C to D, 150 metabolites were up-regulated and 154 were down-regulated (Figure 2d–f). There were 10 kinds of differential metabolites that were common in the seed germination stage (Figure 2d–g). This suggested that the number and types of metabolites in different stages of seed germination were different.
The differential metabolites from the A, B, C, and D groups were matched against the KEGG database to obtain pathway information (Figure 3a). Enrichment analysis was performed on the annotated results to identify pathways with significantly enriched differential metabolites. Pathways with the most differential metabolites primarily involves in biosynthesis of cofactors, nucleotide metabolism, biosynthesis of amino acids, purine metabolism, and phenylpropanoid biosynthesis. Pathways showing a higher enrichment ratio included nucleotide metabolism, TCA cycle, beta-alanine metabolism, flavone and flavonol biosynthesis, pantothenate and CoA biosynthesis, and carbon fixation in photosynthetic organisms. We further analyzed the differential metabolites in different seed germination stages (Figure 3b). The differential metabolites in A vs. B were mainly uniquely enriched in biosynthesis of cofactors, vitamin B6 metabolism, glycine, serine and threonine metabolism, valine, leucine and isoleucine biosynthesis, and arginine biosynthesis. The differential metabolites in B vs. C were mainly uniquely enriched in pentose phosphate pathway, zeatin biosynthesis, flavone and flavonol biosynthesis, biosynthesis of secondary metabolites, carbon metabolite and monoterpenoid biosynthesis. The differential metabolites in C vs. D were mainly uniquely enriched in pyrimidine metabolism, TCA cycle, and C5-branched dibasic acid metabolism. These results indicate that the seed imbibition may change from maintaining basic functions to more amino acid synthesis and vitamin synthesis. However, the germination process of hypocotyl involves more processes such as sugar metabolism and synthesis of secondary metabolites. During leaf growth, seed metabolism may be more related to core metabolic pathways such as energy production and carbon metabolism. This change in metabolic activity may be closely related to the specific functions and needs of different tissues and organs during growth and development.

3.3. Transcriptome Analysis During Macadamia Seed Germination

3.3.1. Analysis of Transcriptome Sequencing Results During Seed Germination

Transcriptome sequencing was performed on samples of macadamia seeds at different stages of germination, and after data filtering and quality control, a total of 40.05–45.58 million clean reads were obtained (Table 1). The Q20 and Q30 statistics of clean reads in the available libraries were greater than 96.83% and 91.18%, respectively. Sequence comparison of clean reads of each sample with the reference genome of macadamia GTF file demonstrated that the alignment rate ranged from 88.60% to 94.50%. By comparison, we identified a total of 28,759 known genes (75.12%) (28,759/38,284) and predicted 167 new genes not included in the reference genome. Differentially expressed genes (DEGs) were identified based on the differences in gene expression in different samples, and were functionally annotated and enriched for analysis.
We performed principal component analysis and intragroup correlation on the transcriptome data of 12 samples. Principal component analysis results showed that PC1 and PC2 explained 30.13% and 20.15% of the gene expression variation across all samples, respectively (Figure 4a). Hierarchical clustering heatmap analysis demonstrated high correlation (R2 > 0.87) among biological replicates from each time point (Figure 4b). In order to verify the RNA-Seq data, four genes were analyzed by qRT-PCR (Figure 4c–f). The results of the RT-qPCR of the four genes were consistent with the RNA-Seq data and indicated that the qRT-PCR and RNA-Seq data were highly correlated and presented consistency in the up-regulation and down-regulation of gene expression. These results indicated that the RNA-Seq data were reliable.

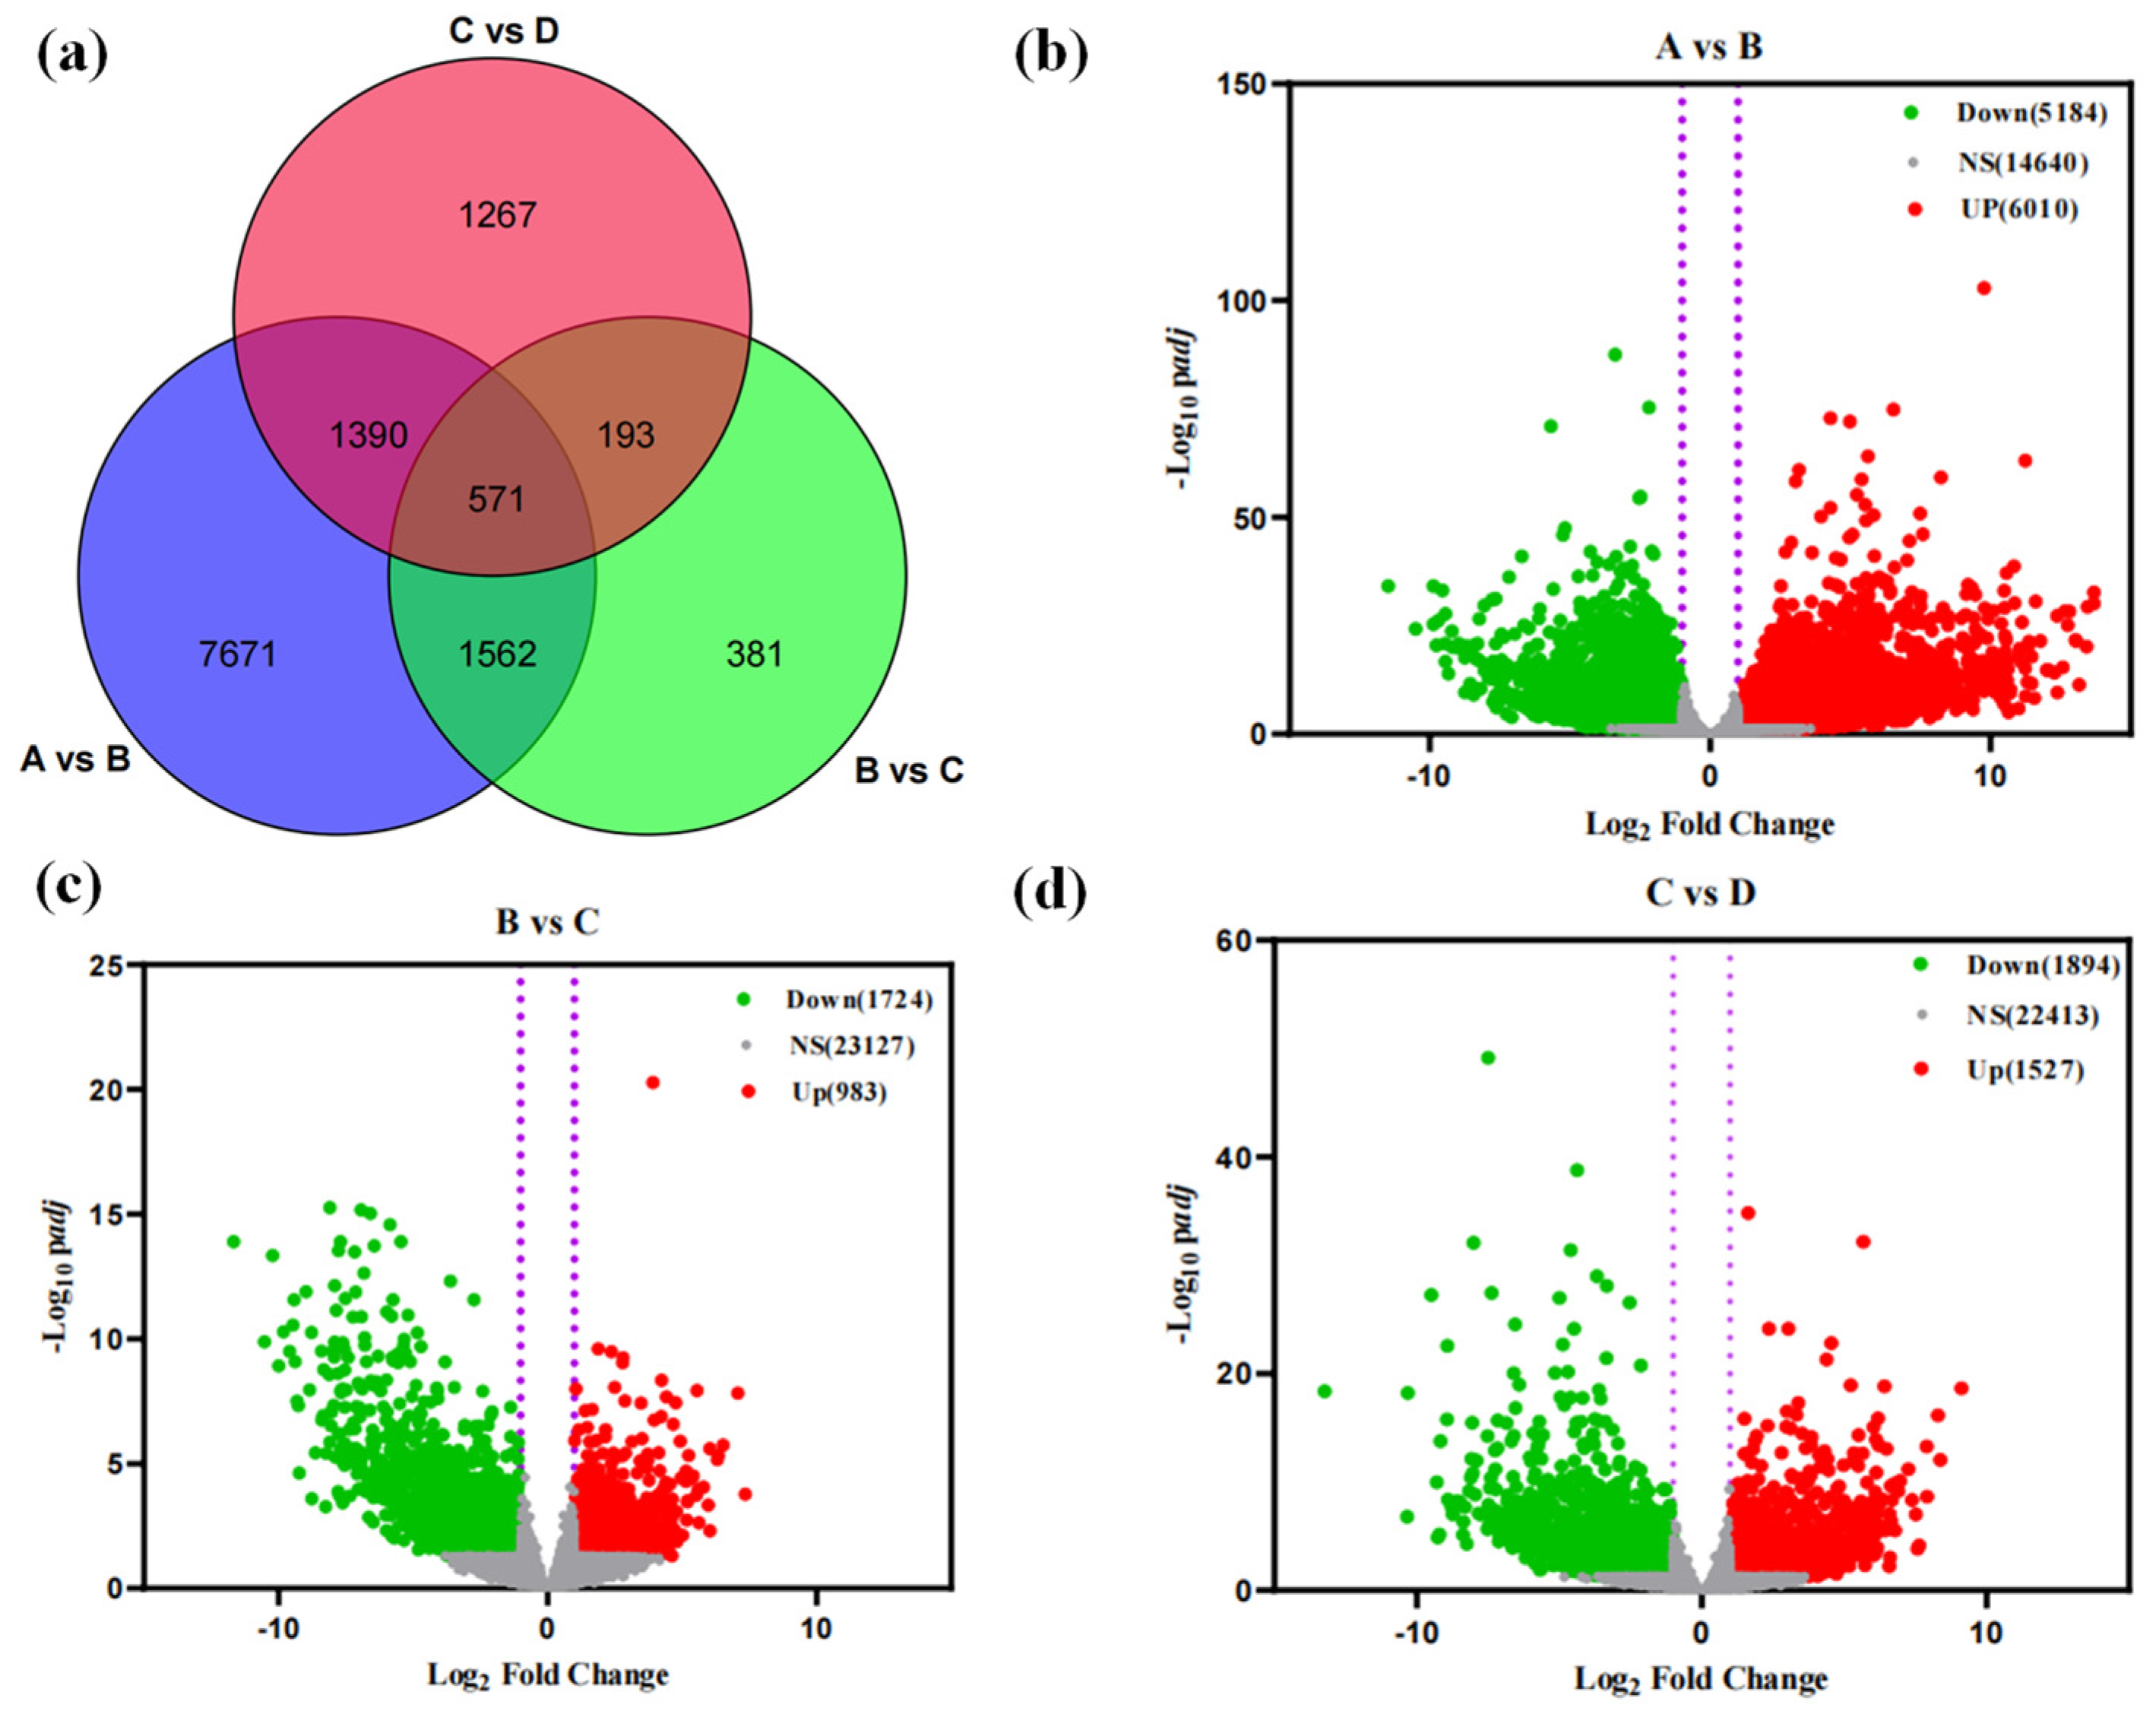
3.3.2. Differential Gene Screening and Functional Annotation

Differential expression analysis at four stages of macadamia seed germination identified a total of 13,035 genes, of which 571 were commonly expressed (Figure 5a). From A to B, 11,194 DEGs were detected (6010 up-regulated, 5814 down-regulated); from B to C, 2707 DEGs were identified (983 up-regulated, 1724 down-regulated); and from C to D, 3421 DEGs were found (1527 up-regulated, 1894 down-regulated) (Figure 5d). The number of induced genes showed a significant difference among different stages, indicating a fluctuating trend of up-regulation and down-regulation over time, with the most active genes involved in the seed imbibition stage.

3.3.3. GO and KEGG Enrichment Analyses

Based on the GO database, we annotated the functions of DEGs, identifying 647 GO terms significantly enriched (p < 0.05) in comparisons A vs. B, B vs. C, and C vs. D, categorized into biological processes, molecular functions, and cellular components (Figure 6a,b). Among them, 35 GO terms were commonly enriched, mainly in aspects such as UDP−glycosyltransferase activity, transferase activity transferring hexosyl groups, small molecule binding, response to water deprivation, response to oxidative stress, response to organonitrogen compound, response to heat, response to fungus, hormone-mediated signaling pathway, cellular amino acid metabolic process, and abscisic acid-activated signaling pathway.
Further analysis using KEGG pathways explored the expression of DEGs across different germination stages (Figure 6c,d). Initially, pathways were filtered with padj < 0.05 as the criterion, resulting in 106 enriched pathways in A vs. B, B vs. C, and C vs. D, with 33 pathways commonly enriched. These pathways were primarily enriched in biosynthesis of cofactors, carbon metabolism, biosynthesis of amino acids, ribosome, protein processing in endoplasmic reticulum, plant hormone signal transduction, MAPK signaling pathway, cysteine and methionine metabolism, plant–pathogen interaction, and starch and sucrose metabolism. Specifically, A vs. B had 27 unique pathways enriched, focusing on oxidative phosphorylation, nucleocytoplasmic transport, purine metabolism mRNA surveillance pathway, cell cycle, ribosome biogenesis in eukaryotes, cellular senescence, AMPK signaling pathway, proteasome, and phagosome. B vs. C had 15 unique pathways enriched, including reactive oxygen species, sphingolipid signaling pathway, sulfur metabolism, phenylalanine metabolism, galactose metabolism, tyrosine metabolism, metabolism of xenobiotics by cytochrome P450, carotenoid biosynthesis, and tropane, piperidine, and pyridine alkaloid biosynthesis. C vs. D had three unique pathways enriched, focusing on arginine and proline metabolism, PPAR signaling pathway, and biosynthesis of unsaturated fatty acids.

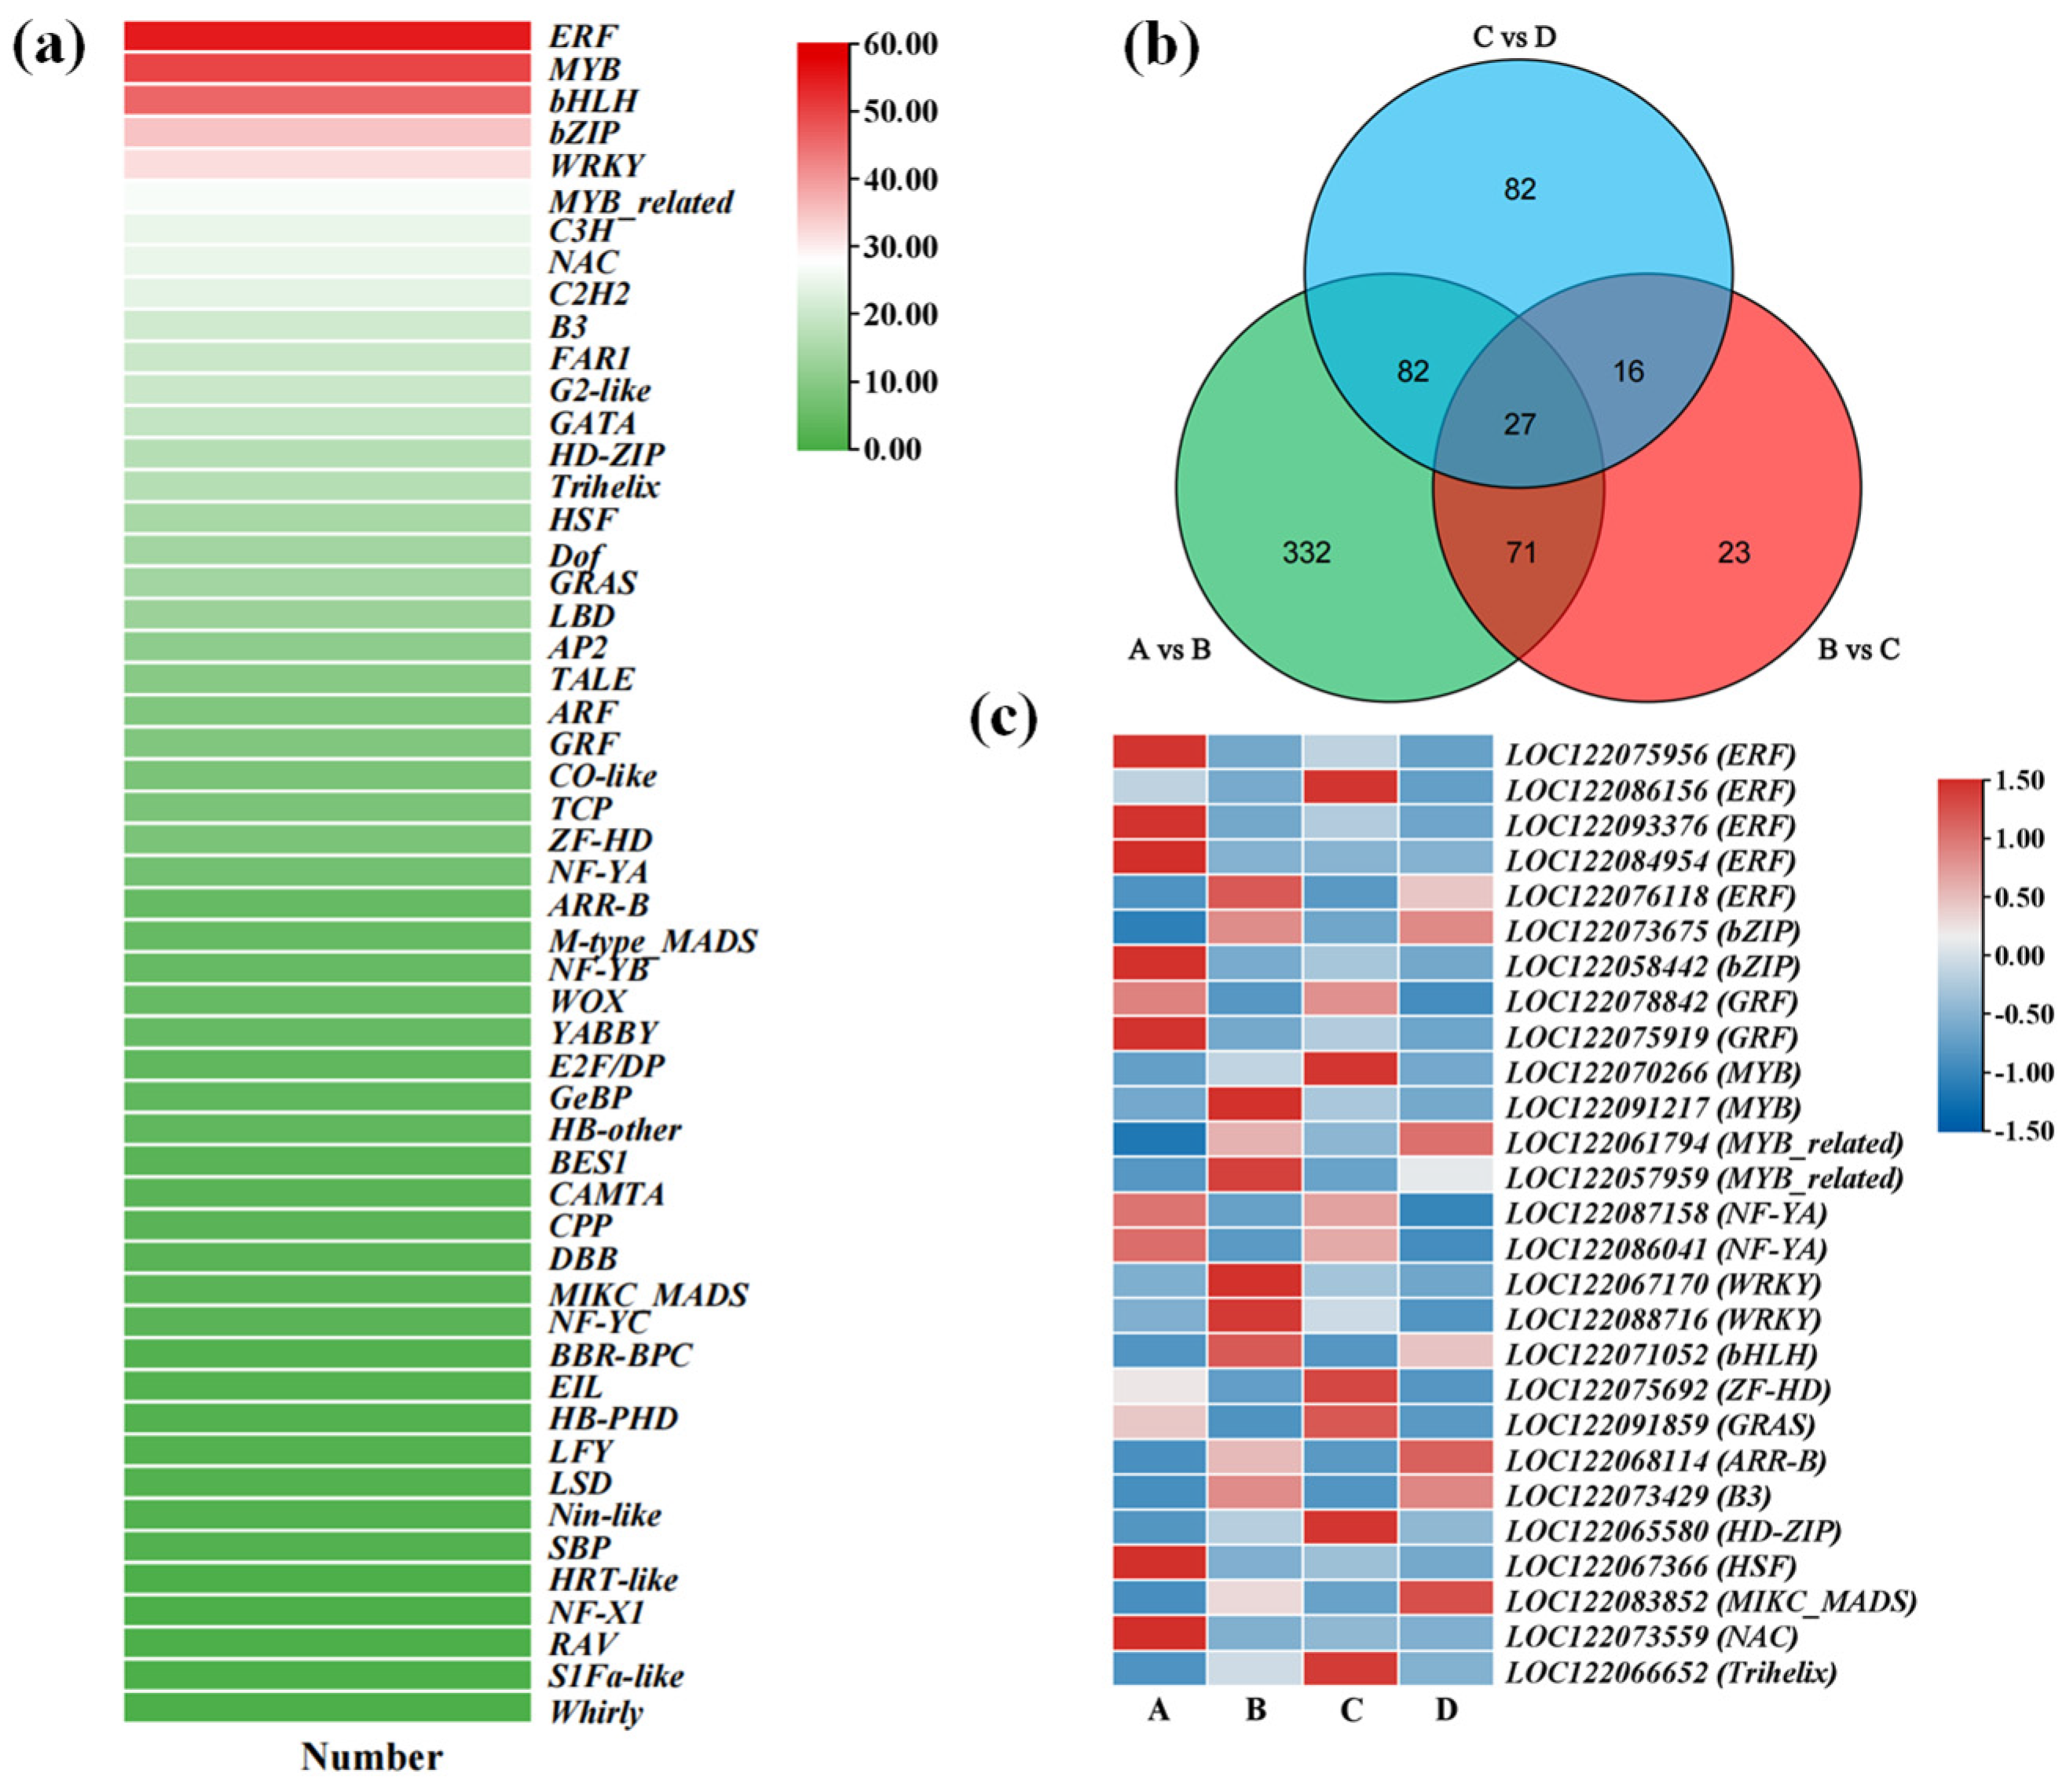
3.3.4. Expression Patterns of Transcription Factors During Macadamia Seed Germination

Transcription factors (TFs) play crucial roles in plant seed germination by regulating the expression levels of target genes. In this study, a total of 1320 TFs with different expression abundances were detected during the seed germination. Among them, 633 TFs showed significant differences in expression among the three comparison groups (Figure 7). Based on the Plant TFDB database, these TFs were classified into 53 families. In terms of the number of detected transcription factors, the ERF, MYB, bHLH, bZIP, and WRKY transcription factor families accounted for a relatively high percentage of the total number of transcription factors, which were 55, 50, 46, 35, and 32, respectively, suggesting that these transcription factors play an important role in the seed germination process. We statistically analyzed the transcription factors of each comparison group and found that the number of transcription factors shared among the three comparison groups was 27, and a large number of these transcription factors differed significantly at different germination stages of seeds, especially the ERF family of transcription factors.

3.4. Transcriptome and Metabolome Association Analysis

We analyzed all the significantly enriched pathways in the transcriptome and metabolome by Venn diagram (Figure 8a), and found that 25 pathways were co-enriched in the two omics. It is mainly enriched in the citrate cycle; the biosynthesis of amino acids; phenylalanine, tyrosine, and tryptophan biosynthesis; starch and sucrose metabolism; flavonoid biosynthesis; flavone and flavonol biosynthesis; carbon metabolism; phenylpropanoid biosynthesis; fatty acid biosynthesis; glutathione metabolism; and other metabolic pathways (Figure 8b). The results showed that these pathways were the key metabolic pathways in the germination process of macadamia seeds, providing necessary energy and amino acids for seed germination.

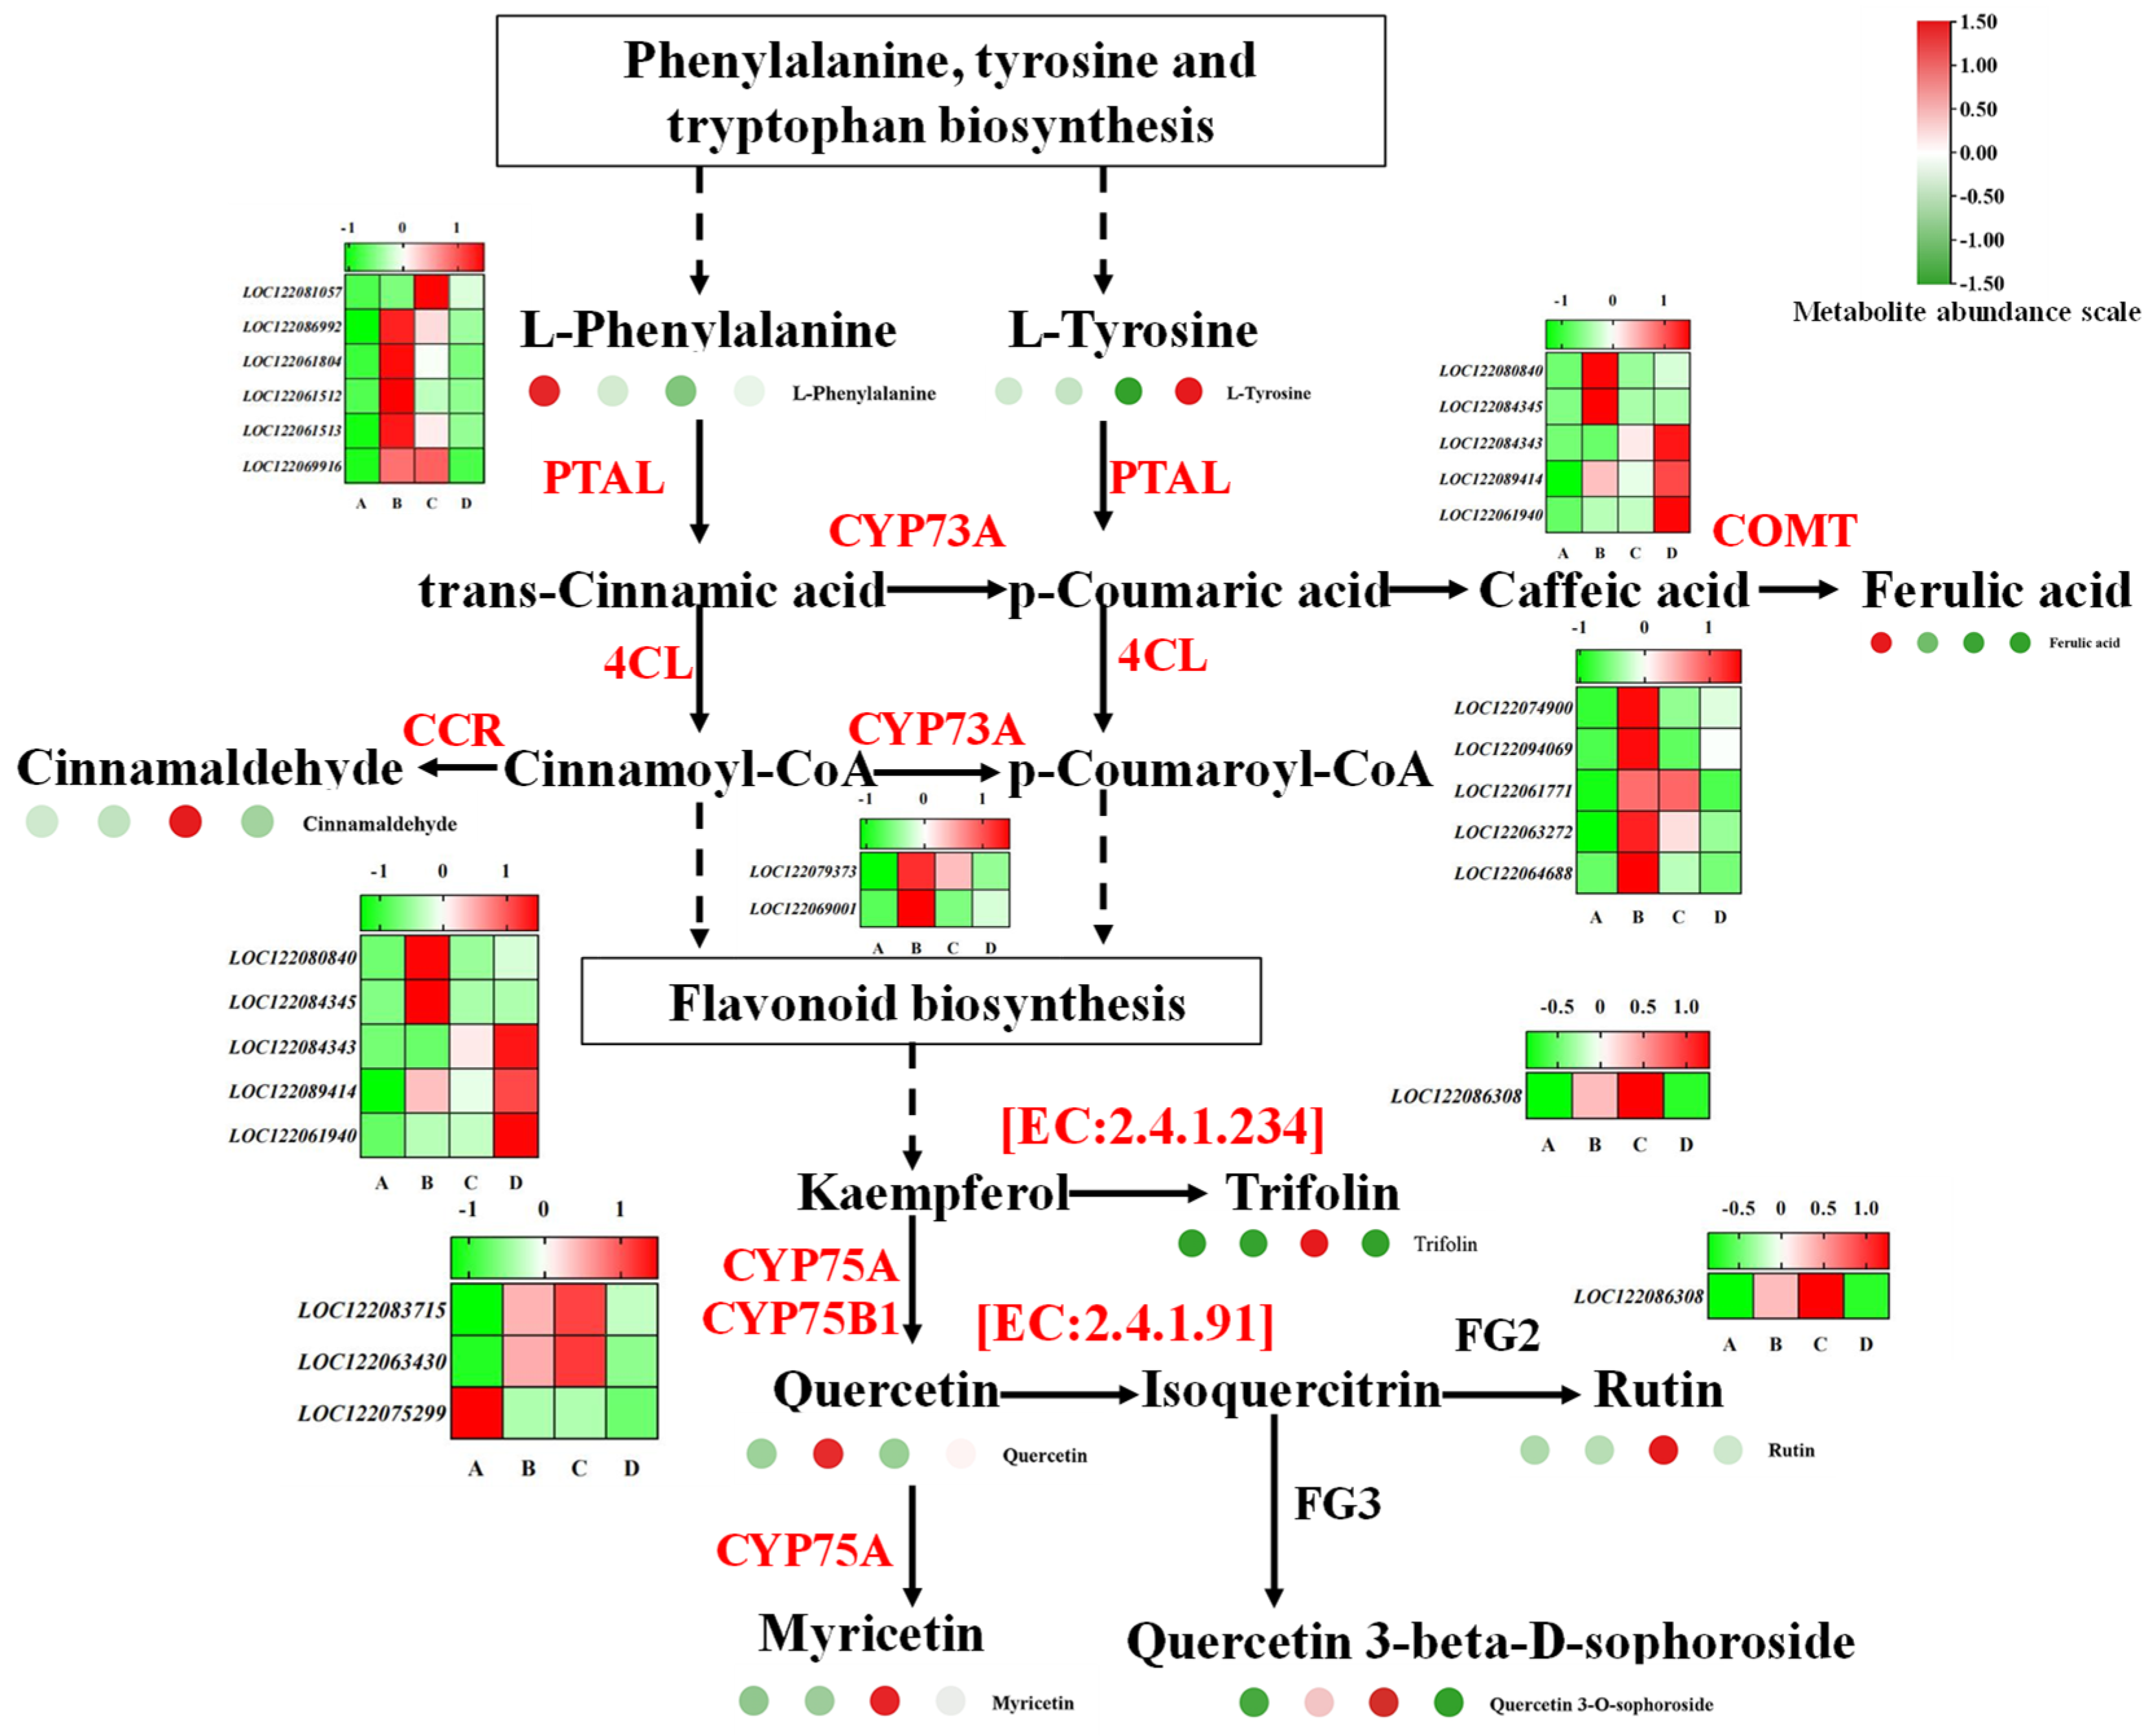
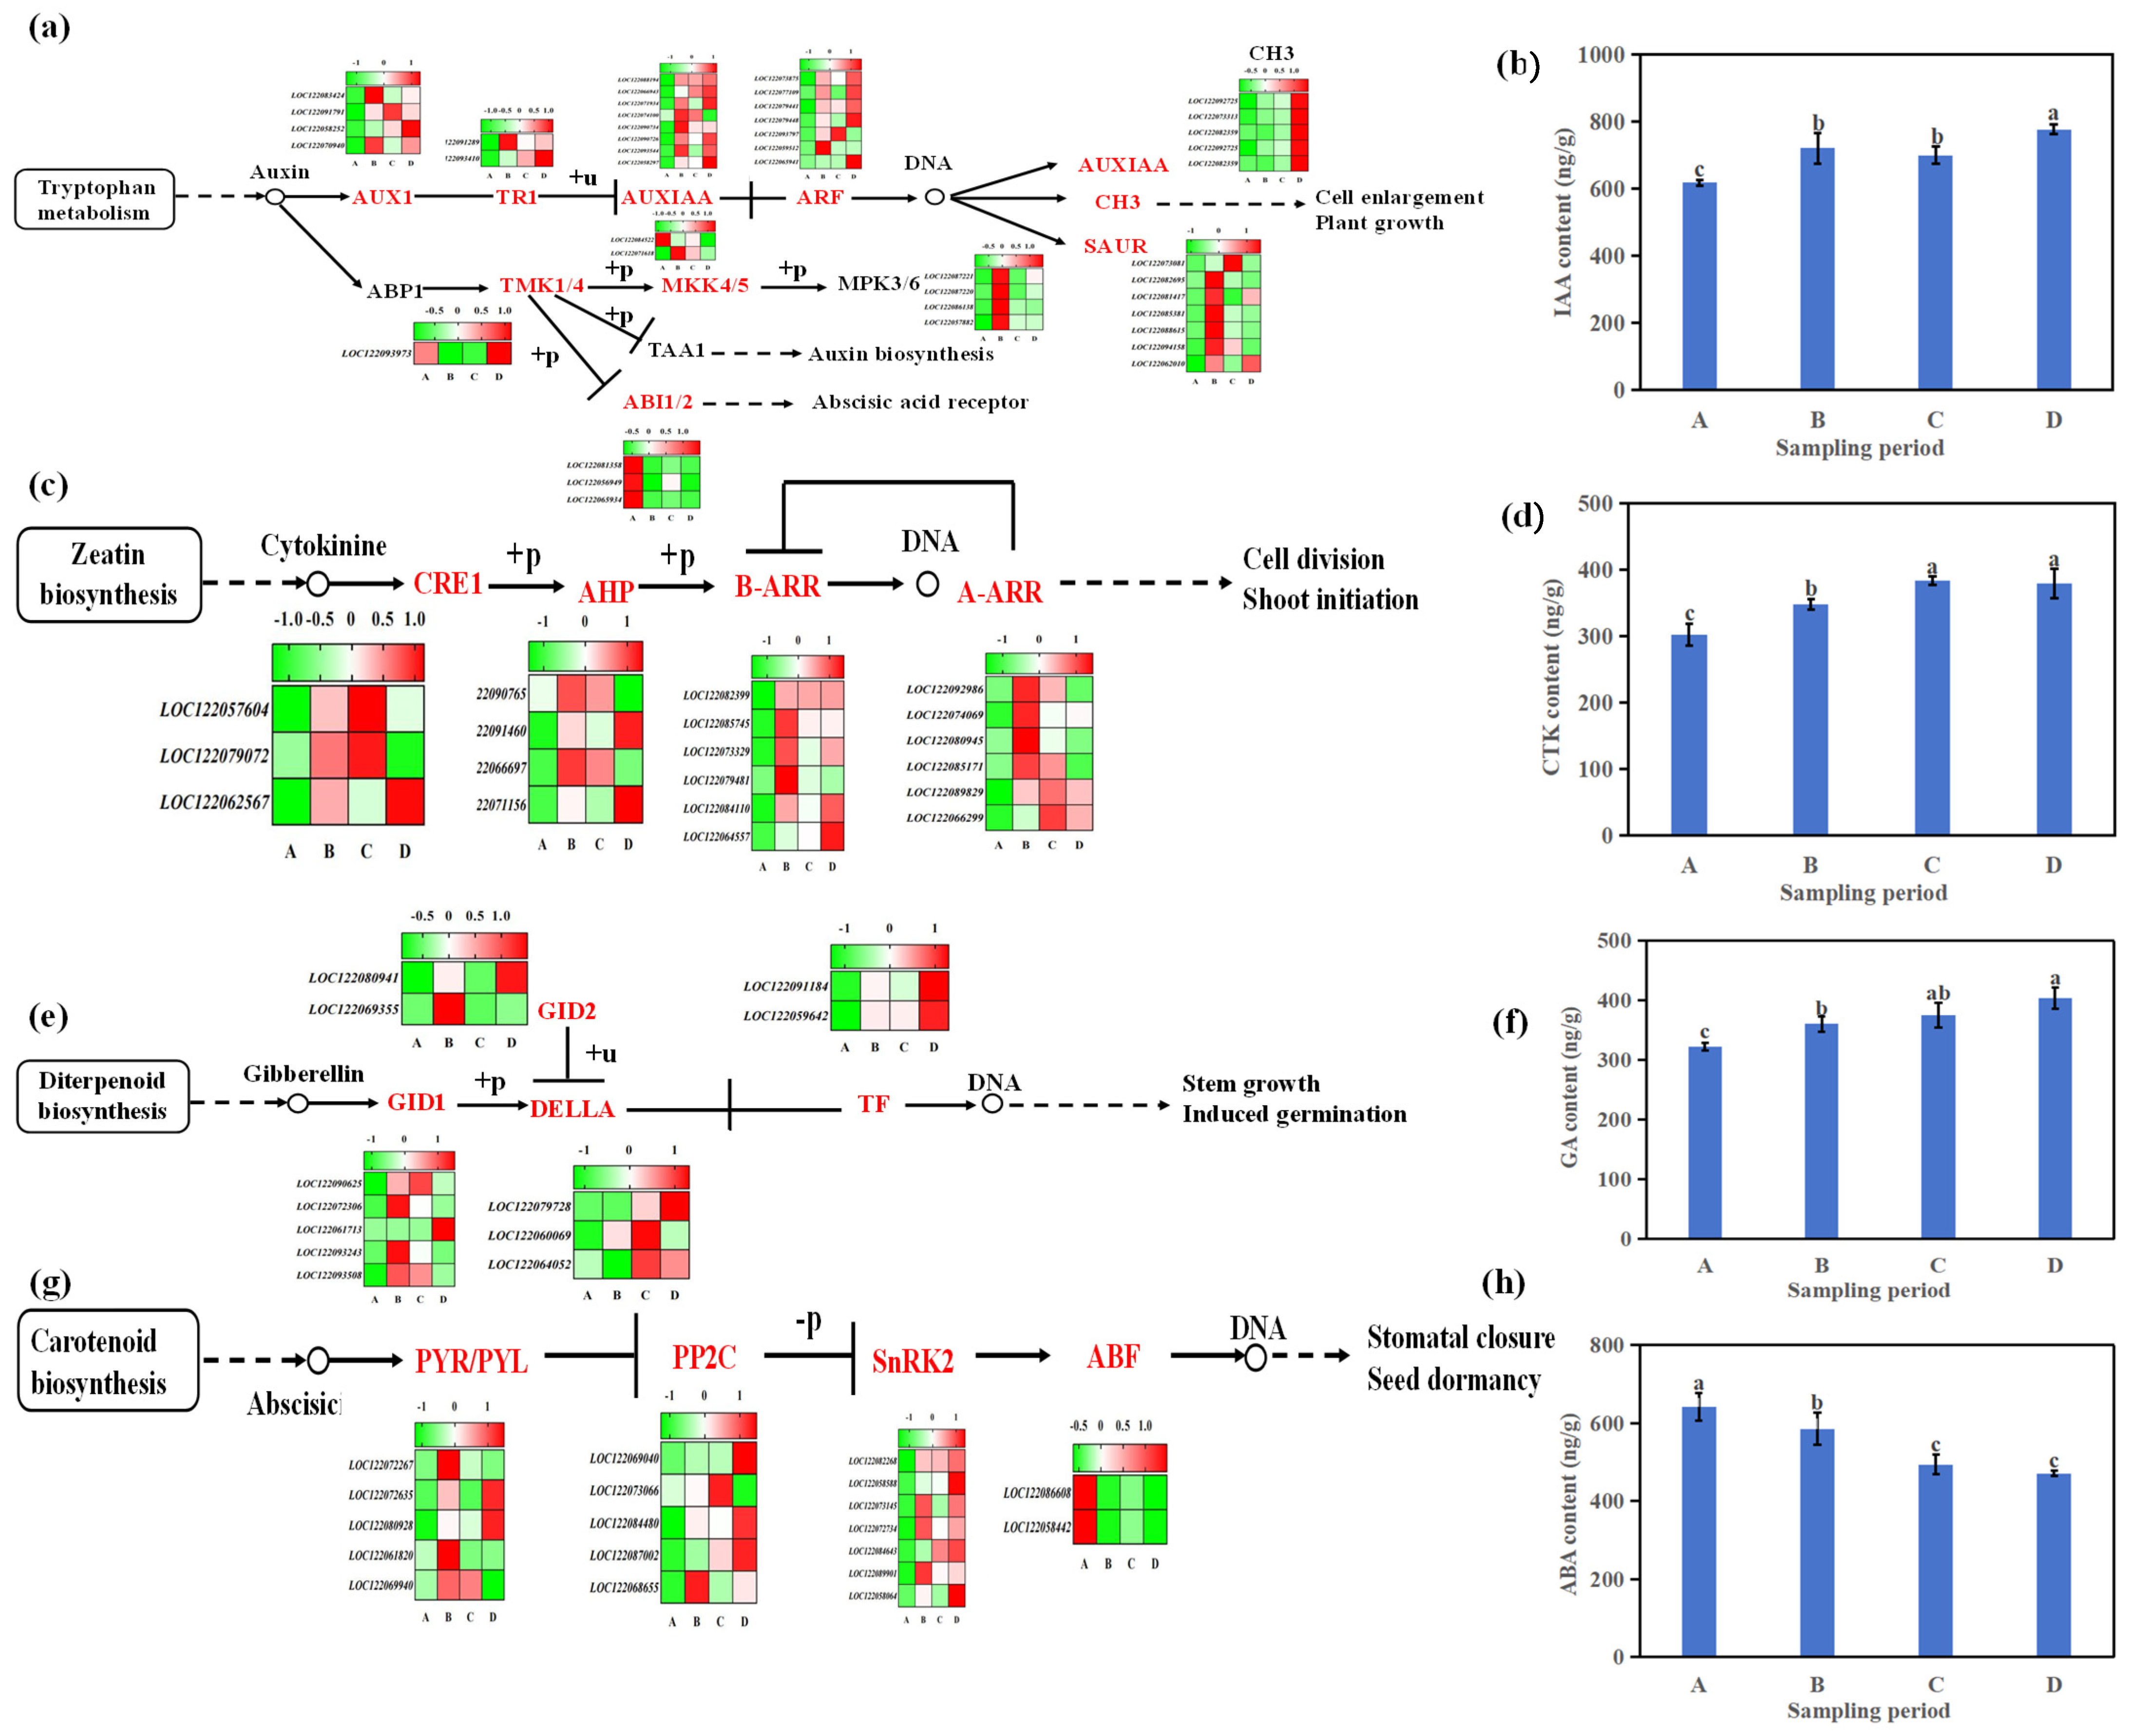
3.5. Phenylpropanoid Biosynthesis and Plant Hormone Signal Transduction Related to Macadamia Seed Germination

According to the joint analysis of differential metabolites and differential genes, we pay attention to the phenylpropanoid biosynthesis (Figure 9). During the macadamia seed germination process, the levels of L-phenylalanine and ferulic acid decreased, while the level of L-tyrosine continued to rise. Quercetin exhibited its highest concentration during the imbibition stage, whereas trifolm, rutin, myricetin, and quercetin 3-beta-D-sophoroside peaked in the radicle growth stage. The expression levels of PTAL (LOC122086992, LOC122061804, LOC122061512, LOC122061513), CYP73A (LOC122079373, LOC122069001), and 4CL (LOC122074900, LOC122094069, LOC122063272, LOC122064688) were the highest in the seed imbibition stage. FG2 (LOC122086308) and CYP75A/CYP75B1 (LOC122083715, LOC122063430) exhibited high expression levels in the radicle growth stage. These findings indicate that the polyphenol biosynthesis pathway plays a significant role in the germination of macadamia seeds, with flavonoid biosynthesis specifically influencing hypocotyl elongation.
Plant hormones play an important role in the excessive germination of seeds. During macadamia seed germination, the contents of IAA, CTK, and GA gradually increased, while ABA content decreased (Figure 10). IAA content were lowest in the seeding stage and peak in the leaf growth stage. AUX1 (LOC122058252), TR1 (LOC122093410), AUXIAA (LOC122058297, LOC122066943), ARF (LOC122079441, LOC122073875, LOC122077109, LOC122079448), and CH3 (LOC122092725, LOC122073313, LOC122082359) show trends in expression which were similar to IAA content (Figure 10a,b). These genes play crucial roles in IAA signal transduction pathways, particularly in the leaf growth stage, promoting cell elongation and facilitating plant growth. CTK content was lowest at sowing and peaked in the radicle growth stage and leaf growth stage. In the CTK signaling pathway, CRE1 (LOC122057604, LOC122079072) and A-ARR (LOC122089829, LOC122066299) showed an increasing trend, reaching the highest levels in the radicle growth stage, indicating their importance in controlling hypocotyl elongation (Figure 10c,d). GA content was lowest in the seeding stage and showed a gradual increase, reaching its peak in the radicle growth stage and leaf growth stage. GID1 (LOC122090625, LOC122061713), DELLA (LOC122079728, LOC122060069, LOC122064052), and TF (LOC122091184, LOC122059642) exhibited peak expression levels in the radicle growth stage or leaf growth stage (Figure 10e,f). These genes may play critical roles in determining GA content during the macadamia seed germination. ABA content decreased gradually, reaching the lowest in radicle growth stage and leaf growth stage. The expression levels of PP2C (LOC122069040, LOC122084480, LOC122087002) increased gradually, peaking in the leaf growth stage (Figure 10g,h). ABF (LOC122086608, LOC122058442) showed decreasing expression trends throughout the macadamia seed germination, with the lowest levels observed in the leaf growth stage.

4. Discussion

4.1. Physiological Changes Related to Macadamia Seed Germination

Usually, seeds expand rapidly after imbibition, which leads to a significant increase in water content, reaching the maximum in the imbibition stage. At this stage, the seed water content increases from around 8% to 10% below the dry weight to over 50% above the dry weight [24]. The water content of macadamia seeds increased and then decreased, reaching its peak in the seed imbibition stage. This dynamic change in water content reflected the process by which seeds utilize water during germination, emphasizing the importance of maintaining cellular function and structure. Soluble sugars, crude fats, crude proteins, and soluble proteins decreased gradually as seed germination advances (Figure 1). It indicated that these nutrient reserves decline progressively with germination. This may be because seeds utilize these reserve materials to provide energy and nutrition to support the growth of newly emerging seedlings. For example, soluble sugars, proteins, and crude fat can be broken down into simple carbohydrates and amino acids, which are used for cellular respiration and synthesizing new biomolecules [25]; this is also the main reason for the gradual increase in amino acid content. The decomposition and transformation of proteins and fatty acids cause the total amino acid content in seeds to show a gradually increasing trend.
Reactive oxygen species (ROS) play crucial roles in the regulation of dormancy, germination, and deterioration in plant seeds [26]. Low levels of ROS act as signaling molecules to promote dormancy release and trigger seed germination. However, an excessive accumulation of ROS can lead to seed deterioration during storage. Maintaining ROS homeostasis plays a central role in regulating dormancy release, germination, and deterioration of crop seeds [27,28]. During seed germination, the enzyme activities of SOD, POD, CAT, and GPX gradually increase. Oxidative stress is a significant physiological challenge during seed germination leading to ROS generation [29]. To counteract this oxidative stress, seeds progressively enhance the activities of antioxidant enzymes such as SOD, POD, CAT, and GPX (Figure 1). These enzymes played crucial roles in scavenging ROS, reducing oxidative damage to cells, and maintaining cellular function and homeostasis [30].

4.2. Phenylpropanoid Biosynthesis Related to Macadamia Seed Germination

Through the joint analysis of transcriptome and metabolomics, we found that the biosynthesis of amino acids, biosynthesis of co-factors and biosynthesis of phenylpropanoid were the key ways to macadamia seed germination (Figure 6). L-Phenylalanine and ferulic acid were important precursor substances in the biosynthetic pathway of polyphenols, and their levels typically decrease during seed germination. During seed germination, the metabolic flow of the phenylalanine pathway primarily promotes flavonoids synthesis while reducing lignin synthesis, thereby facilitating the germination of yellow gentian seeds [15]. During the Scutellaria baicalensis seed germination, the main metabolites were flavonols such as dihydrobaicalin 3-O-glucoside, baicalein-7-O-glucoside, dihydrobaicalein, and baicalein-3-O-glucoside and its isomers [31]. In mung bean, rutin and catechin increased significantly during germination [32]. During the macadamia seed germination, the contents of L-phenylalanine and ferulic acid decrease. This suggests that these substances were likely actively utilized to synthesize more complex polyphenolic compounds such as flavonoids and anthocyanins, which are used to maintain cellular structure and function [33]. During the growth process of Tamarix hispid seedlings, the synthesis of flavonoid compounds such as quercetin glycosides and kaempferol can enhance the adaptation of plant to extreme desert environments [13]. Quercetin reached highest level in the macadamia seed imbibition stage and it is a potent antioxidant with significant biological activity. In the seed imbibition stage, its high concentration may help maintain the oxidative balance of seed cells, shielding them from oxidative stress in the external environment. This supported the survival and development of seeds during the early stages of growth. As seeds continue to grow and develop, particularly in the hypocotyl elongation stage, the accumulation of trifolm, rutin, myricetin, and quercetin 3-beta-D-sophoroside becomes a significant characteristic. These flavonoid compounds not only have antioxidant properties but may also regulate the synthesis and structure of cell walls, enhance the stability of cell membranes, and participate in the transport and signaling of plant hormones [34,35]. This promotes the normal elongation of the hypocotyl and the initial development of seedlings [36]. PTAL (LOC122086992, LOC122061804, LOC122061512, LOC122061513), CYP73A (LOC122079373, LOC122069001), and 4CL (LOC122074900, LOC122094069, LOC122063272, LOC122064688) exhibit the highest expression levels in the seed imbibition stage. PTAL acts as phenylalanine ammonia-lyase, initiating the conversion of phenylalanine to flavonoids and other phenolic compounds when seeds begin to absorb water and activate growth processes. CYP73A and 4CL play roles in subsequent steps of the phenylalanine metabolic pathway, with CYP73A catalyzing the hydroxylation of cinnamic acid and 4CL, catalyzing the formation of p-coumaroyl-CoA from cinnamic acid and Coenzyme A, serving as precursor pathways for phenolic and flavonoid compound synthesis. The high expression of these genes in the seed imbibition stage established the foundation for subsequent polyphenol synthesis and regulation of seed growth [37]. As seeds develop and grow, especially in the hypocotyl elongation stage, the expression levels of CYP75A/CYP75B1 family members (LOC122083715, LOC122063430) and FG2 (LOC122086308), known as flavonoid glucosyltransferase 2, significantly increase. These genes play crucial roles in the late-stage modification and regulation of flavonoids and other phenolic compounds. Overexpression of flavonoid glucosyltransferase in sweet orange can notably increase the accumulation of rutinosides of quercetin, glucosides of quercetin, and glucosides of kaempferol [38]. The enzyme encoded by flavonoid glucosyltransferase is involved in the glycosylation modification of flavonoid compounds, increasing their water solubility and stability. This enzyme may play a role in the synthesis and stability of cell walls during the hypocotyl elongation [39].

4.3. Hormonal Levels and Signal Transduction Related to Macadamia Seed Germination

Numerous studies have shown that seed germination is primarily regulated by the balance between the endogenous plant hormones GA and ABA. GA promotes seed germination and mobilization of storage reserves, while ABA acts as an inhibitory factor in these processes [40]. During the germination process of macadamia nuts, the ABA content gradually decreases, reaching its lowest levels in the radicle growth stage and leaf growth stages. The GA content is lowest in the seeding stage and gradually increases, reaching peak levels in the radicle growth stage and leaf growth stage (Figure 10). This indicated that ABA and GA antagonistically regulate seed dormancy and germination in macadamia nuts, with ABA positively regulating dormancy induction and maintenance, while GA promotes germination. The biological activities of ABA and GA are primarily mediated through a complex series of gene regulatory networks. In the ABA signaling pathway, when ABA is deficient, PP2C binds to SnRK2, leading to the inactivation of downstream ABA signaling factors, inhibiting the ABA response to promote seed germination. Conversely, when ABA is present, the ABA receptor PYR/PYL/RCAR binds to PP2C, causing PP2C inactivation and releasing SnRK2 from PP2C-mediated inhibition. This results in autophosphorylation or phosphorylation of SnRK2, activating it to phosphorylate downstream targets including transcription factors and channel proteins, thereby inducing and maintaining seed dormancy [41,42]. In the GA signaling pathway, when GA is deficient, DELLA proteins remain stable and inhibit the GA response. Conversely, when GA is present, GID1 binds to GA, promoting the formation of the GID1-GA-DELLA complex. This complex then facilitates its binding to SLY1 (SLEEPY1)/GID2 F-box protein and subsequent ubiquitination of DELLA proteins. This process targets DELLA proteins for degradation via the 26S proteasome, thereby relieving the inhibition of GA response by DELLA proteins [43,44]. During the germination process of macadamia nuts, gene expression levels of GID1 (LOC122090625, LOC122061713), DELLA (LOC122079728, LOC122060069, LOC122064052), and TF (LOC122091184, LOC122059642) in the GA pathway peak in the radicle growth stage or leaf growth stage. In the ABA pathway, the expression of PP2C (LOC122069040, LOC122084480, LOC122087002) gradually increases, reaching its highest level in the leaf growth stage. The expression of ABF (LOC122086608, LOC122058442) gradually decreases during macadamia seed germination, reaching its lowest level in the leaf growth stage. These genes likely play crucial roles in influencing ABA and GA signal transduction during macadamia seed germination.

5. Conclusions

In this study, the physiological, metabolic and molecular changes in macadamia seeds during germination were comprehensively discussed. The water content of seeds reached the peak in the seed imbibition stage, and then decreased, while the contents of fat, protein, and sugar showed a continuous downward trend. The enzyme activities of SOD, POD, GPX, and CAT increased and reached the peak in the leaf growth stage. The biosynthesis of amino acids, the biosynthesis of cofactors, and phenylpropanoid biosynthesis were the key pathways for macadamia seed germination. Key genes like FG2 and CYP75A/CYP75B1 in flavonoid biosynthesis, and GID, DELLA, PP2C, and ABF in the plant hormone signal transduction pathway play an important role in macadamia seed germination. These findings have advanced our understanding of the germination mechanism of macadamia and provided insights into the germination of macadamia seeds and the propagation of seedlings.

Supplementary Materials

The following supporting information can be downloaded at: https://www.mdpi.com/article/10.3390/horticulturae11050519/s1, Table S1: Primers selected for real-time quantitative polymerase chain reaction (qRT-PCR) analysis.

Author Contributions

All authors contributed to the study’s conception. Material preparation was performed by G.G., J.G. and X.S.; Z.K. and L.T. analyzed the data, constructed the figures, and wrote the draft. W.W., H.Z. and X.T. conceived and designed the experiment, provided financial support, and reviewed the manuscript. All authors have read and agreed to the published version of the manuscript.

Funding

This research was financially supported by Subsidies for the Cultivation of Forest Tree Seeds and Seedlings (2025-ZM-19); Forestry Science and Technology Innovation Platform Operation Subsidy Funds (2020132540); Subsidies for the Cultivation of Forest Tree Seeds and Seedlings [2023] No. 4; and the Ministry of Agriculture Opening Project Fund of Key Laboratory of Tropical Fruit Biology, Ministry of Agriculture and Rural Affairs.

Data Availability Statement

The original contributions presented in this study are included in the article. Further inquiries can be directed to the corresponding authors.

Acknowledgments

All authors have acknowledged the content of the article and agreed to this publication.

Conflicts of Interest

The authors declare that they have no known competing financial interests or personal relationships that could have appeared to influence the work reported in this paper.

References

  1. Whittle, C.A.; Otto, S.P.; Johnston, M.O.; Krochko, J.E. Adaptive epigenetic memory of ancestral temperature regime in Arabidopsis thaliana. Botany 2009, 87, 650–657. [Google Scholar] [CrossRef]
  2. Lamichhane, J.R.; Varaillas, C.; Debaeke, P. Seedling emergence and biomass production of soybean cultivars under wheat-soybean relay cropping. PLoS ONE 2023, 18, e0293671. [Google Scholar] [CrossRef]
  3. Steinbrecher, T.; Leubner-Metzger, G. The biomechanics of seed germination. J. Exp. Bot. 2017, 68, 765–783. [Google Scholar] [CrossRef] [PubMed]
  4. Farooq, M.A.; Ma, W.; Shen, S.; Gu, A. Underlying Biochemical and Molecular Mechanisms for Seed Germination. Int. J. Mol. Sci. 2022, 23, 8502. [Google Scholar] [CrossRef]
  5. Zhu, M.; Zang, Y.; Zhang, X.; Shang, S.; Xue, S.; Chen, J.; Tang, X. Insights into the regulation of energy metabolism during the seed-to-seedling transition in marine angiosperm Zostera marina L.: Integrated metabolomic and transcriptomic analysis. Front. Plant Sci. 2023, 14, 1130292. [Google Scholar] [CrossRef] [PubMed]
  6. Xia, Q.; Ponnaiah, M.; Cueff, G.; Rajjou, L.; Prodhomme, D.; Gibon, Y.; Bailly, C.; Corbineau, F.; Meimoun, P.; Bouteau, H. Integrating proteomics and enzymatic profiling to decipher seed metabolism affected by temperature in seed dormancy and germination. Plant Sci. 2018, 269, 118–125. [Google Scholar] [CrossRef]
  7. Miransari, M.; Smith, D.L. Plant hormones and seed germination. Environ. Exp. Bot. 2014, 99, 110–121. [Google Scholar] [CrossRef]
  8. Ipek, A.; Kaya, M.; Guerbuez, B. Effects of Seed Age and GA (3) Application on Germination of Fenugreek (Trigonella foenum-graecum L.) and Cumin (Cuminum cyminum L.) Seeds. J. Agric. Sci.-Tarim Bilim. Derg. 2008, 14, 57–61. [Google Scholar] [CrossRef]
  9. Peng, J.; Harberd, N.P. The role of GA-mediated signalling in the control of seed germination. Curr. Opin. Plant Biol. 2002, 5, 376–381. [Google Scholar] [CrossRef]
  10. Ali, F.; Qanmber, G.; Li, F.; Wang, Z. Updated role of ABA in seed maturation, dormancy, and germination. J. Adv. Res. 2022, 35, 199–214. [Google Scholar] [CrossRef]
  11. Li, Z.; Luo, X.; Wang, L.; Shu, K.; Zhang, J. Abscisic Acid Insensitive 5 mediates light–ABA/gibberellin crosstalk networks during seed germination. J. Exp. Bot. 2022, 73, 4674–4682. [Google Scholar] [CrossRef] [PubMed]
  12. Yang, J.; Su, L.; Li, D.; Luo, L.; Sun, K.; Yang, M.; Gu, F.W.; Xia, A.Y.; Liu, Y.Z.; Wang, H. Dynamic transcriptome and metabolome analyses of two types of rice during the seed germination and young seedling growth stages. BMC Genom. 2020, 21, 603. [Google Scholar] [CrossRef] [PubMed]
  13. Pang, X.A.; Suo, J.T.; Liu, S.; Xu, J.D.; Yang, T.G.; Xiang, N.Y.; Wu, Y.; Liu, B.J.; Qin, R.; Liu, H. Combined transcriptomic and metabolomic analysis reveals the potential mechanism of seed germination and young seedling growth in Tamarix hispida. BMC Genom. 2022, 23, 109. [Google Scholar] [CrossRef] [PubMed]
  14. Hao, Y.; Hong, Y.; Guo, H.; Qin, P.; Huang, A.; Yang, X.; Ren, G. Transcriptomic and metabolomic landscape of quinoa during seed germination. BMC Plant Biol. 2022, 22, 237. [Google Scholar] [CrossRef]
  15. Liu, R.; Lu, J.; Xing, J.Y.; Du, M.; Wang, M.X.; Zhang, L.; Li, Y.F.; Zhang, C.H.; Wu, Y. Transcriptome and metabolome analyses revealing the potential mechanism of seed germination in Polygonatum cyrtonema. Sci. Rep. 2021, 11, 12161. [Google Scholar] [CrossRef]
  16. Qu, C.P.; Zhao, H.C.; Chen, J.Y.; Zuo, Z.; Sun, X.; Huang, J.H.; Yang, C.J.; Zhang, X.L.; Zhang, P.; Quan, X.K.; et al. The transcriptional events and their relationship to physiological changes during poplar seed germination and post-germination. BMC Genom. 2019, 20, 801. [Google Scholar] [CrossRef]
  17. Zhou, W.X.; Duan, Y.Y.; Jiang, X.G.; Tan, X.H.; Li, Q.; Wang, H.; Zhang, Y.J.; Zhang, M.D. Transcriptome and metabolome analyses reveal novel insights into the seed germination of Michelia chapensis, an endangered species in China. Plant Sci. 2023, 328, 111568. [Google Scholar] [CrossRef]
  18. Aquino-Bolaños, E.N.; Mapel-Velazco, L.; Martín-del-Campo, S.T.; Chávez-Servia, J.L.; Martínez, A.J.; Verdalet-Guzmán, I. Fatty acids profile of oil from nine varieties of Macadamia nut. Int. J. Food Prop. 2017, 20, 1262–1269. [Google Scholar] [CrossRef]
  19. Kang, Z.M.; Li, C.X.; Song, X.M.; Cai, Y.B.; Guo, G.Z.; Zeng, H.; Tu, X.H.; Pan, X.J.; Zhang, W.E. Metabolomic and transcriptomic analysis of macadamia seedling responses to drought stress and the role of MiGST in enhancing drought resistance. Ind. Crops Prod. 2025, 229, 120984. [Google Scholar] [CrossRef]
  20. Wei, B.; Hou, K.; Zhang, H.H.; Wang, X.Y.; Wu, W. Integrating transcriptomics and metabolomics to studies key metabolism, pathways and candidate genes associated with drought-tolerance in Carthamus tinctorius L. Under drought stress. Ind. Crops Prod. 2020, 151, 112465. [Google Scholar] [CrossRef]
  21. Want, E.J.; Masson, P.; Michopoulos, F.; Wilson, I.D.; Theodoridis, G.; Plumb, R.S.; Shockcor, J.; Loftus, N.; Holmes, E.; Nicholson, J.K. Global metabolic profiling of animal and human tissues via UPLC-MS. Nat. Protoc. 2013, 8, 17–32. [Google Scholar] [CrossRef] [PubMed]
  22. Love, M.I.; Huber, W.; Anders, S. Moderated estimation of fold change and dispersion for RNA-seq data with DESeq2. Genome Biol. 2014, 15, 550. [Google Scholar] [CrossRef]
  23. Kan, L.; Liao, Q.C.; Chen, Z.P.; Wang, S.Y.; Ma, Y.F.; Su, Z.Y.; Zhang, L. Dynamic Transcriptomic and Metabolomic Analyses of Madhuca pasquieri (Dubard) H. J. Lam During the Post-germination Stages. Front. Plant Sci. 2021, 12, 731203. [Google Scholar] [CrossRef] [PubMed]
  24. Bailly, C. The signalling role of ROS in the regulation of seed germination and dormancy. Biochem. J. 2019, 476, 3019–3032. [Google Scholar] [CrossRef] [PubMed]
  25. Aragão, V.P.M.; Navarro, B.V.; Passamani, L.Z.; Macedo, A.F.; Floh, E.I.S.; Silveira, V.; Santa-Catarina, C. Free amino acids, polyamines, soluble sugars and proteins during seed germination and early seedling growth of Cedrela fissilis Vellozo (Meliaceae), an endangered hardwood species from the Atlantic Forest in Brazil. Theor. Exp. Plant Physiol. 2015, 27, 157–169. [Google Scholar] [CrossRef]
  26. Li, W.J.; Niu, Y.Z.; Zheng, Y.Y.; Wang, Z.F. Advances in the Understanding of Reactive Oxygen Species-Dependent Regulation on Seed Dormancy, Germination, and Deterioration in Crops. Front. Plant Sci. 2022, 13, 826809. [Google Scholar] [CrossRef]
  27. Kurek, K.; Plitta-Michalak, B.; Ratajczak, E. Reactive Oxygen Species as Potential Drivers of the Seed Aging Process. Plants 2019, 8, 174. [Google Scholar] [CrossRef]
  28. Considine, M.J.; Foyer, C.H. Stress effects on the reactive oxygen species-dependent regulation of plant growth and development. J. Exp. Bot. 2021, 72, 5795–5806. [Google Scholar] [CrossRef]
  29. Khanna, K.; Bhardwaj, R.; Alam, P.; Reiter, R.J.; Ahmad, P. Phytomelatonin: A master regulator for plant oxidative stress management. Plant Physiol. Biochem. 2023, 196, 260–269. [Google Scholar] [CrossRef]
  30. Bailly, C.; El-Maarouf-Bouteau, H.; Corbineau, F. From intracellular signaling networks to cell death: The dual role of reactive oxygen species in seed physiology. C. R. Biol. 2008, 331, 806–814. [Google Scholar] [CrossRef]
  31. Xu, J.Y.; Yu, Y.L.; Shi, R.Y.; Xie, G.Y.; Zhu, Y.; Wu, G.; Qin, M.J. Organ-Specific Metabolic Shifts of Flavonoids in Scutellaria baicalensis at Different Growth and Development Stages. Molecules 2018, 23, 428. [Google Scholar] [CrossRef]
  32. Gan, R.Y.; Wang, M.F.; Lui, W.Y.; Wu, K.; Corke, H. Dynamic changes in phytochemical composition and antioxidant capacity in green and black mung bean (Vigna radiata) sprouts. Int. J. Food Sci. Technol. 2016, 51, 2090–2098. [Google Scholar] [CrossRef]
  33. Peng, W.P.; Wang, N.; Wang, S.M.; Wang, J.Z.; Dong, Y.L. Effects of Exogenous Caffeic Acid, L-Phenylalanine and NaCl Treatments on Main Active Components Content and In Vitro Digestion of Germinated Tartary Buckwheat. Foods 2022, 11, 3682. [Google Scholar] [CrossRef]
  34. Peer, W.A.; Murphy, A.S. Flavonoids and auxin transport: Modulators or regulators? Trends Plant Sci. 2007, 12, 556–563. [Google Scholar] [CrossRef] [PubMed]
  35. Rencoret, J.; Rosado, M.J.; Kim, H.; Timokhin, V.I.; Gutiérrez, A.; Bausch, F.; Rosenau, T.; Potthast, A.; Ralph, J.; Río, J.C.D. Flavonoids naringenin chalcone, naringenin, dihydrotricin, and tricin are lignin monomers in papyrus. Plant Physiol. 2022, 188, 208–219. [Google Scholar] [CrossRef] [PubMed]
  36. Lyu, G.Z.; Li, D.B.; Xiong, H.; Xiao, L.T.; Tong, J.H.; Ning, C.J.; Wang, P.; Li, S.S. Quantitative Proteomic Analyses Identify STO/BBX24 -Related Proteins Induced by UV-B. Int. J. Mol. Sci. 2020, 21, 2496. [Google Scholar] [CrossRef] [PubMed]
  37. Dong, F.S.; Lv, M.Y.; Wang, J.P.; Shi, X.P.; Liang, X.X.; Liu, Y.W.; Yang, F.; Zhao, H.; Chai, J.F.; Zhou, S. Transcriptome analysis of activated charcoal-induced growth promotion of wheat seedlings in tissue culture. BMC Genet. 2020, 21, 69. [Google Scholar] [CrossRef]
  38. Liu, X.G.; Lin, C.L.; Ma, X.D.; Tan, Y.; Wang, J.Z.; Zeng, M. Functional Characterization of a Flavonoid Glycosyltransferase in Sweet Orange (Citrus sinensis). Front. Plant Sci. 2018, 9, 166. [Google Scholar] [CrossRef]
  39. Guajardo-Flores, D.; Serna-Guerrero, D.; Serna-Saldívar, S.O.; Jacobo-Velázquez, D.A. Effect of Germination and UV-C Radiation on the Accumulation of Flavonoids and Saponins in Black Bean Seed Coats. Cereal Chem. 2014, 91, 276–279. [Google Scholar] [CrossRef]
  40. Qi, K.J.; Wu, X.; Li, L.F.; Xie, Z.H.; Gu, C.; Zhang, S.L. Metabolome and transcriptome analyses unravel the inhibition of embryo germination by abscisic acid in pear. Sci. Hortic. 2022, 292, 110652. [Google Scholar] [CrossRef]
  41. Weitbrecht, K.; Muller, K.; Leubner-Metzger, G. First off the mark: Early seed germination. J. Exp. Bot. 2011, 62, 3289–3309. [Google Scholar] [CrossRef] [PubMed]
  42. Angel, A.; Song, J.; Dean, C.; Howard, M. A Polycomb-based switch underlying quantitative epigenetic memory. Nature 2011, 476, 105–108. [Google Scholar] [CrossRef] [PubMed]
  43. Nelson, S.K.; Steber, C.M. Gibberellin hormone signal perception: Down-regulating DELLA repressors of plant growth and development. Annu. Plant Rev. 2016, 49, 153–188. [Google Scholar] [CrossRef]
  44. Sohn, S.I.; Pandian, S.; Kumar, T.S.; Zoclanclounon, Y.A.B.; Muthuramalingam, P.; Shilpha, J.; Satish, L.; Ramesh, M. Seed Dormancy and Pre-Harvest Sprouting in Rice—An Updated Overview. Int. J. Mol. Sci. 2021, 22, 11804. [Google Scholar] [CrossRef] [PubMed]
Figure 1. The differences in phenotypic and physiological parameters of macadamia seeds at different germination stages (D). (a) The phenotypes of macadamia seeds in different germination stages; (b) seed water content; (c) soluble sugar content; (d) crude fat content; (e) crude protein content; (f) soluble protein content; (g) total amino acid content; (hl) the activities of SOD, POD, CAT, APX, and GPX enzymes, respectively. A, B, C, and D represent the seeding stage, the seed imbibition stage, the radicle growth stage, and the leaf growth stage. The different letters represent significant differences (p < 0.05).
Horticulturae 11 00519 g001
Figure 2. The metabolite analysis of macadamia seeds at different germination stages. (a) OPLS-DA score plots; (b) the relative contents of metabolites with biological roles in different samples; (c) the relative contents of metabolites ranked in the top 20, with the rest of the metabolites included in Others; (dg) the volcano plots of differing metabolites between the different comparator groups and Venn diagrams.
Horticulturae 11 00519 g002
Figure 3. Differential metabolite KEGG pathway annotation plots. (a) KEGG pathway annotation statistics for A vs. B vs. C vs. D metabolite profiles; (b) KEGG pathway annotation statistics for A vs. B, B vs. C, and C vs. D metabolite profiles.
Horticulturae 11 00519 g003
Figure 4. Principal component analysis (a) and correlation analysis (b) of transcriptome data. (c–f) qRT-PCR validation of the transcriptome data results for 4 selected genes. The blue folds represent FPKM values in transcriptome data, and the vertical bars shown in the columns represent relative expression level by qRT-PCR. Relative expression levels of qRT-PCR were calculated using 18sRNA as a standard. Pearson correlation coefficients were calculated by comparing qRT-PCR and FPKM for each gene.
Horticulturae 11 00519 g004
Figure 5. (a) Venn diagrams of the number of differential genes between different comparison groups; (bd) the plots of differential gene volcanoes for A vs. B, B vs. C, and C vs. D, respectively.
Horticulturae 11 00519 g005
Figure 6. (a,b) The GO term annotations of metabolic pathways in different germination stages of macadamia seeds and the Venn diagrams of the number of GO terms between the comparison groups, respectively. (c,d) The annotated information and the Venn diagrams of KEGG pathway enrichment of DEGs between the comparison groups, respectively. The circle’s color indicates the adjusted p value (Padj), and the size of the circle is proportional to the number of DEGs involved in pathway enrichment.
Horticulturae 11 00519 g006
Figure 7. (a) All transcription factors detected and their number. (b) A Venn diagram of the number of transcription factors detected between the different comparison groups. (c) A heat map of the expression of the common transcription factors between the three comparison groups.
Horticulturae 11 00519 g007
Figure 8. (a) Venn diagram of significantly enriched transcriptome and metabolome pathways; (b) names of co-enriched pathways.
Horticulturae 11 00519 g008
Figure 9. An analysis of the biosynthetic metabolic pathways of phenylalanine, tyrosine, tryptophan, and flavonoids. The squares indicate genes, circles indicate metabolites, and different colors indicate different expression and content.
Horticulturae 11 00519 g009
Figure 10. (a,c,e,g) The signal transduction pathways of IAA, CTK, GA, and ABA, respectively. (b,d,f,h) The contents of IAA, CTK, GA, and ABA, respectively. The different letters represent significant differences (p < 0.05).
Horticulturae 11 00519 g010
Table 1. Statistics of transcriptome sequencing data for 12 samples during seed germination.
SamplesTotal ReadsTotal BasesTotal Giga BasesQ20 BasesQ30 Bases≥Q20≥Q30GC ContentOverall Mapping Rate
A145,520,2686,510,660,9616.51G6,337,002,3746,009,671,17897.3392.3146.3988.60
A242,951,3486,175,252,8346.18G6,005,514,7705,683,994,10097.2592.0446.6294.50
A344,325,7706,372,141,2716.37G6,193,402,8495,859,890,33697.2091.9646.4893.00
B142,742,4866,103,108,8446.1G5,909,917,1165,565,103,84796.8391.1844.9993.30
B241,129,7185,906,477,1355.91G5,746,213,8435,441,603,32497.2992.1345.2393.90
B340,059,9005,742,782,8505.74G5,583,191,3345,284,845,51897.2292.0345.1893.40
C144,810,1166,427,791,1956.43G6,258,228,0275,934,616,66097.3692.3345.3092.40
C245,406,0866,458,987,7446.46G6,306,975,6616,003,060,95897.6592.9445.7093.80
C344,976,2706,452,155,5436.45G6,264,697,0855,920,047,15597.0991.7545.6794.10
D140,941,0025,894,673,3925.89G5,733,578,9605,427,643,57697.2792.0845.1494.10
D242,233,2266,080,621,8426.08G5,904,789,4515,580,113,61397.1191.7745.2392.50
D345,575,6946,549,629,9006.55G6,385,459,4966,064,971,53397.4992.6045.3993.60
Disclaimer/Publisher’s Note: The statements, opinions and data contained in all publications are solely those of the individual author(s) and contributor(s) and not of MDPI and/or the editor(s). MDPI and/or the editor(s) disclaim responsibility for any injury to people or property resulting from any ideas, methods, instructions or products referred to in the content.

