Article

Interaction Effects of Cucumber Varieties and Pruning Methods Across Different Growth Stages

1
College of Ecology, Lishui University, Lishui 323000, China
2
College of Resources and Environment Sciences, China Agricultural University, Beijing 100193, China
3
Tianjin Climate Center, Tianjin 300074, China
4
China Meteorological Administration Training Center, Beijing 100081, China
5
Key Laboratory of Crop Breeding in South Zhejiang, Wenzhou Academy of Agricultural Sciences, Wenzhou 325006, China
*
Authors to whom correspondence should be addressed.
Horticulturae 2025, 11(5), 464; https://doi.org/10.3390/horticulturae11050464
Submission received: 27 March 2025 / Revised: 24 April 2025 / Accepted: 24 April 2025 / Published: 25 April 2025
(This article belongs to the Section Vegetable Production Systems)

Abstract

:
In order to investigate the stage plant architecture and productivity characteristics of different cucumber varieties and pruning methods and to construct a comprehensive productivity evaluation system based on plant architecture parameters, this study used JY35 and JS206 as experiment materials and conducted a dual factor control experiment with variety and pruning methods (single-stem pruning (SP) and natural growth (NG)) to systematically analyze the key phenotypic characteristics and productivity indicators of cucumbers at different developmental stages based on variance analysis and principal component evaluation. The results indicated the following: (1) Varieties and pruning methods have a significant impact on the plant architecture characteristics and productivity indicators. (2) The dominant plant architecture characteristics and productivity indicators of JY35 include dry and fresh weights of the tendril, main stem, total stem, leaves, petioles, flowers, overground parts, and overall plant, as well as dry and fresh weight distribution index of the tendril, total stem, leaves, petioles, flowers, overground parts, and overall plant, main stem fresh weight distribution index, water content of roots, tendrils, main stem, leaves, petioles, and flowers, volume of total stem, main stem, and petioles, plant height, total leaf area per plant, leaf area index, and specific leaf area. The remaining plant architecture characteristics and productivity indicators are dominated by the plant architecture of JS206. (3) The dominant plant architecture characteristics and productivity indicators of the SP method include dry and fresh weight distribution index of roots, fruit carpopodiums, main stems, and total stems, water content of petioles, stems, and leaves, and root-to-shoot ratio. The remaining plant architecture characteristics and productivity indicators are dominated by the NG method. This study quantified the dynamic correlation between cucumber plant architecture and productivity characteristics, and the research results can provide a morphological basis for facility cucumber variety breeding and theoretical support for optimizing pruning cultivation mode and achieving efficient utilization of light and heat resources.

1. Introduction

Cucumber (Cucumis sativus L.), as an economically important crop in the Cucurbitaceae family, holds a significant position in the agricultural economy [1]. Plant architecture, which visually embodies the morphology of crops, is formed through the coordinated influence of genetic regulatory networks [2], the interaction of environmental factors [3], and agronomic practices [4]. The characteristics of plant architecture not only determine the light interception efficiency and microenvironment within the canopy of crop populations [5] but also significantly impact assimilate allocation patterns [6], expression of stress tolerance [7], and the formation of final economic yield [3,8]. In the technical system of greenhouse cucumber cultivation, the core agronomic measure for regulating plant architecture is the technique of training cucumbers in a hanging vine upside down (HVUD) pruning technique [9,10]. By altering the spatial distribution of the apical growth point, it adjusts the dominance of the plant apex, thereby influencing lateral branching, spatial arrangement of leaves, and the rhythm of reproductive growth. The scientific application of this technique effectively illustrates the balance between vegetative and reproductive growth [6,11]. However, there is currently a lack of systematic research on the quantitative relationship between pruning methods and the dynamic changes in plant architecture during different growth stages, as well as their cumulative effects on productivity formation throughout the entire growth period. Both variety selection and pruning techniques serve as dual driving factors for plant architecture regulation, playing a synergistic role in shaping crop morphology, improving yield and quality, and optimizing economic benefits [12,13].
In the field of variety plant architecture characteristics, due to the common characteristics of optimized internode configuration and reasonable spatial distribution of leaves in ideal plant architecture, researchers have constructed a leaf morphology–physiology coordination analysis system to reveal the high-yielding plant architectural features of crops through the analysis of indicators such as leaf area, leaf length, leaf width, leaf angle, specific leaf weight, specific leaf nitrogen, yield, and mature yield components [14]. Previous research has employed a variety of methods to analyze differences in plant architecture, including traditional morphological measurements, modern phenomics techniques (such as 3D imaging and point cloud analysis and hyperspectral and thermal imaging), and genome-wide association studies (GWASs) [8,15]. These studies have indicated that compact plant architectures tend to enhance the light interception efficiency of plant populations, while more open architectures offer advantages in terms of photosynthetic product translocation efficiency [16]. Plant architectural traits are not only dynamically regulated by light and temperature conditions [1,3,8] as well as hormonal signaling networks [17] but also reflect the trade-offs in the allocation of carbon assimilates among roots, stems, leaves, and reproductive organs such as flowers and fruits. For example, indeterminate growth types tend to favor continuous vegetative growth, whereas determinate growth types prioritize fruit development. The analysis of plant architectural traits holds significant research importance for several key areas: breeding optimization and cultivar design, precision in crop management, efficient use and sustainable development of resources, adaptation to climate change, and the promotion of interdisciplinary research.
In the field of shoot pruning technique regulation, research indicates that the rejuvenation shoot pruning method stimulates the axillary bud meristem to activate the gibberellin signaling pathway, thereby promoting the efficiency of nitrogen, phosphorus, and potassium absorption. This leads to an increase in the number of panicles, flowers, fruits, and the content of nutrient elements (N, P, K, Mg, Fe, and Cu), ultimately improving tomato yield and quality [18]. The secondary lateral shoot pruning method enhances fruit setting rate by promoting early female flower differentiation, thereby increasing the production and quality of monk fruit while reducing the need for pruning labor [19]. As a result, research comparing the effects of different shoot pruning methods on crop architecture and productivity characteristics indicates that the three-stem pruning method is most beneficial for achieving a well-structured individual configuration, optimal spatial arrangement of the plant population, and improved photosynthetic efficiency in cherry tomatoes. On the other hand, the five-stem pruning method is most conducive to improving fruit marketability, accumulation of nutritional quality components, and increasing yield, thereby confirming the directional regulation characteristics of assimilate distribution in terms of the source–sink relationship and revealing a trade-off relationship between plant architecture and yield in the form of ‘structure-function’ balance [20,21]. Previous studies have stated that the more leaves are retained on cassava, the fewer leaves are removed, and the less dry matter is lost [22]. This leads to an increase in the overall yield, nutrient accumulation, and nutrient distribution ratio in storage roots and leaves during the maturity stage. After leaf removal, the photosynthetic products of the remaining leaves are preferentially allocated to overground growth, providing evidence for the nutrient competition hypothesis regulated by apical dominance.
Research suggests that the ideal cucumber plant architecture should have a medium to tall stem, an indeterminate growth type for the main stem with few or no lateral branches, and limited or absent tendrils. The lower carpopodium should be short and stout, with appropriate leaf area, dark leaf color, minimal shading between leaves, small leaf angles, upright leaf blades, and uniform distribution of leaf blades within the canopy, among other architectural characteristics [23]. Single-stem pruning, which suppresses the growth of lateral branches to concentrate nutrient supply to the main vine, has been widely used in cucumber cultivation. However, its dynamic effects on plant height growth rate, leaf spatial distribution patterns, and the synchrony of flower and fruit development at different stages of cucumber growth—such as the seedling, flowering, and fruiting stages—have not yet been quantified. Moreover, the interactive effects between pruning strategies and cultivar characteristics still need to be further explored. Therefore, this study collected key plant architecture characteristics and productivity indicators of cucumbers at different growth stages for two varieties (JY35 and JS206) and two pruning methods (single-stem pruning (SP) and natural growth (NG)) from the years 2013 to 2015 and 2018 to 2020. The aim is to quantify the growth and development of cucumbers and the formation of quality and provide data support for cucumber variety selection and breeding, adjustment of planting structure, and efficient utilization of agricultural resources.

2. Materials and Methods

The staged sowing experiments were conducted in the sunlight greenhouse of the Agricultural Science and Technology Innovation Base in Wuqing District, Tianjin, China (39°25′48″ N, 116°58′12″ E; the altitude is 8 m) from 2013 to 2015 (cultivar Jinyou 35, JY35) and from 2018 to 2020 (cultivar Jinsheng 206, JS206) [1,3,11]. Both crop varieties have strong plant growth, strong continuous fruiting ability, straight fruit vines, and tolerance to early spring low temperatures and autumn high temperatures, making them highly promising for production. According to the local production model, two crops can be grown each year, divided into spring crop and autumn–winter crop, with three sowing periods for each crop. The early sowing is 15 days earlier than the local conventional transplanting period, the mid-sowing corresponds to the local conventional transplanting period, and the late sowing is 15 days later than the local conventional transplanting period. The experiment adopted a randomized block design. A total of 21 transplanting periods were conducted in 7 stubbles, with 3 replicates for each transplanting period. The interrow spacing was 0.67 m, the distance between plants was 0.42 m, and the planting density was 35,550 plants per hectare. The greenhouse had reasonable structural parameters, and the soil fertility conditions were moderate. According to the literature, the cucumber growth and development process can be divided into 7 key development stages. The specific morphological indicators for each development stage are shown in Table 1. Cucumber is a vine crop with indeterminate growth. During its growth and development, it undergoes multiple SP management. In this study, when comparing the characteristics of the varieties, the plant architecture and productivity characteristics of the two varieties after pruning were compared. When comparing the pruning characteristics, the plant architecture and productivity characteristics of the two pruning methods (SP and NG) of JS206 were compared. NG represents the sum of the plant architecture and productivity characteristics after pruning and the cumulative plant architecture and productivity characteristics. The solar greenhouse featured masonry walls. Its rear wall stood at a height of 3.7 m and a thickness of 0.5 m. The side wall also had a thickness of 0.5 m, with the ridge reaching a height of 5.3 m. The rear roof was inclined at an angle of 44.0°, while the front roof had an angle of 32.0°. The roof spanned 10.0 m in width, extended 65.0 m in length, and covered a total area of 650.0 square meters. The experimental site had heavy clay soil. In the cultivation layer (0–20 cm), the total nitrogen content was 2.76 g/kg, hydrolyzed nitrogen was 227.8 mg/kg, available phosphorus was 299.2 mg/kg, available potassium was 648.0 mg/kg, organic matter was 43.0 g/kg, pH was 7.61, and the cation exchange capacity was 73.44 cmol/kg. An automated irrigation system was implemented for integrated water and fertilizer irrigation. Following planting, weed control should be conducted within the initial 1–2 days and subsequently once a week after flowering and fruiting. A record should be kept of the timing and severity of pest and disease occurrences, and preventive and control measures for commonly encountered pests and diseases should be proactively prepared.
The greenhouse microclimate was monitored using a microclimate observation instrument called CAWS2000 (Beijing Huayun Shangtong Technology Co., Ltd., Beijing, China). This instrument automatically collected meteorological data, including air temperature, humidity, CO2 concentration, and total solar radiation, at 10 min intervals. During the spring crop season, the daily average temperature, daily maximum temperature, daily minimum temperature, nighttime temperature, and daytime temperature varied between 10.7 and 32.1 °C, 12.0 and 42.3 °C, 4.3 and 27.2 °C, 9.7 and 28.8 °C, and 13.9 and 39.2 °C, respectively, with mean values of 22.2 °C, 31.3 °C, 16.4 °C, 8.8 °C, and 27.4 °C, respectively. During the autumn–winter crop season, the daily average temperature, daily maximum temperature, daily minimum temperature, nighttime temperature, and daytime temperature varied between 11.6 and 27.3 °C, 13.4 and 41.3 °C, 7.5 and 20.9 °C, 10.7 and 22.5 °C, and 13.3 and 35.9 °C, respectively, with mean values of 17.7 °C, 25.7 °C, 13.3 °C, 16.0 °C, and 22.7 °C, respectively. The soil temperatures at different depths (0–10 cm, 10–20 cm, and 20–30 cm) were 22.7 °C, 23.2 °C, and 22.2 °C, respectively, with ranges of 2.4 °C, 2.3 °C, and 2.4 °C, respectively.
This study determined the plant architecture and productivity characteristics indicators of cucumber (Table 2). The appearance-related traits mainly cover things like the dry and fresh weights of different plant parts, how these weights are distributed, the lengths and numbers of these parts, their volumes and colors, the root-to-shoot ratio, leaf area and related indices, specific leaf area, fruit shape index, individual yield increase rate, and timing and weight of pruning. The physicochemical quality traits mainly include the water content of different parts, chlorophyll content, soluble solids in fruits, soluble protein, soluble sugar, and vitamin C content.
This study utilized Microsoft Excel 2013 and Origin 2024 for data processing and plotting to create ‘Pearson’ correlation heat maps and SPSS 17.0 software for relevant statistical analysis, and the statistical indicators include mean X ¯ and standard deviation (SD). Due to the significant differences in scalars between various indicators, in order to quantify the order of indicators reasonably, we use the method of normalization to standardize the data (Equation (1)).
Y i = ( X i min X i ) / ( max X i min X i ) × 100 %
where i = 1, 2, …, N, and N are the indicator samples. max X i represents the maximum value of the indicator, min X i represents the minimum value of the indicator, X i represents the indicator value, and Y i represents the normalized value of the indicator, [0, 1].

3. Results

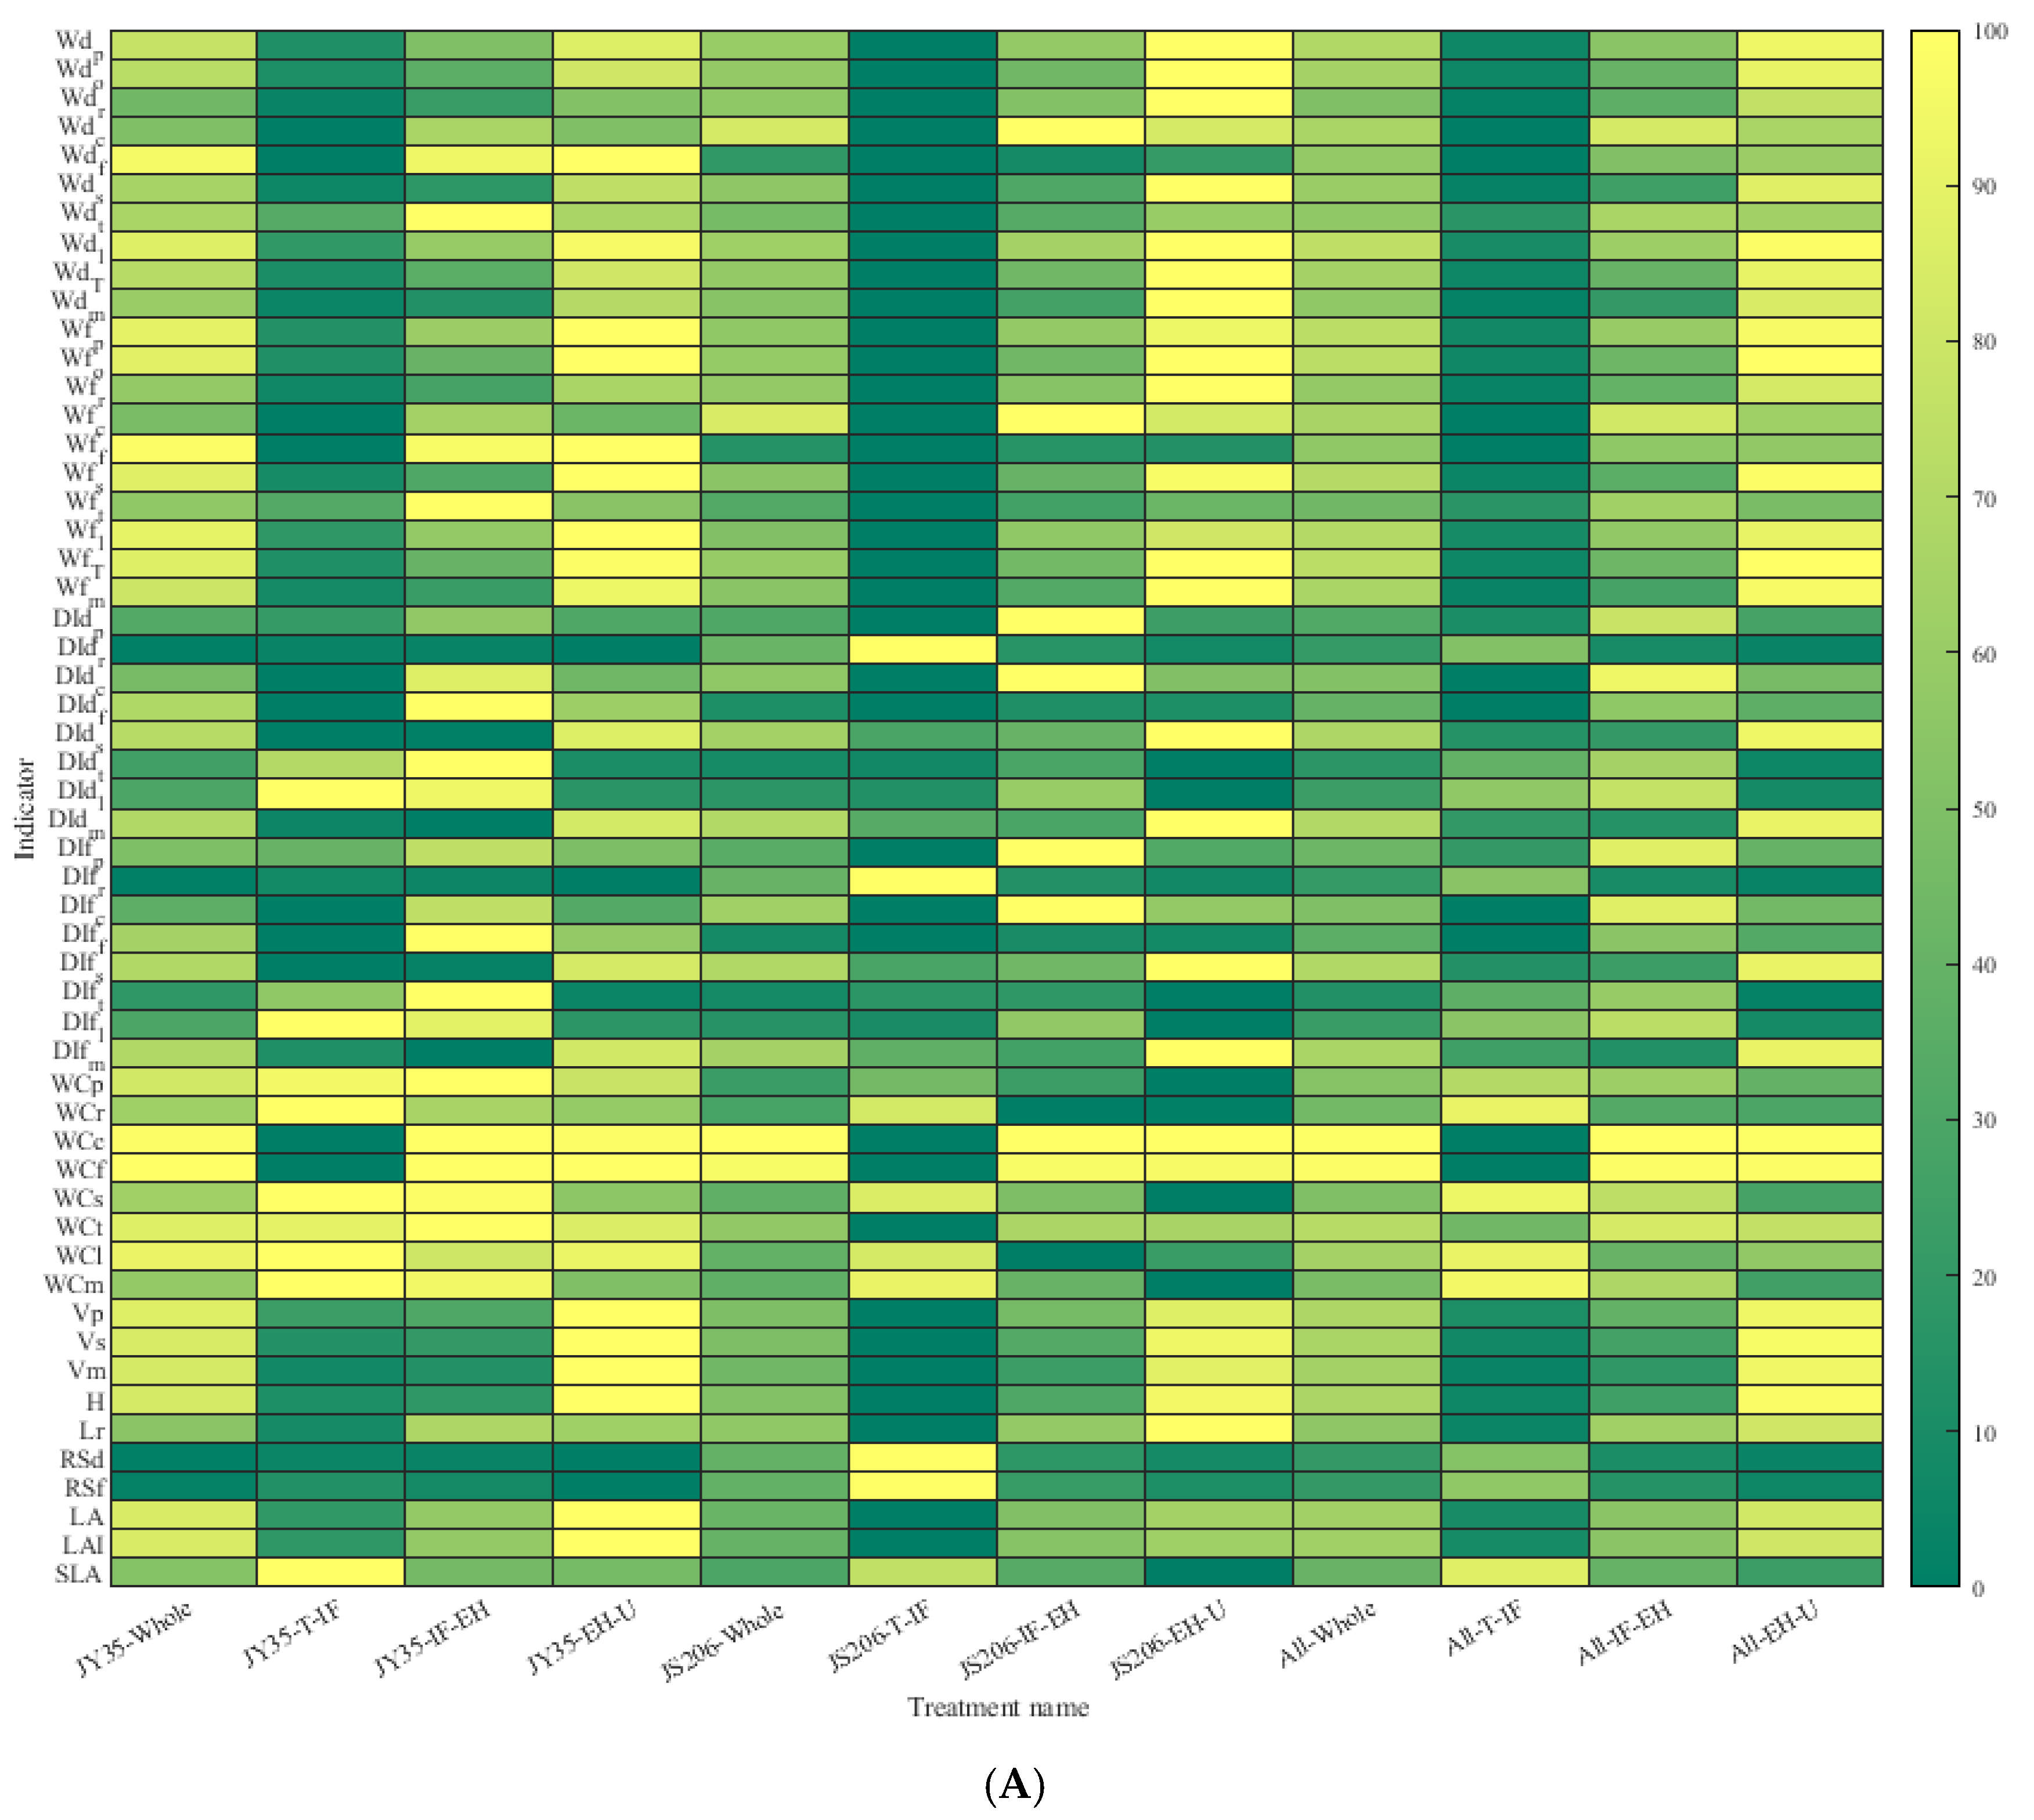
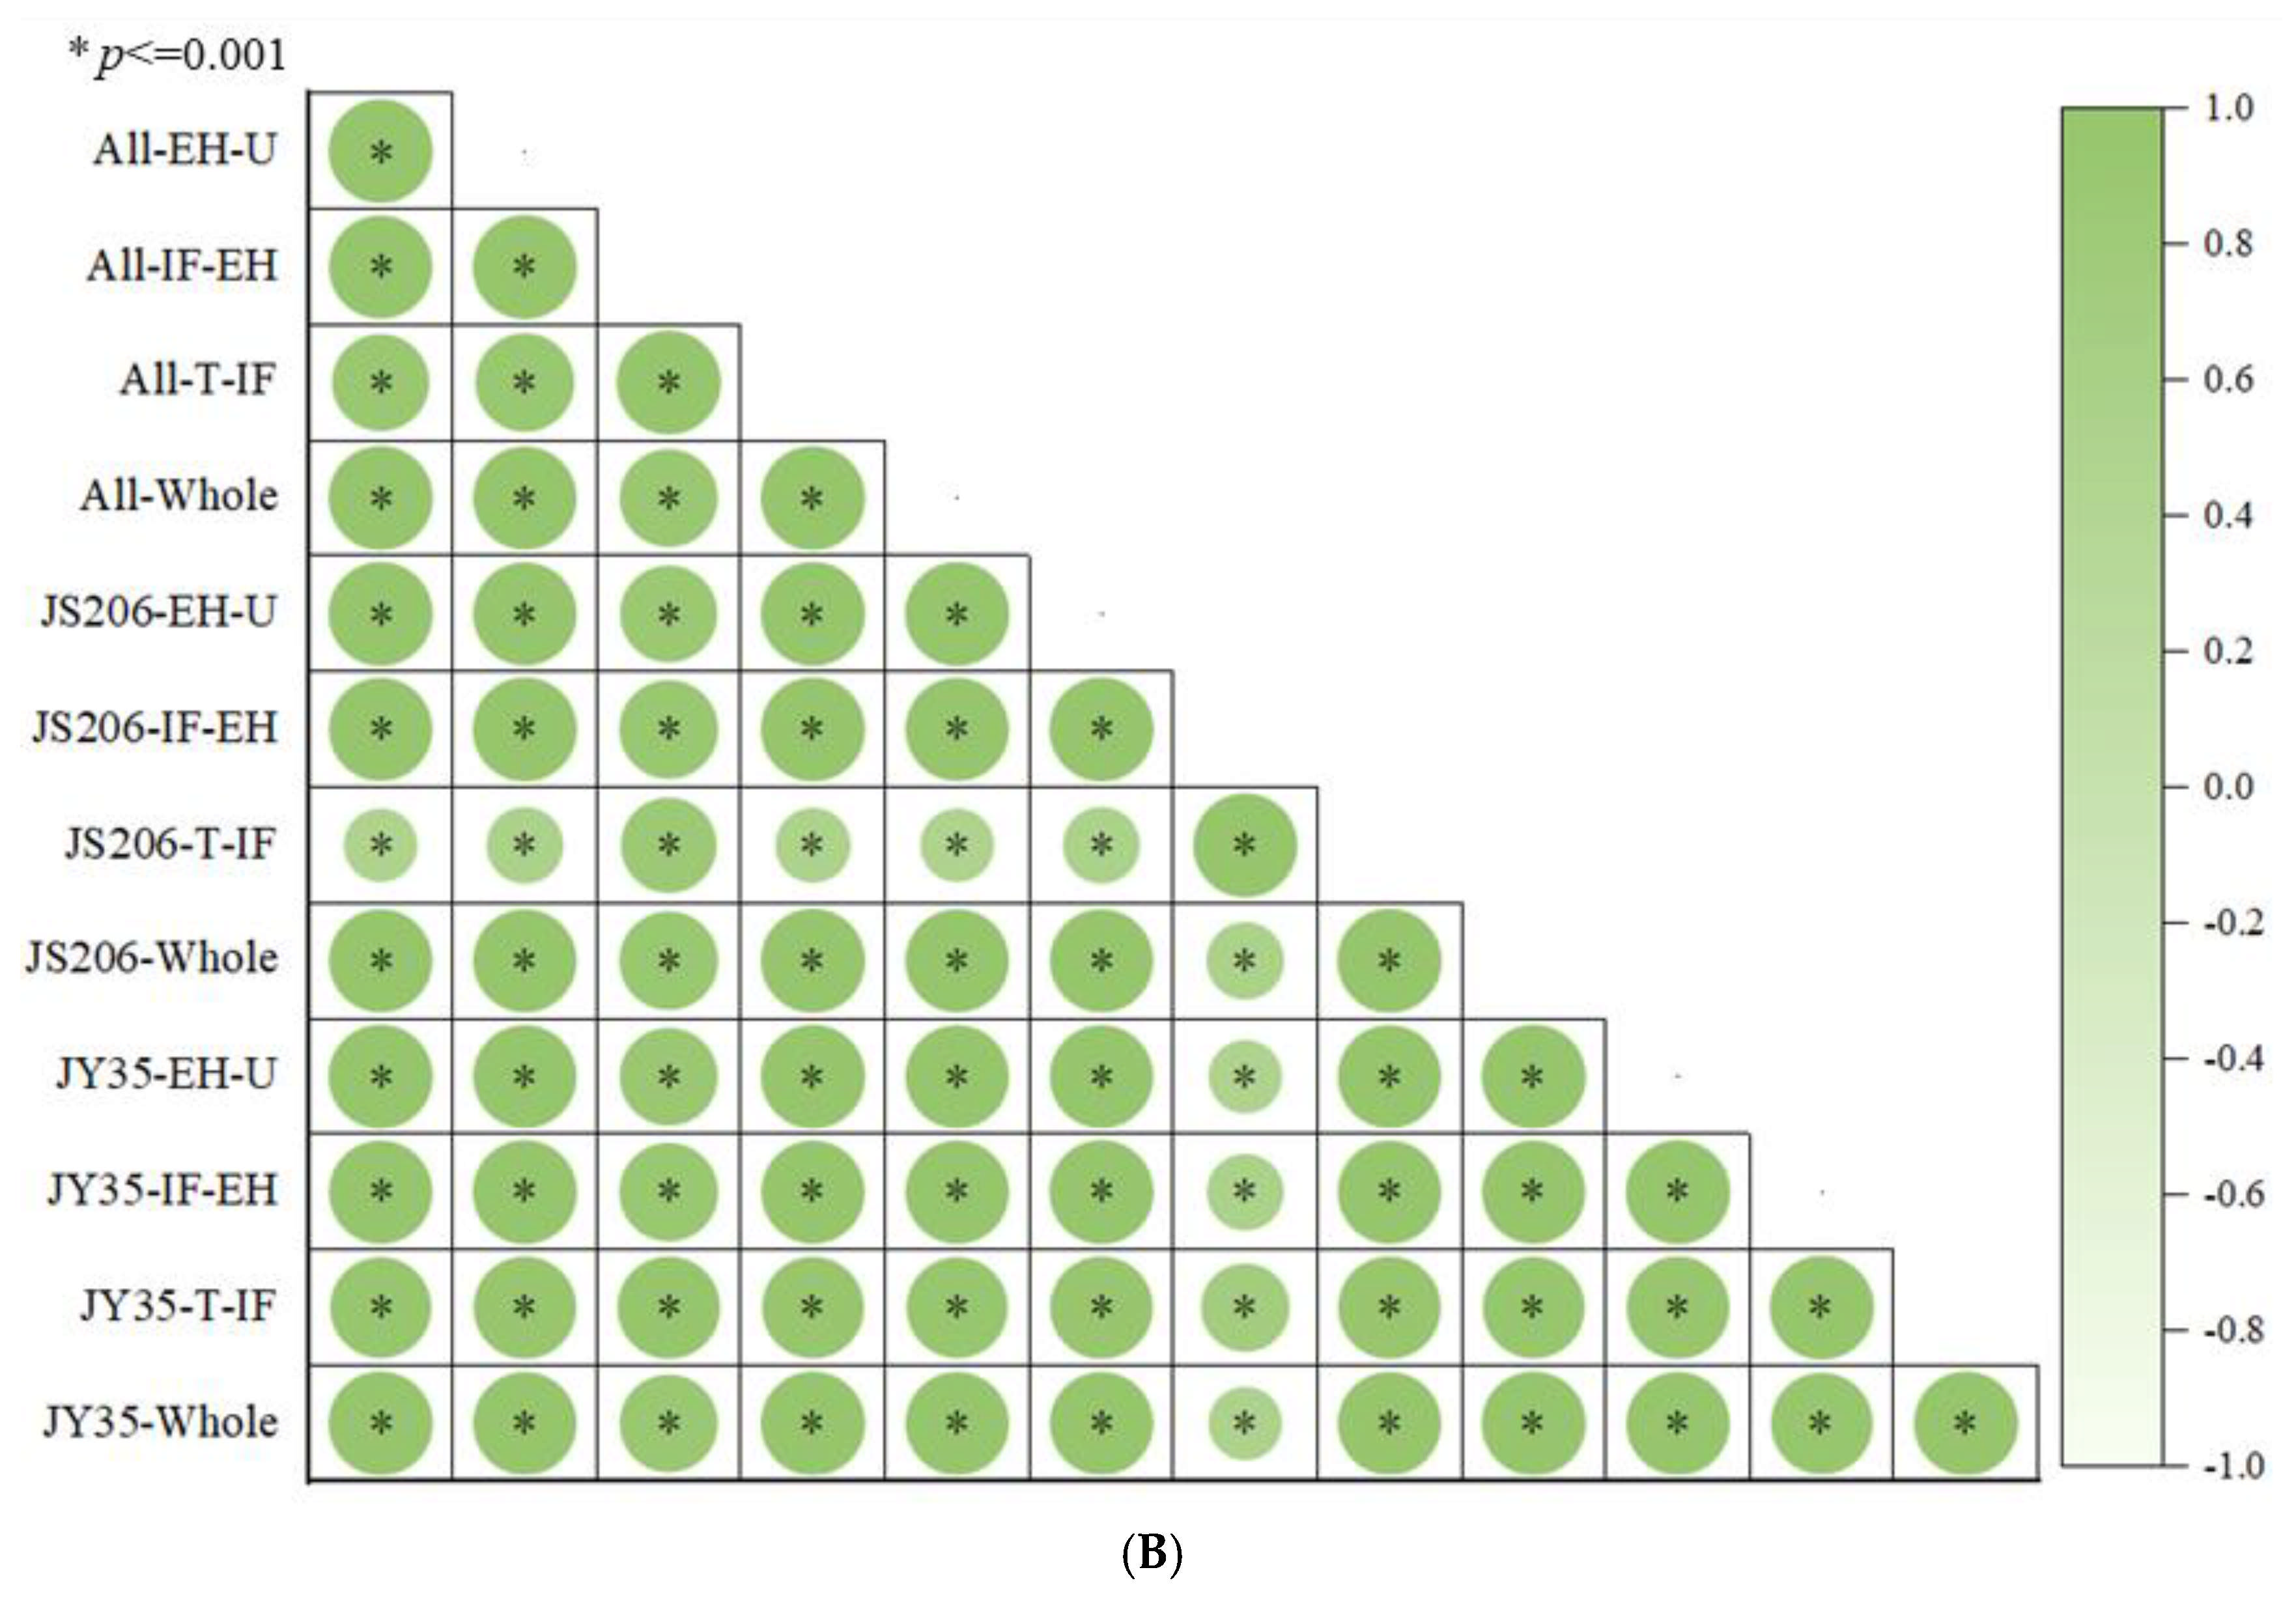
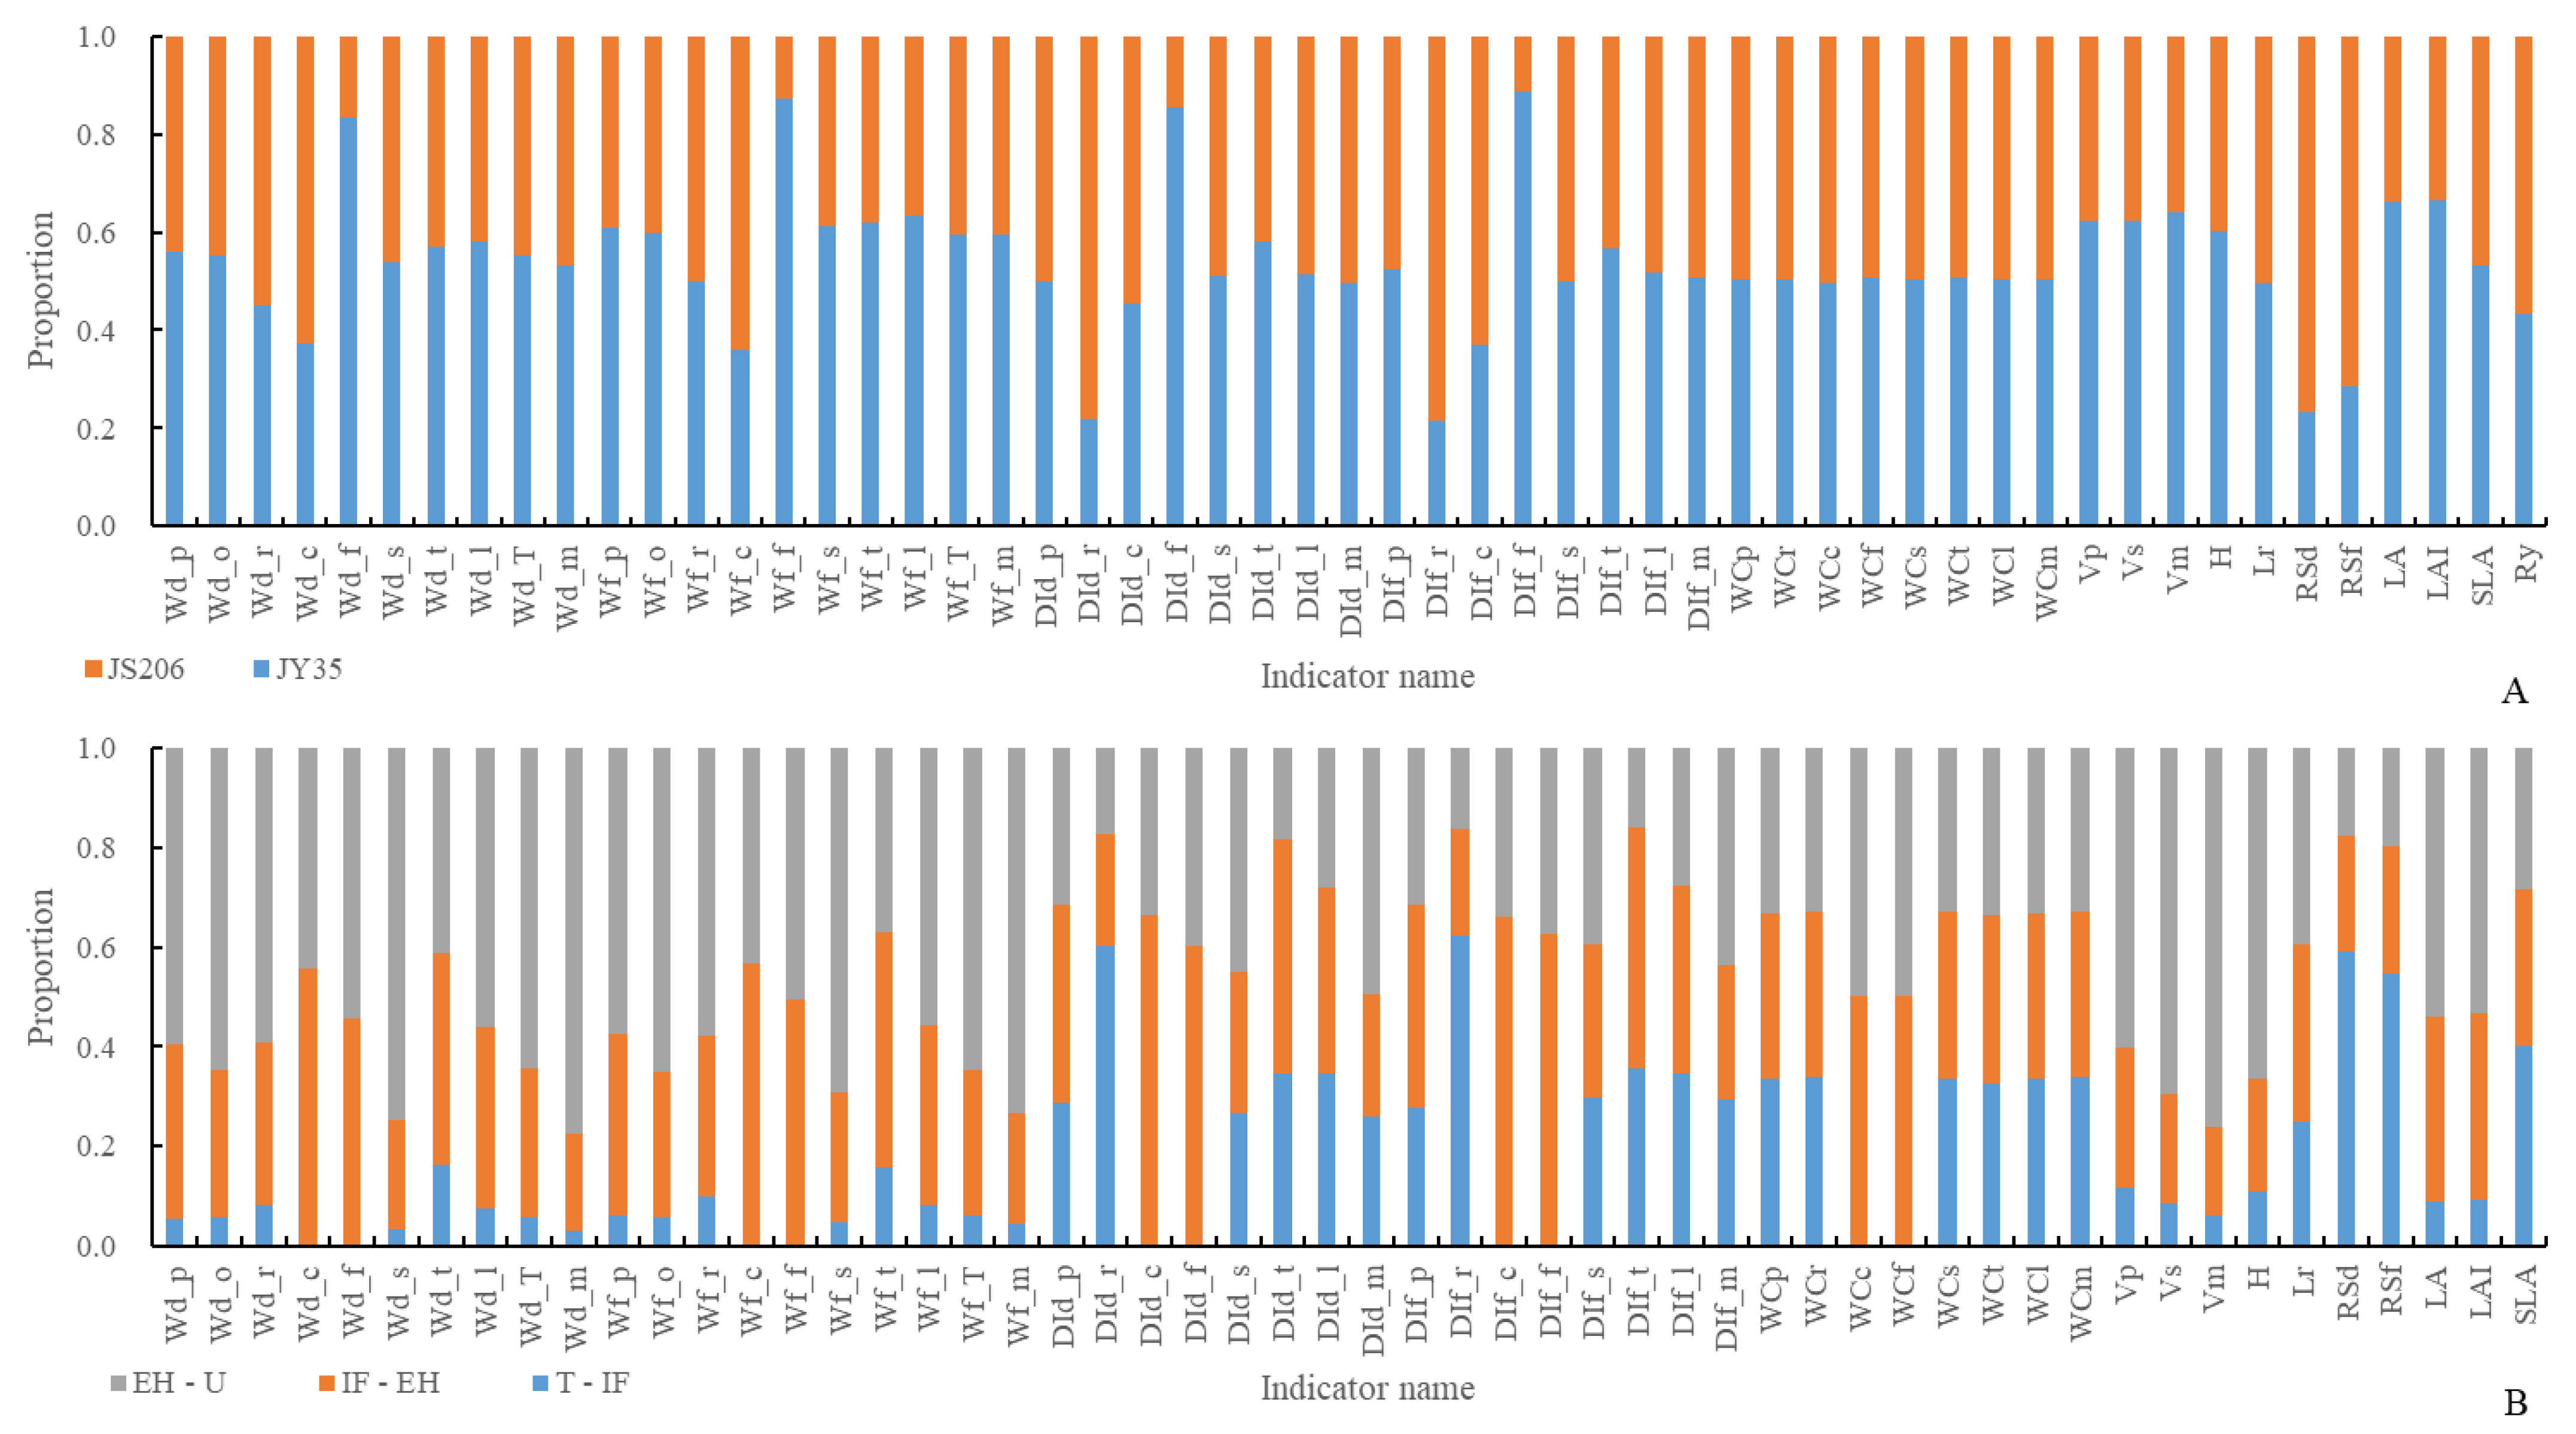
3.1. Analysis of Plant Architecture and Productivity Characteristics at Different Development Stages of Different Varieties

According to Figure 1A and Figure 2, regarding organ dry and fresh weights, the order of organ dry weight from largest to smallest is leaf > main stem > petiole > root > flower > tendril > carpopodium, while the order of organ fresh weight from largest to smallest is main stem > leaf > petiole > root > flower > tendril > carpopodium. As the number of development days increases, the carpopodium dry and fresh weight shows a stable trend, while the root, main stem, total stem, leaf, petiole, flower, overground part, and overall plant dry and fresh weight show a gradual increase. The tendril dry and fresh weight of JY35 initially increases and then stabilizes, while JS206 shows a continuous increase. The carpopodium dry and fresh weight of JY35 is lower than that of JS206, while the tendril, main stem, total stem, leaf, petiole, flower, overground part, and overall plant dry and fresh weight are higher in JY35. The W d _ r is lower in JY35, but slightly higher in W f _ r compared to JS206. Regarding organ dry weight distribution index, the order of distribution index from largest to smallest is leaf > main stem > petiole > root > flower > tendril > carpopodium, while the order of fresh weight distribution index from largest to smallest is main stem > leaf > petiole > root > flower > tendril > carpopodium. As the number of development days increases, the petiole and tendril dry and fresh weight distribution indices initially increase and then decrease, the main stem dry and fresh weight distribution index decreases and then increases, the root, carpopodium, and flower dry and fresh weight distribution indices gradually decrease, and the stem dry and fresh weight distribution index shows a gradual increase. The carpopodium dry and fresh weight distribution index of JY35 decreases gradually, while JS206 initially increases and then decreases. The root and carpopodium dry and fresh weight distribution indices are lower in JY35, while the tendril, total stem, leaf, petiole, flower, overground part, and overall plant dry and fresh weight distribution indices are higher in JY35. The D I d _ s is slightly lower, but the D I f _ s is slightly higher in JY35 compared to JS206. Regarding organ water content, the order of water content from largest to smallest is petiole > main stem > carpopodium > tendril > flower > root > leaf. There is no significant difference in water content among the organs as the number of development days increases. The W C c of JY35 is slightly lower than that of JS206, while the W C r , W C t , W C m , W C l , W C p , and W C f are slightly higher in JY35. Regarding organ volume, the order of volume from largest to smallest is total stem > main stem > petiole. As the number of development days increases, the V s , V m , and V p show a gradual increase. The V s , V m , and V p are higher in JY35 compared to JS206. Regarding other morphological plant architecture characteristics and productivity indicators, H , L r , L A , and L A I show a gradual increase, while the R S d , R S f , and S L A show a gradual decrease. The L r , R S d , R S f , and R y are lower in JY35 compared to JS206, while H , L A , L A I , and S L A are higher in JY35. According to Figure 1B, there is a highly significant correlation between the plant architecture and productivity indicators of different varieties at different developmental stages.

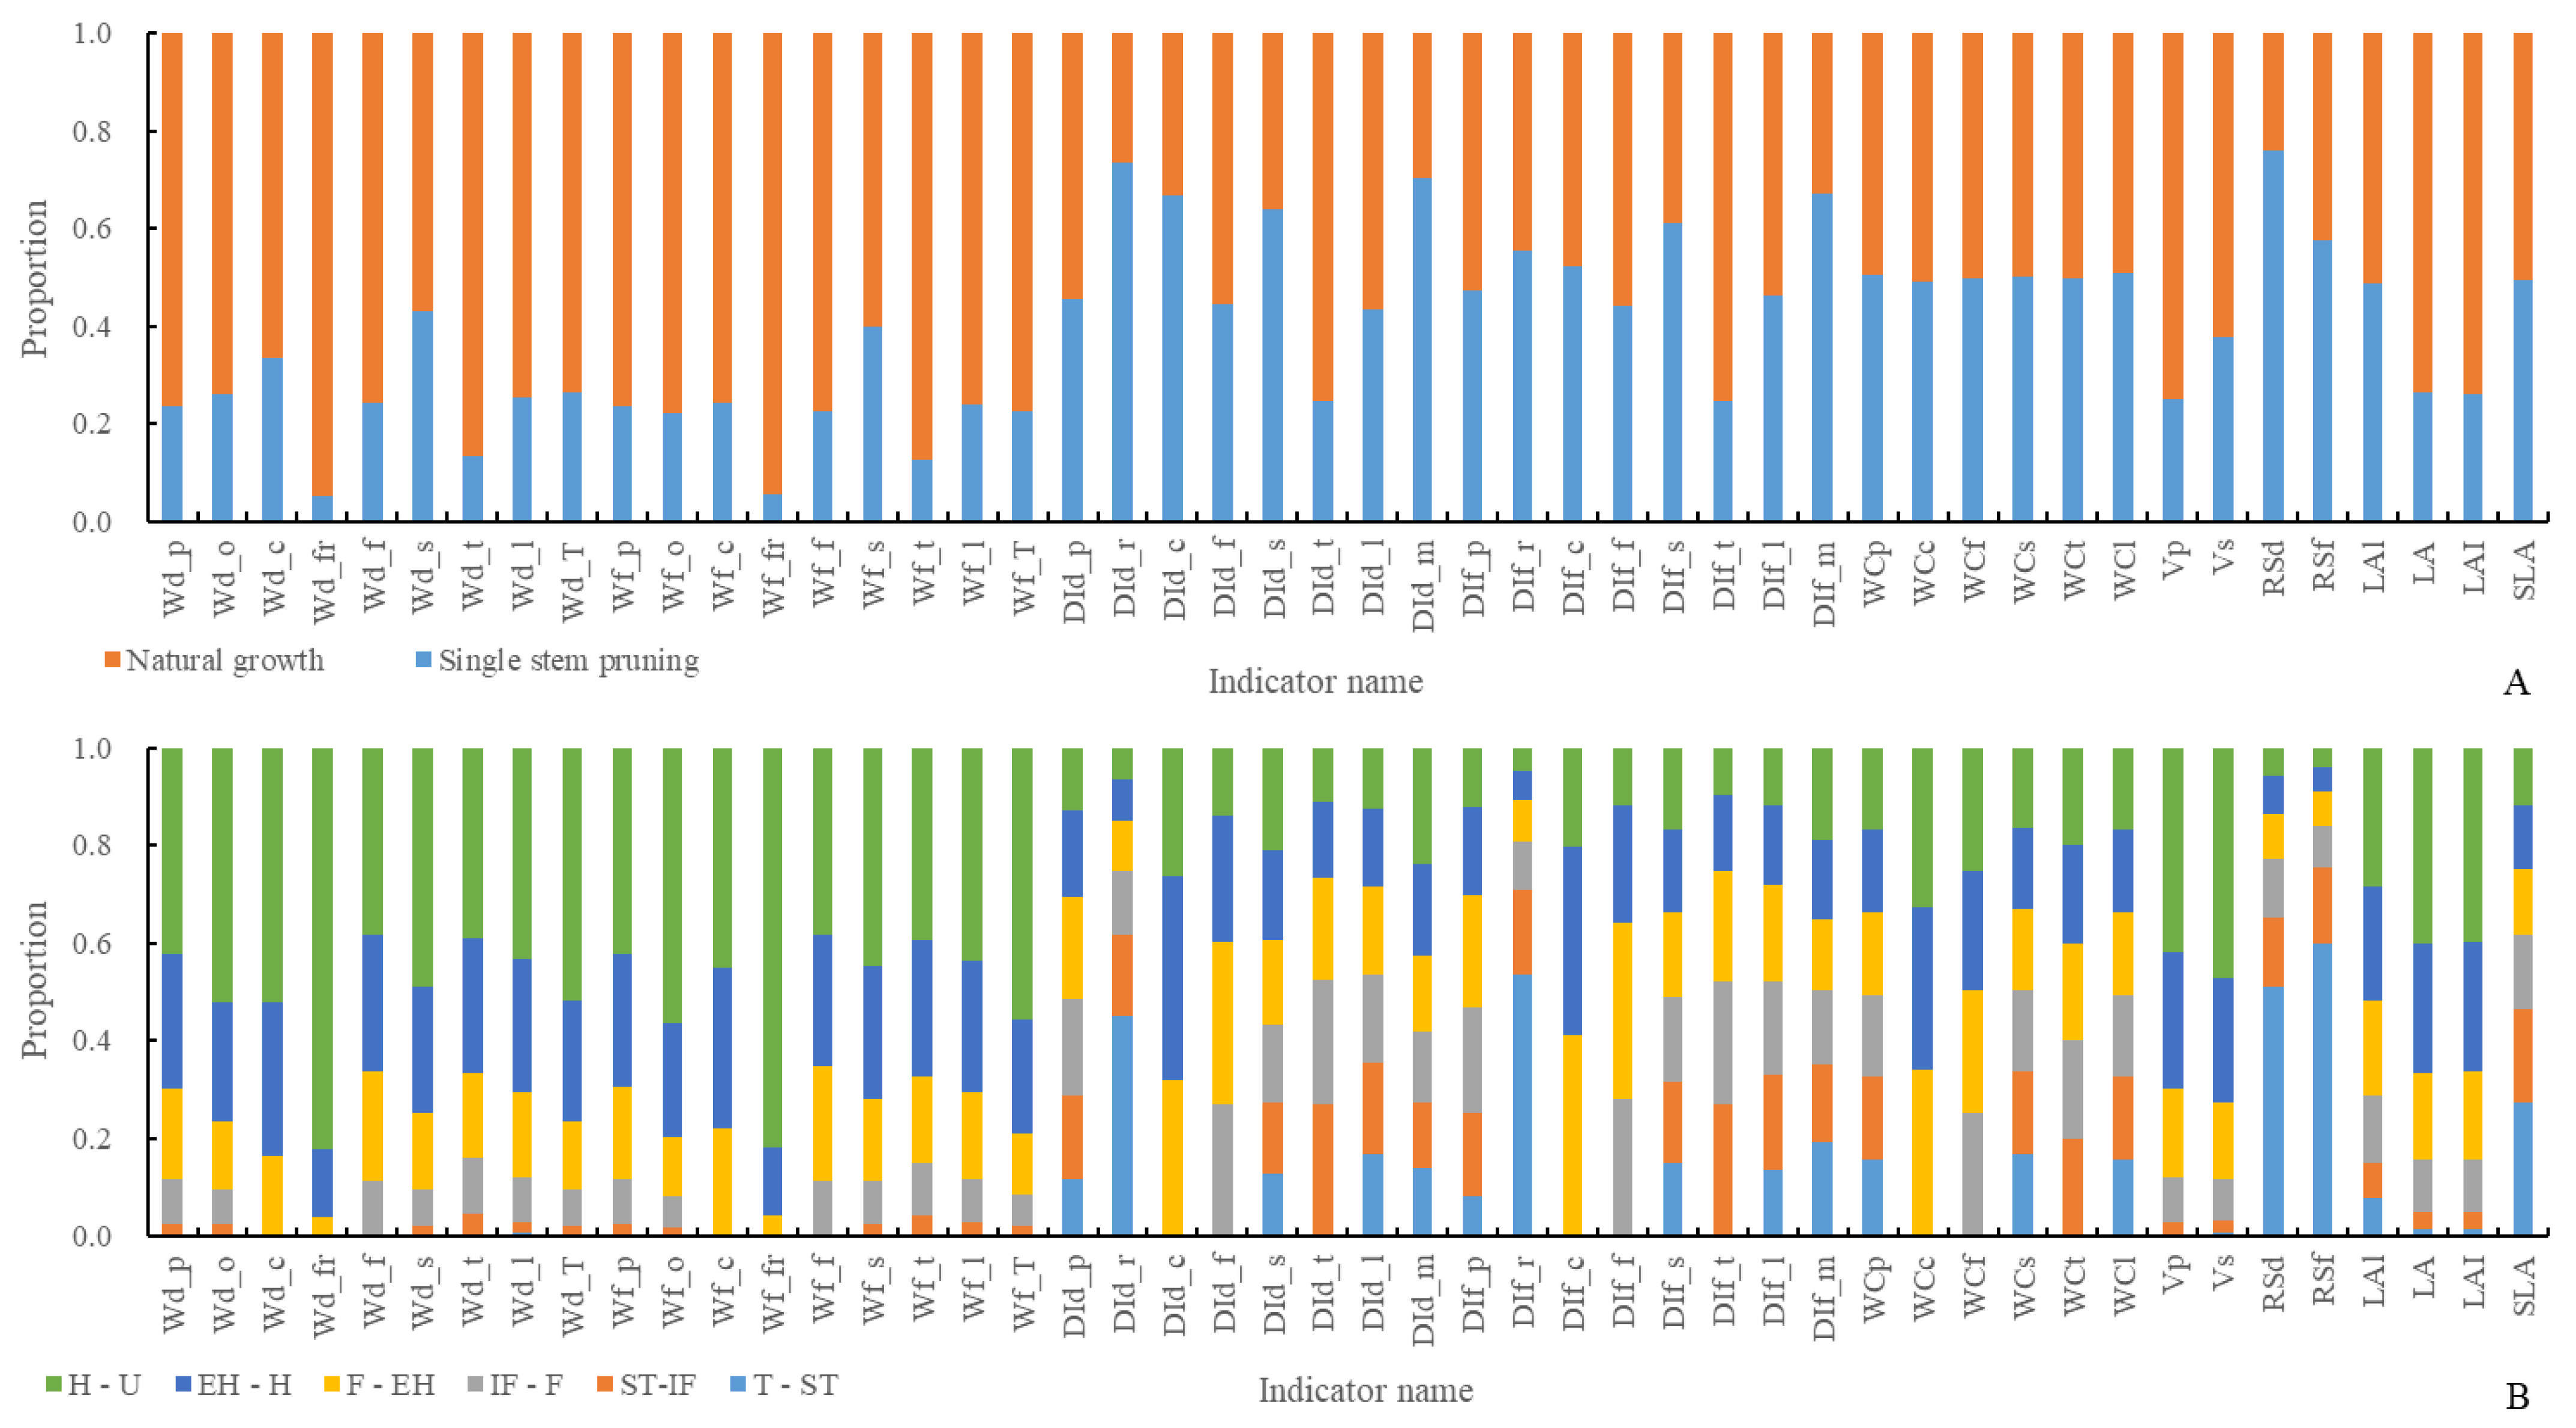
3.2. Analysis of Plant Architecture and Productivity Characteristics at Different Development Stages Under Different Pruning Methods

From Figure 3A, it can be observed that with an increase in the number of development days, the dry and fresh weight of root, fruit, main stem, and fruit dry and fresh weight distribution index show a gradual increase. Regarding organ length indicators, as the number of development days increases, H , D f , W l , D p , L i s , and D i s show a gradual increase. L r , L f , L l , and L p show an initial increase followed by a stable trend, while L c shows an initial increase followed by a decrease. Regarding organ volume indicators, with an increase in the number of development days, the V m and V f show a gradual increase. Concerning organ quantity indicators, the N s n and N s n show a gradual increase in the number of development days. Regarding organ water content, the order of water content from largest to smallest is fruit > main stem > root. There is no significant difference in water content among the organs as the number of development days increases. Regarding organ color indicators, as the number of development days increases, the darkness value shows a stable trend, the lightness value shows an initial increase followed by a decrease, the hue angle shows an initial decrease followed by an increase, H l shows an initial increase followed by a decrease, and H f shows an initial decrease followed by an increase. Regarding other plant architecture characteristics and productivity indicators, C C shows an initial decrease followed by an increase, S I shows an initial increase followed by a decrease, and R f , R e , F , S S C , S P , S S , and V C show a gradual increase. From Figure 3B, there is a highly significant correlation between consistency indicators of plant architecture and productivity characteristics within six key developmental stages of two pruning methods of JS206.
From Figure 4A and Figure 5A, regarding organ dry and fresh weights, the order of dry weight from largest to smallest is leaf > fruit > petiole > carpopodium > flower > tendril, while the order of fresh weight from largest to smallest is leaf > fruit > petiole > carpopodium > tendril > flower. With an increase in the number of development days, overground part, stem, tendril, and leaf dry and fresh weight show a gradual increase, while carpopodium, fruit, and flower dry and fresh weight show an initial increase followed by a stable trend. W d _ p shows a gradual increase, while W f _ p shows an initial increase followed by stability. Regarding organ dry weight distribution index, the order of distribution index from largest to smallest is leaf > main stem > root > petiole > tendril > flower > carpopodium, while the order of fresh weight distribution index from largest to smallest is main stem > leaf > petiole > root > carpopodium > tendril > flower. With an increase in the number of development days, petiole, flower, and leaf dry and fresh weight distribution indices show an initial increase followed by a decrease; the main stem dry and fresh weight distribution index shows an initial decrease followed by an increase, and the root, carpopodium, and tendril dry and fresh weight distribution indices show a gradual decrease. The D I d _ s shows an initial decrease followed by an increase, while the D I f _ s shows a gradual increase. Regarding organ water content, the order of water content from largest to smallest is petiole > carpopodium > total stem > tendril > flower > leaf. There is no significant difference in water content among the organs as the number of development days increases. Regarding organ volume, the order of volume from largest to smallest is total stem > petiole volume, consistent with SP. With an increase in the number of development days, the V s shows a gradual increase, and the V p shows a gradual increase, then stabilizes. Regarding other plant architecture characteristics and productivity indicators, L A and L A l shows a gradual increase, while L A I shows an initial increase followed by stability. The R S d , R S f , and S L A show a gradual decrease.
From Figure 4A and Figure 5B, regarding organ dry and fresh weights, the order of dry weight from largest to smallest is fruit > leaf > petiole > tendril > flower > carpopodium, while the order of fresh weight from largest to smallest is fruit > leaf > petiole > tendril > carpopodium > flower. With an increase in the number of development days, all organs show a gradual increase in dry and fresh weights. Regarding organ dry weight distribution index, the order of distribution index from largest to smallest is leaf > main stem > petiole > root > tendril > flower > carpopodium, while the order of fresh weight distribution index from largest to smallest is leaf > main stem > petiole > root > carpopodium > tendril > flower. With an increase in the number of development days, the distribution index of dry and fresh weight of petioles and total stems shows a trend of first increasing and then decreasing, while the distribution index of dry and fresh weight of roots, flowers, and tendrils shows a gradually decreasing trend. The D I d _ p , D I d _ m , and D I f _ l shows a trend of first increasing and then decreasing, while the D I f _ p , D I f _ m , and D I d _ l shows a gradually decreasing trend. Regarding organ water content, the order of water content from largest to smallest is carpopodium > total stem > petiole > tendril > flower > leaf. There is no significant difference in water content among the organs as the number of development days increases. Regarding organ volume, the order of volume from largest to smallest is total stem > petiole volume. With an increase in the number of development days, the V s and V p show a gradual increase. Regarding other plant architecture characteristics and productivity indicators, L A l , L A , and L A I show a gradual increase, while the R S d , R S f , and S L A show a gradual decrease.
From Figure 4B, except for the weak correlation between the T-ST developmental stage of JS206 treated with SP and other developmental stages, there is a highly significant correlation between plant architecture and productivity indicators with different pruning methods and developmental stages.
In summary, under the SP method, the dry weight distribution index of root, carpopodium, total stem, and main stem, as well as the water content and root-to-shoot ratio of petiole, total stem, and leaf, are lower compared to NG. However, the remaining plant architecture characteristics and productivity indicators are higher than those of NG. Regarding organ dry and fresh weights, under both pruning methods, the order of dry weight from largest to smallest is fruit > leaf > main stem > petiole > root > tendril > flower > carpopodium, while the order of fresh weight from largest to smallest is fruit > leaf > main stem > petiole > root > tendril > carpopodium > flower. Regarding organ dry weight distribution index, the order of distribution index from largest to smallest is leaf > main stem > fruit > petiole > root > tendril > flower > carpopodium, while the order of fresh weight distribution index from largest to smallest is fruit > leaf > main stem > petiole > root > tendril > carpopodium > flower. Regarding organ water content, the order of water content from largest to smallest is carpopodium > petiole > total stem > tendril > flower > leaf. There is no significant difference in water content among the organs as the number of development days increases. Regarding organ volume, the order of volume from largest to smallest is total stem > fruit > main stem > petiole volume.

4. Discussion

4.1. The Impact Mechanism of Crop Varieties on Plant Plasticity

The formation of differences in plant architecture and productivity among cucumber varieties is attributed to the dual effect of genetic background and environmental factors. Previous studies found significant differences in nitrogen absorption efficiency among 32 North China-type cucumber varieties, which is mainly related to allelic variation in root system configuration genes [27]. Previous studies have focused on 12 new cucumber varieties from the Cucumber Research Institute of Tianjin Agricultural Academy as the experimental materials. By measuring various growth, quality, photosynthetic, yield, and field performance indicators of different varieties, it was found that the Jin You series had higher values of plant height, stem thickness, and leaf area compared to the Jin Sheng series but lower yield. This suggests that the Jin You series has a stronger leaf area and light capture capacity, while the Jin Sheng series has a higher root-to-shoot ratio and assimilate transport efficiency [28]. This is consistent with the findings of this study, which further reveals the superior plant architecture characteristics and productivity of the Jin Sheng series in terms of indicators such as carpopodium dry and fresh weight, root dry weight, dry and fresh weight distribution index of root and carpopodium, main stem dry weight distribution index, carpopodium water content, maximum root length, root-to-shoot ratio, and individual yield increment rate. These indicators reflect the genetic characteristics of the ‘source-sink’ relationship regulation.

4.2. Dynamic Regulation Rules of Developmental Stages

This study divided the cucumber growth period into seven key stages and revealed the temporal regulatory patterns underlying the formation of plant architecture characteristics. Previous research has quantified the growth and development processes of different crop varieties and their relationship with climate factors, soil characteristics, and management techniques. By identifying key variety parameters and constructing predictive models for plant architecture characteristics and productivity of different crop varieties, it provides digital support for cucumber production forecasting, early warning, and optimization of crop variety design [1,3,29,30,31]. This study found that indicators such as plant height, total leaf area per plant, and leaf area index showed a gradual increase, while indicators such as root-to-shoot ratio and specific leaf area showed a gradual decrease, with variations among different varieties. For example, JY35 had a lower maximum root length, root-to-shoot ratio, and individual yield increment rate compared to JS206 but higher plant height, maximum root length, total leaf area per plant, leaf area index, and specific leaf area. This specific response during the developmental stages provides a time window for precision cultivation. For example, regulating light and temperature conditions during the flower bud differentiation stage can increase the individual yield increment rate.

4.3. The Impact Mechanism of Pruning Method on Plant Plasticity

Different pruning methods induce the plasticity of plant architecture by altering the source–sink balance, leading to significant differences in the distribution index of organ dry and fresh weights, which are directly related to changes in cytokinin concentration caused by the release of apical dominance. Previous studies used the cumulative irradiance method to construct simulation models for cucumber growth and development under two different pruning methods, and the trends in leaf area changes and leaf area index were consistent with the results of this study [32]. Previous studies constructed simulation models for cucumber growth and development under different pruning methods using the temperature and light effect method, and the trends in individual dry weight, leaf area, soluble sugar, and vitamin C content were consistent with the results of this study [33]. The differential response of fruit quality indicators was related to changes in key enzyme activities involved in sugar metabolism, providing a biochemical basis for targeted quality regulation. This study found consistency in certain plant architecture characteristics and productivity indicators of cucumber under the two pruning methods. For example, as the number of development days increased, indicators such as leaf and fruit darkness values showed a stable trend, while indicators such as color values showed an initial increase followed by a decrease, and color hue values showed an initial decrease followed by an increase. Indicators such as fruit curvature, edibility, hardness, soluble solids, soluble protein, soluble sugar, and vitamin C showed a gradual increase. Regarding inconsistent indicators under the two pruning methods, this study found that under the SP method, the dry and fresh weight distribution index of root, carpopodium, total stem, and main stem, as well as the water content of petiole, total stem, and leaf, and the root-to-shoot ratio were lower compared to NG, while the remaining indicators were higher than NG.
Future research needs to focus on breakthroughs in multi-scale model coupling techniques [34], integrating genomic–phenomic–environmental data flow, and establishing a predictive system from molecular regulatory networks to field phenotypes [35]. At the same time, the development of plant architecture dynamic monitoring technology based on machine vision is needed to achieve real-time calibration of model parameters [36], providing a core driving force for the development of smart agriculture.

5. Conclusions

(1)
Varieties have a significant impact on the plant architecture characteristics and productivity indicators of JY35 and JS206. The dominant plant architecture characteristics and productivity indicators of JY35 include dry and fresh weights of the tendril, main stem, total stem, leaves, petioles, flowers, overground parts, and overall plant, as well as dry and fresh weight distribution index of the tendril, total stem, leaves, petioles, flowers, overground parts, and overall plant, main stem fresh weight distribution index, water content of roots, tendrils, main stem, leaves, petioles, and flowers, volume of total stem, main stem, and petioles, plant height, total leaf area per plant, leaf area index, and specific leaf area. The remaining plant architecture characteristics and productivity indicators are dominated by the plant architecture of JS206;
(2)
Pruning methods have a significant impact on the plant architecture characteristics and productivity indicators of single-stem pruning (SP) and natural growth (NG). The dominant plant architecture characteristics and productivity indicators of the SP method include dry and fresh weight distribution index of roots, fruit carpopodiums, main stems, and total stems, water content of petioles, stems, and leaves, and root-to-shoot ratio. The remaining plant architecture characteristics and productivity indicators are dominated by the NG method.

Author Contributions

Conceptualization, C.C., L.F. and Z.L.; Methodology, C.C., L.F., Z.L. and C.D.; Validation, C.C., L.F., Z.L. and C.D.; Formal analysis, C.C., L.F. and Z.L.; Investigation, C.C., C.D., L.W., Y.W., J.W., Z.G., L.F., Z.L., F.Y. and S.Z.; Resources, C.D., L.W., Y.W., J.W., Z.G., L.F., Z.L., F.Y. and S.Z.; Data curation, C.C., L.F., Z.L. and C.D.; Writing—original draft, C.C.; Writing—review and editing, F.Y. and S.Z.; Visualization, C.C.; Supervision, C.D., L.W., Y.W., J.W., Z.G., L.F., Z.L., F.Y. and S.Z.; Project administration, C.C. and Z.L. All authors have read and agreed to the published version of the manuscript.

Funding

This study received financial support from various sources, including the Tianjin Vegetable Industry Technology System Innovation Team Research Special Project (201716), the Science and Technology Innovation Activity Plan for College Students in Zhejiang Province (New Talent Plan) (2022R434C021, 2023R480014), the National College Student Innovation and Entrepreneurship Training Program (S202210352001X, S202210352009), Lishui City’s ‘Hundred Doctoral Talents Program for Hundred Enterprises’ (2022002), and the Lishui University Talent Launch Fund Project (6604CC01Z).

Data Availability Statement

The data presented in this study are available on request from the corresponding author. The data are not publicly available because the data need to be used in future work.

Conflicts of Interest

The authors declare no conflicts of interest.

References

  1. Cheng, C.; Feng, L.P.; Dong, C.Y.; Chen, X.G.; Yang, F.Y.; Wu, L.; Yang, J.; Zhao, C.S.; Yuan, G.Y.; Li, Z.F. Vegetable commodity organ quality formation simulation model (VQSM) in solar greenhouses. Agriculture 2024, 14, 1531. [Google Scholar] [CrossRef]
  2. Li, A.L.; Hao, C.Y.; Wang, Z.Y. Wheat breeding history reveals synergistic selection of pleiotropic genomic sites for plant architecture and grain yield. Mol. Plant 2022, 15, 504–519. [Google Scholar] [CrossRef]
  3. Cheng, C.; Dong, C.Y.; Guan, X.L.; Chen, X.G.; Wu, L.; Zhu, Y.C.; Zhang, L.; Ding, F.H.; Feng, L.P.; Li, Z.F. CPSM: A dynamic simulation model for cucumber productivity in solar greenhouse based on the principle of effective accumulated temperature. Agronomy 2024, 14, 1242. [Google Scholar] [CrossRef]
  4. Zhan, A.; Liu, J.L.; Yue, S.C.; Chen, X.P.; Li, S.Q.; Bucksch, A. Architectural and anatomical responses of maize roots to agronomic practices in a semi-arid environment. J. Plant Nutr. Soil Sci. 2019, 182, 751–762. [Google Scholar] [CrossRef]
  5. Tang, L.Y.; Yin, D.; Chen, C.C.; Yu, D.Y.; Han, W. Optimal design of plant canopy based on light interception: A case study with loquat. Front. Plant Sci. 2019, 10, 364. [Google Scholar] [CrossRef]
  6. Li, P.F.; Ma, B.L.; Yan, W.K.; Cheng, Z.G.; Li, F.M.; Xiong, Y.C. Plant architecture, plasticity, and adaptation strategies of two oat genotypes under different competition intensities. J. Sci. Food Agric. 2016, 96, 1431–1439. [Google Scholar] [CrossRef]
  7. Cheng, C.; Wu, L.; Yu, W.D.; Yang, F.Y.; Feng, L.P. Dynamic evaluation of winter wheat’s freezing resistance under different low-temperature periods and durations. Sci. Rep. 2025, 15, 8488. [Google Scholar] [CrossRef]
  8. Cheng, C.; Feng, L.P.; Barcena, J.F.B.; Yu, W.D.; Li, G.; Li, Z.F.; Ye, C.H. A growth model based on standardized growing degree days for hydroponic fresh cut tulip in solar greenhouses. Eur. J. Hortic. Sci. 2022, 87, 1–13. [Google Scholar] [CrossRef]
  9. Li, J.X.; Liu, S.S.; Gu, Q.S. Transmission efficiency of cucumber green mottle mosaic virus via seeds, soil, pruning and irrigation water. J. Phytopathol. 2015, 164, 300–309. [Google Scholar] [CrossRef]
  10. Sole, R.A.; Raga, H.A.; Riwukaho, U.J.; Naisanu, J.; Ndun, A.A.; Bunyani, N.A.; Kisse, D.F. Effect of giving lamtoro leaf extract and pruning on cucumber plant production (Cucumis sativus L.). J. Biol. Trop. 2022, 22, 1370–1377. [Google Scholar] [CrossRef]
  11. Cheng, C.; Li, Z.F.; Dong, C.Y.; Gong, Z.H.; Feng, L.P. Simulation and validation of extinction coefficient at different positions of cucumber and celery in solar greenhouse. Trans. Chin. Soc. Agric. Eng. 2020, 36, 243–252. [Google Scholar]
  12. Tian, J.; Wang, C.; Xia, J.; Wu, L.S.; Xu, G.H.; Wu, W.H.; Li, D.; Qin, W.C.; Han, X.; Chen, Q.Y.; et al. Teosinte ligule allele narrows plant architecture and enhances high-density maize yields. Science 2019, 365, 658–664. [Google Scholar] [CrossRef] [PubMed]
  13. Guo, W.; Chen, L.M.; Herrera-Estrella, L.; Cao, D.; Tran, L.S.P. Altering plant architecture to improve performance and resistance. Trends Plant Sci. 2020, 25, 1154–1170. [Google Scholar] [CrossRef] [PubMed]
  14. Li, G.H.; Xue, L.H.; Gu, W.; Yang, C.D.; Wang, S.H.; Ling, Q.H.; Qin, X.; Ding, Y.F. Comparison of yield components and plant type characteristics of high-yield rice between Taoyuan, a ‘special eco-site’ and Nanjing, China. Field Crops Res. 2009, 112, 214–221. [Google Scholar] [CrossRef]
  15. Flint, J.; Eskin, E. Genome-wide association studies in mice. Nat. Rev. Genet. 2012, 13, 807–817. [Google Scholar] [CrossRef]
  16. Henke, M.; Kurth, W.; Buck-Sorlin, G.H. FSPM-P: Towards a general functional-structural plant model for robust and comprehensive model development. Front. Comput. Sci. 2016, 10, 1103–1117. [Google Scholar] [CrossRef]
  17. Abuqamar, S.; Moustafa, K.; Tran, L.S. Mechanisms and strategies of plant defense against Botrytis cinerea. Crit. Rev. Biotechnol. 2017, 37, 262–274. [Google Scholar] [CrossRef]
  18. Cheng, X.Y.; Xu, J.; Liu, H.; Zhu, Z.J.; Xu, Z.H. Effects of re-growth pruning of over-winter cultivated tomato plants on yield and nutrient uptake. Acta Agric. Zhejiangensis 2005, 17, 37–40. [Google Scholar]
  19. Chen, J.F.; Cui, L.H.; Tian, Q.J.; Liu, S.B. Effects of two different pruning methods on growth, development and internal quality of siraitia grosvenorii. Chin. J. Trop. Crops 2013, 34, 1435–1438. [Google Scholar]
  20. Wang, H.R.; Yan, S.H.; Gao, Y.M.; Li, J.S. Effects of different pruning patterns on fruit commodity, nutritional quality and yield of cherry tomato. J. Zhejiang Univ. 2021, 47, 347–353. [Google Scholar]
  21. Wang, H.R.; Li, J.S.; Yan, S.H.; Gao, Y.M. Effect of prunning patterns on canopy light interception characteristics and chlorophyll fluorescence parameters in cherry tomato. Acta Agric. Zhejiangensis 2021, 47, 347–353. [Google Scholar]
  22. Lin, H.X.; Yuan, Z.Q.; Zhang, Z.H.; Xiao, Y.P.; Wang, R.Q.; Lv, F.J. Effects of foliage removal on tuber yield and NPK accumulation and distribution in different cassava types and cultivars. J. Plant Nutr. Fertil. 2021, 27, 1829–1848. [Google Scholar]
  23. Song, M.F.; Zha, G.H.; Chen, J.F.; Lou, Q.F. Research progress on molecular basis of plant architecture related traits in cucumber. Acta Hortic. Sin. 2022, 49, 2683–2702. [Google Scholar]
  24. Ezzat, A.O.; Tawfeek, A.M.; Mohammad, F.; Al-Lohedan, H.A. Modification of magnetite nanoparticles surface with multifunctional ionic liquids for coomassie brilliant blue R-250 dye removal from aqueous solutions. J. Mol. Liq. 2022, 358, 119195. [Google Scholar] [CrossRef]
  25. Li, Y.; Liang, G.; Lu, S.; Wang, H.; Zeng, F.W.; Nai, G.J.; Mao, J.; Chen, B.H. Overexpression of VaSS4 negatively regulates cold tolerance by disturbing ROS balance and decreasing soluble sugar content. Sci. Hortic. 2024, 337, 113590. [Google Scholar] [CrossRef]
  26. Li, X.Y.; Meng, L.; Shen, L.; Ji, H.F. Regulation of gut microbiota by vitamin C, vitamin E and β-carotene. Food Res. Int. 2023, 169, 112749. [Google Scholar] [CrossRef]
  27. Zhao, C.B.; Song, S.R.; Zhao, J.; Zhang, X.M.; Zhang, Y.; Zhang, S.T. Variation in nitrogen uptake and utilization efficiency of different cucumber varieties in Northern China. Sci. Agric. Sin. 2015, 48, 1569–1578. [Google Scholar]
  28. Wang, D.D.; Zhang, Q.Y.; Li, Y.; Qi, L.F.; Niu, R.S.; Shi, J.H. Evaluation of agronomic characters of different cucumber varieties. North. Hortic. 2022, 5, 35–40. [Google Scholar]
  29. Cheng, C.; Feng, L.P.; Xue, Q.Y.; Li, C.; Gong, Z.H.; Dong, C.Y.; Wu, L.; Wang, C.L.; Liu, S.M.; Li, Y.Z.; et al. Simulation model for cucumber growth and development in sunlight greenhouse. Chin. J. Appl. Ecol. 2019, 30, 3491–3500. [Google Scholar]
  30. Cheng, C.; Li, C.; Li, W.M.; Ye, C.Y.; Wang, Y.S.; Zhao, C.S.; Ding, F.H.; Jin, Z.F.; Feng, L.P.; Li, Z.F. Optimal path of the simulation model in horticultural crop development and harvest period. Trans. Chin. Soc. Agric. Eng. 2023, 39, 158–167. [Google Scholar]
  31. Cheng, C.; Dong, C.Y.; Li, Z.F.; Gong, Z.H.; Feng, L.P. Simulation model of external morphology and dry matter accumulation and distribution of celery in solar greenhouse. Trans. Chin. Soc. Agric. Eng. 2021, 37, 142–151. [Google Scholar]
  32. Li, Y.X.; Luo, W.H.; Ni, J.H.; Chen, Y.S.; Xu, G.B.; Jin, L.; Dai, J.F.; Chen, C.H. Simulation of leaf area, photosynthetic rate and dry matter production in greenhouse cucumber based on product of thermal effectiveness and photosynthetically active radiation. Trans. Chin. Soc. Agric. Eng. 2005, 21, 131–136. [Google Scholar]
  33. Tan, W.; Yang, Z.Q.; Li, J. Simulation of nutrient quality of pakchoi based on temperature-light function. Chin. J. Agrometeorol. 2016, 37, 59–67. [Google Scholar]
  34. Zhao, G.; Siebert, S.; Enders, A.; Rezaei, E.E.; Yan, C.Q.; Ewert, F. Demand for multi-scale weather data for regional crop modeling. Agric. For. Meteorol. 2015, 200, 156–171. [Google Scholar] [CrossRef]
  35. Zhu, Y.; Tang, L.; Liu, L.L.; Liu, B.; Zhang, X.H.; Qiu, X.L.; Tian, Y.C.; Cao, W.X. Research progress on the crop growth model (CropGrow). Sci. Agric. Sin. 2020, 53, 3235–3256. [Google Scholar]
  36. Yang, Q.; Shi, L.S.; Han, J.Y.; Zha, Y.Y.; Yu, J.; Wu, W.X.; Huang, K. Regulating the time of the crop model clock: A data assimilation framework for regions with high phenological heterogeneity. Field Crops Res. 2023, 293, 108847. [Google Scholar] [CrossRef]
Figure 1. Comparison of plant architecture and productivity characteristics of different cucumber varieties at various development stages, in which the ‘whole’ represents the entire growth and development stage of the plant and the ‘all’ represents the average of two cucumber varieties. ‘T-IF’ represents from Transplanting date (T) to Initial Flowering period (IF), and for other developmental stages, please refer to Table 1. (A) represents a comparative ranking chart of plant architecture and productivity characteristic indicators for 2 crop varieties and 3 key developmental stages, and (B) represents a correlation analysis chart of plant architecture and productivity characteristic indicators for 2 crop varieties and 3 key developmental stages.
Horticulturae 11 00464 g001aHorticulturae 11 00464 g001b
Figure 2. Comparison of plant architecture and productivity characteristics at different developmental stages of different cucumber varieties. (A) is a comparison of plant architecture and productivity characteristics throughout the entire growth cycle of different cucumber varieties, and (B) is a comparison of plant architecture and productivity characteristics at different developmental stages.
Horticulturae 11 00464 g002
Figure 3. Consistency of plant architecture and productivity characteristics at different developmental stages using different pruning methods of JS206, in which the ‘whole’ represents the entire growth and development stage of the plant. ‘T-ST’ represents from Transplanting date (T) to Stretch Tendril period (ST), and for other developmental stages, please refer to Table 1. (A) represents a comparative ranking chart of consistency indicators of plant architecture and productivity characteristics within 6 key developmental stages of 2 pruning methods, while (B) represents a correlation analysis chart of consistency indicators of plant architecture and productivity characteristics within 6 key developmental stages of 2 pruning methods.
Horticulturae 11 00464 g003
Figure 4. Plant architecture and productivity characteristics of different pruning methods at different development stages, in which the ‘whole’ represents the entire growth and development stage of the plant and the ‘AM’ represents the average of 2 pruning methods. ‘T-ST’ represents from Transplanting date (T) to Stretch Tendril period (ST), and for other developmental stages, please refer to Table 1. (A) represents a comparative ranking chart of plant architecture and productivity characteristic indicators within 6 key developmental stages of 2 pruning methods, while (B) represents a correlation analysis chart of plant architecture and productivity characteristic indicators within 6 key developmental stages of 2 pruning methods.
Horticulturae 11 00464 g004
Figure 5. Comparison of plant architecture and productivity characteristics at different developmental stages of different pruning methods. (A) is a comparison of plant architecture and productivity characteristics throughout the entire growth cycle of different pruning methods, and (B) is a comparison of plant architecture and productivity characteristics at different developmental stages of different pruning methods.
Horticulturae 11 00464 g005
Table 1. Division of key development period and morphological index of cucumber.
Developmental PeriodMorphological Characteristics
Transplanting date (T)The third true leaf unfolds, and the fourth true leaf appears, known as ‘Three Leaves and One Heart’
Stretch Tendril period (ST)The fourth true leaf unfolds, and the fifth true leaf appears, known as ‘four leaves and one heart’. The internode length increases, and tendrils appear at the leaf axils, changing from upright to prostrate. At the end of the seedling stage, the plant transitions from slow growth to rapid growth
Initial Flowering period (IF)The first female flower blooms (in cultivation management, only the flowers above the sixth leaf are left, and the flowers below the sixth leaf are removed)
Fruiting period (F)When the root fruit sits (when the fruit turns from yellow green to dark green, it means the root fruit is sitting), the plant flowers wither and grow young fruit that are 2–3 cm long
Early Harvest period (EH)The root fruit is ripe, and the harvesting standard is that the fruit length is about 30 cm. The process of fruit elongation and thickening is basically completed, and it is crispy, tender, and fragrant
Harvest period (H)Usually, on the 30th to 60th day of the fruiting period, plants will rapidly and continuously bloom and bear fruit
Uprooting period (U)Related to seasonal production capacity, crop rotation, utilization of light and heat resources, and human factor
Table 2. Explanation of measurement and calculation methods for cucumber plant architecture and productivity characteristics indicators.
Indicator NameAbbreviationUnitObservation or Calculation Method
Dry weight of petiole W d _ p g/plantOven drying and electronic balance weighing
Dry weight of overground W d _ o g/plant W d _ o = W d _ t + W d _ f + W d _ m + W d _ p + W d _ c + W d _ l
Dry weight of root W d _ r g/plantOven drying and electronic balance weighing
Dry weight of carpopodium W d _ c g/plantOven drying and electronic balance weighing
Dry weight of flower W d _ f g/plantOven drying and electronic balance weighing
Dry weight of stem W d _ s g/plant W d _ s = W d _ m + W d _ p
Dry weight of tendrils W d _ t g/plantOven drying and electronic balance weighing
Dry weight of leaf W d _ l g/plantOven drying and electronic balance weighing
Dry weight of total plant W d _ T g/plant W d _ T = W d _ r + W d _ o
Dry weight of main stem W d _ m g/plantOven drying and electronic balance weighing
Dry weight of fruit W d _ f r g/plantOven drying and electronic balance weighing
Fresh weight of petiole W f _ p g/plantElectronic balance weighing
Fresh weight of overground W f _ o g/plant W f _ o = W f _ t + W f _ f + W f _ m + W f _ p + W f _ c + W f _ l
Fresh weight of root W f _ r g/plantElectronic balance weighing
Fresh weight of carpopodium W f _ c g/plantElectronic balance weighing
Fresh weight of flower W f _ f g/plantElectronic balance weighing
Fresh weight of stem W f _ s g/plant W f _ s = W f _ m + W f _ p
Fresh weight of tendrils W f _ t g/plantElectronic balance weighing
Fresh weight of leaf W f _ l g/plantElectronic balance weighing
Fresh weight of total plant W f _ T g/plant W f _ T = W f _ r + W f _ o
Fresh weight of main stem W f _ m g/plantElectronic balance weighing
Fresh weight of fruit W f _ f r g/plantElectronic balance weighing
Dry weight distribution index of petiole D I d _ p % D I d _ p = W d _ p / W d _ T × 100 %
Dry weight distribution index of root D I d _ r % D I d _ r = W d _ r / W d _ T × 100 %
Dry weight distribution index of carpopodium D I d _ c % D I d _ c = W d _ c / W d _ T × 100 %
Dry weight distribution index of flower D I d _ f % D I d _ f = W d _ f / W d _ T × 100 %
Dry weight distribution index of stem D I d _ s % D I d _ s = W d _ s / W d _ T × 100 %
Dry weight distribution index of tendrils D I d _ t % D I d _ t = W d _ t / W d _ T × 100 %
Dry weight distribution index of leaf D I d _ l % D I d _ l = W d _ l / W d _ T × 100 %
Dry weight distribution index of main stem D I d _ m % D I d _ m = W d _ m / W d _ T × 100 %
Dry weight distribution index of fruit D I d _ f r % D I d _ f r = W d _ f r / W d _ T × 100 %
Fresh weight distribution index of petiole D I f _ p % D I f _ p = W f _ p / W f _ T × 100 %
Fresh weight distribution index of root D I f _ r % D I f _ r = W f _ r / W f _ T × 100 %
Fresh weight distribution index of carpopodium D I f _ c % D I f _ c = W f _ c / W f _ T × 100 %
Fresh weight distribution index of flower D I f _ f % D I f _ f = W f _ f / W f _ T × 100 %
Fresh weight distribution index of stem D I f _ s % D I f _ s = W f _ s / W f _ T × 100 %
Fresh weight distribution index of tendrils D I f _ t % D I f _ t = W f _ t / W f _ T × 100 %
Fresh weight distribution index of leaf D I f _ l % D I f _ l = W f _ l / W f _ T × 100 %
Fresh weight distribution index of main stem D I f _ m % D I f _ m = W f _ m / W f _ T × 100 %
Fresh weight distribution index of fruit D I f _ f r % D I f _ f r = W f _ f r / W f _ T × 100 %
Water content of petiole W C p % W C p = ( W f _ p W d _ p ) / W f _ p × 100 %
Water content of root W C r % W C r = ( W f _ r W d _ r ) / W f _ r × 100 %
Water content of carpopodium W C c % W C c = ( W f _ c W d _ c ) / W f _ c × 100 %
Water content of flower W C f % W C f = ( W f _ f W d _ f ) / W f _ f × 100 %
Water content of stem W C s % W C s = ( W f _ s W d _ s ) / W f _ s × 100 %
Water content of tendrils W C t % W C t = ( W f _ t W d _ t ) / W f _ t × 100 %
Water content of leaf W C l % W C l = ( W f _ l W d _ l ) / W f _ l × 100 %
Water content of main stem W C m % W C m = ( W f _ m W d _ m ) / W f _ m × 100 %
Water content of fruit W C f r % W C f r = ( W f _ f r W d _ f r ) / W f _ f r × 100 %
Length of petiole L p cmUsing a ruler for measurement
Length of stem L s cmUsing a ruler for measurement
Length of main stem L m cmUsing a ruler for measurement
Diameter of petiole D p mmUsing a vernier caliper for measurement
Diameter of stem D s mmUsing a vernier caliper for measurement
Diameter of main stem D m mmUsing a vernier caliper for measurement
Volume of petiole V p cm3 V p = π × ( D p / 10 ) 2 × L p
Volume of stem V s cm3 V s = π × ( D s / 10 ) 2 × L s
Volume of main stem V m cm3 V m = π × ( D m / 10 ) 2 × L m
Plant height H cmDistance between the top of root and the top of the plant
Maximum root length L r cmDistance from the bottom of root to the bottom of the stem
Length of carpopodium L c cmUsing a ruler for measurement
Length of leaf L l cmUsing a ruler for measurement
Length of petiole L P cmUsing a ruler for measurement
Main stem internode stem length L i s cmUsing a ruler for measurement
Width of leaf W l cmUsing a ruler for measurement
Diameter of petiole D P mmUsing a vernier caliper for measurement
Diameter of internode stem length D i s cmUsing a vernier caliper for measurement
Dry root crown ratio R S d g/g R S d = W d _ r / W d _ o
Fresh root crown ratio R S f g/g R S f = W f _ r / W f _ o
Total leaf area per plant L A cm2Using the coordinate paper method
Leaf area per leaf L A l cm2Using the coordinate paper method
Leaf area index L A I m2/m2 L A I = L A d / 10 4 , which d was the planting density
Specific Leaf Area S L A cm2/g S L A = L A / W d _ l
Growth rate of individual plant yield R y g/d R y = W f _ f r / ( D D E H ) , which D was the number of days in transplanting date, and D E H was the number of days in early harvest period related to the variety
Number of fruit N f Observation count
Number of stem nodes N s n Observation count
Chroma L of fruit L f Each point was measured 3 times using the 3nh NR110 precision colorimeter
Chroma a of fruit a f Each point was measured 3 times using the 3nh NR110 precision colorimeter
Chroma b of fruit b f Each point was measured 3 times using the 3nh NR110 precision colorimeter
Chroma L of leaf L l Each point was measured 3 times using the 3nh NR110 precision colorimeter
Chroma a of leaf a l Each point was measured 3 times using the 3nh NR110 precision colorimeter
Chroma b of leaf b l Each point was measured 3 times using the 3nh NR110 precision colorimeter
Hue of fruit H f H f = b f / a f
Color value of fruit C V f C V f = 2000 × a f × a f 2 + b f 2 / L f
Darker value of fruit D V f D V f = 100 L f
Hue of leaf H l H l = b l / a l
Color value of leaf C V l C V l = 2000 × a l × a l 2 + b l 2 / L l
Darker value of leaf D V l D V l = 100 L l
Firmness of fruit F NGY-4 hardness tester tested at 2–3 cm from the bottom, middle, and top of fruit
Length of fruit L f cmUsing a ruler for measurement
Radian of fruit R f cmUsing a ruler for measurement
Diameter of fruit D f mmUsing a vernier caliper for measurement
Volume of fruit V f cm3 V f = 2 × π × ( D f 20 ) 2 × ( L f / 2 ) 2 + R f 2 2 , assuming the fruit is considered two connected cylinders
Shape index of fruit S I S I f r i u t = 2 × ( L f / 2 ) 2 + R f 2 2 D f / 10
Fruit edibility rate R e % R e = W f _ f / ( W f _ c + W f _ f ) × 100 %
Chlorophyll content C C SPADUsing a handheld portable chlorophyll meter
Soluble solid content S S C Brix%Using PAL-1 digital refractometer [3]
Soluble protein content S P mg/gCoomassie Brilliant Blue method [24]
Soluble sugar content S S mg/gAnthrone Colorimetric method [25]
Vitamin C V C mg/kg2,4-dinitrophenylhydrazine method [26]
Disclaimer/Publisher’s Note: The statements, opinions and data contained in all publications are solely those of the individual author(s) and contributor(s) and not of MDPI and/or the editor(s). MDPI and/or the editor(s) disclaim responsibility for any injury to people or property resulting from any ideas, methods, instructions or products referred to in the content.

