Article

Identification and Characterization of Flavonoid Biosynthetic Gene Families in Paeonia Species and Their Roles in Stamen Petalization of Paeonia lactiflora

1
College of Mathematics and Computer Science, Zhejiang A&F University, Hangzhou 311300, China
2
College of Architecture, North China University of Water Resources and Electric Power, Zhengzhou 450046, China
3
College of Water Resources & Civil Engineering, China Agricultural University, Beijing 100083, China
4
National Key Laboratory for Development and Utilization of Forest Food Resources, Zhejiang A&F University, Hangzhou 311300, China
*
Author to whom correspondence should be addressed.
Horticulturae 2025, 11(5), 463; https://doi.org/10.3390/horticulturae11050463
Submission received: 13 March 2025 / Revised: 9 April 2025 / Accepted: 18 April 2025 / Published: 25 April 2025
(This article belongs to the Section Genetics, Genomics, Breeding, and Biotechnology (G2B2))

Abstract

:
Flavonoid biosynthesis is proposed to play a critical role in floral organ development in Paeonia species. However, its specific involvement in stamen petalization remains unclear. This study identified and characterized 13 gene families related to flavonoid biosynthesis across four Paeonia species. Comparative and phylogenetic analysis revealed that most flavonoid biosynthesis-related genes experience lineage-specific expansion in P. ludlowii. Genes belonging to the same family were commonly clustered on chromosomes and displayed highly conserved domain and motif compositions. The cis-element analysis identified Cis-acting elements associated with light, hormonal, and stress responses, implicating their regulatory roles in flavonoid biosynthesis. To further investigate the role of these genes in stamen petalization of P. lactiflora, expression profiling analyses were performed on ‘Fen Yu Nu’ (normal stamens) and ‘Lian Tai’ (petaloid stamens) cultivars using transcriptomic data released previously. Three quercetin-related genes revealed distinct stage-specific patterns in ‘Fen Yu Nu’ and ‘Lian Tai’. Notably, PlaF3’H03 exhibited significant upregulation during petaloid stamen development in ‘Lian Tai’, suggesting its role in stamen transformation. Molecular docking identified PlaF3’H07 as a key enzyme with strong substrate-binding affinity (ΔG = −4.7 kcal/mol), supporting its catalytic function in quercetin synthesis. The expression pattern of key flavonoid biosynthetic genes was also confirmed across three developmental stages of floral buds by real-time quantitative PCR. This study provides insights into the genetic basis underlying stamen petalization in P. lactiflora and offers potential targets for genetic improvement of floral traits in Paeonia and other ornamental plants.

1. Introduction

Flavonoids represent a distinct class of phenolic compounds characterized by an aromatic ring structure and hydroxyl functional groups [1]. These metabolites are ubiquitous in the plant kingdom and can be categorized into six primary subgroups: chalcones, flavones, flavonols, flavandiols, anthocyanins, and proanthocyanidins [2]. Among these, flavonols, which are synthesized from dihydroflavonols, play a pivotal role in modulating auxin transport and signaling [3]. Their influence stems from their ability to interact with multiple regulatory proteins, thereby affecting cellular auxin dynamics [4]. Quercetin, a prominent member of the flavonol subgroup, is a biologically active natural compound with a C6 (A ring)-C3 (C ring)-C6 (B ring) scaffold [5]. Studies have demonstrated that flavonols like quercetin, kaempferol, and apigenin can hinder the polar movement of auxins, thereby affecting processes like tobacco pollen germination [6,7]. Quercetin interacts directly with PIN proteins, competing with the auxin transport inhibitor (NPA), which disrupts auxin movement in plant tissues and is critical for floral organ identity transitions [8,9,10]. In Arabidopsis thaliana, the tt4 mutation, which blocks flavonol production, becomes ineffective when combined with a mutation in the ABCB4 transporter, suggesting that flavonols regulate ABCB-mediated auxin transport in vivo [11]. Moreover, Quercetin disrupts ABCB1’s interaction with another protein (TWD1), which helps regulate auxin transport [12,13]. While flavonoids are widely recognized for their contribution to floral pigmentation, recent evidence suggests that flavonols like quercetin may also play critical roles in floral organ development, possibly by modulating auxin signaling, redox balance, and other developmental pathways [14].
The genus Paeonia (peonies), comprising 33 species and 26 subspecies [15], is renowned for its ornamental and medicinal value [16], with tree peonies and herbaceous peonies dominating horticultural markets [17,18]. Genomic data of three key species—P. ludlowii, P. ostii, and P. suffruticosa—are publicly available (Figure 1), providing foundational resources for molecular studies. Among their commercial traits, double-flower morphology and intricate pigmentation are critical determinants of market value. To investigate the molecular basis of floral organ development, Fan et al. [19] conducted transcriptome analyses on P. lactiflora, comparing two cultivars: ‘Fen Yu Nu’ (with normal stamens) and ‘Lian Tai’ (with petalized stamens) (Figure 1). Both cultivars belong to the Chinese peony cultivar group and share similar genetic backgrounds and flower colors. In ‘Fen Yu Nu’, the pistils, stamens, and petals develop normally, whereas, in ‘Lian Tai’, the pistils and petals remain unchanged, but the stamens undergo petalization. This study identified transcription factors associated with stamen petalization, yet the underlying molecular mechanisms remain incompletely understood. Recent metabolomic studies in Paeonia have revealed dynamic flavonoid synthesis, particularly of flavonols and anthocyanins, during floral organ development [20], including bud dormancy release [21] and pigmentation [22]. Emerging research has begun to unravel the genetic basis of flavonoid biosynthesis in Paeonia. Transcriptomic analyses of P. lactiflora cultivars with differential petal development revealed coordinated expression of CHS, F3H, and FLS genes, which regulate spatial partitioning of flavonols and anthocyanins across floral tissues [22]. Notably, while flavonoid biosynthesis has been extensively studied in pigmentation, its role in organ identity transitions is largely uncharacterized. Recent advances in Paeonia highlight regulatory complexity: R2R3-MYB transcription factors activate CHS expression in a petal-specific pattern [23], while PqMYBF1 redirects metabolic flux from anthocyanins to flavonols, influencing organ morphology [24].
However, several key knowledge gaps remain. First, the evolutionary dynamics of flavonoid biosynthetic gene families across Paeonia species are still poorly characterized. Second, the regulatory role of cis-acting elements in flavonoid metabolism and its connection to floral organ development is largely unexplored. Third, the functional contribution of specific flavonol biosynthetic genes—particularly F3’H and FLS—to the stamen petalization process remains unclear. To address these questions, we hypothesize that lineage-specific gene expansion and stage-specific expression patterns of quercetin-related biosynthetic genes are crucial drivers of stamen petalization in P. lactiflora. In this study, we systematically identified and characterized 13 core flavonoid biosynthetic gene families across four Paeonia species (P. ludlowii, P. ostii, P. suffruticosa, and P. lactiflora), analyzed their evolutionary relationships, conserved protein motifs, and cis-regulatory elements, and examined the expression patterns and predicted enzymatic activities of F3’H and FLS genes during floral bud development [19,21,25]. Furthermore, we profiled quercetin and its derivatives in petals, petaloid stamens, and normal stamens of P. lactiflora to provide metabolic evidence for their involvement in organ identity transition [26]. By integrating comparative genomics, transcriptomics, and molecular docking, this study aims to elucidate the genetic and biochemical mechanisms underlying flavonoid-mediated stamen petalization and to offer novel insights for the molecular improvement of floral traits in Paeonia.
Figure 1. Taxonomic and morphological characterization of selected Paeonia species. (A) The flower of P. ostii (cited from Zhou et al., 2022 [27]); (B) the flower of P. suffruticosa (cited from Lv et al., 2020 [28]); (C) the flower of P. ludlowii (cited from Xiao et al., 2023 [29]); (D) P. lactiflora ‘Fen Yu Nu’ (FYN); (D1D3) three-stage flower buds of FYN, FYN1 (stamen primordium period), FYN2 (stamens elongated), FYN3 (fully developed stamens); (E) P. lactiflora ‘Lian Tai’ (LT); (E1E3): three floral bud stages of LT, LT1 (stamen primordium stage), LT2 (stamens partly petaloid), LT3 (completely petaloid stamens). Morphologic observations of LT and FYN were cited from Fan et al., 2021 [19].
Horticulturae 11 00463 g001

2. Materials and Methods

2.1. Plant Material Collection, RNA Extraction, and cDNA Synthesis

The plant materials used in this study consisted of terminal underground floral buds from three-year-old Paeonia plants. These buds were collected from the research field at the National Flower Engineering Research Center Germplasm Resource Nursery in Beijing, China (116°39′ E, 40°17′ N). Two P. lactiflora cultivars with distinct stamen developmental patterns were selected for analysis: ‘Fen Yu Nu’ (FYN), which exhibits normal stamen development, and ‘Lian Tai’ (LT), which is characterized by petaloid stamens. For each cultivar, floral buds were examined at three developmental stages. In FYN, the stages included the stamen primordium stage (FYN1), the stamen elongation stage (FYN2), and the fully developed stamen stage (FYN3). In LT, the corresponding stages were the stamen primordium stage (LT1), the partially petaloid stamen stage (LT2), and the fully petaloid stamen stage (LT3). The morphological characteristics and differentiation status of the floral buds were assessed according to standardized methodologies described in previous studies [19,25,30].
Total RNA was extracted from FYN and LT floral buds using Trizol reagent (Life Technologies, Foster City, CA, USA). RNA integrity and quality were evaluated based on established protocols [19]. The purified RNA was then reverse-transcribed into complementary DNA (cDNA) using the GoScript™ Reverse Transcription System (Promega, Madison, WI, USA), following the manufacturer’s guidelines. The resulting cDNA fragments were further purified using the QiAquick PCR Purification Kit (QiAGEN, Düsseldorf, Germany).

2.2. Identification of Gene Family Members in the Flavonoid Biosynthesis Pathway

The protein sequences of AtPAL, AtC4H, At4CL, AtCHS, AtCHI, AtF3H, AtF3’H, AtFLS, AtDFR, AtANS, and AtANR of A. thaliana were retrieved from The A. thaliana Information Resource (TAIR) database (Available online: https://www.arabidopsis.org/, accessed on 13 March 2025) (Table S1). Due to the unavailability of F3’5’H and LAR genes in A. thaliana, we obtained the protein sequences of CsF3’5’H from Camellia sinensis, GmF3’5’H from Glycine max, MtLAR from Medicago truncatula, PtLAR from Pinus taeda, and VvLAR from Vitis vinifera from the National Center for Biotechnology Information (NCBI) database (Table S1).
Using the protein sequences of these genes as a query, the BLAST (v2.5.0) [31] program (E-value < 1 × 10⁻⁵) in software was used to identify homologous genes in the P. ludlowii, P. ostii, and P. suffruticosa genomes [28,29,32]. Then, we used the open-source software package “GFAnno” [33] to obtain the members of 13 families of flavonoid synthesis, using the protein file of P. lactiflora (PRJNA663282) as input. When using the package, we modified some parameters to find more genes (File S1). Subsequently, we combined the outcomes of the blast analysis and identified the overlap between the two results. In the end, we assigned names according to their location on the chromosome.
Identification of F3’H and FLS family members of P. lactiflora by tblastx alignment of A. thaliana F3’H and FLS family member sequences with transcriptome data of P. lactiflora. This part of the identification results is used for gene expression analysis, qPCR experiments, and molecular docking experiments.

2.3. Chromosome Localization Analysis

The chromosomal localization data for each member of the gene family were obtained from the genome databases of P. ludlowii and P. ostii and were visualized with TBtools (version 2.142) [34].

2.4. Phylogenetic Analysis

We conducted a multiple sequence alignment using MAFFT (version 7.525) [35] employing the auto parameter to automatically select the optimal alignment strategy based on input sequence properties. The resulting alignment was trimmed using trimAl (version 1.5.0) [36] to remove poorly aligned regions, the research of which suggests improvements to the quality of subsequent phylogenetic analyses. A maximum likelihood (ML) phylogenetic tree was constructed using IQ-TREE (version 1.6.12) [37]. The substitution model was automatically selected using ModelFinder [38], integrated via the -m MFP option, which evaluates the best-fit model using the Bayesian Information Criterion (BIC). This ensured our tree was built with a model appropriate for our data. To assess branch support robustness, we performed 1000 ultrafast bootstrap replicates using the -bb 1000 parameter [39], balancing computational efficiency with reliability.

2.5. Prediction of Physicochemical Properties and Subcellular Localization of Proteins

The physicochemical properties of proteins from gene family members, including sequence length (aa), molecular weight (kDa), isoelectric point (pI), instability index, and aliphatic index, were predicted using the ExPASy ProtParam tool (available online: http://web.expasy.org/protparam/, accessed on 10 March 2025). Subcellular localization of flavonoid biosynthesis-related proteins was determined using WoLF PSORT II (available online: https://wolfpsort.hgc.jp/, accessed on 10 March 2025).

2.6. Protein Domain and Conserved Motif Analysis

Protein domain prediction for gene family members was conducted using NCBI CD-Search Batch Mode (available online: https://www.ncbi.nlm.nih.gov/Structure/bwrpsb/bwrpsb.cgi, accessed on 10 March 2025) to identify conserved structural domains and their positional information. The results were visualized using TBtools-II [34]. Conserved motif compositions were analyzed using MEME (Multiple EM for Motif Elicitation) Suite 5.5.7 (available online: http://meme-suite.org/tools/meme, accessed on 10 March 2025), with a maximum of 15 motifs, a minimum width of 3, and a maximum width of 60. Visualization of the motifs was also performed by TBtools-II.

2.7. Prediction of Promoter Cis-Acting Elements

The 2000 base pairs (bp) nucleotide sequences upstream of the transcription initiation site of the flavonoid biosynthesis-related genes were extracted to predict the cis-acting elements using PlantCARE (available online: http://bioinformatics.psb.ugent.be/webtools/plantcare/html/, accessed on 13 March 2025) [40], and the results were visualized by TBtools-II.

2.8. Transcriptional Expression and qRT-PCR Validation of Quercetin Synthesis-Related Genes in P. lactiflora

Raw RNA-seq data from FYN and LT floral buds at three developmental stages were obtained from the NCBI Sequence Read Archive (SRA) database under project number PRJNA663282. Gene expression levels were quantified using the Reads Per Kilobase per Million mapped reads (RPKM) method [41], which normalizes read counts to account for differences in sequencing depth and transcript length. To assess the statistical significance of gene expression differences during floral bud development, a one-way analysis of variance (ANOVA) was performed by IBM Statistics SPSS version 27 for each candidate gene across six developmental stages (FYN1–FYN3, LT1–LT3).
The qRT-PCR experiments adhered to the protocol outlined by the manufacturer for TB Green® Premix Ex Taq™ (Tli RNaseH Plus, RR420A; TaKaRa BIO, Shiga, Japan). Primers, detailed in Supplementary Table S2, were crafted using Primer3Plus and produced by Beijing Ruibo Xingke Biotechnology Co., Ltd., Beijing, China. The PCR process was initiated with a 3 m activation phase at 95 °C, followed by 40 cycles that included denaturation at 95 °C for 20 s, annealing at 60 °C for 20 s, and extension at 72 °C for 45 s. Fluorescence was recorded in 1 °C steps during the reaction. All qRT-PCR tests were run in three replicates, with gene expression levels determined via the 2−ΔΔCt method, a common technique for comparative Ct analysis [42].

2.9. Targeted Metabolite Profiling of Quercetin Derivatives

To investigate flavonol dynamics during stamen petalization, we performed a secondary analysis of quercetin-related metabolites using publicly available metabolomic data from the study by Liu et al., 2022 [26] (PMID: [36054136]), which employed ultra-performance liquid chromatography-tandem mass spectrometry (UPLC-MS/MS) to profile metabolites in P. lactiflora cv. ‘Zijinlian’. The original dataset included three tissue types: fully developed petals, partially petaloid stamens, and normal stamens. Quercetin and its derivatives were selected based on MS/MS spectral matches with a similarity score of at least 0.5 and consistent retention times. Normalized ion intensity data for 20 quercetin-related metabolites were extracted and standardized using Z-score transformation. The Euclidean distance was employed to metrically complete the linkage method to visualize tissue-specific accumulation patterns. To assess the differential accumulation of quercetin-related metabolites among petals (Ps), petaloid stamens (PSs), and normal stamens (Ss), pairwise Student’s t-tests were performed for each metabolite across the three tissue types. Metabolites with |Log2FC| > 1 and p-value < 0.05 were considered significantly differentially accumulated. Bubble plots were generated to integrate statistical significance (color-coded by FDR) and magnitude of differential accumulation (bubble size scaled to |Log2FC|). All analyses were implemented in R (v4.3.1) using packages stats, pheatmap, and ggplot2.

2.10. Structure Preparation and Molecular Docking

Structure prediction of the candidate enzymes with cofactors (F3H: 2-ketoglutarate, Fe2+; F3’H: heme; FLS: 2-ketoglutarate, Fe2+) was performed using Alphafold3 [43]. The receptor for molecular docking was chosen based on the highest RANKING SCORE obtained. Molecular docking was executed with the Autodock 4.2.6 software package [44]. The 3D structures of substrates Naringenin, Dihydrokaempferol, and Dihydroquercetin were downloaded from the Pubchem database. Ultimately, the structures of the receptor and ligand were analyzed separately using Autodock Tools 1.5.6 [45]. The docking site was identified based on the crystal structure of the template (F3H: 2BRT; F3’H: 4I8V; FLS: 1GP5), with the center of this site defining the coordinates for the center point of the box. A grid measuring 15 Å × 15 Å × 15 Å resolution was established, and a total of 20 molecular dockings were configured, while the remaining parameters were left at their default settings. The docking results were visualized and analyzed by PyMOL, and reasonable docking conformations were screened according to the catalytic mechanism.

3. Results

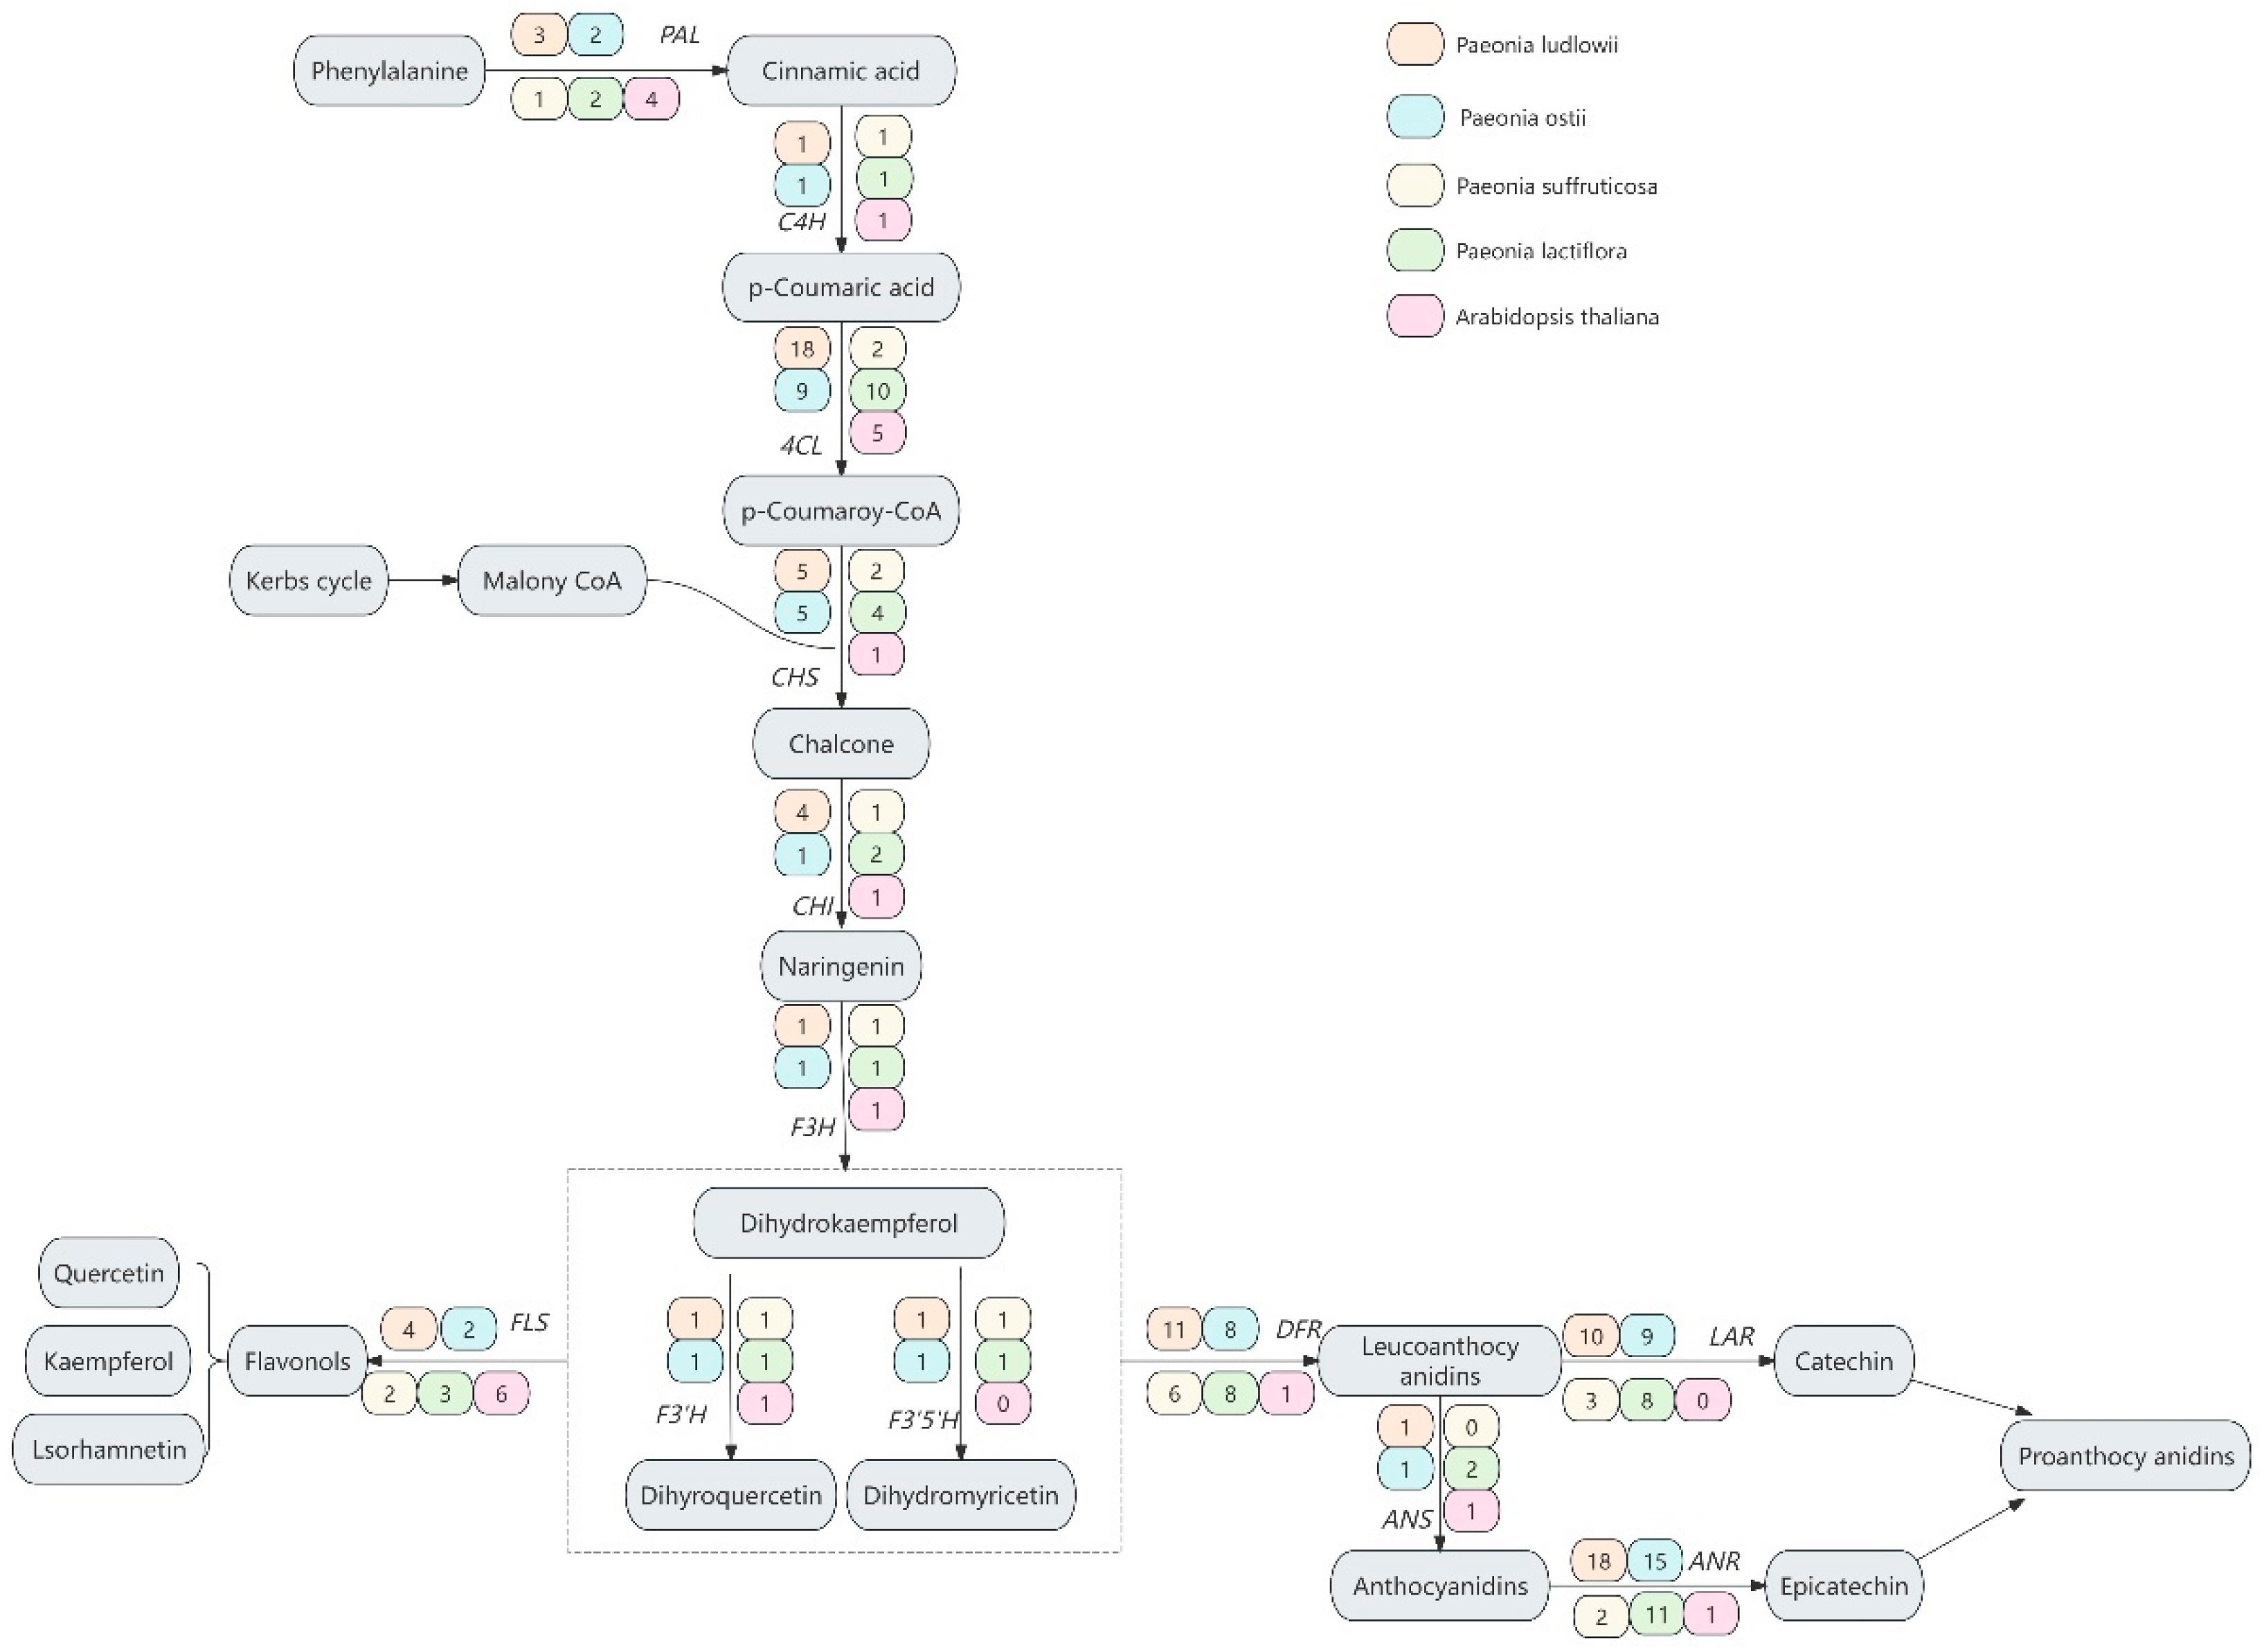
3.1. Identification of 13 Gene Families in the Flavonoid Biosynthesis Pathway of Paeonia

Thirteen gene families participating in the flavonoid biosynthesis pathway were identified in four Paeonia species. Specifically, a total of 78, 52, 19, and 52 enzyme-coding genes were identified in P. ludlowii, P. ostii, P. suffruticosa, and P. lactiflora, respectively. These genes were numbered sequentially based on their chromosomal positions for P. ludlowii and P. ostii, which were assembled to the chromosome level. For P. suffruticosa and P. lactiflora, genes were numbered manually. The prefix of the gene symbol was designated as “Pl”, “Po”, “Ps”, and “Pla” for P. ludlowii, P. ostii, P. suffruticosa, and P. lactiflora, respectively. A comparison of the number of gene family members between Paeonia and A. thaliana indicated that P. ludlowii, P. ostii, and P. lactiflora showed a significantly greater number of genes associated with flavonoid biosynthesis compared to A. thaliana, averaging six, four, and four members per gene family for P. ludlowii, P. ostii, and P. lactiflora, respectively (Figure 2). However, only 19 flavonoid biosynthesis-related genes were identified in P. suffruticosa. The reduced gene number discovered in P. suffruticosa might be largely due to incomplete assembly and annotation of the P. suffruticosa genome.

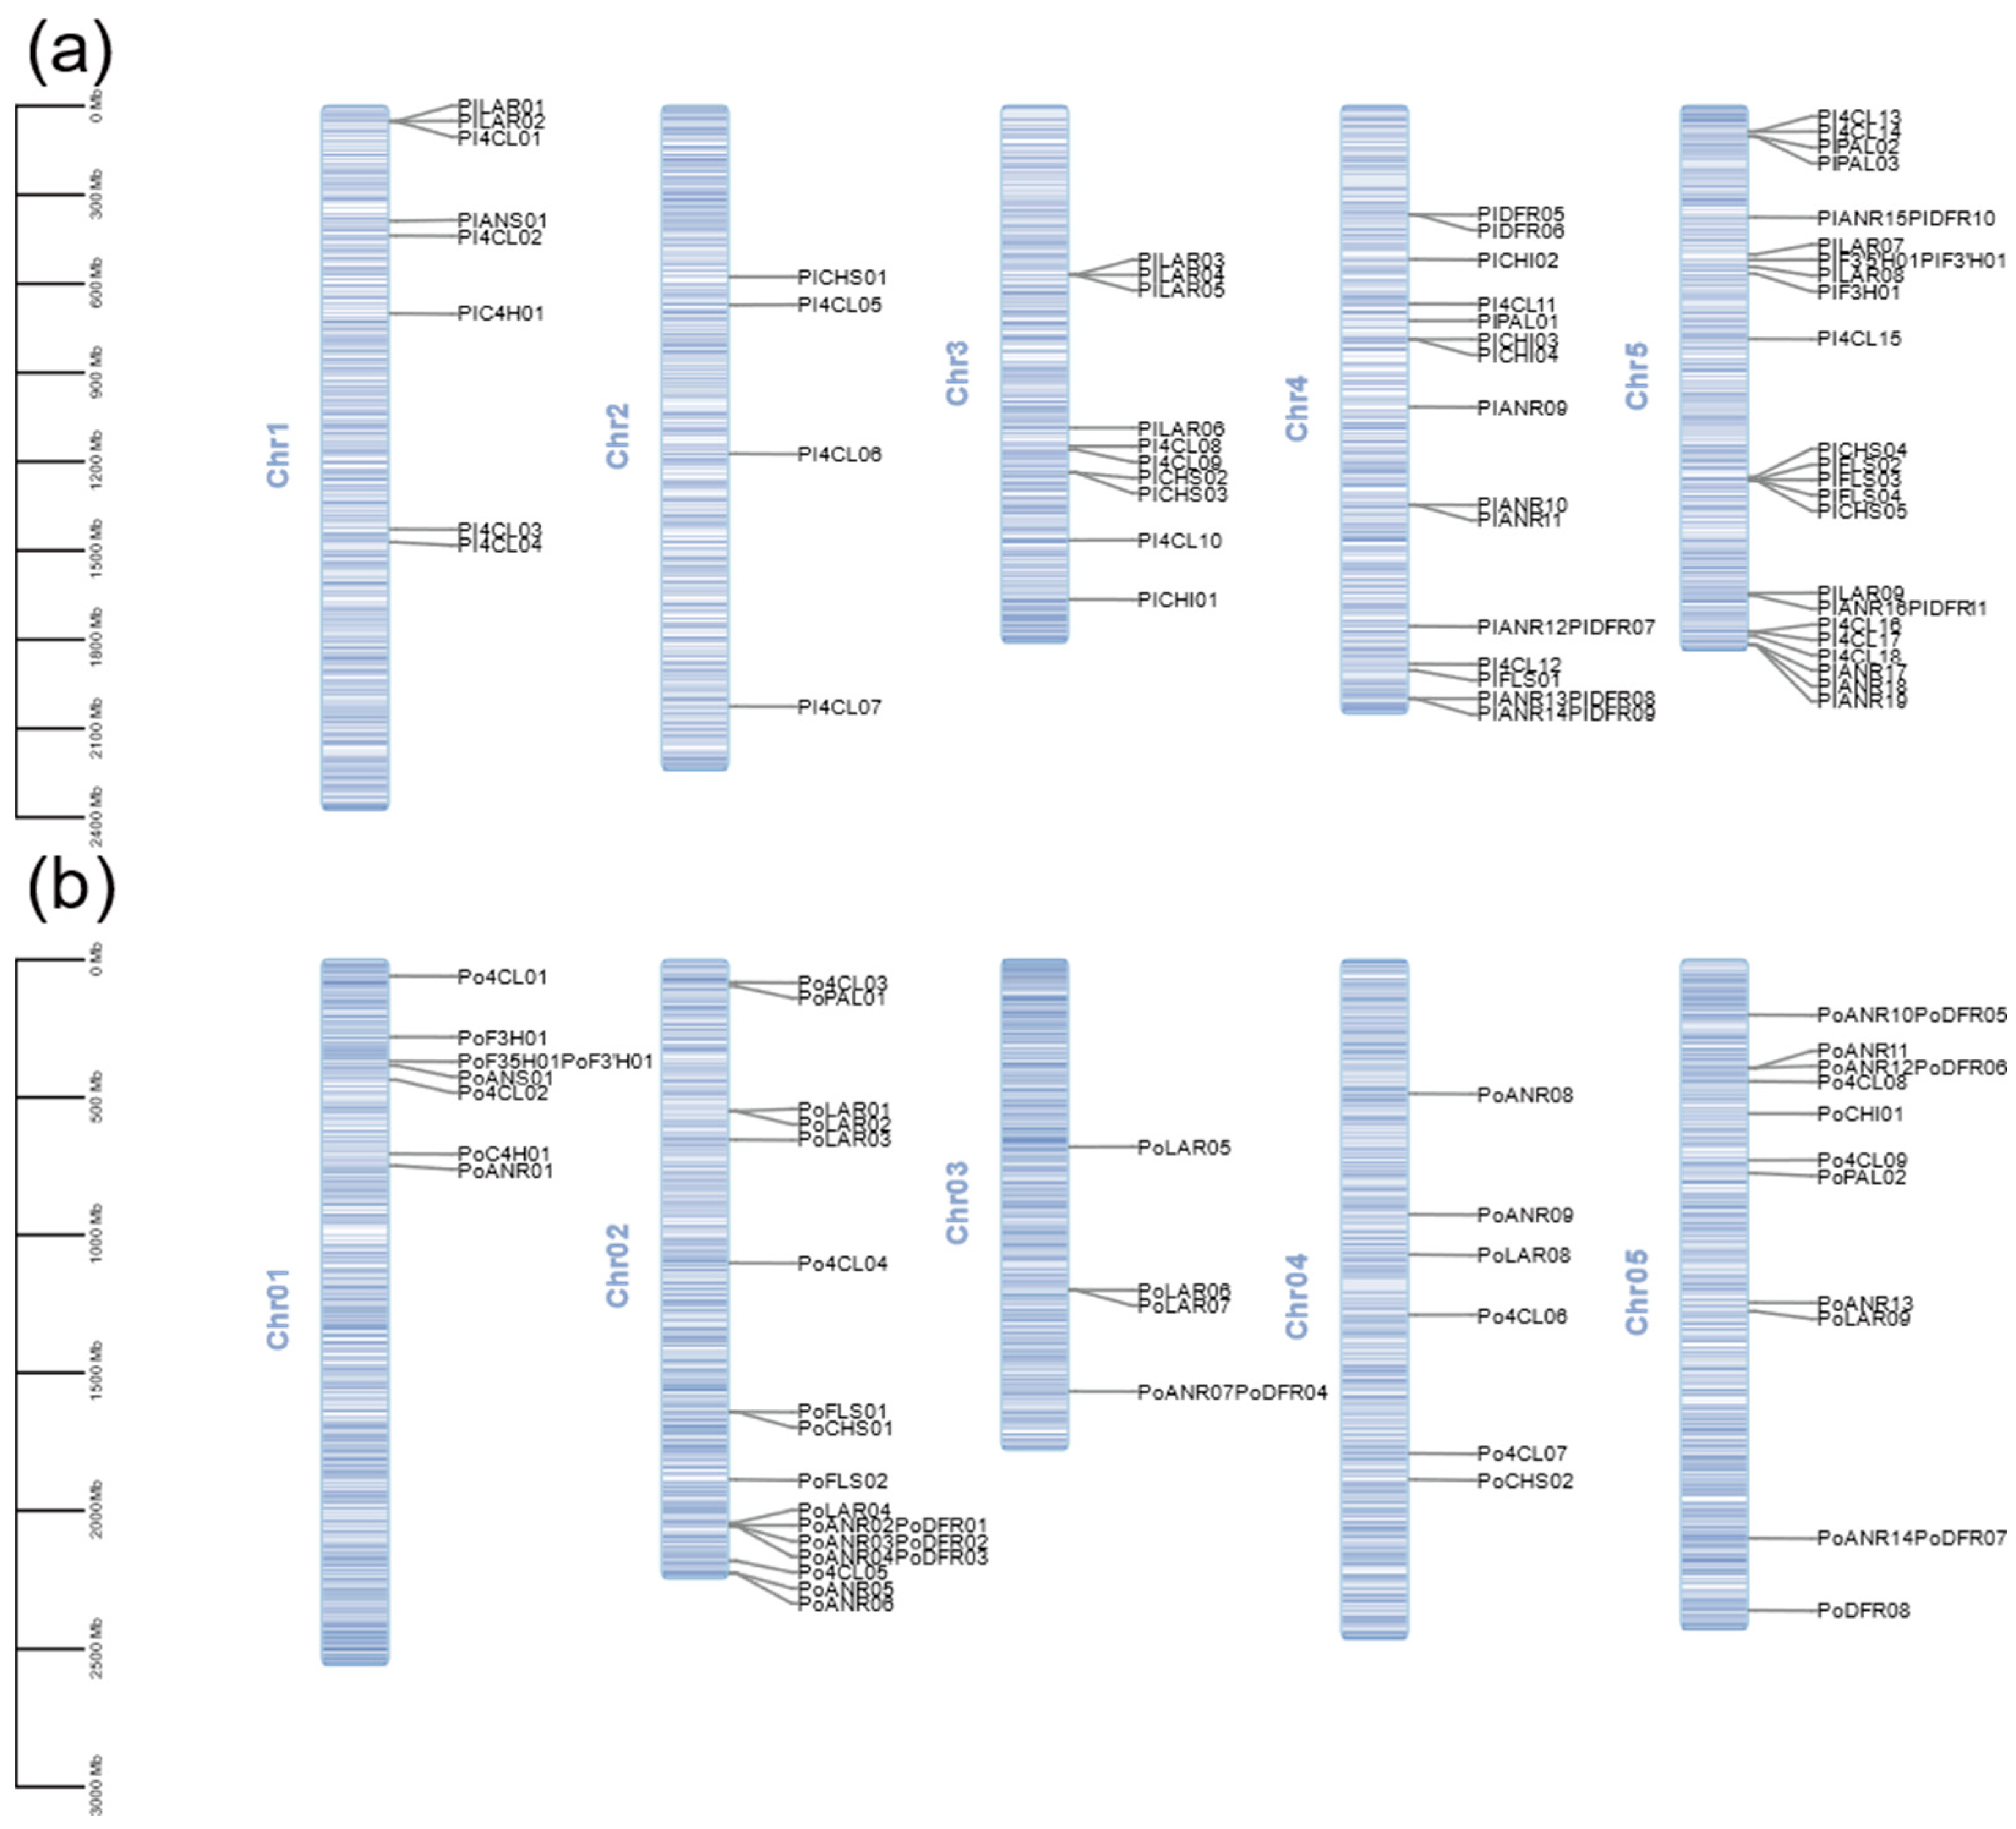
3.2. Chromosome Localization of the Flavonoid Biosynthesis-Related Genes in P. ludlowii and P. ostii

As only the P. ludlowii and P. ostii had the chromosome-level assembly, the distributions of flavonoid biosynthesis-related genes on chromosomes were only explored for the two Paeonia species. In P. ludlowii, 78 genes displayed an uneven distribution across the five chromosomes, with chromosome 5 harboring the highest number of genes (n = 25), and genes on chromosomes 1, 3, 4, and 5 exhibiting significant clustering patterns (Figure 3). The chromosomal distribution of these genes in P. ostii was uneven, with chromosome 2 harboring the highest gene count (n = 19), while chromosomes 1 and 5 exhibited a distinct clustering pattern.

3.3. Physicochemical Properties and Subcellular Localization Prediction of Genes Related to Flavonoid Biosynthesis

The average length of aa in P. ludlowii, P. ostii, and P. lactiflora was relatively close, at 425.31, 402.65, and 401.04 (Tables S3–S5), respectively, whereas P. suffruticosa exhibited a notably lower average length of 349.79 (Table S6). Based on the standard deviation, P. ostii displayed the highest degree of dispersion in aa counts, suggesting greater variability in aa sequence lengths among its members. The average molecular weights of the identified flavonoid biosynthesis-related proteins showed moderate interspecific variation. P. ostii exhibited the highest mean molecular weight (45.50 kDa) and also had the largest standard deviation, indicating greater diversity in protein sizes, possibly due to the presence of unusually long or short sequences within the gene family. The average theoretical isoelectric points (pI) ranged from 6.31 (P. lactiflora) to 6.57 (P. ostii and P. suffruticosa), with standard deviations between 1.02 and 1.18, suggesting relatively consistent pI distributions across species. Regarding protein stability, the average instability index values were all close to 36. The differences in means were small; P. suffruticosa displayed the highest standard deviation (6.62), implying more heterogeneity in protein stability within its gene family members. The mean instability indices ranged between 34 and 36 across the species. P. suffruticosa exhibited the largest standard deviation, implying a more heterogeneous distribution of instability indices. The average aliphatic indices for all species were clustered between 92 and 96, with minimal interspecific differences and low standard deviations, indicating stable and consistent values. All species displayed negative GRAVY values, consistent with an overall hydrophobic tendency. P. ludlowii and P. ostii exhibited closer and lower average Grand Average of Hydropathy (GRAVY) values compared to P. suffruticosa, suggesting stronger hydrophobicity in these two species. To further explore the functional roles of flavonoid biosynthesis-related genes, subcellular localizations of the encoded proteins were predicted using WOLF PSORT. The analysis showed that between 30.77% and 44.23% of the proteins were localized in the cytoplasm, followed by from 25.00% to 31.58% in the chloroplasts across the four Paeonia species (Tables S3–S6). These results suggest that cytoplasmic and chloroplastic compartments may serve as primary sites of flavonoid biosynthetic activity in Paeonia.

3.4. Protein Conserved Domain and Motif Prediction of Genes Related to Flavonoid Biosynthesis

In order to investigate the functional conservation of the flavonoid biosynthesis gene family members in Paeoniaceae, protein domains and conserved motifs were detected in four Paeonia species. The conserved domains and domain compositions were analyzed and compared across each protein family. The results indicated that while members of the same family generally share common domains, some domains are not exclusive to a specific family (Figure S1). For example, PlANR and PlDFR both contain FR_SDR_e domains (Figure S1a). Specifically, P. ludlowii and P. ostii had more similar conserved domains for each protein family, implicating their higher sequence identity or conservation (Figure S1a,b). Notably, the P. lactiflora exhibited more complex domain compositions than the other three Paeonia species (Figure S1d), possibly due to the lower quality of transcript assembly of P. lactiflora, which was not whole-genome sequenced and assembled to chromosome-level.
We also examined the conserved motif patterns within each protein family and observed that each family possesses distinct conserved motifs. Additionally, certain motifs were highly similar or consistent across different families, suggesting their involvement in similar catalytic pathways. For instance, motifs 1, 2, 3, 5, 6, 7, 9, and 12 were highly conserved in ANR/DFR protein families (Figure S2). It was worth noting that not all proteins were predicted to contain conserved motifs, such as C4H, CHI, and ANS, which may be attributed to the parameter settings of MEME Suite, or, actually, these two protein families were not characterized by any conserved motifs.

3.5. Prediction of Promoter Cis-Acting Elements of Flavonoid Biosynthesis-Related Genes in P. ostii and P. ludlowii

Cis-acting regulatory elements play a crucial role in modulating gene expression, and genes with similar functions often share conserved motifs within their promoter regions [46]. To investigate the transcriptional regulation of flavonoid biosynthesis in Paeonia species, we analyzed the 2000 bp upstream promoter regions of flavonoid biosynthesis-related genes in P. ostii and P. ludlowii, both of which have chromosome-level genome assemblies. In addition to core promoter elements, such as the TATA-box and CAAT-box, four major categories of cis-regulatory elements were identified: stress-responsive elements, hormone-responsive elements, light-responsive elements, and transcription factor binding sites (TFBSs) (Figure 4). Among them, elements associated with light and hormone responses were most frequently observed, highlighting the central regulatory roles of these factors in flavonoid biosynthesis. The abundance of these elements also suggests that flavonoids may act as intermediaries or signaling molecules within broader light and hormone response networks. Specifically, elements responsive to methyl jasmonate, abscisic acid, auxin, and salicylic acid were found, implying that these phytohormones are closely involved in regulating the expression of flavonoid biosynthesis genes.

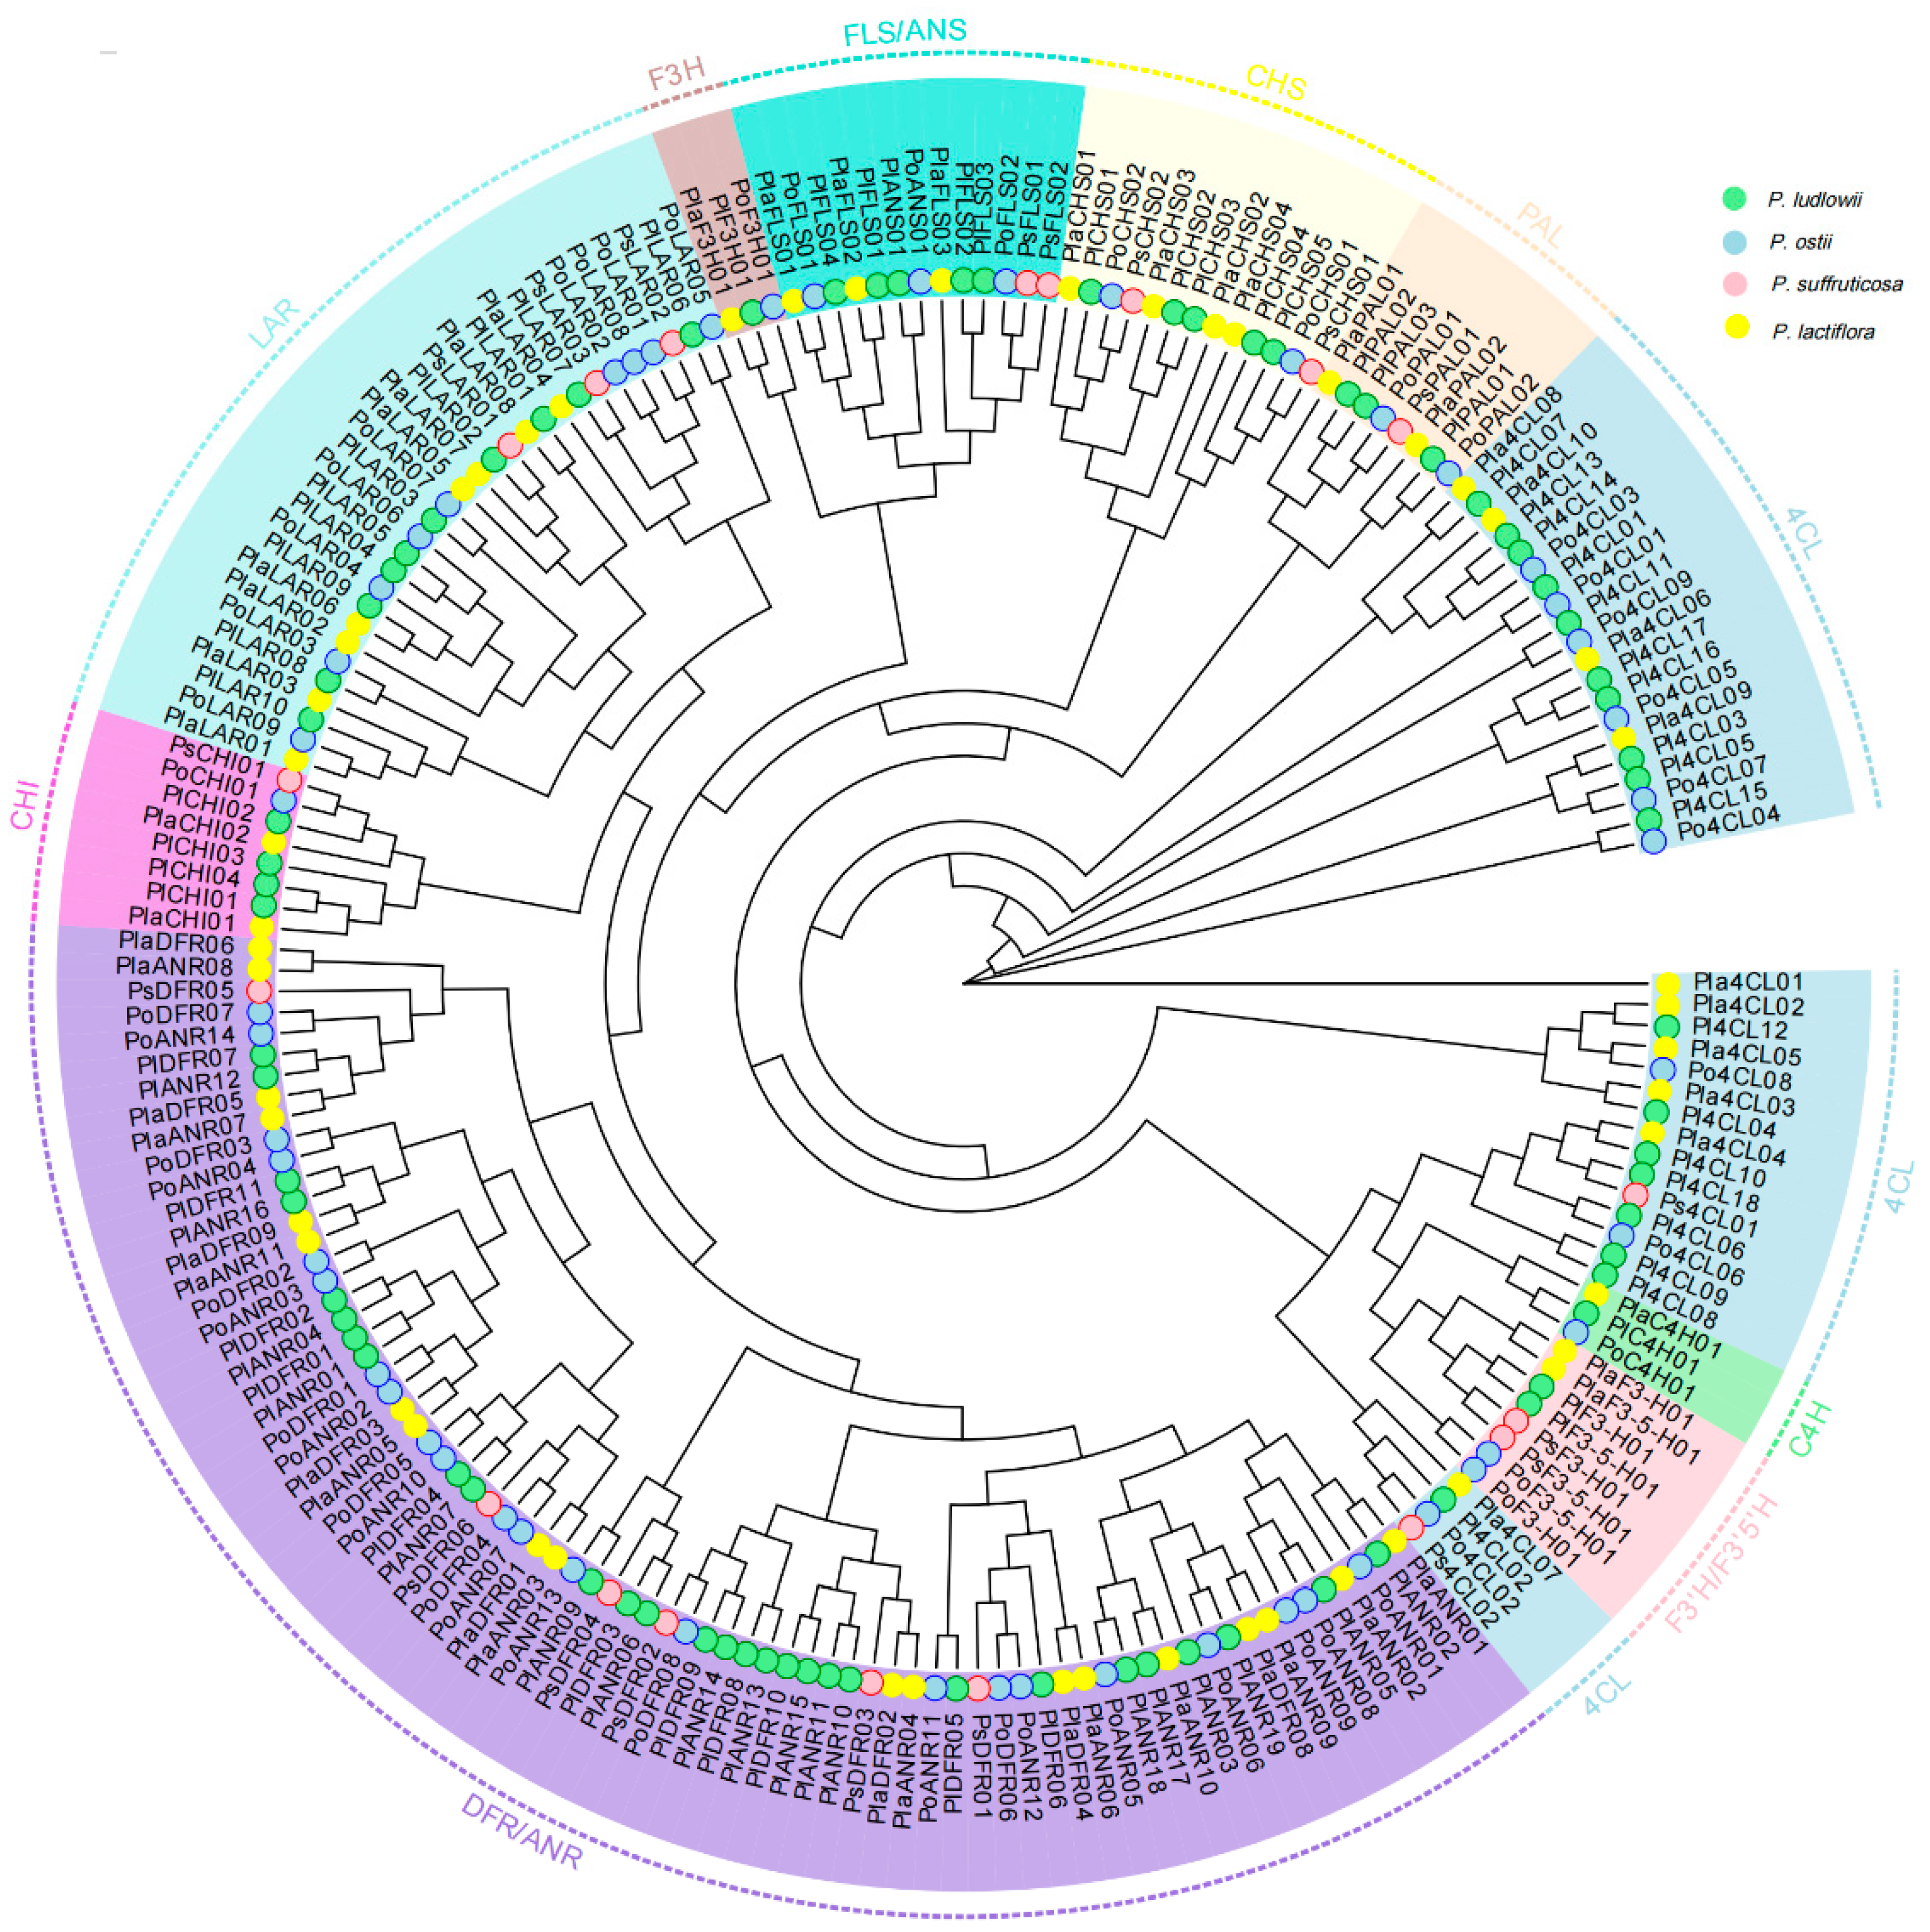
3.6. Phylogenetic Analysis of Gene Families

The phylogenetic relationships of the flavonoid biosynthesis gene families were analyzed for four Paeonia species (Figure 5). This showed that members of different gene families clustered into distinct clades, indicating high evolutionary conservation within each family. Specifically, members of the ANRs and DFRs protein families and members of the ANS and FLS protein families clustered together, indicating a potential co-evolutionary relationship in catalyzing downstream steps of the flavonoid pathway. Additionally, the basal location of PALs and C4Hs gene clusters supported their functional conservation in the upstream phenylpropanoid metabolism pathway.

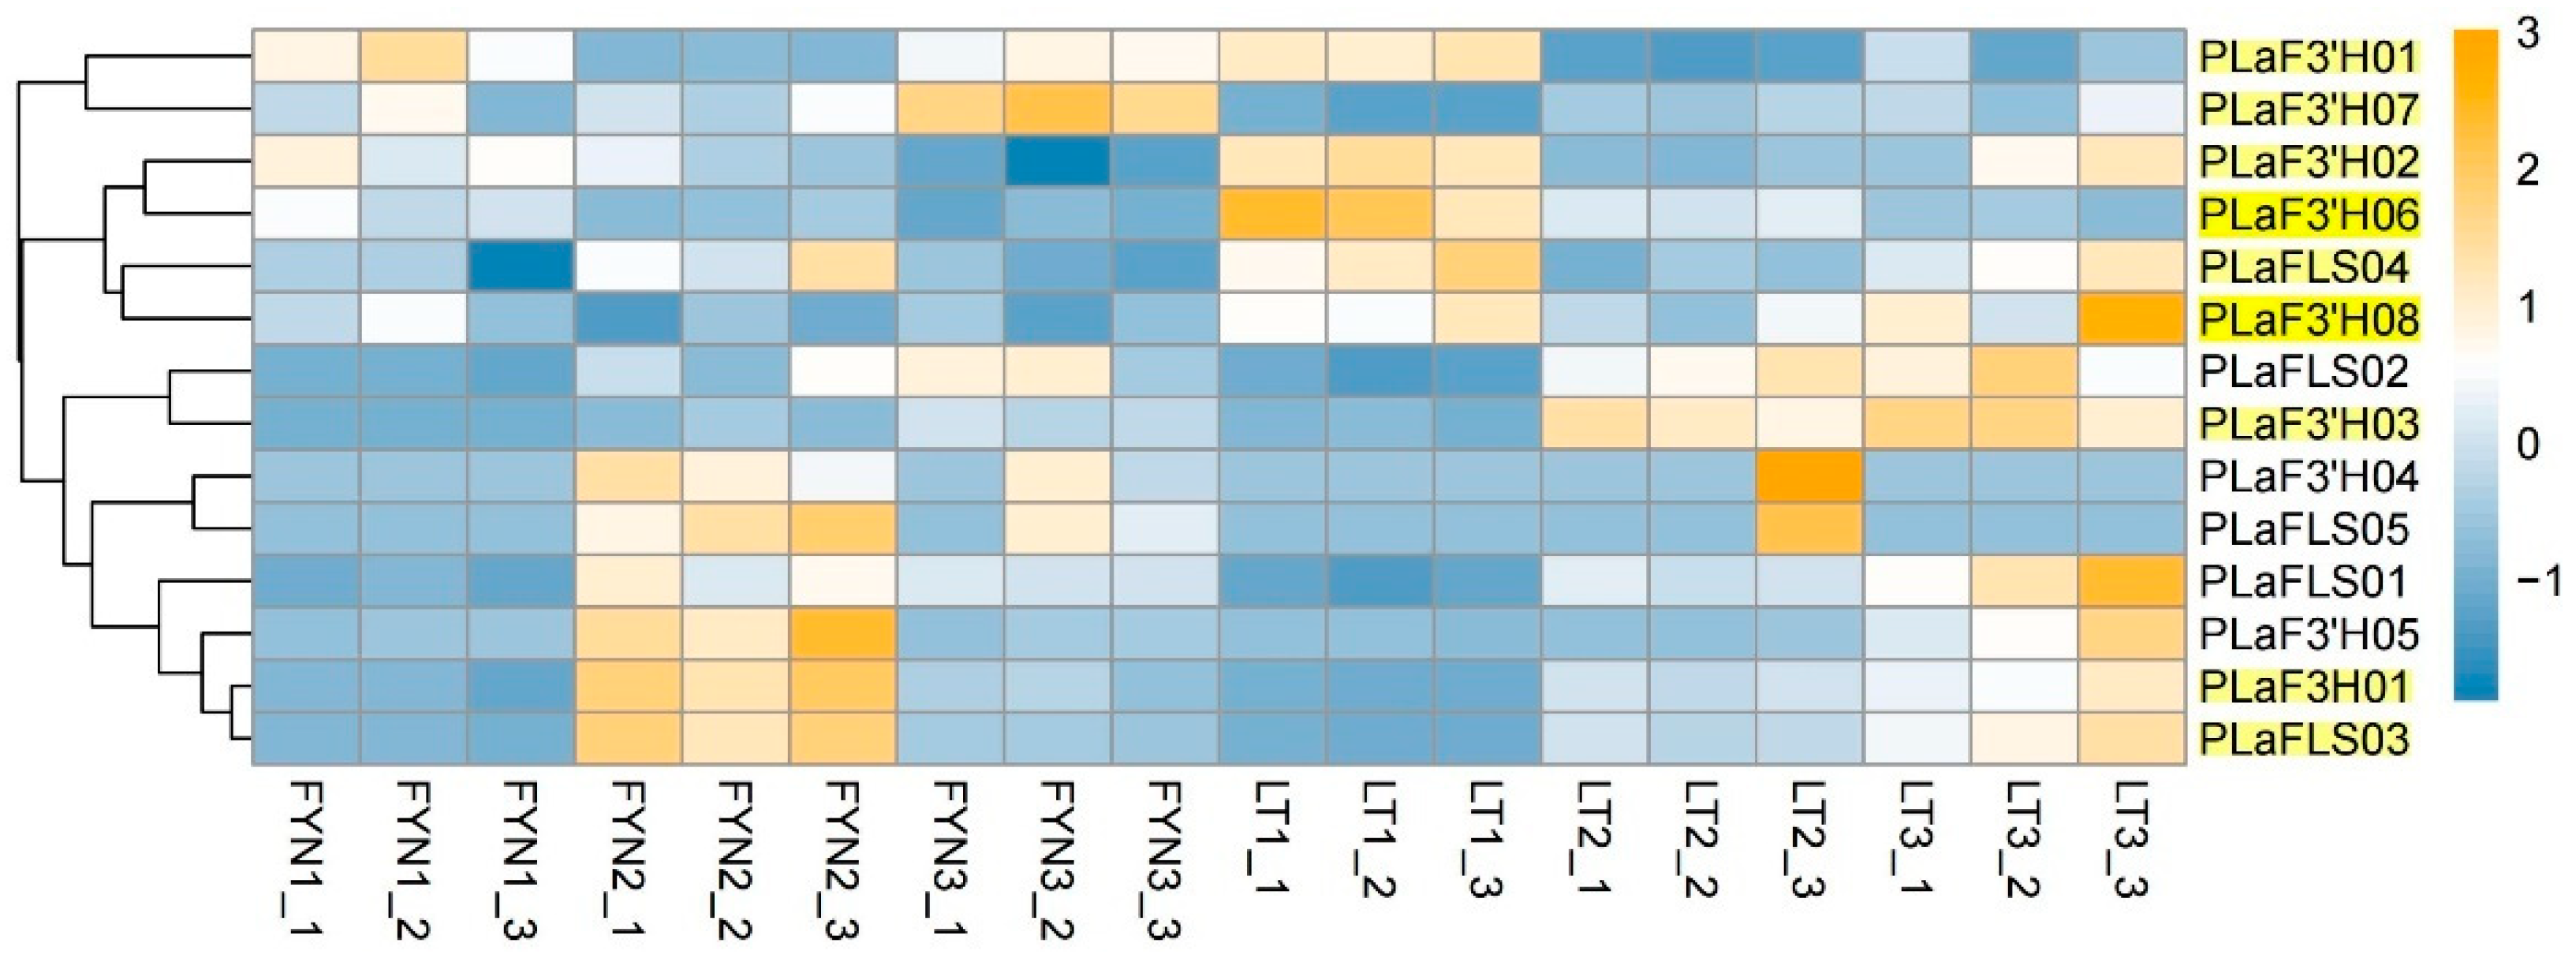
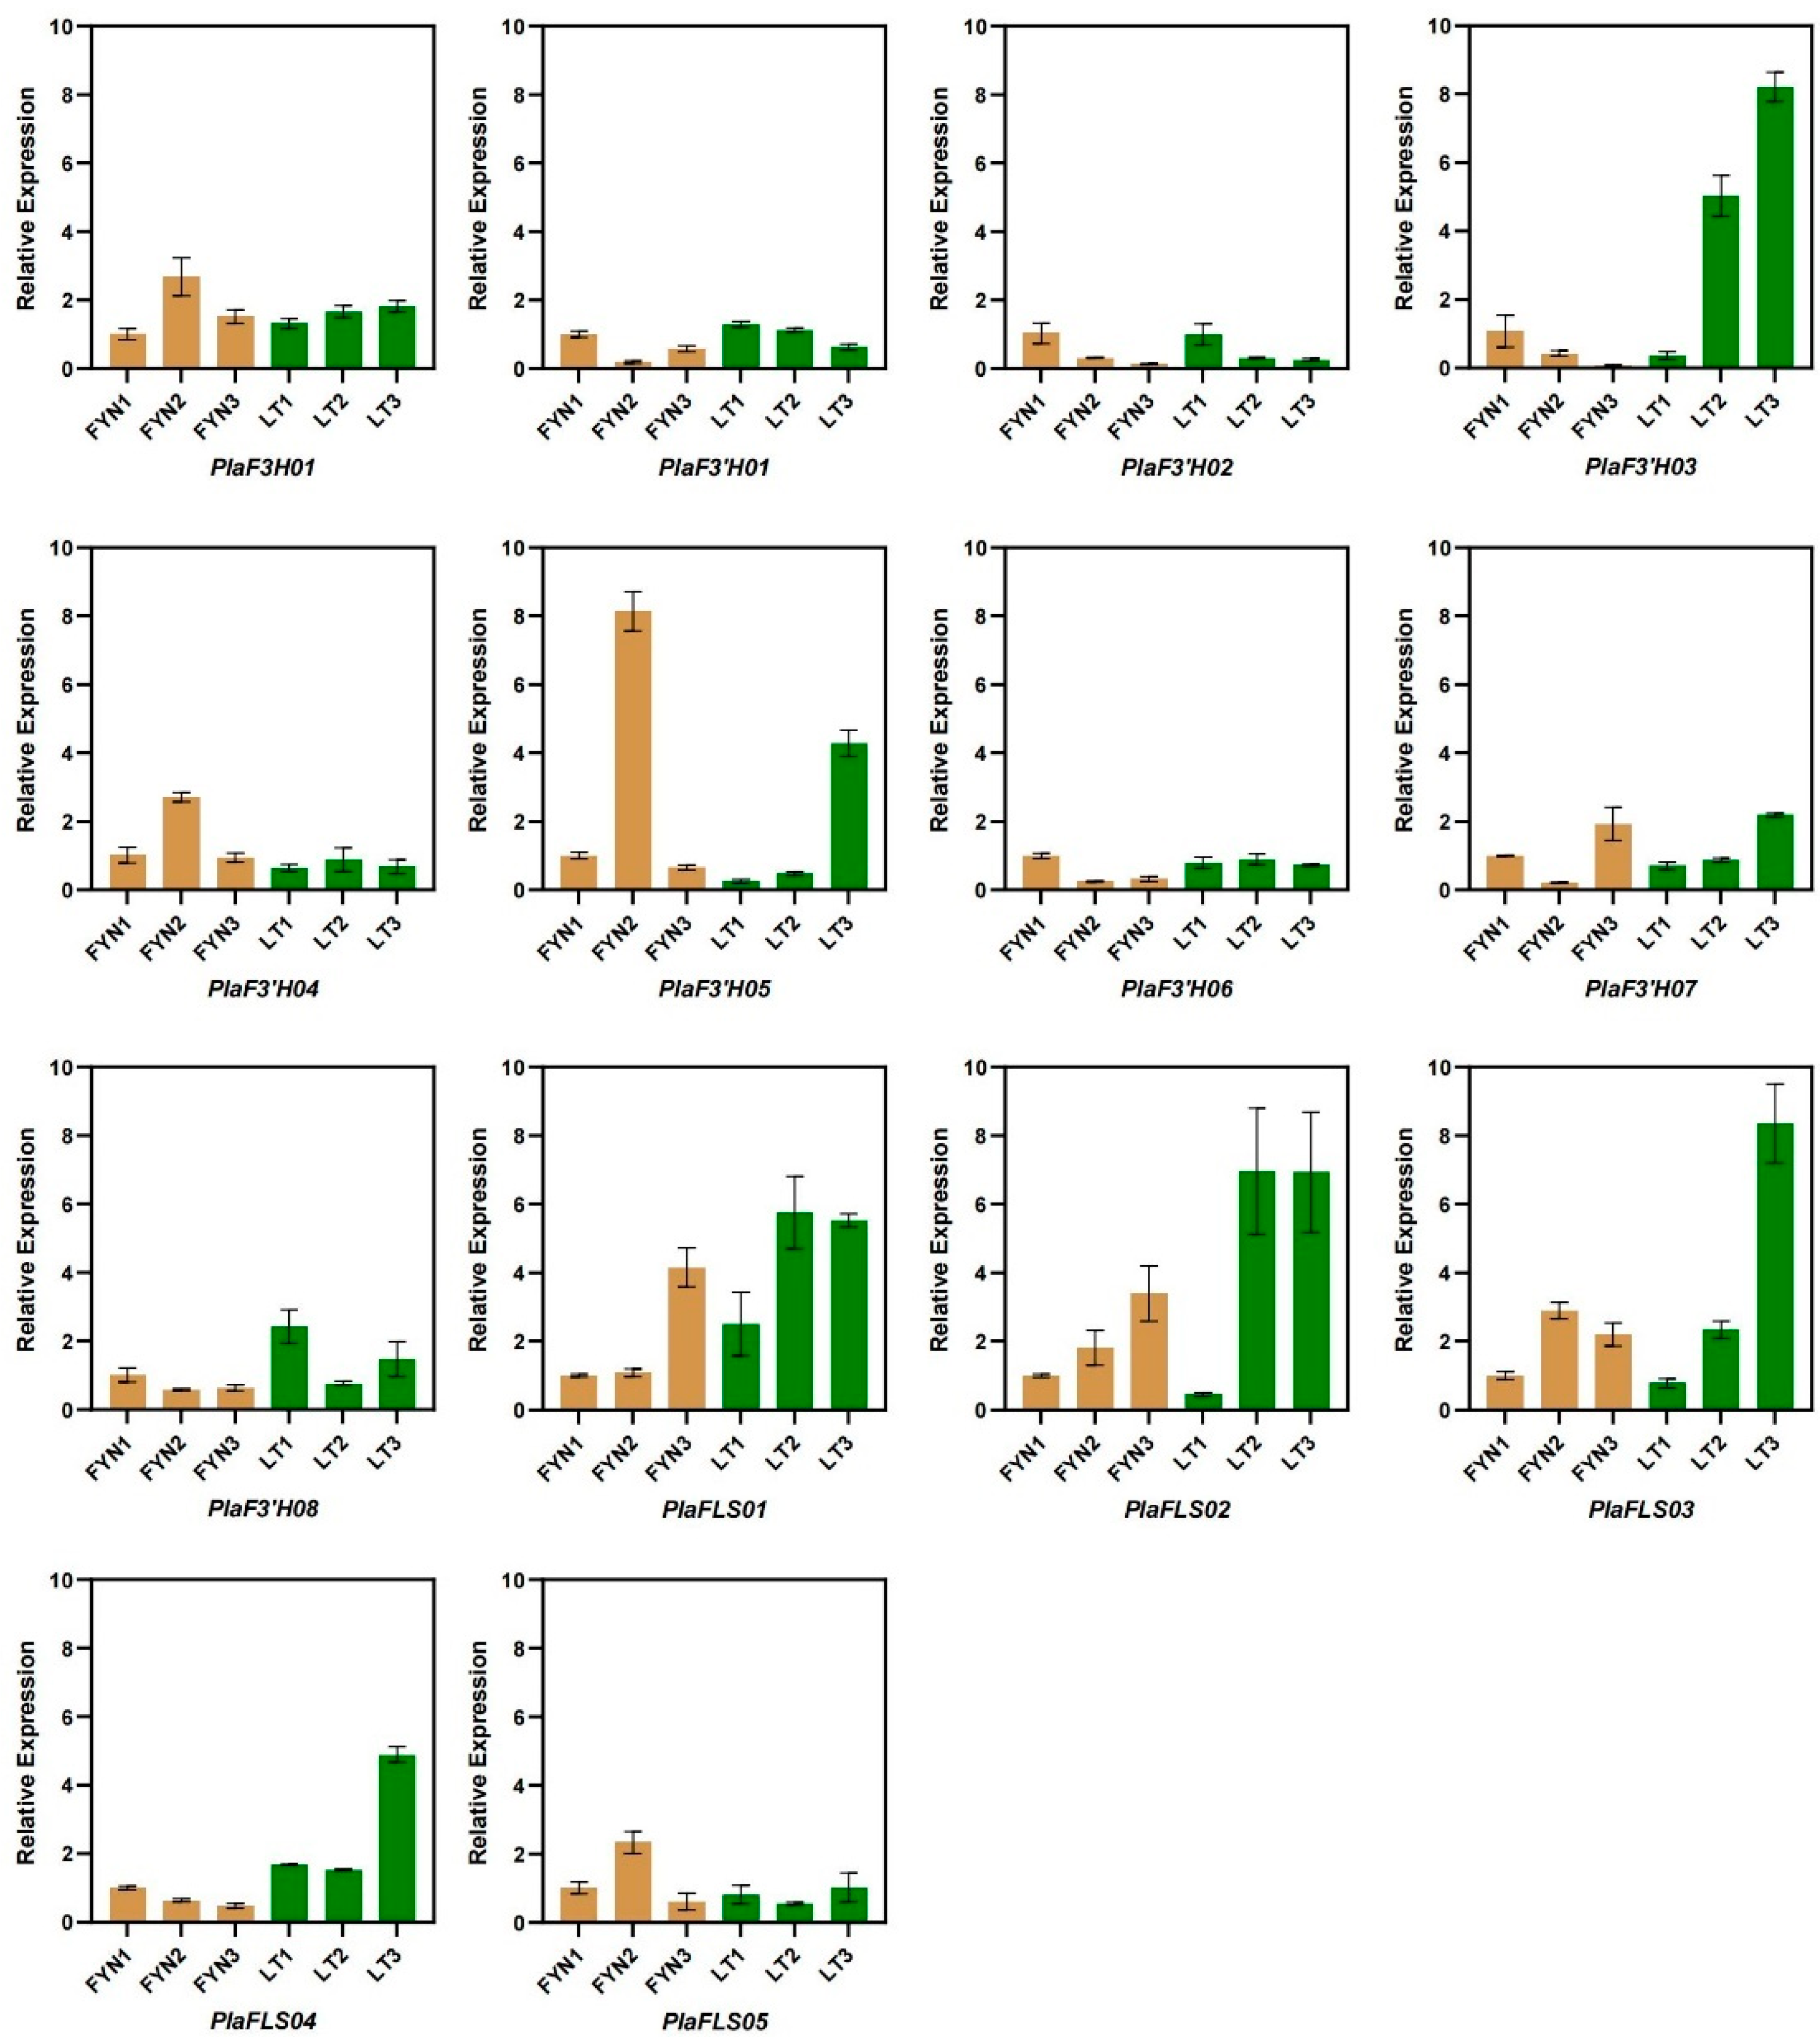
3.7. Expression Pattern Analysis of Quercetin Synthesis Genes in P. lactiflora

Among the flavonoid biosynthetic gene families characterized in this study, the F3H, F3’H, and FLS families were specifically selected for expression profiling in the P. lactiflora cultivars ‘FYN’ and ‘LT’, owing to their critical roles in quercetin biosynthesis. F3H catalyzes the conversion of naringenin into dihydrokaempferol. F3’H then hydroxylates dihydrokaempferol to produce dihydroquercetin, the direct precursor of quercetin. Finally, FLS converts dihydroquercetin and other dihydroflavonols into active flavonols, such as quercetin, thereby regulating the terminal step of the flavonol biosynthetic pathway.
Through tblastx search, we identified a total of eight candidate genes from the F3’H family, one from the F3H family, and five from the FLS family in the P. lactiflora transcriptome. Genes were grouped into different clusters based on their expression patterns (Figure 6). PlaF3’H03 exhibited a remarkable upregulation beginning at LT2, which was nearly absent in FYN, implying a petaloid stamen-specific induction. Similarly, PlaFLS03, a gene responsible for the synthesis of flavonol end-products, such as quercetin, showed strong LT2–LT3 expression, but low expression in FYN3, highlighting its association with flavonol accumulation in petaloid structures. PlaF3’H08 also displayed a gradual increase during LT stages, peaking at LT3, which may reflect its involvement in late-stage quercetin biosynthesis during organ identity transition. “FYN” exhibits normal stamens, whereas the stamens of “LT” have been transformed into petals. This phenomenon may be closely associated with the expression difference of genes involved in quercetin synthesis.

3.8. qPCR Validation of Transcriptome Expression Trends

To validate the RNA-seq results and further explore the roles of key genes in quercetin biosynthesis during stamen petalization, we performed qRT-PCR analysis of 14 candidate genes in the F3H, F3’H, and FLS gene families across six floral bud stages of P. lactiflora cultivars ‘FYN’ (FYN1–FYN3) and ‘LT’ (LT1–LT3).
As shown in Figure 7, the expression levels of most genes exhibited clear stage-specific and cultivar-specific variation. For instance, PlaF3’H03 showed a dramatic increase in expression in LT2 and LT3, corresponding to the transition and completion of stamen petalization, suggesting a regulatory role in organ identity conversion. In contrast, genes such as PlaF3’H05 showed higher expression in early FYN stages but reduced levels in LT, implying possible downregulation during the petaloid transition. Genes in the FLS family, including PlaFLS01 and PlaFLS02, were significantly upregulated in LT stages compared to FYN, indicating a potential enhancement of flavonol biosynthesis in petaloid stamens. Notably, PlaFLS03 and PlaFLS04 exhibited a sharp increase in LT3, consistent with accumulation patterns of quercetin derivatives observed in metabolomics data.
To ensure visual comparability, we plotted all genes using a unified y-axis across all subplots, allowing a direct assessment of expression magnitude between genes. The qRT-PCR results corroborated RNA-seq trends, reinforcing the proposed involvement of specific F3H, F3’H, and FLS isoforms in stamen petalization.

3.9. Accumulation Patterns of Quercetin Derivatives in P. lactiflora Floral Tissues

To investigate the potential metabolic basis of stamen petalization, we focused on quercetin and its derivatives, a major branch of the flavonol biosynthetic pathway. Quercetin was selected due to its well-documented regulatory roles in auxin transport, redox homeostasis, and organ identity control, as well as its high abundance and structural diversity in Paeonia floral tissues.
Hierarchical clustering analysis of 20 quercetin-related metabolites revealed clear tissue-specific accumulation profiles among petals, petaloid stamens, and normal stamens (Figure 8). Free quercetin displayed the highest abundance in petals, followed by stamens, and was lowest in petaloid stamens, suggesting a potential metabolic redirection or degradation during the petalization process. Distinct accumulation patterns were also observed for quercetin derivatives. Methylated forms, such as Azaleatin (5-O-Methylquercetin), and glycosylated derivatives like Quercetin-7-O-glucoside exhibited progressive increases from petals to stamens, with petaloid stamens showing intermediate levels. Conversely, petal-specific compounds such as Quercetin-3-O-(6″-malonyl) galactoside and Quercetin-3-O-(6″-acetyl) galactoside were significantly reduced in petaloid stamens and stamens, indicating tissue-specific metabolic partitioning. Moreover, petaloid stamens exhibited a unique metabolic signature, with elevated levels of Quercetin-3-O-(2″-acetyl) glucuronide and Quercetin-3-O-sulfonate—compounds rarely enriched in petals or normal stamens—suggesting the activation of alternative glycosylation or acylation pathways. These modifications may contribute to metabolite stabilization, vacuolar sequestration, or altered signaling properties during floral organ reprogramming. This aligns with the expression trends of key biosynthetic genes (F3’H, FLS) and provides metabolic evidence for quercetin’s involvement in stamen petalization in P. lactiflora.

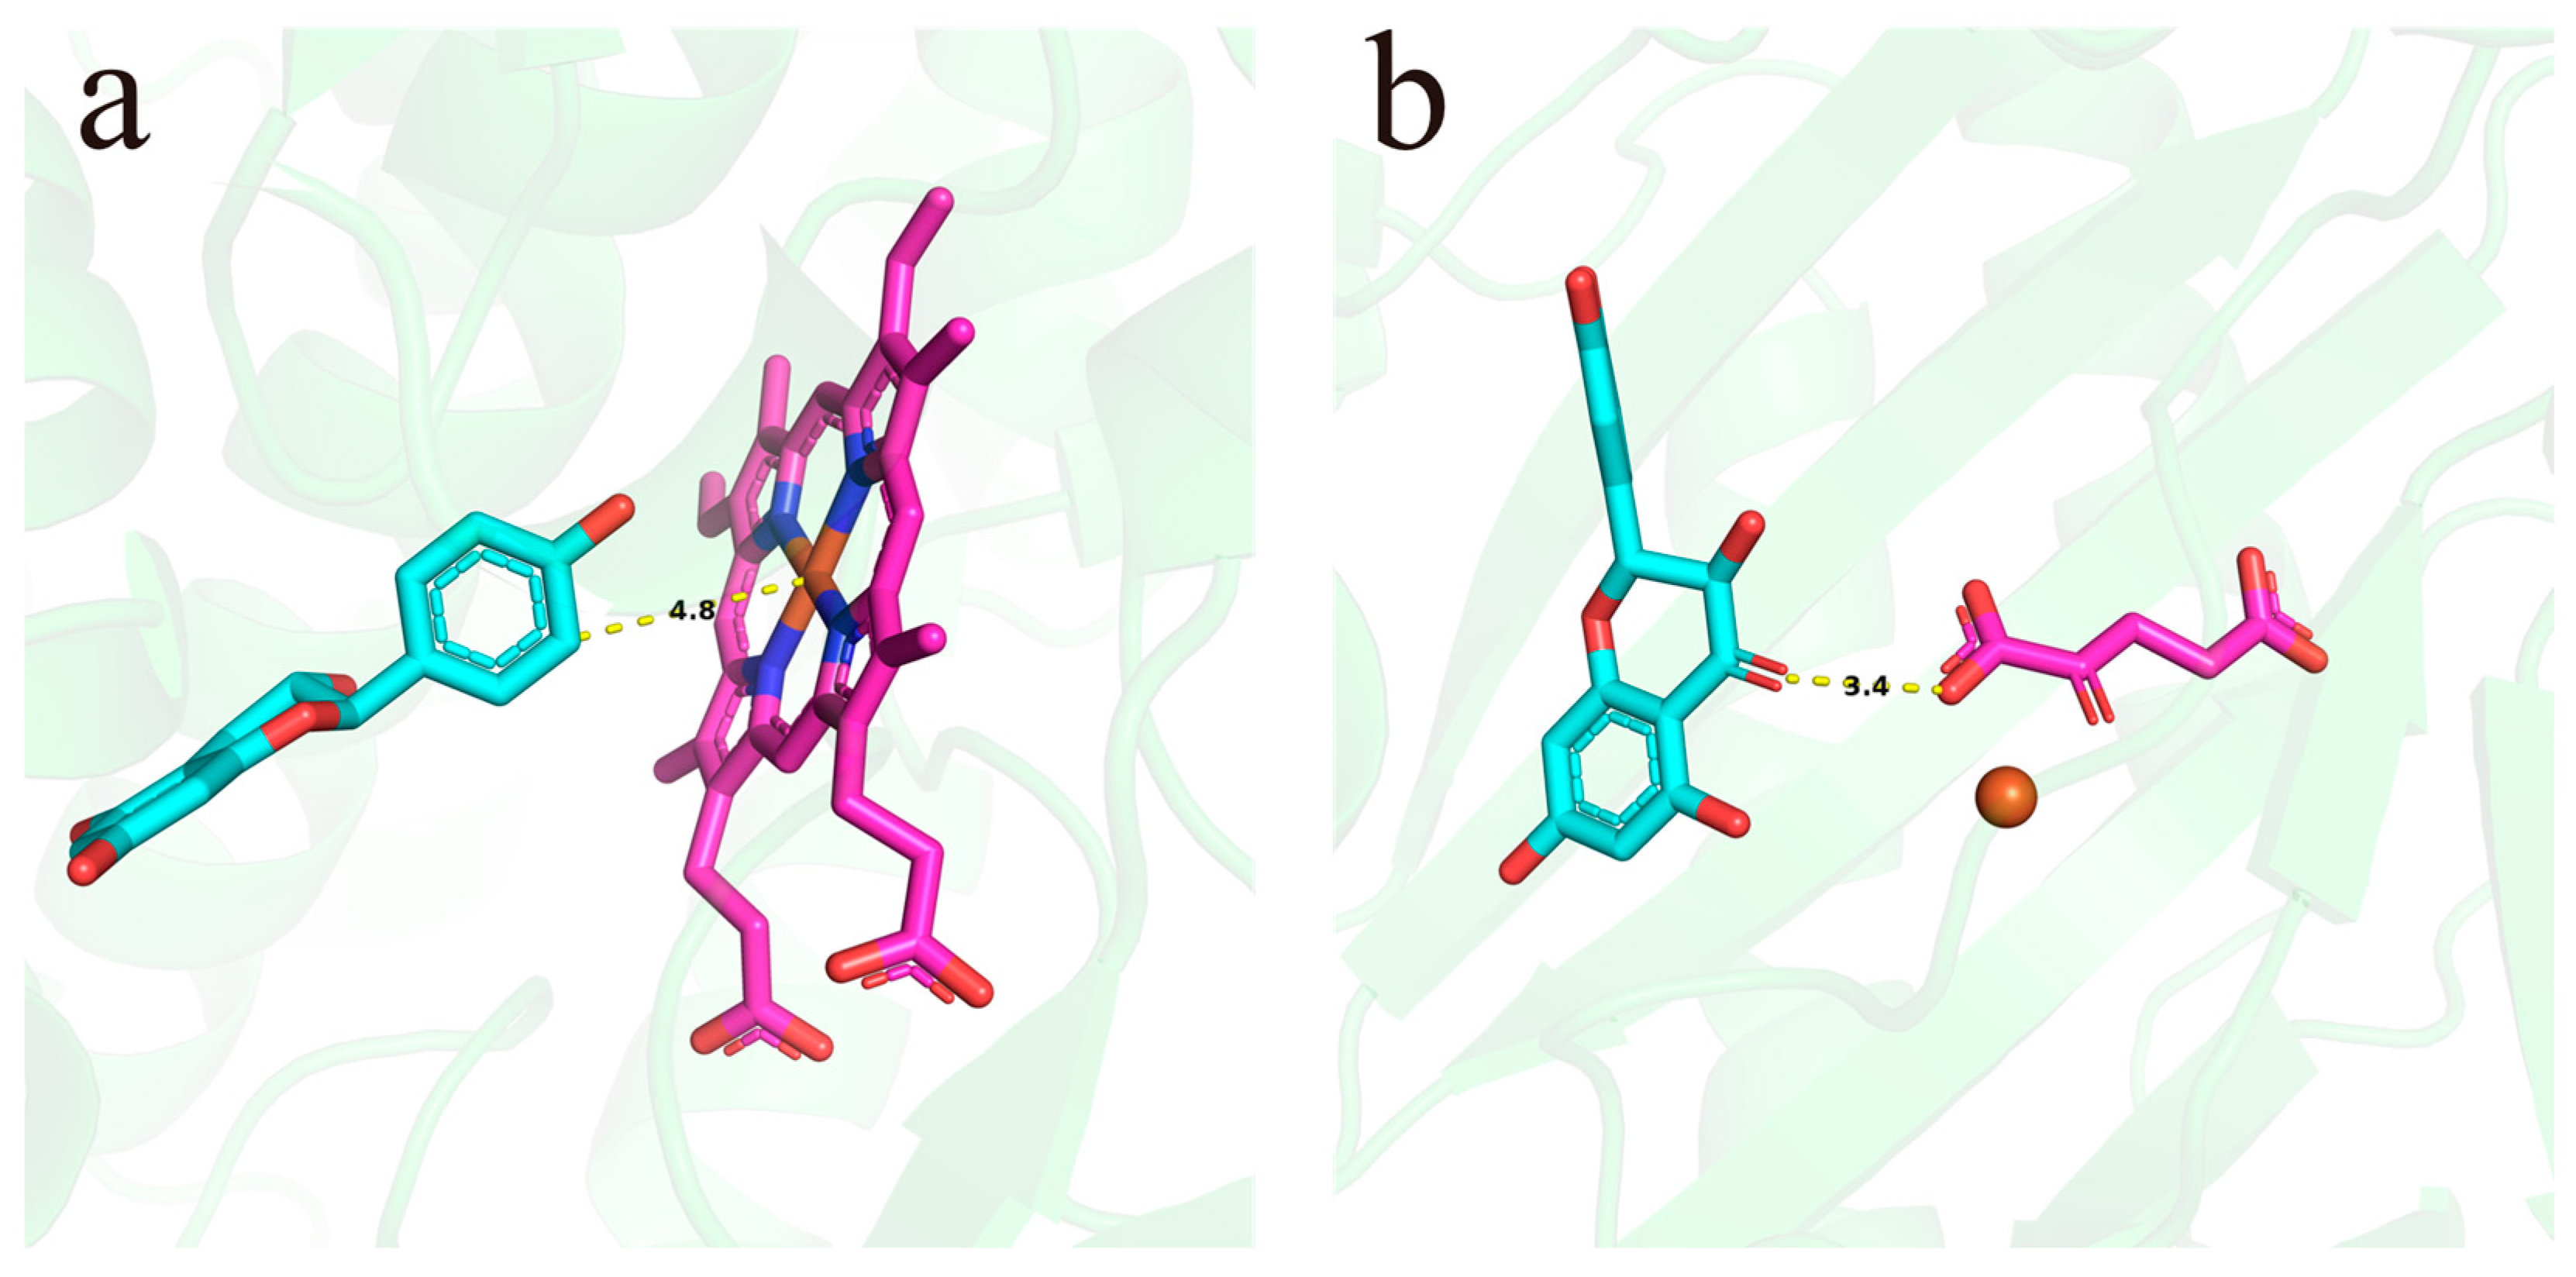
3.10. Screening of Key Enzymes Involved in Quercetin Biosynthesis via Molecular Docking

Notably, PlaF3’H05 was excluded from subsequent analyses due to the lack of a promoter region. The binding affinity between candidate enzymes and substrates was evaluated using molecular docking, revealing significant variations in binding free energy (ΔG) among different enzyme proteins.
Among the candidate enzymes catalyzing the synthesis of dihydrokaempferol, PlaF3’H07 exhibited the strongest binding capability with a ΔG of −4.7 kcal/mol (Table 1), significantly lower than other functionally similar candidates (e.g., PlaF3’H01: −2.1 kcal/mol; PlaF3’H03: −2.4 kcal/mol). Notably, PlaF3’H06 (−0.3 kcal/mol) and PlaF3’H08 (no effective binding detected) displayed relatively high binding energies, suggesting a potential lack of catalytic activity.
For enzymes catalyzing the conversion of dihydrokaempferol to dihydroquercetin, PlaFLS05 (−4.6 kcal/mol), and the A. thaliana homolog AT5G63590 (−4.2 kcal/mol) demonstrated optimal binding properties, with significantly lower ΔG values compared to other group members (e.g., AT5G08640: −1.6 kcal/mol; PlaFLS04: −2.7 kcal/mol). Certain candidates, such as PlaFLS03, failed to yield valid docking results, necessitating further functional validation.
In conclusion, PlaF3’H07 (Figure 9a) and PlaFLS05 (Figure 9b), characterized by their low binding free energies, are proposed as key candidate enzymes regulating dihydroflavonol biosynthesis.

4. Discussion

This study presents a comprehensive and integrative analysis of flavonoid biosynthetic gene families in Paeonia, combining interspecific genomic comparison with intraspecific functional validation. In contrast to previous studies that primarily concentrated on anthocyanin-mediated pigmentation or the function of individual flavonoid genes, our research expands the current understanding by integrating evolutionary, transcriptional, and structural levels of analysis. We systematically identified 13 core gene families involved in flavonoid biosynthesis across four Paeonia species, revealing lineage-specific expansion patterns—particularly in P. ludlowii—and phylogenetic divergence indicative of potential functional diversification. Cis-regulatory element prediction further uncovered hormone-, light-, and stress-responsive motifs, suggesting multi-layered regulatory inputs controlling these pathways. In addition, we examined gene expression dynamics in petaloid and non-petaloid stamen cultivars, identifying PlaF3’H03 as a key candidate with stage-specific expression during petaloid stamen formation. Structural modeling and molecular docking analyses supported the enzymatic relevance of PlaF3’H07 and PlaFLS05, linking substrate affinity with potential metabolic fluxes in quercetin biosynthesis. By combining multi-omics approaches, this work offers a mechanistic framework connecting genomic architecture, metabolic activity, and morphological transformation, providing novel insights into floral organ identity and ornamental trait development in Paeonia.
The flavonoid biosynthesis gene family was significantly expanded in Paeonia species. In P. ludlowii, 78 genes were identified, while A. thaliana contains only 23. This expansion suggests lineage-specific adaptation, likely driven by selective pressures to enhance flavonoid production. Flavonoids contribute to stress tolerance, pigmentation, and developmental regulation, which are important for the ornamental and ecological significance of peonies. In P. ludlowii and P. ostii, clustering of genes on chromosomes 1 and 5 further implies tandem duplication events. Such duplications often lead to functional redundancy or neofunctionalization in plants. These observations resonate with studies in tomato [47], A. thaliana [48], Moringa oleifera [49], and Ginkgo biloba [50], where gene duplication has been linked to specialized metabolite diversity. The phylogenetic tree provides insights into the evolutionary dynamics of the flavonoid pathway gene family. Understanding these aspects is crucial as they provide valuable information that can aid in unraveling the molecular mechanisms underlying the flavonoid biosynthetic pathway.
Quercetin, a central metabolite in the flavonol biosynthesis pathway, was chosen as the focal point of this study due to its well-documented regulatory roles in plant development, particularly in auxin transport, redox balance, and floral organ identity. Unlike other flavonoids such as anthocyanins, which primarily influence pigmentation, quercetin and its derivatives are known to modulate intracellular signaling pathways and developmental reprogramming. This makes quercetin especially relevant for investigating floral structure transitions such as stamen petalization. In P. lactiflora, the expression of quercetin biosynthesis-related genes showed distinct cultivar-specific patterns. For example, PlaF3’H06 exhibited higher expression in the FYN cultivar (normal stamens), potentially reflecting a developmental demand for quercetin in stamen formation. In contrast, PlaF3’H03 was markedly upregulated during LT2 and LT3 stages in the LT cultivar (petaloid stamens), coinciding with the onset of petal-like differentiation. This expression pattern suggests a functional shift, where quercetin synthesis may influence auxin homeostasis and contribute to the re-specification of stamen identity. These observations are consistent with findings in A. thaliana, where flavonols such as quercetin regulate organogenesis by modulating auxin distribution through PIN and ABCB transporters, under the control of MYB transcription factors [51,52]. Our results imply that similar mechanisms may be at play in P. lactiflora, with specific F3’H and FLS genes acting as key regulators of quercetin accumulation and downstream signaling during stamen petalization. Further studies involving transcription factor analysis and hormone profiling will be necessary to fully elucidate this regulatory network.
Given that our metabolome data were obtained from mature tissues, whereas our transcriptome analysis focused on flower buds, we acknowledge that there may be limitations due to differences in developmental stages. However, regulatory mechanisms for flavonoid metabolism are often established early and persist into maturity, so data from mature tissues are a reasonable proxy for understanding dynamics during the bud stage. This approach is supported by studies showing that flavonoid profiles are conserved across developmental stages in other plants [53]. During petalization, especially in petaloid stamens, glycosylation and acylation are active, with increased levels of quercetin-3-O-(2″-acetyl) glucuronide and quercetin-3-O-sulfonate suggesting changes in metabolic flux. This supports the hypothesis that these modifications are actively regulated and may contribute to organ identity transitions. The significant reduction in free quercetin may disrupt local auxin gradients, as quercetin is known to influence auxin transport proteins [5]. This disruption could promote cellular reprogramming toward petal-like identity, a hypothesis supported by studies in A. thaliana showing flavonoids′ role in organ patterning [54]. Metabolomics analysis of flower buds during the petalization process of peony stamens and joint analysis of the results with transcriptome (PRJNA663282) can better reveal the association between genes and metabolites in the flavonoid pathway.
The strong substrate-binding affinity observed in PlaF3’H07 (ΔG = −4.7 kcal/mol) and PlaFLS05 (ΔG = −4.6 kcal/mol) underscores their potential as pivotal enzymes for quercetin biosynthesis. This observation is similar to previous molecular docking studies that have implicated flavonol synthase and flavonoid 3′-monooxygenase in the metabolic enhancement of kaempferol [55]. Although computational analyses support its enzymatic role, assays in vitro are needed to confirm its catalytic activities and kinetic properties. Intriguingly, PlaF3’H08, despite its transcriptional prominence in petaloid stamens, exhibits no effective substrate binding, suggesting a possible discordance between gene expression levels and protein efficacy. In A. thaliana, while several members of the FLS gene family are expressed, only FLS1 appears to affect flavonoid biosynthesis [56]. It is suggested that functional redundancy or subfunctionalization would be prevalent in plant flavonoid pathways. To elucidate these mechanisms, subsequent research should integrate protein interaction analyses, such as Co-Immunoprecipitation (Co-IP), with detailed enzyme kinetics studies.
Collectively, these findings enrich our understanding of the genetic and biochemical basis of floral organ transformation. The discovery of functionally divergent quercetin-related genes, particularly PlaF3’H03, which exhibits high transcript abundance but weak catalytic affinity, highlights a possible molecular uncoupling between gene expression and enzyme activity, a phenomenon rarely discussed in Paeonia. Moreover, our demonstration that metabolite glycosylation and acylation patterns are distinct in petaloid stamens offers new perspectives on how flavonol modification may shape auxin gradients and organ identity. Importantly, this study not only catalogs gene families but also bridges genomic architecture with metabolic function and morphological phenotype, contributing new conceptual and methodological frameworks for exploring floral trait development in ornamental plants. Our findings not only enhance the mechanistic understanding of floral organogenesis in Paeonia but also offer potential molecular targets for breeding double-flowered cultivars with improved ornamental traits through metabolic engineering of flavonol pathways.

5. Conclusions

This study systematically deciphers the genetic and biochemical mechanisms underpinning flavonoid biosynthesis and its role in stamen petalization in P. lactiflora. By integrating comparative genomics, transcriptomics, metabolomics, and molecular docking, we identified 13 flavonoid biosynthetic gene families across four Paeonia species, revealing lineage-specific expansions in P. ludlowii and conserved evolutionary patterns among orthologs. Chromosomal clustering, cis-regulatory element analysis, and phylogenetic reconstruction highlighted the regulatory complexity and functional diversification of these genes. Transcriptional profiling and qPCR validation demonstrated stage-specific upregulation of PlaF3’H03 during petaloid stamen development, while molecular docking identified PlaF3’H07 and PlaFLS05 as key enzymes with strong substrate-binding affinities, suggesting their catalytic roles in quercetin biosynthesis. Metabolomic analysis further revealed dynamic glycosylation and acylation of quercetin derivatives in petaloid stamens, implicating flavonoid modification in organ identity transitions.

Supplementary Materials

The following supporting information can be downloaded at: https://www.mdpi.com/article/10.3390/horticulturae11050463/s1, Table S1. The accession number of genes associated with flavonoid biosynthesis in A. thaliana and other plants; Table S2. The primary information used in this study; Table S3. Physicochemical properties and subcellular localization of flavonoid biosynthesis-related proteins in P. ludlowii; Table S4. Physicochemical properties and subcellular localization of flavonoid biosynthesis-related proteins in P. ostii; Table S5. Physicochemical properties and subcellular localization of flavonoid biosynthesis-related proteins in P. lactiflora; Table S6. Physicochemical properties and subcellular localization of flavonoid biosynthesis-related proteins in P. suffruticosa; File S1. modified GFAnno parameters. Figure S1. Protein conserved domain analysis of P. luslowii (a), P. ostil (b), P. suffruticosa (c), and P. lactiflora (d). Colored boxes indicate the different conserved domains as indicated in the scheme to the right of the figure. Figure S2. Conserved motifs analysis of P. luslowii, P. ostil, P. suffruticosa, and P. lactiflora. Colored boxes indicate the different conserved motifs as indicated in the scheme to the right of the figure.

Author Contributions

Conceptualization, Y.Z. and X.W.; methodology, Y.Z.; software, Y.Z.; validation, Y.Z., X.J. and Y.F.; formal analysis, Y.Z.; investigation, Y.Z. and Y.F.; resources, Y.Z. and Y.F.; data curation, Y.Z.; writing—original draft preparation, Y.Z.; writing—review and editing, Y.Z. and X.J.; visualization, Y.Z. and X.J.; supervision, X.W.; project administration, X.W.; funding acquisition, X.W. All authors have read and agreed to the published version of the manuscript.

Funding

This research received no external funding.

Data Availability Statement

The RNA-seq data were deposited in the NCBI database (PRJNA663282).

Acknowledgments

The authors sincerely thank Xiaonan Yu from Beijing Forestry University for her generous support in providing experimental materials and access to laboratory facilities, which were essential for the completion of this study.

Conflicts of Interest

The authors declare no conflicts of interest.

References

  1. Shen, N.; Wang, T.; Gan, Q.; Liu, S.; Wang, L.; Jin, B. Plant Flavonoids: Classification, Distribution, Biosynthesis, and Antioxidant Activity. Food Chem. 2022, 383, 132531. [Google Scholar] [CrossRef]
  2. Kurepa, J.; Shull, T.E.; Smalle, J.A. Friends in Arms: Flavonoids and the Auxin/Cytokinin Balance in Terrestrialization. Plants 2023, 12, 517. [Google Scholar] [CrossRef] [PubMed]
  3. Liu, W.; Feng, Y.; Yu, S.; Fan, Z.; Li, X.; Li, J.; Yin, H. The Flavonoid Biosynthesis Network in Plants. Int. J. Mol. Sci. 2021, 22, 12824. [Google Scholar] [CrossRef] [PubMed]
  4. Daryanavard, H.; Postiglione, A.E.; Mühlemann, J.K.; Muday, G.K. Flavonols Modulate Plant Development, Signaling, and Stress Responses. Curr. Opin. Plant Biol. 2023, 72, 102350. [Google Scholar] [CrossRef] [PubMed]
  5. Singh, P.; Arif, Y.; Bajguz, A.; Hayat, S. The Role of Quercetin in Plants. Plant Physiol. Biochem. 2021, 166, 10–19. [Google Scholar] [CrossRef]
  6. Ylstra, B.; Touraev, A.; Moreno, R.M.B.; Stöger, E.; Van Tunen, A.J.; Vicente, O.; Mol, J.N.M.; Heberle-Bors, E. Flavonols Stimulate Development, Germination, and Tube Growth of Tobacco Pollen. Plant Physiol. 1992, 100, 902–907. [Google Scholar] [CrossRef]
  7. Van Eldik, G.J.; Reijnen, W.H.; Ruiter, R.K.; Van Herpen, M.M.; Schrauwen, J.A.; Wullems, G.J. Regulation of Flavonol Biosynthesis during Anther and Pistil Development, and during Pollen Tube Growth in Solanum tuberosum. Plant J. 1997, 11, 105–113. [Google Scholar] [CrossRef]
  8. Teale, W.D.; Pasternak, T.; Dal Bosco, C.; Dovzhenko, A.; Kratzat, K.; Bildl, W.; Schwörer, M.; Falk, T.; Ruperti, B.; Schaefer, J.V.; et al. Flavonol-mediated Stabilization of PIN Efflux Complexes Regulates Polar Auxin Transport. EMBO J. 2021, 40, e104416. [Google Scholar] [CrossRef]
  9. Lewis, D.R.; Ramirez, M.V.; Miller, N.D.; Vallabhaneni, P.; Ray, W.K.; Helm, R.F.; Winkel, B.S.J.; Muday, G.K. Auxin and Ethylene Induce Flavonol Accumulation through Distinct Transcriptional Networks. Plant Physiol. 2011, 156, 144–164. [Google Scholar] [CrossRef]
  10. Buer, C.S.; Muday, G.K. The Transparent testa4 Mutation Prevents Flavonoid Synthesis and Alters Auxin Transport and the Response of Arabidopsis Roots to Gravity and Light. Plant Cell 2004, 16, 1191–1205. [Google Scholar] [CrossRef]
  11. Bouchard, R.; Bailly, A.; Blakeslee, J.J.; Oehring, S.C.; Vincenzetti, V.; Lee, O.R.; Paponov, I.; Palme, K.; Mancuso, S.; Murphy, A.S.; et al. Immunophilin-like TWISTED DWARF1 Modulates Auxin Efflux Activities of Arabidopsis P-Glycoproteins*. J. Biol. Chem. 2006, 281, 30603–30612. [Google Scholar] [CrossRef] [PubMed]
  12. Lewis, D.R.; Miller, N.D.; Splitt, B.L.; Wu, G.; Spalding, E.P. Separating the Roles of Acropetal and Basipetal Auxin Transport on Gravitropism with Mutations in Two Arabidopsis Multidrug Resistance-Like ABC Transporter Genes. Plant Cell 2007, 19, 1838–1850. [Google Scholar] [CrossRef] [PubMed]
  13. Bailly, A.; Sovero, V.; Vincenzetti, V.; Santelia, D.; Bartnik, D.; Koenig, B.W.; Mancuso, S.; Martinoia, E.; Geisler, M. Modulation of P-Glycoproteins by Auxin Transport Inhibitors Is Mediated by Interaction with Immunophilins*. J. Biol. Chem. 2008, 283, 21817–21826. [Google Scholar] [CrossRef]
  14. Kumar, V.; Suman, U.; Rubal; Yadav, S.K. Flavonoid Secondary Metabolite: Biosynthesis and Role in Growth and Development in Plants. In Recent Trends and Techniques in Plant Metabolic Engineering; Yadav, S.K., Kumar, V., Singh, S.P., Eds.; Springer: Singapore, 2018; pp. 19–45. ISBN 978-981-13-2251-8. [Google Scholar]
  15. Hong, D.-Y. Peonies of the World: Taxonomy and Phytogeography; Royal Botanic Gardens Kew: London, UK, 2010; Volume 1, ISBN 1-84246-392-6. [Google Scholar]
  16. Li, P.; Shen, J.; Wang, Z.; Liu, S.; Liu, Q.; Li, Y.; He, C.; Xiao, P. Genus Paeonia: A Comprehensive Review on Traditional Uses, Phytochemistry, Pharmacological Activities, Clinical Application, and Toxicology. J. Ethnopharmacol. 2021, 269, 113708. [Google Scholar] [CrossRef]
  17. Zuo, D.-D.; Guo, D.-L.; Hou, X.-G. Development Mechanism of Flower Type and Color in Tree Peony: A Review. Crop Breed. Genet. Genom. 2024, 6, e240009. [Google Scholar] [CrossRef]
  18. Kamenetsky-Goldstein, R.; Yu, X. Cut Peony Industry: The First 30 Years of Research and New Horizons. Hortic. Res. 2022, 9, uhac079. [Google Scholar] [CrossRef]
  19. Fan, Y.; Zheng, Y.; Teixeira Da Silva, J.A.; Yu, X. Comparative Transcriptomics and WGCNA Reveal Candidate Genes Involved in Petaloid Stamens in Paeonia lactiflora. J. Hortic. Sci. Biotechnol. 2021, 96, 588–603. [Google Scholar] [CrossRef]
  20. Lee, S.; Park, N.-I.; Park, Y.; Heo, K.; Kwon, Y.; Kim, E.S.; Son, Y.K.; Lee, K.J.; Choi, S.Y.; Choi, B.-S.; et al. Distribution of Flavonoids in Paeonia suffruticosa and Analyses of the Genes Involved in Flavonoid Biosynthesis in Plants. Plant Gene 2025, 41, 100490. [Google Scholar] [CrossRef]
  21. Zhang, T.; Yuan, Y.; Zhan, Y.; Cao, X.; Liu, C.; Zhang, Y.; Gai, S. Metabolomics Analysis Reveals Embden Meyerhof Parnas Pathway Activation and Flavonoids Accumulation during Dormancy Transition in Tree Peony. BMC Plant Biol. 2020, 20, 484. [Google Scholar] [CrossRef]
  22. Wang, X.; Tang, Y.H.; Luan, Y.T.; Zhang, H.C.; Zhao, D.Q.; Tao, J. Flavonoids Composition and Transcriptome Analysis in Herbaceous Peony (Paeonia lactiflora) of Double-Colored Flowers. Russ. J. Plant Physiol. 2022, 69, 66. [Google Scholar] [CrossRef]
  23. Gu, Z.; Zhu, J.; Hao, Q.; Yuan, Y.-W.; Duan, Y.-W.; Men, S.; Wang, Q.; Hou, Q.; Liu, Z.-A.; Shu, Q.; et al. A Novel R2R3-MYB Transcription Factor Contributes to Petal Blotch Formation by Regulating Organ-Specific Expression of PsCHS in Tree Peony (Paeonia suffruticosa). Plant Cell Physiol. 2019, 60, 599–611. [Google Scholar] [CrossRef] [PubMed]
  24. Zhang, Y.; Duan, J.; Wang, Q.; Zhang, M.; Zhi, H.; Bai, Z.; Zhang, Y.; Luo, J. The Paeonia Qiui R2R3-MYB Transcription Factor PqMYBF1 Positively Regulates Flavonol Accumulation. Plants 2023, 12, 1427. [Google Scholar] [CrossRef] [PubMed]
  25. Fan, Y.; Zheng, Y.; Chen, L.; Xu, L.; Teixeira Da Silva, J.A.; Wu, B.; Yu, X. Transcriptomic and Proteomic Analyses Reveal Changes in the Metabolic Pathways of Paeonia lactiflora Petaloid Stamens. Sci. Hortic. 2023, 312, 111859. [Google Scholar] [CrossRef]
  26. Liu, X.; Chen, Y.; Zhang, J.; He, Y.; Ya, H.; Gao, K.; Yang, H.; Xie, W.; Li, L. Widely Targeted Metabolomics Reveals Stamen Petaloid Tissue of Paeonia lactiflora Pall. Being a Potential Pharmacological Resource. PLoS ONE 2022, 17, e0274013. [Google Scholar] [CrossRef]
  27. Zhou, S.; Ma, C.; Gao, S.; Hou, D.; Song, P.; Guo, Z.; Zhang, Y.; Shi, G. Cloning and Expression of Floral Organ Identity Genes in Paeonia Ostii ‘Fengdan’. Pak. J. Bot. 2022, 54, 2115–2123. [Google Scholar] [CrossRef]
  28. Lv, S.; Cheng, S.; Wang, Z.; Li, S.; Jin, X.; Lan, L.; Yang, B.; Yu, K.; Ni, X.; Li, N.; et al. Draft Genome of the Famous Ornamental Plant Paeonia suffruticosa. Ecol. Evol. 2020, 10, 4518–4530. [Google Scholar] [CrossRef]
  29. Xiao, P.-X.; Li, Y.; Lu, J.; Zuo, H.; Pingcuo, G.; Ying, H.; Zhao, F.; Xu, Q.; Zeng, X.; Jiao, W.-B. High-Quality Assembly and Methylome of a Tibetan Wild Tree Peony Genome (Paeonia ludlowii) Reveal the Evolution of Giant Genome Architecture. Hortic. Res. 2023, 10, uhad241. [Google Scholar] [CrossRef]
  30. Zheng, Y.; Fan, Y.; Chen, Q.; Sun, M.; Chen, X.; Zhu, W.; Wang, Y.; Teixeira Da Silva, J.A.; Yu, X. Exploring miRNA-Target Modules in Paeonia lactiflora Stamen Petalization through Integrated miRNAome, Transcriptome, and Degradome Analysis. Ind. Crops Prod. 2024, 215, 118662. [Google Scholar] [CrossRef]
  31. Altschul, S.F.; Madden, T.L.; Schäffer, A.A.; Zhang, J.; Zhang, Z.; Miller, W.; Lipman, D.J. Gapped BLAST and PSI-BLAST: A New Generation of Protein Database Search Programs. Nucleic Acids Res. 1997, 25, 3389–3402. [Google Scholar] [CrossRef]
  32. Yuan, J.; Jiang, S.; Jian, J.; Liu, M.; Yue, Z.; Xu, J.; Li, J.; Xu, C.; Lin, L.; Jing, Y.; et al. Genomic Basis of the Giga-Chromosomes and Giga-Genome of Tree Peony Paeonia Ostii. Nat. Commun. 2022, 13, 7328. [Google Scholar] [CrossRef]
  33. Du, L.; Lu, C.; Wang, Z.; Zou, L.; Xiong, Y.; Zhang, Q. GFAnno: Integrated Method for Plant Flavonoid Biosynthesis Pathway Gene Annotation. Beverage Plant Res. 2024, 4, e008. [Google Scholar] [CrossRef]
  34. Chen, C.; Wu, Y.; Li, J.; Wang, X.; Zeng, Z.; Xu, J.; Liu, Y.; Feng, J.; Chen, H.; He, Y.; et al. TBtools-II: A “One for All, All for One” Bioinformatics Platform for Biological Big-Data Mining. Mol. Plant 2023, 16, 1733–1742. [Google Scholar] [CrossRef] [PubMed]
  35. Katoh, K.; Standley, D.M. MAFFT Multiple Sequence Alignment Software Version 7: Improvements in Performance and Usability. Mol. Biol. Evol. 2013, 30, 772–780. [Google Scholar] [CrossRef]
  36. Capella-Gutiérrez, S.; Silla-Martínez, J.M.; Gabaldón, T. trimAl: A Tool for Automated Alignment Trimming in Large-Scale Phylogenetic Analyses. Bioinformatics 2009, 25, 1972–1973. [Google Scholar] [CrossRef]
  37. Minh, B.Q.; Schmidt, H.A.; Chernomor, O.; Schrempf, D.; Woodhams, M.D.; Von Haeseler, A.; Lanfear, R. IQ-TREE 2: New Models and Efficient Methods for Phylogenetic Inference in the Genomic Era. Mol. Biol. Evol. 2020, 37, 1530–1534. [Google Scholar] [CrossRef]
  38. Kalyaanamoorthy, S.; Minh, B.Q.; Wong, T.K.F.; von Haeseler, A.; Jermiin, L.S. ModelFinder: Fast Model Selection for Accurate Phylogenetic Estimates. Nat. Methods 2017, 14, 587–589. [Google Scholar] [CrossRef]
  39. Hoang, D.T.; Chernomor, O.; von Haeseler, A.; Minh, B.Q.; Vinh, L.S. UFBoot2: Improving the Ultrafast Bootstrap Approximation. Mol. Biol. Evol. 2018, 35, 518–522. [Google Scholar] [CrossRef]
  40. Lescot, M.; Déhais, P.; Thijs, G.; Marchal, K.; Moreau, Y.; Van de Peer, Y.; Rouzé, P.; Rombauts, S. PlantCARE, a Database of Plant Cis-Acting Regulatory Elements and a Portal to Tools for in Silico Analysis of Promoter Sequences. Nucleic Acids Res. 2002, 30, 325–327. [Google Scholar] [CrossRef]
  41. Li, P.; Piao, Y.; Shon, H.S.; Ryu, K.H. Comparing the Normalization Methods for the Differential Analysis of Illumina High-Throughput RNA-Seq Data. BMC Bioinform. 2015, 16, 347. [Google Scholar] [CrossRef]
  42. Schmittgen, T.D.; Livak, K.J. Analyzing Real-Time PCR Data by the Comparative CT Method. Nat. Protoc. 2008, 3, 1101–1108. [Google Scholar] [CrossRef]
  43. Jumper, J.; Evans, R.; Pritzel, A.; Green, T.; Figurnov, M.; Ronneberger, O.; Tunyasuvunakool, K.; Bates, R.; Žídek, A.; Potapenko, A.; et al. Highly Accurate Protein Structure Prediction with AlphaFold. Nature 2021, 596, 583–589. [Google Scholar] [CrossRef] [PubMed]
  44. Morris, G.M.; Huey, R.; Lindstrom, W.; Sanner, M.F.; Belew, R.K.; Goodsell, D.S.; Olson, A.J. AutoDock4 and AutoDockTools4: Automated Docking with Selective Receptor Flexibility. J. Comput. Chem. 2009, 30, 2785–2791. [Google Scholar] [CrossRef] [PubMed]
  45. Sanner, M.F. Python: A Programming Language for Software Integration and Development. J. Mol. Graph. Model. 1999, 17, 57–61. [Google Scholar] [PubMed]
  46. Biłas, R.; Szafran, K.; Hnatuszko-Konka, K.; Kononowicz, A.K. Cis-Regulatory Elements Used to Control Gene Expression in Plants. Plant Cell Tissue Organ Cult. 2016, 127, 269–287. [Google Scholar] [CrossRef]
  47. Kerwin, R.E.; Hart, J.E.; Fiesel, P.D.; Lou, Y.-R.; Fan, P.; Jones, A.D.; Last, R.L. Tomato Root Specialized Metabolites Evolved through Gene Duplication and Regulatory Divergence within a Biosynthetic Gene Cluster. Sci. Adv. 2024, 10, eadn3991. [Google Scholar] [CrossRef]
  48. Shirai, K.; Matsuda, F.; Nakabayashi, R.; Okamoto, M.; Tanaka, M.; Fujimoto, A.; Shimizu, M.; Shinozaki, K.; Seki, M.; Saito, K.; et al. A Highly Specific Genome-Wide Association Study Integrated with Transcriptome Data Reveals the Contribution of Copy Number Variations to Specialized Metabolites in Arabidopsis thaliana Accessions. Mol. Biol. Evol. 2017, 34, 3111–3122. [Google Scholar] [CrossRef]
  49. Chang, J.; Marczuk-Rojas, J.P.; Waterman, C.; Garcia-Llanos, A.; Chen, S.; Ma, X.; Hulse-Kemp, A.; Deynze, A.V.; de Peer, Y.V.; Carretero-Paulet, L. Chromosome-Scale Assembly of the Moringa Oleifera Lam. Genome Uncovers Polyploid History and Evolution of Secondary Metabolism Pathways through Tandem Duplication. Plant Genome 2022, 15, e20238. [Google Scholar] [CrossRef]
  50. Liu, S.; Meng, Z.; Zhang, H.; Chu, Y.; Qiu, Y.; Jin, B.; Wang, L. Identification and Characterization of Thirteen Gene Families Involved in Flavonoid Biosynthesis in Ginkgo biloba. Ind. Crops Prod. 2022, 188, 115576. [Google Scholar] [CrossRef]
  51. Dubos, C.; Le Gourrierec, J.; Baudry, A.; Huep, G.; Lanet, E.; Debeaujon, I.; Routaboul, J.; Alboresi, A.; Weisshaar, B.; Lepiniec, L. MYBL2 Is a New Regulator of Flavonoid Biosynthesis in Arabidopsis thaliana. Plant J. 2008, 55, 940–953. [Google Scholar] [CrossRef]
  52. Li, B.; Fan, R.; Guo, S.; Wang, P.; Zhu, X.; Fan, Y.; Chen, Y.; He, K.; Kumar, A.; Shi, J. The Arabidopsis MYB Transcription Factor, MYB111 Modulates Salt Responses by Regulating Flavonoid Biosynthesis. Environ. Exp. Bot. 2019, 166, 103807. [Google Scholar] [CrossRef]
  53. Yue, L.; Zhong, M.; Kang, D.; Qin, H.; Li, H.; Chai, X.; Kang, Y.; Yang, X. Genome-Wide Identification and Characterization of Flavonol Synthase (FLS) Gene Family in Brassica Vegetables and Their Roles in Response to Biotic and Abiotic Stresses. Sci. Hortic. 2024, 331, 113168. [Google Scholar] [CrossRef]
  54. Peer, W.A.; Murphy, A.S. Flavonoids and Auxin Transport: Modulators or Regulators? Trends Plant Sci. 2007, 12, 556–563. [Google Scholar] [CrossRef] [PubMed]
  55. Kumari, G.; Nigam, V.K.; Pandey, D.M. The Molecular Docking and Molecular Dynamics Study of Flavonol Synthase and Flavonoid 3′-Monooxygenase Enzymes Involved for the Enrichment of Kaempferol. J. Biomol. Struct. Dyn. 2023, 41, 2478–2491. [Google Scholar] [CrossRef] [PubMed]
  56. Stracke, R.; De Vos, R.C.H.; Bartelniewoehner, L.; Ishihara, H.; Sagasser, M.; Martens, S.; Weisshaar, B. Metabolomic and Genetic Analyses of Flavonol Synthesis in Arabidopsis thaliana Support the in Vivo Involvement of Leucoanthocyanidin Dioxygenase. Planta 2009, 229, 427–445. [Google Scholar] [CrossRef]
Figure 2. Comparative analysis of flavonoid biosynthesis pathway genes across four Paeonia species and A. thaliana. This diagram illustrates the canonical flavonoid biosynthetic pathway, highlighting the enzymatic steps catalyzed by key gene families. Each reaction step is annotated with the number of gene copies identified in the genomes or transcriptomes of four Paeonia species—P. ludlowii (peach), P. ostii (blue), P. suffruticosa (yellow), and P. lactiflora (green)—as well as in Arabidopsis thaliana (pink, used as a model reference).
Horticulturae 11 00463 g002
Figure 3. Chromosomal distribution of flavonoid biosynthesis-related genes in Paeonia species. (a) Chromosomal localization of 78 enzyme-coding genes involved in flavonoid biosynthesis in P. ludlowii. (b) Chromosomal distribution of 52 flavonoid biosynthesis-related genes in P. ostii.
Horticulturae 11 00463 g003
Figure 4. Analysis of cis-acting elements in the 2000 bp sequence upstream of flavonoid biosynthesis-related genes. (a) cis-acting element of genes involved in flavonoid biosynthesis in Paeonia ludlowii. (b) cis-acting element of flavonoid biosynthesis-related genes in Paeonia ostii. The colored rectangles represent the four major types of cis-elements for each gene family, and the length of the rectangles means the number of cis-elements. The numbers in the squares represent the number of cis-elements for each gene family.
Horticulturae 11 00463 g004
Figure 5. Phylogenetic tree of flavonoid biosynthesis-related genes in Paeonia species. Leaves with different colors were responsible for each gene family, and green, blue, red, and yellow circles represented P. ludlowii, P. ostii, P. suffruticosa, and P. lactiflora, respectively.
Horticulturae 11 00463 g005
Figure 6. Expression patterns of quercetin biosynthesis-related genes in P. lactiflora indicated by RNA-seq during floral bud development. Genes with significant expression differences (p < 0.05) and maximum RPKM values greater than 5 were highlighted with a yellow background in the expression heatmap.
Horticulturae 11 00463 g006
Figure 7. Relative expression patterns of quercetin biosynthesis-related genes (F3’H and FLS families) in floral buds of P. lactiflora at three developmental stages: FYN1–FYN3 (normal stamens in ‘FYN’), LT1–LT3 (petaloid stamens in ‘LT’).
Horticulturae 11 00463 g007
Figure 8. Differential accumulation of quercetin-related metabolites in petals (P), petaloid stamens (PS), and stamens (S) of P. lactiflora. The heatmap (left) shows hierarchical clustering of metabolite abundance across tissues and biological replicates (P1–P3, PS1–PS3, S1–S3). The bubble plot (right) presents pairwise comparisons (PvsS, PvsPS, PSvsS) of each metabolite. Bubble size indicates |Log2FC|; bubble color represents p-value from t-tests. Orange rectangles highlight significantly differentially accumulated metabolites (p < 0.05 and |Log2FC| > 1). Asterisks (*) indicate metabolites that have known isomeric forms (isomers).
Horticulturae 11 00463 g008
Figure 9. Molecular docking analysis of key enzymes involved in quercetin biosynthesis; (a) docking interaction between PlaF3’H07 and dihydrokaempferol; (b) docking interaction between PlaFLS05 and dihydroquercetin.
Horticulturae 11 00463 g009
Table 1. Molecular docking analysis of candidate enzymes involved in quercetin biosynthesis.
Gene IDLowest Binding Free Energy
PlaF3’H07−4.7 kcal/mol
PlaF3’H01−2.1 kcal/mol
PlaF3’H03−2.4 kcal/mol
PlaF3’H06−0.3 kcal/mol
PlaF3’H08−kcal/mol
PlaF3’H02−2.3 kcal/mol
PlaF3’H04
PlaFLS01−3.2 kcal/mol
PlaFLS02−1.7 kcal/mol
PlaFLS03
PlaFLS04−2.7 kcal/mol
PlaFLS05−4.6 kcal/mol
Disclaimer/Publisher’s Note: The statements, opinions and data contained in all publications are solely those of the individual author(s) and contributor(s) and not of MDPI and/or the editor(s). MDPI and/or the editor(s) disclaim responsibility for any injury to people or property resulting from any ideas, methods, instructions or products referred to in the content.

