1. Introduction
Lettuce (
Lactuca sativa L.) is an important dietary vegetable that is primarily consumed fresh in salads. Consumption of lettuce has some health benefits attributed to the presence of vitamin C, phenolic compounds, and fiber content. Considering the global market, Spain and Italy are two of the top-ranking lettuce producers in the world, responsible for about 9% of global lettuce production. Spain, Italy, Turkey, and France are the major lettuce-producing countries in the Mediterranean basin, reaching a yield of almost 3 million tons/year. From 2000 to 2007, 77% of the total lettuce production in the European Union was harvested in Spain, Italy, Turkey, and France [
1,
2]. Lettuce is tender and delicious, rich in multiple vitamins and minerals, has a high multiple-cropping index and uniform growth, and is widely planted in China [
3]. Crop yield and quality are significantly influenced by nitrogen, a necessary nutrient for crop growth. As a result, a crucial component of crop maintenance is optimizing nitrogen application [
4]. Nitrogen deficiency reduces yields by limiting the rate of photosynthesis and biomass accumulation [
5]. Nitrogen is a crucial element in physiology, playing a central role in the structure and function of biomolecules. It is a key component of amino acids, nucleotides, and chlorophyll, and is essential for the synthesis of proteins, nucleic acids, and other biomolecules. Nitrogen is also involved in various physiological processes, including energy metabolism, immune function, and neurotransmission. It is the core mineral nutrient element that activates the different physiological and biochemical processes in plants. It improves nutrient uptake, photosynthesis, and the respiration process by synthesizing various metabolic substances such as hormones, vitamins, proteins, and several metabolic enzymes. Adequate nitrogen intake is essential for maintaining optimal physiological function, and deficiencies can lead to a range of health problems in lettuce crop. Applying too much nitrogen can result in more invalid tillers, lower yields, higher costs, and more environmental pollution. Thus, crop nitrogen levels must be monitored to maximize crop yield and quality. Human activities, notably in agriculture and industrial sectors, have significantly altered this natural cycle, resulting in environmental challenges like eutrophication and increased greenhouse gas emissions. In industrial contexts, the transportation of N involves handling compounds like ammonia and nitric acid, necessitating strict safety measures. Current research is focused on developing sustainable practices and innovative methods for N utilization, aiming to mitigate the environmental impact and enhance efficiency in its use.
Fertilization is an essential factor affecting crop growth, and nitrogen plays a crucial role in increasing lettuce yield, income, nutritional, and safety quality [
6]. According to earlier research, using leaf nitrogen concentration (LNC) to guide nitrogen fertilizer application was effective. However, the conventional approach to measuring LNC typically relies on field-collected plant samples and laboratory analysis, which is labor-intensive and time-consuming. Remote sensing has been researched and suggested as a substitute for nondestructive, real-time crop status monitoring to address this issue [
7]. However, nitrogen management issues have become increasingly prominent with large-scale and efficient agricultural production development. Traditional nitrogen fertilization methods that rely on experience lack accuracy and timeliness; can easily lead to excessive or insufficient nitrogen, affecting crop growth and development; and also may cause environmental pollution problems [
8].
Modern nondestructive imaging technologies are rapid, and nondestructive detection systems are extensively used in predicting agriculture product components [
9,
10]. However, accurately estimating the nitrogen nutritional status of plants provides a reference for producers to adjust fertilization measures in a timely manner and will also become the development direction of crop nitrogen diagnosis in the future [
11]. Nitrogen diagnosis of lettuce based on deep learning is a kind of modern nondestructive diagnostic technology that emerged after deep learning technology’s gradual maturation [
12]. A convolutional neural network in deep learning (CNN) was used to perform image segmentation of fresh lettuce. Then, the K-nearest neighbor algorithm was used to predict the ammonium content levels (QL1, QL2, QL3, QL4, and QL5) of lettuce, in which the CNN segmentation algorithm only used convergence and was completed in 70 s, and the accuracy reached 0.979. Drones collected digital images and normalized vegetation index (NDVI) to predict nitrogen stress in lettuce to construct linear and deep learning CNN models to complete classification and regression prediction tasks, as seen in PHAM et al. [
13]. The results in PAN et al. [
14] show that the CNN model is significantly better than the linear regression model and can more accurately evaluate plant height, number of leaves, NDVI, chlorophyll content, and nitrogen stress in lettuce.
Research on nitrogen diagnosis of lettuce based on deep learning is still in the active development stage; whether it is digital image segmentation in the data processing stage, screening of characteristic bands of hyperspectral images, or final classification or regression model training, deep learning can play a role [
15]. Compared with traditional vegetation index diagnosis methods, deep learning can make maximum use of the information contained in the original data. However, there are still some challenges, such as the cost of data collection, labelling and training, and the interpretability of the deep learning model. Additionally, model migration issues under different environmental conditions still need to be further explored by researchers. Nondestructive techniques for estimating nitrogen (N) status are essential tools for optimizing N fertilization input and reducing the environmental impact of agricultural N management, especially in green lettuce cultivation, which is notably problematic. The main research objectives are to propose an improved deep learning study to extend the hyperspectral data set of lettuce and a more reliable evaluation of nitrogen diagnosis to validate the validity of the generated spectral data and develop a new side-dress N fertilizer recommendation strategy at the initial stage based on the RFR model using crop sensor and other ancillary data. This study obtained the corresponding plant parts’ spectral data and nitrogen contents. After that, hyperspectral reflectance, random forest, and transfer learning techniques in RGB were used to predict nitrogen contents.
2. Material and Methods
2.1. Sample Preparations
2.1.1. Lettuce Cultivation
The lettuce variety used in the experiment was “Batavia”, purchased from Shanghai Xinghui Vegetable Co., Ltd. (Shanghai, China), and the soilless culture medium used in the experiment was purchased from Shanghai Yuanyi Seedling Co., Ltd. (Shanghai, China) The experiment was conducted from October 2021 to November 2021 in the glass greenhouse of the Agricultural Engineering Training Center of the School of Agriculture and Biology, Shanghai Jiao Tong University. “Batavia” lettuce was cultivated using a substrate. The specifications of the seedling pots were 12 cm × 10.5 cm × 14 cm (height × bottom diameter × diameter). Each pot contained 110 g of soilless cultivation substrate. Made from a mixture of coconut bran, vermiculite, peat, and perlite, its nutrient content was as follows: organic matter 488.3 g/kg, total nitrogen 33 g/kg, ammonium nitrogen 38.0 mg/kg, nitrate nitrogen 379.5 mg/kg, quick-acting potassium 3512 mg/kg, available phosphorus 260.2 mg/kg, available nitrogen 417.5 mg/kg. A 200-hole plug tray was used for seed cultivation. The seeds were transplanted into seedling pots at the two-leaf and one-center stage. After slowing the seedlings for a week, they started to be treated with nutrient solutions with different nitrogen levels. The nutrient solution used in the experiment was adjusted based on the Hoagland formula [
16], and a total of 6 nitrogen concentration gradients were set [CK (0%): 0 mmolL
−1; T1 (50%): 7.5 mmolL
−1; T2 (75%): 10.25 mmolL
−1; T3 (100%): 15 mmolL
−1; T4 (125%): 18.75 mmolL
−1; T5 (150%): 22.5 mmolL
−1]. The mother liquor formula is shown in
Table 1. Each concentration gradient nutrient solution uses a different proportion of stock solution to dilute 1 L (
Table 1). In each gradient treatment, 75 lettuce plants were cultivated, totaling 450. After the seedling slowed down, treatments took place every 5 d. The plant spacing was set at 33.3 cm (three plants per slab) between individual plants and 150 cm between rows. Samples were taken once, and 15 plants were destructively sampled for each gradient treatment to measure various indicators of growth physiology and nutritional quality. The remaining plants were supplemented with 30 mL, corresponding to the gradient of nutrient solution.
2.1.2. Fertilizer Application
The experiment was conducted in the greenhouse of Shanghai Green Cube Agricultural Development Co., Ltd. (Shanghai, China), from 13 October 2022 to 20 November 2022. “Batavia” lettuce was cultivated in shallow liquid flow water. The seeds were planted in the seedbed with two leaves and one heart. The nutrient solution adopted the Hogland formula, and the mother liquor was diluted to an EC value of 1.8 mS/cm
Table 1. The fertilizer spreader was started every 5 min. Each fertilization lasted 5 min. Samples were taken every 2 days after planting, and 8 plants were destructively sampled each time. A total of 20 samples were taken during the entire growth period. Growth physiological indicators were measured, and RGB and hyperspectral images were obtained.
The trial was conducted from 13 October to 20 November 2022, in the greenhouse of Shanghai Green Cube Agricultural Development Co., Ltd. The lettuce for the leaves of “Batavia” was cultivated using shallow liquid hydroponics; the seedlings were planted to the seedbed at the two-leaf and one-heart stage, the nutrient solution was Hogland formula, and the mother solution was diluted to an EC value of 1.8 mS/cm; the fertilizer applicator was started every 5 min, and the duration of each fertilization was 5 min. After planting, samples were taken every 2 days, and 8 plants were taken destructively each time. A total of 20 samples were taken during the whole growth period, the growth physiological indexes were measured, and RGB and hyperspectral images were obtained.
2.2. Hyperspectral Equipment and Image Acquisition
Method 1: Huawei Mate 20 mobile phone camera (Huawei Technologies Co., Ltd, Guangdong, China) used in professional mode to capture outdoors in natural light conditions. A tripod was used to keep the phone 40 cm above ground level and adjusted the parameters such as matrix metering, automatic sensitivity, exposure time of 1/100 s, exposure compensation 0, autofocus, resolution, and image size of 3968 × 2976. A total of 450 RGB images were acquired during the entire growth period of the lettuce cultivation process, and 160 RGB images were acquired at the fertilizer application stage.
Method 2: Hikvision DS-2CD2756FWDV2-IZS network camera (Hangzhou, China) used to capture RGB images with a resolution of 2560 × 1536.
A Specim IQ portable hyperspectral camera (Finland) was used to collect real-time reflection spectral images of the lettuce canopy. The Specim IQ is a handheld hyperspectral camera that performs hyperspectral data acquisition, data processing, and visualization of classification results in a single integrated unit. Its collection spectral range is 400~1000 nm, with an interval of 7 nm, 204 bands, a focal length of 21 mm, and a resolution of 512 × 512. The shots were taken with the lettuce canopy at 60 cm, 90 cm, and 120 cm from the lens. These distances were carefully selected as they were neither too close, which could ensure the entire lettuce could be recorded comprehensively, nor too far, enabling the capture of the reflectance of the lettuce veins accurately. Each image was taken with a standard diffuse reflection whiteboard as a reference to eliminate the influence of changes in light intensity. A total of 450 hyperspectral images were acquired during cultivation, and 480 hyperspectral images were acquired in the fertilizer application process.
Preprocessing and segmentation of RGB images play a standardizing role. Firstly, compared with traditional threshold-based segmentation methods, U2Net segmentation offers better results, significantly enhanced generalization ability, and adaptability to different lighting conditions. Through this step, all lettuce plants are extracted intact, thus completely eliminating the influence of complex and variable backgrounds on model training and inference. Secondly, unifying the image size to 320 × 320 for training the nitrogen diagnosis model enables the model to effectively process photos collected at various distances for inference during practical applications.
2.3. RGB Image Preprocessing and IMAGE Segmentation
The specifications of the system used for RGB image preprocessing are CPU (i5-13600 KF), GPU (RTX 4090), memory (32 GB) operating system (Windows 10 Professional Edition), PyCharm Professional 2022.1.3 for integrated development environment, Python version 3.10, PyTorch version 1.11.0, Pillow version 9.0.1, and Photoshop 2020.
Image annotation was performed using Photoshop to add noise interference in all collected RGB images in Experiment 1 and Experiment 2. The area of the lettuce was marked manually. Afterward, Pillow was used to conduct an image enhancement step to perform data enhancement on the noise-added RGB images and annotation files (rotate at 90° clockwise in left, right, up, and down directions). After 610 RGB images were enhanced, 3660 RGB images were obtained, and images were split into training, verification, and test sets according to a ratio of 7:1:2. The 10% validation set serves to mitigate the risk of model overfitting. By providing an independent data set during the training process for model evaluation and adjustment, it helps to ensure that the model does not overly memorize the training data. Meanwhile, the 20% test set is sufficient to comprehensively validate the generalization ability of the model. It allows for assessing how well the model can perform on unseen data, which is crucial for evaluating the model’s practical applicability and reliability in real-world scenarios.
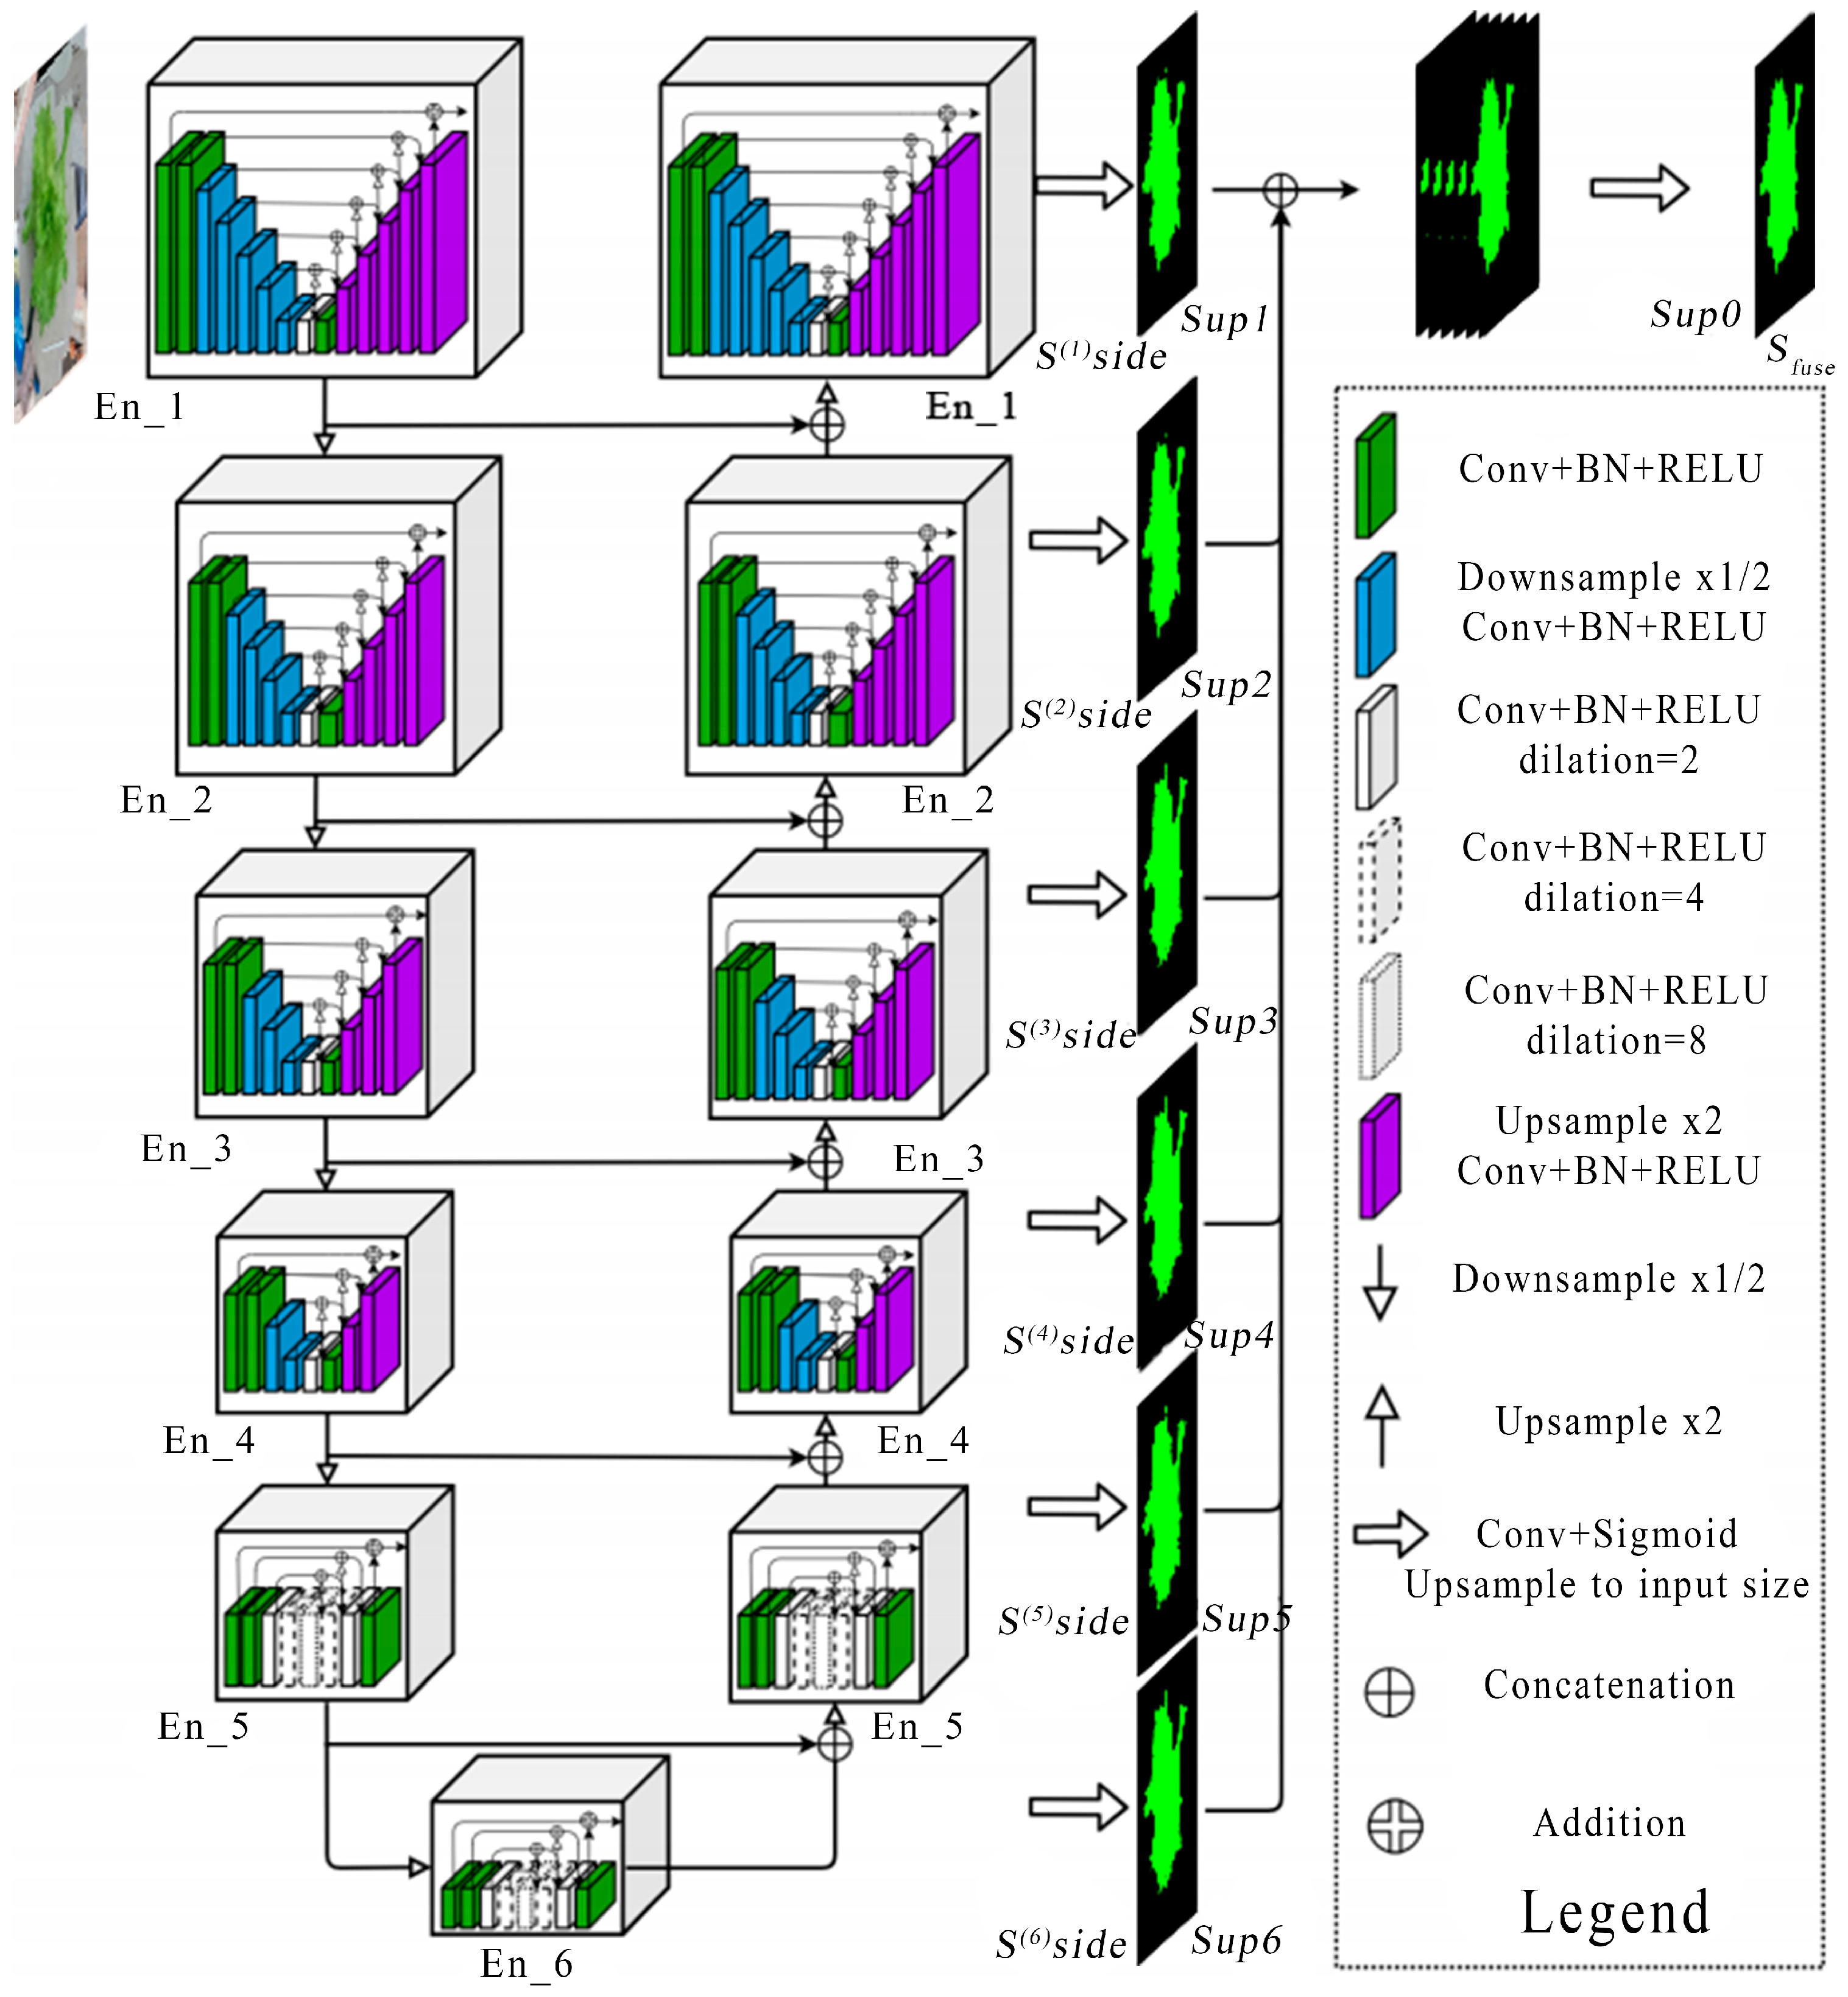
The U2Net neural network was used to train the lettuce image segmentation algorithm, which is lightweight and highly accurate compared with other available networks; the structure is shown in
Figure 1. U2Net is a network proposed for salient target detection tasks [
17]. It is an end-to-end deep denoising network with an encoder–decoder structure. It extracts semantic information through a 7-layer encoder, restores detail through a 6-layer decoder, and implements information through skip connections. This transfer ultimately achieves efficient image denoising. The network was built on a PyTorch framework, with the hyperparameters set to Batch_size = 8, Epoch = 30, initial learning rate Lr = 0.001, and input image resolution = 320 × 320.
2.3.1. Hyperspectral Image Preprocessing
Reflection intensity and calibration were performed on lettuce at a hyperspectral wavelength obtained using the Specim IQ portable hyperspectral camera (Specim, Spectral Imaging Ltd., Oulu, Finland) and placed in ENVI remote sensing file format with the suffix .dat. The NumPy module reads the ENVI remote sensing format file in float 32 format and calibrates the spectral data [
18]. The calibration is as shown in Formula (1).
R is the corrected reflectance value, is the digital quantization value (Digital Number , DN) of the original hyperspectral image, is the dark current DN value, and DN is the value of the standard diffuse reflectance reference white plate.
The original reflectance intensity is a one-dimensional array with a length of 53,477,376. After the correction, the one-dimensional array is reshaped to (512, 204, 512), 204 is the number of channels, and the resolution is 512 × 512 of a three-dimensional array in a NumPy format file. The 204 channels express 204 bands, respectively, and each value represents the spectral reflectance of the corresponding pixel in a specific band.
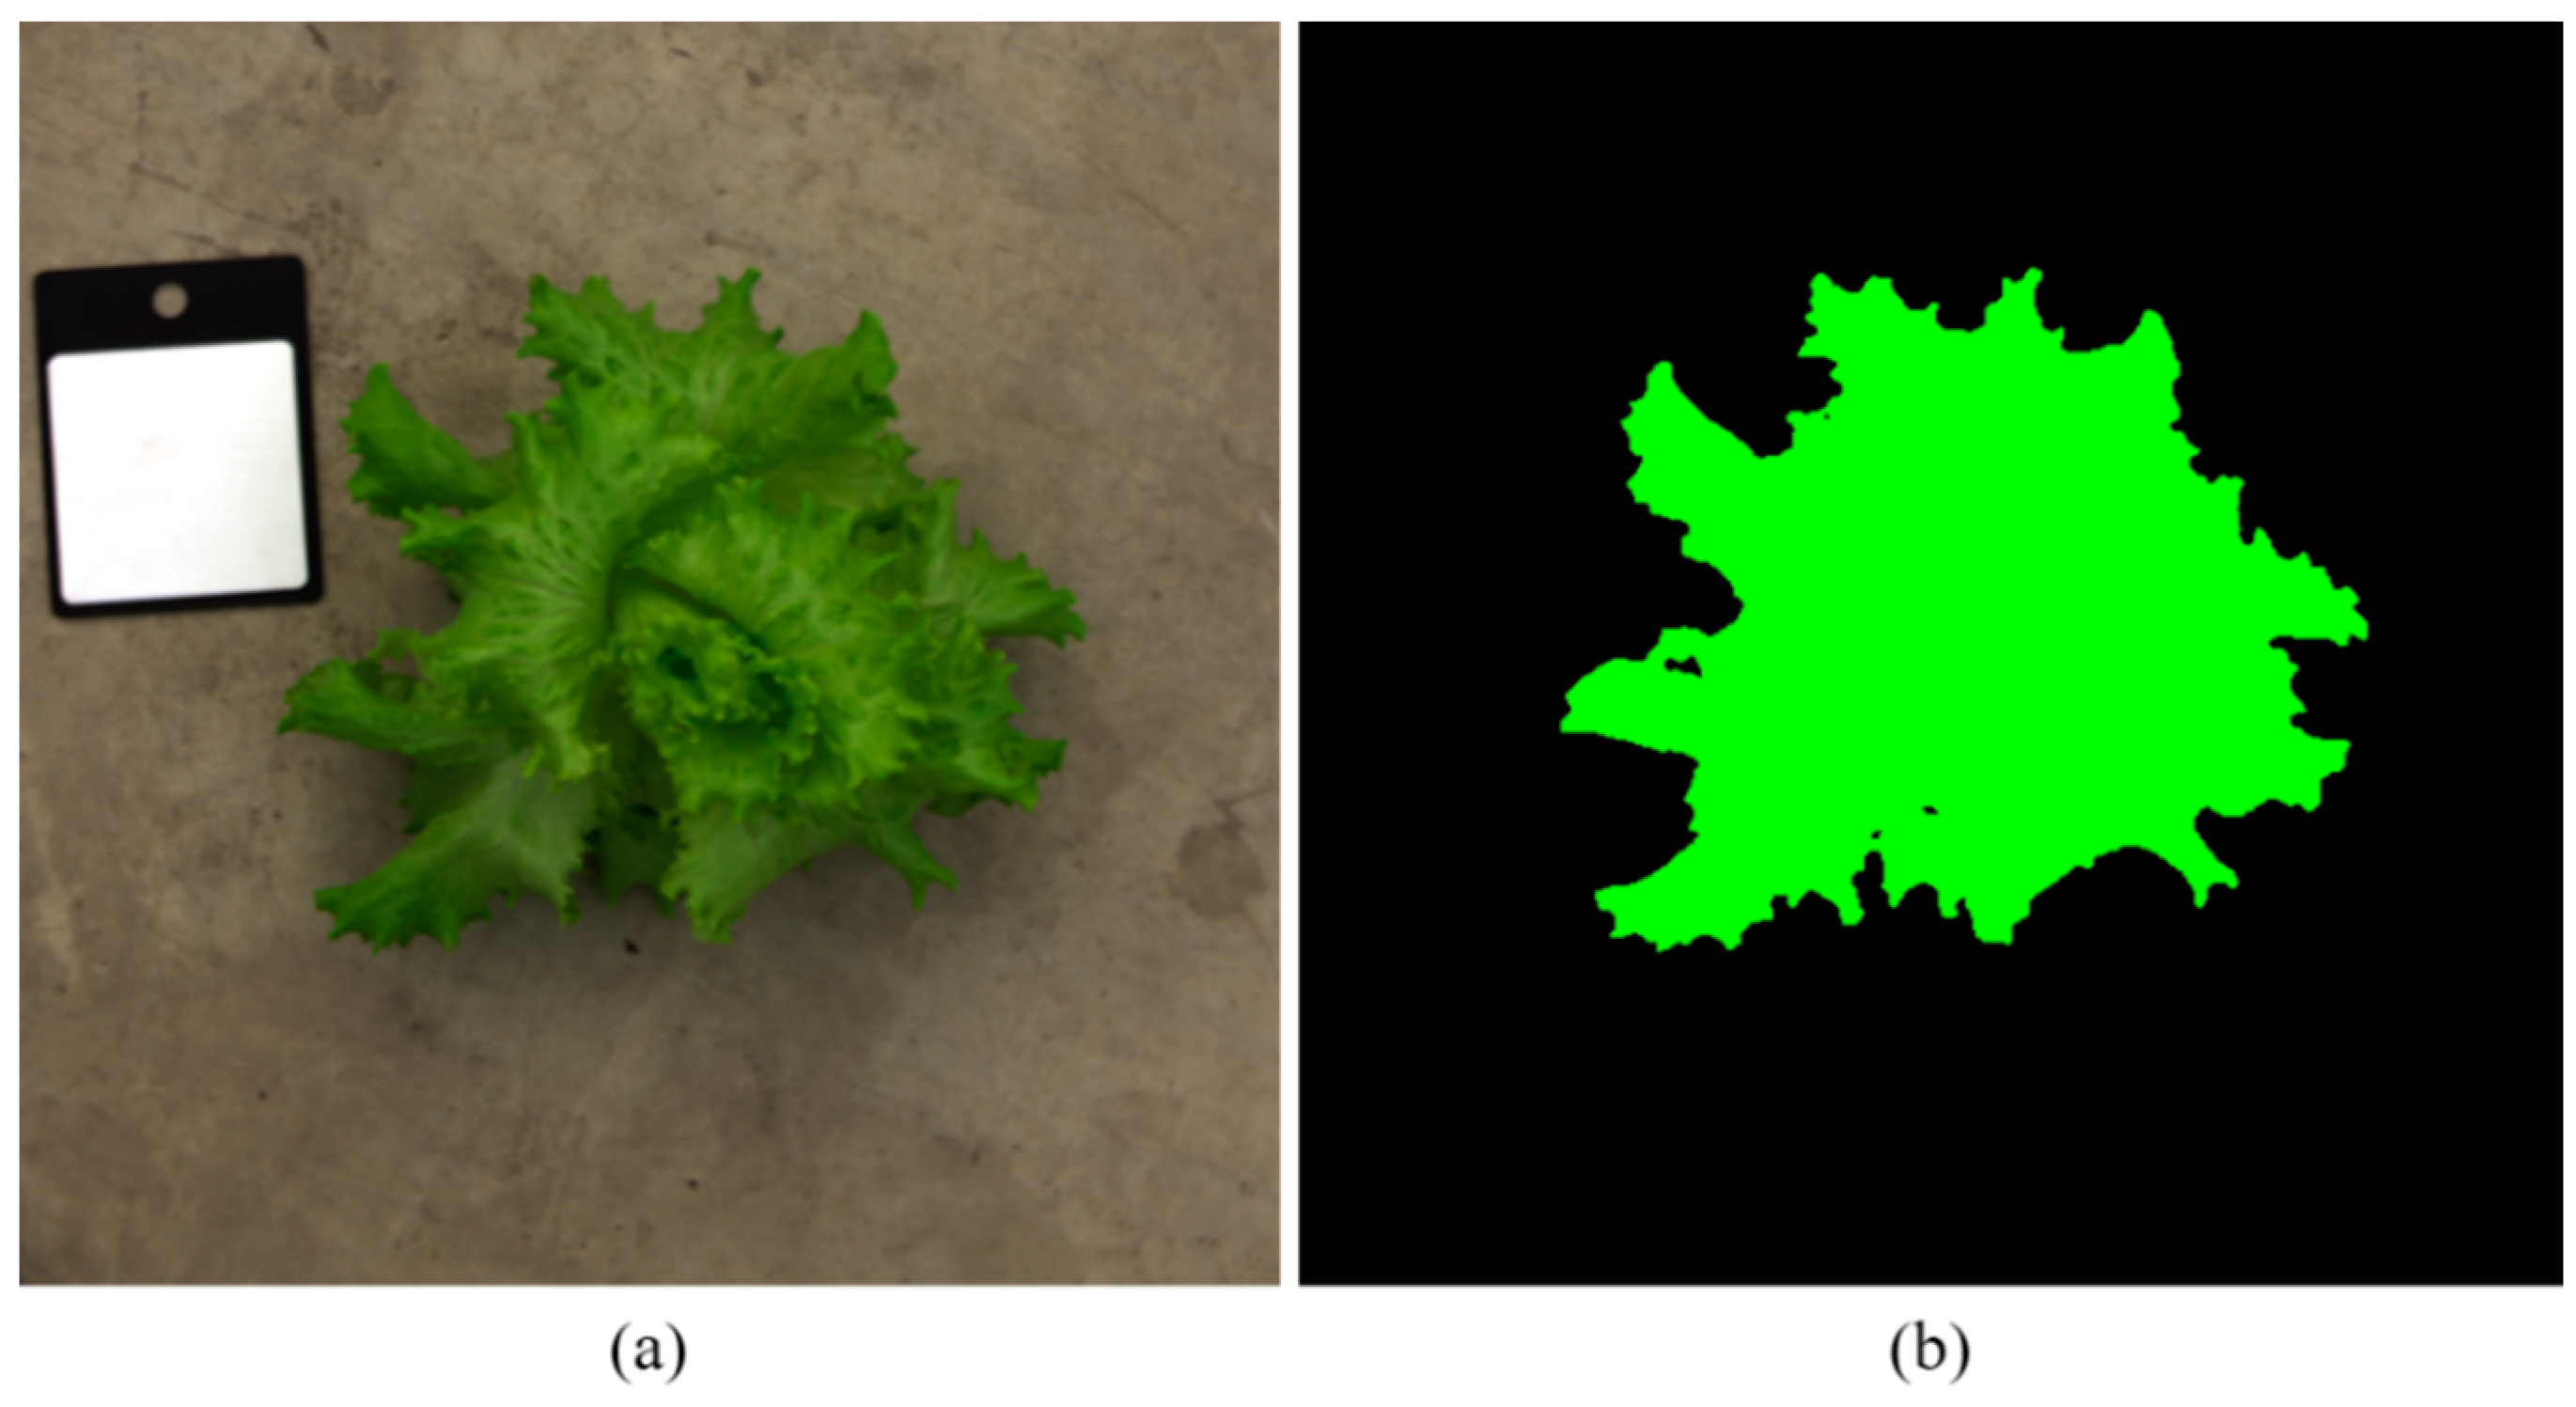
Target area acquisition: The trained U2Net model was used to segment the lettuce objects in all images and mask the lettuce target, as shown in
Figure 2. The green and background pixel values of the masked images are 1 and 0, respectively. Based on the above mask, vector multiplication processing was performed on the three-dimensional array obtained in the previous step, the reflectance of the target area was retained in all 204 bands, and the reflectance of the non-target area was set to 0, thereby eliminating background spectral reflectance for subsequent processing and interference with analysis.
Sensitive band selection with the NumPy and sklearn modules was used to average the reflectance of the lettuce target area in 204 bands of all hyperspectral images and determine feature values, using the nitrogen content of the lettuce as reference values. The linear regression algorithm of the sklearn module and the nonlinear continuous projection algorithm selected the three bands most sensitive to nitrogen content and sorted them from large to small in order of correlation. Among the 204 bands, the index values of these three bands were 101, 100, and 80, respectively. The corresponding wavelengths were 690.64 nm, 693.62 nm, and 631.15 nm,
Supplementary Figure S1. Band concat with the NumPy module was used to extract the two-dimensional reflectance array of all hyperspectral images in the three bands of 690.64 nm, 693.62 nm, and 631.15 nm, with a shape of (512, 512); splice it into a three-dimensional array with a shape of (512, 51, 3); and save it as a NumPy format data set. After randomly shuffling the data set, the training set, verification set, and test set were randomly divided into the training set verification set and test set in a ratio of 7:1:2 for subsequent nitrogen prediction model training (
Supplementary Figure S2).
2.3.2. Data Fusion Preprocessing
Data fusion: After obtaining the target area in the previous step, the hyperspectral data acquired were a three-dimensional array with a shape of (512, 204, 512). All elements fell between 0 and 1; the third dimension (204) corresponded to 204 spectral bands. The RGB image data were a three-dimensional array with a shape of (512, 512, 3), where all elements ranged between 0 and 255. The third dimension (3) represents the Blue, Green, and Red color channels, respectively. Data were extracted from the 100th dimension of the hyperspectral data array (reflectance data for the 690.64 nm wavelength most sensitive to nitrogen), all reflectance values were multiplied by 255, and the B channel data in the RGB image data were replaced, thereby achieving the fusion of hyperspectral and RGB data from multiple sources (
Supplementary Figure S3)
2.4. Machine and Deep Learning Model Development
Supervised learning is a model training method in which all input content and output results are known. The input and output used for training are collectively called a data set. The algorithm finds the best way or pattern from a given input to a given production through continuous iterative learning. When new unknown data arrive, the results can be predicted based on the learned patterns [
19]. Four machine learning algorithms, including linear regression, support vector machine regression [
20], AdaBoost regression [
21], and random forest regression [
22] were used in this study.
2.4.1. Linear Regression Algorithm Construction
Linear regression is a standard statistical analysis method used to build a linear relationship model to predict the relationship between a dependent variable and one or more independent variables [
23]. Linear regression aims to find the best regression coefficient and error term. The least squares method is usually used to find the best function match of the data to minimize the sum of squared residuals between the model’s predicted value and the observed value.
2.4.2. Support Vector Machine Regression Algorithm Construction
Support vector machine regression (SVR): The principle of SVR is based on the following assumptions: first, SVR tries to find a linear hyperplane that can bring the known data as close to it as possible, and the error within a specific range is acceptable; second, SVR defines a loss function that measures the difference between the predicted value and the actual value, keeping the loss at zero within the error range and increasing linearly otherwise. Next, SVR optimizes the weights to minimize the loss function and find the best hyperplane for regression prediction. Therefore, SVR is a powerful regression prediction method that can be adjusted based on data characteristics for optimal performance [
24].
2.4.3. AdaBoost Regression Algorithm Construction
AdaBoost regression is an ensemble learning technique that solves regression problems by iteratively optimizing a combination of multiple basic regression models [
25]. Initially, each data point has equal weight, and then the basic regression model is trained under these weights, and after multiple iterations, multiple regression models are finally formed. By weighted combination of the prediction results of these basic models, accurate fitting of the target variables is achieved, and the model also shows robustness in the face of noise and complex relationship data.
2.4.4. Random Forest Regression Algorithm Construction
Random forest (RF) regression is a powerful ensemble learning method that builds multiple decision tree models by randomly selecting different data subsets and features [
26]. Each tree independently predicts the target variable, and the final regression prediction is generated by averaging or weighting the predictions of these trees. This method has two key advantages: first, it reduces the variance of the model through randomness and improves the stability of the model; second, it increases the diversity of the model and improves the overall performance by constructing multiple different decision trees. It can also effectively handle high-dimensional data and large-scale data sets. Therefore, random forest regression performs well in various complex regression tasks.
2.5. Data Modeling and Validation
Supervised learning is a model training method in which all input content and output results are known [
27]. The input and output used for training are collectively called a data set. Through continuous iterative learning, the algorithm finds the best way or pattern from a given input to a given production. When new unknown data arrives, the results can be predicted based on the learned patterns [
19]. In this work, the RGB image, H SI data, and fused image are obtained through image preprocessing.
We used ResNet [
28], SqueezeNet [
29], ShuffleNet [
30], MobileNet [
31], RegNet [
32], and EfficientNet [
33], which are six lightweight CNN models designed for mobile terminals.
ResNet18 has 18 layers that show the network architecture, which contains four main stages: input processing, residual block, global average pooling, and fully connected layer. The input image size is 336 × 336 pixels, with three channels (R, G, and B). The original image is passed through a 7 × 7 convolution layer with a stride of 2 and 64 convolution kernels. The convolution operation reduces the image size from 336 × 336 to 16.8 × 16.8. This convolutional layer is followed by a batch normalization (BN) layer and ReLU activation function. Then, the image is passed through a 3 × 3 max pooling layer with a stride of 2; at this time, the feature map size is reduced to 8.4 × 8.4.
SqueezeNet-1.1 is a lightweight deep neural network architecture that adopts a unique “Fire module” structure to maintain a small model size while maintaining good learning performance. ShuffleNet v2 is a lightweight neural network architecture that points out that measuring model speed cannot just be measured using floating point operations (FLOPs) because the actual running time of a model is also related to the memory access cost (MAC), GPU parallelism, related to file IO, and other operations. Based on the four principles of having the same number of input and output channels, the number of groups not being too large, having as few fragmented operations as possible, and avoiding element-by-element operations, the ShuffleNet v2 algorithm has the basic modules.
Model evaluation, which is based on the coefficient of determination (R
2), mean absolute error (MAE), and mean square error (MSE) commonly used in the field of artificial intelligence, is calculated by the following formulas:
In the above formulas, is the predicted value of nitrogen content of lettuce, is the measured value of nitrogen content of lettuce, represents the iteration of each value, and represents the number of records. The better the model effect, the closer the of the training set, validation set, and test set are to 1, and the closer the sum of and is to 0.
2.6. Statistical Analysis
All data underwent analysis using Student’s t-tests through procedures based on Python. We conducted an independent two-sample t-test at a significance level of p ≤ 0.05. The treatment layout followed a completely randomized block design. Furthermore, we leveraged the functionalities of the Matplotlib library (V3.5.3) in Python for efficient data visualization. This robust library enabled us to generate violin plots, bar graphs, distribution plots, and box plots, providing 216 comprehensive visual representations of our data distribution.
3. Results and Discussion
3.1. Nitrogen Diagnosis of Lettuce Based on Machine Learning and Spectral Reflectance
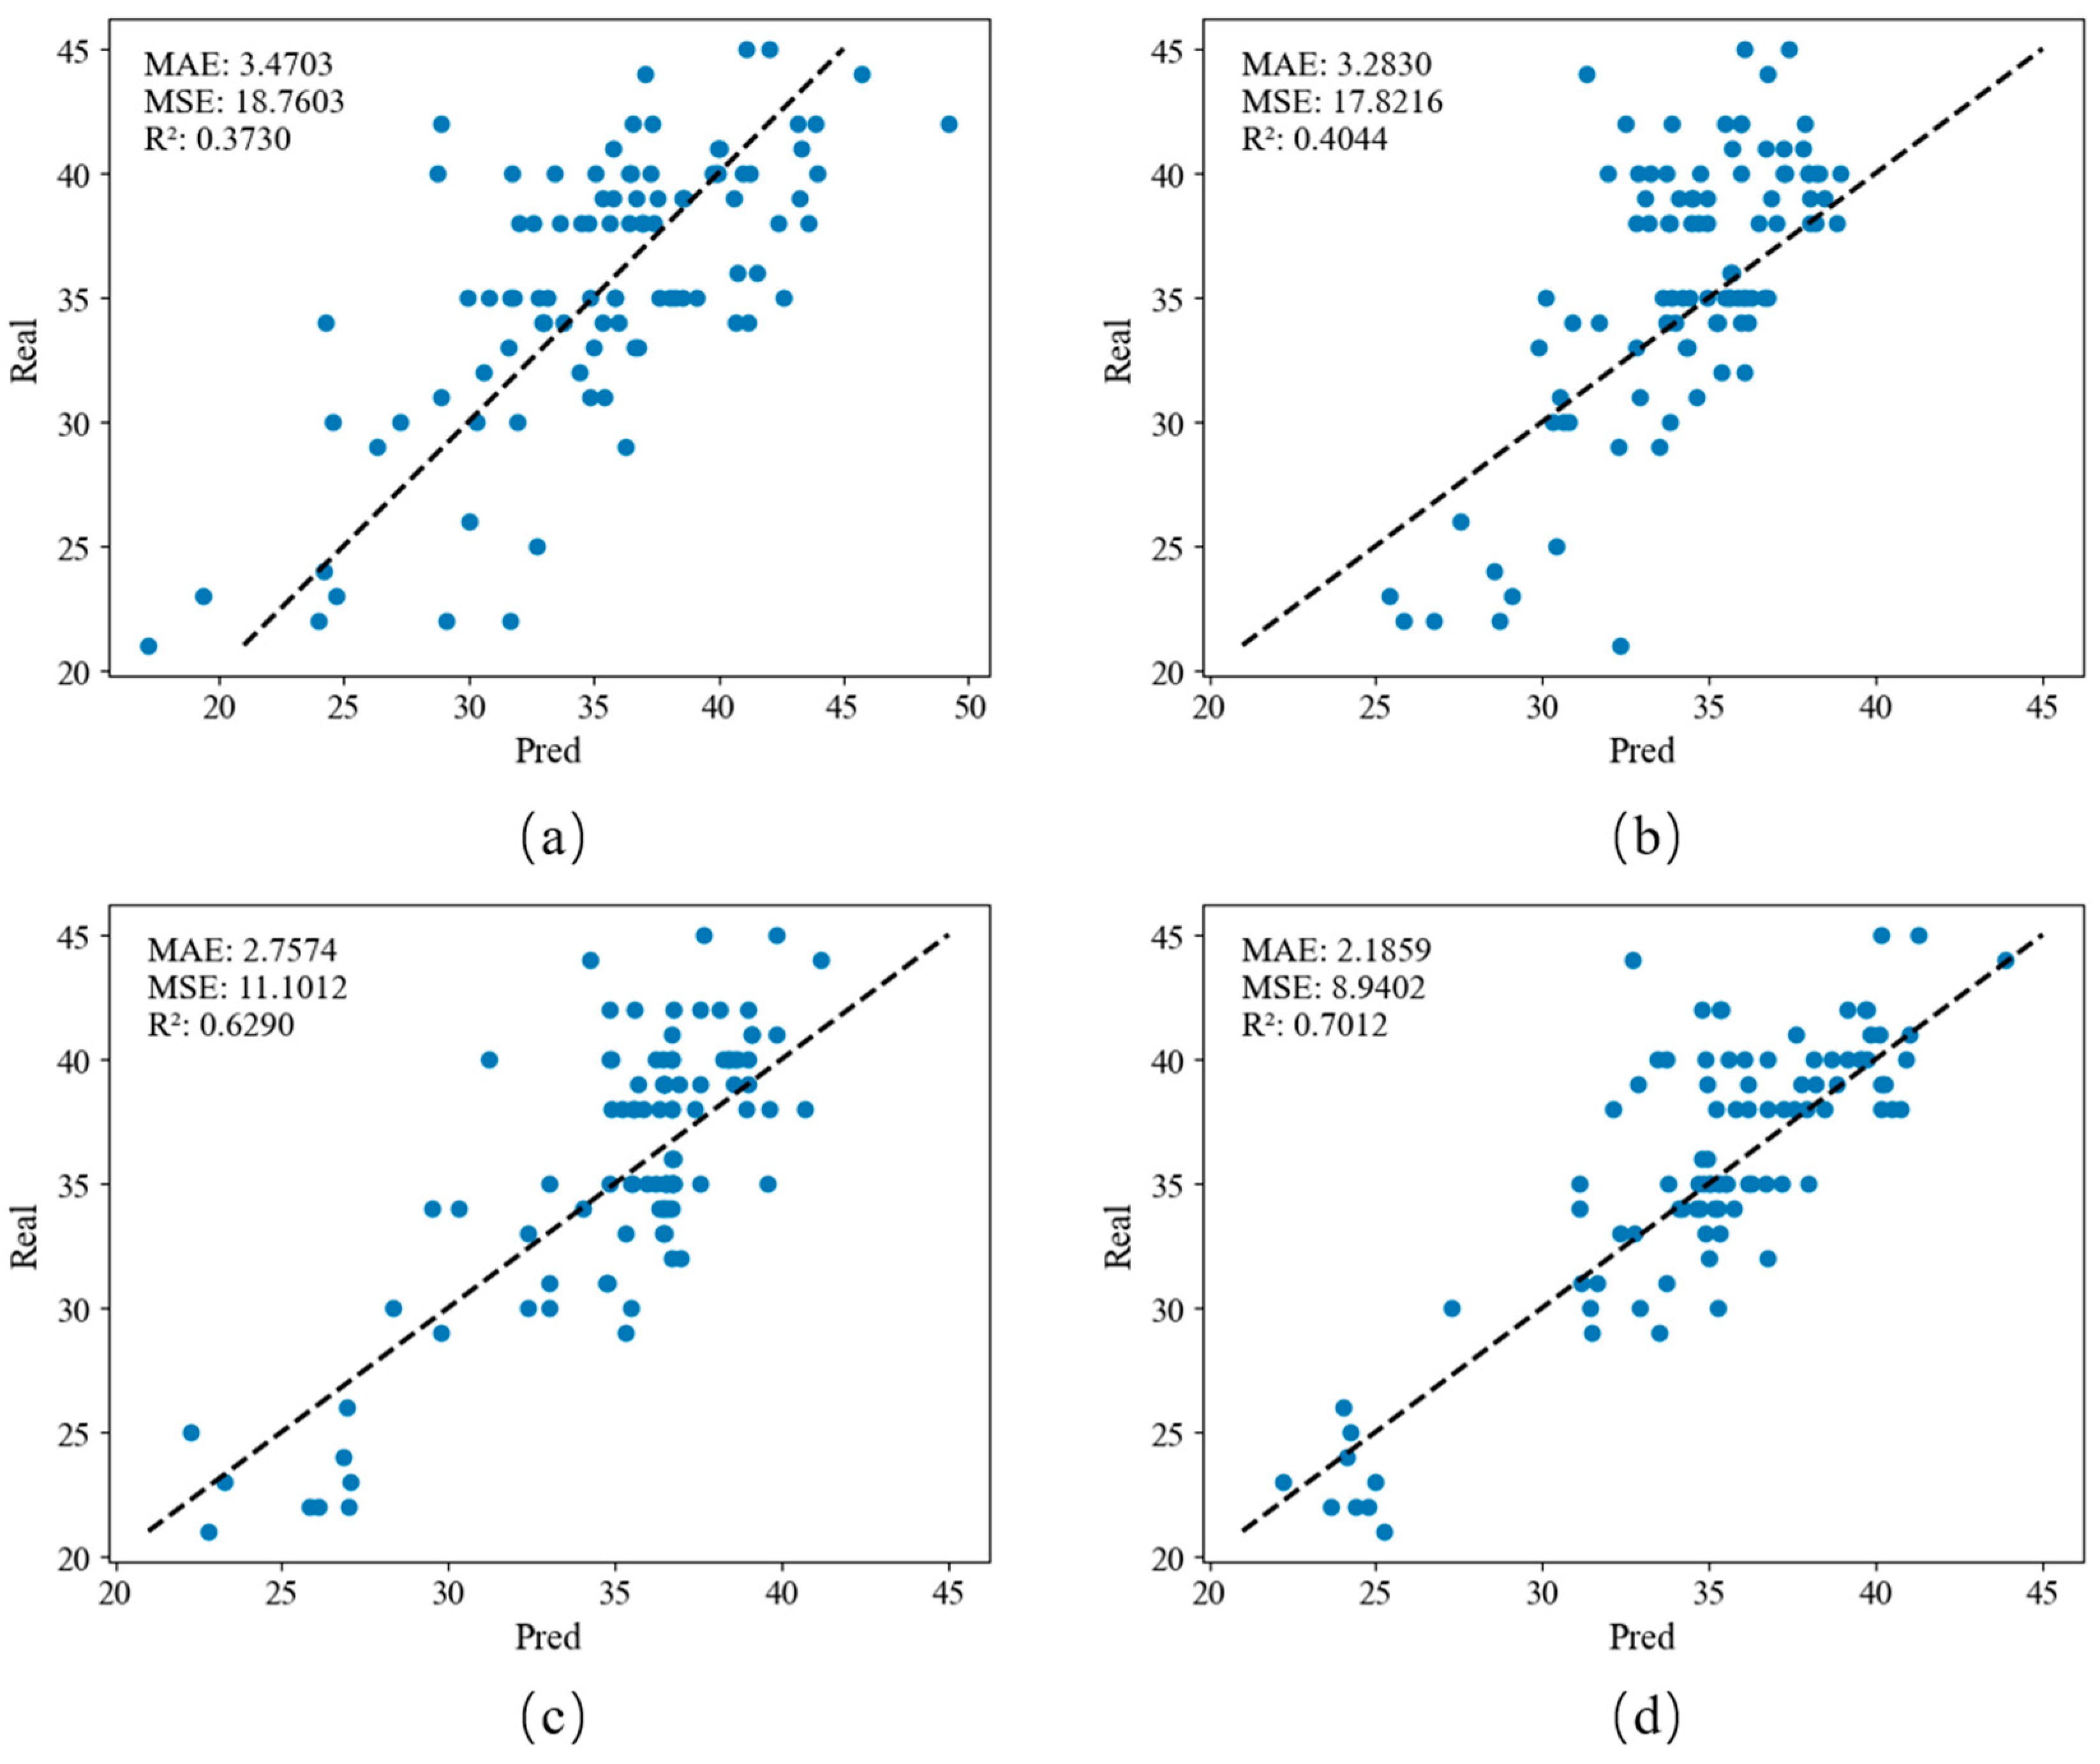
A linear regression model, support vector machine regression model, AdaBoost regression model, and random forest regression model were used to establish a model between lettuce spectral reflectance and nitrogen concentration and test it, as observed in
Figure 3. The four models show the same comparative effect on the MSE, MAE, and R
2 evaluation indicators. Among them, the R regression model evaluation indicators on the test set are 0.7012, the MSE is 8.9402, and the MAE is 2.11859. The value of R
2 is closest to 1, indicating that the model can better explain the variance in the target variable, while lower MSE and MAE indicate that the model’s prediction error is smaller and is close to the actual observed value. Overall, this shows that random forest performs well in model performance and has the highest accuracy for the estimating lettuce nitrogen concentration. This result was significantly lower than the result previously reported using multispectral and hyperspectral cameras to analyze vegetation [
34,
35]. The variations in nitrogen concentration-induced modifications to the biochemical components of leaves cannot be detected by the reflectance of visible light [
36,
37]. There are numerous red-edge, near-infrared, and infrared wavebands in multispectral and hyperspectral cameras that are sensitive to leaf pigments, leaf structure, and canopy characteristics. This could explain why, compared to RGB cameras, the VIs computed from multispectral and hyperspectral cameras have higher estimation accuracy [
38].
The R2 of the linear regression algorithm on the test set is as low as 0.3730, which means that the model cannot explain the variance in the target variable well. The MSE and MAE are 18.7603 and 3.4703, respectively, indicating that the model-predicted value deviates from the measured value. At larger values, it is generally difficult to use a linear function to reflect the relationship between canopy reflectance and nitrogen content of lettuce in various bands.
The limitation of traditional machine learning methods lies in the insufficient utilization of raw data. In this experiment, the input values of the machine learning model are the average reflectance. However, both the RGB image-based model and the hybrid model retain as much multidimensional data as possible for each pixel and input them into the neural network for training and inference. Considering that machine learning algorithms, including random forest, are suitable for the training and inference of numerical data, attempts to input data by zones or input more types of statistical data might improve the accuracy.
This is an empirical modelling method for predicting crop NNI and yield and making N recommendations [
39].
3.2. Nitrogen Diagnosis of Lettuce Based on Transfer Learning and RGB Images
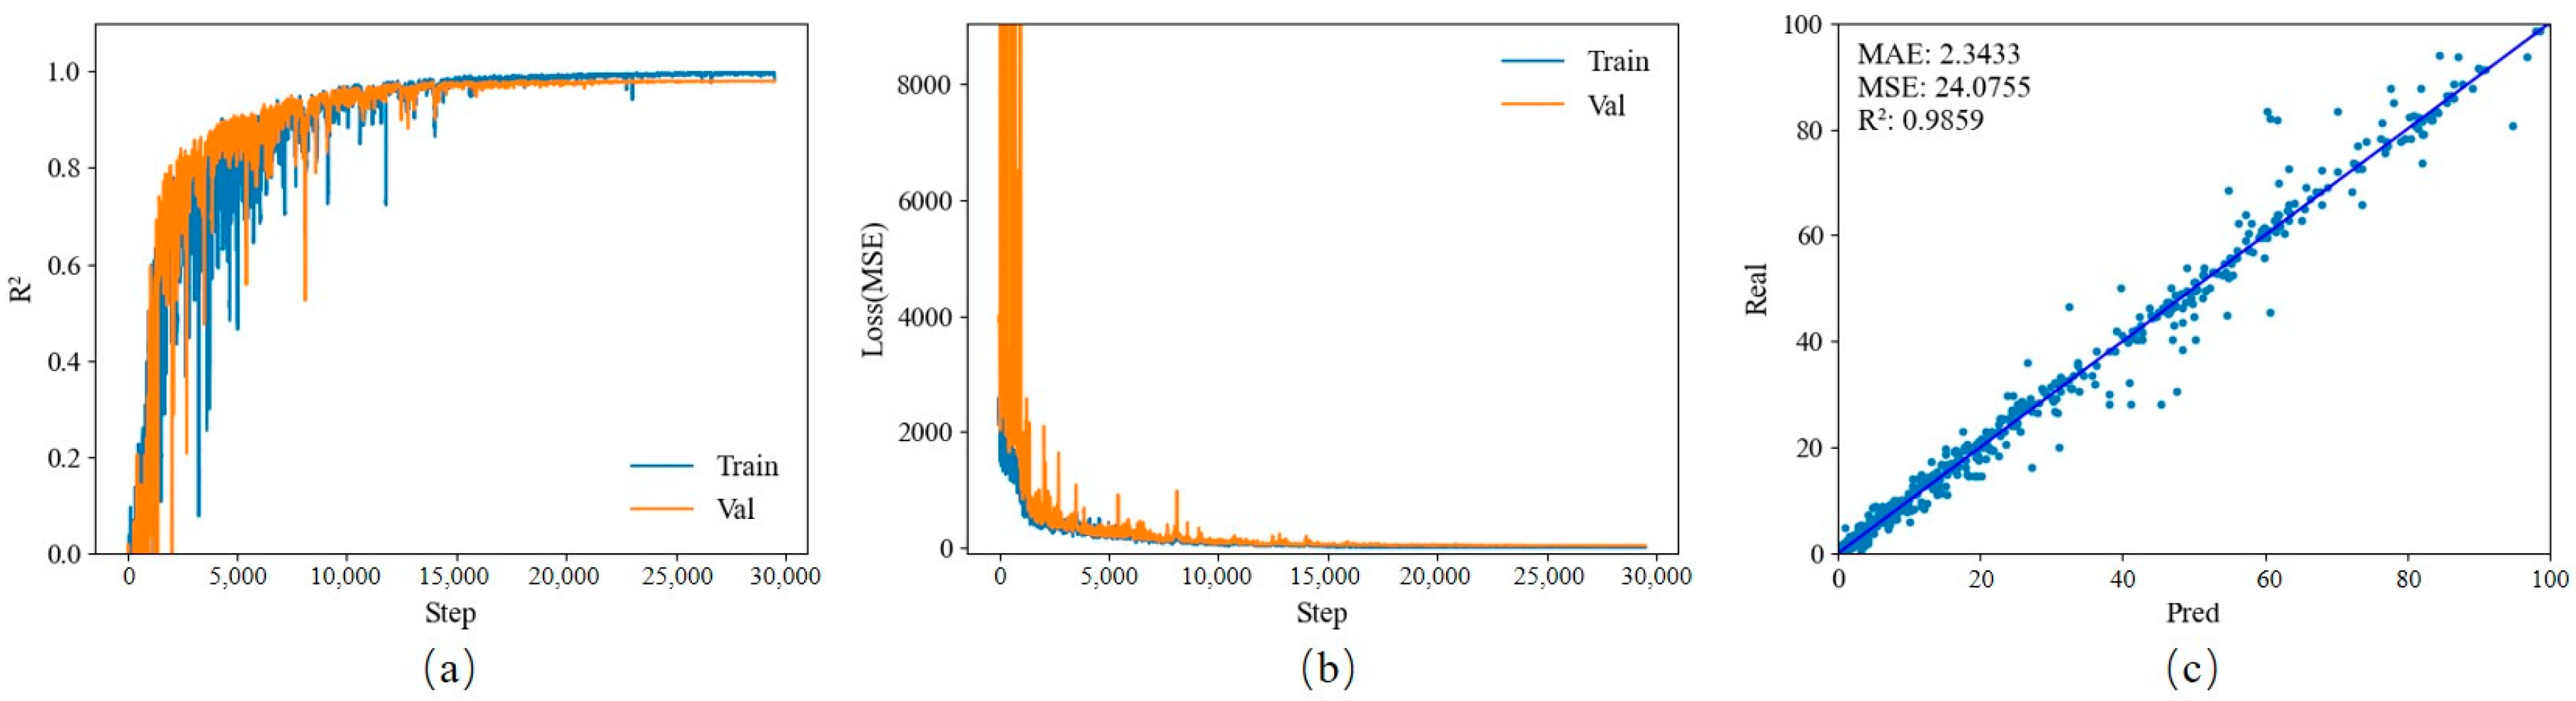
Each model is trained based on the official pre-training model for transfer learning. The data set contains a total of 4620 RGB images. After random shuffling, data are randomly divided into a training set, a verification set, and a test set in a ratio of 7:1:2. EfficientNet-v2-s model: The training set and validation set R
2 have a certain degree of co-frequency fluctuation in the early stage of training, which shows that the model performs poorly when the number of training rounds is small. But starting from the mid-term, the model gradually stabilizes. Eleven model files are used for testing in the test set. When epoch = 100, R
2 reaches the highest value of 0.9859; MSE and MAE are 24.0755 and 2.3433, respectively. All the obtained results can be found in
Figure 4.
EfficientNet-v2-s is a lightweight model that can operate in an environment with limited computing power, which facilitates its wide application in actual production. It performs outstandingly in visual tasks and is easy to fine-tune to adapt to different tasks. Although it is the largest among the six lightweight models selected in this experiment (model size = 77.80 MB), the computing resources it consumes are far from being unacceptable (training time = 468 min), and when the data set is large enough, its accuracy is also the highest (R2 = 0.9859).
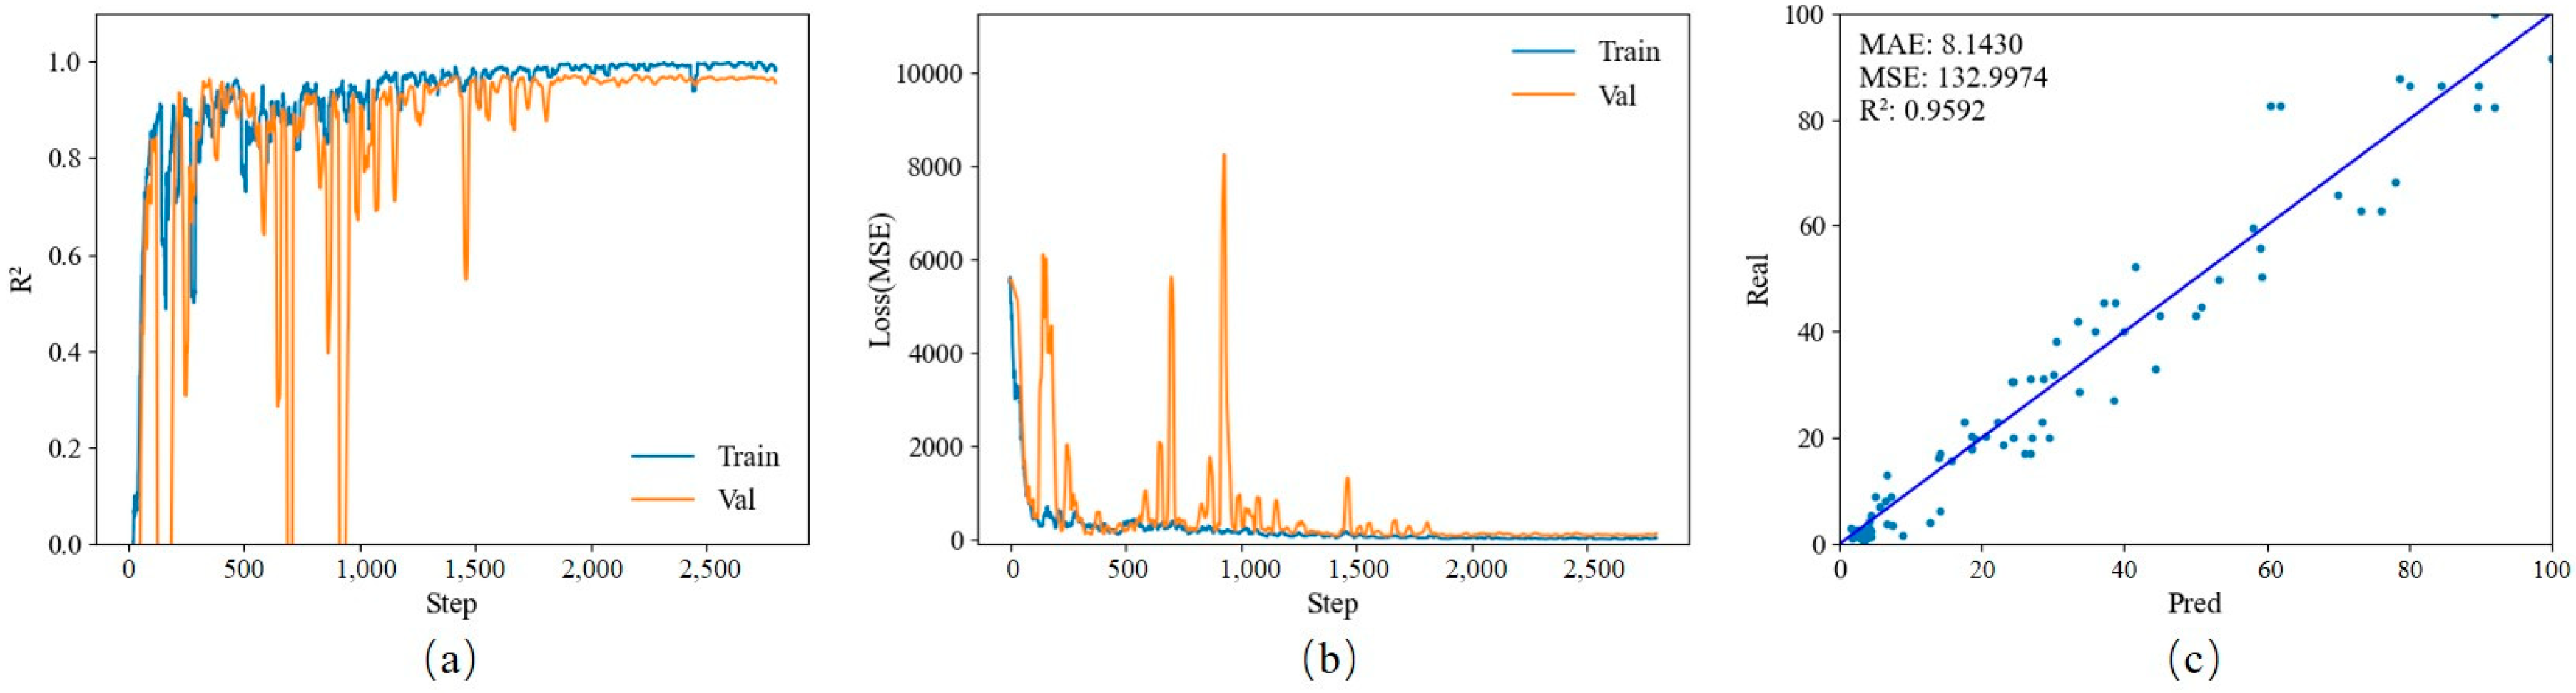
3.3. Nitrogen Diagnosis of Lettuce Based on Transfer Learning and Hyperspectral Images
Each model was trained based on the official pre-training model for transfer learning. After training, 11 model files were used to test the test set. A 1:1 scatter plot of predicted values versus actual values was drawn. The data set contained a total of 480 hyperspectral images. After random shuffling, data were randomly divided into a training set, a verification set, and a test set in a ratio of 7:1:2.
The ShuffleNet-v2-1.0 model obtained an R
2 value of 0.9592, and the MSE and MAE were 132.9974 and 8.1430, respectively. The results are displayed in
Figure 5.
3.4. Nitrogen Diagnosis of Lettuce Based on Transfer Learning and Fusion Data
Each model was trained based on the official pre-training model for transfer learning. The hyperparameter settings were as follows: initial learning rate 0.001; training set batch_size = 16, that is, 16 RGB images are input at a time during training; validation set batch size = 8, that is, after every training cycle, the verification set is used for cross-validation and adjusting the learning rate. The verification set inputs eight RGB images each time; epochs = 100, that is, a total of 100 rounds of training, and the changes are recorded in R2 and loss function MSE during the training process. The result model is saved every 10 rounds of training, and the SOTA model in 100 rounds is additionally saved. A total of 11 local model files are saved. After training, 11 model files are used to test the test set. A 1:1 scatter plot of predicted values versus actual values is drawn. The data set contains a total of 480 hyperspectral images. After random shuffling, data are randomly divided into a training set, a verification set, and a test set in a ratio of 7:1:2.
3.5. Effects and Application Options of Nitrogen Diagnostic Model
N fertilization, which is directly related to productivity, is crucial in modern agriculture to achieve stable food production. However, improving the efficiency of N nutrition is necessary for both agricultural management and global environmental conservation. In lettuce cultivation, these environmental impacts in agricultural N management have been notably problematic. Therefore, the impact of N management can be maximized in lettuce cultivation. Nondestructive estimation techniques, such as hyperspectral reflectance, are effective tools for tracking crop status. This study assessed variety of machine learning and deep learning solutions to diagnose lettuce nitrogen. Among them, the lettuce nitrogen solution based on machine learning and spectral reflectance had the worst effect. The optimal model, random forest, had an R
2 = 0.7012; therefore, the practical application value is low. It can learn nonlinear relationships, robust to outliers, and corrects over fitting observed with decision trees [
40]. The effect of the lettuce nitrogen diagnosis model based on transfer learning is shown in
Table 2.
In the RGB image scheme, there are a total of 4620 images in the data set. Except for the SqueezeNet-1.1 model, the other models all have good results, and R2 is greater than 0.96. The EfficientNet-v2-s model has the best diagnostic effect, but the price is that it requires longer training time (GPU: RTX 4090) and also retains more parameters, which can be seen from the size of the model file RegNet-y-800mf. The effect of the model is slightly inferior to EfficientNet-v2-s, but the training time is significantly shortened, the model file size is also significantly reduced, and the corresponding inference time is also shortened. In practical applications, RegNet-y-800mf is obviously a more cost-effective choice, reducing hardware equipment requirements while ensuring sufficient diagnostic accuracy.
In the hyperspectral image and multi-source information fusion data scheme, the limited hyperspectral source data and the inability to perform various data enhancement processing tasks, for example, on RGB images, are the fundamental reasons why the data set size is only 480, which is about 10% of the RGB image data set, one-tenth, so the training time is greatly shortened compared to RGB images. When the data set is quite limited, the R2 of the pure hyperspectral scheme can reach the level of 0.91 to 0.95. ShuffleNet-v2-1.0 is the best with R2 = 0.9592, and the model file is only 4.97 MB, indicating that hyperspectral solutions have great research and application potential. The R2 of the multi- source information fusion scheme is between 0.93 and 0.98, which is generally better than the pure hyperspectral scheme. The R2 of the best model RegNet-y-800mf = 0.9779, which is very close to the best of the RGB image scheme. If, in subsequent research, effective data can be continuously collected and the model can be further trained, better results can be achieved, and the application value will be further improved. However, in research and application, the resolution and phase consistency issues of RGB images and hyperspectral images need to be solved, that is, the value of each pixel on the three channels needs to correspond to the same point on the plant. Only in this way is “Fusion” the most effective.
Nitrogen, a crucial nutrient for lettuce growth, is involved in numerous biochemical processes within lettuce, such as the synthesis of chlorophyll and proteins. This directly affects the efficiency of light energy absorption and utilization by leaves. Therefore, an appropriate supply of nitrogen is beneficial not only for the growth of lettuce but also for enhancing its nutritional value.
Precise nitrogen diagnosis holds significant environmental implications for sustainable horticultural production. By accurately monitoring the nitrogen status of lettuce and implementing precise fertilization, the nitrogen use efficiency can be effectively improved. This, in turn, helps to avoid nitrogen losses caused by excessive fertilization and reduces pollution to soil, water bodies, and the atmosphere. From the perspective of practical applications, the nitrogen diagnosis models developed in this study possess certain feasibility and cost-effectiveness advantages [
41]. Take the model based on RGB images as an example. Its data collection is relatively simple, and image data can be obtained using common mobile phones or network cameras. Additionally, developing corresponding collection devices for one or several specific effective bands can greatly reduce the costs of hyperspectral data collection and application. Moreover, for the agricultural field with limited computing power and small- to medium-sized farms, the lightweight deep learning models adopted in this paper can be easily deployed and applied.
3.6. Modal Performance Comparison with Previous Studies
In this work, hyperspectral imaging is used to quantify the nitrogen content in lettuce crop leaves with high accuracy using the optimal model, random forest. RF produced high accuracy results for nitrogen content in leaf-scale traits (R
2 = 0.701). By using canopy hyperspectral data transfer learning and RGB images, the EfficientNet-v2-s model had an R
2 = 0.9859 with higher accuracy [
41,
42,
43], in contrast to research on predicting in nitrogen diagnosis based on transfer learning and multi-source information fusion, RegNet-y-800mf model.
This study quantified canopy-scale traits, such as nitrogen R
2 = 0.9779, in contrast to research on nitrogen and chlorophyll predictions at the crop canopy scale [
41,
44,
45].
Deep learning is essentially a black box, and there is currently no complete theoretical framework for interpretability analysis. However, through the image preprocessing described in
Section 2.3.1, certain speculations can be made regarding what the deep learning model in this study learned. Through preprocessing, the backgrounds of RGB and hyperspectral images were removed, leaving only the target subjects. Moreover, the images were resized to a unified size of 336 × 336. As a result, the retained information includes the following: the original RGB or reflectance values, the mean of the original values, variance, entropy, contrast, homogeneity, dissimilarity, angular second–moment and correlation, edge information of the lettuce leaf, degree of leaf wrinkling, etc. If these data are calculated separately and then used to train a machine learning model, it may lead to data distortion. In contrast, feeding the original data with a resolution of 336 × 336 into the deep learning model can maximize the utilization of effective information.
As can be seen from the previous content, compared with the hyperspectral-only scheme, the multi-source information fusion scheme effectively improved the accuracy of nitrogen diagnosis. This indicates that the contribution of hyperspectral reflectance to nitrogen diagnosis is greater than that of the R channel, which is attributed to the contribution of characteristic bands (690.64 nm, 693.62 nm, and 631.15 nm). The wavelength range of 650 nm–700 nm corresponds to the main absorption band of chlorophyll b, suggesting that nitrogen supply may have an impact on the synthesis of chlorophyll, ultimately manifested in the hyperspectral reflectance of specific bands. Moreover, in subsequent research, it is necessary to continue to explore other fusion combinations of characteristic bands with the R, G, and B channels. Additionally, the dimension of the fused data could be altered by incorporating more characteristic band reflectances to improve accuracy.
The development of high-performance nitrogen diagnosis models with low computational power requirements, as demonstrated in this study, holds significant economic, environmental, and social implications. These models enable more accurate monitoring of lettuce growth, which serves as a solid foundation for fertilization decision-making models. This is especially beneficial for agricultural industries with limited computational resources. By precisely guiding fertilization, it not only reduces unnecessary fertilizer input costs but also mitigates potential environmental pollution caused by overfertilization, contributing to both economic savings and environmental sustainability.
Nonetheless, this work could be more robust and transferable in various conditions than traditional vegetation index approaches because it makes use of the full range of hyperspectral data by combining data-driven hyperspectral reflectance, random forest, RGB, and spectral reference approaches. The findings of this study suggest that hyperspectral reflectance data and machine learning techniques show good potential for estimating N in lettuce plants. Remote sensing techniques using unmanned aerial vehicles will also enable the high-throughput estimation of N and Chl statuses in lettuce at canopy scale. These findings will contribute advanced indices for the nondestructive tracking of crop N status. In the future, these techniques could be applied to improve irregularities in fertilizer and the real-time diagnostics of physiological status changes in large farms.
4. Conclusions
This study was based on various types of data and used different machine learning models and deep learning models using transfer learning methods to train a nitrogen regression diagnosis model for lettuce. In nitrogen diagnosis based on machine learning and spectral reflectance, the optimal model random forest achieved R2 = 0.7012, MSE = 8.9402, and MAE = 2.11859; in nitrogen diagnosis based on transfer learning and RGB images, the EfficientNet-v2-s model achieved R2 = 0.9859, MSE = 24.0755, and MAE = 2.3433; in nitrogen diagnosis based on transfer learning and hyperspectral images, the ShuffleNet-v2-1.0 model achieved R2 = 0.9592, MSE = 132.9974, and MAE = 8.1430; in nitrogen diagnosis based on transfer learning and multi-source information fusion, the RegNet-y-800mf model achieved R2 = 0.9779, MSE = 71.9990, and MAE = 5.5589. The diagnostic effect of deep learning was significantly better than that of machine learning. With a large enough RGB image data set, each model had good diagnostic results, and they have a low application threshold and high versatility in actual application scenarios. Under the condition that the hyperspectral data set was very limited, the nitrogen diagnosis effect using data fused with RGB and hyperspectral images was better than using a single hyperspectral image and was even close to the effect obtained by using RGB images with 10 times the quantity of data. The nitrogen diagnostic model of lettuce obtained in this study provides support for the subsequent fertilization decision-making model, and at the same time provides a new and potential method of data fusion and utilization.


 ,
, 
