Article

Variations in the Mineral Composition of Houpoea Officinalis Flowers at Different Stages of Development

1
Department of Forestry, Faculty of Forestry, Sichuan Agricultural University, Chengdu 611130, China
2
School of Life Science and Engineering, Southwest Jiaotong University, Chengdu 611756, China
3
Sichuan Academy of Forestry, Chengdu 610081, China
4
National Forestry and Grassland Administration Key Laboratory of Forest Resources Conservation and Ecological Safety on the Upper Reaches of the Yangtze River, Chengdu 611130, China
*
Authors to whom correspondence should be addressed.
Horticulturae 2025, 11(4), 387; https://doi.org/10.3390/horticulturae11040387
Submission received: 20 February 2025 / Revised: 3 April 2025 / Accepted: 4 April 2025 / Published: 5 April 2025
(This article belongs to the Special Issue Breeding, Cultivation, and Metabolic Regulation of Medicinal Plants)

Abstract

:
Houpoea officinalis (H. officinalis) flowers are rich in a spectrum of bioactive compounds and mineral nutrients. The availability and balance of mineral elements directly impact the morphogenesis of flower organs, which play pivotal roles in various physiological and biochemical processes that drive flower development. However, relatively little is known about the changes in mineral elements composition that occur during flower development in H. officinalis. The objective of this study is to analyze the variations of 22 mineral elements contents in pistil, stamens, and petals of H. officinalis flower at four development stages. The amount of mineral elements (Na, Mg, K, Ca, V, Cr, Mn, Fe, Co, Ni, Cu, Zn, Sr, Sn, Al, Ti, Ga, Cd, Ba, Tl, Pb, and Bi) in these samples was determined using atomic absorption spectroscopy and inductively coupled plasma mass spectrometry. Results showed that H. officinalis flowers are rich in macroelements such as potassium (K, 25.80–48.06 mg/g) and calcium (Ca, 17.27–31.00 mg/g), as well as microelements like zinc (Zn, 445.17–1553.16 μg/g) and iron (Fe, 324.27–622.31 μg/g). Notably, the pistil part is found to harbor a more significant concentration of mineral elements during the early developmental stages of flowers. Correlation analysis and PCA have effectively exposed a pronounced association between the accumulation patterns of mineral elements in H. officinalis flowers and their corresponding developmental stages and organs. These findings will provide more detailed information about the accumulation and distribution of mineral elements in H. officinalis flowers at different development stages and organs, which help to encourage researchers to enhance the flower quality for human consumption.

1. Introduction

Flowers, as critical reproductive and ephemeral organs in plants, hold significant aesthetic and commercial value, while also being rich in bioactive compounds like phenolic acids, flavonoids, carotenoids, and terpenes, which exhibit antioxidant, anti-inflammatory, anti-diabetic, and hepatoprotective properties [1]. Flower development is a complex and dynamic process involving stages such as bud initiation, floral bud development, anthesis, and senescence, with physiological and biochemical changes occurring throughout. These changes support cell division, enhance visual attraction, indicate nutritional status, and signal senescence [2]. The process is highly regulated and influenced by both intrinsic factors (minerals, endogenous hormones, carbohydrates, transcription factors) and extrinsic factors (temperature, photoperiod, water availability, light exposure), as well as genetic and hormonal signals [3]. Moreover, the variations of morphological features, C:N:P stoichiometry, non-structural carbohydrate (NSC), and hormones in Cercis chinensis and Michelia maudiae ‘rubicunda’ flower at different development stages have been reported [4,5]. Understanding the process of flower development is crucial for optimizing production practices, enhancing orchard management, improving flower quality, extending vase-life, and increasing commercial value. It also aids in deciphering the nutritional demands and metabolic intricacies underlying floral growth and differentiation, which are essential for future plant breeding and ensuring the reproductive success of plants.
Macro- (K, Ca, Na, and Mg) and microelements (Fe, Mn, Zn, Cu, B, and Mo) are vital for plant physiology, driving photosynthesis, enzyme function, stress response, and floral development [6]. During flower development, the contents of these elements undergo dynamic changes. For example, the mineral composition in Rosa damascena Mill. petals varies significantly at different developmental stages [7]. Earlier studies indicated that key macronutrients (K, Ca, and Mg) peak at the bud stage and decline as flowers open [8,9]. These macroelements are vital for petal development and expansion processes due to their effect on cell division, cell wall formation, and signal transduction. Meanwhile, micronutrients (Fe, Mn, Zn, Cu, and Mo) play specialized roles in flower development [6,10]. Specifically, Fe enables chlorophyll synthesis for floral photosynthesis during development, while Zn promotes both seed formation and growth hormone production in flower development [11,12]. In summary, micronutrients and macronutrients play complex, multifaceted roles in flower development and may influence diverse processes ranging from cellular metabolism to morphological differentiation [6,7,8,9,10,11,12]. Given that nutrients and secondary metabolites are ultimately derived from mineral elements absorbed by plants from their environment, investigating the temporal and spatial variations of mineral elements during flower development emerges as a critical step towards deciphering the nutritional demands and metabolic intricacies underpinning floral growth and differentiation.
Determining the appropriate harvest time and/or development stage for medicinal plants is of paramount importance due to its multifaceted implications on the quality, efficacy, and sustainability of plant-derived medicinal products. The accumulation of secondary metabolites, such as fatty acids, organic acids, and phenolic compounds, is highly dynamic and influenced by harvest time and/or development stage [1,4,7]. Moreover, previous studies have established the importance of harvesting different plant organs at different growth stages. The optimal harvest time for maximizing the yield and concentration of bioactive compounds varies with developmental stage and/or harvest stage [5,8,12]. For example, the dynamic changes in essential oil components, fatty acids, organic acids, and phenolic compounds across five developmental stages of oil-bearing rose were reported, revealing the developmental stage-dependent quality of rose-derived products [1]. Moreover, the dynamic differences in 11 mineral elements and 122 metabolites in tea leaves and flowers during flowering were demonstrated, revealing significant shifts in P, S, Cu, and metabolites such as sugars, organic acids, and flavonoids [8]. These findings showed that the contents of secondary metabolites in medicinal plant extracts are significantly related to developmental stages and different plant organs. By aligning harvesting times with metabolic, developmental, and environmental rhythms, it is possible to optimize the therapeutic value of medicinal plants while promoting sustainable resource management.
Houpoea officinalis (H. officinalis), known as “houpo” in China, is a highly esteemed traditional medicinal and ornamental plant with a history of approximately 2000 years in Asia, particularly in China, Japan, and South Korea. Its stem bark, root bark, and flower are prized for their significant medicinal values due to their rich content of magnolol and honokiol [13]. H. officinalis is renowned for its efficacy in treating dampness-induced spleen and stomach disorders, abdominal distension, diarrhea, dyspepsia, constipation, phlegm and fluid retention, asthma, and stagnation syndromes [14]. Modern pharmacological research has identified the presence of magnolol, honokiol, alkaloids, and other bioactive components in the cortex of H. officinalis, endowing it with therapeutic potential against a wide range of diseases, including cancer, inflammation, bacterial infections, anxiety, depression, diabetes, asthma, gastrointestinal disorders, neurological conditions, and cardiovascular diseases [15]. H. officinalis flowers, containing sugars and magnolol, also offer high nutritional and health benefits. The flowers of H. officinalis contain lower concentrations of magnolol and honokiol, which have similar but milder therapeutic effects like bark [13]. The transformation from flower buds to flowers is a critical phase in the plant’s life cycle, marked by significant physiological and biochemical changes. During this transition, the plant reallocates its resources, including mineral elements, NSC and other compounds, to support the development and maturation of floral structures [7,9]. Our previous study revealed that the C, N, and P contents and their ratios in H. officinalis flowers vary significantly at different development stages and are closely linked to the levels of NSC content [16]. Although the accumulation and proportional distribution patterns of C, N, P and NSC in response to developmental stages in some plant species have been established [7,8], the intricate complex changes from flower buds to flowering remain to be further explored. A deeper understanding of these changes could provide valuable insights into optimizing floral development, with potential applications in horticulture.
To date, information regarding the mineral elements content, and their dynamic changes in H. officinalis flowers remains limited. In this investigation, variations in macronutrients and trace elements across the three organs of H. officinalis flowers at four distinct developmental stages were comparatively analyzed. This study aimed to elucidate the dynamic patterns of elemental composition in H. officinalis flowers across developmental stages and organ types, and to inform optimal harvest timing decisions by providing a reference for maximizing elemental quality.

2. Materials and Methods

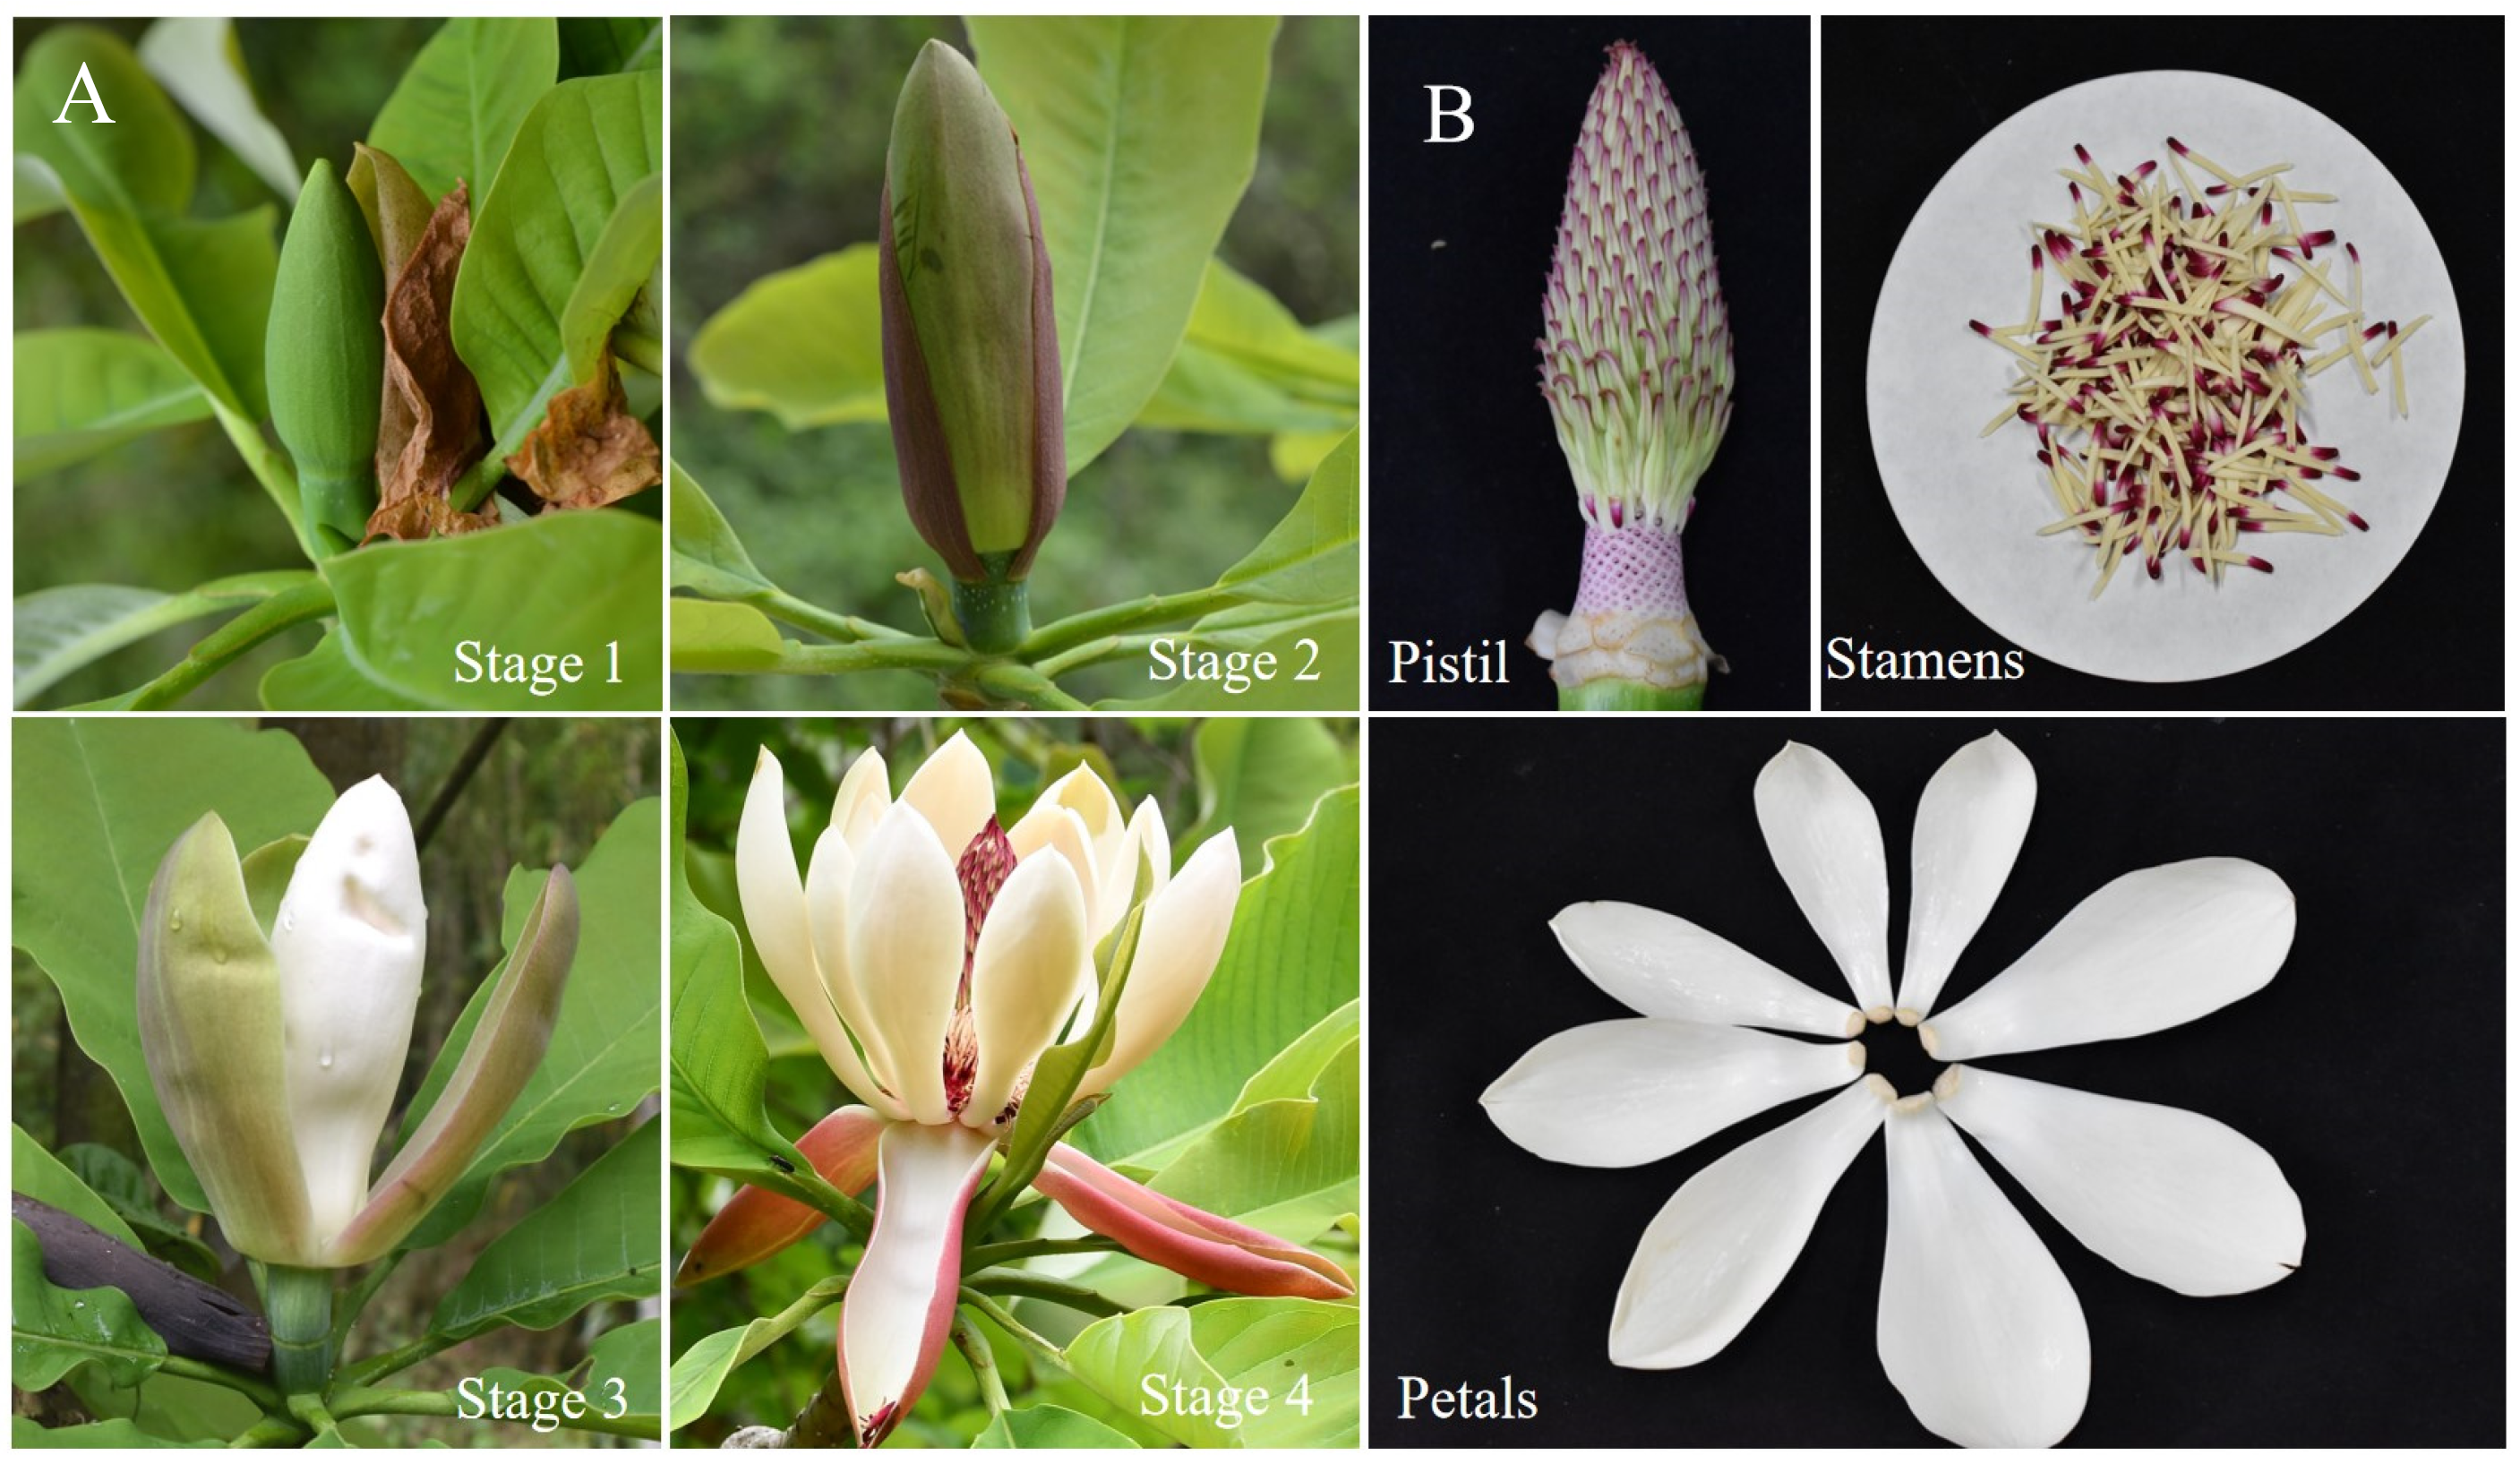
2.1. Sample Collection and Preparation

The study site is located in Longchi Township, Dujiangyan City, Chengdu, Sichuan Province, China (coordinates 103°38′ E, 31°6′ N). Ten randomly selected trees (10 years old) with similar growth conditions were selected as the sampling objects from an artificially cultivated H. officinalis forest planted in 2013. On 20 March, 5 April, 20 April, and 5 May 2023, 5 flowers from each tree were collected as samples. These flowers were categorized according to four developmental stages: the young flower bud stage (stage 1, S1), the flower bud expansion stage (stage 2, S2), the initial bloom stage (stage 3, S3), and the full bloom stage (stage 4, S4, Figure 1). The flower samples underwent rinsing with deionized water to remove particulate matter, and were subsequently segmented into three parts: pistil, stamens, and petals. These parts were then subjected to drying in a controlled-temperature oven set at 65 °C for a duration of 72 h to attain a consistent dry weight. The dried samples were subsequently pulverized using a multifunctional grinder and sieved through an 80-mesh sieve to facilitate the quantification of the mineral element content.

2.2. Chemicals

This experiment required concentrated sulfuric acid and perchloric acid for sample digestion. Standard samples of 22 mineral elements also needed to be tested for the production of standard curves. The reagents employed in this study were of analytical grade (AR). Deionized water was utilized for the preparation of standard solutions and for diluting the samples. All glassware utilized in the experimental procedures was immersed in a 10% (v/v) sulfuric acid solution overnight to minimize the risk of contamination.

2.3. Sample Digestion and Mineral Analysis

Sample digestion was performed employing the wet digestion technique [11]. Specifically, a 0.5 g sample was measured and subjected to digestion in a 10 mL mixture of sulfuric acid and perchloric acid in a ratio of 10:1, following the diacid digestion protocol. The digestion procedure commenced with heating the sample to 280 °C for a duration of 15 min, followed by a temperature increment to 350 °C for an additional 15 min, and ultimately elevating the temperature to 450 °C to achieve a colorless and transparent digestate. Once the digest was cooled to room temperature, it was diluted with deionized water and then passed through a 0.22-micron filter membrane to clarify the solution, preparing it for further analysis. The measured parameters comprised the contents of 22 mineral elements (abbreviated as shown in Table 1).
The concentrations of K, Ca, Mg, and Na were quantified using an atomic absorption spectrometer (AAS, model AA-6880 series), with the specific instrumental parameters outlined in Table 2. For the determination of the remaining 18 elements, an inductively coupled plasma mass spectrometer (ICP-MS, NexION 2000) was employed. The ICP-MS operational parameters were configured as follows: 1350 W of ICP power, a plasma gas flow rate of 16 L/min, an auxiliary gas flow rate of 1.2 L/min, a nebulizer gas flow rate of 0.85 L/min, a nebulizer pump speed of 50.00 rpm, with 20 sweeps and 3 replicates per analysis. The linear regression equations and associated parameters for each element are presented in Table 3 and Table 4. To prevent instrument damage, it is imperative to dilute the sample solutions appropriately to ensure they are within the operational measuring range of the instrumentation.

2.4. Statistical Analysis

Mineral analysis for each sample was conducted in triplicate. Data underwent preliminary processing with Excel, and the results of all measurements were expressed as the mean ± standard error (S.E.). To assess significant differences among various groups, Duncan’s multiple range test, along with regression and correlation analyses, was performed at a significance level of p ≤ 0.05 using SPSS 25.0 software (SPSS Inc., Chicago, IL, USA). Furthermore, Origin 2021 (OriginLab Corporation, Northampton, MA, USA) was utilized for graph plotting, including radar charts and principal component analysis (PCA), while the heat map was generated with TB tools-II software.

3. Results and Discussion

3.1. Contents of Elements

To assess the mineral elemental composition within H. officinalis flowers, the concentrations of 22 elements—comprising macronutrients, micronutrients, and potentially toxic trace elements—were quantified among pistils, stamens, and petals at four developmental stages (Table 5). The variations in elemental content were categorized into four distinct clusters based on differences among flower parts and developmental stages (Figure 2). Cluster one comprised pistils from stages 1 and 2, cluster two included stamens from stages 1 and 2, as well as pistils from stages 3 and 4, cluster three encompassed stamens from stage 3, along with petals from the first three stages, and cluster four comprised petals and stamens from stage 4. Generally, the majority of elements examined in this study peaked in the pistils, with Sn, Bi, Cu, Co, Ga, V, and Tl reaching maximum concentrations in stage 1; Zn, Na, Sr, Mg, Cd, Mn, Ni, and Pb in stage 2; Ba in stage 3; and Ca in stage 4. Additionally, four elements (Ti, Al, Fe, and Cr) exhibited maximum concentrations in the stamens at stage 4, while K alone reached its peak in the petals at stage 2. Consequently, it can be inferred that the pistil contains higher concentrations of bioactive compounds, as plant elements contribute to the accumulation of principal active constituents [17]. This is analogous to the higher content of naringin and hesperidin in the pistils of Citrus maxima flowers [18] and the elevated antioxidant activity in the pistils of lotus flowers [19].

3.1.1. Assessment of Macroelements

Na, Mg, K, and Ca are prevalent macronutrients essential for the maintenance of various physiological functions in animals, plants and microorganisms [20]. Specifically, Na is recognized for its role in preventing heatstroke, enhancing cognitive function, alleviating muscle cramps, and delaying the effects of premature ageing [21]. Mg safeguards against disorders spanning metabolic, skeletal, respiratory, neurological, and cardiovascular systems [22], while K maintains fluid balance, neuromuscular function, and cardiovascular health [23]. Additionally, Ca strengthens bones and teeth, reduces arthritis, and alleviates sleep [21]. Therefore, as an initial phase in our investigation, the concentrations of Na, Mg, K, and Ca in the floral organs (pistils, stamens, and petals) of H. officinalis flowers were quantitatively analyzed across four developmental stages. The concentrations of these four macronutrients in the study surpassed 1 mg/g, with ranges from 1.45 to 3.08 mg/g for Na; 3.86 to 6.62 mg/g for Mg; 25.80 to 48.06 mg/g for K; and 17.27 to 31.00 mg/g for Ca (Table 5). K showed the highest content among all nutrients, matching the high K levels previously reported in Tweedia caerulea during floral development and blooming [24]. Adequate K helps lower stroke and heart disease risk, while also protecting against bone loss and kidney stones [25]. It is evident that the mineral element content in H. officinalis flowers follows the order K > Ca > Mg > Na. Similar patterns of K, Ca, Mg, and Na content were observed in Gentiana macrophylla and Celosia cristata flowers, yet with significant variations in their specific concentrations due to species differences [26,27]. Additionally, the maximum Mg content at all developmental stages was detected in the pistils, while the highest K content was identified in the petals. However, there is no distinct pattern in the variation of Na and Ca content in H. officinalis flowers among the four developmental stages and flower parts.

3.1.2. Assessment of Trace Elements

Edible flowers are rich in K, Ca, Mg, and Na, which are commonly assessed in floral mineral nutrition [26,27]. In contrast, studies on Zn, Fe, Mn, and Cu are relatively scarce, while other elements are involved in floral research [8,15,28,29]. Consequently, this investigation extended to measure 18 trace elements, including 10 beneficial and 8 toxic ones, during H. officinalis flowers developmental. The concentrations of 10 trace elements, including V, Cr, Mn, Fe, Co, Ni, Cu, Zn, Sr, and Sn, in H. officinalis flowers are detailed in Table 5. Although required in differing quantities for various physiological functions, these essential elements all contribute beneficially to humans, maintaining normal vital physiological activities when consumed within appropriate thresholds. Zn interacts with enzymes and proteins within the body, playing functional, regulatory, and structural roles, while iron is pivotal in oxygen transport, DNA synthesis, and electron transport [30,31]. Zn and Fe are the most abundant, with concentrations ranging from 445.17 to 1553.16 μg/g and 324.27 to 622.31 μg/g, respectively, and both exhibit significant fluctuations throughout floral development. Zn levels peak in the pistil, with a remarkable 3.49-fold variation, whereas Fe shows no clear pattern, reaching maximum concentrations in stamens and petals at stage 4 and in pistils at stage 2. These variations are attributed to differences in floral parts and developmental stages, akin to the uptake and translocation of elements from soil to floral organs of Cucurbita pepo, with accumulation varying by element type, concentration, and floral organ [32].
The trace elements Cr, Mn, Ni, Cu, Sr, and Sn exhibit intermediate concentrations (5–120 μg/g) with distinct biological functions and developmental patterns. Cr, involved in carbohydrate and lipid metabolism [33], shows stable early-stage levels but significant fluctuations in later development (peaking in stage 4 stamens). Mn, an essential cofactor in catalytic reactions and metabolic activities [34], shows marked declines during floral development, with decreases of 77.8% in pistils, 45.2% in stamens, and 70.1% in petals. Ni affects endocrine function [35], while Cu serves vital roles in mitochondrial respiration [36], and both demonstrate more stable concentration trends compared to Mn. Although Cu is an essential micronutrient, concentrations exceeding 20 μg/g in medicinal materials constitute excessive levels that may adversely affect human health. Both Sr and Sn reach their maximum concentrations in the pistil throughout all developmental stage, with Sn content decreasing as the flower develops. Sr is a bone-seeking element that promotes bone formation, reduces resorption, and treats bone-related diseases [37]. Sn (IV) compounds exhibit anticancer activity and potential for anticancer drug development [38]. V and Co are relatively low in content, ranging from 0.33 to 0.81 μg/g and 0.16 to 0.31 μg/g, respectively, with the highest content in the first-stage pistil. V exhibits diverse biological functions including antimicrobial, metabolic-regulatory, and organ-protective effects [39]. Co is a precursor for vitamin B12 synthesis, stimulating hematopoiesis and maintaining cardiovascular health [40].

3.1.3. Assessment of Toxic Trace Elements

The remaining eight toxic trace elements (Al, Ti, Ga, Cd, Ba, Tl, Pb, and Bi) showed significant content variations, spanning up to four orders of magnitude (Table 5). Based on maximum content thresholds (>100, >10, >1, and <1 μg/g), the toxic trace elements can be stratified into four tiers: Tier 1—Al (165.91–271.63 μg/g) and Ti (966.52–1189.03 μg/g); Tier 2—Ba (22.65–33.31 μg/g) and Bi (8.93–41.26 μg/g); Tier 3—Tl (0.04–2.36 μg/g) and Pb (0.86–3.75 μg/g); and Tier 4—Ga (0.37–0.94 μg/g) and Cd (0.10–0.5 μg/g). Although Al, Ti, and Ga hold potential applications in sectors like aerospace, healthcare, power electronics, and photovoltaics, they pose significant toxicological risks to human health [41,42,43]. The progressive accumulation of these toxic trace elements in human tissues can disrupt multiple physiological systems, potentially causing neurological dysfunction, metabolic imbalance, and even carcinogenesis [44].
Notably, Ti and Al are the most abundant, with the highest concentrations at stage 4 among the three flower parts, suggesting that these two heavy metals continue to accumulate in the flowers as flower development progresses. This aligns with the perspective that plant roots absorb heavy metal elements from the environment and translocate them to above-ground parts [45]. Tl and Bi levels decreased during flower development in all organs of H. officinalis flowers, similar to the reduction in toxic elements during brown rice germination. This pattern may reflect common plant detoxification mechanisms, such as enzyme induction, ion transport regulation, and small peptide production [46]. Alternatively, these toxic elements present in the flowers may be translocated to other organs, but further investigation is needed for verification. Moreover, Pb accumulation was consistently highest in pistils throughout the development, with Ba following a comparable pattern except at stage 1. Cd content in H. officinalis flowers did not exhibit a clear trend during the development, but peaked in the pistil at stage 2. Given the well-documented health risks associated with Pb and Cd exposure, the Chinese Pharmacopoeia has established strict maximum limits for these heavy metals in traditional Chinese medicines: 5 mg/kg for Pb and 1 mg/kg for Cd.

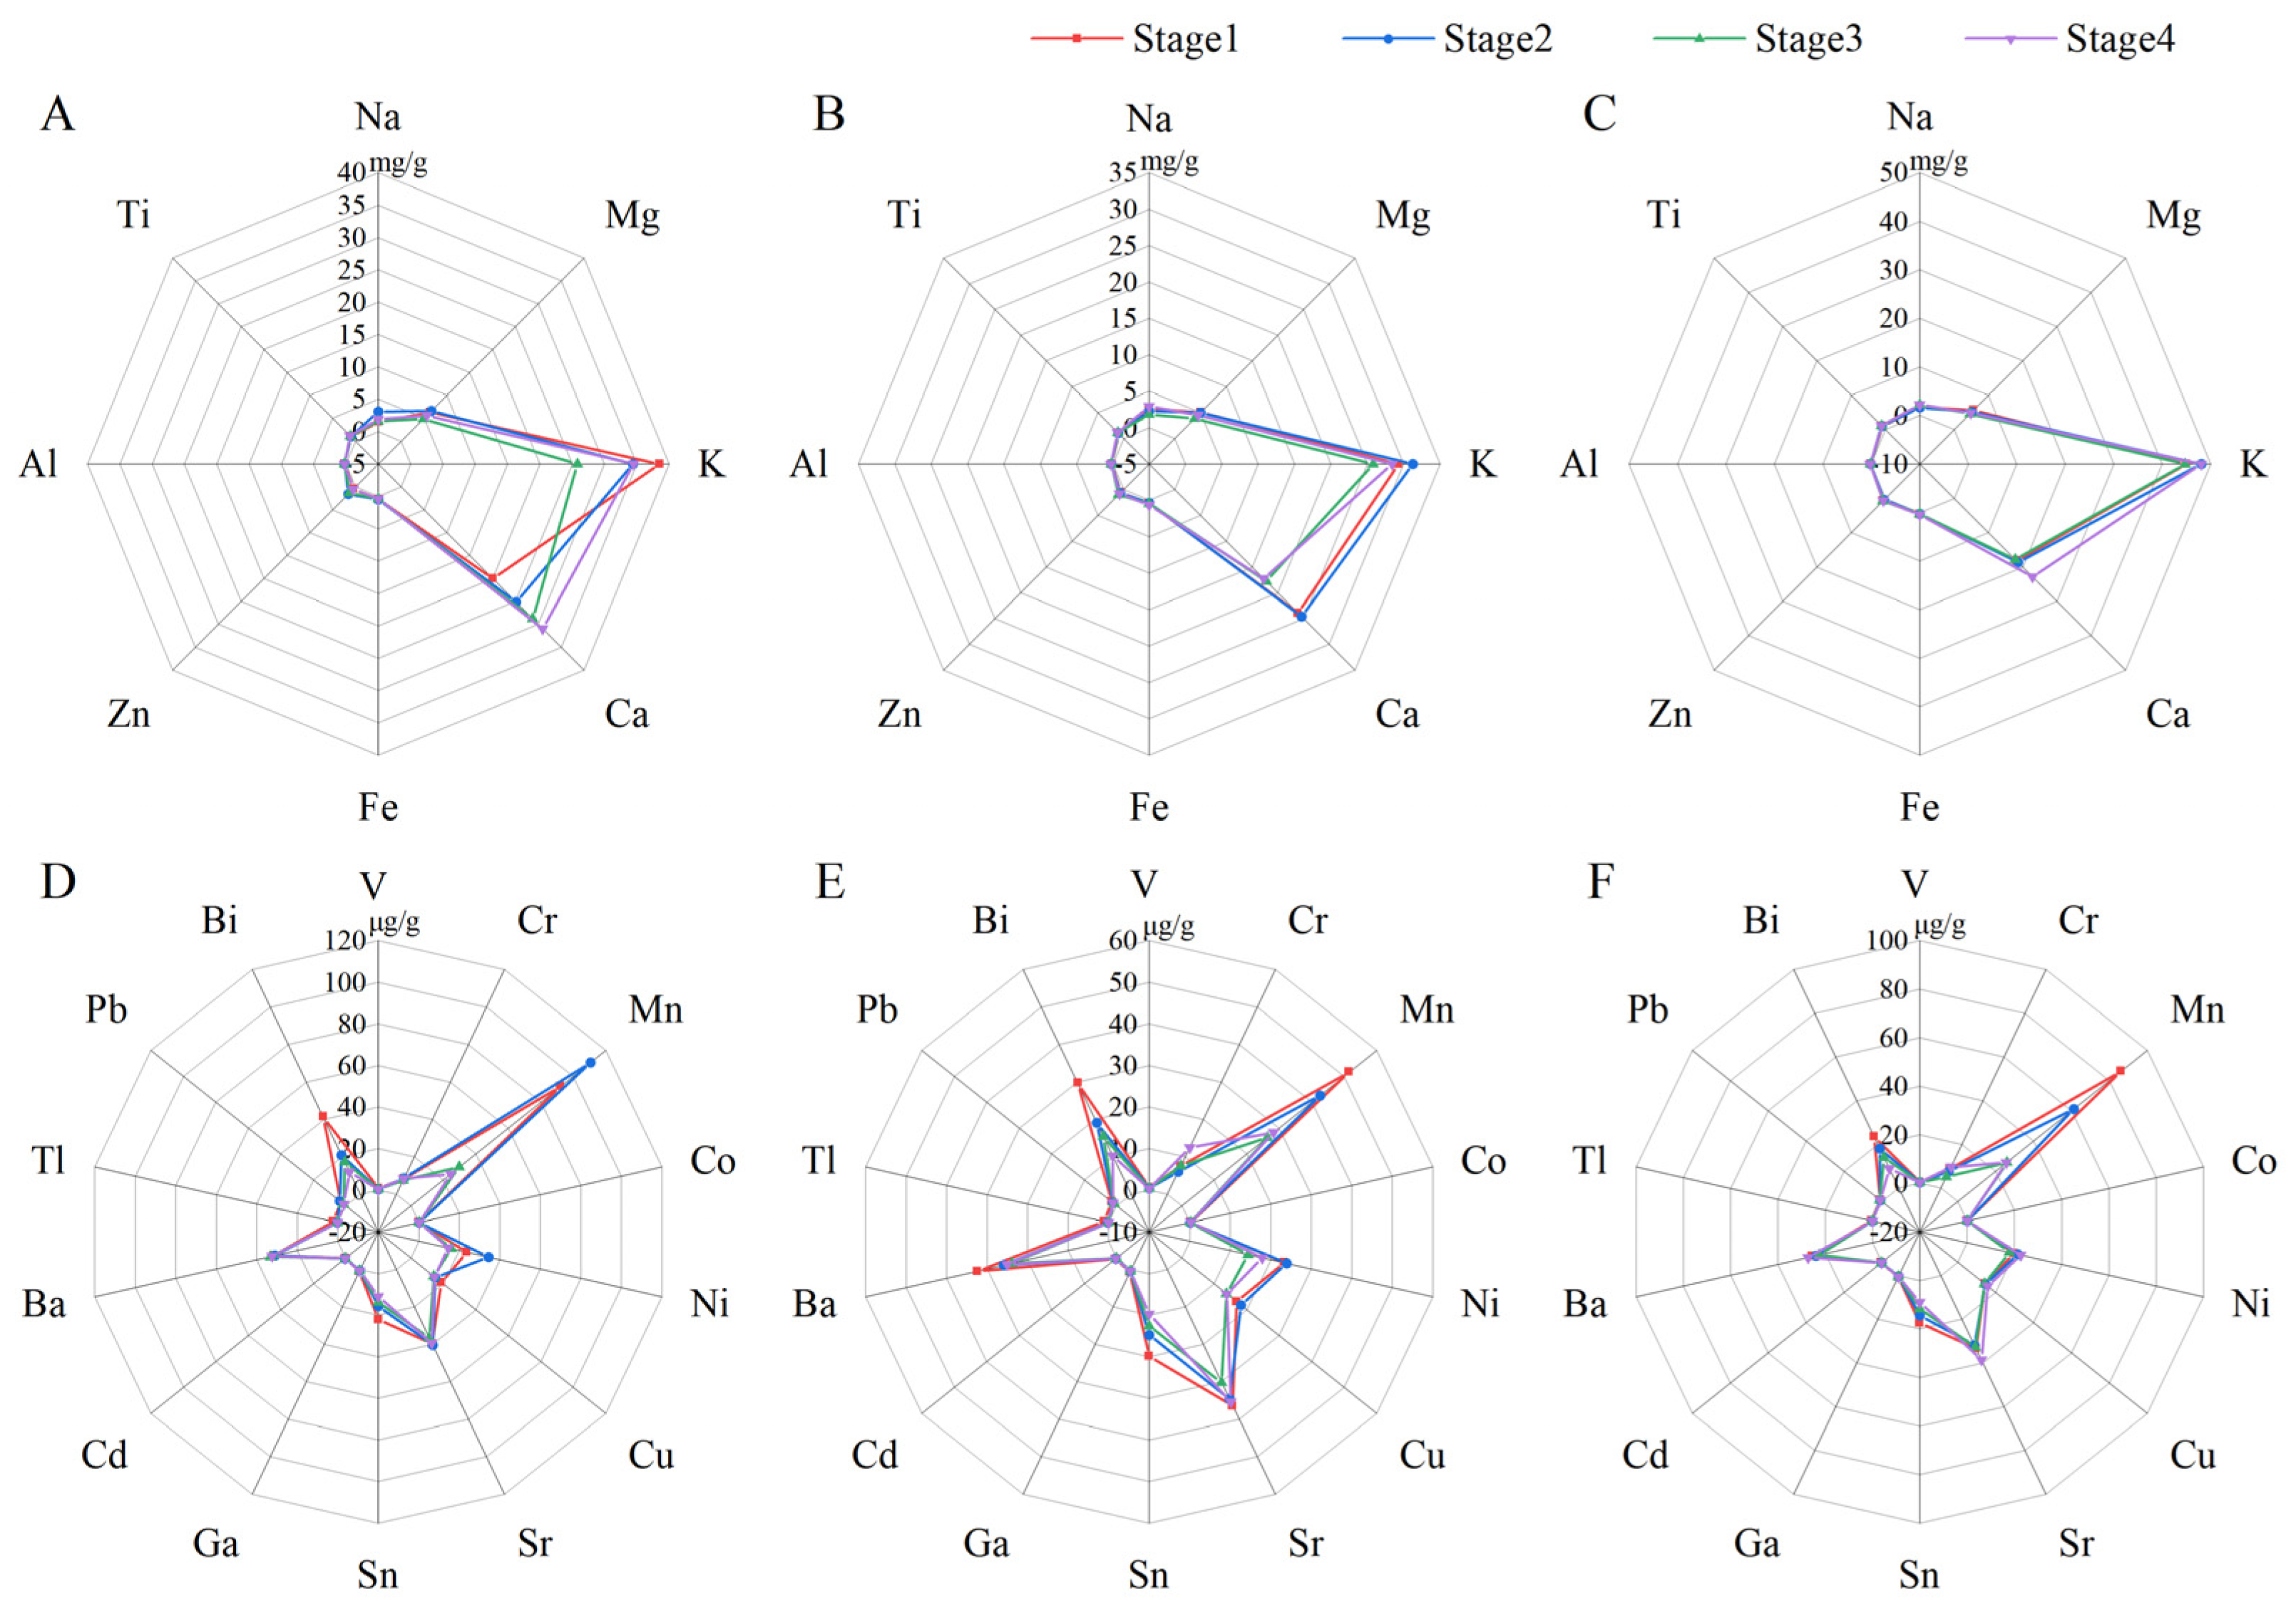
3.2. Radar Map Analysis

Radar charts are adept at comparing multiple variables across different dimensions, boasting robust data visualization capabilities. Due to the considerable variation in concentration ranges among the 22 mineral elements analyzed, their representation was categorized and standardized at 120 μg/g in Figure 3. This normalization enhances the radar chart’s clarity, enabling more effective visualization of elemental distribution patterns in H. officinalis floral organs (pistil, stamens, and petals) across developmental stages. It is evident from Figure 3A–C that K and Ca are predominant throughout the developmental stages of H. officinalis flowers. Notably, K and Ca exhibit stage-dependent variations, while other elements show minimal differences across stages. This may be due to the radar chart’s scale exceeding their content levels. Specifically, K content surpasses Ca in three floral parts across four stages, with the exception of the pistil in stage 3 of H. officinalis flowers. Mg content is significantly lower than K and Ca, but markedly higher than the content of Na, Ti, Fe, Zn, and Al. As illustrated in Figure 3D–F, 14 trace elements with concentrations below 120 μg/g exhibit similarities in their distribution within different parts of H. officinalis flowers. Mn, Ni, Sr, Ba, and Bi are relatively abundant in the pistil, stamens, and petals, whereas Cr, Cu, and Sn are relatively less abundant, and V, Co, Ga, Cd, Tl, and Pb are exceedingly low. Notably, the radar chart’s overlapping points reveal significant fluctuations in Cr content in the stamens, Ni and Cu content in the pistil, and Mn, Sn, and Bi content across the three organs during floral development. In addition, most elements in other parts peak at stage 1 and 2, aside from the high Ca content in the pistil and petals throughout the four stages. This suggested that stages 1 and 2, characterized by pen flowers, are enriched with beneficial mineral elements, making them more suitable for medicinal applications. This aligns with the descriptor of high-quality flower buds in the same family, magnolia, which are known for their “yellow-green color and tightly arranged petals” [47].

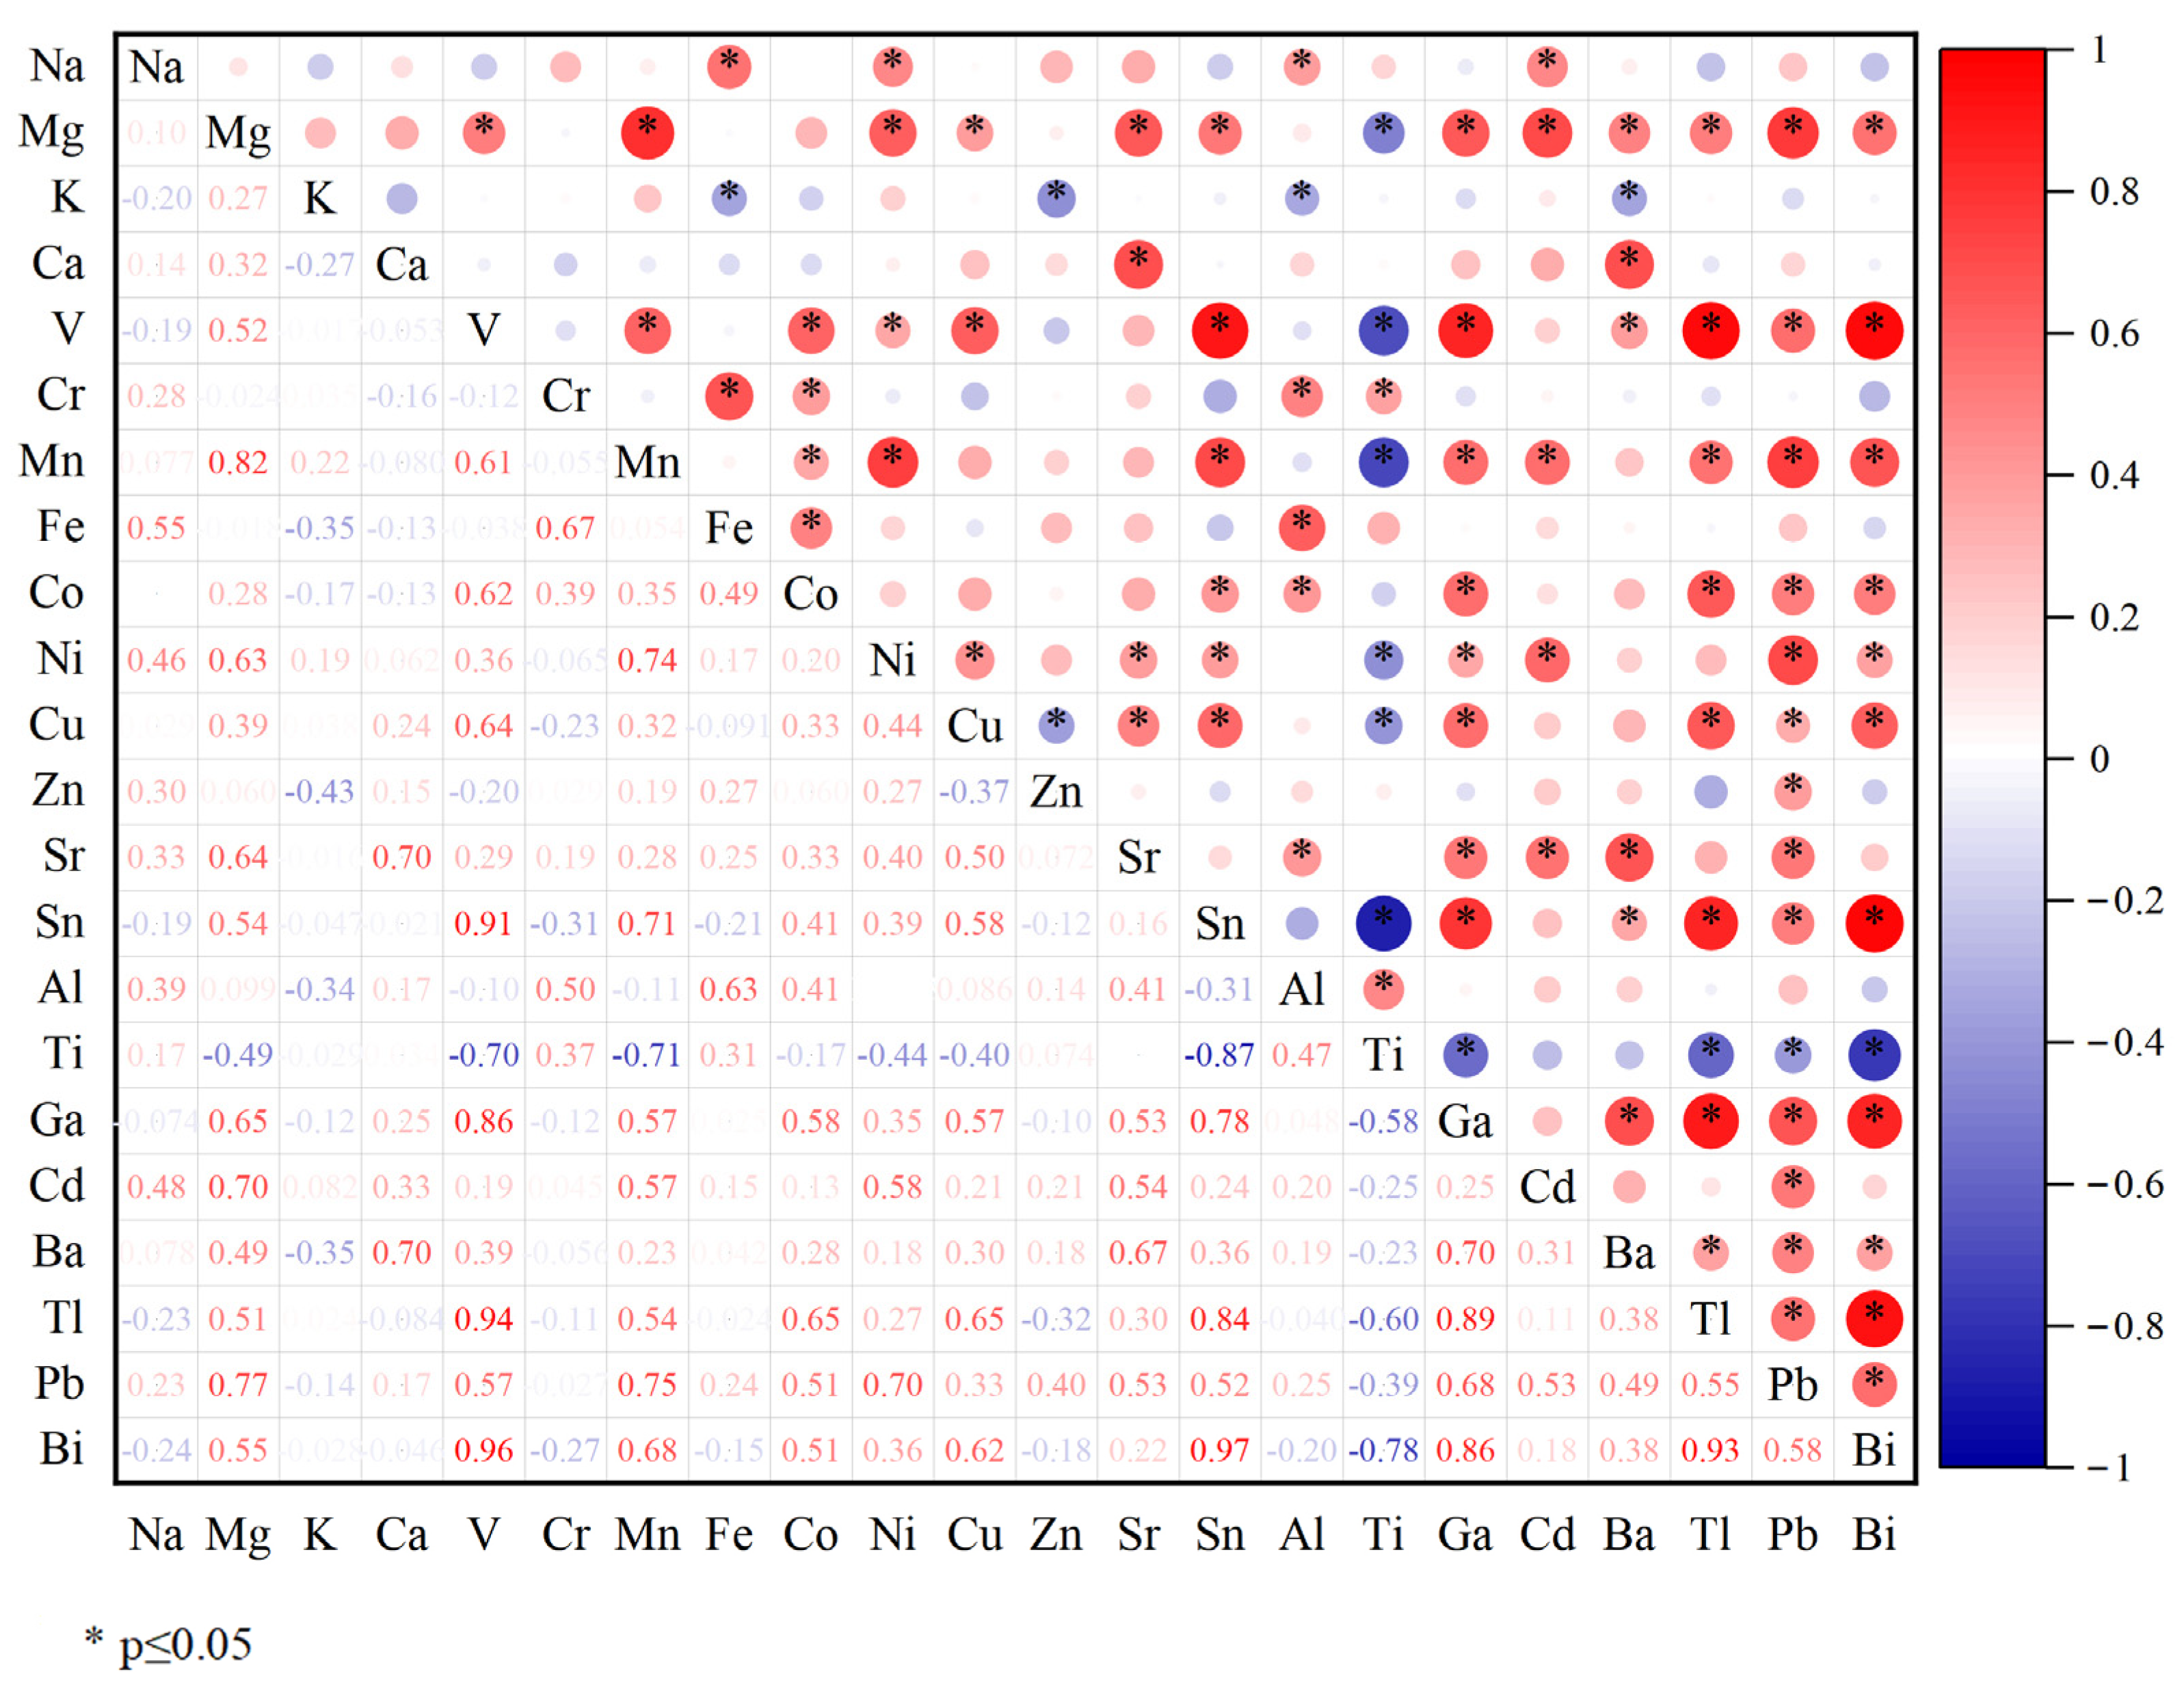
3.3. Pearson Correlation Analysis

Pearson correlation analysis of the 22 mineral elements elucidates the interrelationships between the content levels of each element, aiding in the inference of the nutritional status of other elements by assessing the levels of certain elements. The Pearson correlation heatmap visually represents these correlations, where the intersection of any two elements indicates their correlational relationship. The size of the circle (and the darkness of its color) corresponds to the strength of the correlation, with red indicating a positive correlation and blue indicating a negative one, aligning with the magnitude and sign of the correlation coefficient at the respective intersection. The correlation analysis (Figure 4) revealed particularly strong positive associations within the V-Sn-Ga-Tl-Bi cluster, with the highest coefficients observed for V-Bi (r = 0.96, p < 0.05), Sn-Bi (r = 0.97), V-Tl (r = 0.94), V-Sn (r = 0.91), and Tl-Bi (r = 0.93). Moderately strong positive correlations included Mg-Mn (r = 0.82), Mg-Pb (r = 0.77), V-Ga (r = 0.86), Sn-Tl (r = 0.84), Ga-Tl (r = 0.89), Ga-Bi (r = 0.86), Mn-Pb (r = 0.75), and Sn-Ga (r = 0.78). In addition, the significant negative correlations between Sn-Ti (r = −0.87) and Ti-Bi (r = −0.78) may suggest potential antagonistic relationships within the elemental network.

3.4. Principal Component Analysis

Principal component analysis (PCA) was applied to the 22 mineral elements present in Houpoea officinalis flowers. As detailed in Table 6, the eigenvalues for the first five principal components exceed 1.0, representing 38.088%, 19.339%, 10.732%, 9.7%, and 7.31% of the cumulative variance, respectively, which sums up to 84.17%. According to Table 7, V, Ga, Sn, and Bi show notable positive contributions to the first principal component (PC1), while Na, Fe, and Al contribute significantly to the second principal component (PC2). For the third principal component (PC3), Cr, Fe, and Co contribute significantly in the positive direction, while Cd contributes notably in the negative direction. Ca and Ba exhibit significant contributions in the negative direction for the fourth principal component (PC4), with Ni showing a positive contribution. Furthermore, the fifth principal component (PC5) is strongly correlated with K and Zn, with K contributing positively and Zn negatively. As depicted in Figure 5, the confidence ellipses for the pistil, stamens, and petals partially overlap, particularly between the stamens and pistil at stage 3, and the petals at stages 1, 2, and 4. This overlap suggests a high degree of similarity in the mineral element composition among these floral parts. These findings indicate that the concentrations of the 22 mineral elements are closely correlated with both developmental stage and parts within H. officinalis flowers.

4. Conclusions

In summary, this comprehensive investigation delineated the spatio-temporal distribution of macroelements (K, Ca, Na, and Mg) and trace elements (V, Cr, Mn, Fe, Co, Ni, Cu, Zn, Sr, Sn, Al, Ti, Ga, Cd, Ba, Tl, Pb, and Bi) across three floral organs of H. officinalis at four developmental stages, revealing its rich reservoir of K, Ca, Zn, and Fe. Correlation and principal component analyses demonstrated that elemental profiles were intricately linked to developmental progression and organ-specific differentiation, underscoring the interplay between physiological development, floral architecture, and mineral accumulation. These findings not only provide novel insights into the dynamic regulation of elemental partitioning during floral ontogeny, but also establish a foundation for rapid nutritional assessment methodologies. However, the polyphasic relationships among developmental trajectories, organ-specific physiology, and mineral element dynamics necessitate further exploration. Future research will prioritize elucidating the regulatory networks governing elemental homeostasis and integrating physio-biochemical parameters to advance mechanistic understanding of H. officinalis flower development, with implications for both fundamental biology and applied horticultural practices.

Author Contributions

Conceptualization, supervision, writing—original draft preparation, and writing—review and editing, S.G. and G.-Q.Z.; methodology, software, validation, data curation, formal analysis, writing—original draft preparation, and writing—review and editing, Y.Y., M.-Y.Z., and S.-M.Z.; visualization and writing—review and editing, Y.-T.F., J.-W.H., and T.Y. All authors have read and agreed to the published version of the manuscript.

Funding

This work was financially supported by the National Key Research and Development Program of China (No. 2023YFD1600400).

Data Availability Statement

The data presented in this study are available on request from the corresponding author.

Conflicts of Interest

The authors declare no conflicts of interest.

References

  1. Önder, S.; Tonguç, M.; Erbaş, S.; Önder, D.; Mutlucan, M. Investigation of Phenological, Primary and Secondary Metabolites Changes During Flower Developmental of Rosa damascena. Plant Physiol. Biochem. 2022, 192, 20–34. [Google Scholar] [CrossRef] [PubMed]
  2. Jhanji, S.; Kaur, G.; Kaur, R.; Dhatt, U.K. Physiological and Biochemical Changes During Flower Development and Senescence in Chrysanthemum and Gladiolus. Acta Physiol. Plant. 2023, 45, 14. [Google Scholar] [CrossRef]
  3. Thomson, B.; Wellmer, F. Molecular Regulation of Flower Development. Curr. Top. Dev. Biol. 2019, 131, 185–210. [Google Scholar] [CrossRef] [PubMed]
  4. Ren, H.-Y.; Qian, W.-Z.; Yi, L.; Ye, Y.-L.; Gu, T.; Gao, S.; Cao, G.-X. Nutrient Composition and Antioxidant Activity of Cercis chinensis Flower in Response to Different Development Stages. Horticulturae 2023, 9, 961. [Google Scholar] [CrossRef]
  5. Yu, T.; Yang, Y.; Wang, H.; Qian, W.; Hu, Y.; Gao, S.; Liao, H. The Variations of C/N/P Stoichiometry, Endogenous Hormones, and Non-structural Carbohydrate Contents in Michelia maudiae ‘Rubicunda’ Flower at Five Development Stages. Horticulturae 2023, 9, 1198. [Google Scholar] [CrossRef]
  6. Kaur, H.; Kaur, H.; Kaur, H.; Srivastava, S. The Beneficial Roles of Trace and Ultratrace Elements in Plants. Plant Growth Regul. 2023, 100, 219–236. [Google Scholar] [CrossRef]
  7. Önder, D. Variation in Antioxidant Capacity, Antioxidant Activity and Mineral Composition during Flower Development of Oil-Bearing Rose (Rosa damascena Mill.). Sci. Rep. 2023, 13, 17255. [Google Scholar] [CrossRef]
  8. Jia, S.; Wang, Y.; Hu, J.; Ding, Z.; Liang, Q.; Zhang, Y.; Wang, H. Mineral and Metabolic Profiles in Tea Leaves and Flowers during Flower Development. Plant Physiol. Biochem. 2016, 106, 316–326. [Google Scholar] [CrossRef]
  9. Tian, J.; Gong, Y.; Li, J. Nutritional Attributes and Phenolic Composition of Flower and Bud of Sophora japonica L. and Robinia pseudoacacia L. Molecules 2022, 27, 8932. [Google Scholar] [CrossRef]
  10. Morrissey, J.; Guerinot, M.L. Trace Elements: Too Little or Too Much and How Plants Cope. F1000 Biol. Rep. 2009, 1, 14. [Google Scholar] [CrossRef]
  11. Rai, S.; Singh, P.K.; Mankotia, S.; Swain, J.; Satbhai, S.B. Iron Homeostasis in Plants and Its Crosstalk with Copper, Zinc, and Manganese. Plant Stress 2021, 1, 100008. [Google Scholar] [CrossRef]
  12. Wang, Y.; Liu, C.; Hu, J.; Wu, K.; Gong, B.; Xu, Y. A Flowering Morphological Investigation, Fruit Fatty Acids, and Mineral Elements Dynamic Changes of Idesia polycarpa Maxim. Plants 2024, 13, 2663. [Google Scholar] [CrossRef]
  13. Niu, L.; Hou, Y.; Jiang, M.; Bai, G. The Rich Pharmacological Activities of Magnolia Officinalis and Secondary Effects Based on Significant Intestinal Contributions. J. Ethnopharmacol. 2021, 281, 114524. [Google Scholar] [CrossRef]
  14. Poivre, M.; Duez, P. Biological Activity and toxicity of the Chinese Herb Magnolia officinalis Rehder & E. Wilson (Houpo) and Its Constituents. J. Zhejiang Univ. Sci. B 2017, 18, 194–214. [Google Scholar] [CrossRef] [PubMed]
  15. Pires, E.D.O.; Di Gioia, F.; Rouphael, Y.; García-Caparrós, P.; Tzortzakis, N.; Ferreira, I.C.F.R.; Barros, L.; Petropoulos, S.A.; Caleja, C. Edible Flowers as an Emerging Horticultural Product: A Review on Sensorial Properties, Mineral and Aroma Profile. Trends Food Sci. Technol. 2023, 137, 31–54. [Google Scholar] [CrossRef]
  16. Yang, Y.; Qiu, Y.; Cheng, Y.; Yu, T.; Zhu, M.; Qian, W.; Gao, S.; Zhuang, G. Non-structural Carbohydrate Content and C:N:P Stoichiometry in Houpoea Officinalis Flowers in Response To Development Stages. Horticulturae 2024, 10, 784. [Google Scholar] [CrossRef]
  17. Zhao, S.; Xiong, F.; Wang, L.; Wang, B.; Chen, K.; Chen, C.; Zhou, G. Study on the Quality Characteristics and Geographical Origin Authentication of Wild Rheum Tanguticum in Three Authentic Regions. J. Food Compos. Anal. 2023, 123, 105463. [Google Scholar] [CrossRef]
  18. Zhang, X. Extraction from Different Parts of Citrus maxima Flowers Using Ultrasound as an Aid And Study of Their Composition and Function. Ultrason. Sonochem. 2023, 100, 106632. [Google Scholar] [CrossRef]
  19. Liu, Q. Characterization of the Phytochemical Content, Antioxidant Activity and Inhibition Capacity Against α-Glucosidase of Different Flower Parts of Seven Lotuses (Nelumbo). Sci. Hort. 2023, 316, 112007. [Google Scholar] [CrossRef]
  20. Zoroddu, M.A. The Essential Metals for Humans: A Brief Overview. J. Inorg. Biochem. 2019, 195, 120–129. [Google Scholar] [CrossRef]
  21. Jomova, K.; Makova, M.; Alomar, S.Y.; Alwasel, S.H.; Nepovimova, E.; Kuca, K.; Rhodes, C.J.; Valko, M. Essential Metals in Health and Disease. Chem. Biol. Interact. 2022, 367, 110173. [Google Scholar] [CrossRef]
  22. Al Alawi, A.M.; Majoni, S.W.; Falhammar, H. Magnesium and Human Health: Perspectives and Research Directions. Int. J. Endocrinol. 2018, 2018, 9041694. [Google Scholar] [CrossRef]
  23. Pohl, H.R.; Wheeler, J.S.; Murray, H.E. Sodium and Potassium in Health and Disease. In Interrelations Between Essential Metal Ions and Human Diseases; Metal Ions in Life Sciences; Springer: Berlin/Heidelberg, Germany, 2013; pp. 29–47. [Google Scholar] [CrossRef]
  24. Norikoshi, R.; Imanishi, H.; Ichimura, K. Changes in Cell Number, Osmotic Potential and Concentrations of Carbohydrates and Inorganic Ions in Tweedia caerulea During Flower Opening. J. Jpn. Soc. Hortic. Sci. 2013, 82, 51–56. [Google Scholar] [CrossRef]
  25. Weaver, C.M. Potassium and Health. Adv. Nutr. 2013, 4, 368S–377S. [Google Scholar] [CrossRef] [PubMed]
  26. Niu, X.; Chen, X.; Su, H.; Eneji, A.E.; Guo, Y.; Dong, X. Changes of Secondary Metabolites and Trace Elements in Gentiana Macrophylla Flowers: A Potential Medicinal Plant Part. Chin. Herb. Med. 2014, 6, 145–151. [Google Scholar] [CrossRef]
  27. Sayeed, R.; Thakur, M.; Gani, A. Celosia cristata Linn. Flowers as a New Source of Nutraceuticals- a Study On Nutritional Composition, Chemical Characterization and In-vitro Antioxidant Capacity. Heliyon 2020, 6, e05792. [Google Scholar] [CrossRef]
  28. Katarzyna, J.; Karolina, J.; Patrycja, K.; Mateusz, B.; Izabela, G. Mineral Composition and Antioxidant Potential in the Common Poppy (Papaver rhoeas L.) Petal Infusions. Biol. Trace Elem. Res. 2021, 199, 371–381. [Google Scholar] [CrossRef]
  29. Mlcek, J.; Plaskova, A.; Jurikova, T.; Sochor, J.; Baron, M.; Ercisli, S. Chemical, Nutritional and Sensory Characteristics of Six Ornamental Edible Flowers Species. Foods 2021, 10, 2053. [Google Scholar] [CrossRef]
  30. Singh, M.; Nara, U.; Rani, N.; Pathak, D.; Sangha, M.K.; Kaur, K. Mineral Content Variation in Leaves, Stalks, and Seeds of Celery (Apium graveolens L.) Genotypes. Biol. Trace Elem. Res. 2023, 201, 2665–2673. [Google Scholar] [CrossRef]
  31. Abbaspour, N.; Hurrell, R.; Kelishadi, R. Review on Iron and Its Importance for Human Health. J. Res. Med.Sci. 2014, 19, 164–174. [Google Scholar]
  32. Xun, E. Translocation of Heavy Metals from Soils into Floral Organs and Rewards of Cucurbita pepo: Implications for Plant Reproductive Fitness. Ecotoxicol. Environ. Saf. 2017, 145, 235–243. [Google Scholar] [CrossRef] [PubMed]
  33. Genchi, G.; Lauria, G.; Catalano, A.; Carocci, A.; Sinicropi, M.S. The Double Face of Metals: The Intriguing Case of Chromium. Appl. Sci. 2021, 11, 638. [Google Scholar] [CrossRef]
  34. Chen, P. Manganese Metabolism in Humans. Front. Biosci. 2018, 23, 1655–1679. [Google Scholar] [CrossRef] [PubMed]
  35. Yang, J.; Ma, Z. Research Progress on the Effects of Nickel on Hormone Secretion in The Endocrine Axis and on Target Organs. Ecotoxicol. Environ. Saf. 2021, 213, 112034. [Google Scholar] [CrossRef]
  36. Chen, L. Copper Homeostasis and Cuproptosis in Health and Disease. Signal Transduct. Target. Ther. 2022, 7, 378. [Google Scholar] [CrossRef]
  37. Pilmane, M. Strontium and Strontium Ranelate: Historical Review of Some of Their Functions. Mater. Sci. Eng. C 2017, 78, 1222–1230. [Google Scholar] [CrossRef]
  38. Yusof, E.N.M.; Ravoof, T.B.S.A.; Page, A.J. Cytotoxicity of Tin(Iv)-based Compounds: A Review. Polyhedron 2021, 198, 115069. [Google Scholar] [CrossRef]
  39. Ścibior, A.; Pietrzyk, Ł.; Plewa, Z.; Skiba, A. Vanadium: Risks and Possible Benefits in The Light of a Comprehensive Overview of Its Pharmacotoxicological Mechanisms and Multi-Applications with a Summary of Further Research Trends. J. Trace Elem. Med. Biol. 2020, 61, 126508. [Google Scholar] [CrossRef]
  40. Leyssens, L.; Vinck, B.; Van Der Straeten, C.; Wuyts, F.; Maes, L. Cobalt Toxicity in Humans-a Review of the Potential Sources and Systemic Health Effects. Toxicology 2017, 387, 43–56. [Google Scholar] [CrossRef]
  41. Li, S. Development and Applications of Aluminum Alloys for Aerospace Industry. J. Mater. Res. Technol. 2023, 27, 944–983. [Google Scholar] [CrossRef]
  42. Najafizadeh, M.; Yazdi, S.; Bozorg, M.; Ghasempour-Mouziraji, M.; Hosseinzadeh, M.; Zarrabian, M.; Cavaliere, P. Classification and Applications of Titanium and Its Alloys: A Review. J. Alloys Compd. Commun. 2024, 3, 100019. [Google Scholar] [CrossRef]
  43. Zhang, J.; Kuang, X.; Tu, R.; Zhang, S. A Review on Synthesis and Applications of Gallium Oxide Materials. Adv. Colloid Interface Sci. 2024, 328, 103175. [Google Scholar] [CrossRef]
  44. Gonçalves, D.A.; De Souza, I.D.; Rosa, A.C.G.; Melo, E.S.P.; Goncalves, A.-M.B.; De Oliveira, L.C.S.; Do Nascimento, V.A. Multi-wavelength Calibration: Determination of Trace Toxic Elements in Medicine Plants by ICP OES. Microchem. J. 2019, 146, 381–386. [Google Scholar] [CrossRef]
  45. Chen, Y.-G. Impacts of Heavy Metals and Medicinal Crops on Ecological Systems, Environmental Pollution, Cultivation, and Production Processes in China. Ecotoxicol. Environ. Saf. 2021, 219, 112336. [Google Scholar] [CrossRef] [PubMed]
  46. Li, X. Effect of Germination on Mineral Content Changes in Brown Rice (Oryza sativa L.). Biol. Trace Elem. Res. 2025, 203, 535–543. [Google Scholar] [CrossRef]
  47. Xu, L.; Sun, L.; Chen, Y.; Nie, T.; Zhu, H.; Yin, Z. Magnolia biondii Pamp.: A Comprehensive Review of The Pharmacognosy, Phytochemistry, Pharmacology, and Applications. Ind. Crops Prod. 2024, 222, 119648. [Google Scholar] [CrossRef]
Figure 1. (A) Schematic diagram of the developmental morphology of H. officinalis flowers. Stage 1, young flower bud stage. Stage 2, flower bud expansion stage. Stage 3, first bloom stage. Stage 4, full bloom stage. (B) Three parts of H. officinalis flowers.
Horticulturae 11 00387 g001
Figure 2. Cluster heat map of 22 mineral elements in the pistil, stamens, and petals of H. officinalis at four developmental stages. Numbers 1, 2, 3, and 4 represent the developmental stages of the flower, while Pi, St, and Pe represent the abbreviations for pistil, stamens, and petals, respectively.
Horticulturae 11 00387 g002
Figure 3. Radar map of 22 elements in different parts of H. officinalis flower at four different stages. (AC) represents radar map of 8 elements with a content exceeding 120 μg/g in the pistil, stamens and petals, respectively. (DF) represents radar map of 14 elements with a content below 120 μg/g in the pistil, stamens and petals, respectively.
Horticulturae 11 00387 g003
Figure 4. Correlation coefficients of 22 mineral elements in H. officinalis flower. * represents significance at 0.05 probability level.
Horticulturae 11 00387 g004
Figure 5. Principal component analysis of mineral elements in H. officinalis flowers from four stages. Arabic numerals were used instead of Roman numerals to distinguish between the developmental stages.
Horticulturae 11 00387 g005
Table 1. Names and abbreviations of 22 mineral elements.
Element NameAbbreviationElement NameAbbreviation
SodiumNaZincZn
MagnesiumMgAluminumAl
PotassiumKChromiumCr
CalciumCaGalliumGa
TitaniumTiStrontiumSr
VanadiumVCadmiumCd
ManganeseMnTinSn
IronFeBariumBa
CobaltCoThalliumTl
NickelNiLeadPb
CopperCuBismuthBi
Table 2. Operating conditions for AAS.
ElementBackground Correction Modeλ (nm)Lamp Current (mA)Spectral BandwidthFlame TypeGas Flow Rate (L/min)Combustion Head Height
NaNON-BGC589.030.2 nmAir-C2H21.96 mm
MgBGC-D2285.280.7 nmAir-C2H22.07 mm
KNON-BGC589.030.2 nmAir-C2H21.96 mm
CaBGC-D2422.740.7 nmAir-C2H22.48 mm
Table 3. Linear equations, correlation coefficient, linear ranges, relative standard deviation (RSD), limits of detection (LOD), and limits of quantification (LOQ) for each mineral in AAS.
ElementsLinear EquationCorrelation Coefficient (R2)Linear Range
(mg/L)
RSD
(%)
LOD (ppm)LOQ (ppm)
Nay = 0.0248x + 0.0064R2 = 0.99320–0.50.0340.0010.004
Mgy = 0.7778x − 0.001R2 = 0.99970–0.20.0240.00070.002
Ky = 0.1995x + 0.0109R2 = 0.9950–40.0340.0010.004
Cay = 0.0647x + 0.0069R2 = 0.9940–50.6670.020.05
Table 4. Linear equations, correlation coefficient, linear ranges, relative standard deviation (RSD), limits of detection (LOD), and limits of quantification (LOQ) for each mineral in NexION 2000.
ElementsLinear EquationCorrelation Coefficient (R2)Linear Range
(mg/L)
RSD
(%)
LOD (ppm)LOQ (ppm)
Tiy = 2695.5x − 5938.5R2 = 0.99820–1504.5%0.03280.1094
Vy = 5329.2x − 1252.5R2 = 0.99970–1502.8%0.00060.0019
Mny = 4387.2x + 826.95R2 = 0.99970–1502.2%0.00320.0107
Fey = 137.14x − 388.5R2 = 0.99430–1505.2%0.43571.4522
Coy = 9094x + 7055.6R2 = 0.99950–1502.7%0.00070.0023
Niy = 2437.9x + 1643.1R2 = 0.99930–1500.9%0.03970.1322
Cuy = 6390x + 7327.4R2 = 0.99930–1500.3%0.59291.9763
Zny = 1327.4x + 2975.3R2 = 0.99920–1502.2%0.10180.3394
Aly = 525.98x + 521.96R2 = 0.99960–1500.6%0.01350.0450
Cry = 6133.7x − 3264.9R2 = 0.99940–1505.0%0.00770.0257
Gay = 3813.4x − 8523.2R2 = 0.99870–1506.8%0.00490.0165
Sry = 6576.3x + 5639.7R2 = 0.99970–1502.6%0.00290.0097
Cdy = 1830.2x + 1477.3R2 = 0.99960–1502.4%0.00250.0084
Sny = 3212.5x – 14,307R2 = 0.99480–1503.3%0.00510.0170
Bay = 12,831x + 31,426R2 = 0.99780–1503.5%0.00380.0125
Tly = 18,451x + 81,280R2 = 0.99380–1503.5%0.00070.0024
Pby = 14,793x + 61,577R2 = 0.99540–1501.3%0.00130.0042
Biy = 20,581x – 74,109R2 = 0.99050–1501.5%0.00200.0065
Table 5. Changes in 22 mineral elements in different parts of H. officinalis flowers during development process.
Stage 1Stage 2Stage 3Stage 4
PistilStamensPetalsPistilStamensPetalsPistilStamensPetalsPistilStamensPetals
Na(mg/g)1.45 ± 0.23 e2.58 ± 0.35 abc1.82 ± 0.07 de3.08 ± 0.28 a2.31 ± 0.19 bcd1.67 ± 0.05 de1.63 ± 0.14 de1.81 ± 0.16 de2.24 ± 0.10 cd1.93 ± 0.13 cde2.90 ± 0.25 ab2.20 ± 0.23 cd
Mg(mg/g)6.34 ± 0.05 a5.07 ± 0.12 c5.70 ± 0.04 b6.62 ± 0.04 a4.96 ± 0.14 cd5.16 ± 0.06 c4.84 ± 0.12 cde3.86 ± 0.06 f4.64 ± 0.14 de5.64 ± 0.12 b4.55 ± 0.18 e4.87 ± 0.16 cde
K(mg/g)38.57 ± 0.34 c29.25 ± 0.44 ef44.93 ± 0.34 b34.39 ± 0.21 d31.26 ± 0.28 e48.06 ± 0.40 a25.80 ± 0.57 g25.78 ± 0.21 g44.73 ± 0.37 b34.52 ± 0.89 d28.43 ± 1.94 f48.06 ± 0.53 a
Ca(mg/g)20.00 ± 0.60 cde23.96 ± 2.5 bcd18.23 ± 0.10 de25.17 ± 2.90 bc24.64 ± 1.60 bc18.61 ± 1.48 de28.77 ± 3.01 ab17.77 ± 1.09 e17.82 ± 1.53 e31.00 ± 0.29 a17.27 ± 1.34 e22.88 ± 2.77 bcde
V(μg/g)0.81 ± 0.01 a0.64 ± 0.05 b0.51 ± 0.03 c0.46 ± 0.03 cd0.42 ± 0.01 de0.39 ± 0.01 def0.42 ± 0.04 de0.34 ± 0.01 ef0.37 ± 0.03 ef0.33 ± 0.01 f0.35 ± 0.01 ef0.33 ± 0.02 f
Cr(μg/g)8.15 ± 0.39 bc7.46 ± 0.77 bc8.77 ± 0.59 b8.48 ± 0.8 bc6.05 ± 0.49 c7.67 ± 0.94 bc7.36 ± 0.22 bc7.62 ± 1.15 bc5.13 ± 2.6 bc8.35 ± 0.95 bc12.49 ± 0.59 a9.74 ± 0.37 b
Mn(μg/g)92.02 ± 1.58 b51.56 ± 0.37 e85.99 ± 1.29 c110.64 ± 1.22 a42.59 ± 1.97 f61.28 ± 0.61 d29.92 ± 0.35 g26.36 ± 1.52 gh25.94 ± 1.00 gh24.54 ± 1.88 h28.27 ± 1.07 gh25.66 ± 1.95 gh
Fe(μg/g)419.58 ± 31.65 bcd400.94 ± 8.70 cde387.57 ± 40.961 cde485.12 ± 18.02 b360.01 ± 26.52 de333.11 ± 14.28 e370.51 ± 15.92 cde443.68 ± 24.67 bc324.27 ± 10.21 e372.19 ± 16.86 cde622.31 ± 25.98 a441.12 ± 32.09 bc
Co(μg/g)0.31 ± 0.01 a0.22 ± 0.02 bc0.19 ± 0.01 c0.21 ± 0.03 bc0.16 ± 0.01 c0.16 ± 0.01 c0.21 ± 0.01 bc0.18 ± 0.02 c0.18 ± 0.02 c0.17 ± 0.01 c0.26 ± 0.03 ab0.18 ± 0.01 c
Ni(μg/g)23.70 ± 0.63 b23.26 ± 0.92 b19.87 ± 0.77 cd34.37 ± 1.30 a23.95 ± 1.41 b21.62 ± 0.51 bc16.03 ± 0.74 ef14.43 ± 0.28 f17.99 ± 1.18 de14.48 ± 0.23 f17.90 ± 0.40 de22.77 ± 1.02 b
Cu(μg/g)18.82 ± 0.93 a16.93 ± 0.70 bc14.46 ± 0.41 d15.04 ± 0.87 d18.24 ± 0.79 ab14.51 ± 0.26 d14.08 ± 0.73 d13.78 ± 0.43 d14.14 ± 0.28 d14.48 ± 0.42 d13.88 ± 0.65 d15.80 ± 0.32 cd
Zn(μg/g)445.17 ± 33.72 g568.88 ± 50.12 efg691.47 ± 61.87 def1553.16 ± 92.64 a615.97 ± 70.47 defg469.02 ± 8.27 g1368.03 ± 87.30 b986.18 ± 73.29 c750.23 ± 61.56 de502.42 ± 48.95 fg788.36 ± 44.13 d612.40 ± 28.67 defg
Sr(μg/g)39.59 ± 0.44 ab36.35 ± 2.30 abcd33.33 ± 0.03 cde40.47 ± 3.01 a34.51 ± 1.11 bcde31.75 ± 0.70 de36.47 ± 1.73 abcd30.19 ± 1.75 e32.69 ± 1.72 de39.34 ± 1.44 ab35.34 ± 1.36 abcde38.51 ± 1.64 abc
Sn(μg/g)22.07 ± 1.25 a19.94 ± 0.68 b17.54 ± 0.30 c15.71 ± 0.44 d14.78 ± 0.19 de14.35 ± 0.36 de13.80 ± 0.17 ef12.65 ± 0.04 fg11.71 ± 0.12 gh10.94 ± 0.14 hi9.78 ± 0.32 ij8.96 ± 0.13 j
Al(μg/g)228.09 ± 7.66 bc179.21 ± 4.20 fg188.50 ± 5.75 efg226.63 ± 15.91 bc224.06 ± 11.94 bcd165.91 ± 6.06 g207.74 ± 8.51 cde200.93 ± 4.22 def200.30 ± 5.00 def235.29 ± 4.41 b271.63 ± 7.83 a214.53 ± 1.36 bcd
Ti(μg/g)996.73 ± 18.13 ef966.52 ± 6.48 f969.82 ± 14.05 f1030.84 ± 10.47 de1030.86 ± 28.60 de1051.60 ± 15.05 cd1089.03 ± 11.64 bc1133.76 ± 1.25 ab1137.49 ± 8.83 a1151.35 ± 19.44 a1178.16 ± 20.04 a1176.35 ± 13.65 a
Ga(μg/g)0.94 ± 0.06 a0.74 ± 0.06 b0.55 ± 0.02 cd0.61 ± 0.03 c0.47 ± 0.005 de0.41 ± 0.02 d0.56 ± 0.03 cd0.41 ± 0.002 d0.37 ± 0.02 d0.54 ± 0.04 cd0.42 ± 0.02 d0.46 ± 0.02 de
Cd(μg/g)0.28 ± 0.02 bc0.31 ± 0.05 bc0.36 ± 0.04 b0.55 ± 0.04 a0.27 ± 0.05 bc0.23 ± 0.02 bcd0.18 ± 0.03 cd0.10 ± 0.04 d0.25 ± 0.05 bcd0.37 ± 0.09 b0.29 ± 0.04 bc0.19 ± 0.02 cd
Ba(μg/g)31.72 ± 1.90 a32.44 ± 1.00 a25.44 ± 0.72 bc31.05 ± 1.26 a25.88 ± 0.45 bc23.93 ± 0.91 bc33.31 ± 1.81 a23.83 ± 0.98 bc22.65 ± 1.20 c32.43 ± 1.87 a25.05 ± 0.73 bc27.19 ± 1.37 b
Tl(μg/g)2.36 ± 0.07 a1.12 ± 0.13 b0.52 ± 0.04 c0.27 ± 0.02 d0.18 ± 0.01 de0.12 ± 0.01 e0.10 ± 0.01 e0.07 ± 0.00 e0.06 ± 0.00 e0.05 ± 0.00 e0.04 ± 0.00 e0.04 ± 0.00 e
Pb(μg/g)3.14 ± 0.27 b1.61 ± 0.04 c0.97 ± 0.09 ef3.75 ± 0.08 a1.13 ± 0.07 def0.86 ± 0.07 f1.41 ± 0.13 cd0.87 ± 0.04 f1.01 ± 0.05 ef1.23 ± 0.07 de1.17 ± 0.02 def0.87 ± 0.02 f
Bi(μg/g)41.26 ± 0.55 a29.66 ± 2.37 b23.56 ± 0.48 c20.82 ± 0.43 d19.12 ± 0.20 de18.07 ± 0.61 e17.23 ± 0.32 ef15.43 ± 0.49 fg13.92 ± 0.35 gh11.94 ± 0.18 hi10.29 ± 0.55 ij8.93 ± 0.41 j
Note: Data were means ± standard error deviation (n = 3). Different superscript lowercase letters indicate significant differences (p < 0.05) in element content among all samples.
Table 6. Principal component analysis of 22 mineral elements in H. officinalis.
ComponentEigenvaluePercentage of Variance (%)Cumulative (%)ComponentEigenvaluePercentage of Variance (%)Cumulative (%)
18.37938.08838.088120.1630.73997.933
24.03518.33956.427130.1260.57498.508
32.36110.73267.160140.1150.52199.029
42.1349.70076.860150.0560.25499.283
51.6087.31084.170160.0510.23099.513
60.9734.42388.593170.0400.18499.697
70.6062.75491.347180.0300.13899.835
80.4712.14193.488190.0160.07199.906
90.3471.57695.064200.0120.05499.961
100.2831.28796.350210.0050.02299.982
110.1860.84397.194220.0040.018100.000
Table 7. The first 5 principal component loadings of 22 mineral elements in H. officinalis.
PC1PC2PC3PC4PC5
Na0.0070.35−0.1130.171−0.009
Mg0.2760.105−0.2230.0830.176
K−0.002−0.165−0.1720.2910.557
Ca0.0670.19−0.297−0.4990.052
V0.307−0.130.196−0.01−0.012
Cr−0.050.2720.3230.1860.22
Mn0.2770.005−0.1380.33−0.055
Fe0.0040.3650.3230.185−0.062
Co0.1930.1290.4330.061−0.016
Ni0.2120.138−0.2450.3140.013
Cu0.229−0.0470.039−0.1580.277
Zn−0.0060.247−0.1620.106−0.561
Sr0.1870.293−0.105−0.2430.286
Sn0.301−0.1940.0410.016−0.134
Al0.0010.3780.247−0.080.115
Ti−0.2480.2250.113−0.1050.186
Ga0.313−0.0110.116−0.173−0.016
Cd0.1670.233−0.3030.1490.114
Ba0.1970.163−0.073−0.413−0.1
Tl0.296−0.1330.252−0.0450.07
Pb0.2740.182−0.0550.112−0.166
Bi0.311−0.1770.122−0.01−0.076
Disclaimer/Publisher’s Note: The statements, opinions and data contained in all publications are solely those of the individual author(s) and contributor(s) and not of MDPI and/or the editor(s). MDPI and/or the editor(s) disclaim responsibility for any injury to people or property resulting from any ideas, methods, instructions or products referred to in the content.

