Article

Identification and Quantification of Carotenoids in White and Yellow-Fleshed Peaches (Prunus persica (L.) Batsch) by QTRAP+ LC-MS/MS

1
School of Biological and Chemical Engineering, Ningbo Tech University, Ningbo 315100, China
2
National & Local Joint Engineering Laboratory of Intelligent Food Technology and Equipment, College of Biosystems Engineering and Food Science, Zhejiang University, Hangzhou 310058, China
*
Author to whom correspondence should be addressed.
These authors contributed equally to this work.
Horticulturae 2025, 11(4), 376; https://doi.org/10.3390/horticulturae11040376
Submission received: 8 February 2025 / Revised: 21 March 2025 / Accepted: 24 March 2025 / Published: 31 March 2025
(This article belongs to the Section Fruit Production Systems)

Abstract

:
This study aimed to characterize carotenoid profiles and unravel the genetic mechanisms underlying flesh color variation in white and yellow-fleshed peaches, with a focus on the hybrid cultivar ‘ZY29’ derived from two white-fleshed parents (‘Yulu’ and ‘Hujing Honey Dew’). Using UPLC-APCI-MS/MS, we quantified carotenoids in the pericarp (exocarp) and flesh (mesocarp) of parental and hybrid fruits. Results showed that ‘ZY29’ accumulated significantly higher levels of β-carotene and lutein compared to its white-fleshed parents. Transcriptome analysis revealed upregulation of carotenoid biosynthesis genes (PSY, LCYB, and ZDS) and downregulation of the carotenoid cleavage gene CCD4 in ‘ZY29’, explaining enhanced carotenoid accumulation. Integrative metabolome-transcriptome analysis identified core regulatory networks associated with metabolic shifts, including transcription factors (MYB and WRKY). These findings provide novel insights into the molecular basis of yellow flesh formation in peaches, offering potential targets (PSY and LCYB) and metabolic markers (β-carotene and lutein) for breeding nutritionally enriched cultivars. These findings contribute to a better understanding of the genetic factors and parental regulatory mechanisms involved in the formation of yellow flesh color in peaches. Our results have important implications for breeding new peach varieties with desirable color and nutritional qualities and may provide valuable insights for future research in this area.

1. Introduction

The coloration of peach fruit varies significantly, with distinct hues among cultivars primarily determined by differences in pigment composition. The color of peach fruit can be roughly divided into white, yellow, red, half-red and half-yellow. Carotenoids and anthocyanins play a major role in the formation of pigments in yellow and red-fleshed peach fruits, respectively. The carotenoid components and contents in the fruits of different varieties of yellow-fleshed peaches vary greatly [1,2,3].
Carotenoid is one of the main coloring substances of fruits and the main reason why peach fruits are yellow [4,5,6]. Yellow-fleshed peaches are generally divided into light yellow, golden yellow and orange varieties. The color presentation of different fruits is related to the total content of carotenoids [7]. Among them, the content of carotenoids in orange-yellow varieties was the highest, and that in light yellow varieties was the lowest. The study found that the skin and flesh of yellow-fleshed peach mainly contained lutein, zeaxanthin, β-cryptoxanthin, α-carotenoids and β-carotene [8]. At present, the main pathway of carotenoid metabolism has been gradually clarified through research in biochemistry, classical genetics, and molecular biology [9,10,11,12]. The accumulation of carotenoid during plant fruit ripening is highly regulated by carotenoid biosynthetic genes, including oxygen-containing carotenoid upstream synthetic genes (PSY, PDS, ZDS, CRTISO, LCYB, and LCYE) and downstream synthetic genes (HYB and ZEP) [13,14,15,16]. There are many reports that carotenoid metabolism is regulated by gene transcription level. For example, in tomatoes, the excessive expression of the cyclooxygenase gene (LCYB) can lead to significant changes in β-lycopene in tomato fruit. A large amount of carotene is accumulated while the expression of the lycopene-δ-carotene gene (LCYE) increases [17]. Compared with the yellow-fleshed honey peach, white peaches have lower carotenoid levels in the pericarp and flesh, which may be related to the differential expression of the PpCCD4 gene. In yellow-fleshed honey peaches, the accumulation of carotenoids during pericarp development is partially related to the transcriptional regulation of PpFPPS, PpGGPS, PpLCYB, and PpCHYB. However, in the flesh, its accumulation may also be related to the increased transcription of PpPDS and the four genes mentioned above [18]. In addition, the carotene content of persimmon fruit meat is greatly affected by PSY and LCYB genes, especially PSY. Overexpression of the PSY gene can increase the content of lycopene, zeaxanthin and α-carotene, while silencing the PSY gene has significantly reduced the content of lycopene, β-carotenoids, zeaxanthin, and α- carotene [19].
Regarding carotenoid synthesis in peach fruit, farnesyl pyrophosphate synthase (FPPS) is the key enzyme to start carotenoid synthesis in peach fruit, and its expression level affects the synthesis of carotenoid substances in fruit. Some studies have found that the expression level of FPPS in peach fruit pericarp is significantly higher than in fruit flesh. There is a correlation between the PSY gene and carotenoid content in peach flesh. During fruit ripening, the expression of PSY has raised with the increase of carotenoid content [20]. Some studies have also shown that the octahydronenenebc lycopene dehydrogenase gene (PDS) may be the key gene regulating the accumulation of carotenoids in peach fruit. In recent years, some studies have found that CCD4 is a key gene with degrading β-carotenoids controlling the yellow and white flesh color of peach fruits. [21,22]. In wild-type petunias, the loss of CCD4 expression will lead to the accumulation of more carotenoids [23]. There are two main views on the regulation of CCD4 on the accumulation of carotenoids in yellow and white-fleshed peaches. One is that there is no difference in the expression of CCD4 in yellow and white-fleshed peaches. The appearance of yellow flesh is due to the disorder of the function of the coding protein caused by the mutation of this gene, which blocks the carotenoid degradation pathway, leading to the accumulation of carotenoids in the flesh, and finally, the flesh turns yellow. The other is that there are differences in the expression of CCD4, resulting in the difference in the synthesis of carotenoids in the yellow and white varieties [24].
The process of fruit growth and development is complex and holistic, and single metabonomics or transcriptome data cannot systematically analyze the development process. The conjoint analysis of metabolome and transcriptome data can not only verify each other but also provide us with a panoramic window to understand the biological activity process. In recent years, a large number of differentially expressed genes (DEGs) obtained from transcriptome sequencing and differential metabolites (DEMs) obtained from metabolomic analysis have received more and more attention for association analysis. Through conjoint analysis among genomics, the relationship between genes and phenotypes can be quickly established, and the internal changes of organisms can be analyzed from both the cause and result levels. Meanwhile, key gene targets, metabolites, and metabolic pathways can be identified by building a core regulatory network to systematically and comprehensively analyze the complex mechanisms of plant growth and explain biological issues as a whole.
This study was conducted through ‘Yulu’ × ‘The hybrid breeding of ‘Hujing Honey Dew’ has resulted in the breeding of a yellow-fleshed peach variety, ‘ZY29’, which has excellent properties with a good appearance and color. The maturity period of ‘ZY29’ is in early August, with a soluble solid content of about 15.5%. In the case where both parents are originally white flesh, the flesh of the offspring fruit is yellow. This study compared the content of carotenoids in fruits to explain the difference in genetic metabolism between white and yellow meat peaches, as well as the regulatory role of parents in the formation of representative characteristics of offspring. Analyzing the color formation mechanism of the yellow meat peach has laid a theoretical foundation for its genetic law, parental cooperative regulation mechanism, and the breeding of new varieties of characteristic fruits.

2. Materials and Methods

2.1. Materials and Sampling

The materials used in this study are located in Cicheng Town, Jiangbei District, Ningbo City, Zhejiang Province, China (E120°55′–122°16′, N28°51′–30°33′). ‘Lakeview Honey Dew (HJ)’, ‘Yulu’ (YL), and their hybrids ‘ZY29’ (Yulu × Lake view, yellow fruit) are the test material (Figure 1). The age of the trees in the test garden is 10 years. Three trees were selected for each variety to harvest fruits, with 10 fruits per tree as one repeat for a total of three replicates. The contents of carotenoids and transcriptome measured in the pericarp (P) and flesh (F) of parents and offspring were determined. The pericarp specifically refers to the exocarp, while the flesh refers to the mesocarp tissue.

2.2. Detection and Quantification of Carotenoids

Our plan is to adopt a design of sampling at 10-day intervals after anthesis (covering multiple time points), which can completely capture the transition nodes of each stage. Finally, the fruits at the mature stage are selected for metabolite determination. The sample was freeze-dried, ground into powder (30 Hz, 1.5 min), and stored at −80 °C until needed. An amount of 50 mg powder was weighed and extracted with 0.5 mL mixed solution of n-hexane: acetone–ethanol (1:1:1, v/v/v). The extract was vortexed for 20 min at room temperature. The supernatants were collected after being centrifuged at 12,000 r/min for 5 min at 4 °C. The residue was re-extracted by repeating the above steps under the same conditions, then evaporated to dryness and reconstituted in a mixed solution of MeOH/MTBE (1:1, v/v). The solution was filtered through a 0.22 μm membrane filter for further LC-MS/MS analysis.
The sample extracts were analyzed using a UPLC-APCI-MS/MS system (UPLC, ExionLC™ AD; MS, Agilent 6470 Triple Quad LC/MS, Agilent Technologies, Santa Clara, CA, USA). The analytical conditions were as follows: LC: column, YMC C30(3 μm, 100 mm × 2.0 mm i.d); solvent system, methanol: acetonitrile (1:3, v/v) with 0.01% BHT and 0.1% formic acid (A), methyl tert-butyl ether with 0.01% BHT (B); gradient program, started at 0% B (0–3 min), increased to 70% B (3–5 min), then increased to 95% B (5–9 min), finally ramped back to 0% B (10–11 min); flow rate, 0.8 mL/min; temperature, 28 °C; injection volume: 2 μL.

2.3. Metabolome Data Analysis

The HCA (hierarchical cluster analysis) results of samples and metabolites were presented as heatmaps with dendrograms. HCA was carried out using the R package’s 1.0.12 pheatmap. For HCA, normalized signal intensities of metabolites (unit variance scaling) are visualized as a color spectrum. Significantly regulated metabolites between groups were determined by absolute Log2FC (fold change).
Identified metabolites were annotated using the KEGG compound database (http://www.kegg.jp/kegg/compound/, accessed on 23 February 2024); annotated metabolites were then mapped to the KEGG Pathway database (http://www.kegg.jp/kegg/pathway.html, accessed on 8 June 2024). Pathways with significantly regulated mapped metabolites were then fed into MSEA (metabolite sets enrichment analysis); their significance was determined by the hypergeometric test’s p-values.

2.4. RNA-Seq Transcriptome Sequencing

Samples were sent to BGI (Wuhan) for sequencing. The total RNA was treated with mRNA enrichment or rRNA removal. For mRNA enrichment, the mRNA with a poly-A tail was enriched with magnetic beads harboring Oligo(dT). For rRNA removal, rRNA was hybridized with a DNA probe. The DNA/RNA hybridization chain was selectively digested with RNaseH, and the DNA probe was used with DNaseI to obtain the required RNA sample after purification. The obtained RNA was fragmented with fragmentation buffer and, using random N6 primers was reverse transcribed. The cDNA was then synthesized to form double-stranded DNA. The end of the synthesized double-stranded DNA was flattened and phosphorylated at the 5′ end; the 3′ end formed a sticky end with a protruding “A” and was then connected at a bubble joint with a protruding “T” at the 3′ end. The ligation products were amplified by PCR with specific primers. The PCR product was thermally denatured into a single strand, and then a bridge primer was used to cyclize the single-strand DNA to obtain a single-strand circular DNA library. Finally, the DNA was sequenced. Reference genome version: GCF_000346465.2_Prunus_persica_NCBIv2. The fragments per kilobase of exon model per million mapped reads (FPKM) value was used to measure the abundance value of gene expression, and the influence of gene length and sequencing volume differences on gene expression was eliminated. The calculated gene expression levels could be directly used to compare the gene expression differences among different samples. The screening standards of differentially expressed genes (DEGs) were a p-value < 0.05 and fold-change > 2 or fold-change < 0.5. The gene ontology (GO) gene function annotation and Kyoto Encyclopedia of Genes and Genomes (KEGG) pathway enrichment analysis were conducted for the selected DEGs.

2.5. Integration Analysis of the Metabolite and Transcriptome

Genome sequencing was performed at the mRNA and metabolite levels based on gene expression information, and two sets of data were integrated according to data classification and correlation level to study the gene expression process. For this project, all differential genes and metabolites were selected to establish the O2PLS model, and the variables with high correlation and weight in different data groups were preliminarily judged through the load map to screen out the important variables that affect the other omics.

2.6. qRT–PCR

The total RNA of experimental materials was extracted using the RNAprep Pure Polysaccharide Polyphenol Plant Total RNA Extraction Kit (Tiangen, Beijing, China), and fluorescent cDNA was synthesized according to the instructions for the Novoscript Plus All-in-One 1st Strand cDNA Synthesis Supermix (gDNA purge) reverse transcription kit. qRT–PCR analysis was performed according to the instructions for the Novostart SYBR qPCR Supermix Plus (Novogene Technology Co., Ltd., Beijing, China.) kit. The reaction system included 35 μL of 2 × Novostart SYBR qPCR Supermix plus 1.4 μL each of the forward and reverse primers, 1.4 μL of fluorescent cDNA, and 30.8 μL of ddH2O for a total volume of 70 μL. The reaction procedure was as follows: predenaturation at 95 °C for 5 min, followed by 30 cycles of 95 °C for 1 min, 95 °C for 20 s, and 60 °C for 1 min. The relative expression level of the genes was determined using the 2−ΔCT method using 18S rRNA as the respective reference gene.

3. Results

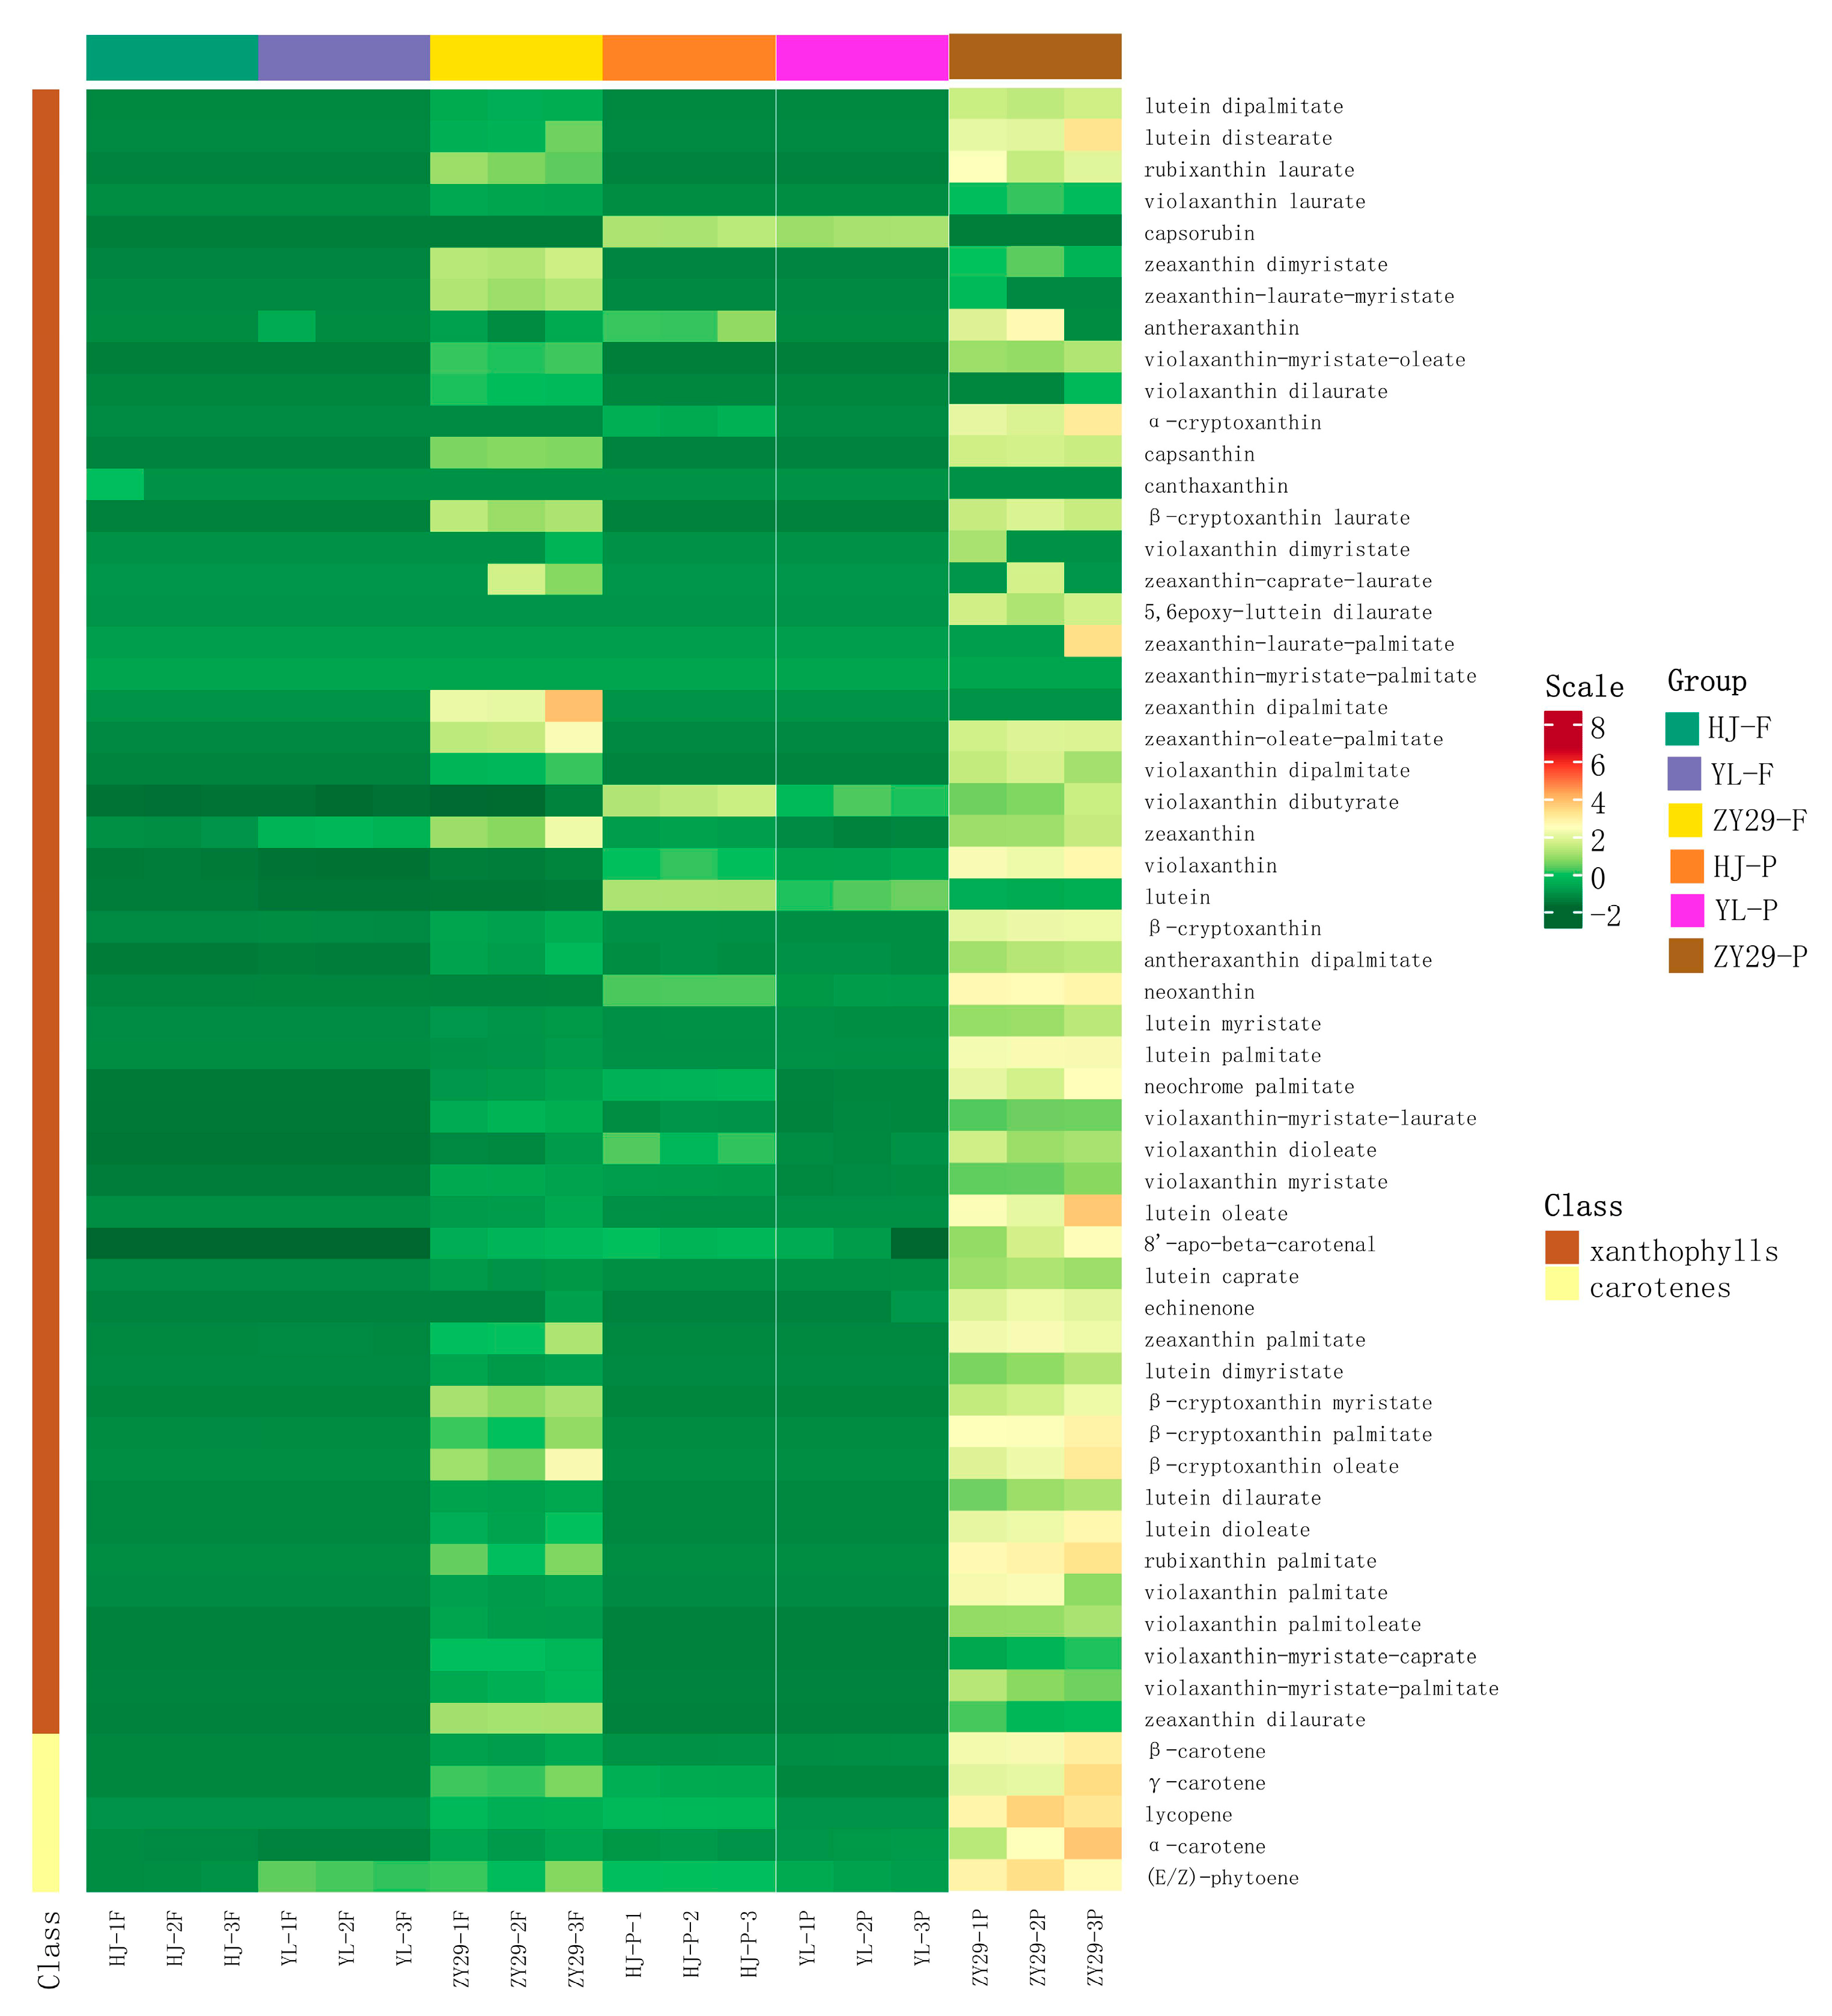
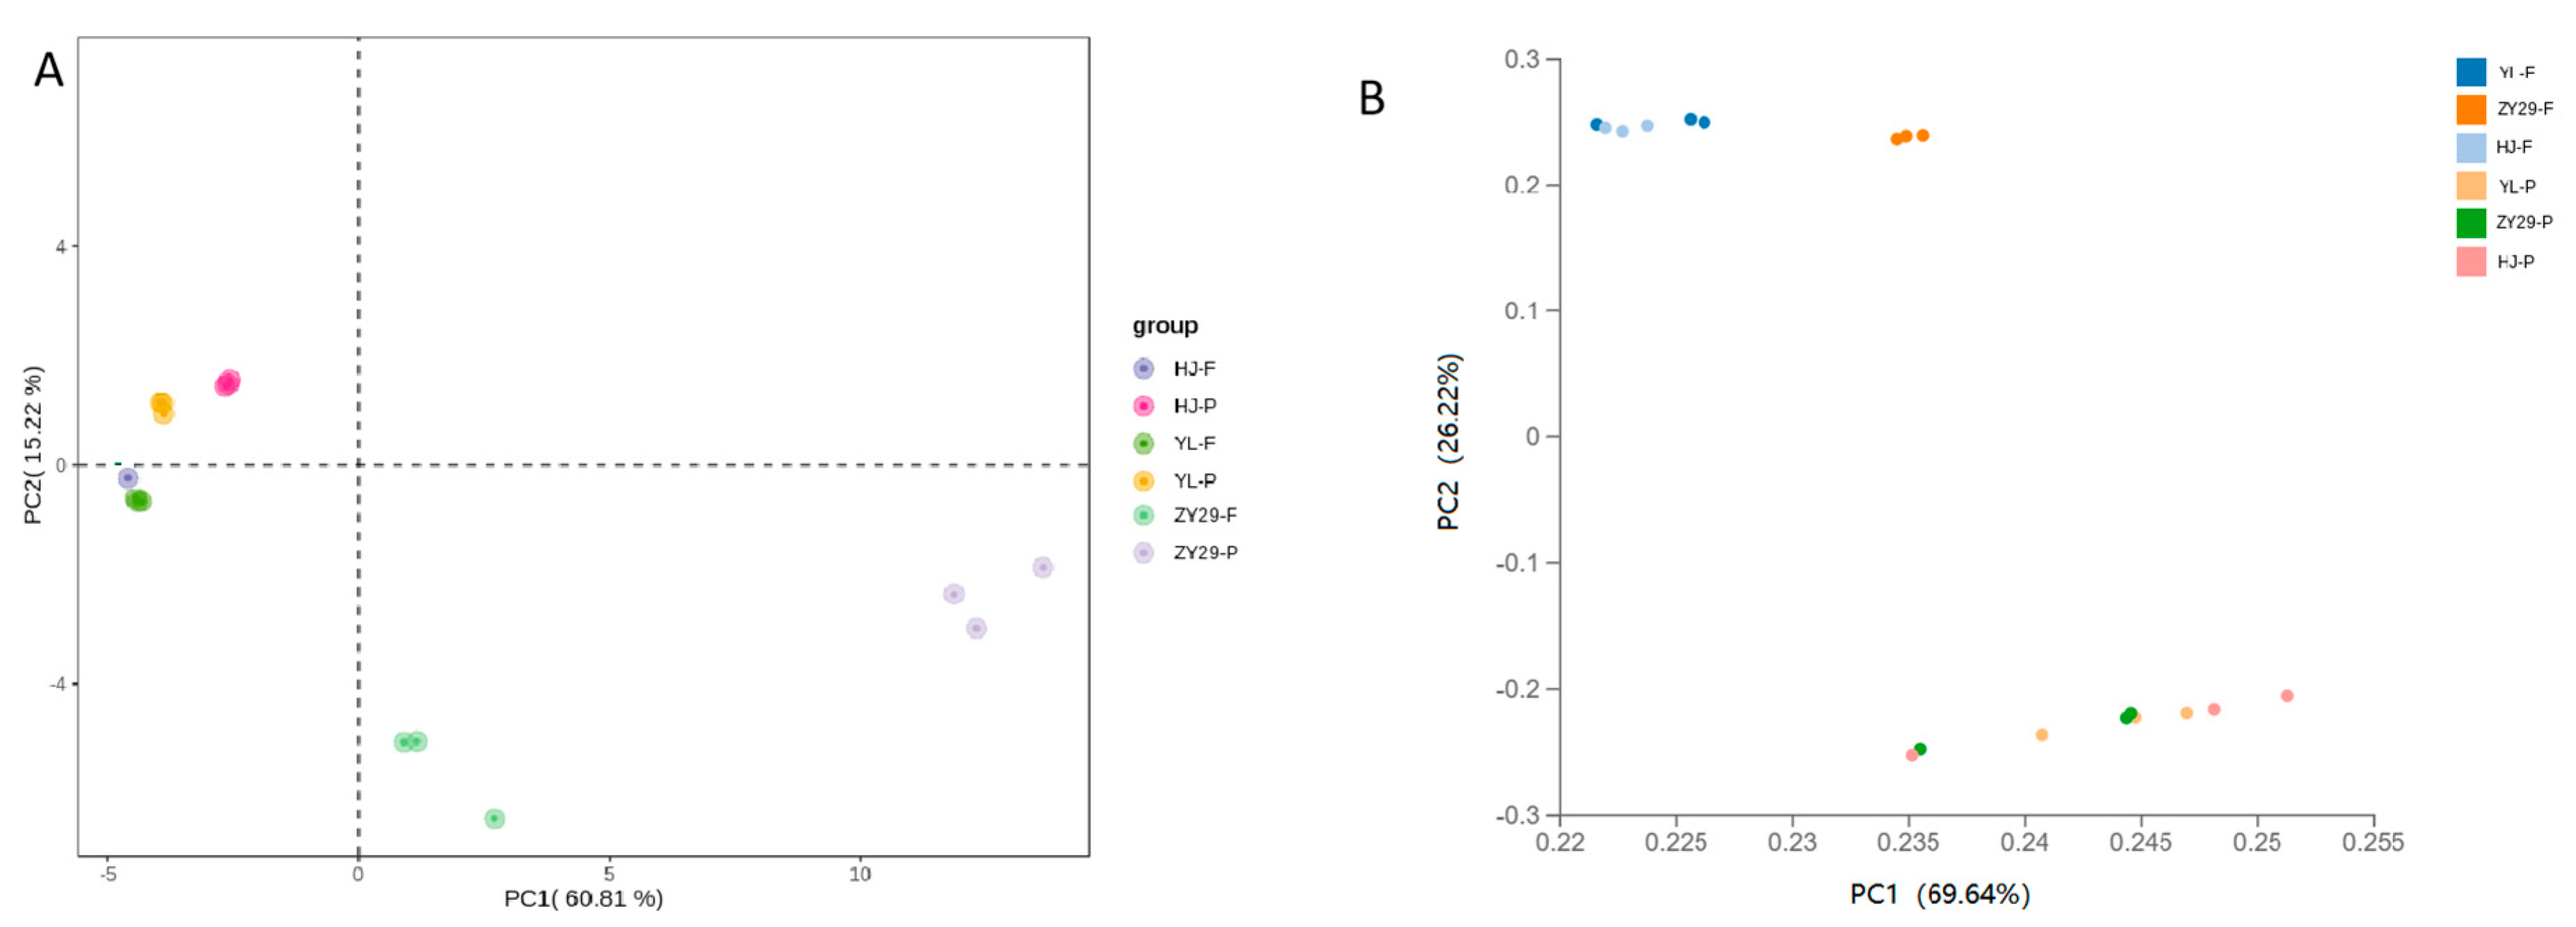
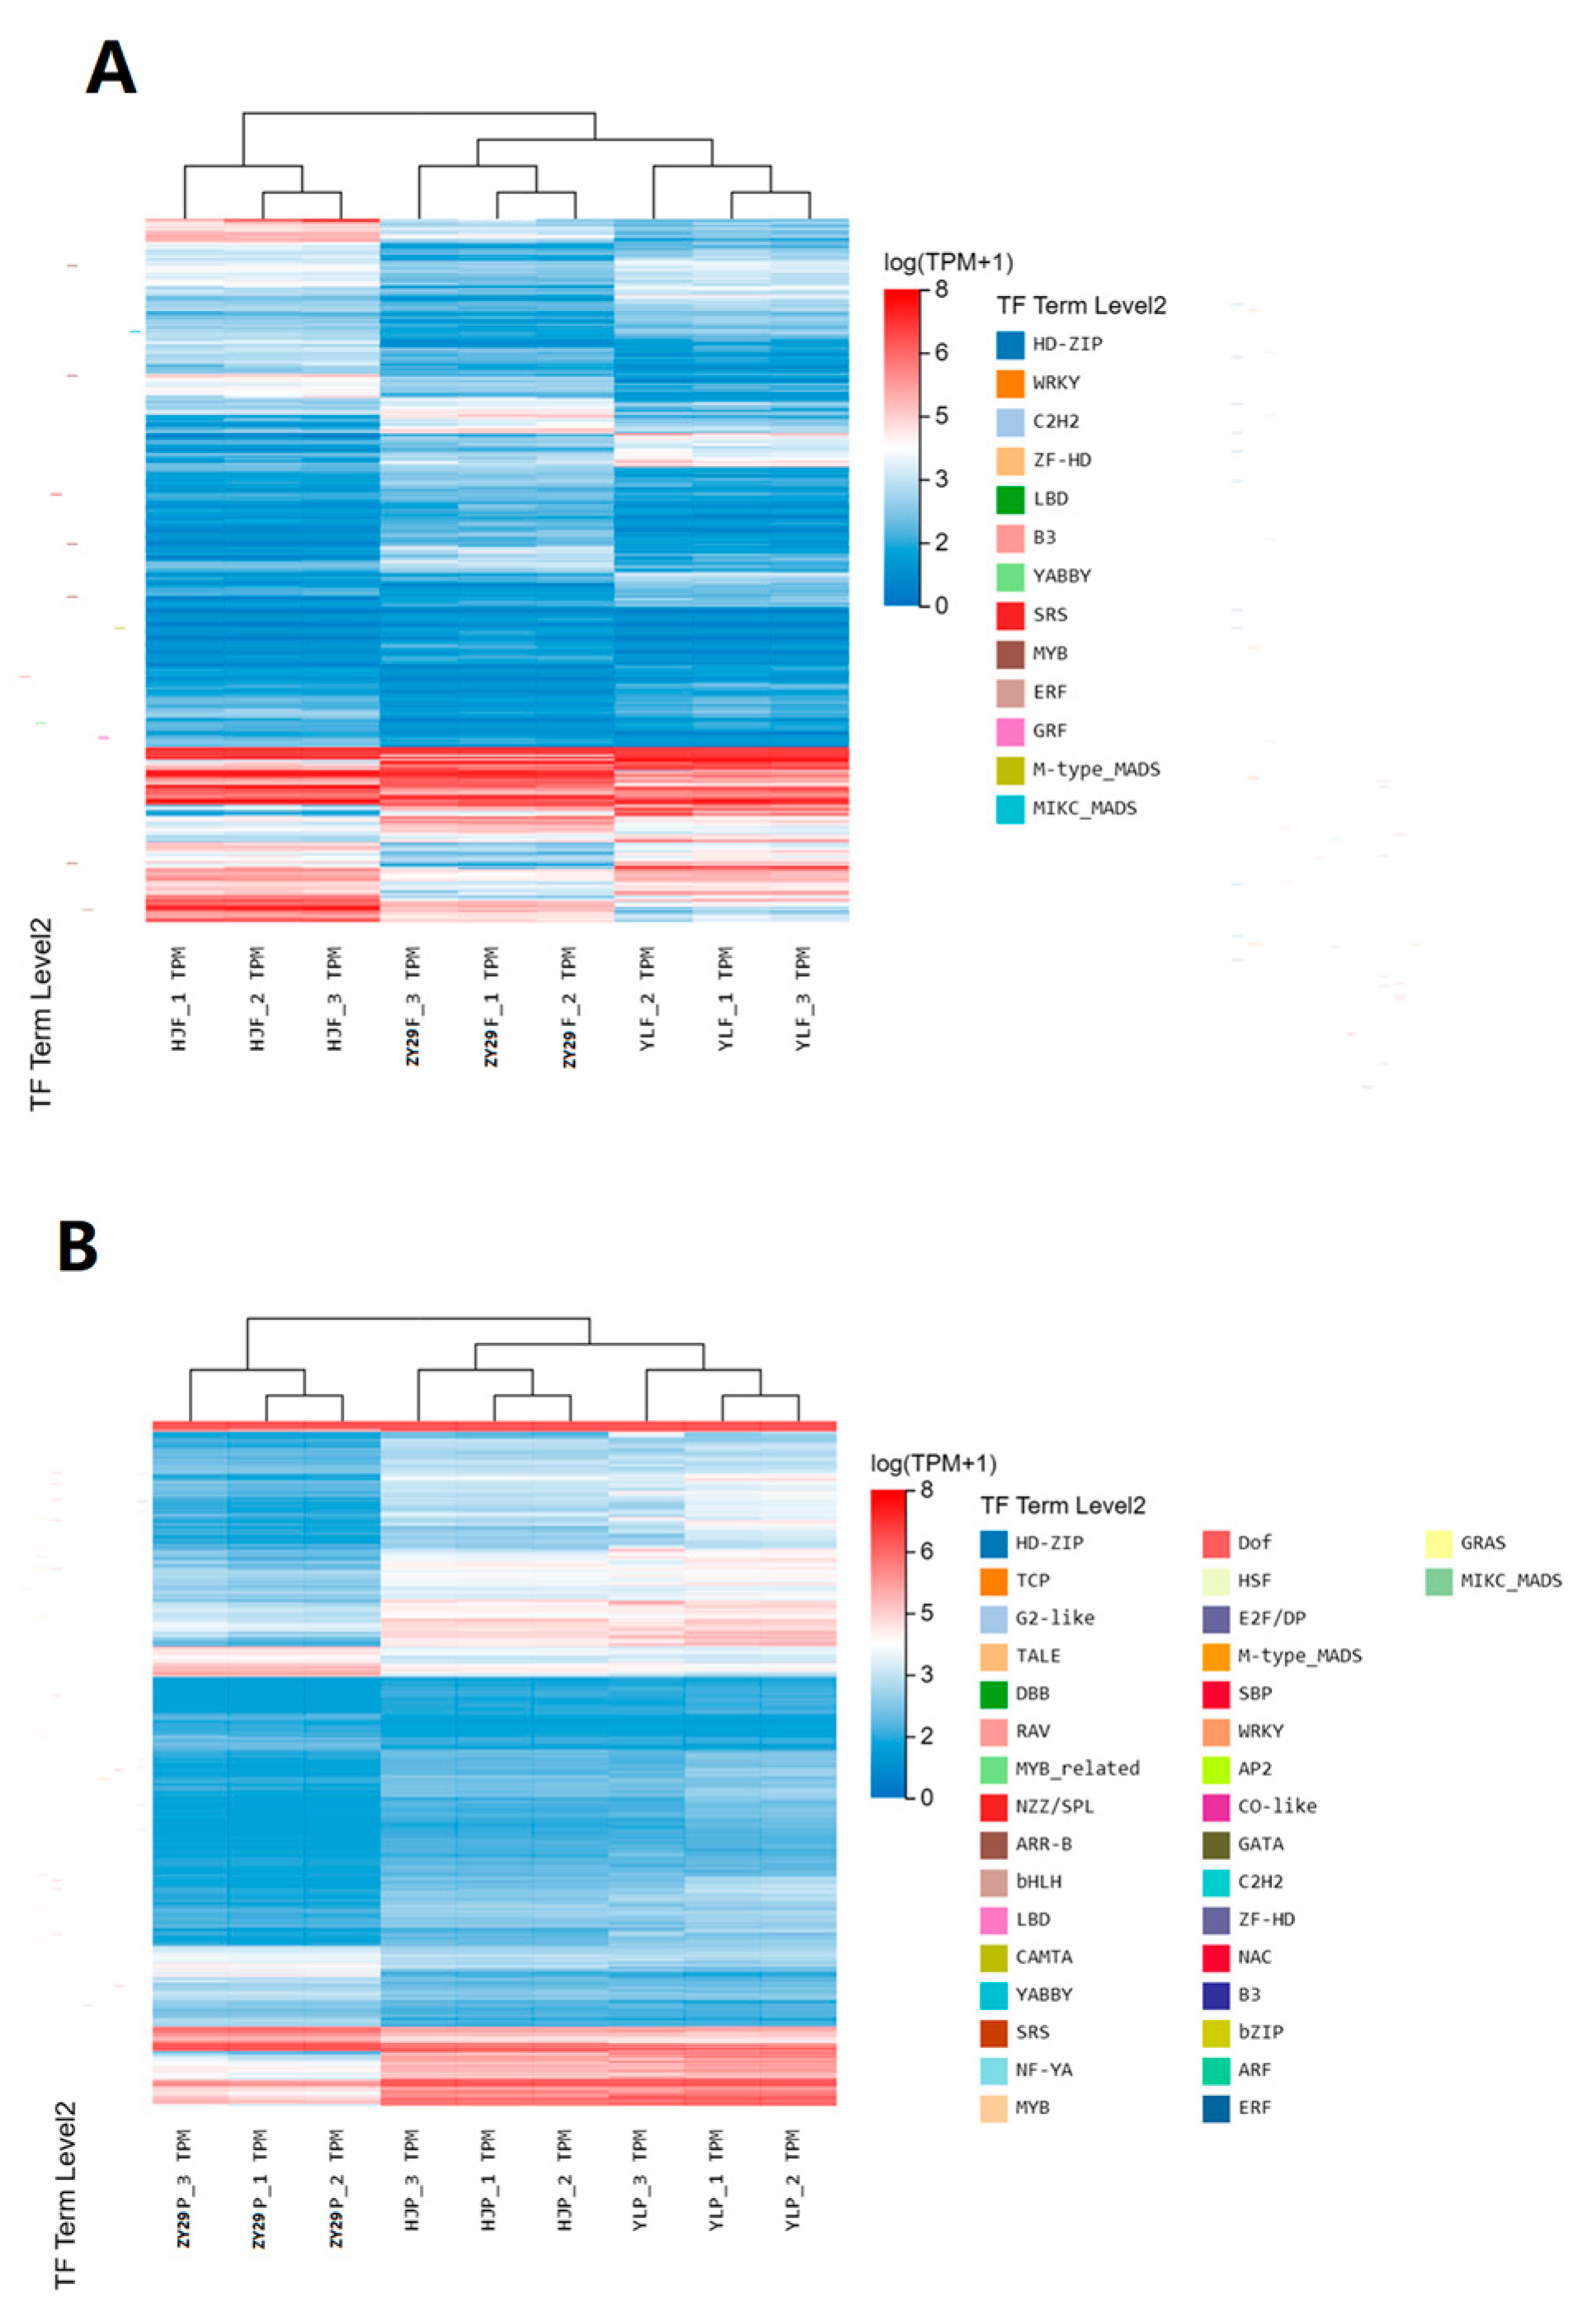
3.1. Transcriptome and Metabolome Analysis of Peach

Carotenoid metabonomics and transcriptome analysis were performed on the flesh (F) and pericarp (P) of HJ, YL, and ‘ZY29’. Three independent biological replicates were used for each sample of HJ-F, HJ-P, YL-F, YL-P, ‘ZY29’-F, and ‘ZY29’-P, resulting in 18 samples. In carotenoid metabonomics, five carotene and 31 luteins were detected. The metabolite content data were processed by UV (unit variance scaling). R software’s ComplexHeatmap package (2.16.2) was used to draw a heat map, and HCA was conducted on the accumulation mode of metabolites among different samples. It can be seen from the figure that there was no obvious difference between the parents’ metabolites (HJ and YL). The obvious difference was mainly concentrated in ‘ZY29’, which indicates that the carotenoids of the honey peach after hybridization changed (Figure 2). In transcriptome detection, a total of 120.5 GB of clean data was obtained. We sequenced 18 samples with the BGISEQ platform, generating about 6.69 Gb bases per sample on average. The percentage of the Q20 base value was over 94.94%, and the average mapping ratio with the gene was 86.99%. A total of 24,858 genes were identified. (Table 1).
Principal component analysis (PCA) was performed on the transcriptome and metabolism group, respectively, which visually showed that there were significant differences between the two groups of samples, explaining 60.81% and 69.64% of the total variation, respectively (Figure 3A,B). These results indicated that there were significant differences in metabolites and genes related to the carotenoid metabolism of peach flesh (F) and pericarp (P) between the HJ, YL, and ‘ZY29’. The PCAs of the variance-stabilized estimated raw counts were also conducted.

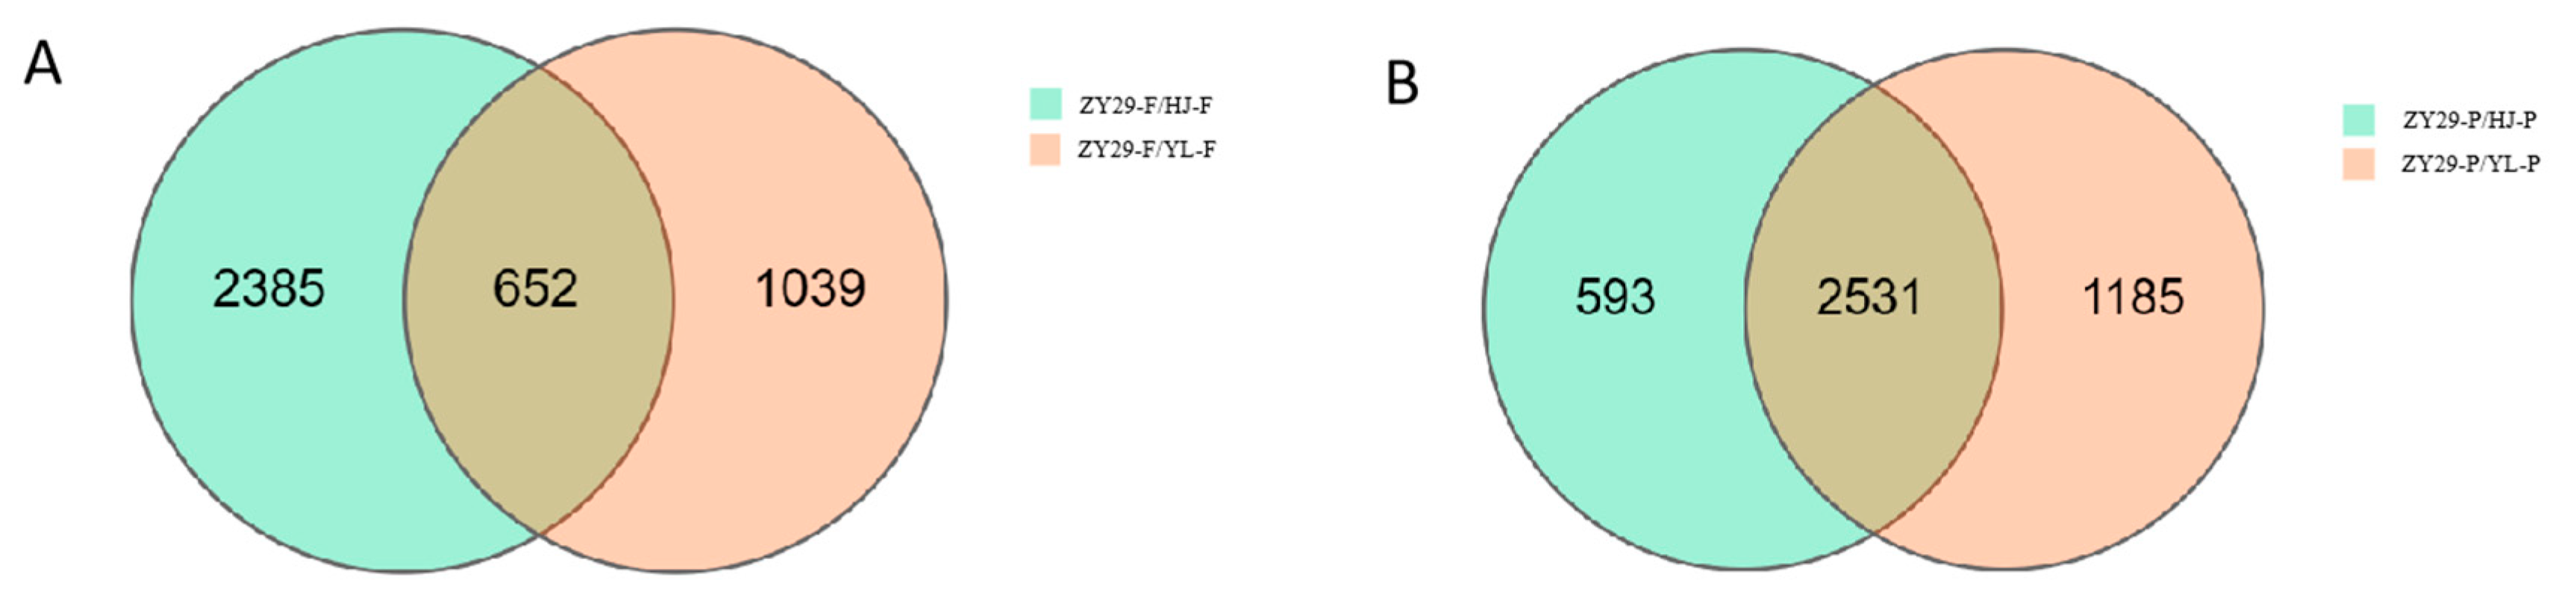
3.2. Identification of Differentially Expressed Unigenes

To identify the DEGs between ‘ZY29’ and its parents HJ and YL in the flesh and pericarp, the gene expression levels were estimated with the fragments per kilobase of exon per million fragments mapped (FPKM) values. The FPKM values in the flesh and pericarp were compared, and the DEGs were selected with the |log2Fold Change| ≥ 1 and false discovery rate (FDR) correction set at p < 0.05. A total of 652 common unigenes were identified in the flesh, and 2531 common unigenes were identified in the pericarp (Figure 4). A cluster analysis of the common DEGs between ‘ZY29’/HJ and ‘ZY29’/YL revealed significant differences in 652 common DEGs in the flesh and 2531 common DEGs in the pericarp. We also found differentially expressed transcription factors (TFs), mainly including C2H2, ERF, MYB, and WRKY and other transcription factors in the flesh, and TCP, bHLH, MYB, WRKY, and bZIP and other transcription factors in the pericarp. They were considered as predominant common differentially expressed TFs (Figure 5).

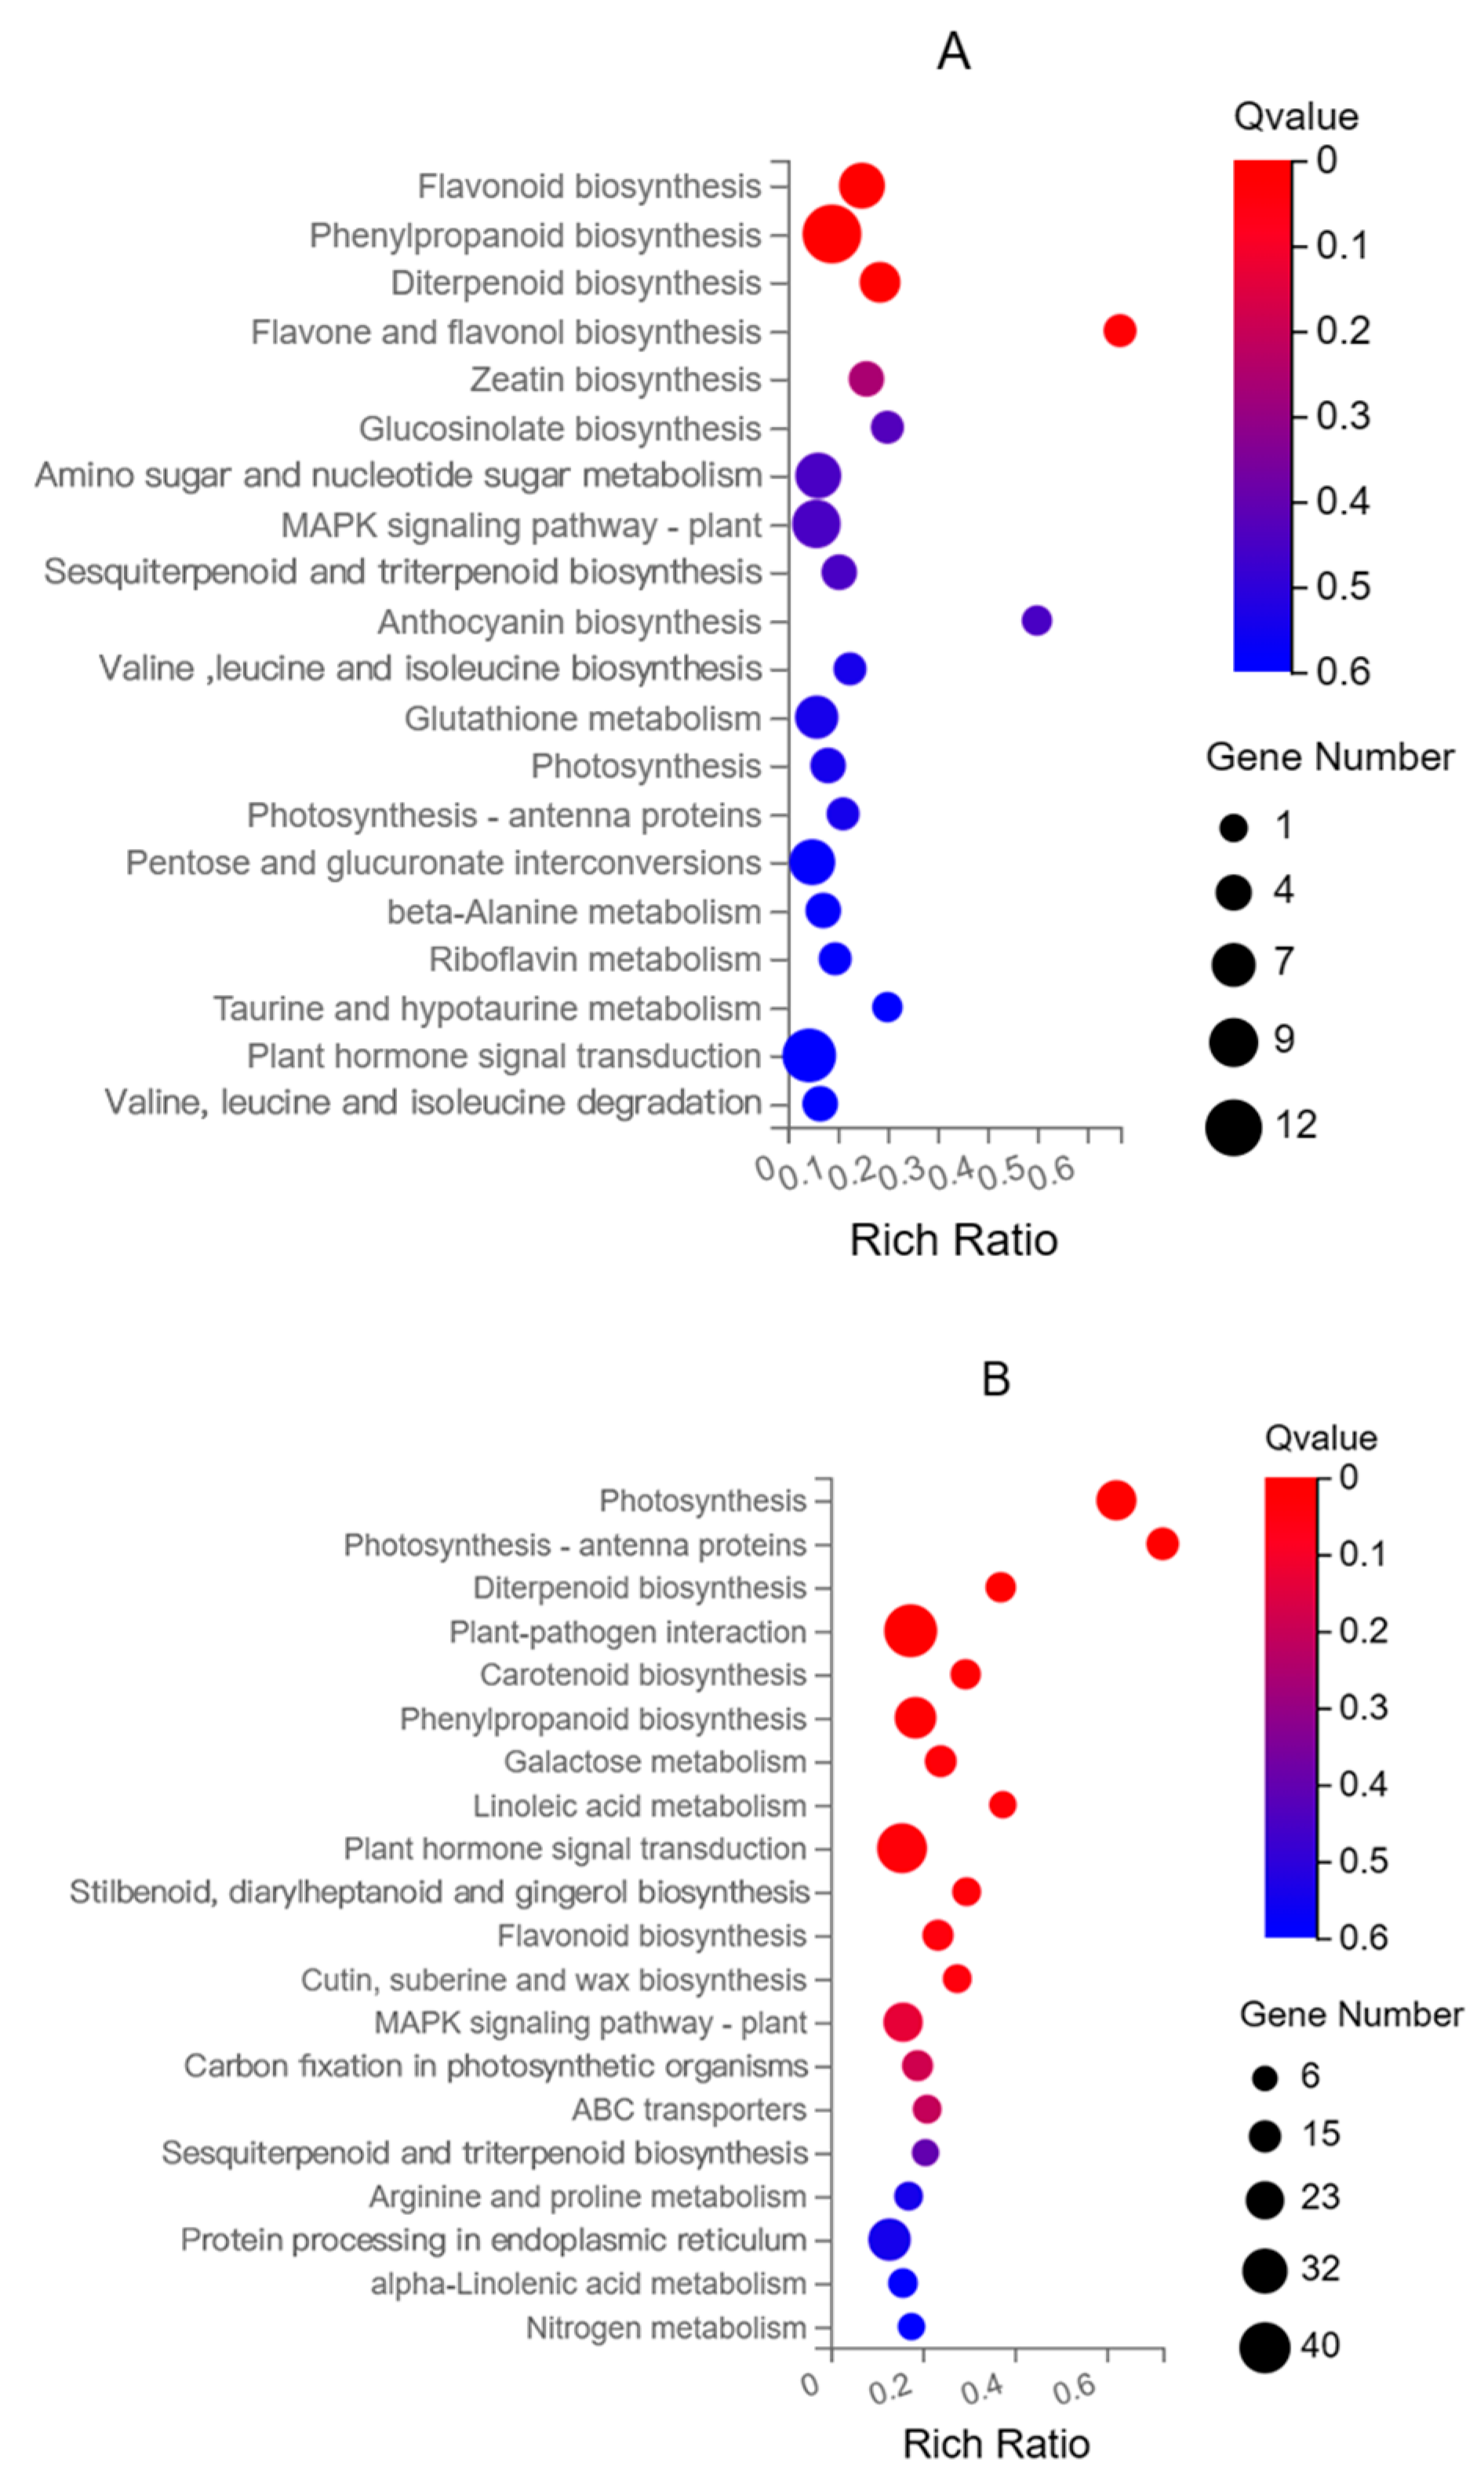
3.3. KEGG Enrichment Analysis of DEGs

In the flesh, we found that the common DEGs of ‘ZY29’/HJ and ‘ZY29’/YL were the most significantly enriched in flavonoid biosynthesis, phenylpropanoid biosynthesis, diterpenoid biosynthesis, flavone, and flavonol biosynthesis. In the pericarp, the common DEGs of ‘ZY29’/HJ and ‘ZY29’/YL were the most significantly enriched in photosynthesis, photosynthesis antenna proteins, diterpenoid biosynthesis, and carotenoid biosynthesis. The most enriched genes are found in plant–pathogen interactions and hormone signal translation (Figure 6)

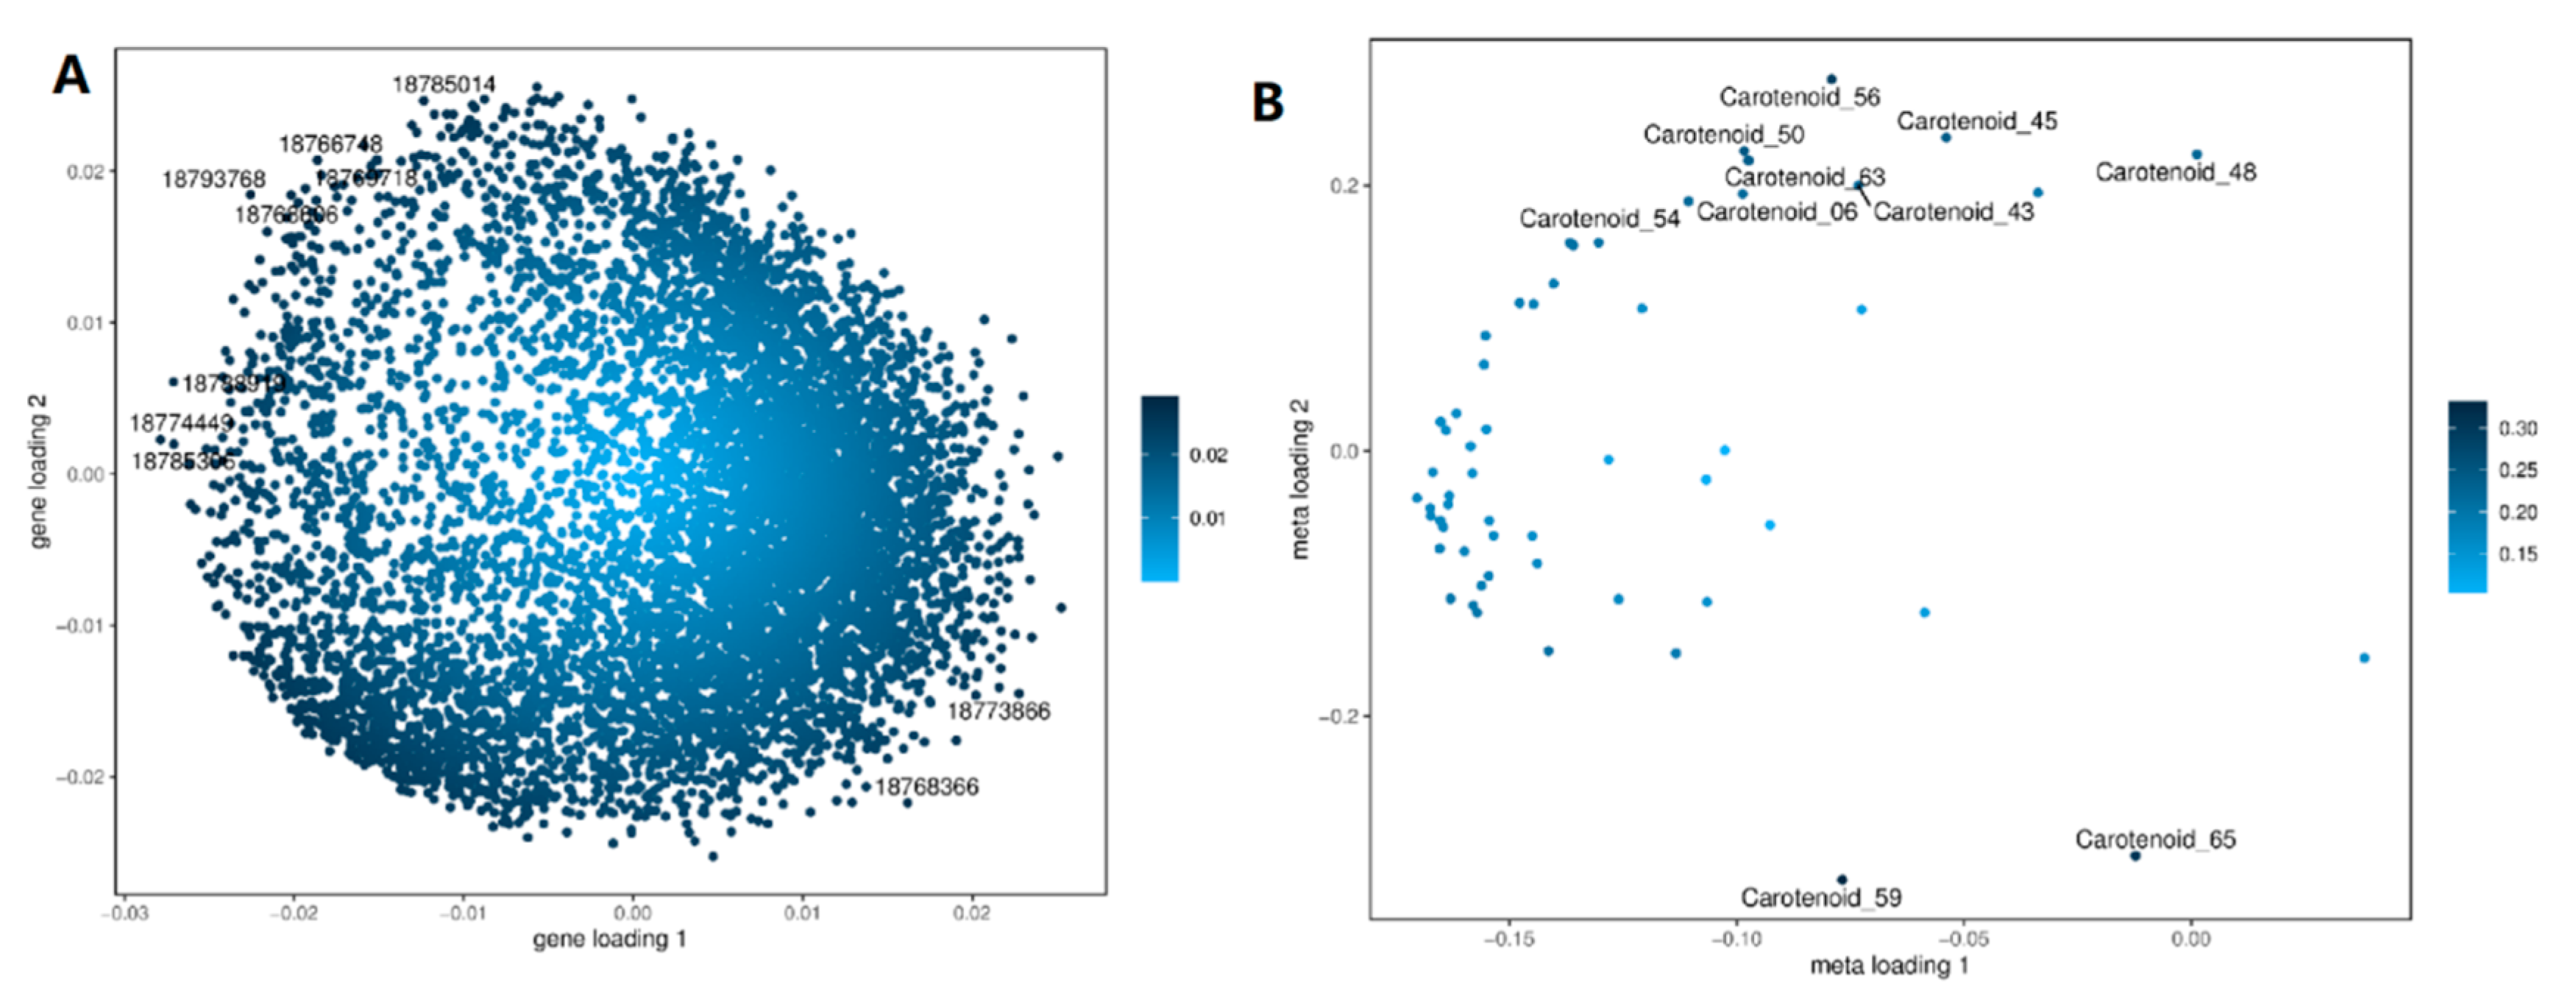
3.4. The Transcriptome and Metabolome Were Combined to Analyze the Metabolic Pathways Related to Peach Carotenoid

To quantitatively analyze the transcripts of metabolic pathways associated with the carotenoid, we performed a combined transcriptome and metabolome KEGG pathway enrichment analysis. The O2PLS model is used for integration analysis between two data groups, including the association between systems biology omics, the association between molecular regulation mechanisms and phenotypes, and other internal links of various big data groups (Figure 7). All differentially expressed genes and metabolites were selected to establish an O2PLS model, and variables with high correlation and weight in different data groups were preliminarily determined through load plots, screening out important variables that affect other omics. A total of 8441 genes were screened (Table S1), and the expression levels of the top ten genes were analyzed in each sample. The results showed that ‘ZY29’ had significant differences compared to HJ and YL, with its expression levels being significantly higher than those of HJ and YL (Figure S1). These genes may be related to the accumulation of carotenoids and may be the key genes for the yellowing of peach flesh.
To better understand the relationship between genes and metabolites, we mapped both DEGs and DAMs to the KEGG pathway map (Table S2); statistical screening HJ-F/‘ZY29’-F (Figure S2), HJ-P/‘ZY29’-P (Figure S3), YL-F/‘ZY29’-F (Figure S4), YL-P/‘ZY29’-P (Figure S5). The annotation of the KEGG database in metabolites with significant differences is shown in the figure. Only in the YL-F/‘ZY29’-F did the phytoene (PSY) remain unchanged, while the other components were upregulated. In HJ-F/‘ZY29’-F, the violaxanthin did not change but was significantly upregulated in the other components. Capsorubin was significantly downregulated in the pericarp but was not detected in the flesh. It is worth noting that antheraxanthin is upregulated in HJ-F/‘ZY29’-F and YL-P/‘ZY29’-P and downregulated in HJ-P/‘ZY29’-P and YL-F/‘ZY29’-F. The α-Carotene, lycope, γ-Carotene, β-Carotene, β-Cryptoxanthin myristate, and other eight metabolites were significantly upregulated in each component.

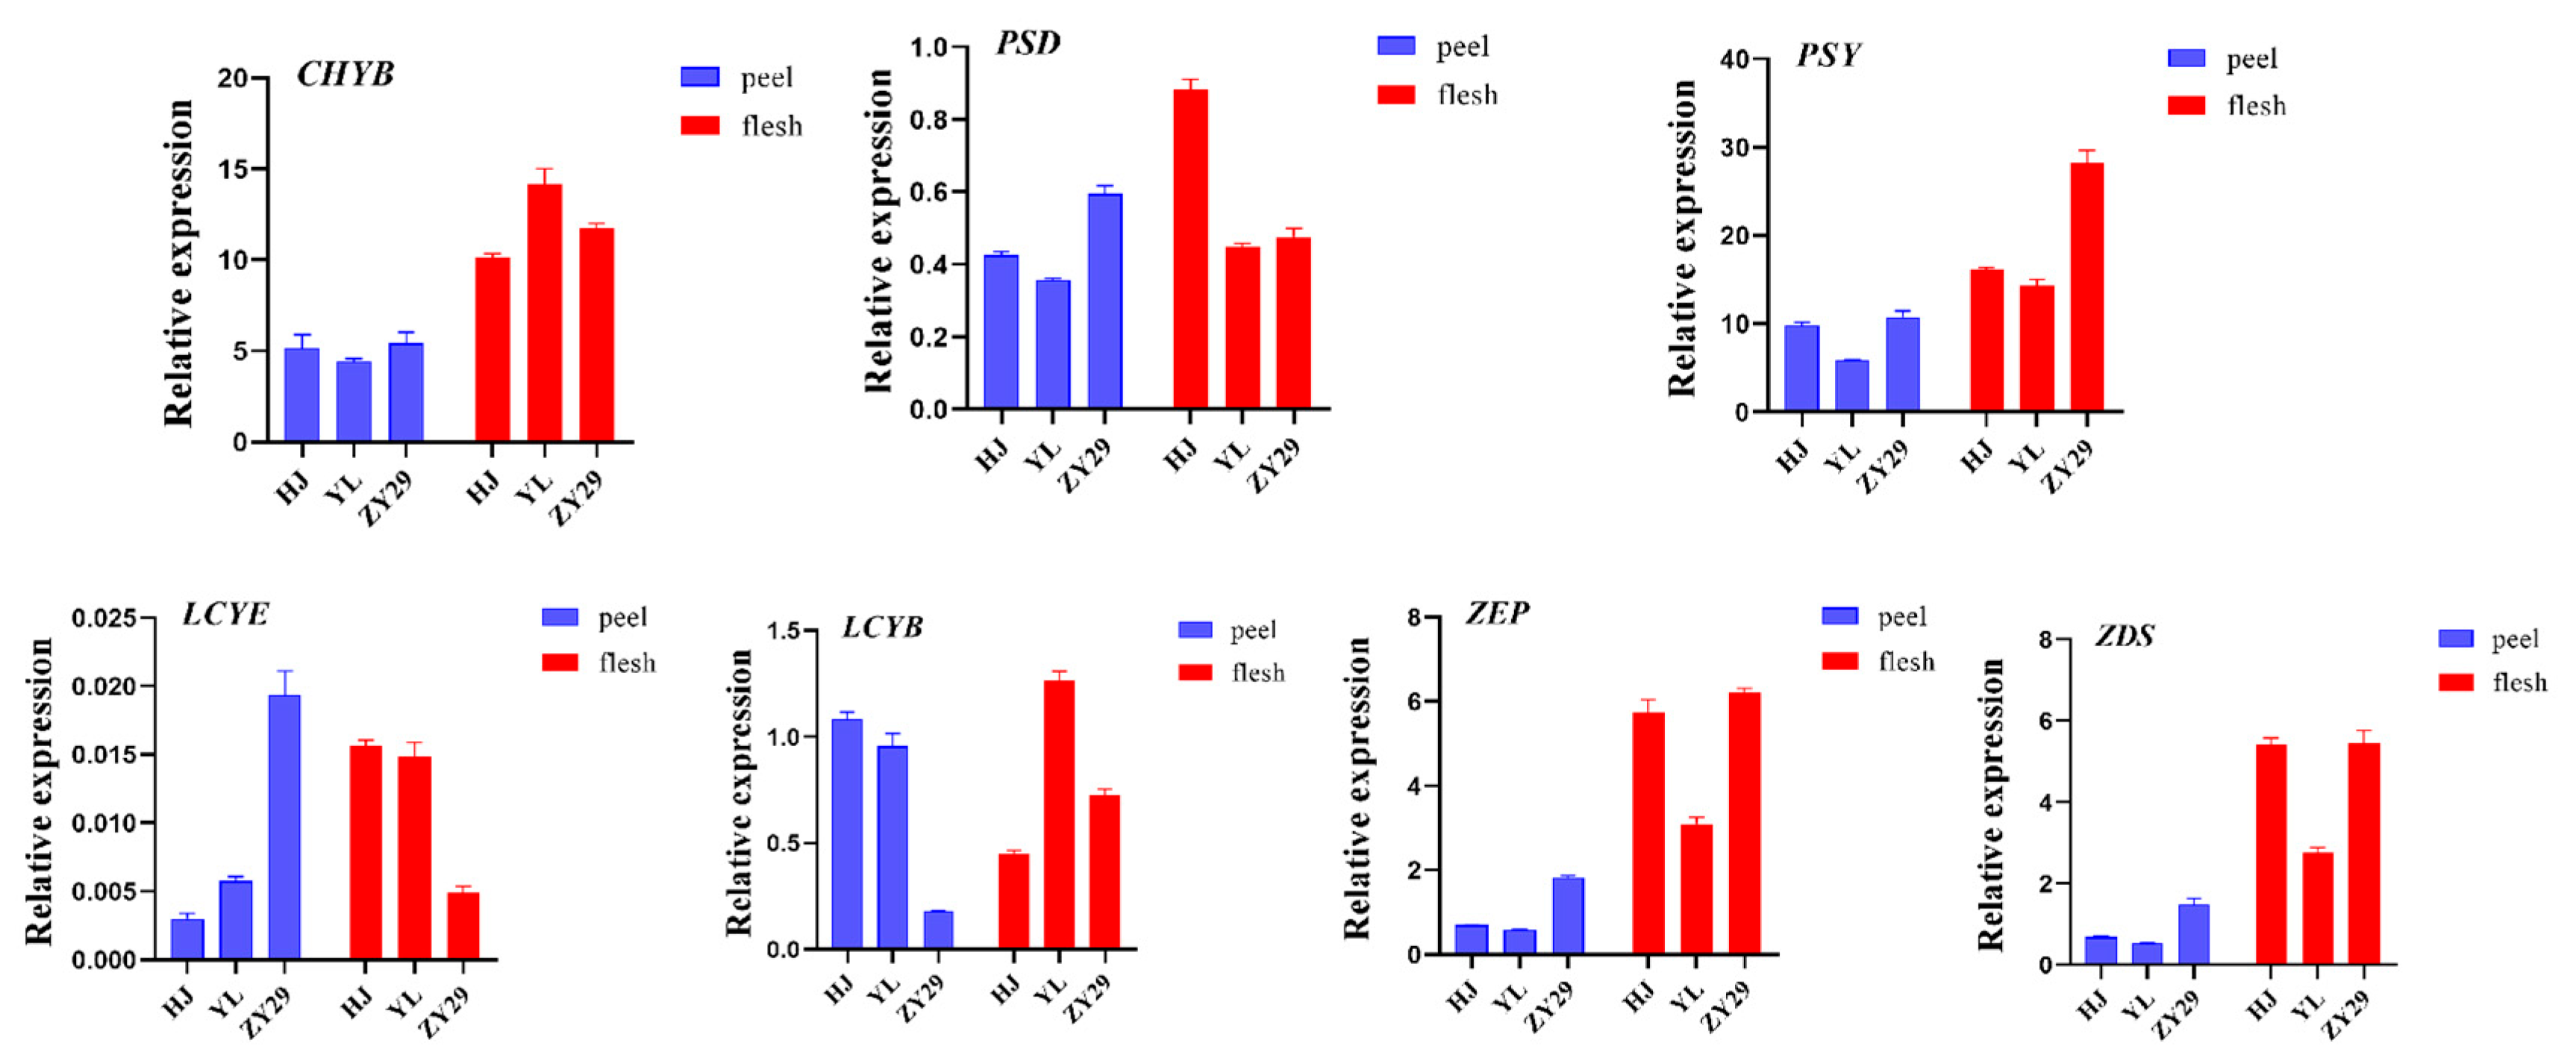
3.5. Real-Time Quantitative PCR Analysis

To verify the RNAseq results, HJ, YL, and ‘ZY29’ pericarp and fresh samples were verified by qPCR. The key genes of the carotenoid metabolic pathway, CHYB, PSD, PSY, LCYB, LCYE, ZEP, and ZDS were selected. The results showed that the expression trend of differentially expressed genes (DEGs) measured by qRT–PCR was consistent with the results of transcriptome sequencing, indicating that the transcriptome data were reliable (Figure 8). The primers used for qRT–PCR are listed in the Supplementary Materials (Table S3).

4. Discussion

Carotenoids, as a class of secondary metabolites widely distributed in nature, play a crucial role in plant growth and development. They contribute to the vibrant colors of plant petals, fruits, and leaves and are essential for attracting pollinators, enhancing reproductive success, and aiding in photosynthesis by capturing light energy and transferring it to chlorophyll. Additionally, carotenoids can be degraded to produce important aroma compounds, such as ionones, which further enhance the ecological functions of plants. In horticultural plants, the metabolic pathways of carotenoids have been well-characterized, and recent advances in omics technologies have enabled the identification and validation of key genes and their variations that regulate carotenoid metabolism. These studies have demonstrated that variations in the coding regions and promoters of structural genes within the carotenoid pathway can significantly alter gene function and transcriptional activity, leading to changes in carotenoid composition and content.
Our results from the transcriptome and metabolome analysis of the peaches (HJ, YL, and ‘ZY29’) provide further evidence supporting these findings. The carotenoid metabonomics analysis revealed significant differences in carotenoid profiles between the hybrid ‘ZY29’ and its parental lines (HJ and YL), particularly in the pulp flesh and pericarp peel tissues. This suggests that hybridization has led to notable changes in carotenoid metabolism, as evidenced by the differential accumulation of metabolites such as α-carotene, β-carotene, lycopene, and β-cryptoxanthin myristate. These findings align with previous studies in other plants, such as cauliflower, carrots, and chrysanthemums, where variations in key metabolic pathway genes, including PSY, have been shown to influence carotenoid synthesis and contribute to phenotypic diversity.
The transcriptome data further support this by identifying the DEGs and TFs associated with carotenoid metabolism. Notably, 652 common DEGs in the pulp flesh and 2531 common DEGs in the pericarp peel were identified between ‘ZY29’ and its parents. Among these, transcription factors such as MYB, WRKY, bHLH, and bZIP were differentially expressed, suggesting their potential regulatory roles in carotenoid biosynthesis. The upregulation of genes such as PSY in ‘ZY29’ compared to its parents further underscores the importance of genetic variation in driving carotenoid accumulation. This is consistent with findings in cassava and pepper, where variations in the PSY coding region have been linked to enhanced carotenoid synthesis and color diversity.
The integration of transcriptome and metabolome data through KEGG pathway enrichment analysis and the O2PLS model revealed strong correlations between gene expression and metabolite accumulation. For instance, the upregulation of key metabolites like α-carotene, β-carotene, and lycopene in ‘ZY29’ was associated with the differential expression of genes involved in the carotenoid biosynthesis pathway. These results highlight the potential of molecular marker-assisted breeding for improving carotenoid-related traits in peaches. By identifying and targeting key genes and their variations, it is possible to develop molecular markers for early selection, thereby accelerating the breeding process and achieving desirable traits such as enhanced fruit color and nutritional value.
In conclusion, our findings demonstrate that hybridization can significantly alter carotenoid metabolism in peaches, leading to distinct metabolite profiles and gene expression patterns. The identification of key genes and transcription factors associated with carotenoid biosynthesis provides valuable insights into the molecular mechanisms underlying these changes. These results not only contribute to our understanding of carotenoid metabolism in horticultural plants but also pave the way for the development of molecular tools for efficient breeding and trait improvement.

5. Conclusions

This study systematically analyzed carotenoid metabolism and transcriptional regulation in white and yellow-fleshed peaches, particularly focusing on the hybrid variety ‘ZY29’ derived from two white-fleshed parents. The key findings reveal that yellow-fleshed ‘ZY29’ accumulates significantly higher levels of β-carotene and lutein compared to its parents, attributed to upregulated expression of biosynthetic genes PSY, LCYB, and ZDS, combined with reduced carotenoid degradation due to functional mutations in CCD4. Transcriptome-metabolome integration identified core regulatory networks linking differential gene expression (e.g., MYB and WRKY transcription factors) to metabolite variations, providing mechanistic insights into color formation. These findings have practical implications for molecular breeding, as candidate genes and metabolic markers (β-carotene, lutein) can be leveraged to develop yellow-fleshed cultivars with enhanced nutritional value. Future research should validate gene functions via transgenic approaches, explore environmental/epigenetic influences, and develop early-stage molecular markers for marker-assisted selection. This work bridges genotype–phenotype gaps and advances strategies for improving fruit quality traits in horticultural crops.

Supplementary Materials

The following supporting information can be downloaded at: https://www.mdpi.com/article/10.3390/horticulturae11040376/s1. Figure S1: Analysis of differential gene expression patterns; Figure S2: HJ-F/‘ZY29’-F significant differential metabolite analysis; Figure S3: HJ-P/‘ZY29’-P significant differential metabolite analysis; Figure S4: YL-F/‘ZY29’-F significant differential metabolite analysis; Figure S5: YL-P/‘ZY29’-P significant differential metabolite analysis; Table S1: Differential impact genes; Table S2: Differential impact metabolites; Table S3: Primers for Real-time PCR.

Author Contributions

Conceptualization, W.Z.; Methodology, Y.J.; Writing—original draft, Y.G.; Writing—review & editing, Q.W.; Project administration, W.Z. All authors have read and agreed to the published version of the manuscript.

Funding

This research was supported by the International Cooperation Project of Ningbo Science and Technology Bureau of China (2023H021).

Data Availability Statement

Data is contained within the article and Supplementary Materials.

Conflicts of Interest

The authors declare no conflict of interest.

References

  1. Gil, M.I.; Tomás-Barberán, F.A.; Hess-Pierce, B.; Kader, A.A. Antioxidant capacities, phenolic compounds, carotenoids, and vitamin C contents of nectarine, peach, and plum cultivars from California. J. Agric. Food Chem. 2002, 50, 4976–4982. [Google Scholar] [PubMed]
  2. Reig, G.; Iglesias, I.; Gatius, F.; Alegre, S. Antioxidant capacity, quality, and anthocyanin and nutrient contents of several peach cultivars [Prunus persica (L.) Batsch] grown in Spain. J. Agric. Food Chem. 2013, 61, 6344–6357. [Google Scholar] [PubMed]
  3. Ding, T.; Cao, K.; Fang, W.; Zhu, G.; Chen, C.; Wang, X.; Wang, L. Evaluation of phenolic components (anthocyanins, flavanols, phenolic acids, and flavonols) and their antioxidant properties of peach fruits. Sci. Hortic. 2020, 268, 109365. [Google Scholar]
  4. Auldridge, M.E.; McCarty, D.R.; Klee, H.J. Plant carotenoid cleavage oxygenases and their apocarotenoid products. Curr. Opin. Plant Biol. 2006, 9, 315–321. [Google Scholar] [PubMed]
  5. Simkin, A.J.; Kapoor, L.; Doss, C.G.P.; Hofmann, T.A.; Lawson, T.; Ramamoorthy, S. The role of photosynthesis related pigments in light harvesting, photoprotection and enhancement of photosynthetic yield in planta. Photosynth. Res. 2022, 152, 23–42. [Google Scholar]
  6. Kaur, N.; Alok, A.; Kumar, P.; Kaur, N.; Awasthi, P.; Chaturvedi, S.; Pandey, P.; Pandey, A.; Pandey, A.K.; Tiwari, S. CRISPR/Cas9 directed editing of lycopene epsilon-cyclase modulates metabolic flux for β-carotene biosynthesis in banana fruit. Metab. Eng. 2020, 59, 76–86. [Google Scholar]
  7. Yuan, H.; Zhang, J.; Nageswaran, D.; Li, L. Carotenoid metabolism and regulation in horticultural crops. Hortic. Res. 2015, 2, 15036. [Google Scholar]
  8. Ito, M.; Yamano, Y.; Tode, C.; Wada, A. Carotenoid synthesis: Retrospect and recent progress. Arch. Biochem. Biophys. 2009, 483, 224–228. [Google Scholar]
  9. Fraser, P.D.; Enfissi, E.M.; Bramley, P.M. Genetic engineering of carotenoid formation in tomato fruit and the potential application of systems and synthetic biology approaches. Arch. Biochem. Biophys. 2009, 483, 196–204. [Google Scholar]
  10. Li, H.; Han, S.; Huo, Y.; Ma, G.; Sun, Z.; Li, H.; Hou, S.; Han, Y. Comparative metabolomic and transcriptomic analysis reveals a coexpression network of the carotenoid metabolism pathway in the panicle of Setaria italica. BMC Plant Biol. 2022, 22, 105. [Google Scholar]
  11. Zheng, X.; Yang, Y.; Al-Babili, S. Exploring the Diversity and Regulation of Apocarotenoid Metabolic Pathways in Plants. Front. Plant Sci. 2021, 12, 787049. [Google Scholar]
  12. Ni, Z.; Yang, Y.; Zhang, Y.; Hu, Q.; Lin, J.; Lin, H.; Hao, Z.; Wang, Y.; Zhou, J.; Sun, Y. Dynamic change of the carotenoid metabolic pathway profile during oolong tea processing with supplementary LED light. Food Res. Int. 2023, 169, 112839. [Google Scholar] [PubMed]
  13. Khan, A.H.; Akram, A.; Saeed, M.; ur Rahman, M.; ur Rehman, A.; Mansoor, S.; Amin, I. Establishment of Transcriptional Gene Silencing Targeting the Promoter Regions of GFP, PDS, and PSY Genes in Cotton using Virus-Induced Gene Silencing. Mol. Biotechnol. 2023, 65, 1052–1061. [Google Scholar] [PubMed]
  14. Naing, A.H.; Song, H.Y.; Lee, J.M.; Lim, K.B.; Kim, C.K. Development of an efficient virus-induced gene silencing method in petunia using the pepper phytoene desaturase (PDS) gene. Plant Cell Tissue Organ Cult. (PCTOC) 2019, 138, 507–515. [Google Scholar]
  15. Chen, Y.; Li, J.; Fan, K.; Du, Y.; Ren, Z.; Xu, J.; Zheng, J.; Liu, Y.; Fu, J.; Ren, D.; et al. Mutations in the maize zeta-carotene desaturase gene lead to viviparous kernel. PLoS ONE 2017, 12, e0174270. [Google Scholar]
  16. Lou, Y.; Sun, H.; Li, L.; Zhao, H.; Gao, Z. Characterization and Primary Functional Analysis of a Bamboo ZEP Gene from Phyllostachys edulis. DNA Cell Biol. 2017, 36, 747–758. [Google Scholar]
  17. Ronen, G.; Carmel-Goren, L.; Zamir, D.; Hirschberg, J. An alternative pathway to ε-carotene formation in plant chromoplasts discovered by map-based cloning of Beta and old-gold color mutations in tomato. Proc. Natl. Acad. Sci. USA 2000, 97, 1102–1107. [Google Scholar]
  18. Cao, S.; Liang, M.; Shi, L.; Shao, J.; Song, C.; Bian, K.; Chen, W.; Yang, Z. Accumulation of carotenoids and expression of carotenogenic genes in peach fruit. Food Chem. 2017, 214, 137–146. [Google Scholar]
  19. Fraser, P.D.; Enfissi, E.M.; Halket, J.M.; Truesdale, M.R.; Yu, D.; Gerrish, C.; Bramley, P.M. Manipulation of phytoene levels in tomato fruit: Effects on isoprenoids, plastids, and intermediary metabolism. Plant Cell 2007, 19, 3194–3211. [Google Scholar]
  20. Fang, X.; Gao, P.; Luan, F.; Liu, S. Identification and Characterization Roles of Phytoene Synthase (PSY) Genes in Watermelon Development. Genes 2022, 13, 1189. [Google Scholar] [CrossRef]
  21. Brandi, F.; Bar, E.; Mourgues, F.; Horváth, G.; Turcsi, E.; Giuliano, G.; Liverani, A.; Tartarini, S.; Lewinsohn, E.; Rosati, C. Study of ‘Redhaven’ peach and its white-fleshed mutant suggests a key role of CCD4 carotenoid dioxygenase in carotenoid and norisoprenoid volatile metabolism. BMC Plant Biol. 2011, 11, 24. [Google Scholar]
  22. Falchi, R.; Vendramin, E.; Zanon, L.; Scalabrin, S.; Cipriani, G.; Verde, I.; Vizzotto, G.; Morgante, M. Three distinct mutational mechanisms acting on a single gene underpin the origin of yellow flesh in peach. Plant J. 2013, 76, 175–187. [Google Scholar]
  23. Phadungsawat, B.; Watanabe, K.; Mizuno, S.; Kanekatsu, M.; Suzuki, S. Expression of CCD4 gene involved in carotenoid degradation in yellow-flowered Petunia × hybrida. Sci. Hortic. 2020, 261, 108916. [Google Scholar]
  24. Adami, M.; De Franceschi, P.; Brandi, F.; Liverani, A.; Giovannini, D.; Rosati, C.; Dondini, L.; Tartarini, S. Identifying a carotenoid cleavage dioxygenase (ccd4) gene controlling yellow/white fruit flesh color of peach. Plant Mol. Biol. Report. 2013, 31, 1166–1175. [Google Scholar]
Figure 1. Different varieties of peach fruit. HJ—Lakeview Honey Dew; YL—Yulu; ZY29—Hybrids of HJ and YL.
Horticulturae 11 00376 g001
Figure 2. Sample population clustering heat map. Note: The horizontal is the sample name, the vertical is the metabolite information, and the different colors are the colors filled with different values obtained after the standardization of different relative contents (red represents high content, and green represents low content). Group is the grouping, and Class is the substance classification. For all heatmap classes, the thermal diagram indicates the substance. The heatmap row cluster indicates the cluster analysis of metabolites and samples. The cluster line on the left side of the figure is the cluster line of metabolites, and the cluster line on the top of the figure is the cluster line of the samples heatmap row. Cluster: Cluster analysis is only performed on metabolites. The cluster line on the left side of the figure is the cluster line of metabolites.
Horticulturae 11 00376 g002
Figure 3. PCA of the variance-stabilized estimated raw counts. (A) Metabolom PCA chart. (B) PCA diagram of the transcriptome.
Horticulturae 11 00376 g003
Figure 4. DEGs Venn map. (A) DEGs in the flesh. (B) DEGs in the pericarp.
Horticulturae 11 00376 g004
Figure 5. DEGs clustering heatmap. (A) DEGs in the flesh. (B) DEGs in the pericarp.
Horticulturae 11 00376 g005
Figure 6. KEGG enrichment analysis. (A) DEGs in the flesh. (B) DEGs in the pericarp.
Horticulturae 11 00376 g006
Figure 7. O2PLS analysis. (A) Gene loadings map. (B) Metabolite loadings graph. Note: The distance from each point to the origin in the graph or the height of the bar graph represents the magnitude of the correlation between the substance and another omics. The darker the color, the greater the correlation. The top 10 substances that have a significant impact on the other omics are indicated in the graph.
Horticulturae 11 00376 g007
Figure 8. qRT–PCR analysis. Error bars show the mean ± SD of three independent biological experiments.
Horticulturae 11 00376 g008
Table 1. Transcriptome sequencing data.
Sample NameRaw Reads (M)Clean Reads (M)Clean Bases (M)Q20 (%)Q30 (%)Reads Ratio (%)
HJ-F-147.3345.116.7797.3393.0995.31
HJ-F-247.3344.816.7297.3793.1994.67
HJ-F-347.3344.796.7297.2993.0594.64
HJ-P-147.1945.076.7697.2291.4795.51
HJ-P-247.1945.026.7597.1291.1595.41
HJ-P-345.4443.836.5797.2891.5996.46
YL-F-147.1945.126.7797.291.4195.61
YL-F-247.1945.126.7797.2391.4695.63
YL-F-347.1944.666.797.2791.5794.64
YL-P-144.0642.716.4195.0389.0396.93
YL-P-247.3345.436.8194.9488.8296
YL-P-343.942.116.3294.5688.0195.91
ZY29-F-147.1945.326.897.1991.3496.04
ZY29-F-247.1945.336.897.2291.4296.06
ZY29-F-347.1945.076.7697.1991.3795.51
ZY29-P-147.3345.496.8294.9188.7896.12
ZY29-P-247.3345.36.895.0689.0695.72
ZY29-P-344.9743.016.4595.0389.0395.64
Sum839.87803.3120.5
Note: In order to reflect the correlation of gene expression between samples, the Pearson correlation coefficients of all gene expressions between each two samples were calculated, and these coefficients were reflected in the form of a heatmap. The correlation coefficients can reflect a similar situation in the overall gene expression between each sample. The higher the correlation coefficient, the more similar the gene expression level.
Disclaimer/Publisher’s Note: The statements, opinions and data contained in all publications are solely those of the individual author(s) and contributor(s) and not of MDPI and/or the editor(s). MDPI and/or the editor(s) disclaim responsibility for any injury to people or property resulting from any ideas, methods, instructions or products referred to in the content.

