Article

Maturity Classification of Blueberry Fruit Using YOLO and Vision Transformer for Agricultural Assistance †

Tokyo University of Agriculture and Technology, 2-24-16 Nakachō, Tokyo 184-0012, Japan
*
Author to whom correspondence should be addressed.
This paper is an extended version of our paper published in IVSP 2025: 2025 7th International Conference on Image, Video and Signal Processing, Ikuta, Japan, 4–6 March 2025. Available online: https://ivsp.net/IVSP2025.html.
Horticulturae 2025, 11(10), 1272; https://doi.org/10.3390/horticulturae11101272
Submission received: 10 September 2025 / Revised: 13 October 2025 / Accepted: 18 October 2025 / Published: 21 October 2025

Abstract

This paper proposes a method for classifying the maturity levels of blueberry fruit from camera images as part of a cultivation support system. Following the five-stage maturity classification, the proposed approach first detects individual blueberry regions in an image and subsequently classifies each region into one of the five levels. The method leverages a Transformer-based model to extract features from local fruit regions that include contextual background, enabling the learning of spatial relationships both within and beyond the fruit boundaries. A dedicated dataset was constructed by capturing images of blueberry fruits alongside a color chart representing maturity levels. Experimental evaluations involving multiple deep learning models under three training–testing configurations demonstrate the effectiveness of the proposed method, achieving an average classification accuracy of 93.7%.

1. Introduction

Blueberry clusters typically consist of fruits at different stages of ripeness, making uniform harvesting in a single pass impractical. To ensure that only fully ripened berries—those with optimal flavor, texture, and nutritional value—are delivered to market, selective harvesting is required. However, this process is both time-consuming and labor-intensive, often necessitating multiple harvest rounds and skilled workers. In countries such as Japan, where the agricultural workforce is shrinking due to a severely declining population, the challenge of manual harvesting is even more pronounced. Labor shortages not only increase production costs but also threaten the sustainability of blueberry cultivation. In the context of urban agriculture, where space is limited and operational efficiency is crucial, the need to cultivate high value-added crops with minimal labor becomes especially important for profitability. Against this backdrop, the research and development of smart agriculture technologies—such as automated harvesting systems and precision farming tools—are being actively pursued to address these challenges and ensure the long-term viability of fruit production. Methods using machine learning have been proposed for the automatic maturity classification of blueberry fruit. In blueberry fruit, ripening is a complex physiological process involving changes in peel color due to anthocyanin accumulation, firmness fruit softening, sugar accumulation, and acidity reduction, which are critical for both biological maturity and commercial quality [1,2]. These parameters are commonly used in postharvest quality control and are closely associated with consumer acceptance and shelf life. Traditionally, the handcrafted method was used to identify the maturity of different stages of blueberry [3,4]. In recent years, Mask-RCNN models have been mainly used for blueberry detection [5,6]. A method was proposed using YOLOv8 [7] to detect blueberries and classify their maturity using a CNN [8]. An enhanced YOLOv7 network has been employed to classify blueberries into five distinct maturity levels, aiming to improve classification accuracy [9]. Liu et al. proposed a YOLOv5x-based approach to detect three ripeness levels in blueberries [10]. In addition, the YOLOv4 model has been applied to identify three color-based classes—green, red, and blue berries—as well as a two-class classification distinguishing unripe and ripe berries [11]. These studies demonstrate the potential of deep learning methods for accurate and efficient blueberry maturity assessment. However, these methods have problems to be solved. First, the CNN for classifying maturity levels is considered shallow and insufficient for classifying maturity levels. In addition, the basis for labeling the five levels of maturity is unclear and is largely dependent on subjectivity. This study proposes a Vision Transformer (ViT)-based method to improve the accuracy of blueberry fruit maturity level classification. Based on the conventional approach described in [8], the framework initially detects blueberry fruit regions using YOLOv8, followed by the classification of maturity stages using the Vision Transformer. For model training, a dedicated dataset was constructed by capturing images that include both a color chart and the corresponding fruit. The color chart was designed to represent the characteristic hues of different maturity levels, enabling consistent and accurate annotation.
This research extends our previous work [12] by incorporating new experimental results that further strengthen the contribution of the previously proposed method.
  • Conventional model (customize CNN) is trained to compare the detection results with proposed method.
  • The classification results for the all three patterns dataset are included.
  • The precision–recall curve for the patterns 2 and 3 datasets are included.
  • To show the effectiveness of object detection module, segmentation results are compared with the proposed model.

2. Materials and Methods

The proposed method for blueberry fruit maturity classification first detects the location of the fruit from camera images, followed by classification into five distinct maturity levels. This approach is intended to support and enhance the automated harvesting of blueberry fruit. The TifBlue variety, a type of rapid-eye blueberry cultivated at Tokyo University of Agriculture and Technology (TUAT), was selected for this study. Each component of the proposed method is described in detail in the following sections.

2.1. Maturity Levels of Blueberry Fruit

In the proposed method, the color stage by Shutak [13] in Table 1 is used for classification of blueberry maturity level, which is generally used as a reference in rapid-eye blueberry cultivation. While the classification in this study is based on external peel color, previous studies have shown that peel color is significantly correlated with internal quality parameters such as soluble solids content (SSC), titratable acidity (TA), and firmness [14,15]. Other research also shows how external color and texture change during the ripening period of blueberries due to acidity [16]. Moreover, blueberries are sorted based on external color for molecular, chemical, and histological analyses [17]. These findings support the use of external color as a proxy for maturity in non-destructive classification systems. One of the difficulties in the classification of five maturity levels from images of blueberries is the variation of the color in the image due to changes in conditions such as sun exposure and weather conditions, which is difficult even for experts. In the method, a color chart taken together with the fruit, as shown in Figure 1, is used to label the five levels of fruit maturity with the correct answer. The color corresponding to each level is a numerical value in the L∗a∗b∗ color space of the fruit corresponding to the color stage by Yamagishi [18]. Figure 2 shows an example of a color chart, and the fruits are captured at the same time under the same condition.

2.2. Dataset

Images of the blueberry fruits were captured using a Google Pixel 6a smartphone (Google LLC, Mountain View, CA, USA), producing images with a resolution of 4032 × 3024 pixels with the color chart in the TUAT orchard. The images were taken from a distance that allows the fruits to be seen clearly. Two-year-old blueberries were planted in spring 2023, and the growth status ranges from standard to good. The tree vigor is moderate. The standard selection pruning method commonly used in Japan was used to maintain healthy growth and optimize fruit production. The pruning involves removing dead and weak branches, as well as cutting back vigorous branches by approximately half their length. The variety of blueberry plants is Tifblue.
Each fruit in the images was annotated and surrounded by a bounding box, regardless of its maturity level. This dataset consisted of 250 images, for a total of 4506 fruits. Then, a fruit maturity classification dataset was created using these 4506 fruits. The basic manual validation of the images was performed by a human annotator, who referred to a color chart displayed on a computer monitor to classify the maturity of each blueberry in the images. Each fruit was labeled with five levels of maturity, and the area images of the fruit were cut out of the bounding box and classified into folders for each maturity level. The number of images for each stage is shown in Table 2. To experiment on the same dataset for detection and maturity level classification, each stage contained a different number of fruits due to the natural distribution of fruits across maturity stages in the images. Figure 3 shows example images of each maturity level in the dataset. Fruits proceed from immature (Figure 3a) to mature (Figure 3e).

2.3. Maturity Classification Method

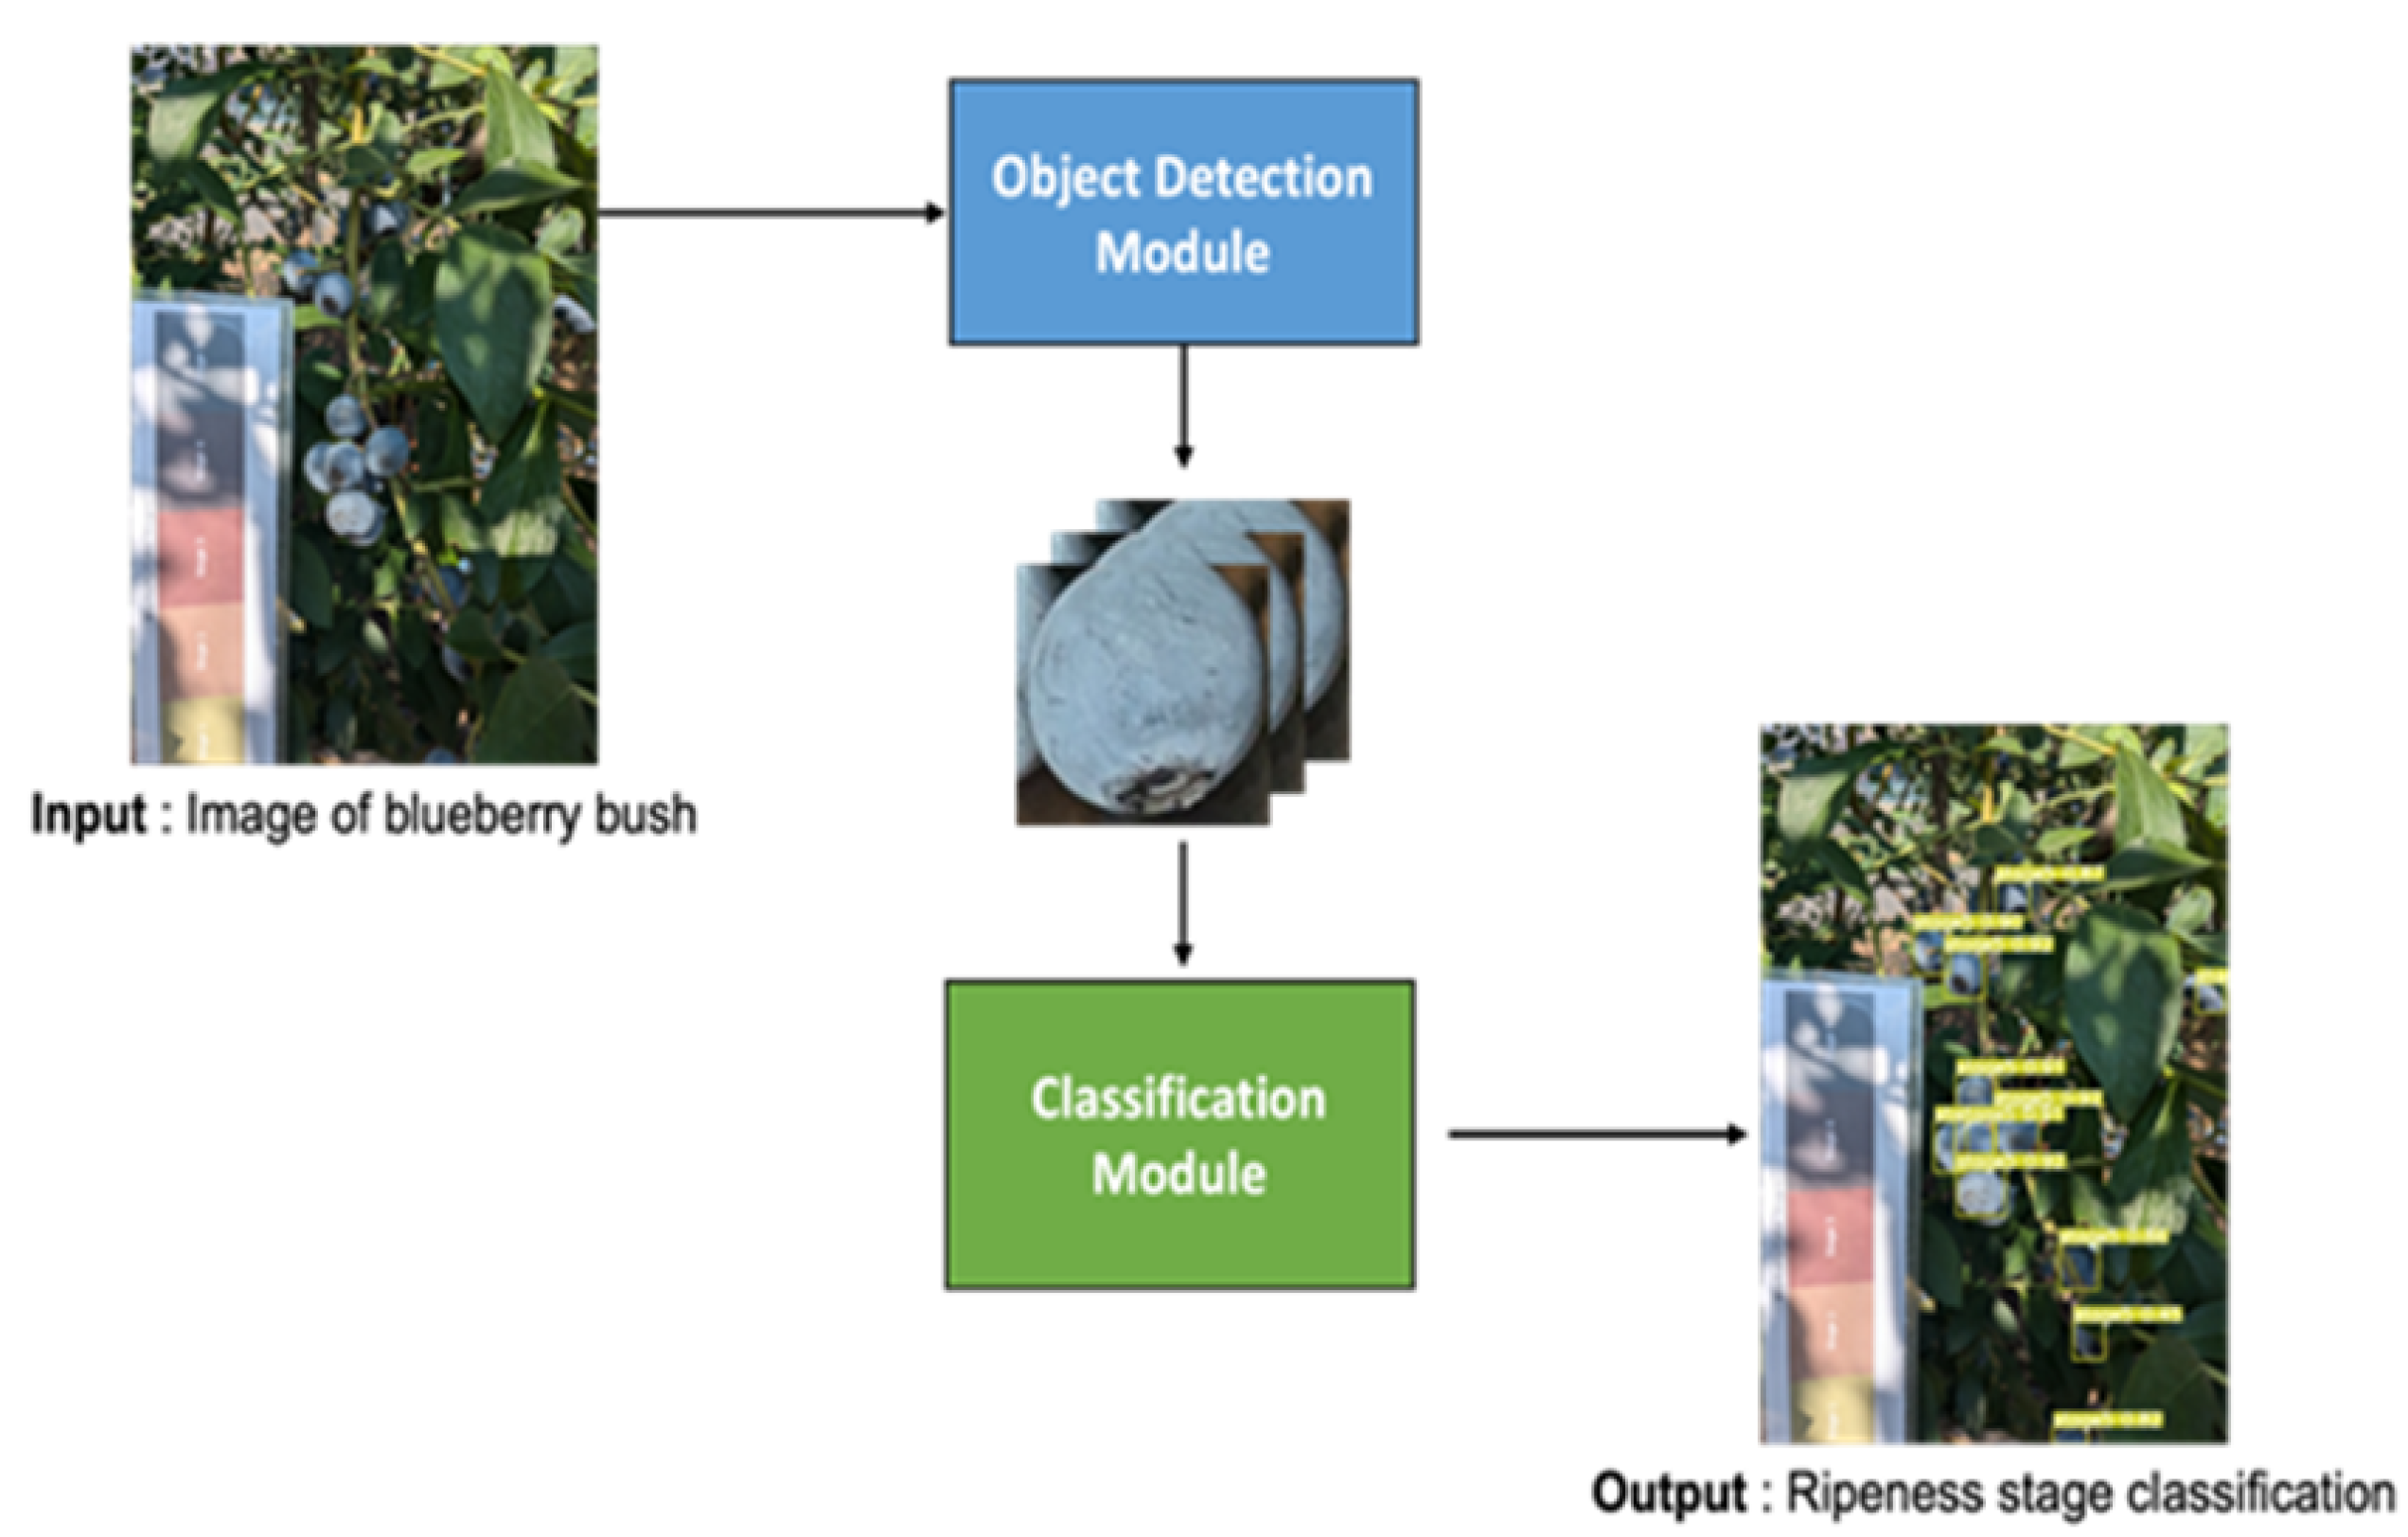
The overview of the proposed method is shown in Figure 4.
First, images of the blueberry fruits are captured in the orchard. Then, the object detection module is applied to the image to detect the location of each blueberry fruit. The detected regions are then input into the classification module, which assigns five maturity levels to each blueberry fruit.
For the object detection module, YOLOv8’s Model S is employed to detect blueberries in an image. The conventional method [6] uses YOLOv8 and not only performs object detection but also performs segmentation to detect only real regions. However, the proposed method does not perform segmentation but only object detection. This is because the color correspondence with the surroundings in the bounding box and other factors are considered to be the basis for maturity classification. The coordinates of the detected bounding box are the output of this module.
For the classification module, the Vision Transformer model is employed [19]. The conventional method [6] consists of only two convolutional layers and three full-combination layers, which are considered insufficient for classifying fruit maturity from an image. In the classification module, to achieve the robust classification to environmental change, the Vision Transformer was trained on images from the fruit maturity classification dataset. The bounding box information extracted by the object detection module are used as the input of the classification module, and the maturity of the input fruit images is the output of this module.

3. Experiments

3.1. Experimental Condition

To confirm the effectiveness of the proposed method, the accuracy of methods for identifying fruit maturity from images are compared. The first method is the proposed method that inputs image data to the object detection module, detects fruits regardless of their maturity level, and then inputs the detected regions to the classification module to identify five levels of maturity. The second method is to input the image data to the object detection module and identify the five levels of maturity directly. The object detection module uses YOLOv8’s Model S. The model was trained with a learning rate of 0.01 for 3000 epochs, and the weights with the highest score were used. The classification module compared several models. Specifically, the following models were compared:
  • Convolutional Neural Network
    Conventional method [8]: params: 3.6 (M), input: 224 (pixel).
    EfficientNet v2 [20]: params: 21.5M, input size: 384.
    MobileNet v3 [21]: params: 5.5M, input size: 224.
    Inception v4 [22]: params: 42.7M, input size: 299.
  • Nearest neighbor search in L∗a∗b∗ color space of image.
  • Vision Transformer (proposed method): params: 5.7 M, input size: 224 (proposed method).
The four convolutional neural network models and the Vision Transformer were trained for 100 epochs with a learning rate of 3 × 10 5 . The optimization method for the conventional Custom-CNN was stochastic gradient descent (SDG). For the other methods, EfficientNet v2, MobileNet v3, Inception v4, and Vision Transformer were trained using the ADAM optimizer. The batch size was 16, and cross-entropy loss was used.

3.2. Results and Discussion

At first, the classification modules were compared. The constructed fruit maturity classification dataset was divided into training and testing data at a ratio of 8:2. This division was performed randomly in three different patterns, and the average accuracy across these patterns was considered the final result for the experiment. The detailed results of each individual pattern are provided in Table 3, Table 4 and Table 5, showing that different models exhibit varying performance across stages. Table 6 shows the average detection rate. Then, object detection and segmentation methods are compared to show the effectiveness of object detection in fruit classification, as shown in Table 7 and Table 8 and Figure 5 and Figure 6.

3.2.1. Classification Accuracy

In pattern 1, as shown in Table 3, the results show that the Vision Transformer achieves the highest overall accuracy at 94.7%, demonstrating consistent performance across all stages. Most models perform well at the peaks, with high accuracy in Stage 1 and Stage 5, indicating that very early or fully mature cases are easier to classify. However, intermediate stages (Stage 2–4) are more challenging, with significant drops in accuracy for several models. For example, EfficientNet v2 performs very poorly at Stage 2 (27.4%), and the conventional method struggles at Stage 4 (19.4%). Among the models, the Vision Transformer is the most balanced, maintaining relatively high accuracy even in these difficult stages, likely due to its ability to capture subtle variations through long-range dependencies and complex feature interactions. CNN-based models such as EfficientNet v2, MobileNet v3, and Inception v4 perform well for clear-cut cases but are less reliable for intermediate stages, while simpler color-based approaches like L∗a∗b show the lowest overall performance, especially when distinguishing subtle transitions. Overall, the results highlight the superior capability of the Transformer-based model in handling subtle differences between classes, leading to more robust classification across all stages.
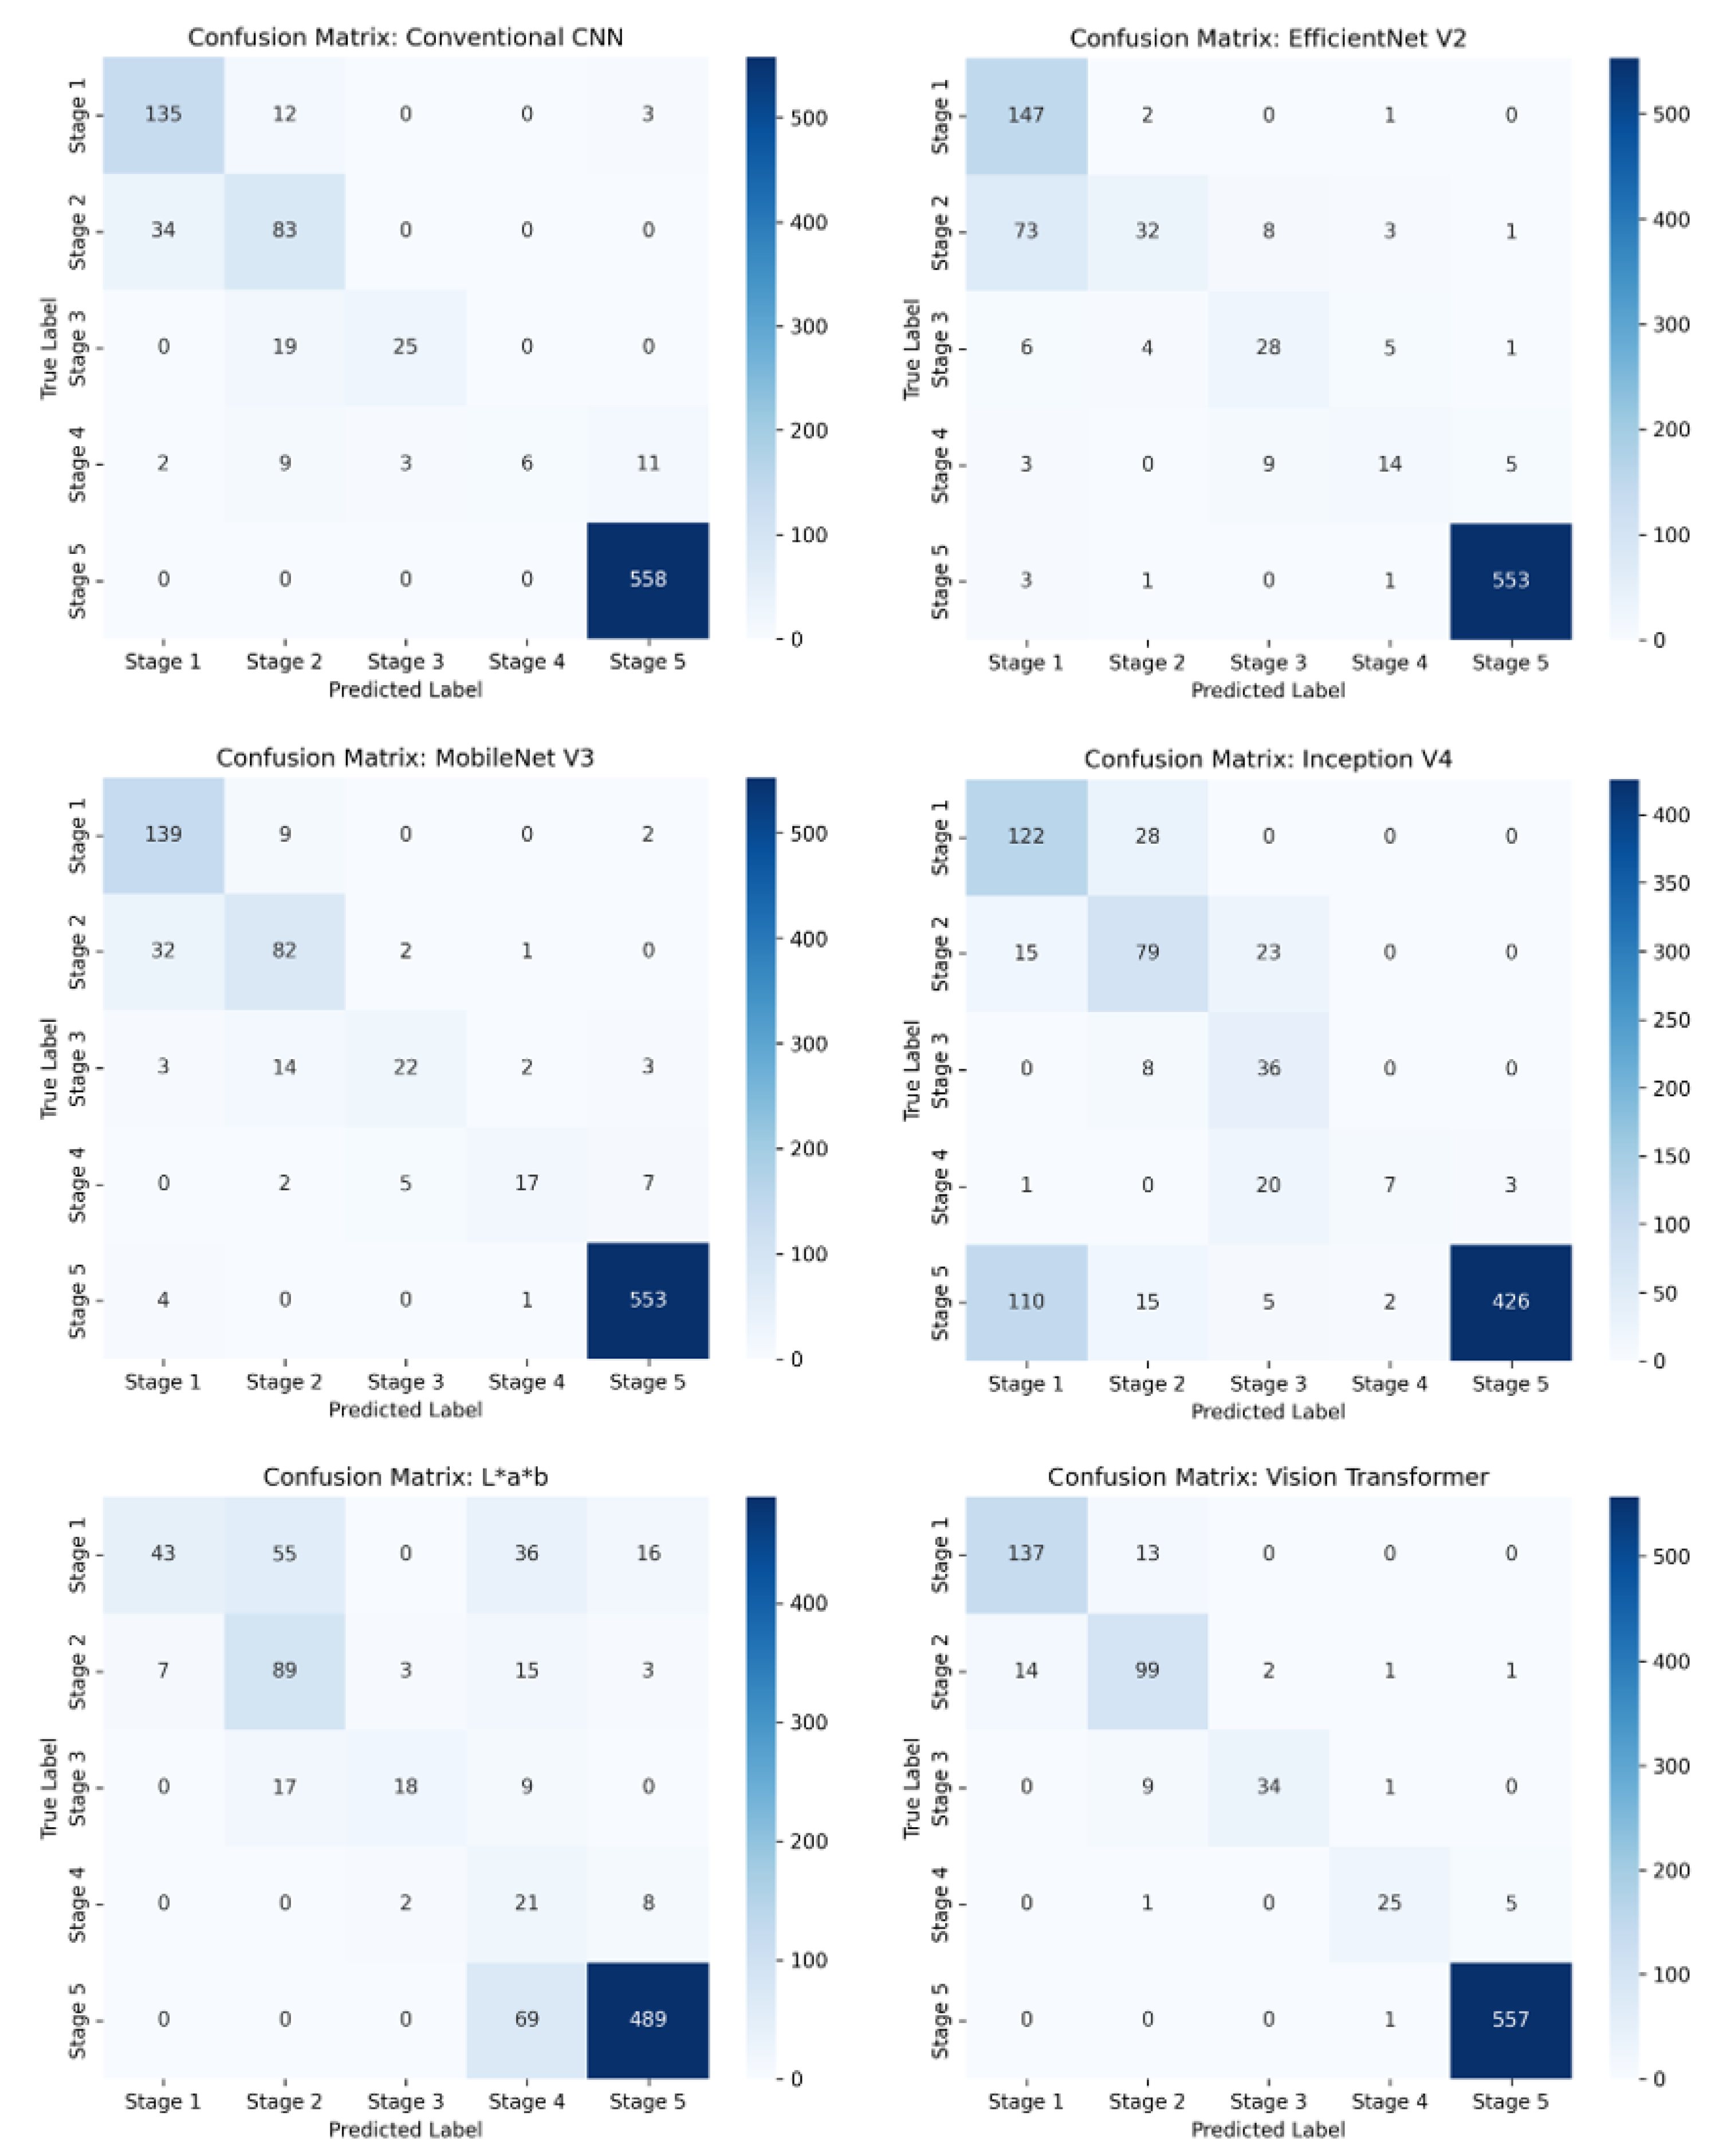
To clarify the misclassifications, the confusion matrix of models in pattern 1 is shown in Figure 5. The misclassification patterns reveal distinct model behaviors in handling stage progression. The Vision Transformer mainly confuses adjacent stages, indicating it effectively captures the ripening sequence but struggles at subtle transition points. MobileNet v3 and the conventional CNN show a similar trend, performing well at the extreme stages but often misclassifying intermediate ones. EfficientNet v2 also performs strongly at the early and late stages but exhibits pronounced errors in Stage 2 and confusion between Stages 3 and 4. In contrast, Inception v4 shows larger errors, including Stage 5 frequently being misclassified as Stage 1, suggesting poor preservation of stage adjacency. The L∗a∗b color-based method performs the weakest, with widespread errors across distant stages. Overall, the Vision Transformer tends to preserve the natural ordering of ripeness, whereas Inception v4 and classical methods fail to maintain this structure.
In pattern 2, as shown in Table 4, the Vision Transformer achieved the highest overall accuracy (92.6%), demonstrating consistent performance across all stages. While all models performed well at Stage 1 and Stage 5, intermediate stages remained challenging, with the conventional method and L∗a∗b exhibiting notably low accuracies. CNN-based models showed moderate performance on some intermediate stages but were generally less consistent than the Vision Transformer, which effectively captures subtle visual differences, highlighting its robustness for stage-wise classification.
In pattern 3, as shown in Table 5, the Vision Transformer achieved the highest overall accuracy (93.7%) and demonstrated consistently strong performance across all stages. While most models performed well in the easily distinguishable Stage 1 and Stage 5, intermediate stages—particularly Stage 3 and Stage 4—remained challenging. Conventional and L∗a∗b methods showed the lowest accuracies in these stages, and CNN-based models exhibited moderate but less consistent performance. In contrast, the Vision Transformer effectively captures subtle visual differences, resulting in superior and more robust stage-wise classification.
Finally, the average of the results from the three patterns is presented in Table 6. The Vision Transformer consistently achieved the highest overall accuracy (93.7%) and demonstrated robust performance across all stages. While early and late stages were generally classified accurately by most models, intermediate stages proved more challenging. Conventional methods and L∗a∗b exhibited lower performance in these stages, and CNN-based models showed moderate but less consistent results. The nearest neighbor method using the L∗a∗b color space, despite its simplicity, was strongly influenced by hue variations and lacked robustness against lighting inconsistencies and uneven skin coloration, leading to reduced classification performance. In contrast, the Vision Transformer effectively captured subtle visual differences, resulting in the most reliable and balanced stage-wise classification. CNNs, which rely on convolutional kernels to extract local features, often emphasize shapes and edges over subtle pixel-level color changes, limiting their effectiveness in this context. In contrast, the Vision Transformer leverages a self-attention mechanism to model global relationships between image patches, enabling the capture of fine color gradients and nuanced transitions across the fruit surface. This capability, combined with effective fine-tuning on a pretrained model, is believed to have contributed to the Vision Transformer’s high accuracy, even when trained on a relatively small dataset.

3.2.2. Detection Approach

In this study, a framework that separates fruit detection and ripeness classification is adopted. However, it is necessary to examine whether it is more appropriate to use an object detection model (bounding box detection) or a segmentation model (pixel-level region detection) as the object detection module. Therefore, this section compares the conventional segmentation model with the object detection model used in this study. For the object detection model, the previously used YOLOv8 (model s) was employed, while for the segmentation model, the conventional YOLOv8 segmentation model (model n) was used. Both models were trained with a learning rate of 0.01 for 3000 epochs, and the weights with the highest accuracy on the validation data were selected for evaluation. The training data consisted of 33 images (a total of 593 fruits), matched to the number of annotations available for segmentation. These were constructed by combining the fruit detection dataset used in the experiment with the DeepBlueberry dataset [5].
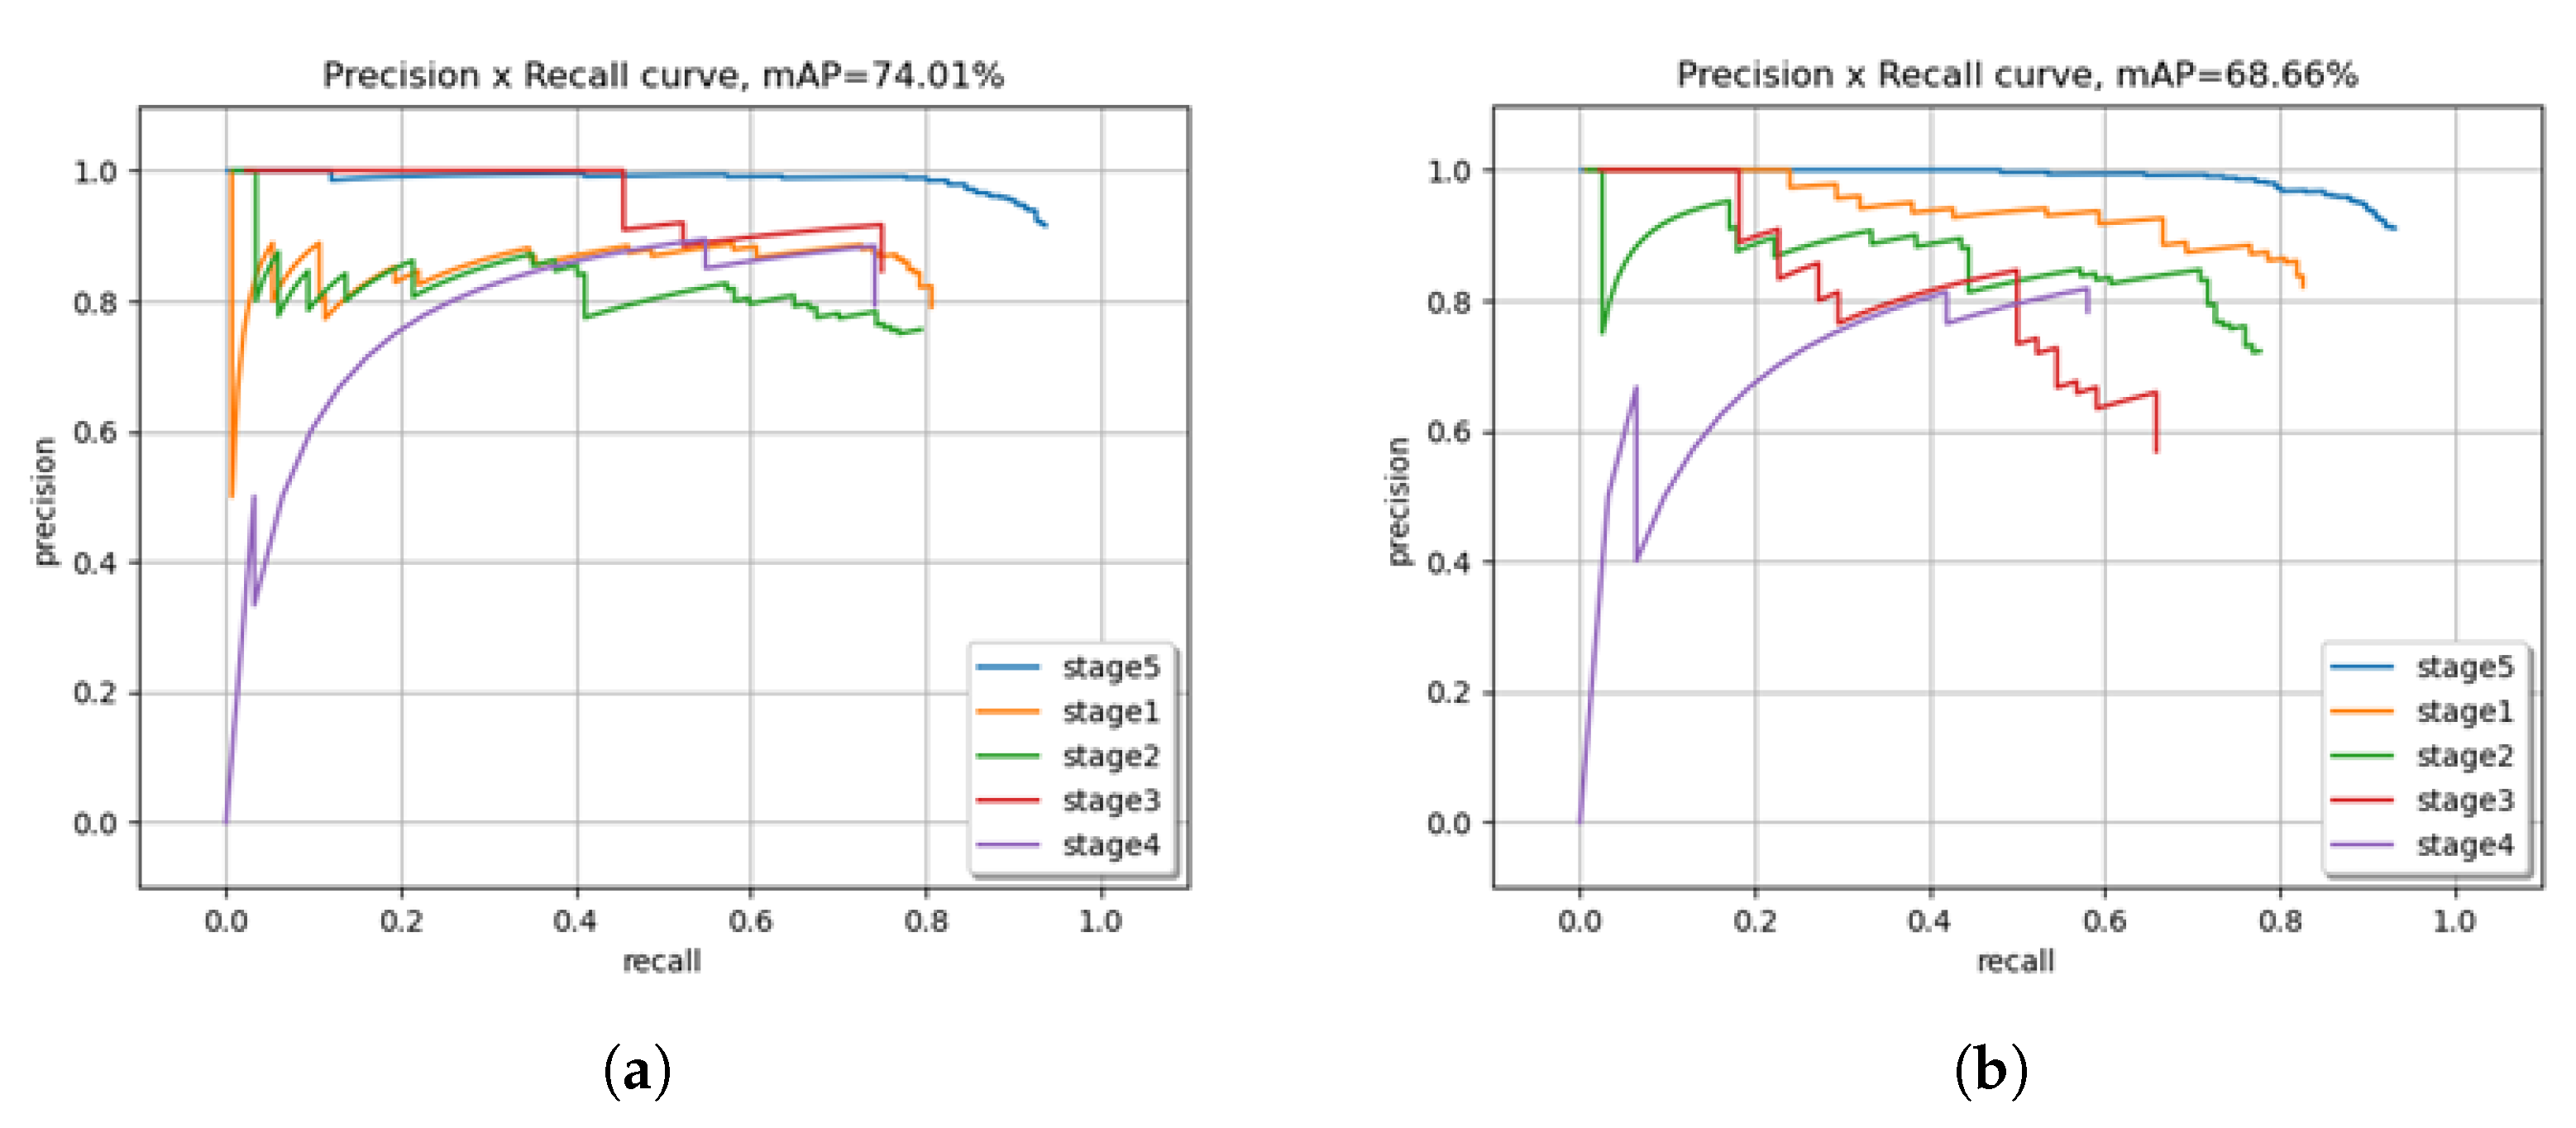
First, to evaluate how accurately the fruits were detected regardless of ripeness, Figure 6 shows the precision–recall curve (IoU = 0.5). There is not much difference in AP between the object detection and the segmentation models, with the object detection model being slightly higher, but both models capture the fruit region well.
Next, the fruit detection methods were compared using the confusion matrix of detected fruits: the proposed approach is as shown in Table 7, which utilizes an object detection model with bounding boxes, and a conventional segmentation-based method as shown in Table 8 that detects fruits at the pixel level. To ensure a fair comparison, the number of training images was reduced to match the dataset size used by the segmentation-based approach. A Vision Transformer was used for classification in both methods. Upon analyzing the confusion matrices, a slight edge in performance was demonstrated by the object detection model for Stage 1. However, no substantial difference was observed between the two methods overall. Notably, models often require retraining when deployed in new environments. Given that less effort is required for annotation in object detection compared with segmentation, it is concluded that object detection is the more practical approach for fruit detection in dynamic settings.

3.3. Ablation Analysis

3.3.1. Effectiveness of Transformer Module

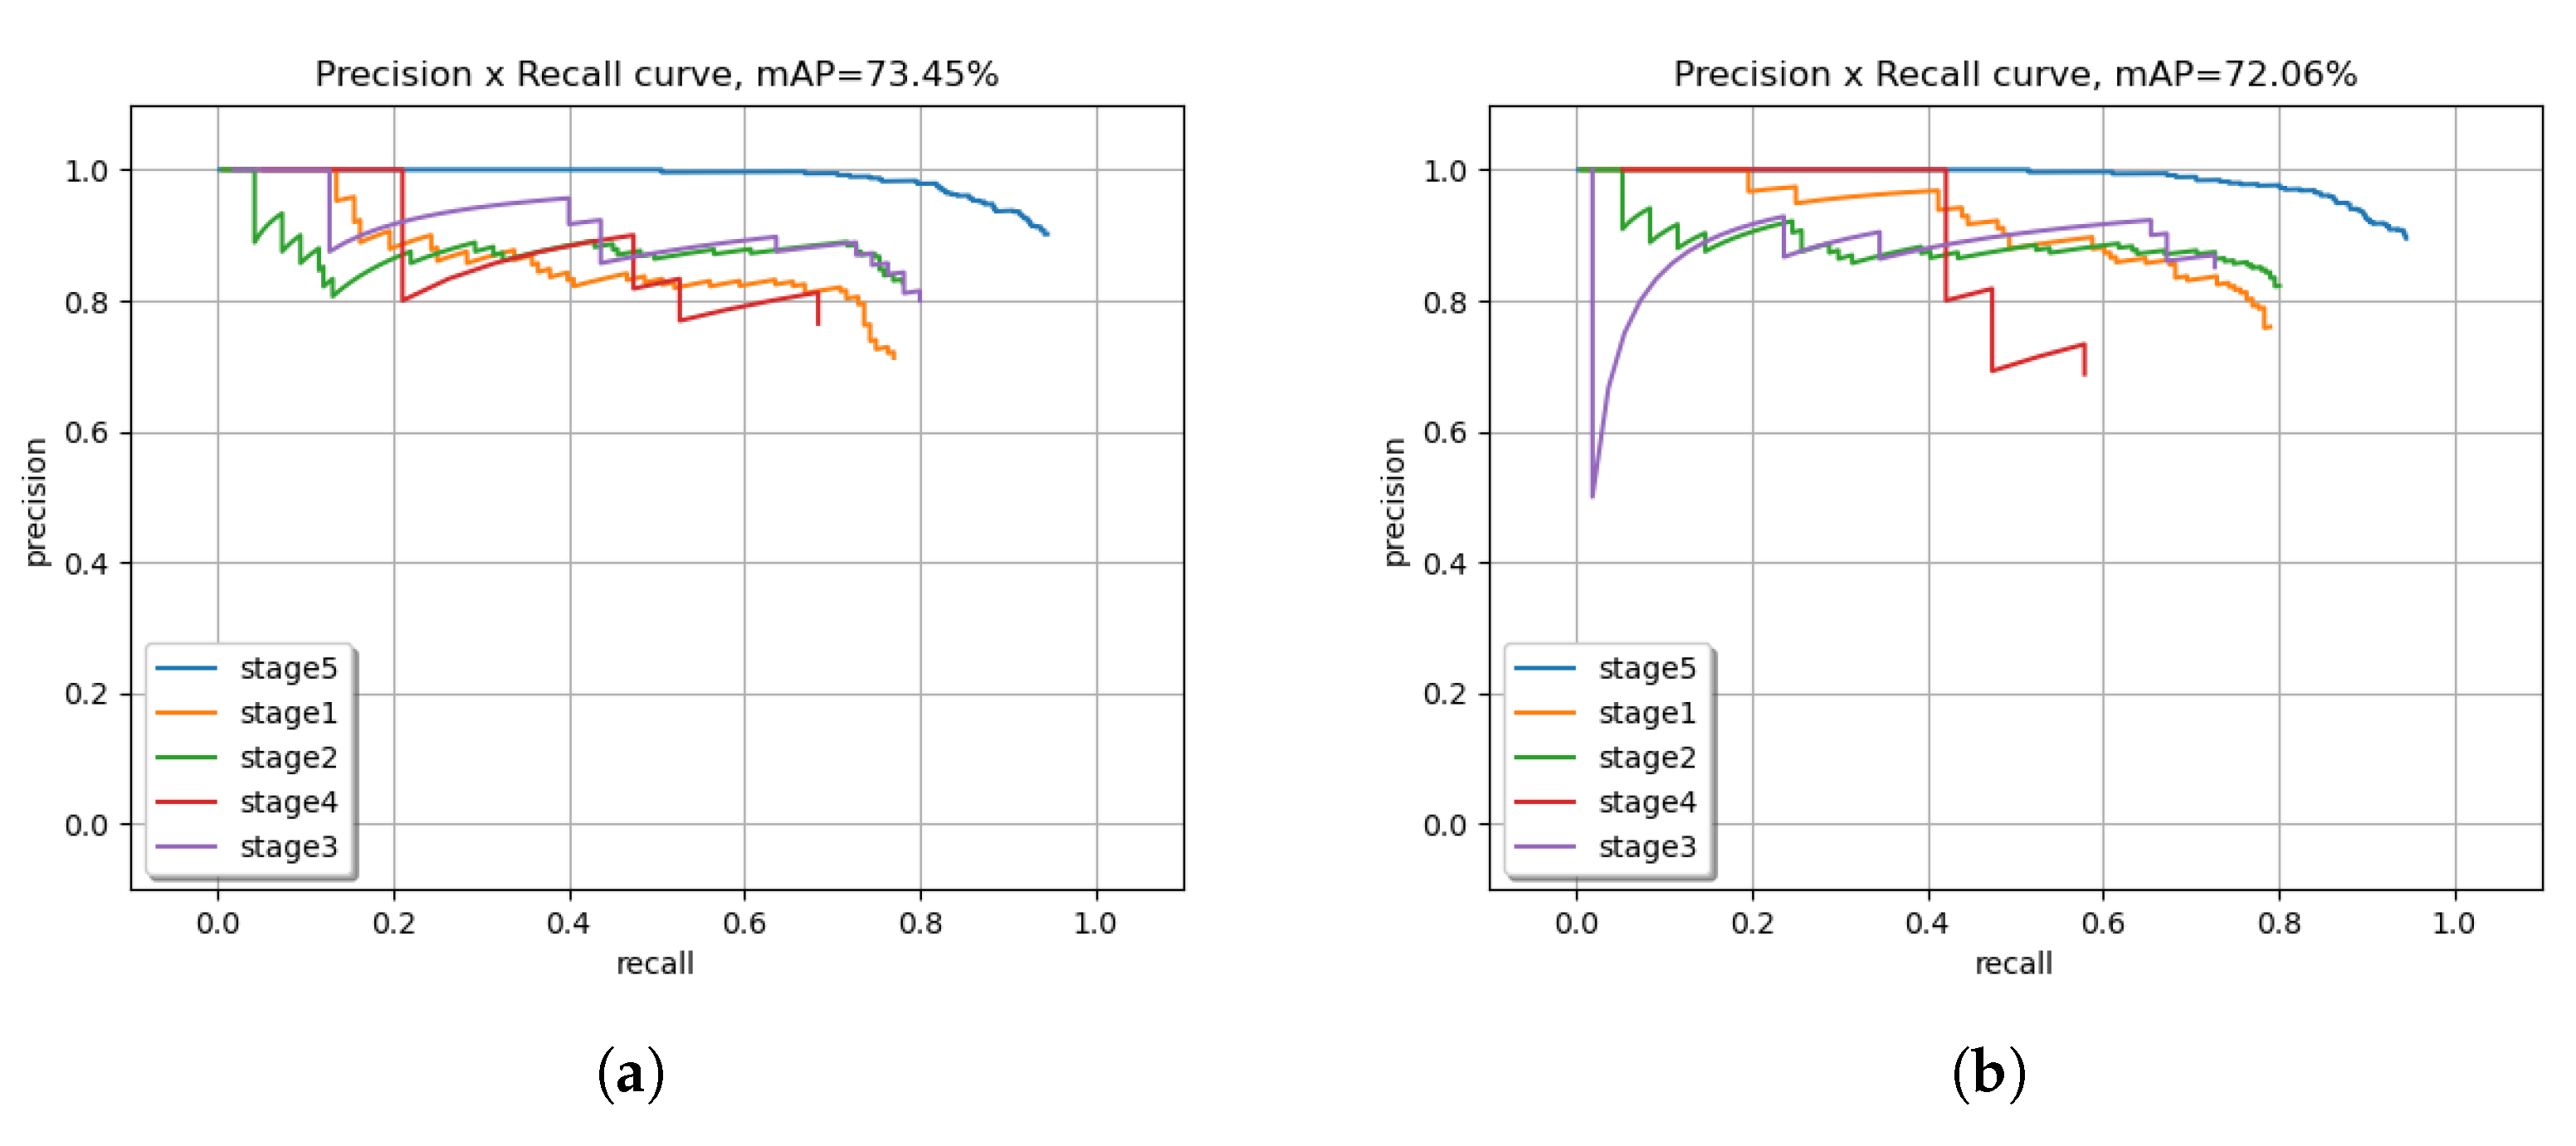
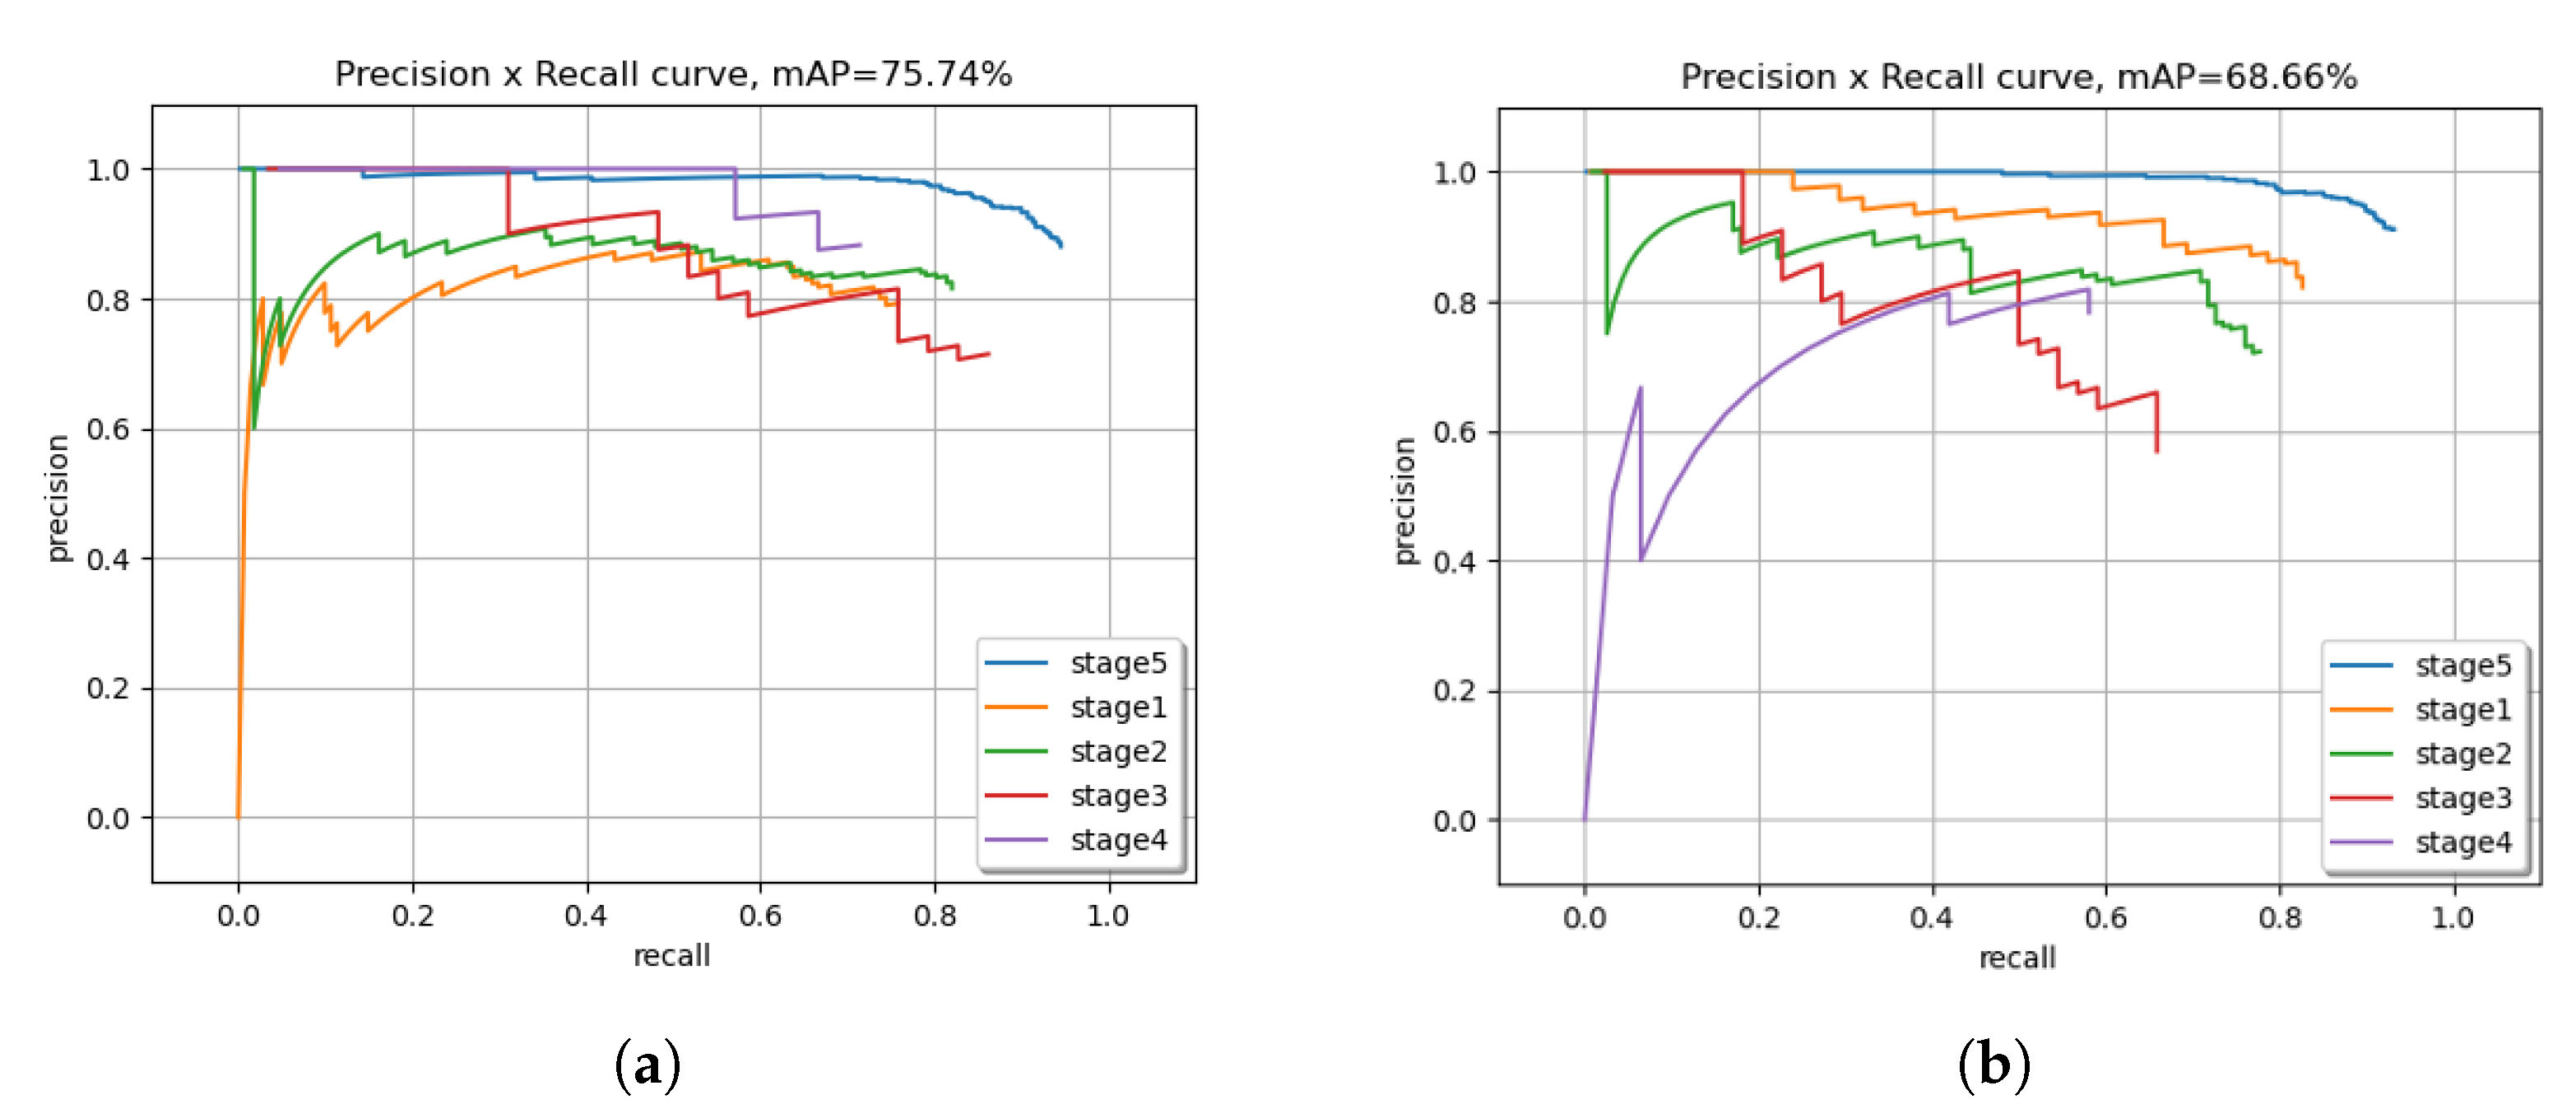
The Transformer is used as the classification module, which was more accurate, as shown in Table 6. This experiment was also performed on the same three datasets as the experiment comparing the five classification modules without the Transformer module. Figure 7, Figure 8 and Figure 9 show the precision–recall curves (IoU = 0.5) for each pattern of dataset, respectively. The results of detecting fruit and identifying the maturity of the test data are shown as a PR curve and mAP (mean average precision). The higher the curve is on the right, the better the accuracy. The proposed method incorporating a Vision Transformer demonstrates superior performance in terms of precision and recall over YOLOv8. The advantage is particularly seen in Stages 3 and 4, where the classification task involves distinguishing subtle shade differences. Furthermore, the proposed method consistently outperforms all other evaluated approaches across all patterns with respect to mean average precision (mAP), indicating its robustness and effectiveness in handling visual features.

3.3.2. Effectiveness of Classification Using Unified Dataset

As the number of images in each stage is imbalanced due to the natural distribution of fruits, an experiment was conducted by reducing the number of fruits to evaluate the effectiveness of the YOLOv8 + Vision Transformer module. Each stage contains 84 images of fruits. The experimental results are presented in Table 9. The results show that the Vision Transformer outperforms other models in Stages 2, 4, 5, and overall. This indicates the effectiveness of the Vision Transformer even on a small classification dataset.

4. Limitation

The discussion is presented from two perspectives: the first subsection identifies the dataset and methodological limitations of the proposed approach, while the second subsection extends the discussion toward its practical applicability and future potential in robotic harvesting systems.

4.1. Dataset

A limitation of the current dataset is that misclassifications can occur between adjacent stages, such as Stage 4 fruits being classified as Stage 2 and vice versa. These errors are partly due to subjective variations in color perception. To address this, a review of the labels, potentially involving multiple evaluators, may be necessary to improve labeling consistency. Moreover, the proposed method is not fully applicable across all blueberry varieties. Variability in orchard backgrounds and ambient illumination can distort perceived maturity color, thereby reducing model performance. To ensure robust detection and accurate maturity classification across diverse cultivars and conditions, the training dataset must include a broad and representative set of images. Another limitation of this research is that the reference method for validating fruit maturity, based on a 1980 publication, relies solely on color and overlooks other key ripeness indicators such as weight, texture, sugar content, and acidity. Although our method does not directly measure internal quality attributes, the use of peel color as a maturity indicator is supported by previous studies that demonstrate strong correlations between color and internal ripeness parameters [2,23]. Future work could integrate multispectral imaging or NIR sensors to capture these internal traits more directly.

4.2. Applicability to Robotic Harvesting

Apart from the above limitation, although the proposed system is not directly applicable to conventional mechanical harvesters, it holds significant potential for integration into future robotic harvesting platforms.
Blueberries for the fresh market are hand-harvested, since the quality and shelf life are highly important [24]. In contrast, large-scale machinery has been put into practical use for harvesting fruits for processing. The harvesters have used rotary or sway mechanisms to remove the berries from the trees, so machine-harvested berries must be sorted to remove unripe fruit. If farmers could non-destructively measure the ripeness of fruits growing on trees using drones or simple cameras, it would enable determining the optimal timing for introducing harvesting machinery and reducing labor in sorting operations.
Current robotic harvesting systems for small fruits such as blueberries face major challenges, including slow picking speed, occlusion by foliage, and difficulty in detecting individual ripe fruits [25,26,27]. Our method, which combines object detection and fine-grained maturity classification using a Vision Transformer [19], can contribute to solving the fruit identification problem under occlusion and varying lighting conditions. Furthermore, while commercial postharvest grading systems (e.g., TOMRA KATO260, Ellips-Elifab, WECO Sortivator) already achieve high accuracy in sorting based on external color and defects, our approach offers a lightweight, field-deployable alternative that can be embedded into robotic platforms for preharvest applications [28]. In contrast to commercial systems, our proposed method offers a lightweight, low-cost, and portable solution that can be deployed in the field using consumer-grade cameras. This enables on-site maturity assessment before harvest, which is not addressed by current commercial systems. Furthermore, our approach leverages a Vision Transformer to capture subtle color variations and contextual features, which may enhance classification robustness under variable lighting and occlusion conditions. Therefore, the proposed system complements existing postharvest technologies [29,30] by enabling preharvest decision-making and potentially reducing the burden on downstream sorting processes. This opens the possibility of real-time, in-field maturity assessment, enabling selective harvesting and reducing postharvest sorting costs.

5. Conclusions

In this study, we proposed a method for classifying blueberry fruit maturity levels from smartphone images, combining an object detection module with a classification module. YOLOv8 was employed for object detection, and a Vision Transformer was used for classification, demonstrating effective performance. A dataset was constructed using images captured in the TUAT orchard, with a color chart enabling precise labeling of fruit maturity levels with five levels. The experimental results showed that the proposed method achieved an average classification accuracy of 93.7%, indicating its potential as a reliable tool for automated blueberry maturity assessment.

Author Contributions

Conceptualization, I.S. and T.B.; methodology, I.S.; software, I.E.; validation, I.E., R.S. and I.S.; formal analysis, I.S.; investigation, I.E. and S.N.; resources, S.N. and T.B.; data curation, I.E.; writing—original draft preparation, I.E.; writing—review and editing, R.S.; visualization, I.E.; supervision, I.S.; project administration, I.S.; funding acquisition, I.S. All authors have read and agreed to the published version of the manuscript.

Funding

This work was partly supported by JSPS KAKENHI Grant Number K07B292162F.

Institutional Review Board Statement

Not applicable.

Informed Consent Statement

Not applicable.

Data Availability Statement

The data presented in this study are not publicly available due to privacy or ethical restrictions.

Conflicts of Interest

The authors declare no conflicts of interest.

References

  1. Zapien-Macias, J.M.; Liu, T.; Nunez, G.H. Blueberry ripening mechanism: A systematic review of physiological and molecular evidence. Hortic. Res. 2025, 12, 8. [Google Scholar] [CrossRef] [PubMed]
  2. Smrke, T.; Stajner, N.; Cesar, T.; Verberic, R.; Hudina, M.; Jakopic, J. Correlation between Destructive and Non-Destructive Measurements of Highbush Blueberry Fruit during Maturation. Horticulturae 2023, 9, 501. [Google Scholar] [CrossRef]
  3. Li, H.; Lee, W.S.; Wang, K. Identifying blueberry fruit of different growth stages using natural outdoor color images. Comput. Electron. Agric. 2014, 106, 91–101. [Google Scholar] [CrossRef]
  4. Yang, C.; Lee, W.S.; Gader, P. Hyperspectral band selection for detecting different blueberry fruit maturity stages. Comput. Electron. Agric. 2014, 109, 23–31. [Google Scholar] [CrossRef]
  5. Gonzalez, S.; Arellano, C.; Tapia, J.E. Deepblueberry: Quantification of blueberries in the wild using instance segmentation. IEEE Access 2019, 7, 105776–105788. [Google Scholar] [CrossRef]
  6. Muñoz, P.B.C.; Sorogastua, E.M.F.; Gardini, S.R.P. Detection and classification of ventura-blueberries in five levels of ripeness from images taken during pre-harvest stage using deep learning techniques. In Proceedings of the 2022 IEEE ANDESCON, Barranquilla, Colombia, 16–19 November 2022; IEEE: Piscataway, NJ, USA, 2022; pp. 1–6. [Google Scholar]
  7. Varghese, R.; Sambath, M. Yolov8: A novel object detection algorithm with enhanced performance and robustness. In Proceedings of the 2024 International Conference on Advances in Data Engineering and Intelligent Computing Systems (ADICS), Chennai, India, 18–19 April 2024; IEEE: Piscataway, NJ, USA, 2024; pp. 1–6. [Google Scholar]
  8. Muñoz, P.B.C.; Kemper, R.J.H.; Gardini, S.R.P. Artificial vision strategy for Ripeness assessment of Blueberries on Images taken during Pre-harvest stage in Agroindustrial Environments using Deep Learning Techniques. In Proceedings of the 2023 IEEE XXX International Conference on Electronics, Electrical Engineering and Computing (INTERCON), Lima, Peru, 2–4 November 2023; IEEE: Piscataway, NJ, USA, 2023; pp. 1–6. [Google Scholar]
  9. Yang, W.; Ma, X.; An, H. Blueberry Ripeness Detection Model Based on Enhanced Detail Feature and Content-Aware Reassembly. Agronomy 2023, 13, 1613. [Google Scholar] [CrossRef]
  10. Liu, Y.; Zheng, H.; Zhang, Y.; Zhange, Q.; Chen, H.; Xu, X.; Wang, G. Is this blueberry ripe?: A blueberry ripeness detection algorithm for use on picking robots. Front. Plant Sci. 2023, 14, 1198650. [Google Scholar] [CrossRef] [PubMed]
  11. MacEachern, C.B.; Esau, T.J.; Schumann, A.W.; Hennessy Patrick, J.; Zaman, Q.U. Detection of fruit maturity stage and yield estimation in wild blueberry using deep learning convolutional neural networks. Smart Agric. Technol. 2023, 3, 100099. [Google Scholar] [CrossRef]
  12. Esaki, I.; Noma, S.; Ban, T.; Sultana, R.; Shimizu, I. Maturity classification of blueberry fruit from camera image for cultivation support system. In Proceedings of the 2025 7th International Conference on Image, Video and Signal Processing, Kunming, China, 14–16 November 2025; pp. 75–79. [Google Scholar]
  13. Shutak, V.G.; Gough, R.E.; Windus, N.D. The Cultivated Highbush Blueberry: Twenty Years of Research; Rhode Island Agricultural Experiment Station Bulletin, University of Rhode Island, Dept. of Plant and Soil Science: Kingston, RI, USA, 1980; 428p. [Google Scholar]
  14. Sanhueza, D.; Balic-Norambuena, I.; Sepúlveda-Orellana, P.; Siña-López, S.; Moreno, A.A.; María Alejandra Moya-León, M.A.; Saez-Aguayo, S. Unraveling cell wall polysaccharides during blueberry ripening. Front. Plant Sci. 2024, 15, 1422917. [Google Scholar] [CrossRef] [PubMed]
  15. Acharya, T.P.; Nambeesan, S.U. Ethylene-releasing plant growth regulators promote ripening initiation by stimulating sugar, acid and anthocyanin metabolism in blueberry (Vaccinium ashei). BMC Plant Biol. 2025, 25, 766. [Google Scholar] [CrossRef] [PubMed]
  16. Chiabrando, V.; Giacalone, G. Anthocyanins, phenolics and antioxidant capacity after fresh storage ofblueberry treated with edible coatings. INternational J. Food Sci. Nutr. 2015, 66, 248–253. [Google Scholar] [CrossRef] [PubMed]
  17. Zifkin, M.; Jin, A.; Ozga, J.A.; Zaharia, L.I.; Schernthaner, J.P.; Gesell, A.; Abrams, S.R.; Kennedy, J.A.; Constabel, C.P. Gene Expression and Metabolite Profiling of Developing Highbush Blueberry Fruit Indicates Transcriptional Regulation of Flavonoid Metabolism and Activation of Abscisic Acid Metabolism. Plant Physiol. 2012, 158, 200–224. [Google Scholar] [CrossRef] [PubMed]
  18. Yamagishi, S.; Ito, N.; Takeda, H.; Hirose, Y. Blueberry fruit detachment when vibrating fruit and resultant branch units. Agric. Res. 2002, 37, 25–32. (In Japanese) [Google Scholar]
  19. Steiner, A.; Kolesnikov, A.; Zhai, X.; Wightman, R.; Uszkoreit, J.; Beyer, L. How to train your vit? data, augmentation, and regularization in vision transformers. arXiv 2021, arXiv:2106.10270. [Google Scholar]
  20. Tan, M.; Le, Q. Efficientnetv2: Smaller models and faster training. In International Conference on Machine Learning; PMLR: Cambridge, MA, USA, 2021; pp. 10096–10106. [Google Scholar]
  21. Howard, A.; Sandler, M.; Chu, G.; Chen, L.C.; Chen, B.; Tan, M.; Wang, W.; Zhu, Y.; Pang, R.; Vasudevan v VLe, Q.; et al. Searching for mobilenetv3. In Proceedings of the IEEE/CVF International Conference on Computer Vision, Seoul, Republic of Korea, 27 October–2 November 2019; pp. 1314–1324. [Google Scholar]
  22. Szegedy, C.; Ioffe, S.; Vanhoucke, V.; Alemi, A. Inception-v4, inception-resnet and the impact of residual connections on learning. In Proceedings of the AAAI Conference on Artificial Intelligence, San Francisco, CA, USA, 4–9 February 2017; Volume 31. [Google Scholar]
  23. Jia, Z.; JiYun, N.; Hui, Z.; Ye, L. Evaluation Indexes for Blueberry Quality. Sci. Agric. Sin. 2019, 52, 2128–2139. [Google Scholar]
  24. Steven, A.S.; Brecht, J.K.; Forney, C.F. Blueberry harvest and postharvest operations: Quality maintenance and food safety; Childers, N.F., Lyrene, P.M., Blueberries, E.O., Eds.; Painter Printing Company, Inc.: De Leon Springs, FL, USA, 2006; pp. 139–151. [Google Scholar]
  25. Zhou, H.; Wang, X.; Au, W.; Kang, H.; Chen, C. Intelligent robots for fruit harvesting: Recent developments and future challenges. Precis. Agric. 2022, 23, 1856–1907. [Google Scholar] [CrossRef]
  26. Chen, Z.; Lei, X.; Yuan, Q.; Qi, Y.; Ma, Z.; Qian, S.; Lyu, X. Key Technologies for Autonomous Fruit- and Vegetable-Picking Robots: A Review. Agronomy 2024, 14, 2233. [Google Scholar] [CrossRef]
  27. Wang, C.; Pan, W.; Zou, T.; Li, C.; Han, Q.; Wang, H.; Yang, J.; Zou, X. A Review of Perception Technologies for Berry Fruit-Picking Robots: Advantages, Disadvantages, Challenges, and Prospects. Agriculture 2024, 14, 1346. [Google Scholar] [CrossRef]
  28. TOMRA Food. Integrated Blueberry Solutions. 2025. Available online: https://www.tomra.com/food/categories/fruit/blueberries/ (accessed on 13 October 2025).
  29. Ellips, B.V. Ellips - Fruit Sorting and Grading Technology. 2024. Available online: https://ellips.com/grading-machine/blueberry/ (accessed on 13 October 2025).
  30. UNITEC S.p.A. UNITEC Blueberry Vision 3: Optical Sorting Technology. 2024. Available online: https://www.unitec-group.com/en/blueberry-vision-3/ (accessed on 13 October 2025).
Figure 1. Color chart for blueberry maturity levels.
Horticulturae 11 01272 g001
Figure 2. Color chart for blueberry maturity levels.
Horticulturae 11 01272 g002
Figure 3. Images of the classification dataset illustrate the blueberry fruit at various stages of ripeness. The stages are categorized as follows: (a) mature green; (b) green pink; (c) blue pink; (d) blue; (e) ripe.
Horticulturae 11 01272 g003
Figure 4. Overview of the proposed method for the classification of the maturity level of blueberry fruit.
Horticulturae 11 01272 g004
Figure 5. Confusion matrix (pattern 1).
Horticulturae 11 01272 g005
Figure 6. Precision–recall curve. (a) represents the curve for object detection. (b) represents the curve for segmentation.
Horticulturae 11 01272 g006
Figure 7. Precision–recall curve for pattern 1. (a) represents YOLOv8+Vision Transformer. (b) represents YOLOv8.
Horticulturae 11 01272 g007
Figure 8. Precision–recall curve for pattern 2. (a) represents YOLOv8+Vision Transformer. (b) represents YOLOv8.
Horticulturae 11 01272 g008
Figure 9. Precision–recall curve for pattern 3. (a) represents YOLOv8+Vision Transformer. (b) represents YOLOv8.
Horticulturae 11 01272 g009
Table 1. Blueberry fruit maturity stage indicators.
Maturity StageIndicator by Peel ColorColor Stage
Stage 1The entire fruit is green with a slight reddish tinge on the nape.Mature green
Stage 2About 1/2 of the fruit is reddish.Green pink
Stage 3Fruit reddish with slight bluish tinge.Blue pink
Stage 4The whole fruit is blue except around the small petiolar attachment.Blue
Stage 5The entire fruit is blue, including the area around the small petiolar attachment.Ripe
Table 2. Number of images in the fruit maturity classification dataset.
Stage 1Stage 2Stage 3Stage 4Stage 5
8186322291152712
Table 3. Accuracy comparison of classification modules (pattern 1).
ModelStage 1Stage 2Stage 3Stage 4Stage 5All
Conventional Method90.070.956.819.4100.089.7
EfficientNet v298.027.463.645.299.186.0
MobileNet v392.770.150.054.899.190.3
Inception v481.367.581.822.676.374.4
L∗a∗b28.776.140.967.787.673.3
Vision Transformer91.384.677.380.799.894.7
Table 4. Accuracy comparison of classification modules (pattern 2).
ModelStage 1Stage 2Stage 3Stage 4Stage 5All
Conventional Method73.070.812.70.099.682.2
EfficientNet v281.162.552.747.498.384.4
MobileNet v381.178.149.142.199.487.9
Inception v491.973.481.842.195.188.3
L∗a∗b28.464.647.378.987.470.7
Vision Transformer89.279.787.368.499.892.6
Table 5. Accuracy comparison of classification modules (pattern 3).
ModelStage 1Stage 2Stage 3Stage 4Stage 5All
Conventional Method78.784.434.50.099.889.3
EfficientNet v279.479.044.828.698.688.7
MobileNet v383.068.951.757.199.388.7
Inception v489.465.958.638.192.284.6
L∗a∗b37.671.934.576.288.075.3
Vision Transformer85.885.089.766.799.693.7
Table 6. Accuracy comparison of classification modules (average).
ModelStage 1Stage 2Stage 3Stage 4Stage 5All
Conventional Method80.675.434.76.599.887.1
EfficientNet v286.256.353.740.498.686.4
MobileNet v385.672.450.351.499.389.0
Inception v487.568.974.134.387.982.4
L∗a∗b31.670.940.974.387.773.1
Vision Transformer88.883.184.771.999.893.7
Table 7. Confusion matrix for object detection (proposed method).
PredictionTrue
Stage 1Stage 2Stage 3Stage 4Stage 5
Stage 110314001
Stage 213881010
Stage 3022910
Stage 4021220
Stage 50003469
Background34114587
Table 8. Confusion matrix for segmentation (conventional method).
PredictionTrue
Stage 1Stage 2Stage 3Stage 4Stage 5
Stage 19211001
Stage 21387910
Stage 3023010
Stage 4002211
Stage 50003468
Background45113587
Table 9. Classification on balanced dataset.
Stage 1Stage 2Stage 3Stage 4Stage 5All
EfficientNet v282.0%50.4%59.1%67.7%97.7%86.0%
MobileNet v368.0%47.9%56.8%54.8%93.5%80.2%
Inception v494.0%41.0%84.1%74.2%95.0%86.5%
Vision Transformer86.7%69.2%75.0%93.5%98.4%91.3%
Disclaimer/Publisher’s Note: The statements, opinions and data contained in all publications are solely those of the individual author(s) and contributor(s) and not of MDPI and/or the editor(s). MDPI and/or the editor(s) disclaim responsibility for any injury to people or property resulting from any ideas, methods, instructions or products referred to in the content.