Article

Integrative Multi-Omics Analysis Identified Tissue-Specific Volatile Metabolites in Populus koreana

1
College of Agriculture, Jilin Agricultural Science and Technology College, Jilin 132101, China
2
Institute of Forestry Science of Heilongjiang Province, Harbin 150081, China
3
School of Pharmacy, Harbin University of Commerce, Harbin 150040, China
4
State Key Laboratory of Tree Genetics and Breeding, Northeast Forestry University, Harbin 150040, China
*
Authors to whom correspondence should be addressed.
These authors contributed equally to this work.
Horticulturae 2025, 11(10), 1262; https://doi.org/10.3390/horticulturae11101262 (registering DOI)
Submission received: 1 September 2025 / Revised: 15 October 2025 / Accepted: 17 October 2025 / Published: 19 October 2025
(This article belongs to the Section Genetics, Genomics, Breeding, and Biotechnology (G2B2))

Abstract

Populus koreana emits a wide array of volatile organic compounds (VOCs) with potential ecological functions; however, the tissue-specific distribution and underlying regulatory mechanisms of these compounds remain poorly understood. This study employed an integrated approach combining gas chromatography-mass spectrometry (GC-MS)-based metabolomics and RNA-seq to systematically profile VOC composition and gene expression in terminal buds, stems and leaves of P. koreana. A total of 207 VOCs were identified, predominantly terpenes and aromatic compounds, exhibiting distinct tissue-specific accumulation patterns. Terminal buds were enriched in limonene and caryophyllene, while leaves showed higher concentrations of alcohols and phenolic aldehydes. Transcriptomic analysis revealed 12,733 differentially expressed genes (DEGs) among the three organs, with substantial enrichment in terpenoid and phenylpropanoid biosynthetic pathways. Notably, key upregulated genes in buds, including TPS21 and PAL1, correlated with observed VOC profiles. Weighted gene co-expression network analysis (WGCNA) further identified 6365 genes strongly associated with bud-specific VOC biosynthesis. Integrated omics analyses indicated coordinated regulation of phenylalanine metabolism and transcription factors in VOC production. These findings illuminate the molecular mechanisms underlying tissue-specific VOC accumulation in P. koreana, enhancing our understanding of metabolic specialization and ecological adaptation in woody plants.

1. Introduction

Populus koreana Rehder, a representative species of the Populus section, is extensively distributed throughout Northeast China, the Korean Peninsula and the Russian Far East. It shows remarkable ecological adaptability, characterized by substantial cold tolerance and the ability to thrive in nutrient-poor soils, establishing it as a key constructive species in montane mixed coniferous-broadleaf forest ecosystems. A notable biological attribute of this species is the continuous emission of distinctive aromatic volatiles from its vegetative organs, a trait particularly characteristic of the genus Populus within the Salicaceae family [1]. Studies have demonstrated that the unique aromatic profile of P. koreana is closely associated with specialized secondary metabolic pathways, which predominantly generate volatile organic compounds (VOCs) dominated by monoterpenes and sesquiterpenes. These metabolites serve as important chemotaxonomic markers while also exemplifying the unique metabolic regulatory mechanisms shaped through evolutionary adaptation. Nonetheless, substantial knowledge gaps remain regarding the spatial distribution and regulatory mechanisms of volatile substances emissions across different tissues and organs of P. koreana [2,3].
Plant VOCs act as essential chemical mediators in plant-environment interactions, facilitating a variety of ecological roles, including interspecific signaling, pollinator attraction and defense against herbivores and pathogens [4,5]. To date, more than 1700 VOCs have been identified. These low-molecular-weight, highly volatile secondary metabolites are primarily derived from four principal classes: terpenoids, phenylpropanoids, fatty acid derivatives and nitrogen-containing compounds [6,7]. The biosynthesis of VOCs is tightly regulated by the availability of carbon, nitrogen, sulfur and energy resources, underscoring the intrinsic linkage between primary and secondary metabolic processes [8]. Within the terpene biosynthetic pathway, the transformation of geranyl diphosphate (GPP) or farnesyl diphosphate (FPP) into volatile backbone structures by terpene synthase constitutes a critical step, followed by oxidative modifications typically mediated by cytochrome P450 monooxygenase [9,10]. In poplar species, two distinct pathways are involved in 2-phenylethanol biosynthesis: one mediated by CYP79 family P450 enzymes and aromatic aldehyde synthase (AAS), which drive the formation of volatile substances and the other involving aromatic amino acid decarboxylase (AADC), which contributes to the production of glycoside-bound derivatives [11,12]. Studies have shown that in Populus trichocarpa, PtAAS1 and PtAADC1, respectively, control the synthesis of free and bound forms of 2-phenylethanol in response to phytophagous insects. Specifically, PtAAS1 catalyzes the conversion of L-phenylalanine to phenylacetaldehyde, which subsequently gives rise to volatile 2-phenylethanol, whereas PtAADC1 contributes precursors for glycosylated products. Additionally, PtAAS2 displays in vitro catalytic activity comparable to that of PtAAS1, indicating a potentially redundant role in phenylacetaldehyde biosynthesis [12]. These AAS and AADC enzymes belong to the pyridoxal phosphate-dependent enzyme family and exhibit broad substrate flexibility within plant secondary metabolic pathways [13,14].
Gas chromatography-mass spectrometry (GC-MS) analyses of P. koreana, Populus suaveolens and Populus maximowiczii have identified 76 chemical constituents in bud exudates, among which 49 were phenolic compounds, including acetophenones, pinacatechin-3-acetate and caffeic acid fatty esters. Notably, amyl acetophenone was detected as the predominant component across all three species, resulting in strikingly similar chemical profiles [3]. Further research revealed that terpenes and ester compounds derived from the leaves of P. koreana constitute the principal chemical basis underlying its characteristic aromatic properties. Comparative genomic analyses have revealed a marked expansion of terpene synthase (TPS) genes in P. koreana compared with P. trichocarpa, with the encoded enzymes primarily involved in terpenoid biosynthesis. In particular, genes belonging to the TPS-a/b subfamilies are crucial for regulating the synthesis of monoterpenes and sesquiterpenes [15]. Similarly, in Litsea cubeba, the expression of the LcuTPS42 gene appears to be modulated by MYB transcription factors [16]. Coniferous species exhibit specialized defense mechanisms, for instance, expression of PtTPS2 can be induced more than ten-fold, promoting α-pinene synthesis, whereas spruce synthesizes defensive resin acids through the mevalonate (MVA) pathway [17]. Furthermore, studies have shown that herbivory by leaf beetles (Chrysomelidae) significantly stimulates the emission of defensive aldehyde oxime volatile substances in Populus nigra [11].
P. koreana possesses notable ecological and economic significance, the species’ production of VOCs contributes to environmental adaptation and defense responses and presents potential applications in landscaping and perfumery. The publication of a high-quality nuclear genome of P. koreana in 2023 has provided a foundation for gene mapping and functional investigation of aromatic metabolism [15]. To date, research on P. koreana has largely concentrated on taxonomy, disease management and geographic population distribution, with relatively few studies addressing tissue-specific biosynthetic pathways of aromatic compounds and their key regulatory genes [18,19]. The primary aim of the present study involves systematically investigating the gene expression profiles and differential accumulation of volatile metabolites in distinct tissues (terminal buds, stems, and leaves) of P. koreana. In the present study, two-year-old healthy P. koreana plants were employed as experimental material. By integrating transcriptomic and volatilomic (GC-MS) analyses, we systematically examined gene expression profiles and the differential accumulation of volatile metabolites in terminal buds, stems and leaves. These findings highlight key molecular targets for enhancing aromatic traits in forest trees through molecular breeding and lay the groundwork for the development of novel aromatic resources.

2. Results

2.1. Identification of VOCs in Different Tissues of P. koreana

To profile tissue-specific aromatic compounds in P. koreana, we performed a systematic non-targeted metabolomic analysis using gas chromatography-mass spectrometry (GC-MS) on terminal buds (DY), stems (JD) and leaves (YP) (Figure 1A). This analysis identified 207 VOCs, with absolute quantification data provided in Table S1. The detected VOCs were classified into eight categories: terpenes, aromatic compounds, heterocyclic compounds, aldehydes, ketones, alcohols, esters and sulfur/nitrogen-containing compounds. Among these, terpenes and aromatic compounds were the most abundant, accounting for 34.78% and 18.81% of the total VOCs, respectively, and representing the primary constituents of P. koreana’s aroma. Heterocyclic compounds (10.14%), ketones (5.80%), alcohols (8.21%) and esters (7.25%) were also present in notable amounts, while aldehydes and sulfur/nitrogen-containing compounds were less abundant, collectively making up 5.80% (Figure 1B). Principal component analysis (PCA) indicated that PC1 and PC2 explained 77.07% and 14.18% of the total variance, respectively. The score plot revealed clear spatial separation among samples from different tissues, highlighting significant tissue-specific differences in VOC composition across terminal buds, stems and leaves (Figure 1C). To further investigate tissue-specific differences in volatile metabolites, orthogonal partial least squares-discriminant analysis (OPLS-DA) was applied to compare DY, JD and YP of P. koreana. This analysis identified 77, 61 and 57 differential VOCs in the DY vs. YP, JD vs. YP and JD vs. DY comparisons, respectively (Figure 1D).

2.2. Identification of Tissue-Specific Differential VOCs in P. koreana

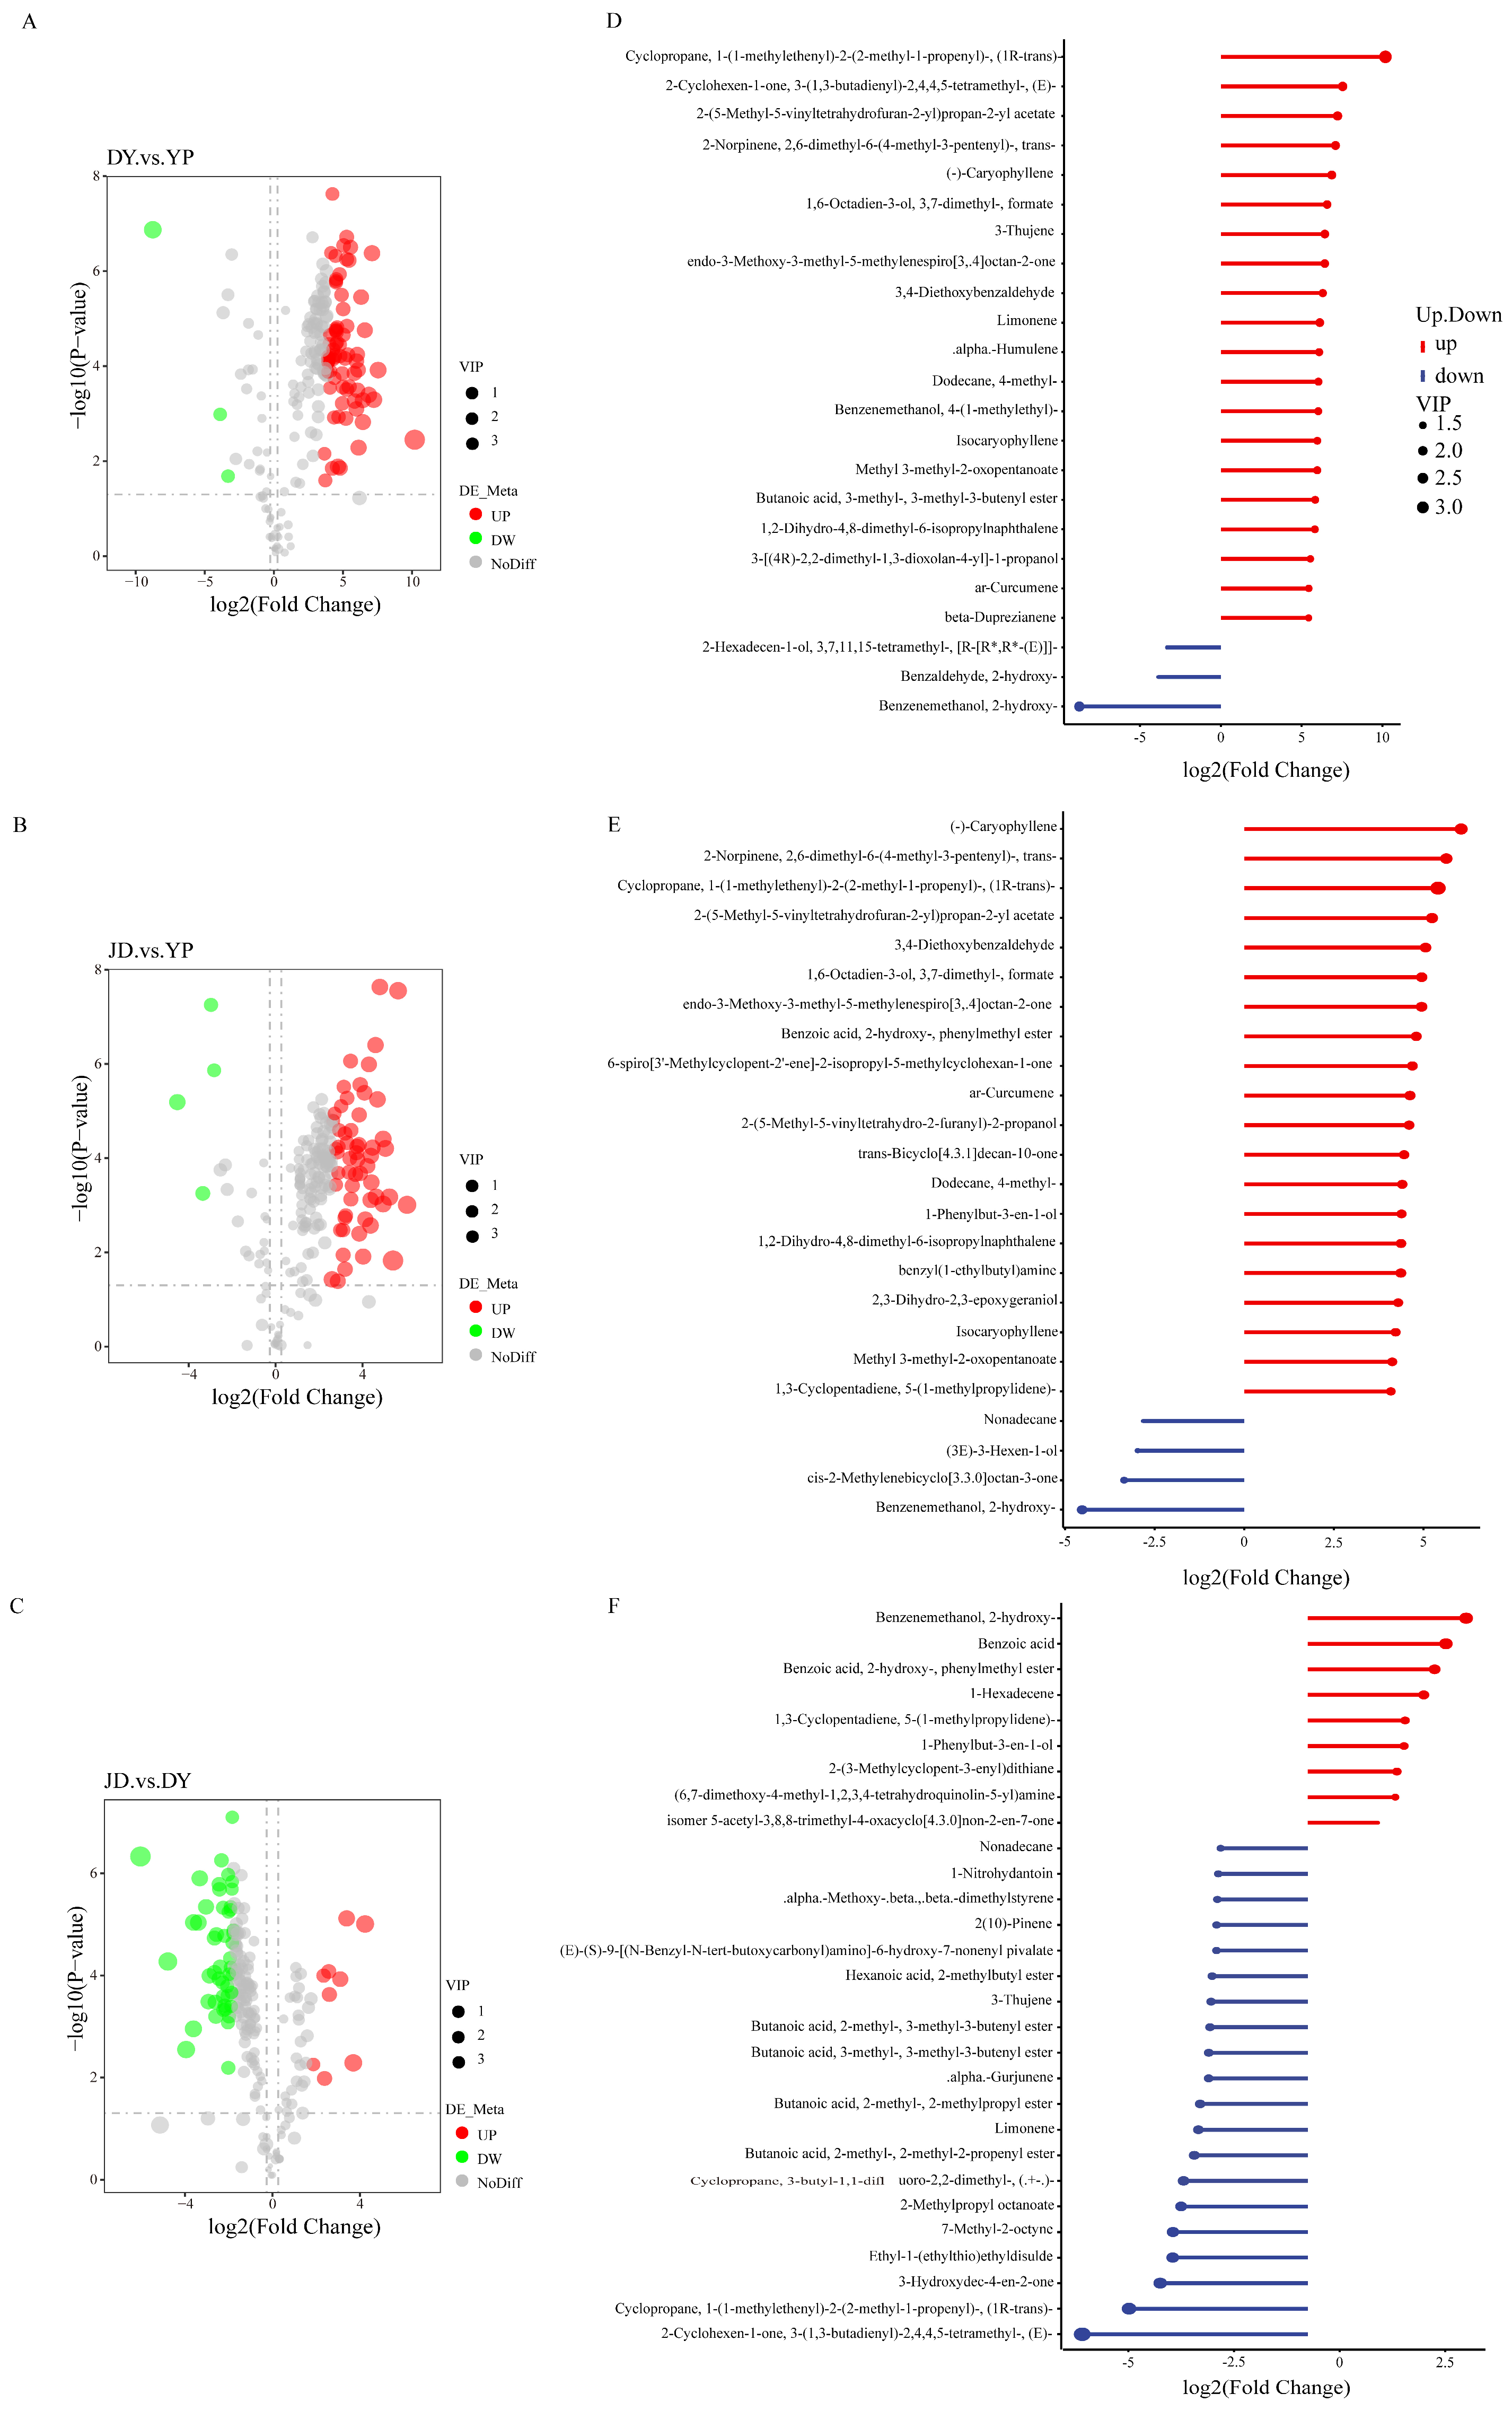
Among the tissues analyzed, terminal buds exhibited the highest number of upregulated differential VOCs (Figure 2A–C). In the DY vs. YP comparison, 74 differential VOCs were upregulated and 3 differential VOCs were downregulated in terminal buds (Figure 2A). As illustrated in Figure 2D, compounds such as (-)-Caryophyllene, α-Humulene, Isocaryophyllene, 3,4-Diethoxybenzaldehyde, trans-2-Norpinene, 2,6-dimethyl-6-(4-methyl-3-pentenyl)-, Benzenemethanol, 4-(1-methylethyl)-, Methyl 3-methyl-2-oxopentanoate, Butanoic acid, 3-methyl-, 3-methyl-3-butenyl ester, Cyclopropane, 1-(1-methylethenyl)-2-(2-methyl-1-propenyl)-,(1R-trans)-, 2-Cyclohexen-1-one, 3-(1,3-butadienyl)-2,4,4,5-tetramethyl-, (E)- and 2-Norpinene, 2,6-dimethyl-6-(4-methyl-3-pentenyl)-,trans- were significantly upregulated, while 2-Hexadecen-1-ol, Benzaldehyde, 2-hydroxy- and Benzenemethanol, 2-hydroxy- were downregulated. Compared to leaves, stems exhibited a substantial number of differential VOCs, with 57 upregulated and 4 downregulated (Figure 2B). VOCs that were abundant in terminal buds, such as (-)-Caryophyllene, Cyclopropane, 1-(1-methylethenyl)-2-(2-methyl-1-propenyl)-, (1R-trans)- and Isocaryophyllene, also showed significant upregulation in stems (Figure 2E). In the JD vs. DY comparison, only 9 differential VOCs were upregulated and 48 differential VOCs were downregulated in stems (Figure 2C). The main upregulated compounds included Benzenemethanol, 2-hydroxy-, Benzoic acid, Benzoic acid, 2-hydroxy-, phenylmethyl ester and 1-Phenylbut-3-en-1-ol, while α-Gurjunene, Limonene, 3-Thujene, 2(10)-Pinene, Hexanoic acid, 2-methylbutyl ester, Butanoic acid, 2-methyl-, 3-methyl-3-butenyl ester, 2-Methylpropyl octanoate and 2-Cyclohexen-1-one, 3-(1,3-butadienyl)-2,4,4,5-tetramethyl-, (E)-terpenes were downregulated (Figure 2F). These results indicate that the different tissues of P. koreana exhibit unique and tissue-specific VOC profiles. In comparison to leaves and stems, the terminal buds showed an overall upregulation of VOCs, with the key VOCs being terpenes and aromatic compounds.

2.3. Quantitative and Correlation Analysis of Differential VOCs

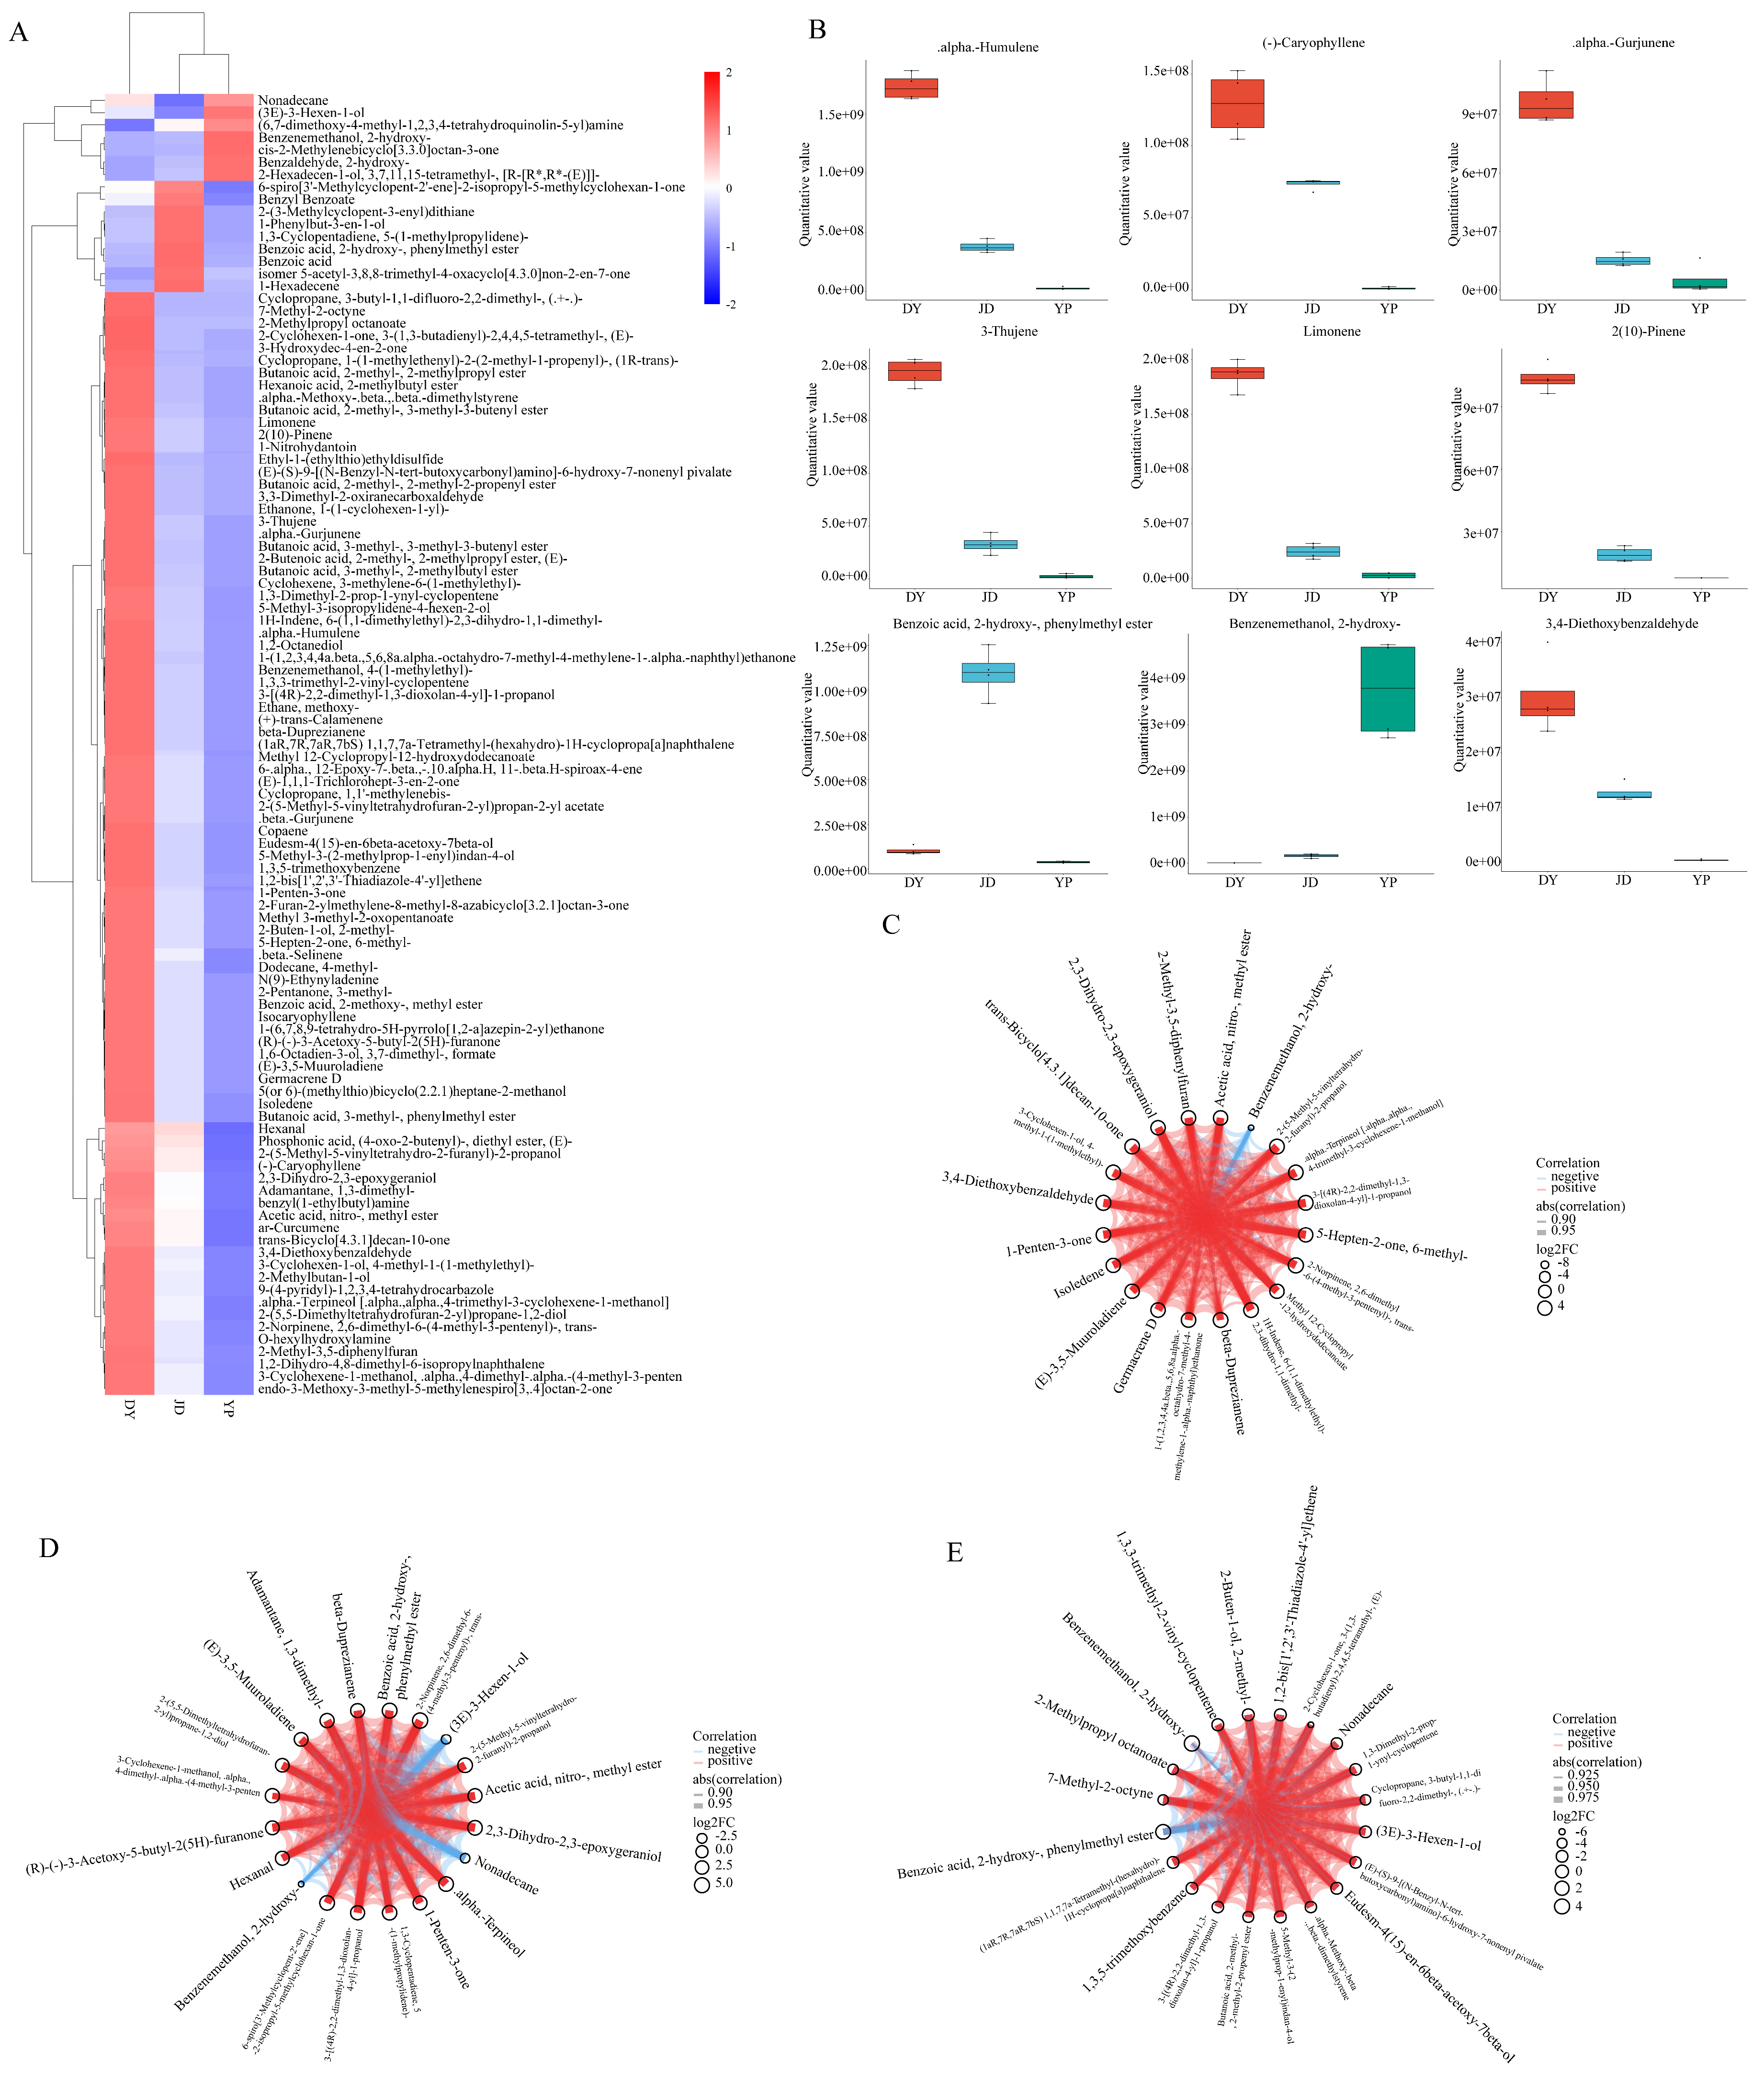
To further elucidate the aroma characteristics of different tissues in P. koreana, a cluster heatmap analysis of tissue-specific aroma-active compounds was performed. The analysis revealed distinct, tissue-specific VOC accumulation patterns across terminal buds, stems and leaves. Differential VOCs were most abundant in terminal buds, reduced in stems and lowest in leaves (Figure 3A). The tissue-specific accumulation of aromatic volatiles in P. koreana was further confirmed by quantitative analysis. As shown in Figure 3B, key aroma-active compounds such as Limonene, 2(10)-Pinene, 3-Thujene, (-)-Caryophyllene, α-Humulene, α-Gurjunene and 3,4-Diethoxybenzaldehyde were predominantly enriched in terminal buds. Conversely, compounds such as Benzoic acid,2-hydroxy-,phenylmethyl ester and Benzenemethanol,2-hydroxy- displayed tissue-specific distributions, being mainly localized in stems and leaves, respectively. Moreover, comprehensive correlation analysis of differential VOCs across tissues of P. koreana revealed a complex, tissue-specific network of metabolic interactions. In the DY vs. YP comparison, β-Duprezianene, Germacrene D and (E)-3,5-Muuroladiene exhibited strong positive correlations with most differentially accumulated VOCs, while Benzenemethanol,2-hydroxy- showed distinct negative correlations with other metabolites (Figure 3C). Comparisons between stems and leaves revealed that Benzenemethanol,2-hydroxy-, (3E)3-hexen-1-ol and Nonadecane were significantly positively correlated with β-Duprezianene, while α-Terpineo displayed positive correlations with the majority of VOCs (Figure 3D). In the JD vs. DY comparison, 1,2-bis(1′,2′,3′-thiadiazole-4′-yl)ethene, 2-cyclohexen-1-one, 5-methyl-3-(2-methylprop-1-enyl)indan-4-ol, Nonadecane and α-Methoxy-β,β-dimethylstyrene were positively correlated with other metabolites, whereas Benzoic acid,2-hydroxy-,phenylmethyl ester was negatively correlated with most metabolites but positively correlated with Benemethanol,2-hydroxy-. Additionally, the polycyclic terpene (1aR,7R,7aR,7bS)-1,1,7,7a-tetramethyl-1H-cyclopropa[a]naphthalene showed strong coordination with both 7-methyl-2-octyne and 2-methyl-2-buten-1-ol, suggesting potential functional linkages within their biosynthetic pathways (Figure 3E).

2.4. Identification of Differentially Expressed Genes (DEGs) in Different Tissues of P. koreana

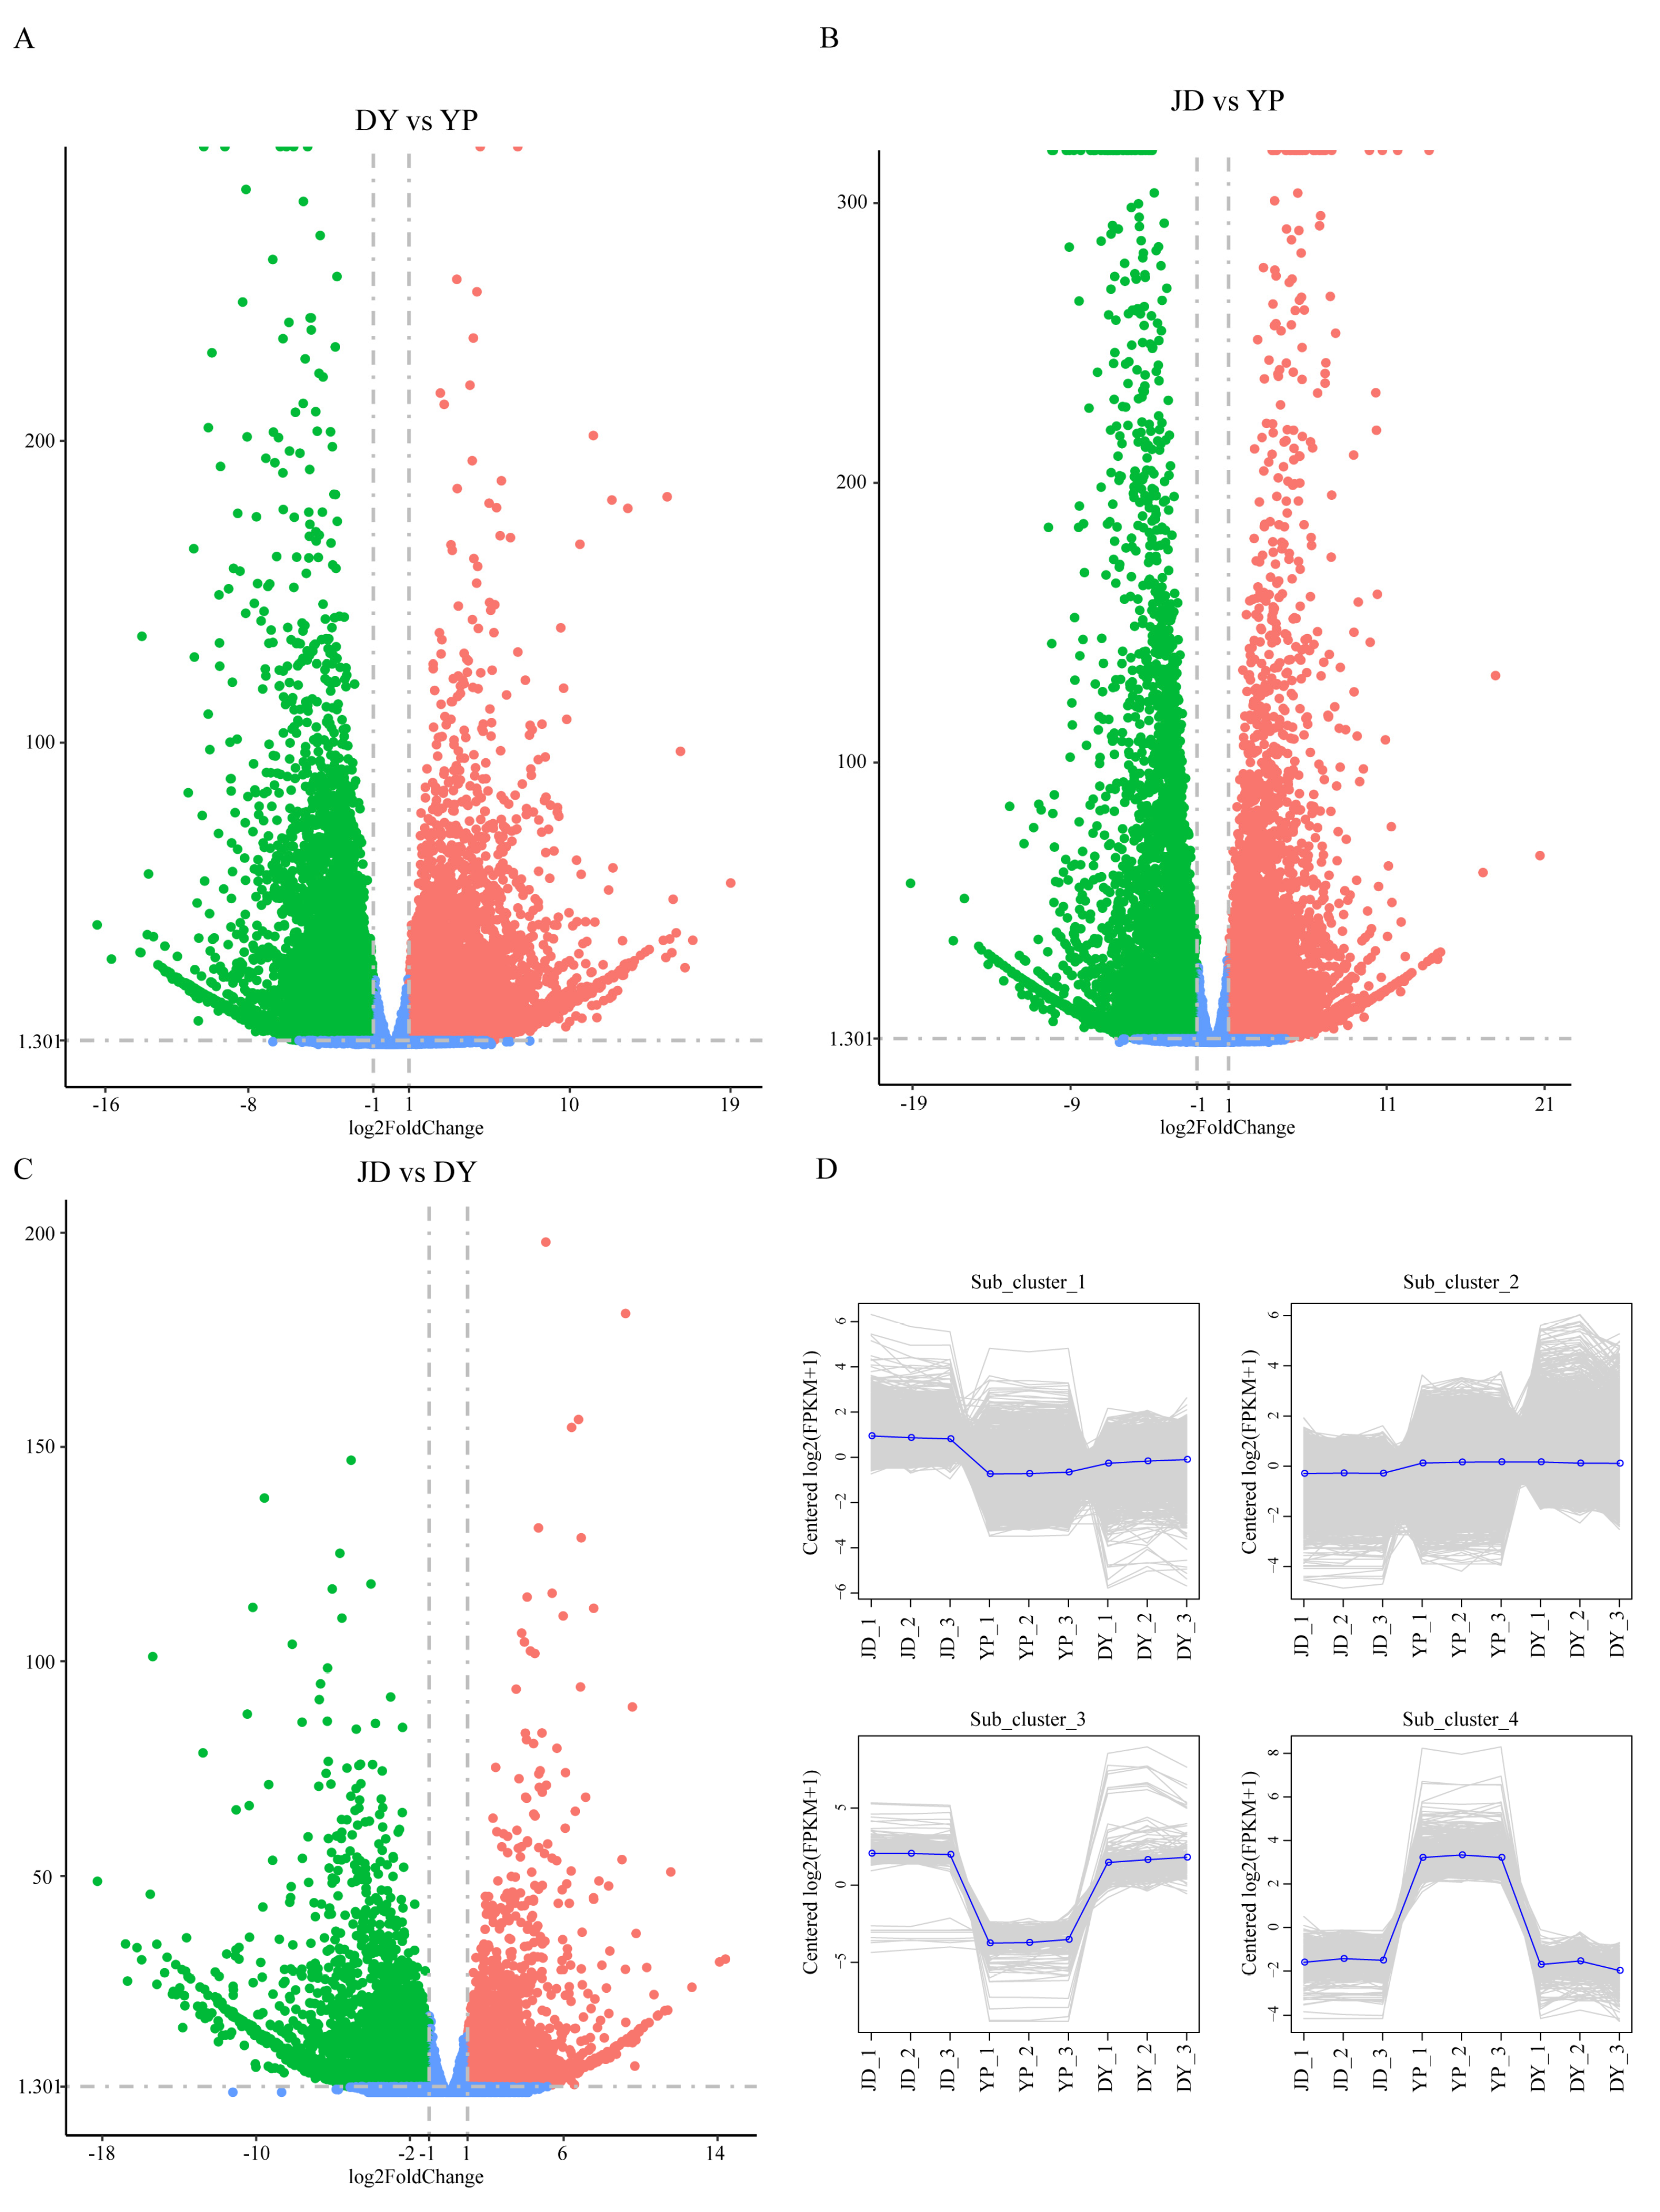
To investigate tissue-specific gene expression in P. koreana, RNA-seq was carried out on DY, JD and YP samples. Differential gene expression analysis using stringent criteria (|log2(FoldChange)| ≥ 1, p < 0.05) revealed distinct transcriptional profiles across tissue comparisons. In the DY vs. YP comparison, 12,733 DEGs were identified, including 6724 upregulated and 6009 downregulated genes (Figure 4A; Table S2). To verify the reliability of the transcriptome data, RT-qPCR was used to assess the expression of 9 DEGs that displayed relatively high FPKM values. The results showed expression patterns largely consistent with the transcript abundance observed in the transcriptome data, thereby validating the dataset (Figure S1). The JD vs. YP comparison yielded 11,971 DEGs (6061 upregulated, 5910 downregulated; Figure 4B), while the JD vs. DY comparison revealed fewer differences, with 6706 DEGs (2677 upregulated, 4029 downregulated; Figure 4C). K-means clustering analysis of all DEGs grouped 16,137 tissue-specific genes into four distinct expression clusters: cluster 1 (3376 genes), cluster 2 (12,183 genes), cluster 3 (165 genes) and cluster 4 (413 genes) (Figure 4D). These clustering results demonstrate distinct tissue-specific expression patterns in P. koreana.

2.5. Gene Ontology (GO) Function and KEGG Enrichment Analysis of DEGs

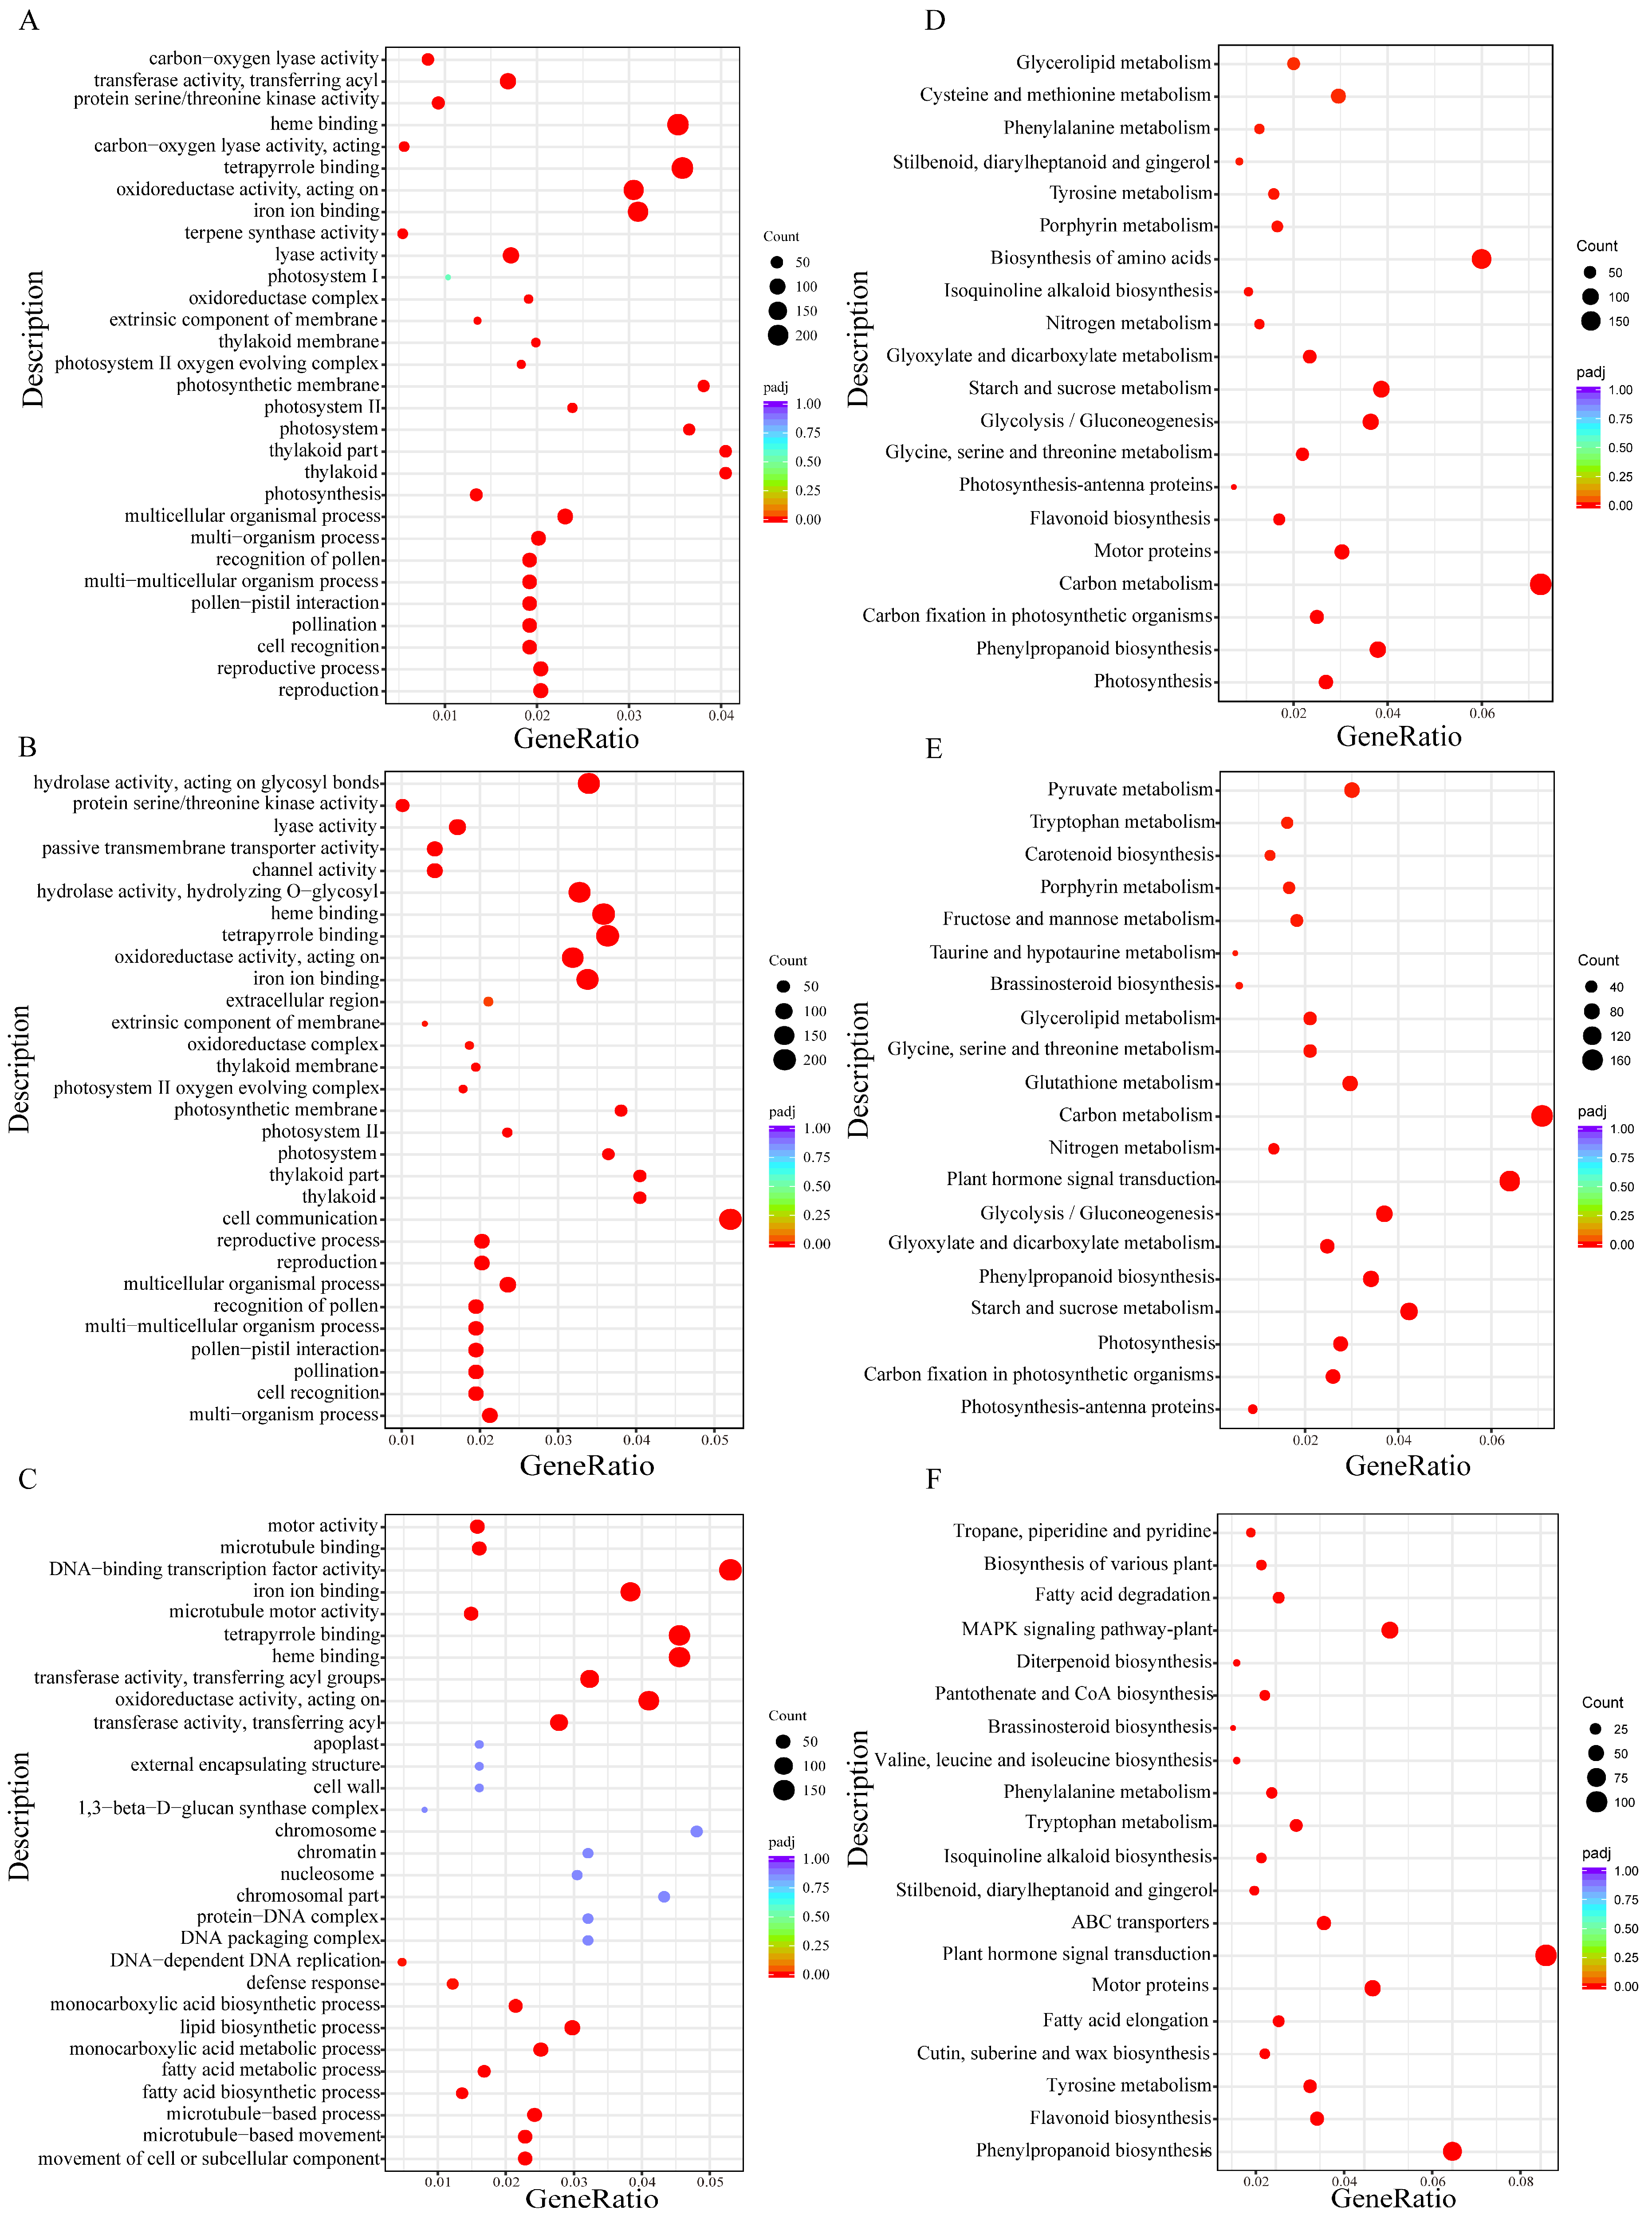
GO annotation and enrichment analysis of DEGs revealed distinct functional patterns among different tissues of P. koreana. Across the three comparison groups (DY vs. YP, JD vs. YP and JD vs. DY), shared molecular functions such as iron ion binding, tetrapyrrole binding, heme binding and oxidoreductase activity were significantly enriched. These DEGs were also enriched in cellular components related to photosynthetic machinery, particularly thylakoids and photosystem complexes (Figure 5A–C). Each comparison group displayed unique functional characteristics: DEGs between stems and leaves were specifically enriched in glycoside hydrolase activity and cell communication processes (Figure 5B), whereas DEGs from JD vs. DY showed preferential enrichment in DNA-binding transcription factor activity, acyltransferase activity and lipid and monocarboxylic acid metabolic processes (Figure 5C).
KEGG analysis showed that DEGs across the different comparison groups were mainly enriched in several metabolic pathways, including carbon metabolism, glycerolipid metabolism, nitrogen metabolism, phenylpropanoid biosynthesis, amino acid biosynthesis and metabolism and other secondary metabolic pathways. In the DY vs. YP comparison, DEGs were significantly enriched in core metabolic processes such as cysteine and methionine metabolism, carbon metabolism, starch/sucrose metabolism, glycolysis/gluconeogenesis and photosynthesis (Figure 5D). Meanwhile, in the JD vs. YP comparison, significant enrichment was observed in pyruvate metabolism, starch/sucrose metabolism, glutathione metabolism and plant hormone signal transduction pathways (Figure 5E). The comparison between stems and terminal buds showed that pathways such as plant hormone signaling, flavonoid biosynthesis, motor proteins, tropane/pyridine/pyridine alkaloid biosynthesis, diterpenoid biosynthesis, fatty acid degradation and MAPK signaling were uniquely enriched (Figure 5F). Notably, phenylpropanoid biosynthesis was significantly enriched across all comparison groups, while stilbenoid/diarylheptanoid/gingerol biosynthesis and isoquinoline alkaloid biosynthesis pathways were commonly enriched in the DY vs. YP and JD vs. DY comparisons (Figure 5D,F). Additionally, DY vs. YP and JD vs. YP comparisons shared enrichment in carbon metabolism, glycerolipid metabolism, nitrogen metabolism, glycolysis/gluconeogenesis, starch/sucrose metabolism and photosynthesis-antenna proteins pathways (Figure 5D,E). These results suggest the presence of conserved primary metabolic pathways alongside tissue-specific secondary metabolic pathways in P. koreana. The genes involved in phenylpropanoid biosynthesis, diterpenoid biosynthesis, plant hormone signaling and flavonoid biosynthesis pathways may play important roles in aroma-related metabolite production.

2.6. Weighted Gene Co-Expression Network Analysis (WGCNA) of VOC Biosynthesis

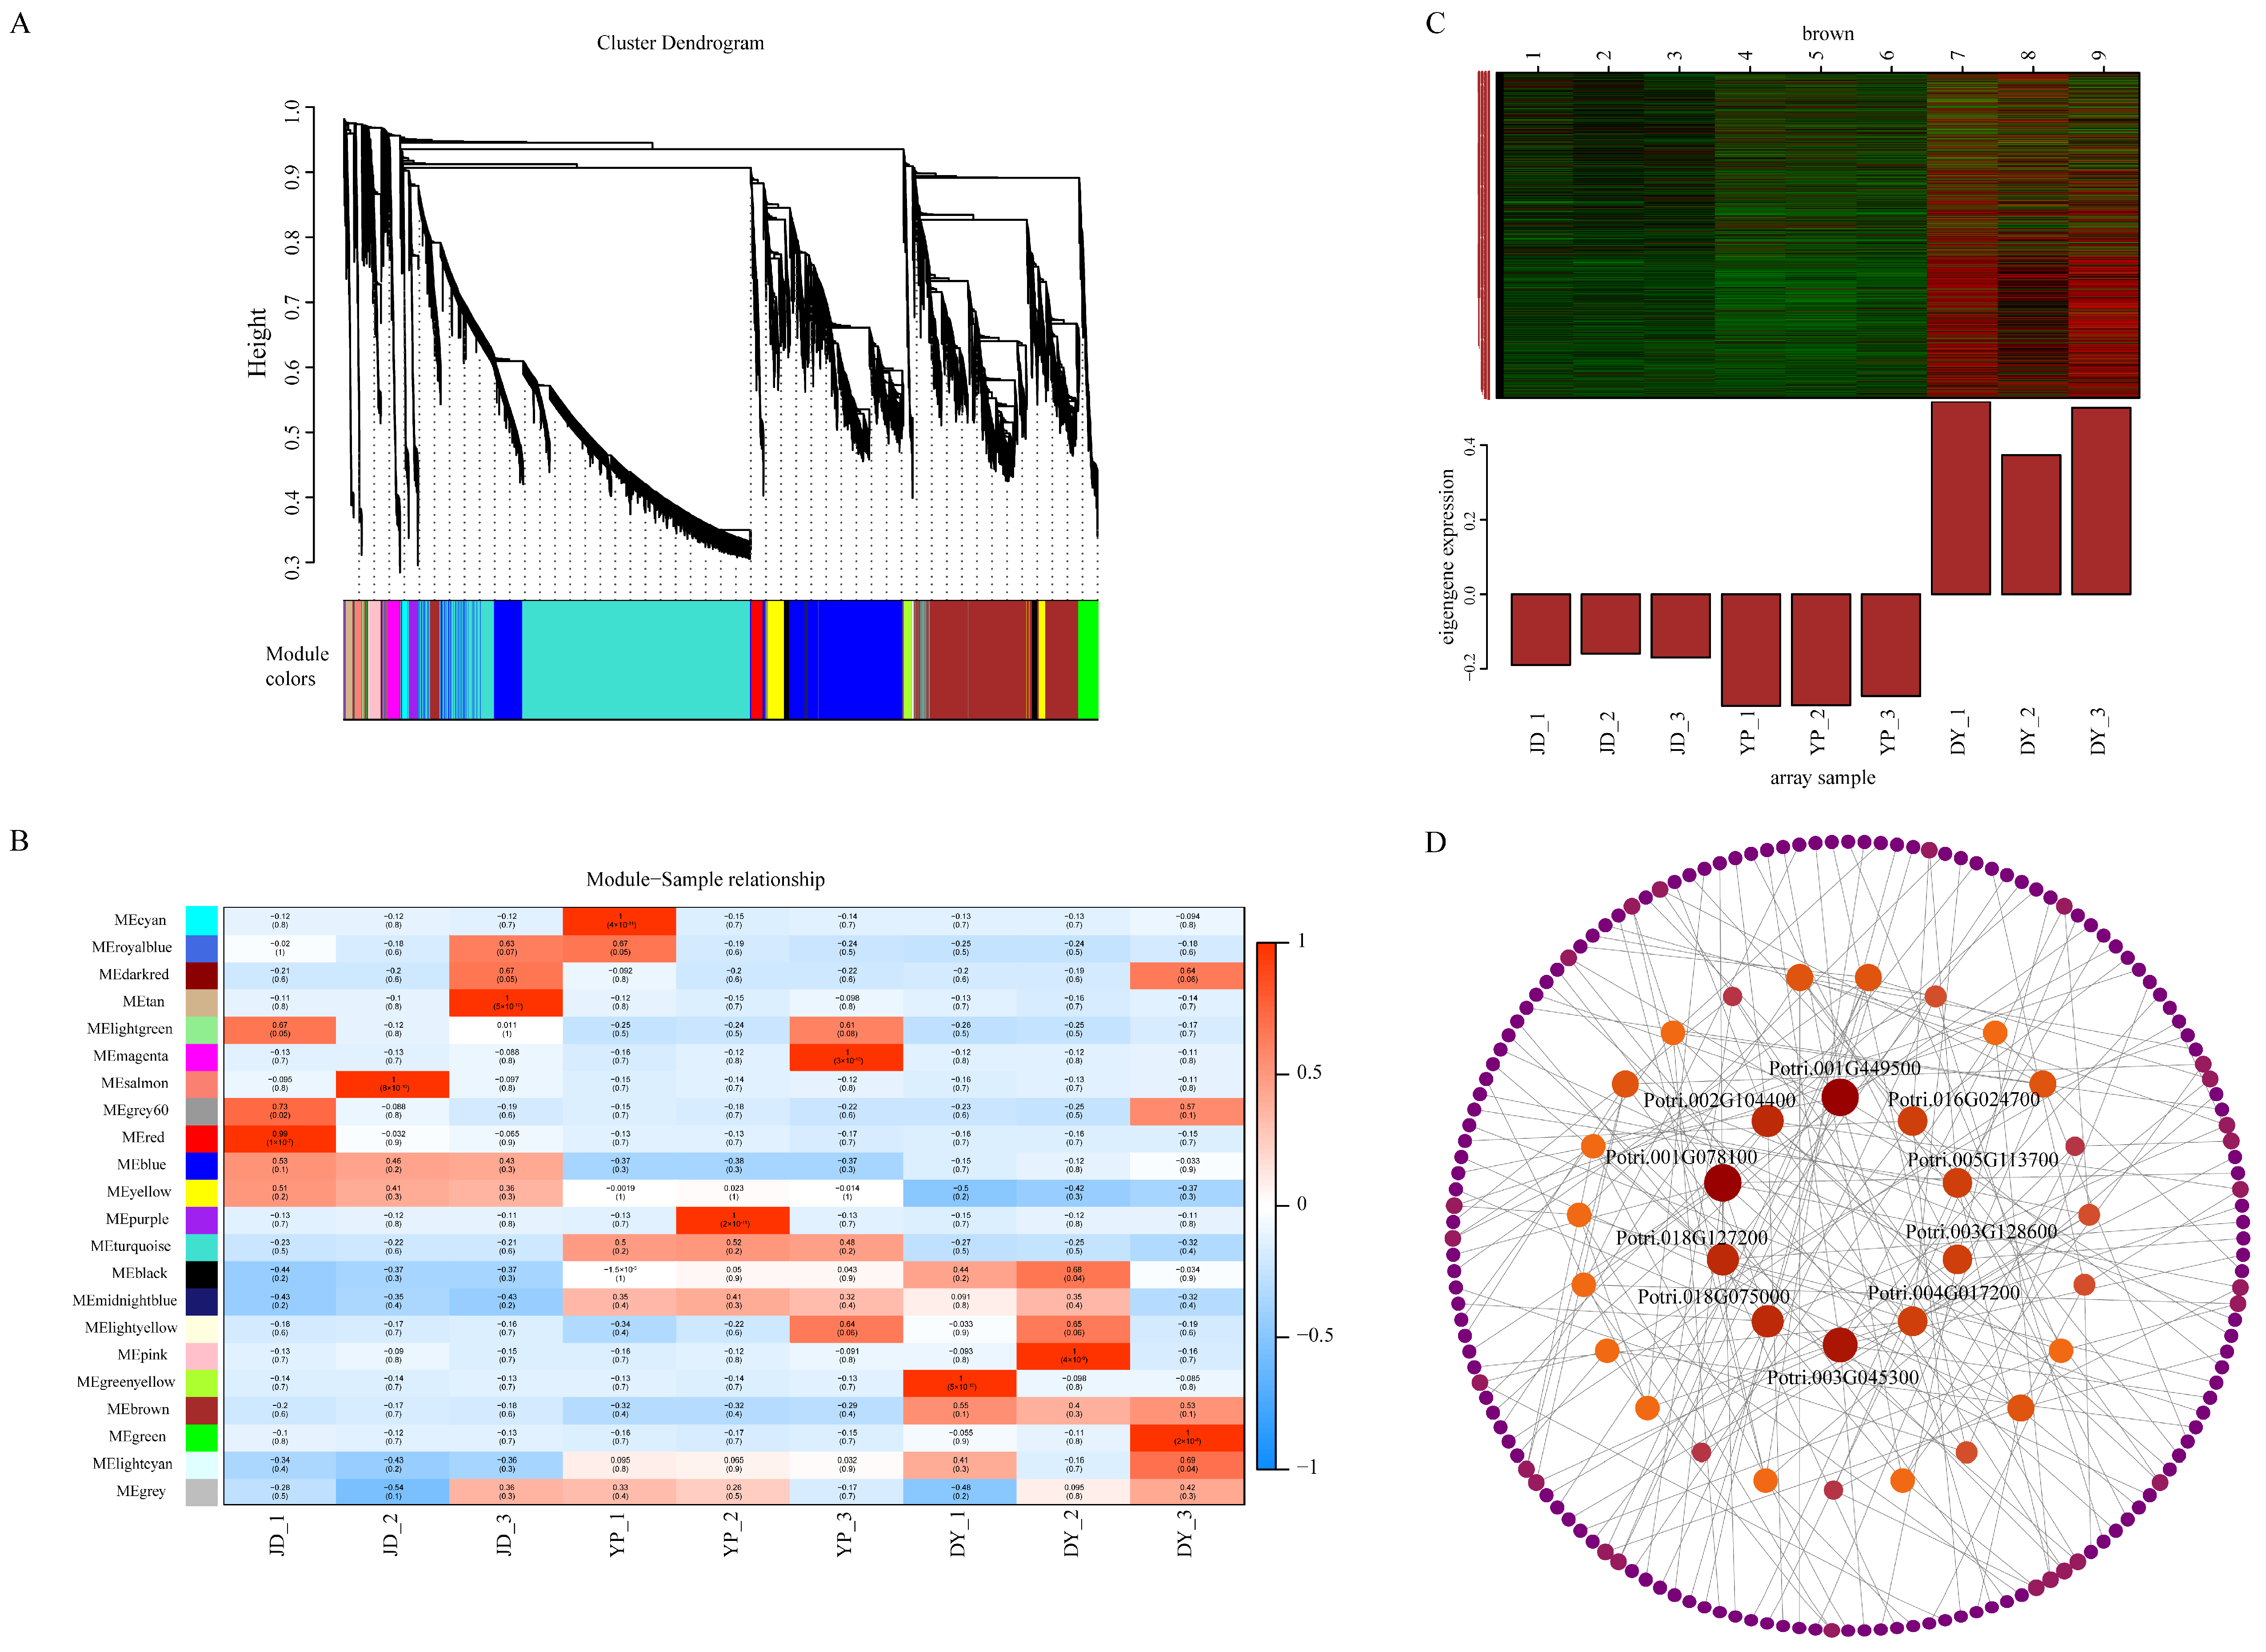
To further explore the regulatory mechanisms of genes involved in VOC biosynthesis across different tissues of P. koreana, WGCNA was conducted in this study. Hierarchical clustering identified 22 distinct gene co-expression modules, each exhibiting markedly different expression patterns among the DEGs (Figure 6A). These modules showed significant variation in DEG expression and displayed different correlations with the tissue samples. Notably, the “brown” module, comprising 6365 genes, was highly correlated with terminal buds (Figure 6B). This module displayed a distinctive expression profile, with many genes significantly upregulated in terminal buds but downregulated in stems and leaves (Figure 6C). Key hub genes within the “brown” module include Potri.001G449500 (encoding granule-bound starch synthase), Potri.001G078100 (encoding cell-wall binding lipoprotein YkyA-like), Potri.003G045300 (encoding ESCRT-related protein), Potri.002G104400 (encoding mitochondrial uncoupling protein 5), Potri.018G127200 (encoding ubiquitin system component cue protein), Potri.018G075000 (encoding aldehyde dehydrogenase family 2 member C4), Potri.004G017200 (encoding polyadenylate-binding protein), Potri.003G128600 (encoding aquaporin PIP1-1), Potri.005G113700 (encoding naringenin,2-oxoglutarate 3-dioxygenase) and Potri.016G024700 (encoding calmodulin) (Figure 6D).

2.7. Analysis of DEG Expression Patterns Across Diverse Metabolic Pathways

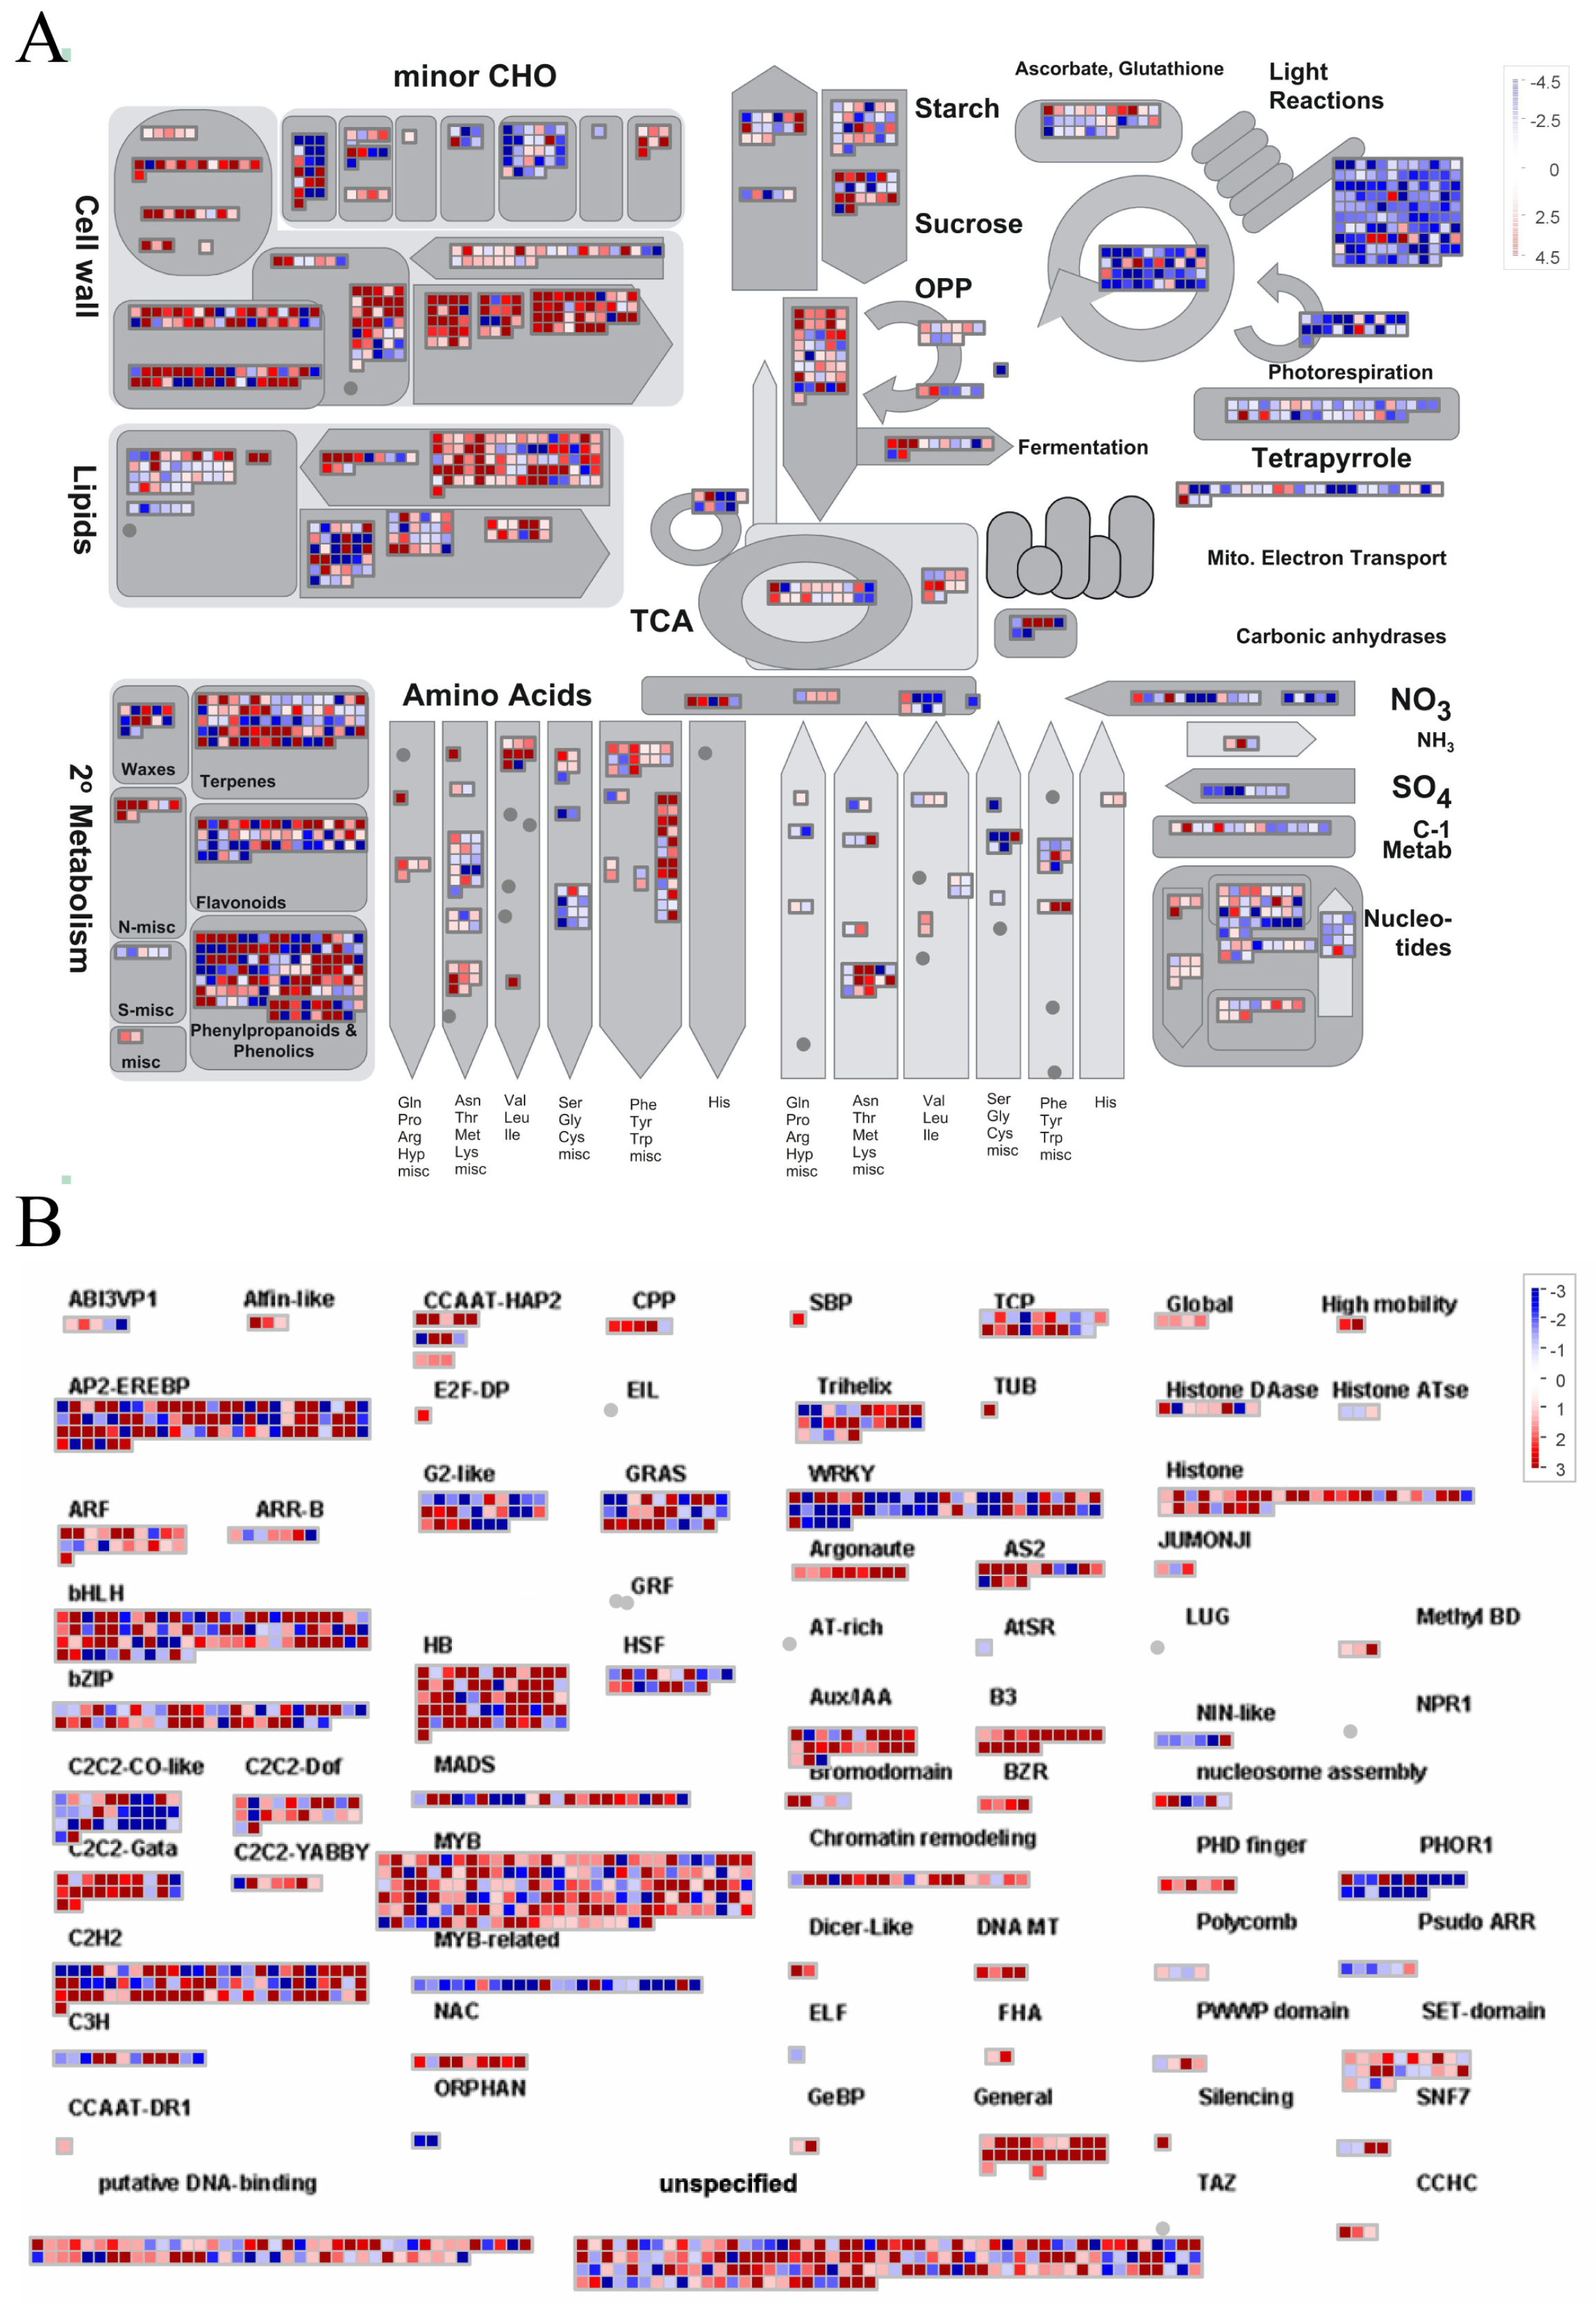
To comprehensively illustrate the expression patterns of DEGs across different metabolic pathways, we mapped the log2FC values (DY vs. YP, JD vs. YP, JD vs. DY) of DEGs onto their corresponding metabolic pathways and visualized the resulting expression patterns. As depicted in Figure 7A, compared to leaves, genes associated with sucrose-starch metabolism, carbohydrate metabolism, lipid metabolism, amino acid biosynthesis and metabolism and cell wall biosynthesis pathways in terminal buds were significantly upregulated. Conversely, genes related to photosynthesis were markedly downregulated in terminal buds. In the JD vs. DY comparison, genes linked to lipid metabolism and secondary metabolite biosynthetic pathways, notably terpenoid, flavonoid and phenylpropanoid synthesis in stems were significantly downregulated. Conversely, these gene expression changes point to a metabolic shift from photosynthetic activity in leaves toward secondary metabolite production in terminal buds, which may account for the tissue-specific accumulation patterns of VOCs (Figure S2A,B).
During the biosynthesis of volatile compounds, transcription factors (TFs) modulate gene expression by directly binding to cis-acting elements. A total of 1412, 1249 and 946 TFs were identified in the DY vs. YP, JD vs. YP and JD vs. DY comparisons, respectively. Genes encoding AP2/EREBP, ARF, bHLH, HB, MYB and C2H2 were significantly upregulated in the terminal buds, whereas WRKY, PHOR1 and C2C2-CO-like were downregulated (Figure 7B). The TF expression patterns observed in the DY vs. YP comparison were largely consistent with those in the JD vs. YP comparison (Figure S2C). However, in stems, TCP, AP2/EREBP, C2H2, MYB and WRKY genes showed downregulation relative to the terminal buds (Figure S2D). These varied gene expression patterns among TF families indicate a complex transcriptional regulation of volatile compounds biosynthesis, with different TFs influencing distinct components of the metabolic pathways.
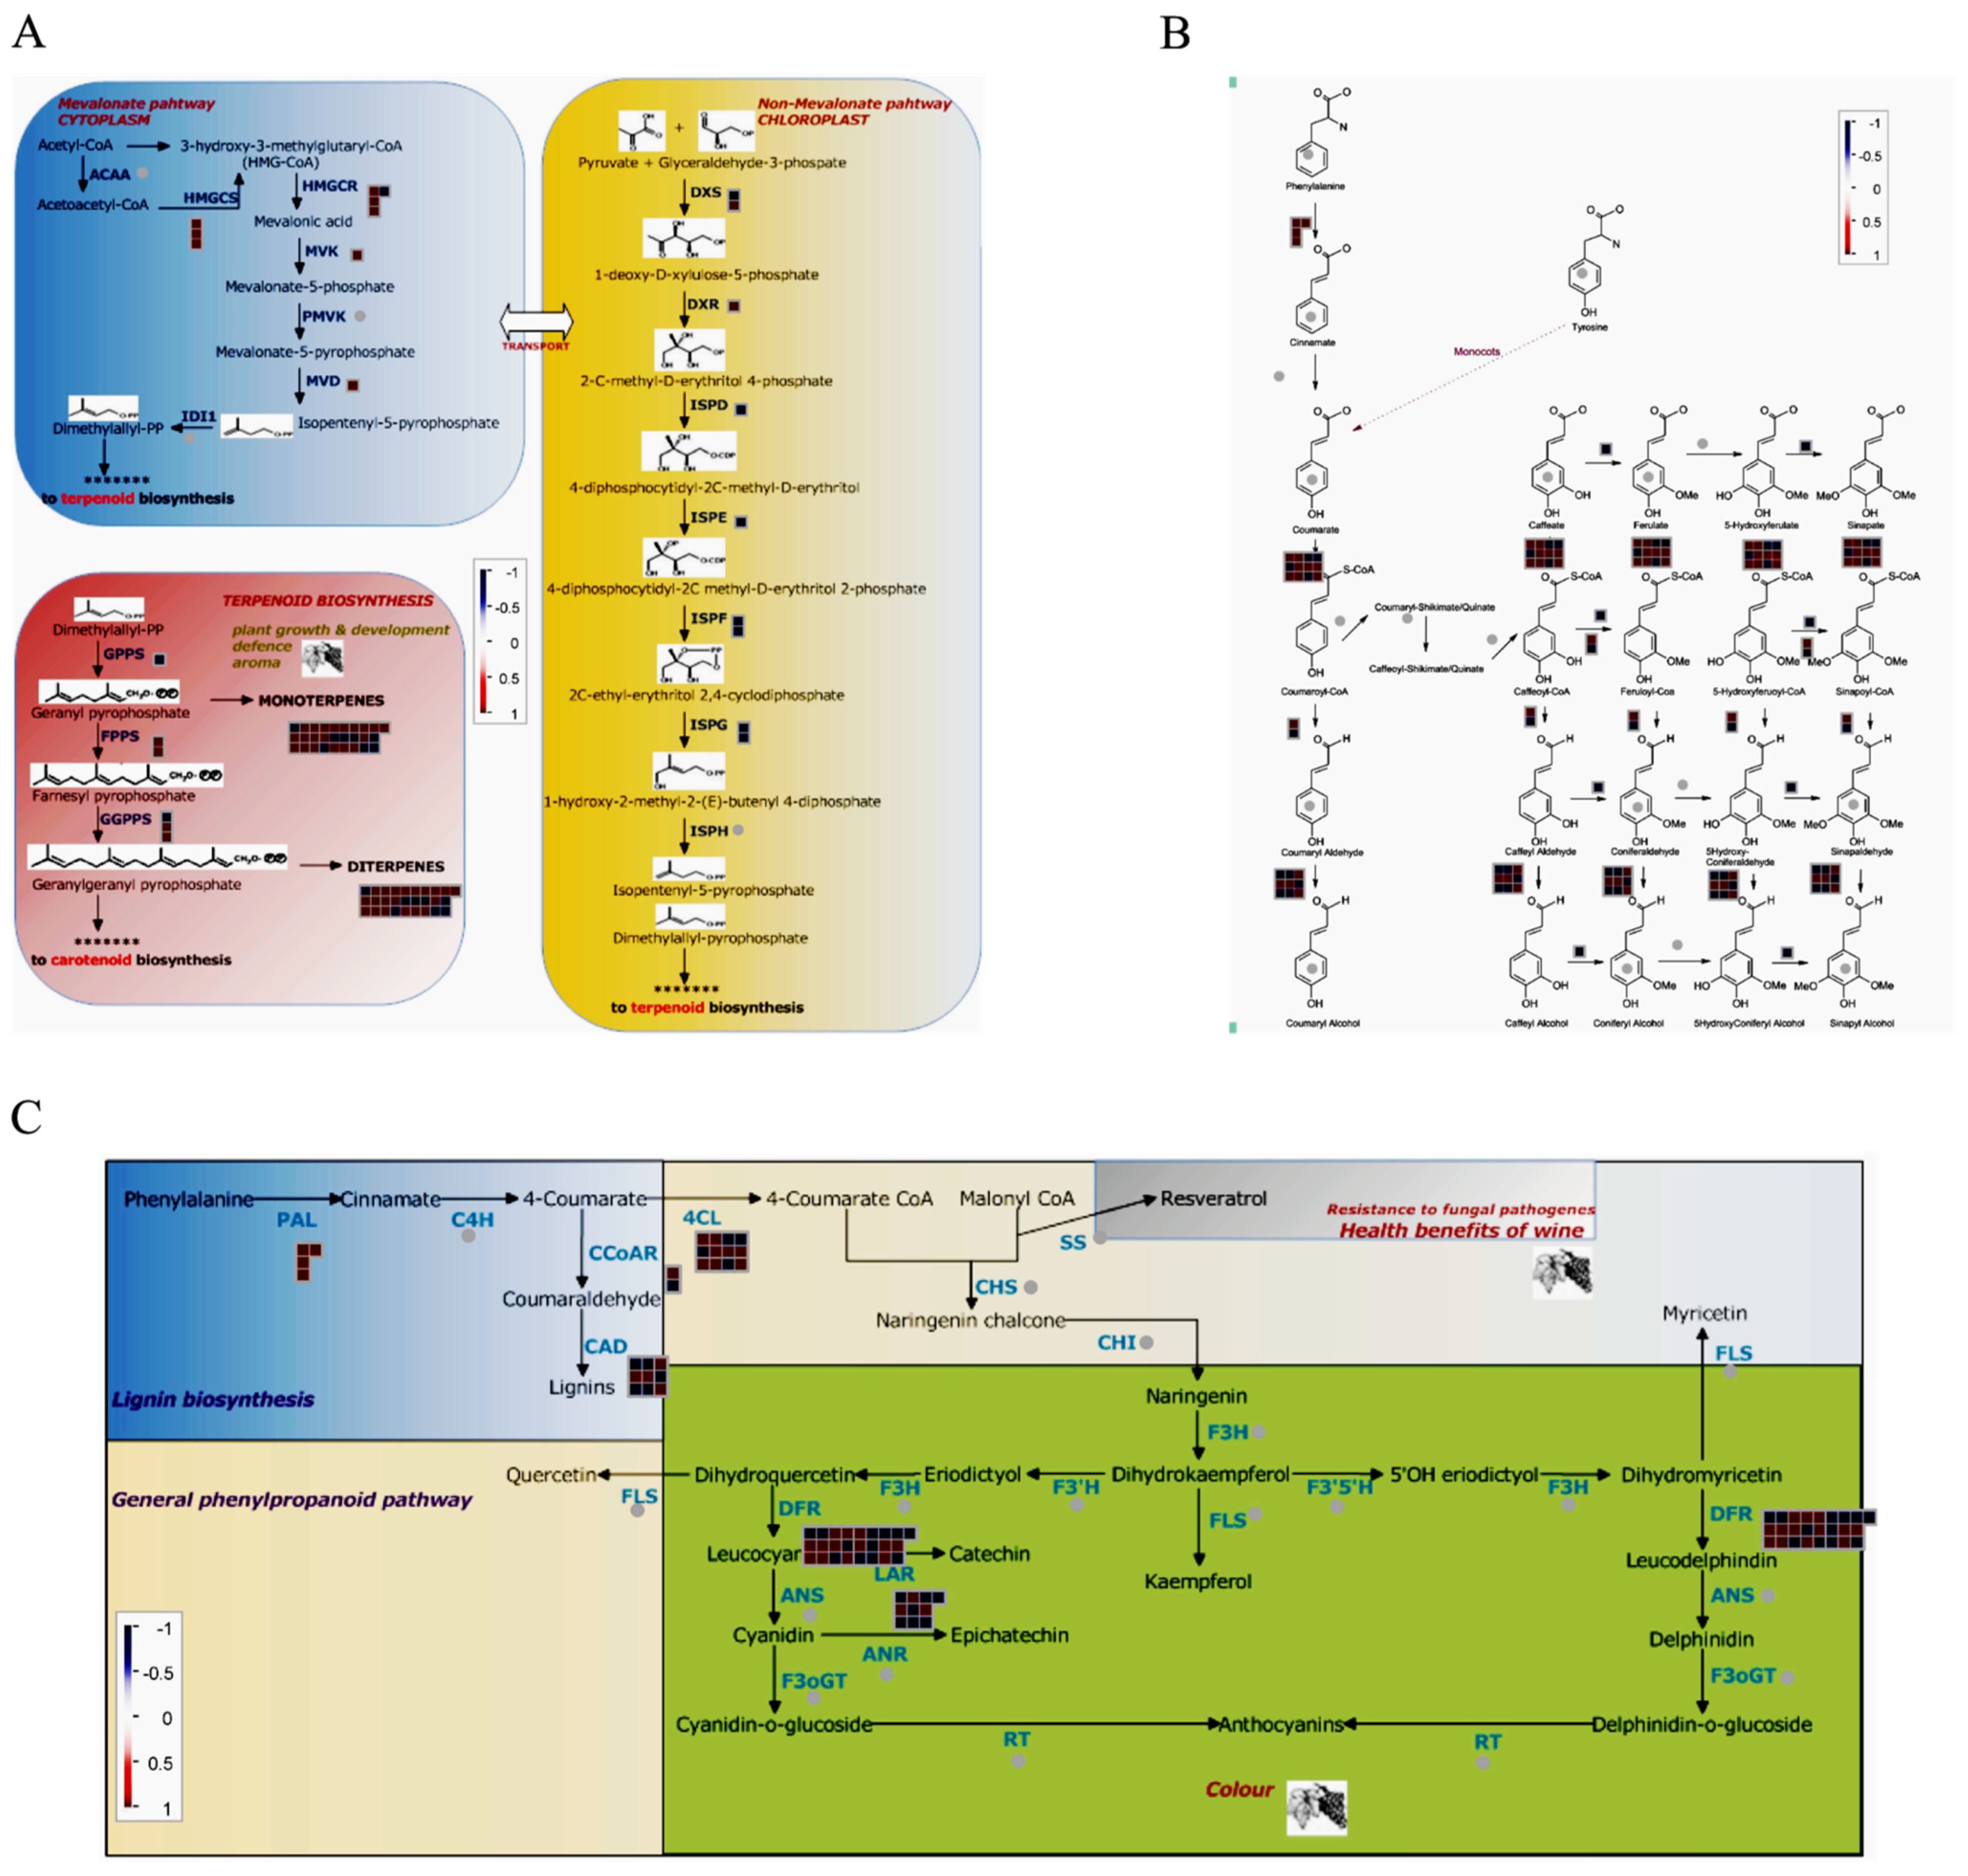
Terpene metabolism serves as the principal biosynthetic pathway generating VOCs in plants. In P. koreana, genes involved in terpenoid biosynthesis exhibit significant differential expression across tissues (Figure 8A and Figure S3A,B). Terminal buds exhibited significant upregulation of key terpene synthase genes, including TPS21, TPS3, TPS-CIN, CAMS1, TPS14, GA2 and CAS1, compared to leaves, consistent with tissue-specific patterns of terpenoid accumulation (Figure 8A). The phenylpropanoid pathway, which is crucial for aromatic VOC biosynthesis, also exhibited tissue-specific regulation. Terminal buds showed significant upregulation of key phenylpropanoid genes such as IOMT9, IOMT8, CCOAMT, HCBT1_DIACA, ACOS5A, PPO, CHAT, CAD9 and PAL1, whereas OPCL1, AAE14 and ELI3-2 were downregulated compared to leaves, likely contributing to differences in aromatic compound accumulation (Figure 8B and Figure S3C,D). Similarly, the flavonoid biosynthesis pathway, responsible for producing flavonoids, lignin, lignans and stilbenes that influence aromatic profiles, was markedly upregulated in terminal buds for genes like TT4, 5AMT, DFR4, CHI and IFRH, while CCR1, CHSA and PRR1 were downregulated (Figure 8C and Figure S3E,F). Overall, these coordinated expression patterns highlight a complex, tissue-specific regulation of multiple interconnected secondary metabolic pathways that govern VOC production in P. koreana.

2.8. Combined Analysis of Transcriptome and Metabolome

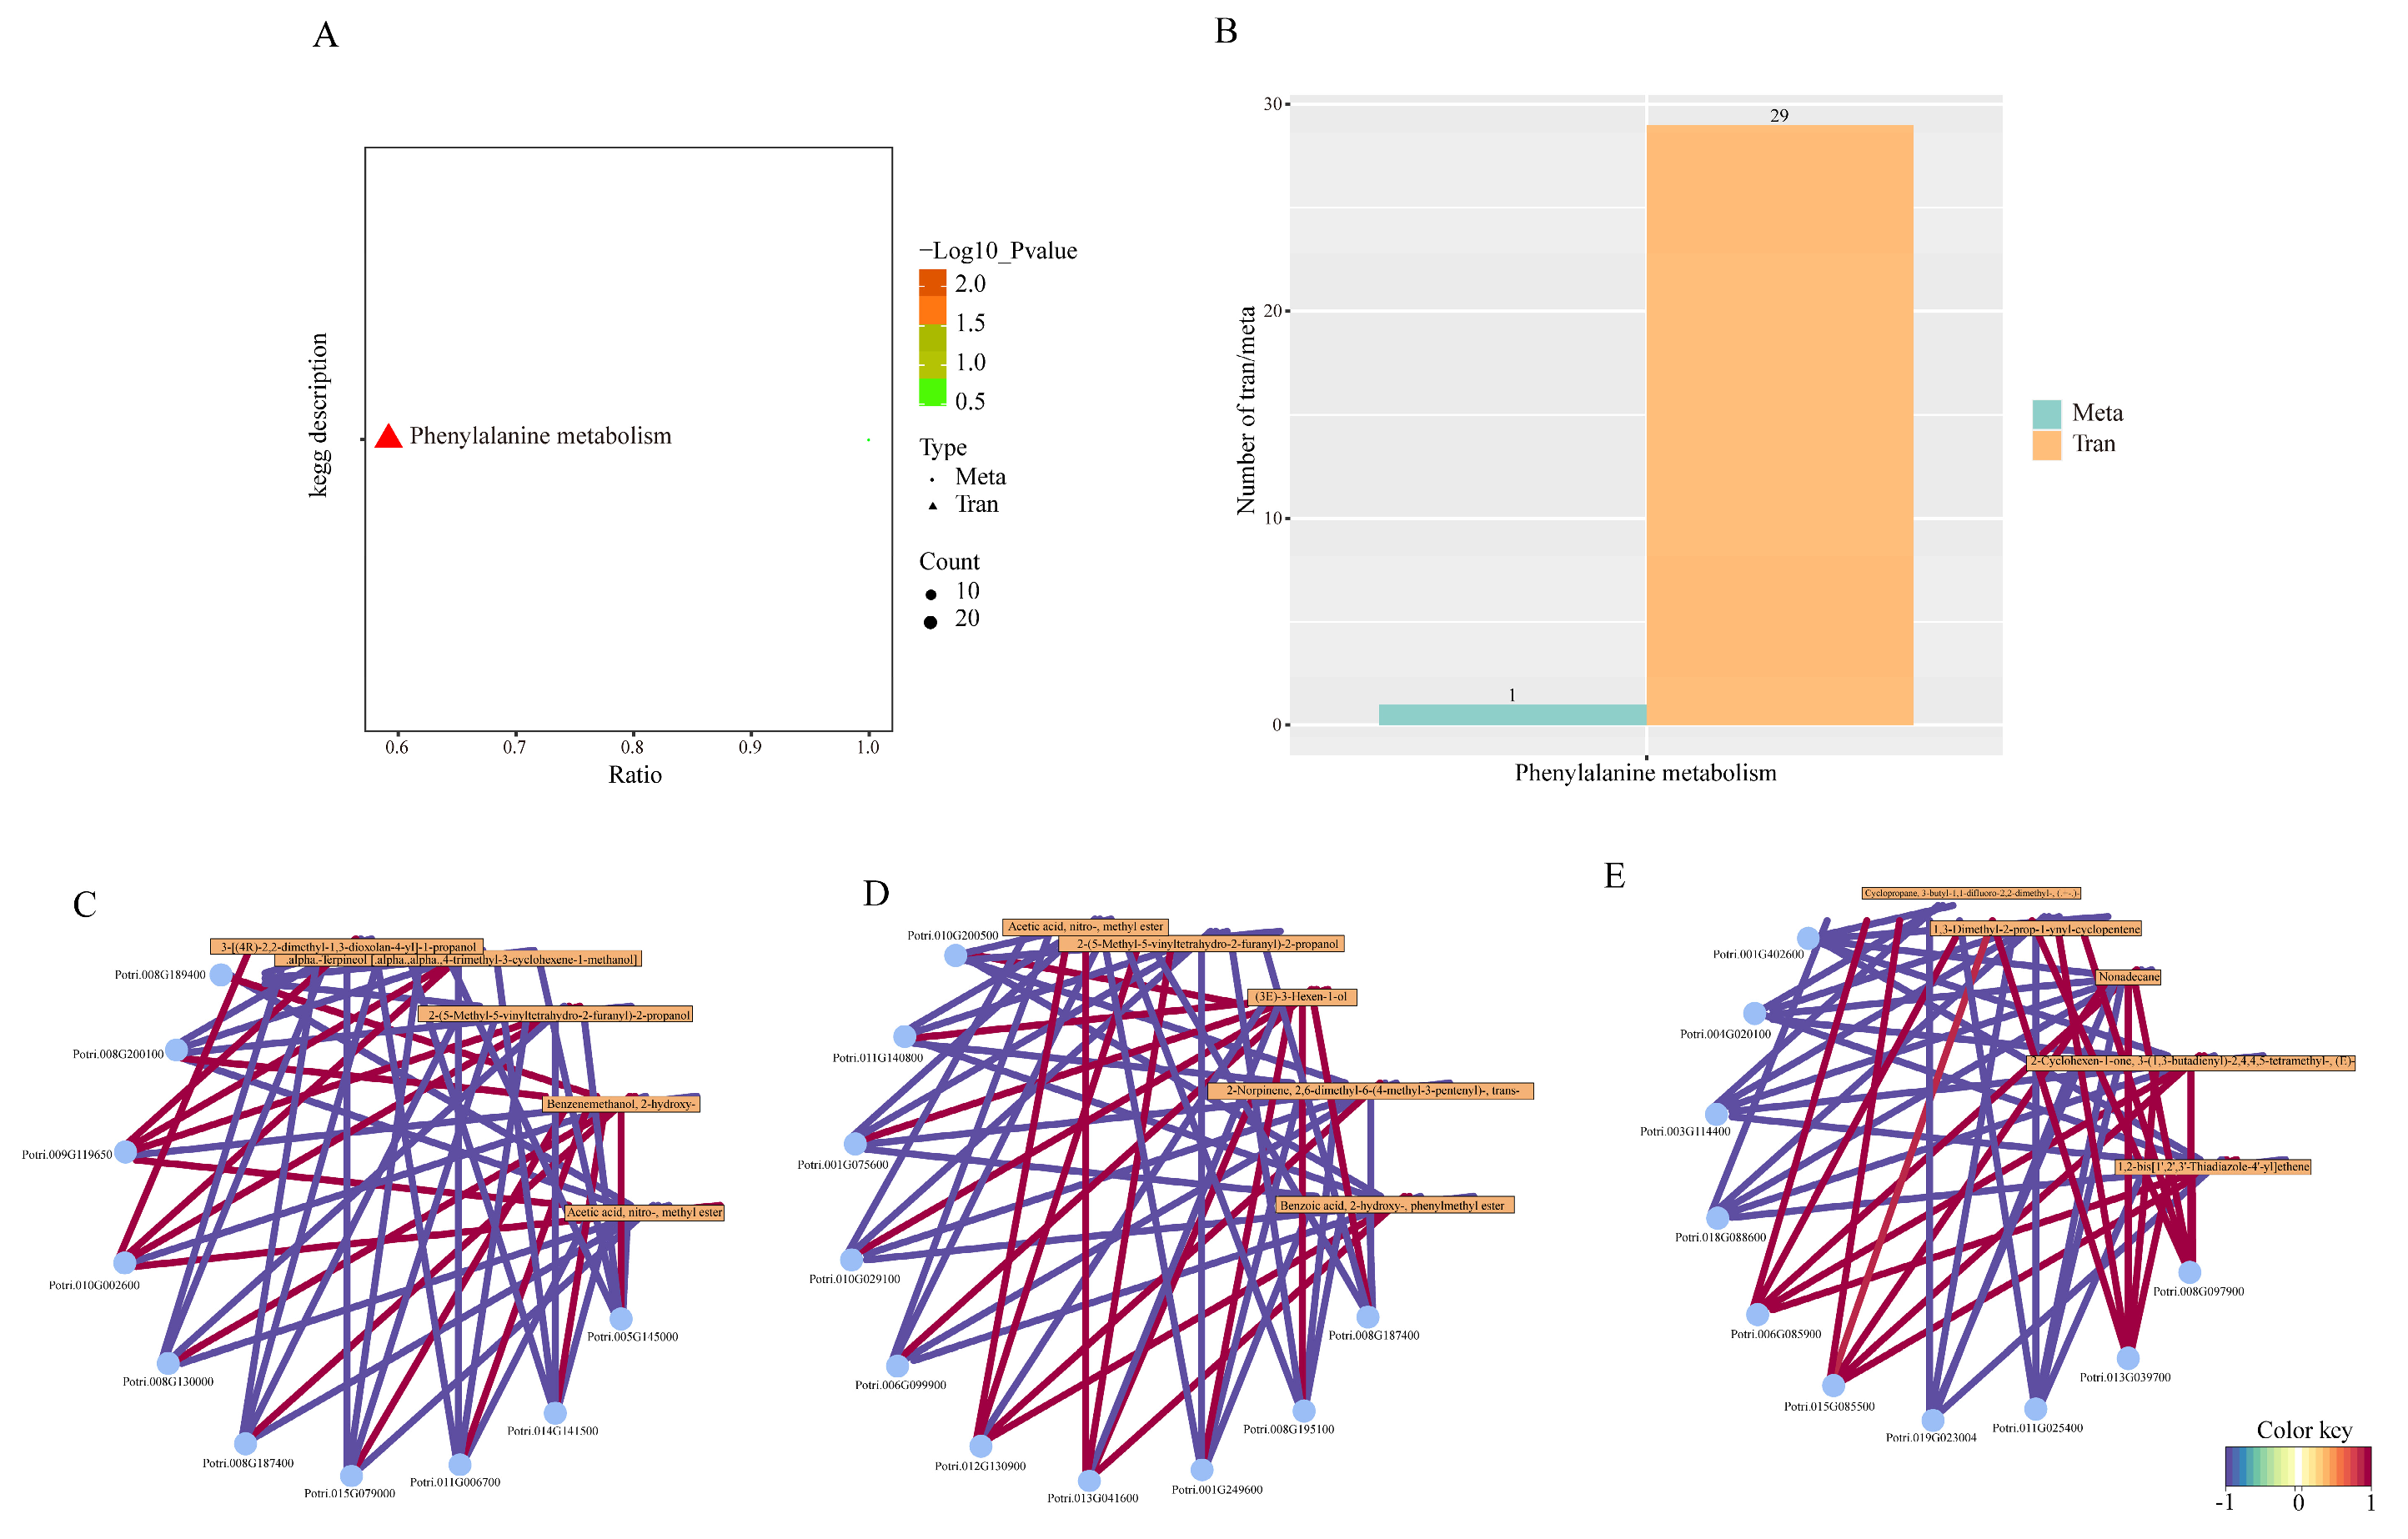
To investigate the molecular mechanisms underlying tissue-specific VOCs accumulation in P. koreana, an integrated analysis of DEGs and differentially accumulated VOCs (DAVs) was carried out. KEGG enrichment analysis revealed a significant co-enrichment of 24 DEGs and one DAV in the phenylalanine metabolism pathway (Figure 9A,B). Pearson correlation analysis was used to assess the relationships between DEGs and differential VOCs (Table S3). The top 10 DEGs and top 5 differentially expressed metabolites were then selected to construct a correlation network diagram (Figure 9C–E). In the DY vs. YP comparison, bZIP44 (Potri.009G119650) and LEA (Potri.010G002600) positively regulated the accumulation of Acetic acid, nitro-,methyl ester, 2-(5-Methyl-5-vinyltetrahydro-2-furanyl)-2-propanol, α-Terpineol and 3-(4R)-2,2-dimethyl-1,3-dioxolan-4-yl-1-propanol, while genes including GolS1 (Potri.008G189400), GS (Potri.008G200100), MPK12 (Potri.008G130000) and GGT2 (Potri.008G187400) positively regulated the accumulation of Benzenemethanol,2-hydroxy- (Figure 9C). In the JD vs. YP comparison, ATS3 (Potri.012G130900) and HEL (Potri.013G041600) showed strong positive correlations with four VOCs, including 2-Norpinene,2,6-dimethyl-6-(4-methyl-3-pentenyl)-,trans-, 2-(5-Methyl-5-vinyltetrahydro-2-furanyl)-2-propanol, Benzoic acid,2-hydroxy-,phenylmethyl ester and Acetic acid, nitro-, methyl ester. Additionally, multiple genes, including GST (Potri.011G140800), VSR6 (Potri.001G075600), GS2 (Potri.010G029100), CAX3 (Potri.006G099900), TSP9 (Potri.001G249600), GLGL1 (Potri.008G195100) and GGT2 (Potri.008G187400), were positively correlated with the accumulation of (3E)-3-Hexen-1-ol (Figure 9D). In the JD vs. DY comparison, MYB (Potri.006G085900), SVS2 (Potri.015G085500), DBNBT (Potri.013G039700) and SPL6 (Potri.008G097900) positively regulated the accumulation of 1,2-bis(1′,2′,3′-Thiadiazole-4′-yl)ethene, 2-Cyclohexen-1-one, 3-(1,3-butadienyl)-2,4,4,5-tetramethyl-,(E)-, Nonadecane, 1,3-Dimethyl-2-prop-1-ynyl-cyclopentene and Cyclopropane,3-butyl-1,1-difluoro-2,2-dimethyl-,(.+-.)-. Conversely, the accumulation of these five VOCs showed negative correlations with GDSL (Potri.018G088600), SVS2 (Potri.015G085500), TPS6 (Potri.019G023004) and PME18 (Potri.011G025400) (Figure 9E).

3. Discussion

P. koreana is an important species within the Populus genus, notable for its distinctive aromatic profile. This study employed an integrated multi-omics approach to explore the molecular mechanisms underlying fragrance development, focusing on the spatial distribution and regulatory networks of VOCs in different tissues. By integrating metabolomic and transcriptomic analyses, this study characterized tissue-specific accumulation patterns of terpenoids, aromatic compounds and aldehydes in terminal buds, stems and leaves, while uncovering coordinated interactions among key regulatory genes controlling these metabolic pathways. These results provide a detailed understanding of the complex biosynthetic networks that contribute to the species’ distinctive aroma.
Terpenoids constitute the most diverse class of plant aroma volatiles and play an essential role in producing various plant scents. In higher plants, floral fragrances demonstrate species-specific and spatiotemporal patterns of expression, with petals being the primary site of volatile emission. The composition and proportion of volatile compounds released by different plant species and varieties are influenced by gene regulation [20,21]. Metabolomic analysis reveals significant differences in volatile compound types and levels across terminal buds, stems and leaves, with terminal buds containing the highest terpene concentrations and overall aroma volatile content. In fragrant poplar, terpene compounds such as Limonene, 2(10)-Pinene, 3-Thujene, (-)-Caryophyllene, α-Humulene and α-Gurjunene are abundant and generally emit fresh pine or floral scents. These compounds also play important roles in plant defense [22]. Previous studies have shown that P. koreana leaves are rich in esters and other volatile compounds. In contrast, the present study demonstrated that terminal buds have significantly higher levels of both terpenes and esters compared to leaves and stems. Specifically, P. koreana terminal buds were abundant in terpenes like (-)-caryophyllene and α-humulene, while stems accumulated more aromatic esters like benzyl salicylate. Leaves primarily contained aldehydes and alcohols, including (3E)-3-hexen-1-ol, highlighting distinct, tissue-specific patterns of volatile compound accumulation in P. koreana [15]. Research on Populus balsamifera showed that its bud tissues are abundant in 54 compounds, with terpenoids as the dominant component, including sesquiterpene hydrocarbons and sesquiterpenoids [23]. A comparative analysis of three tissue contrasts (DY vs. YP, JD vs. YP and JD vs. DY) revealed 72 terpene compounds, such as (-)-Caryophyllene, 3-Thujene, Limonene, α-Humulene, ar-Curcumene, β-Farnesene, Germacrene D, α-Cedrene and β-Nerolidol, including many of which are similar to volatile substances found in tulips and other floral scents. Terpenes are the primary contributors to the aromas of numerous flowers, including roses, orchids, peonies, lilies and hyacinths [24,25], while esters comprise the main fragrant compounds in jasmine (Jasminum sambac) and daffodils (Narcissus tazetta). Additionally, compounds such as Methyl 3-methyl-2-oxopentanoate, Butanoic acid,3-methyl-,3-methyl-3-butenyl ester and 2-(5-Methyl-5-vinyltetrahydrofuran-2-yl) propan-2-yl acetate were detected in the terminal buds and leaves of fragrant poplar [26].
Research has shown that terpenoids help protect plants by attracting pollinators or natural predators and by providing resistance to certain abiotic stresses [27]. The (3E)-3-hexen-1-ol found in P. koreana leaves acts similarly to its counterpart in tea leaves, functioning both as a key aroma compound and as a signaling molecule that triggers defense responses in nearby plants [28]. In tea plants, CsAFS1 boosts resistance to biotic stress by promoting terpene accumulation [29], while BpWRKY6 enhances insect resistance in Betula platyphylla through increased jasmonic acid and terpenoid levels [30]. The accumulation of triterpenoid compounds also significantly strengthens peach trees’ defense against aphids [31]. During lotus flowering, substantial amounts of terpenes such as β-caryophyllene accumulate in the stamens, a pattern similar to that seen in P. koreana [32]. This indicates that P. koreana likely protects its young tissues by accumulating large amounts of terpenes in terminal buds and leaves, thereby inhibiting pathogen proliferation and deterring insects.
The correlation analysis of VOCs across different tissues of P. koreana revealed both synergistic and antagonistic interactions among compounds within the metabolic network. In the DY vs. YP comparison, β-Duprezianene and Germacrene D exhibited a strong positive correlation with α-Terpineol. This synergistic interaction is likely due to the biosynthesis of these volatile compounds relying on the mevalonate-5-phosphate (MEP) pathway to produce GPP and FPP. Monoterpenes like α-Terpineol are produced from GPP with the help of a terpene synthase (TPS), while sesquiterpenes are formed from FPP by the action of a sesquiterpene synthase. A similar pattern has been documented in tea leaves, where the co-expression of CsTPS1 and CsTPS5 simultaneously enhances the synthesis of both monoterpenes and sesquiterpenes [28]. Additionally, the strong positive correlation between the aromatic derivative 3,4-Diethoxybenzaldehyde and trans-Bicyclo(4.3.1)decan-10-one may be attributed to coordinated metabolism in the phenylpropanoid pathway [33].
The MVA pathway was the first identified route for terpenoid synthesis, with sesquiterpene aroma compounds mainly synthesized via this pathway. TPS functions as the terminal enzyme in the MVA pathway, catalyzing the reactions that generate terpenoid compounds. The diversity and quantities of these compounds are largely determined by the specific types of TPS enzymes and their expression levels [34]. In the Lilium ‘Siberia’, LoTPS2 predominantly catalyzes the synthesis of α-farnesene [35]. In Freesia, TPS10 regulates β-caryophyllene synthesis, while TPS14 controls nerolidol synthesis [36,37]. In Chimonanthus praecox, CpTPS10 mainly drives caryophyllene formation [38]. Compared to P. trichocarpa, the P. koreana genome contains a higher number of TPS genes and its encoded proteins are enriched in terpene metabolic pathways linked to volatile production [15]. This study revealed that in the DY vs. YP comparison, several terpene-related genes, including TPS3, TPS14 and TPS21, were significantly upregulated, suggesting the pivotal role of TPS in crafting the aroma of P. koreana.
Phenylpropanoids are widely distributed across the plant kingdom and are essential components of floral fragrances. They are found in numerous aromatic plants, including herbaceous flowers like petunias and peonies, as well as woody flowers such as roses [39,40]. The phenylpropanoid biosynthesis pathway begins with phenylalanine metabolism, yielding products like lignin, flavonoids and phenolic compounds. This pathway plays a major role in the synthesis of plant secondary metabolites and in plant defense [41]. DEGs across all three comparison groups showed significant enrichment in this metabolic pathway, indicating the critical role of phenylpropanoid biosynthesis in the aroma formation of P. koreana. Cysteine and methionine metabolism supplies precursors for sulfur-containing volatiles, while variations in carbon metabolism and photosynthesis may influence terpene synthesis by modulating sugar availability [22,42]. DEGs in the DY vs. YP comparison were enriched in cysteine and methionine metabolism, carbon metabolism and photosynthesis pathways, accounting for the differences in terpenes and sulfur-containing volatiles between terminal buds and leaves. The synthesis of aromatic compounds relies on the phenylpropanoid metabolism pathway. In the terminal buds and leaves of P. koreana, the upregulation of genes like PAL and CAD9 within this pathway facilitates the accumulation of aromatic intermediates, which in turn increases aroma volatility.
The transcriptional regulation of VOC biosynthesis is mediated by a variety of TF families that control the expression of pathway genes via specific interactions with promoter cis-elements [43]. Studies have demonstrated that TF families such as MYB, bHLH, WRKY, ERF/AP2, bZIP and ARF participate in terpene biosynthesis [44]. Recent studies investigating the role of TFs in the biosynthesis of floral terpenoid compounds have mainly concentrated on MYB and bHLH. MYB is a key TF that plays an important role in the synthesis of terpene compounds in flowers. Research shows that it has the ability to regulate the synthesis of a variety of floral substances [45]. In Hedychium coronarium, the R2R3-MYB TFs HcMYB1-6 show high levels of expression during the peak flowering stage, while their expression remains low in other parts of the plant. These TFs are predominantly expressed in the flowers of Hedychium coronarium [46]. Further studies have shown that HcMYB1 and HcMYB2 play a role in controlling linalool synthesis by activating the expression of HcTPS5 [45,47]. Research on Lilium siberia demonstrated that transient silencing of LiMYB305 in petals significantly lowered the expression of monoterpene synthesis-related genes LiOcS and LiMyS, resulting in substantial reductions in the emission of linalool, ocimene and myrcene [48]. The bHLH TF family plays essential roles in plant growth, development and regulation. Studies indicate that certain bHLH members regulate the synthesis of floral fragrance compounds. For example, in Chimonanthus praecox, CpbHLH13 and CpMYC2 have been identified as key regulators of β-caryophyllene and linalool biosynthesis [49]. In Phalaenopsis, PbbHLH4 and PbbHLH6 transcriptionally activate genes in the monoterpene biosynthesis pathway, with PbbHLH4 playing a vital role in geraniol synthesis [50]. Additionally, BHLH35 potentially regulates TPS2 gene expression, thereby controlling linalool production in Osmanthus fragrans [51].
In Hedychium coronarium, HcARF5 is highly expressed and shows a significant correlation with the β-ocimene synthesis gene HcTPS3, responsible for producing primary floral fragrance compounds [52]. Studies in Osmanthus fragrans indicate that the expression of OfWRKY36 positively correlates with variations in multiple monoterpene compounds, whereas OfWRKY7 acts as a negative regulator of ocimene production [53]. Transcriptomic analysis of P. koreana revealed comparable results. In the DY vs. YP comparison, several TFs, including MYB, bHLH and WRKY, were significantly upregulated. Furthermore, the concentrations of terpene compounds such as 2(10)-Pinene, α-Humulene, α-Gurjunene, Limonene, 3-Thujene and (-)-Caryophyllene were substantially higher in terminal buds compared to stems and leaves. These findings suggest that MYB, bHLH and WRKY TFs play a key role in enhancing the release of VOCs in different tissues and organs by activating the terpene synthesis pathway.

4. Materials and Methods

4.1. Plant Materials and Growth Conditions

This study utilized healthy, two-year-old P. koreana plants as experimental materials, cultivated in an intelligent greenhouse at Jilin Agricultural Science and Technology College (126.48° N, 43.95° E). On 25 September 2024, tissue-specific samples, including terminal buds, stem segments and leaves (10 g per tissue type), were carefully collected from uniformly growing P. koreana plants for aroma profiling. The stems samples were taken from the third internode below the terminal buds, while leaf samples comprised the third uppermost fully expanded leaves adjacent to the terminal buds. For each tissue type, samples from three individual seedlings were pooled, flash-frozen in liquid nitrogen and stored at −80 °C for subsequent multi-omics analyses.

4.2. Volatile Compound Analysis by GC-MS

The VOCs from stems, leaves and terminal buds of P. koreana were investigated using headspace solid-phase microextraction coupled with gas chromatography-mass spectrometry (HS-SPME-GC-MS). The analysis was performed on an Agilent 7890B GC system connected to a LECO Pegasus BT MS and equipped with a CTC autosampler. Fresh tissue samples (100 mg) were placed in 20-mL vials and extracted under optimized conditions using a DVB/CAR/PDMS fiber, involving equilibration at 80 °C for 10 min, adsorption for 30 min and desorption at 245 °C for 5 min. Chromatographic separation was carried out on a DB-WAX capillary column with helium as the carrier gas under the following temperature program: initial hold at 40 °C for 3 min, a 10 °C/min ramp to 230 °C, followed by a 6 min hold. Mass spectra (m/z 35–450) were acquired at 70 eV ionization energy (15 spectra/sec), maintaining the ion source temperature at 220 °C. Raw data were processed in ChromaTOF v4.71 (LECO Corporation, St. Joseph, MI, USA) with peak deconvolution and alignment [54,55]. Compound identification relied on matching experimentally determined retention indices and mass spectra against NIST libraries, followed by manual verification, achieving Level 2 confidence. Differential metabolites were screened using an integrated criterion: univariate analysis (fold change > 1.5 or <0.67, p < 0.05) combined with multivariate model results (PLS-DA/OPLS-DA VIP > 1 and p < 0.05). Metabolic patterns were characterized through hierarchical clustering and Pearson correlation analysis, with outcomes visualized using heatmaps and co-occurrence networks [56,57].

4.3. Total RNA Isolation, Library Construction and Transcriptome Sequencing

Total RNA of high quality was isolated from stem segments, leaves and terminal buds of P. koreana using the RNeasy Plant Mini Kit (Qiagen, Duesseldorf, Germany; Cat. No. 74904), following the manufacturer’s guidelines. RNA concentration was quantified with a NanoDrop spectrophotometer and purity was evaluated using A260/A280 and A260/A230 absorbance ratios. Sample integrity was evaluated by agarose gel electrophoresis using an Agilent 2100 Bioanalyzer (Agilent Technologies, Santa Clara, CA, USA) and only samples with an RNA Integrity Number (RIN) greater than 7.0 were retained for library construction. For each tissue type, three biological replicates were used. Library construction was carried out with 1 μg of total RNA per sample, meeting quality standards, using the NEBNext Ultra™ RNA Library Prep Kit (New England Biolabs Inc., Ipswich, MA, USA). Polyadenylated mRNA was first enriched with oligo(dT) magnetic beads, after which the mRNA was fragmented to approximately 300 bp under high temperature in the presence of divalent cations. First-strand cDNA was synthesized through reverse transcription using random hexamers, followed by second-strand generation using DNA polymerase I and RNase H. The resulting double-stranded cDNA was first end-repaired to generate blunt ends and then modified with a single-base A overhang at the 3′ end. Illumina sequencing adapters carrying unique index sequences were subsequently ligated to these A-tailed fragments. Adapter-ligated products were size-selected with AMPure XP beads to enrich fragments of ~300–400 bp. The size-selected libraries were amplified using high-fidelity PCR with index primers to incorporate sample-specific barcodes. Following library quality validation with the Agilent 2100 Bioanalyzer (Agilent Technologies, Santa Clara, CA, USA), uniquely barcoded libraries were pooled and sequenced on the Illumina NovaSeq 6000 platform (Personal Biotechnology Co., Ltd., Shanghai, China), generating 150-bp paired-end reads [58,59]. The raw sequencing data were then subjected to quality control, including assessment of Q20/Q30 scores and GC content, resulting in high-quality clean reads suitable for tissue-specific gene expression analysis in P. koreana.

4.4. Estimation of Transcript Abundance and Differential Expression Analysis

Following sequencing, raw FASTQ files were subjected to stringent quality control to remove low-quality reads, adapter sequences and reads containing excessive poly-N content, resulting in a dataset of high-quality clean reads. Data reliability was assessed using Q30 scores and GC content prior to subsequent analyses. Clean reads derived from P. koreana stems, leaves and terminal buds were aligned to the P. trichocarpa (https://phytozome-next.jgi.doe.gov/info/Ptrichocarpa_v4_1) (access date: 5 November 2024) as reference genome using HISAT2 (version 2.2.1), chosen for its robust splice-aware alignment features that ensure accurate mapping in woody plants [60,61]. Transcriptome assembly and novel isoform detection were carried out using StringTie’s flow network algorithm, enabling the reconstruction and quantification of both annotated and novel transcripts. Gene expression levels were quantified as Fragments Per Kilobase of transcript per Million mapped reads (FPKM) to normalize for variations in sequencing depth and gene length. For differential expression analysis, DESeq2 was applied to three biological replicates per tissue, performing pairwise comparisons among terminal buds vs. leaves (DY vs. YP), stems vs. leaves (JD vs. YP) and stems vs. terminal buds (JD vs. DY). Significant DEGs were identified based on thresholds of |log2(fold change)| ≥ 1 and a Benjamini-Hochberg-adjusted p-value (padj) < 0.05, ensuring reliable detection of tissue-specific expression patterns [62]. MapMan software (v3.6.0) was employed to map and analyze the log2 (fold change) of genes involved in various metabolic pathways and to visualize the expression changes in DEGs.

4.5. Transcriptome Annotation and Functional Enrichment

Functional annotation of genes was carried out through BLAST searches against major public databases such as NCBI NR, Pfam, COG/KOG, Swiss-Prot, GO, KEGG Orthology (KO) and KEGG pathways. Differential expression analysis across stem, leaf and terminal bud tissues was performed using DESeq2 on three biological replicates per tissue, applying thresholds of Benjamini-Hochberg-adjusted p-value < 0.01 and |log2(fold change)| ≥ 1. Functional enrichment analysis of DEGs was conducted with ClusterProfiler: GO term enrichment was assessed via the Wallenius non-central hypergeometric test (significance threshold FDR < 0.05), while KEGG pathway enrichment was tested using Fisher’s exact test (p < 0.05) [63,64]. Additionally, WGCNA was also conducted in R, considering only genes with expression levels > 1 FPKM [65]. Following the determination of optimal soft thresholding power, co-expression modules were generated (minimum module size = 100; merge cut height = 0.25). Module-trait associations were evaluated via Pearson correlation coefficients and hub genes within biologically significant modules were identified based on high intramodular connectivity (kME ≥ 0.7) and gene significance (|GS| ≥ 0.5), thereby highlighting potential key regulators in tissue-specific gene networks [66].

4.6. Validation by RT-qPCR

For validation of the key transcriptome results, 9 tissue-specific DEGs were randomly selected for RT-qPCR analysis, with expression levels normalized to gene-specific primer pair for poplar ACTIN1 (GenBank Accession XM_002298674) as a reference gene [67]. Total RNA was extracted from the same stems, leaves and terminal buds samples used for RNA-seq and 1 μg of RNA was reverse-transcribed using HiScript III RT SuperMix (Vazyme, Nanjing, China) according to the manufacturer’s instructions. RT-qPCR was conducted with gene-specific primers designed using Primer3Plus (v2.4.2) (Table S4). Each 20 μL reaction mixture consisted of 10 μL ChamQ SYBR Color Master Mix (Vazyme), 2 μL cDNA template, 0.4 μL forward and reverse primers (10 μM) and 7.2 μL nuclease-free water. The RT-qPCR protocol consisted of initial denaturation at 95 °C for 7 min, followed by 35 cycles of 95 °C for 15 s, 60 °C for 20 s and 72 °C for 30 s. Reactions were run on a qTOWER 3G Cycler (Analytik Jena, Jena city, Germany). Relative gene expression was calculated using the 2−ΔΔCt method and visualized with GraphPad Prism v9.0.0 (GraphPad Software, San Diego, CA, USA) [67].

4.7. Statistical Analysis

Data analysis was conducted using SPSS v22.0 (IBM Inc., Armonk, NY, USA). Differences in gene expression among stem segments, leaves and terminal buds were evaluated using a two-tailed Student’s t-test, with significance set at p < 0.05. A single asterisk (*) indicates a significant difference (p < 0.05), while a double asterisk (**) denotes a highly significant difference (p < 0.01). Results are presented as the mean ± standard error (SE) based on three biological replicates.

5. Conclusions

This study systematically characterized the tissue-specific distribution of VOCs in P. koreana, identifying 207 VOCs with distinct accumulation patterns across terminal buds, stems and leaves. Terminal buds were enriched in terpenes and aromatic compounds, while leaves primarily accumulated phenolic derivatives. Integrated transcriptomic and metabolomic analyses pinpointed key biosynthetic genes and transcription factors involved in VOC production. WGCNA revealed a bud-specific gene co-expression module strongly correlated with terpenoid biosynthesis. These findings provide molecular insights into tissue-specific aroma formation in P. koreana, offering valuable genetic resources for the breeding of aromatic plants and related industrial applications.

Supplementary Materials

The following supporting information can be downloaded at: https://www.mdpi.com/article/10.3390/horticulturae11101262/s1, Figure S1: Validation of transcriptomic data by RT-qPCR; Figure S2: Pathway mapping of DEGs in JD vs. YP and JD vs. DY comparisons; Figure S3: Secondary metabolic pathways mapping of DEGs in JD vs. YP and JD vs. DY comparisons; Table S1: Detailed data of the 207 volatile organic compounds (VOCs); Table S2: Detailed differentially expressed genes (DEGs) data in the transcriptome; Table S3: The relationships between DEGs and differential VOCs; Table S4: The primers used in this study.

Author Contributions

Conceptualization, H.W., F.W. and J.W.; methodology, H.W.; software, T.X., S.Z. and Z.J.; validation, H.W., X.L. and J.Y.; formal analysis, H.W.; investigation, H.W.; resources, H.W.; data curation, X.L. and J.Y.; writing—original draft preparation, H.W. and F.W.; writing—review and editing, X.L. and J.Y.; visualization, H.W. and Q.W.; supervision, X.L. and J.Y.; project administration, H.W. and X.L.; funding acquisition, H.W. All authors have read and agreed to the published version of the manuscript.

Funding

This research was funded by Jilin Agricultural Science and Technology College Doctoral Startup Fund, grant number XJ2021001106.

Data Availability Statement

Dataset available on request from the authors.

Conflicts of Interest

The authors declare no conflicts of interest.

References

  1. Liu, Z.; Han, J.; Liu, Z.; Zhang, X.; Chen, J.; Dong, A. First report of Pseudomonas aeruginosa causing tumor disease of Populus koreana in China. J. Plant Dis. Prot. 2019, 126, 485–488. [Google Scholar] [CrossRef]
  2. Zhang, B.; Zhu, W.; Diao, S.; Wu, X.; Lu, J.; Ding, C.; Su, X. The poplar pangenome provides insights into the evolutionary history of the genus. Commun. Biol. 2019, 2, 215. [Google Scholar] [CrossRef]
  3. Greenaway, W.; English, S.; May, J.; Whatley, F.R. Analysis of Phenolics o f Bud Exudates of Populus koreana, Populus maximowiczii and Populus suaveolens by GC-M S. Naturforsch 1992, 47, 313–317. [Google Scholar] [CrossRef]
  4. Bao, X.; Zhou, W.; Xu, L.; Zheng, Z. A meta-analysis on plant volatile organic compound emissions of different plant species and responses to environmental stress. Environ. Pollut. 2023, 318, 120886. [Google Scholar] [CrossRef]
  5. Montejano-Ramírez, V.; Ávila-Oviedo, J.L.; Campos-Mendoza, F.J.; Valencia-Cantero, E. Microbial volatile organic compounds: Insights into plant defense. Plants 2024, 13, 2013. [Google Scholar] [CrossRef] [PubMed]
  6. Bergman, M.E.; Huang, X.-Q.; Baudino, S.; Caissard, J.-C.; Dudareva, N. Plant volatile organic compounds: Emission and perception in a changing world. Curr. Opin. Plant Biol. 2025, 85, 102706. [Google Scholar] [CrossRef] [PubMed]
  7. Arimura, G.-I.; Uemura, T. Cracking the plant VOC sensing code and its practical applications. Trends Plant Sci. 2025, 30, 105–115. [Google Scholar] [CrossRef] [PubMed]
  8. Dudareva, N.; Klempien, A.; Muhlemann, J.K.; Kaplan, I. Biosynthesis, function and metabolic engineering of plant volatile organic compounds. New Phytol. 2013, 198, 16–32. [Google Scholar] [CrossRef]
  9. Degenhardt, J.; Köllner, T.G.; Gershenzon, J. Monoterpene and sesquiterpene synthases and the origin of terpene skeletal diversity in plants. Phytochemistry 2009, 70, 1621–1637. [Google Scholar] [CrossRef]
  10. Lee, S.; Badieyan, S.; Bevan, D.R.; Herde, M.; Gatz, C.; Tholl, D. Herbivore-induced and floral homoterpene volatiles are biosynthesized by a single P450 enzyme (CYP82G1) in Arabidopsis. Proc. Natl. Acad. Sci. USA 2010, 107, 21205–21210. [Google Scholar] [CrossRef]
  11. Irmisch, S.; McCormick, A.C.; Boeckler, G.A.; Schmidt, A.; Reichelt, M.; Schneider, B.; Block, K.; Schnitzler, J.-P.; Gershenzon, J.; Unsicker, S.B.; et al. Two herbivore-induced cytochrome P450 enzymes CYP79D6 and CYP79D7 catalyze the formation of volatile aldoximes involved in poplar defense. Plant Cell 2013, 25, 4737–4754. [Google Scholar] [CrossRef]
  12. Günther, J.; Lackus, N.D.; Schmidt, A.; Huber, M.; Stödtler, H.-J.; Reichelt, M.; Gershenzon, J.; Köllner, T.G. Separate pathways contribute to the herbivore-induced formation of 2-Phenylethanol in poplar. Plant Physiol. 2019, 180, 767–782. [Google Scholar] [CrossRef]
  13. Torrens-Spence, M.P.; Pluskal, T.; Li, F.-S.; Carballo, V.; Weng, J.-K. Complete pathway elucidation and heterologous reconstitution of rhodiola salidroside biosynthesis. Mol. Plant 2018, 11, 205–217. [Google Scholar] [CrossRef]
  14. Facchini, P.J.; Huber-Allanach, K.L.; Tari, L.W. Plant aromatic L-amino acid decarboxylases: Evolution, biochemistry, regulation, and metabolic engineering applications. Phytochemistry 2000, 54, 121–138. [Google Scholar] [CrossRef]
  15. Shen, L.; Ding, C.; Zhang, W.; Zhang, T.; Li, Z.; Zhang, J.; Chu, Y.; Su, X. The Populus koreana genome provides insights into the biosynthesis of plant aroma. Ind. Crops Prod. 2023, 197, 116453. [Google Scholar] [CrossRef]
  16. Chen, Y.-C.; Li, Z.; Zhao, Y.-X.; Gao, M.; Wang, J.-Y.; Liu, K.-W.; Wang, X.; Wu, L.-W.; Jiao, Y.-L.; Xu, Z.-L.; et al. The Litsea genome and the evolution of the laurel family. Nat. Commun. 2020, 11, 1675. [Google Scholar] [CrossRef] [PubMed]
  17. Niu, S.; Li, J.; Bo, W.; Yang, W.; Zuccolo, A.; Giacomello, S.; Chen, X.; Han, F.; Yang, J.; Song, Y.; et al. The Chinese pine genome and methylome unveil key features of conifer evolution. Cell 2022, 185, 204–217.e14. [Google Scholar] [CrossRef] [PubMed]
  18. Zeng, Y.; Wang, W.; Liao, W.; Wang, H.; Zhang, D. Multiple glacial refugia for cool-temperate deciduous trees in northern East Asia: The Mongolian oak as a case study. Mol. Ecol. 2015, 24, 5676–5691. [Google Scholar] [CrossRef]
  19. Liu, Y.-J.; Wang, X.-R.; Zeng, Q.-Y. De novo assembly of white poplar genome and genetic diversity of white poplar population in Irtysh River basin in China. Sci. China Life Sci. 2019, 62, 609–618. [Google Scholar] [CrossRef]
  20. Muhlemann, J.K.; Klempien, A.; Dudareva, N. Floral volatiles: From biosynthesis to function. Plant Cell Environ. 2014, 37, 1936–1949. [Google Scholar] [CrossRef] [PubMed]
  21. Farré-Armengol, G.; Filella, I.; Llusià, J.; Peñuelas, J. β-Ocimene, a key floral and foliar volatile involved in multiple interactions between plants and other organisms. Molecules 2017, 22, 1148. [Google Scholar] [CrossRef] [PubMed]
  22. Zhang, D.; Shen, D.; Cao, Y.; Duan, X.; Sun, H. Widely targeted metabolomic approach reveals dynamic changes in non-volatile and volatile metabolites of peanuts during roasting. Food Chem. 2023, 412, 135577. [Google Scholar] [CrossRef] [PubMed]
  23. Isidorov, V.A.; Vinogorova, V.T. GC-MS Analysis of Compounds Extracted from Buds of Populus balsamifera and Populus nigra. Z. Fur Naturforschung Sect. C-A J. Biosci. 2003, 58, 355–360. [Google Scholar] [CrossRef] [PubMed]
  24. Chuang, Y.-C.; Lee, M.-C.; Chang, Y.-L.; Chen, W.-H.; Chen, H.-H. Diurnal regulation of the floral scent emission by light and circadian rhythm in the Phalaenopsis orchids. Bot. Stud. 2017, 58, 50. [Google Scholar] [CrossRef]
  25. Shalit, M.; Guterman, I.; Volpin, H.; Bar, E.; Tamari, T.; Menda, N.; Adam, Z.; Zamir, D.; Vainstein, A.; Weiss, D.; et al. Volatile ester formation in roses. Identification of an acetyl-coenzyme A. geraniol/citronellol acetyltransferase in developing rose petals. Plant Physiol. 2003, 131, 1868–1876. [Google Scholar] [CrossRef]
  26. Chen, G.; Mostafa, S.; Lu, Z.; Du, R.; Cui, J.; Wang, Y.; Liao, Q.; Lu, J.; Mao, X.; Chang, B.; et al. The Jasmine (Jasminum sambac) genome provides insight into the biosynthesis of flower fragrances and jasmonates. Genom. Proteom. Bioinform. 2022, 21, 127–149. [Google Scholar] [CrossRef]
  27. Irmisch, S.; Jiang, Y.; Chen, F.; Gershenzon, J.; Köllner, T.G. Terpene synthases and their contribution to herbivore-induced volatile emission in western balsam poplar (Populus trichocarpa). BMC Plant Biol. 2014, 14, 270. [Google Scholar] [CrossRef]
  28. Laia, S.; Yia, N.; Yina, S.; Huanga, Y.; Shena, T.; Daia, Q.; Gaob, L.; Jianga, X.; Xia, T. Biochemical characterization of CsCXEs: Carboxylesterase enhances the biosynthesis of green odor volatiles during tea processing. Hortic. Plant J. 2024, 11, 1684–1698. [Google Scholar] [CrossRef]
  29. Dao, M.; Zhang, Z.; Yin, X.; Wang, J.; Qin, Y.; Yu, L.; Wu, T. CsAFS1 Enhances the self-resistance of tea plants by promoting terpenoid accumulation. Physiol. Plant. 2025, 177, e70430. [Google Scholar] [CrossRef]
  30. Xie, Q.; Dong, W.; Wang, M.; Wang, J.; Sun, L.; Liu, Z.; Gao, C.; Cao, C. BpWRKY6 regulates insect resistance by affecting jasmonic acid and terpenoid synthesis in Betula platyphylla. Plant Biotechnol. J. 2025, 23, 3682–3696. [Google Scholar] [CrossRef]
  31. Pan, L.; Huang, R.; Lu, Z.; Duan, W.; Sun, S.; Yan, L.; Cui, G.; Niu, L.; Wang, Z.; Zeng, W. Combined transcriptome and metabolome analysis identifies triterpenoid-induced defense responses in Myzus persicae Sülzer-infested peach. J. Exp. Bot. 2024, 75, 6644–6662. [Google Scholar] [CrossRef]
  32. Wei, H.; Wang, Y.; Wang, X.; Zhou, X.; Zhang, H.; Mo, M.; Wang, L.; Li, Y.; Wu, Q. Untargeted metabolites profiling of volatile components of Chinese Antique Lotus (Nelumbo nucifera Gaertn.) using solid-phase microextraction (SPME) GC/MS. PeerJ 2025, 13, e19600. [Google Scholar] [CrossRef]
  33. He, L.; Hu, Q.; Wei, L.; Ge, X.; Yu, N.; Chen, Y. Unravelling dynamic changes in non-volatile and volatile metabolites of pulses during soaking: An integrated metabolomics approach. Food Chem. 2023, 422, 136231. [Google Scholar] [CrossRef]
  34. Jia, Q.; Brown, R.; Köllner, T.G.; Fu, J.; Chen, X.; Wong, G.K.-S.; Gershenzon, J.; Peters, R.J.; Chen, F. Origin and early evolution of the plant terpene synthase family. Proc. Natl. Acad. Sci. USA 2022, 119, e2100361119. [Google Scholar] [CrossRef]
  35. Abbas, F.; Ke, Y.; Zhou, Y.; Ashraf, U.; Li, X.; Yu, Y.; Yue, Y.; Ahmad, K.W.; Yu, R.; Fan, Y. Molecular cloning, characterization and expression analysis of LoTPS2 and LoTPS4 involved in floral scent formation in oriental hybrid Lilium variety ‘Siberia’. Phytochemistry 2020, 173, 112294. [Google Scholar] [CrossRef] [PubMed]
  36. Gao, F.; Liu, B.; Li, M.; Gao, X.; Fang, Q.; Liu, C.; Ding, H.; Wang, L.; Gao, X. Identification and characterization of terpene synthase genes accounting for volatile terpene emissions in flowers of Freesia x hybrida. J. Exp. Bot. 2018, 69, 4249–4265. [Google Scholar] [CrossRef] [PubMed]
  37. Bao, T.; Kimani, S.; Li, Y.; Li, H.; Yang, S.; Zhang, J.; Wang, Q.; Wang, Z.; Ning, G.; Wang, L.; et al. Allelic variation of terpene synthases drives terpene diversity in the wild species of the Freesia genus. Plant Physiol. 2023, 192, 2419–2435. [Google Scholar] [CrossRef] [PubMed]
  38. Shang, J.; Tian, J.; Cheng, H.; Yan, Q.; Li, L.; Jamal, A.; Xu, Z.; Xiang, L.; Saski, C.A.; Jin, S.; et al. The chromosome-level wintersweet (Chimonanthus praecox) genome provides insights into floral scent biosynthesis and flowering in winter. Genome Biol. 2020, 21, 200. [Google Scholar] [CrossRef]
  39. Scalliet, G.; Journot, N.; Jullien, F.; Baudino, S.; Magnard, J.L.; Channelière, S.; Vergne, P.; Dumas, C.; Bendahmane, M.; Cock, J.M.; et al. Biosynthesis of the major scent components 3,5-dimethoxytoluene and 1,3,5-trimethoxybenzene by novel rose O-methyltransferases. FEBS Lett. 2002, 523, 113–118. [Google Scholar] [CrossRef]
  40. Verdonk, J.C.; Ric de Vos, C.H.; Verhoeven, H.A.; Haring, M.A.; van Tunen, A.J.; Schuurink, R.C. Regulation of floral scent production in petunia revealed by targeted metabolomics. Phytochemistry 2003, 62, 997–1008. [Google Scholar] [CrossRef]
  41. Wang, M.; Wang, Y.; Li, X.; Zhang, Y.; Chen, X.; Liu, J.; Qiua, Y.; Wang, A. Integration of metabolomics and transcriptomics reveals the regulation mechanism of the phenylpropanoid biosynthesis pathway in insect resistance traits in Solanum habrochaites. Hortic. Res. 2024, 11, uhad277. [Google Scholar] [CrossRef]
  42. Ma, Y.; Gao, Y.; Xu, Y.; Zhou, H.; Zhou, K.; Li, C.; Xu, B. Microbiota dynamics and volatile metabolite generation during sausage fermentation. Food Chem. 2023, 423, 136297. [Google Scholar] [CrossRef] [PubMed]
  43. Nieuwenhuizen, N.J.; Chen, X.; Wang, M.Y.; Matich, A.J.; Perez, R.L.; Allan, A.C.; Green, S.A.; Atkinson, R.G. Natural variation in monoterpene synthesis in kiwifruit: Transcriptional regulation of terpene synthases by NAC and ETHYLENE-INSENSITIVE3-like transcription factors. Plant Physiol. 2015, 167, 1243–1258. [Google Scholar] [CrossRef] [PubMed]
  44. Picazo-Aragonés, J.; Terrab, A.; Balao, F. Plant volatile organic compounds evolution: Transcriptional regulation, epigenetics and polyploidy. Int. J. Mol. Sci. 2020, 21, 8956. [Google Scholar] [CrossRef] [PubMed]
  45. Abbas, F.; Ke, Y.; Zhou, Y.; Yu, Y.; Waseem, M.; Ashraf, U.; Wang, C.; Wang, X.; Li, X.; Yue, Y.; et al. Genome-wide analysis reveals the potential role of MYB transcription factors in floral scent formation in hedychium coronarium. Front. Plant Sci. 2021, 12, 623742. [Google Scholar] [CrossRef] [PubMed]
  46. Yue, Y.; Yu, R.; Fan, Y. Transcriptome profiling provides new insights into the formation of floral scent in Hedychium coronarium. BMC Genom. 2015, 16, 470. [Google Scholar] [CrossRef]
  47. Ke, Y.; Abbas, F.; Zhou, Y.; Yu, R.; Fan, Y. Auxin-responsive R2R3-MYB transcription factors HcMYB1 and HcMYB2 activate volatile biosynthesis in hedychium coronarium flowers. Front. Plant Sci. 2021, 12, 710826. [Google Scholar] [CrossRef]
  48. Yang, Y.-Y.; Ma, B.; Li, Y.-Y.; Han, M.-Z.; Wu, J.; Zhou, X.-F.; Tian, J.; Wang, W.-H.; Leng, P.-S.; Hu, Z.-H. Transcriptome analysis identifies key gene LiMYB305 involved in monoterpene biosynthesis in Lilium ‘Siberia’. Front. Plant Sci. 2022, 13, 1021576. [Google Scholar] [CrossRef]
  49. Aslam, M.Z.; Lin, X.; Li, X.; Yang, N.; Chen, L. Molecular cloning and functional characterization of CpMYC2 and CpBHLH13 transcription factors from wintersweet (Chimonanthus praecox L.). Plants 2020, 9, 785. [Google Scholar] [CrossRef]
  50. Chuang, Y.-C.; Hung, Y.-C.; Tsai, W.-C.; Chen, W.-H.; Chen, H.-H. PbbHLH4 regulates floral monoterpene biosynthesis in Phalaenopsis orchids. J. Exp. Bot. 2018, 69, 4363–4377. [Google Scholar] [CrossRef]
  51. Han, Y.; Lu, M.; Yue, S.; Li, K.; Dong, M.; Liu, L.; Wang, H.; Shang, F. Comparative methylomics and chromatin accessibility analysis in Osmanthus fragrans uncovers regulation of genic transcription and mechanisms of key floral scent production. Hortic. Res. 2022, 9, uhac096. [Google Scholar] [CrossRef]
  52. Abbas, F.; Ke, Y.; Zhou, Y.; Yu, Y.; Waseem, M.; Ashraf, U.; Li, X.; Yu, R.; Fan, Y. Genome-wide analysis of ARF transcription factors reveals HcARF5 expression profile associated with the biosynthesis of β-ocimene synthase in Hedychium coronarium. Plant Cell Rep. 2021, 40, 1269–1284. [Google Scholar] [CrossRef]
  53. Ding, W.; Ouyang, Q.; Li, Y.; Shi, T.; Li, L.; Yang, X.; Ji, K.; Wang, L.; Yue, Y. Genome-wide investigation of WRKY transcription factors in sweet osmanthus and their potential regulation of aroma synthesis. Tree Physiol. 2019, 40, 557–572. [Google Scholar] [CrossRef]
  54. Dunn, W.B.; Broadhurst, D.; Begley, P.; Zelena, E.; Francis-McIntyre, S.; Anderson, N.; Brown, M.; Knowles, J.D.; Halsall, A.; Haselden, J.N.; et al. Procedures for large-scale metabolic profiling of serum and plasma using gas chromatography and liquid chromatography coupled to mass spectrometry. Nat. Protoc. 2011, 6, 1060–1083. [Google Scholar] [CrossRef]
  55. Dai, W.; Xie, D.; Lu, M.; Li, P.; Lv, H.; Yang, C.; Peng, Q.; Zhu, Y.; Guo, L.; Zhang, Y.; et al. Characterization of white tea metabolome: Comparison against green and black tea by a nontargeted metabolomics approach. Food Res. Int. 2017, 96, 40–45. [Google Scholar] [CrossRef]
  56. Heischmann, S.; Quinn, K.; Cruickshank-Quinn, C.; Liang, L.-P.; Reisdorph, R.; Reisdorph, N.; Patel, M. Exploratory metabolomics profiling in the kainic acid rat model reveals depletion of 25-Hydroxyvitamin D3 during epileptogenesis. Sci. Rep. 2016, 6, 31424. [Google Scholar] [CrossRef] [PubMed]
  57. Haspel, J.A.; Chettimada, S.; Shaik, R.S.; Chu, J.-H.; Raby, B.A.; Cernadas, M.; Carey, V.; Process, V.; Hunninghake, G.M.; Ifedigbo, E.; et al. Circadian rhythm reprogramming during lung inflammation. Nat. Commun. 2014, 5, 5753. [Google Scholar] [CrossRef] [PubMed]
  58. Liu, D.; Cheng, L.; Tang, L.; Yang, L.; Jiang, Z.; Song, X.; Kang, Q.; Yao, D.; Chen, S.; Ru, J.; et al. Transcriptome and endogenous hormone analysis reveals the molecular mechanism of callus hyperhydricity in flax (Linum usitatissimum L.). Int. J. Mol. Sci. 2025, 26, 5360. [Google Scholar] [CrossRef] [PubMed]
  59. Leng, X.; Wang, H.; Cao, L.; Chang, R.; Zhang, S.; Xu, C.; Yu, J.; Xu, X.; Qu, C.; Xu, Z.; et al. Overexpressing GLUTAMINE SYNTHETASE 1;2 maintains carbon and nitrogen balance under high-ammonium conditions and results in increased tolerance to ammonium toxicity in hybrid poplar. J. Exp. Bot. 2024, 75, 4052–4073. [Google Scholar] [CrossRef]
  60. Trapnell, C.; Williams, B.A.; Pertea, G.; Mortazavi, A.; Kwan, G.; Van Baren, M.J.; Salzberg, S.L.; Wold, B.J.; Pachter, L. Transcript assembly and quantification by RNA-Seq reveals unannotated transcripts and isoform switching during cell differentiation. Nat. Biotechnol. 2010, 28, 511–515. [Google Scholar] [CrossRef]
  61. Kim, D.; Langmead, B.; Salzberg, S.L. HISAT: A fast spliced aligner with low memory requirements. Nat. Methods 2015, 12, 357–360. [Google Scholar] [CrossRef]
  62. Love, M.I.; Huber, W.; Anders, S. Moderated estimation of fold change and dispersion for RNA-seq data with DESeq2. Genome Biol. 2014, 15, 550–571. [Google Scholar] [CrossRef]
  63. Ashburner, M.; Ball, C.A.; Blake, J.A.; Botstein, D.; Butler, H.; Cherry, J.M.; Davis, A.P.; Dolinski, K.; Dwight, S.S.; Eppig, J.T.; et al. Gene ontology: Tool for the unification of biology. Nat. Genet. 2000, 25, 25–29. [Google Scholar] [CrossRef]
  64. Florea, L.; Song, L.; Salzberg, S.L. Thousands of exon skipping events differentiate among splicing patterns in sixteen human tissues. F1000Research 2013, 2, 188–213. [Google Scholar] [CrossRef]
  65. Zhu, L.; Liao, J.; Liu, Y.; Zhou, C.; Wang, X.; Hu, Z.; Huang, B.; Zhang, J. Integrative metabolome and transcriptome analyses reveal the molecular mechanism underlying variation in floral scent during flower development of Chrysanthemum indicum var. aromaticum. Front. Plant Sci. 2022, 13, 919151. [Google Scholar] [CrossRef] [PubMed]
  66. Chu, Y.; Huang, Q.; Zhang, B.; Ding, C.; Su, X. Expression and molecular evolution of two DREB1 genes in black poplar (Populus nigra). PLoS ONE 2014, 9, e98334. [Google Scholar] [CrossRef] [PubMed]
  67. Arocho, A.; Chen, B.; Ladanyi, M.; Pan, Q. Validation of the 2-DeltaDeltaCt calculation as an alternate method of data analysis for quantitative PCR of BCR-ABL P210 transcripts. Diagn. Mol. Pathol. 2006, 15, 56–61. [Google Scholar] [CrossRef] [PubMed]
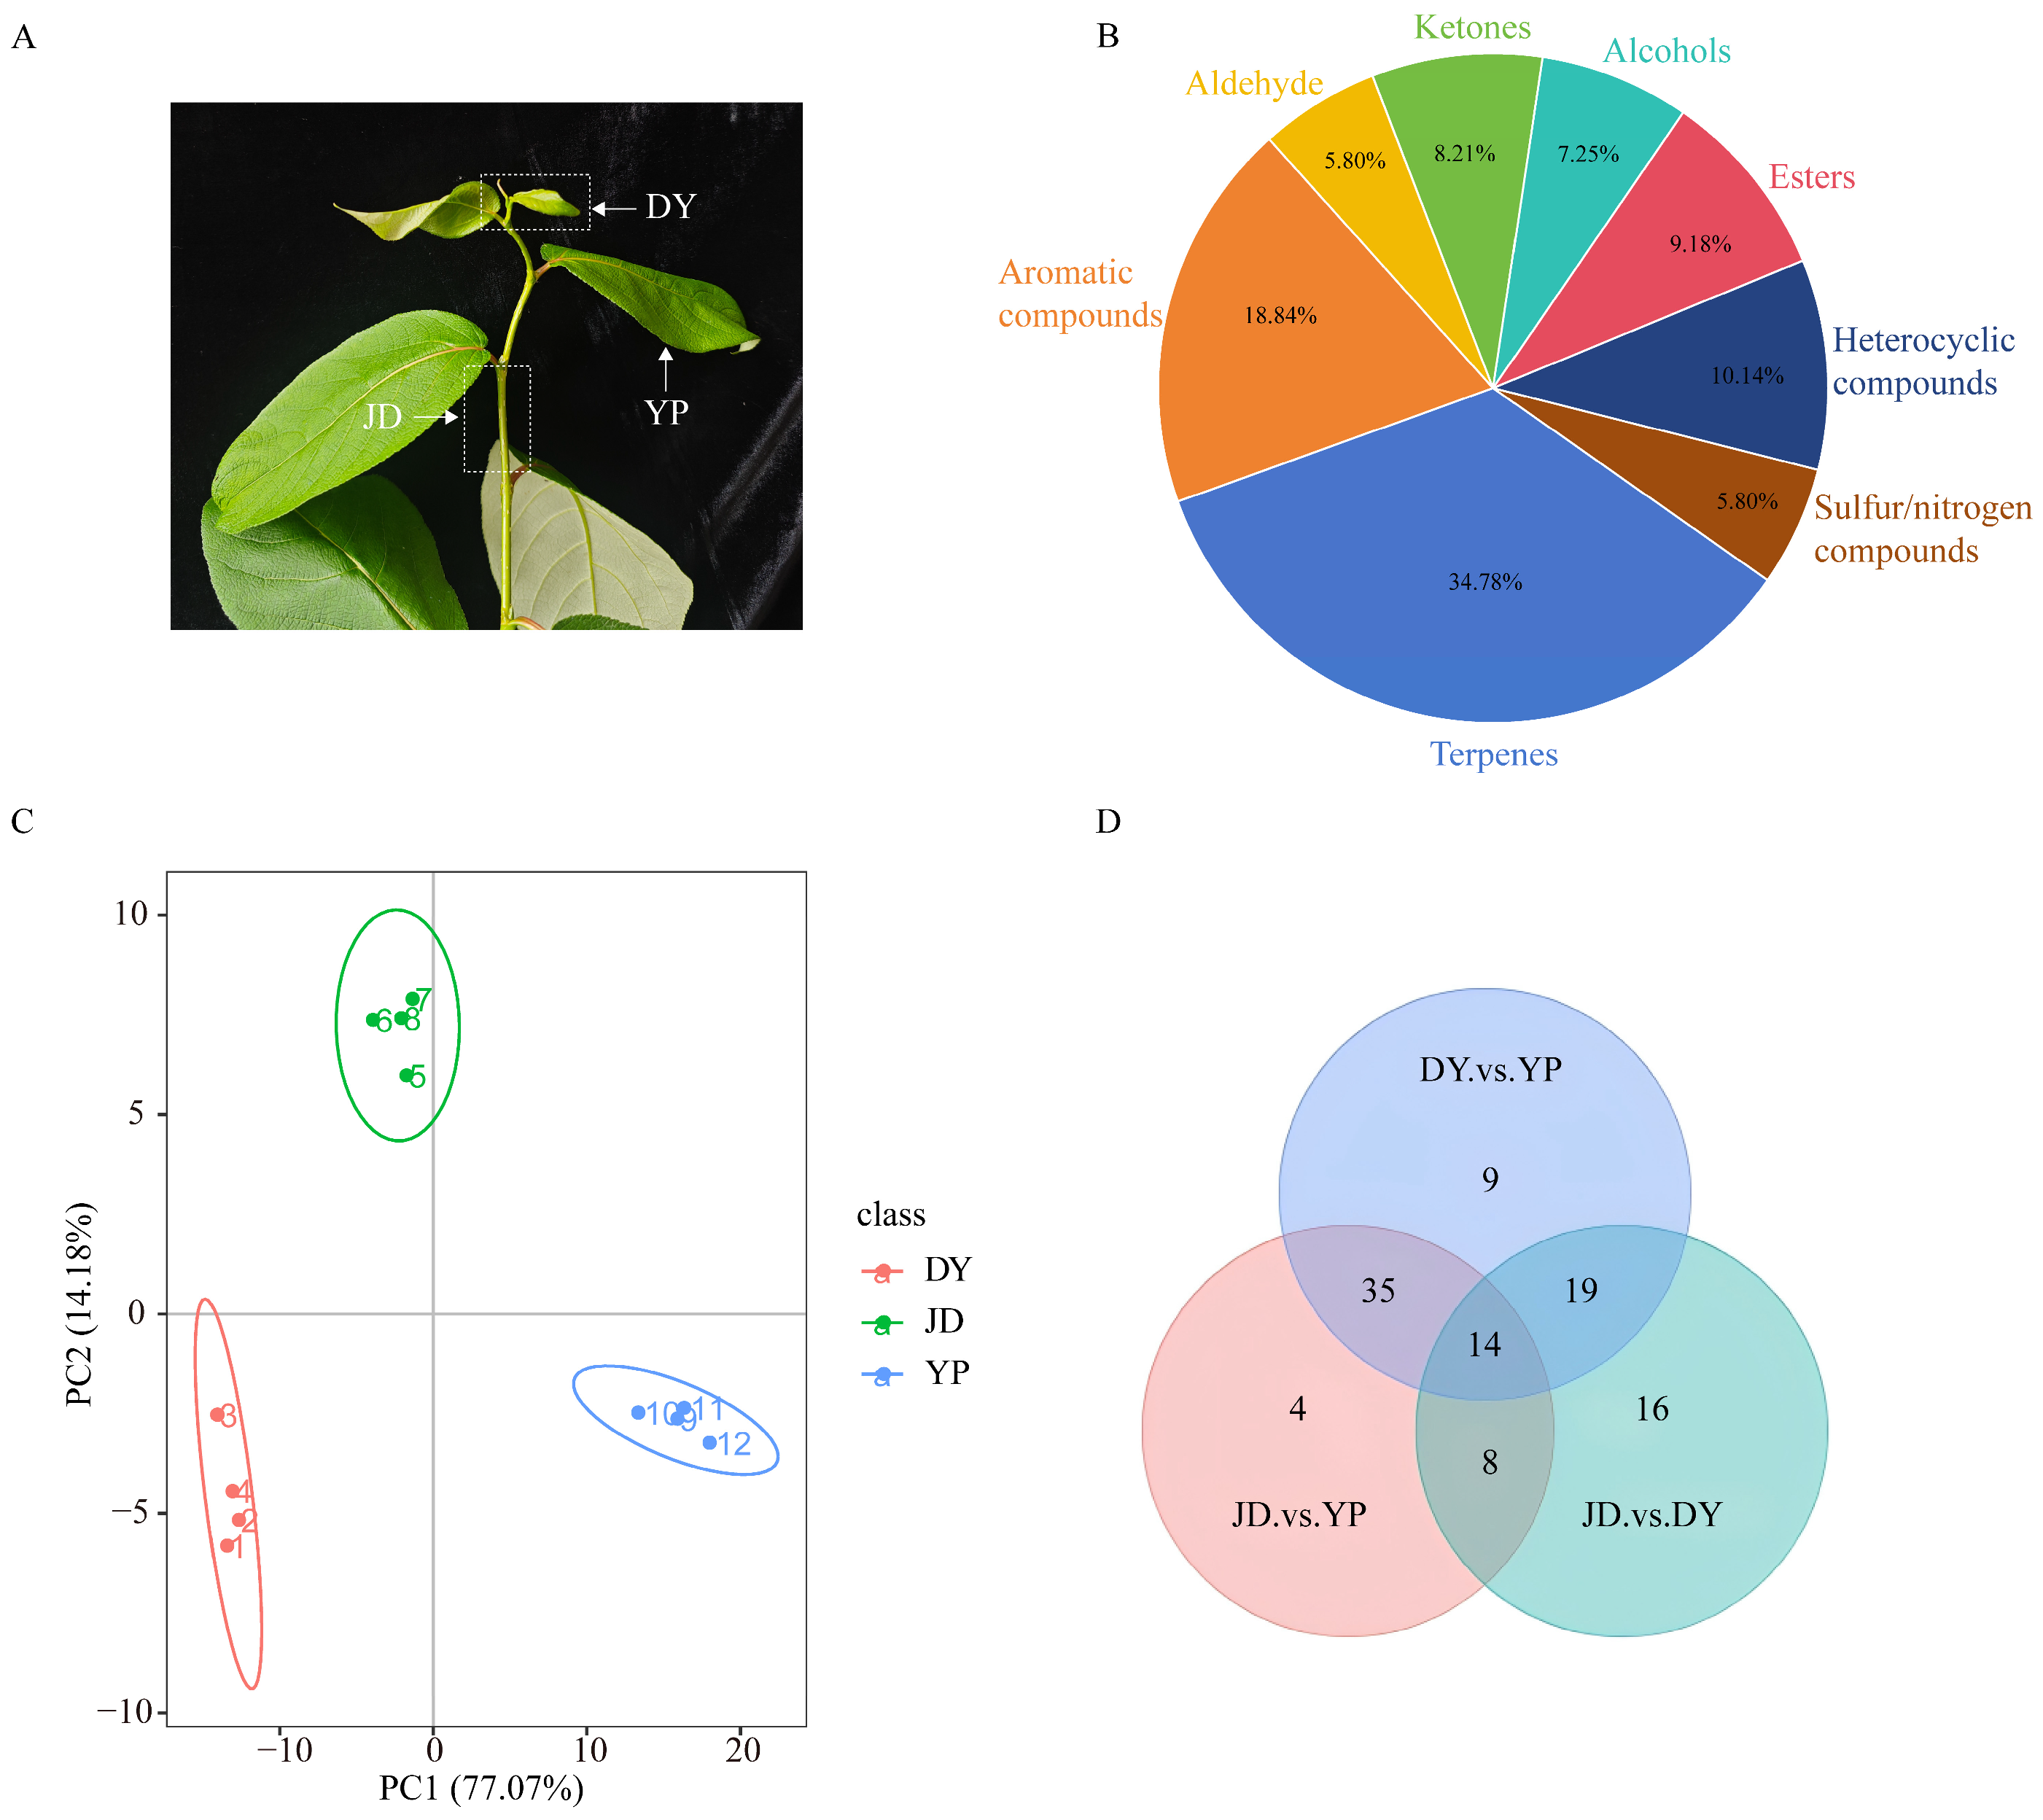
Figure 1. GC-MS analysis of different tissues in Populus koreana. (A) The collection tissue parts of P. koreana DY: terminal buds, JD: stems, YP: leaves. (B) Categories and proportions of different VOCs. (C) PCA plot of different samples. (D) Venn diagram of differential VOCs between DY, JD and YP comparisons.
Horticulturae 11 01262 g001
Figure 2. Comparative analysis of differential VOCs in different tissues of P. koreana. (AC) Volcano plots of differential VOCs in all comparison groups, (A) DY vs. YP; (B) JD vs. YP; (C) JD vs. DY. (DF) Steam plots of differential VOCs in all comparison groups, (D) DY vs. YP; (E) JD vs. YP; (F) JD vs. DY.
Horticulturae 11 01262 g002
Figure 3. Quantitative and correlation analysis of differential VOCs. (A) Heatmap analysis of differential VOCs in DY, JD and YP. (B) Box plots of aroma-active differential VOCs. (CE) Chord diagram of differential VOCs, (C) DY vs. YP; (D) JD vs. YP; (E) JD vs. DY.
Horticulturae 11 01262 g003
Figure 4. RNA-seq analysis of different tissues in Populus koreana. (AC) Volcano plots of differential DEGs in all comparison groups. (D) The K-means cluster analysis on DEGs.
Horticulturae 11 01262 g004
Figure 5. GO and KEGG enrichment analysis of DEGs. (AC) GO enrichment analysis of DEGs, (A) DY vs. YP; (B) JD vs. YP; (C) JD vs. DY. (DF) KEGG enrichment analysis of DEGs, (D) DY vs. YP; (E) JD vs. YP; (F) JD vs. DY.
Horticulturae 11 01262 g005
Figure 6. WGCNA. (A) Hierarchical clustering tree of co-expression modules based on WGCNA for DEGs. (B) Heatmap of gene module-sample correlations. (C) Expression patterns of DEGs in the “brown” module. (D) Co-expression network of hub genes in the “brown” module.
Horticulturae 11 01262 g006
Figure 7. Pathway mapping of DEGs. (A) Overview pathway mapping of DEGs in DY vs. YP. (B) Transcription factors mapping of DEGs in DY vs. YP. Heatmaps for individual genes are based on log2(fold-change) values, where red indicates up-regulated expression and blue represents down-regulated expression.
Horticulturae 11 01262 g007
Figure 8. Secondary metabolic pathways mapping of DEGs. (A) Terpenoid biosynthesis pathway mapping of DEGs in DY vs. YP. (B) Phenylpropanoid biosynthesis pathway mapping of DEGs in DY vs. YP. (C) Flavonoid biosynthesis pathway mapping of DEGs in DY vs. YP. Heatmaps for individual genes are based on log2(fold-change) values, where red indicates up-regulated expression and blue represents down-regulated expression.
Horticulturae 11 01262 g008
Figure 9. Transcriptome-metabolome integrative analysis. (A) Co-enrichment KEGG of DEGs and differential VOCs. (B) Number of genes and metabolites enriched in the phenylalanine metabolism pathway. (CE) Correlation network analysis of DEGs and differential VOCs, (C) DY vs. YP; (D) JD vs. YP; (E) JD vs. DY.
Horticulturae 11 01262 g009
Disclaimer/Publisher’s Note: The statements, opinions and data contained in all publications are solely those of the individual author(s) and contributor(s) and not of MDPI and/or the editor(s). MDPI and/or the editor(s) disclaim responsibility for any injury to people or property resulting from any ideas, methods, instructions or products referred to in the content.