Article

Complete Chloroplast Genome of Hygrophila polysperma (Acanthaceae): Insights into Its Genetic Features and Phylogenetic Relationships

by
Li-Xuan Chin
1,2,
Qiurui Huang
3,
Qinglang Fan
3,
Haibo Tan
1,2,
Yuping Li
1,2,
Caixia Peng
1,2,
Yunfei Deng
1,2 and
Yongqing Li
1,2,*
1
State Key Laboratory of Plant Diversity and Specialty Crops, Guangdong Provincial Key Laboratory of Applied Botany, South China Botanical Garden, Chinese Academy of Sciences, Guangzhou 510650, China
2
University of Chinese Academy of Sciences, Beijing 100049, China
3
Huamei International School, Guangzhou 510520, China
*
Author to whom correspondence should be addressed.
Horticulturae 2025, 11(10), 1240; https://doi.org/10.3390/horticulturae11101240
Submission received: 6 August 2025 / Revised: 6 October 2025 / Accepted: 8 October 2025 / Published: 14 October 2025
(This article belongs to the Special Issue Horticultural Plant Genomics and Quantitative Genetics)

Abstract

Hygrophila polysperma is a type of amphibious plant that originates from Acanthaceae. Here, we report its first complete chloroplast (cp) genome. The complete cp genome is 146,675 bp in length with 38.3% of GC content. There are 130 genes including 86 protein coding genes, 36 tRNA genes, and 8 rRNA genes in this genome. Simple short sequence (SSR) analysis found 30 SSRs, 24 of which are located in a large single-copy region. Nucleotide diversity identified six most divergent sequences (trns-GCU, psaA-pafI, psaI-pafII, ycf2, rpl32, and ycf1) among 3 close-related species, H. polysperma, H. ringens, and Asteracantha longifolia. A phylogenetic tree among H. polysperma and another 30 related species was constructed based on the common coding sequence of the cp genome and showed that H. polysperma is most closely related to H. ringens (both belong to subtribe Hygrophilinae) and, together, they form a clade that is sister to A. longifolia. This study provides a basis for systemic and evolution studies as well as the development of molecular markers for species identification and genetic breeding.

1. Introduction

Hygrophila is a genus within the Acanthaceae family, one of the largest plant families from angiosperm. Hygrophila polysperma (Roxb.) T. Anderson is also known as Miramar weed as the common name [1,2] and grows as an annual herbaceous plant. This species was found in Jiangxi province in mainland China when it was first being reported as a terrestrial plant [3]. By contrast, the submerged variation of this species was introduced to Florida, U.S., in the 1950s as an ornamental aquatic plant by the aquarium plant industry [4]. H. polysperma grows in the form of a shrub and is categorized as an invasive species due to its fast-growing and rate of rapid spread [4,5,6].
H. polysperma was first documented in Florida as an aquatic ornamental used in the aquarium trade, whereas the sample collected in this study was grown under terrestrial conditions. This is due to its amphibious properties, allowing it to grow on submerged, emerged, and land habitats. Likewise, Hygrophila ringens (H. ringens) and Hygrophila difformis (H. difformis), another species of the same genus, are typically submerged macrophytes of tropical and subtropical rivers and streams and occupy primarily wet tropical biomes [7,8]. In addition, the generic epithet “Hygrophila” itself derives from Greek hygro- (water) and -phila (plants), reflecting the historical association with aquatic habitats and its initial dissemination by aquarium enthusiasts [9].
H. polysperma is reproduced through seed dispersal where the seeds are stored in polyspermous, thin-walled, elliptical capsules [9]. The leaves are 2–2.2 cm long, elliptic-lanceolate, obtuse, and all linear with inconspicuous rounded teeth (Figure 1). The flowers are purple with the upper lip 2-toothed and the lower lip 3-lobed, and with the lobes nearly equal and rounded. However, the leaves of submerged H. polysperma are generally larger in size and grow up to 8 cm long and 2 cm wide [4].
Chloroplast contains the genomic information that gives the data of its varieties and speciation. The chloroplast genome (cp genome) is conserved and contains a large single-copy (LSC) region, a small single-copy (SSC) region, and two inverted repeat regions (IRs) in opposite directions, forming a quadripartite structure. These contribute to the capability of the cp genome to be utilized for plant systemic and evolution studies, as well as the development of molecular markers for species identification and genetic breeding [10]. Here, we report the complete cp genome of H. polysperma. The characteristics of the genome including gene content, repeat sequences, codon analysis, IR contraction and expansion, and comparative analysis of genome structure were summarized and the phylogenetic relationship between H. polysperma and 30 other species were analyzed based on coding sequences (CDSs) from complete cp genomes. This study aims to provide the scientific basis for development of molecular markers in species identification, genetic breeding, and molecular evolution studies.

2. Materials and Methods

2.1. Plant Materials, DNA Extraction, and Plastid Genome Sequencing

Fresh plant samples were collected from the South China Botanical Garden research centre field in Guangzhou city, Guangdong province, China, and were grown from the seeds of wild H. polysperma under terrestrial conditions. A voucher specimen of the plant samples was deposited at the herbarium of South China Botanical Garden with accession number IBSC1050922. The arial part of the fresh plant samples was collected for extraction and genome sequencing. Total genomic DNA was extracted using the Magen HiPure Plant DNA extraction kit (Magen Biotech CO., Shanghai, China) and amplified through Polymerase Chain Reaction (PCR). The PCR product was then detected for purity and quality via DNA gel electrophoresis (1 × TAE agarose gel). The qualified DNA was subject to DNA sequencing through the BGISEQ-500 platform by sending to Bio & Data Biotech. Inc., Guangzhou, China. The sequencing procedure was carried out according to the BGISEQ-500 standard protocol. The process of DNA sequencing included DNA sample quality detection, ultrasonication into DNA fragments, reconstruction of the sequence library from DNA fragments, quality detection of the sequence, and genome sequencing.

2.2. Cp Genome Assembly and Annotation

After BGISEQ-500 sequencing, the raw data of the sample was converted into nucleotide data through base calling conversion. The raw reads were displayed in the form of FASTQ containing the original data. The raw reads were QC-filtered by eliminating primer sequence, capping end, and low-quality data to obtain clean data. In order to reduce the complexity of sequence assembly, fast gapped-read alignment with Bowtie 2 was carried out by selecting three CDSs with the highest number of aligned reads and treated as the starting sequences (SSeqs) for cp genome assembly [11]. This is because these sequences with the highest number of aligned reads are mostly conserved and less likely to contain structural variations or errors. The core module of assembly was used by Novoplastys software to assemble the sequence into cp genome contigs [12]. CAP3 was used to connect multiple contigs into a complete cp genome, and the starting position of the circular cp genome was manually adjusted. The complete cp genome of H. polysperma was created for this study.
We constructed the annotation of the H. polysperma complete cp genome by using the GeSeq online tool (https://chlorobox.mpimp-golm.mpg.de/geseq.html, accessed on 20 February 2025) with default parameters [13]. The detailed circular cp genome map was constructed with Organellar Genomes DRAW (OGDRAW) [14]. Detailed information of the cp genome was determined and stated by using Unipro UGENE v50.0 software, as well as the GC content analysis and distribution [15].

2.3. Repeat Sequences and Codon Usage Analysis

We conducted repeat-sequence detection by performing analysis through the MISA-web online platform (https://webblast.ipk-gatersleben.de/misa/index.php?action=1, accessed on 20 March 2025) [16] with Kmer lengths of 10, 6, 5, 4, 4, and 4, where each value refers to the mononucleotide, dinucleotide, trinucleotide, tetranucleotide, pentanucleotide, and hexanucleotide, respectively. The Short Sequence Repeats (SSRs) were then compared with the result obtained from running the script provided by [17] through the github platform (https://github.com/Xwb7533/CPStools, accessed on 21 March 2025) to obtain the complete SSR information. Repeat sequences such as forward (F), reverse (R), complementary (C), and palindromic (P) were analyzed by running the REPuter online programme (https://bibiserv.cebitec.uni-bielefeld.de/reputer, accessed on 21 March 2025) with a minimal repeating size of 30 bp and a Hamming distance of 3. Tandem repeats were analyzed by using the online Tandem Repeats Finder Program (https://tandem.bu.edu/trf/home, accessed on 21 March 2025) [18] with alignment parameters of 2, 7, and 7 bp, denoting match, mismatch, and indel sections. In order to understand the preferable codons, we conducted Relative Synonymous Codon Usage (RSCU) analysis by using online tools, RSCU illustrator, provided on the Genepioneer platform (http://genepioneer.com/, accessed on 21 March 2025).

2.4. Inverted-Repeats Contraction and Expansion

IR boundary comparison among cp genome sequences of different species was illustrated by using the CPJSdraw tool provided on the Genepioneer platform to visualize the LSC-IR and SSC-IR boundary [19].

2.5. Comparative Analysis of Genome Structure

The list of information including every gene position in the cp genome was compiled and created to run mVISTA analysis online. VISTA is a comprehensive suite of programmes and databases for comparative analysis of genomic sequences where mVISTA is one of the online tools to align and compare the sequences from multiple species. The mVISTA online programme (https://genome.lbl.gov/vista/mvista/submit.shtml, accessed on 21 March 2025) was used in LAGAN mode to align the obtained cp genomes with another 4 different species of the Acanthaceae family [20]. The complete genome sequences were downloaded from NCBI (accession numbers: PQ436353, NC_080349, NC_082429, and NC_080332).
Then, we conducted nucleotide diversity (Pi) analysis by using DNA Sequence Polymorphism software (Dna SP) v6.12 to identify the possible molecular markers that can be applied for phylogenetic analysis. The Pi analysis was performed with a sliding window with a window length of 600 bp and step size of 200 bp.

2.6. Phylogenetic Analysis

The phylogenetic tree was illustrated by selecting a complete cp genome of another 30 species, which showed the highest percentage of identical sequences to H. polysperma. The complete cp genome was downloaded from Genbank of NCBI (Table S1). The common CDS of cp genomes shared among 31 species was analyzed using the script provided by [17]. The common CDS nucleotides of all 31 cp genomes were aligned by using the Clustal Omega online platform (https://www.ebi.ac.uk/jdispatcher/msa, accessed on 24 March 2025) to obtain a multiple-sequence alignment file. Phylogenetic analysis was performed via maximum likelihood (ML) analysis on the nucleotide alignment of 66 common CDSs using MEGA11 [21]. ML phylogenetic inference was performed by using a general time-reversible model with a gamma distribution of substitution rate among sites (GTR+G) and applying 1000 replicates to optimize the ML method. Bootstrap analysis was performed to determine the support of each branch in the phylogenetic tree constructed. The percentage of trees in which the associated taxa clustered together is shown next to the branches. We obtained the initial tree for the heuristic search automatically by applying Neighbour-Join and BioNJ algorithms to a matrix of pairwise distances estimated using the Maximum Composite Likelihood (MCL) approach, and then selecting the topology with a superior log likelihood value. A discrete Gamma distribution was used to model evolutionary rate differences among sites (5 categories (+G, parameter = 0.2505)). There was a total of 53,140 positions obtained in the final dataset.

3. Results

3.1. Species Identification

The fresh plant sample was collected in the South China Botanical Garden and initially identified as H. polysperma based on phenotype. To further confirm the species identity, sequencing was carried out and the result showed that the highest cp genome sequence similarity belongs to a species called Hygrophila sp. (accession number: OQ984266) with a mere genus name without exact species variation. Thus, the gene sequence of the psb-trnH intergenic spacer from this species was selected and input in GenBank for species characterization. It showed that the sequence of the psb-trnH intergenic spacer is highly similar to H. polysperma (accession number: KP744280) at 98.2% of identity.

3.2. General Characterization of Genome

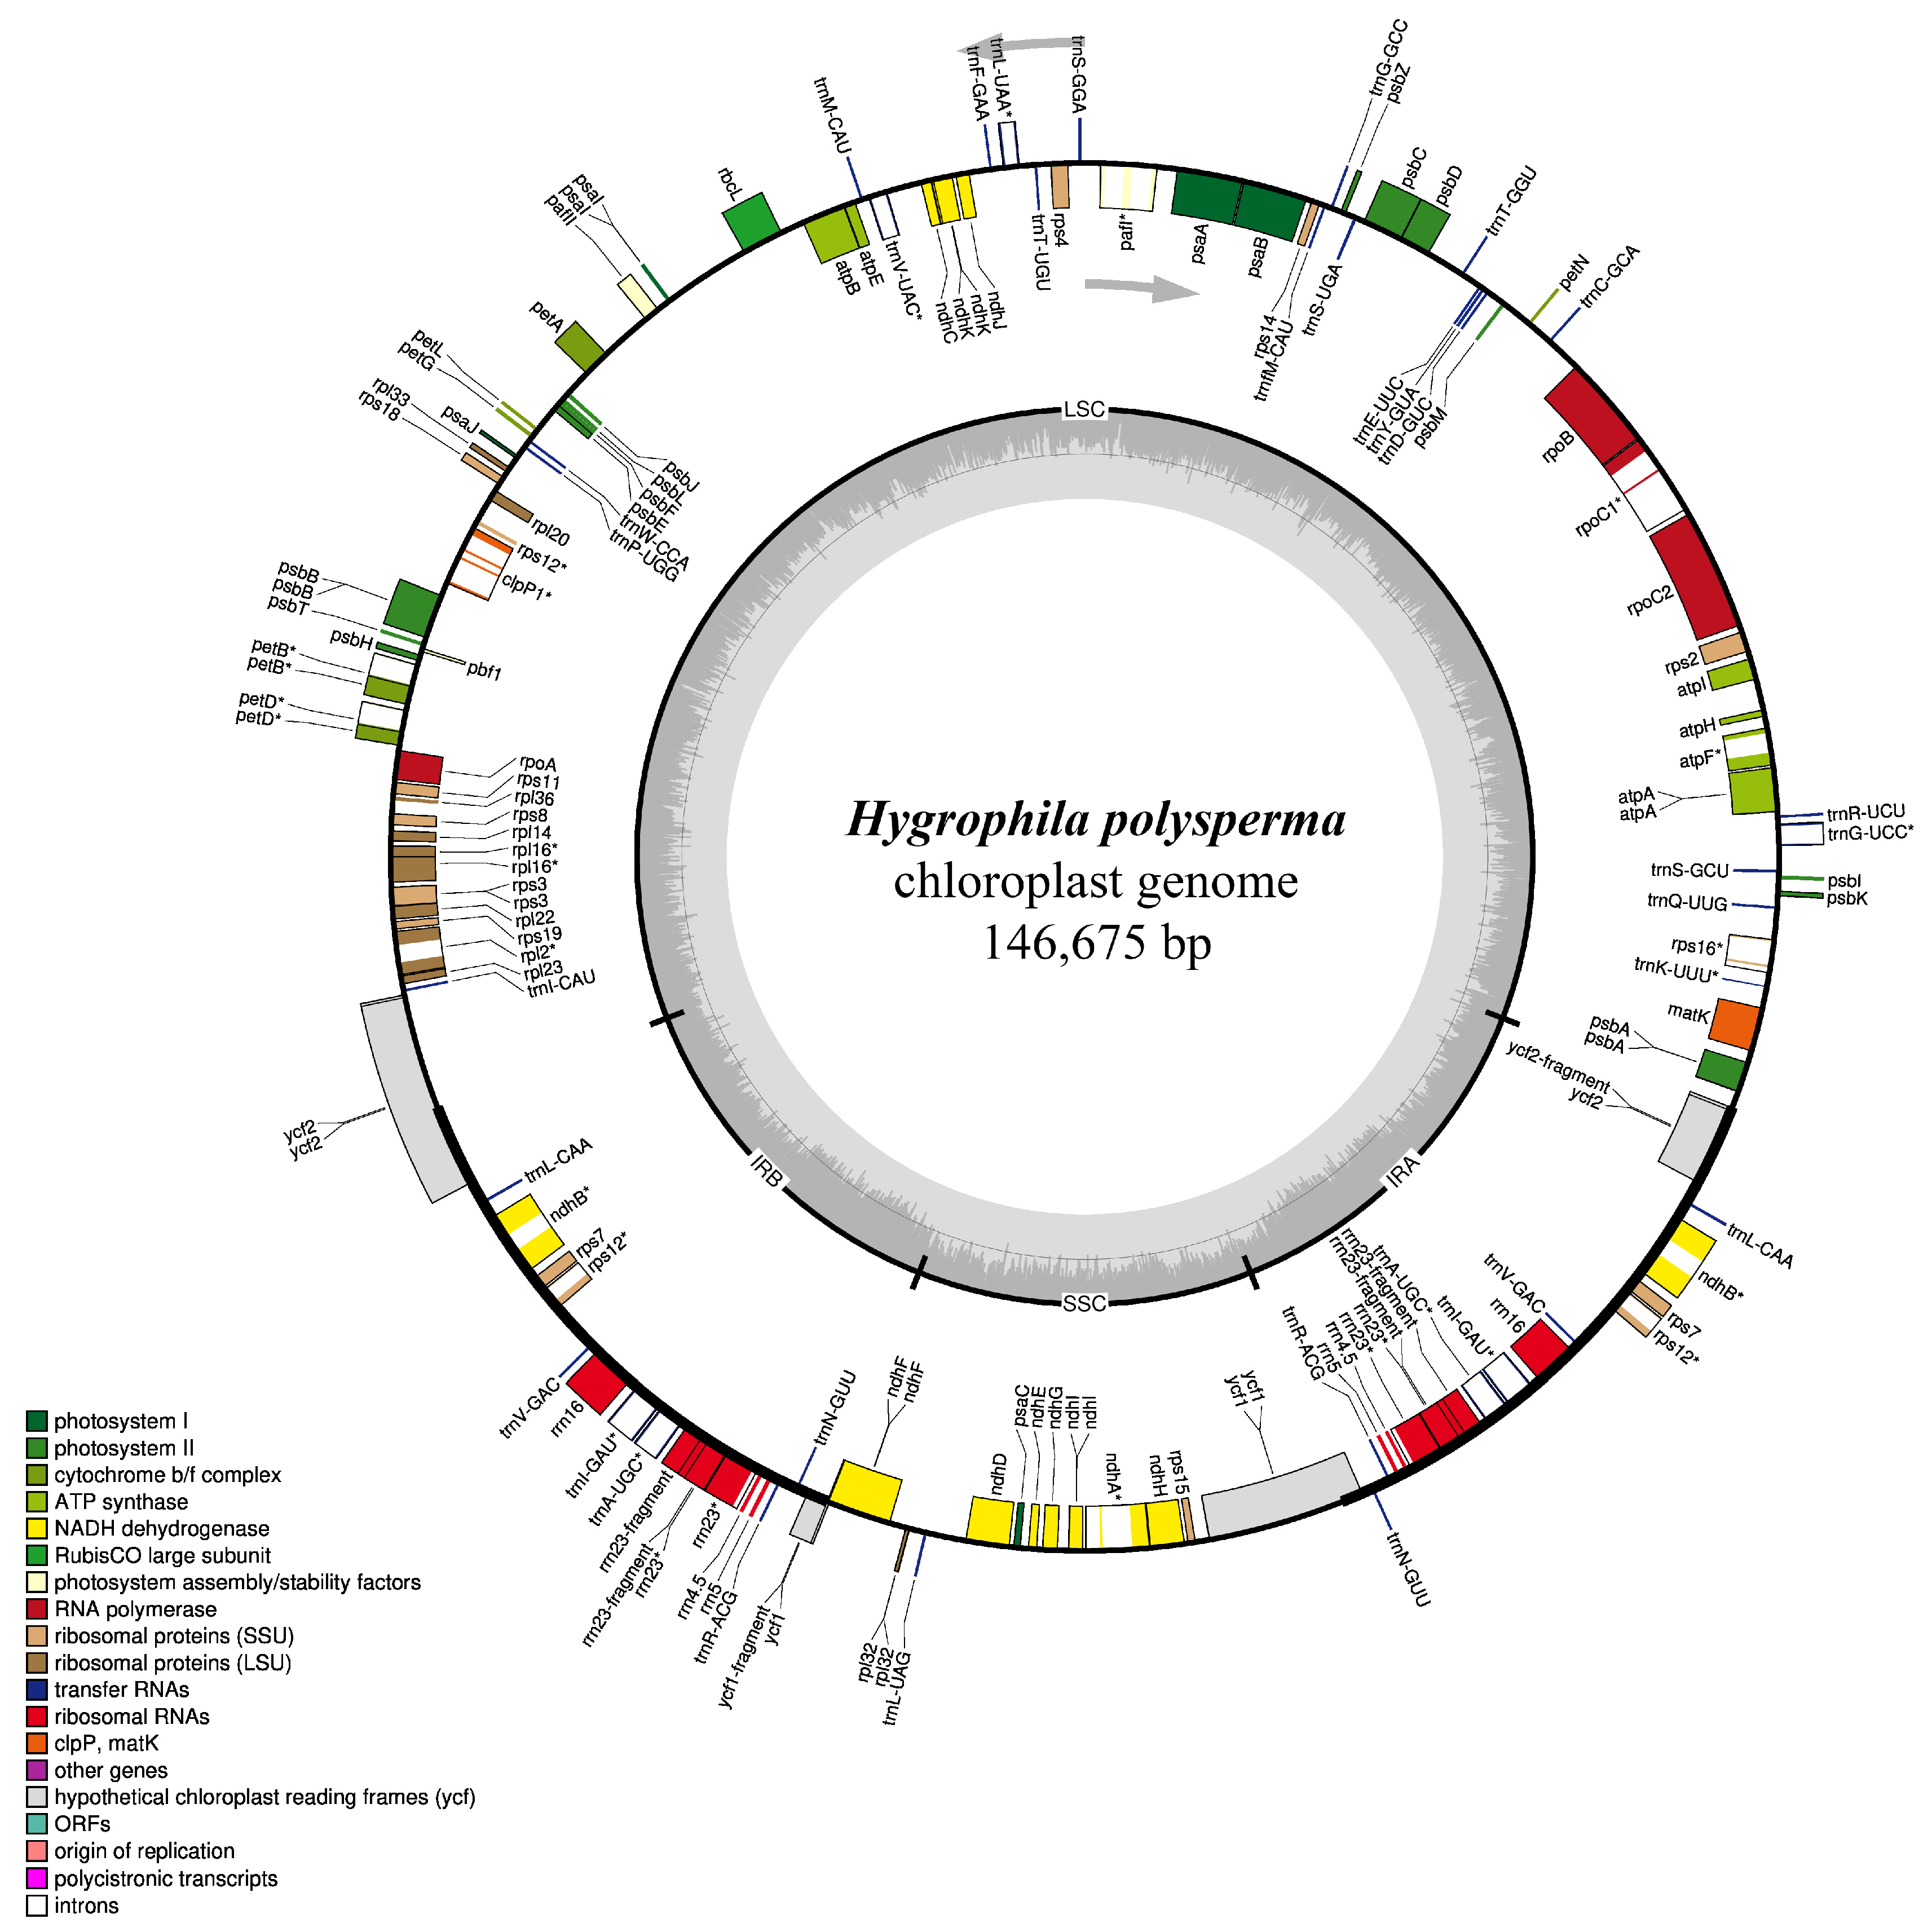
The cp genome of H. polysperma demonstrated a circular structure containing a length of 146,675 bp nucleotides, including 90,570 bp nucleotides in the LSC region (1–90,570 bp), 17,699 bp nucleotides in SSC (109,774–127,472 bp), and a pair of IRs consisting of 19,203 bp nucleotides (90,571–109,773 bp for inverted-repeat A and 127,473–146,675 bp for inverted-repeat B) (Figure 2), forming a typical quadripartite organization. The cp genome of H. polysperma annotated 130 genes consisting of 86 CDSs, 8 rRNAs, and 36 tRNAs (Table 1). There are 22 genes that contain introns in the H. polysperma cp genome. The 130 genes overall can be categorized into four categories, which are photosynthesis-related genes (6 gene groups), self-replication (5 gene groups), other genes (7 gene groups), and genes with unknown function (1 gene group) (Table 2).
There is a total of 38.3% of GC content found in the overall cp genome, with 38.4% distributed in CDSs, 55.5% in rRNA, and 33.5% in non-coding regions (Table 3). There are 30.6%, 31.1%, 19.5%, and 18.8% attributed in the cp genome of H. polysperma to A, T, C, and G bases, respectively. The GC content was found to be higher in the IRs (45.2%) than the regions in LSC (36.4%) and SSC (32.7%). The occurrence of this situation is due to the presence of rRNAs in IRs, resulting in the genome possessing a higher GC content (Figure 3). This situation can be observed in the majority of angiosperm plants [22,23]. The overall length of the CDS region is 74,493 bp, where 68 protein coding genes are located in the LSC region, 11 are located in the SSC region, and 10 of them are distributed in IRs. The GC content is higher in CDSs than the overall cp genome at 38.4%.
When the complete cp genome assembly was input into BLAST (https://blast.ncbi.nlm.nih.gov/Blast.cgi?PROGRAM=blastn&PAGE_TYPE=BlastSearch&LINK_LOC=blasthome, accessed on 20 March 2025), it showed that the gene sequence is closely related to another Hygrophila species called H. ringens. Thus, the cp genome of H. ringens was selected to be compared with H. polysperma in the analysis shown below.

3.3. General Comparison of Cp Genome with Another Closely Related Species

Both cp genome sequences of H. polysperma and H. ringens were aligned and compared. Genes consisting of 2 exons include trnH-GUG, trnK-UUU, rps16, trnG-UCC, atpF, rpoC1, trnL-UAA, trnV-UAC, petB, petD, rpl16, rpl2, ndhB, trnI-GAU, trnA-UGC, and ndhA, and those consisting of 3 exons, rps12, pafI, and clpP1, were displayed in the cp genome of H. polysperma. In the cp genome of H. polysperma, genes including ycf3, ycf4, clpP, psbN, and ycf68 showed no significant similarity to any known sequences when compared with H. ringens, and no homologs were detected for the introns of ycf3. However, a single gene, pafI, which contains an extra intron of trnI, was identified.
Thykaloid ycf3 was previously reported as a conserved gene sequence in cyanobacteria, algae, and plants, which is essential for stable accumulation to encode the photosystem I assembly factors in photosynthesis at the post-transcriptional level [24,25,26]. Similarly, the ycf4 gene plays a crucial role in encoding the nonessential assembly factor for photosystem I in higher plants [27]. However, the detected pafI and pafII genes in the H. polysperma cp genome are part of the assembly and maintenance of the photosystem I complex [28]. These photosynthesis-related genes, pafI and pafII, were also previously reported in P. cyrtonema and P. odoratum from the Liliceae family [29] and C. gileadensis from the Burseraceae family [28], consistent with the lack of detectable homology to the ycf3 and ycf4 genes. Similarly, the gene ycf68 is also a photosynthetic-related gene, but the main function of this gene is not fully understood [30,31]. The clpP gene encodes for the Clp protease proteolytic subunit that is present in the H. ringens chloroplast genome, but the clpP1 (caseinolytic protease P1) gene is present in H. polysperma, encoding for the function of ATP-dependent Clp protease proteolytic subunit 1. The clpP gene was previously reported in a green alga, C. reinhardtii, which works as an important chloroplast gene involved in cytochrome b6f complex and protein ClpP1, which is part of the Clp system, as a catalytic subunit in ATP-dependent ClpP protease [32,33,34]. The basic structure of Clp machinery is conserved throughout evolution as the Clp system plays a central role in plastid development and function [35,36]. Furthermore, no homology was detected for the psbN gene (which encodes for photosystem II protein N), whereas the pbf1 (prolamin-box binding factor1) gene, encoding photosystem biogenesis factor 1 was identified in H. polysperma. It was reported that the psbN gene is required for early assembly and repair of photosystem II in tobacco, N. tabacum [37]. The expression of the psbN gene affects the processing of psbT-psbH intercistronic RNA [38], but the effect of the pbf1 gene located within psbT-psbH is unknown as the function of the pbf1 gene was previously reported to play a role in transcription regulation in the seed of maize [39]. Thus, the pbf1 gene may be performing a different function related to chloroplast-specific processes.
In addition, the gene ndhA in the H. polysperma cp genome which encodes for NADH dehydrogenase subunit A, occupying the largest intron (1077 bp) that is allocated in the SSC region, was detected.
Apart from H. ringens, we found that Asteracantha longifolia (A. longifolia) displays a higher percentage of identical sequences than H. ringens. Therefore, a comparison of the genome sequence was conducted among H. polysperma and A. longifolia as well. Based on the comparison of the cp genome sequence, no homologs were detected for ycf3, ycf4, clpP, and psbN genes, as well as rrn16s, ycf68, rrn23S, rrn4.5s, and rrn5s genes in H. polysperma, but there were significant identifications in A. longifolia.

3.4. Repeat Sequences

As protein-coding regions and conserved gene sequences of the cp genome can be treated as tools for phylogenetic analysis and domestication studies [40], the intron content was evaluated in this study. SSRs, also known as microsatellites, referring to 2–6 base pairs of repeating DNA sequences, function as molecular markers in genetic variation, which are located in non-coding sequence regions, and their impacts vary depending on their location in the gene sequence [41]. In this case, a total of 30 SSRs were found in the cp genome of H. polysperma (Table 4). Based on the perspective of the distribution of SSRs, a majority of the SSRs (24) were found in the LSC region, whereas 2 SSRs were found in the IR and 4 SSRs were located in the SSC region. In addition, there are 26 mono-, 3 di-, and 1 tetranucleotides found based on the result obtained from SSRs containing 2 compound SSRs.
In order to understand the type of repeats in the sequence, they are categorized into tandem, palindromic, forward, reverse, and complementary repeats. After analysis in REPuter and MISA-web programmes, a total of 30 tandem, 13 palindromic, 12 forward, 3 reverse, and 2 complementary repeats were shown from the result. The size of tandem repeats is generally distributed from 10 to 17 bp, 30 to 44 bp for palindromic, 30 to 42 bp for forward, 30 to 37 for reverse repeats, and 15 and 102 bp for each complementary repeat.
There are 22 genes recruiting introns, of which 14 are CDSs and 8 are tRNAs (8 of these are duplicated in the IR). Most genes consist of only a single intron, whereas pafI and clpP1 contain the usual complement of two introns each within the genes. There are 13 genes that are composed of introns located at the LSC, while 4 duplicated genes consisting of introns are distributed within IRs. Only 1 gene employs an intron in the SSC region.

3.5. Codon Usage Analysis

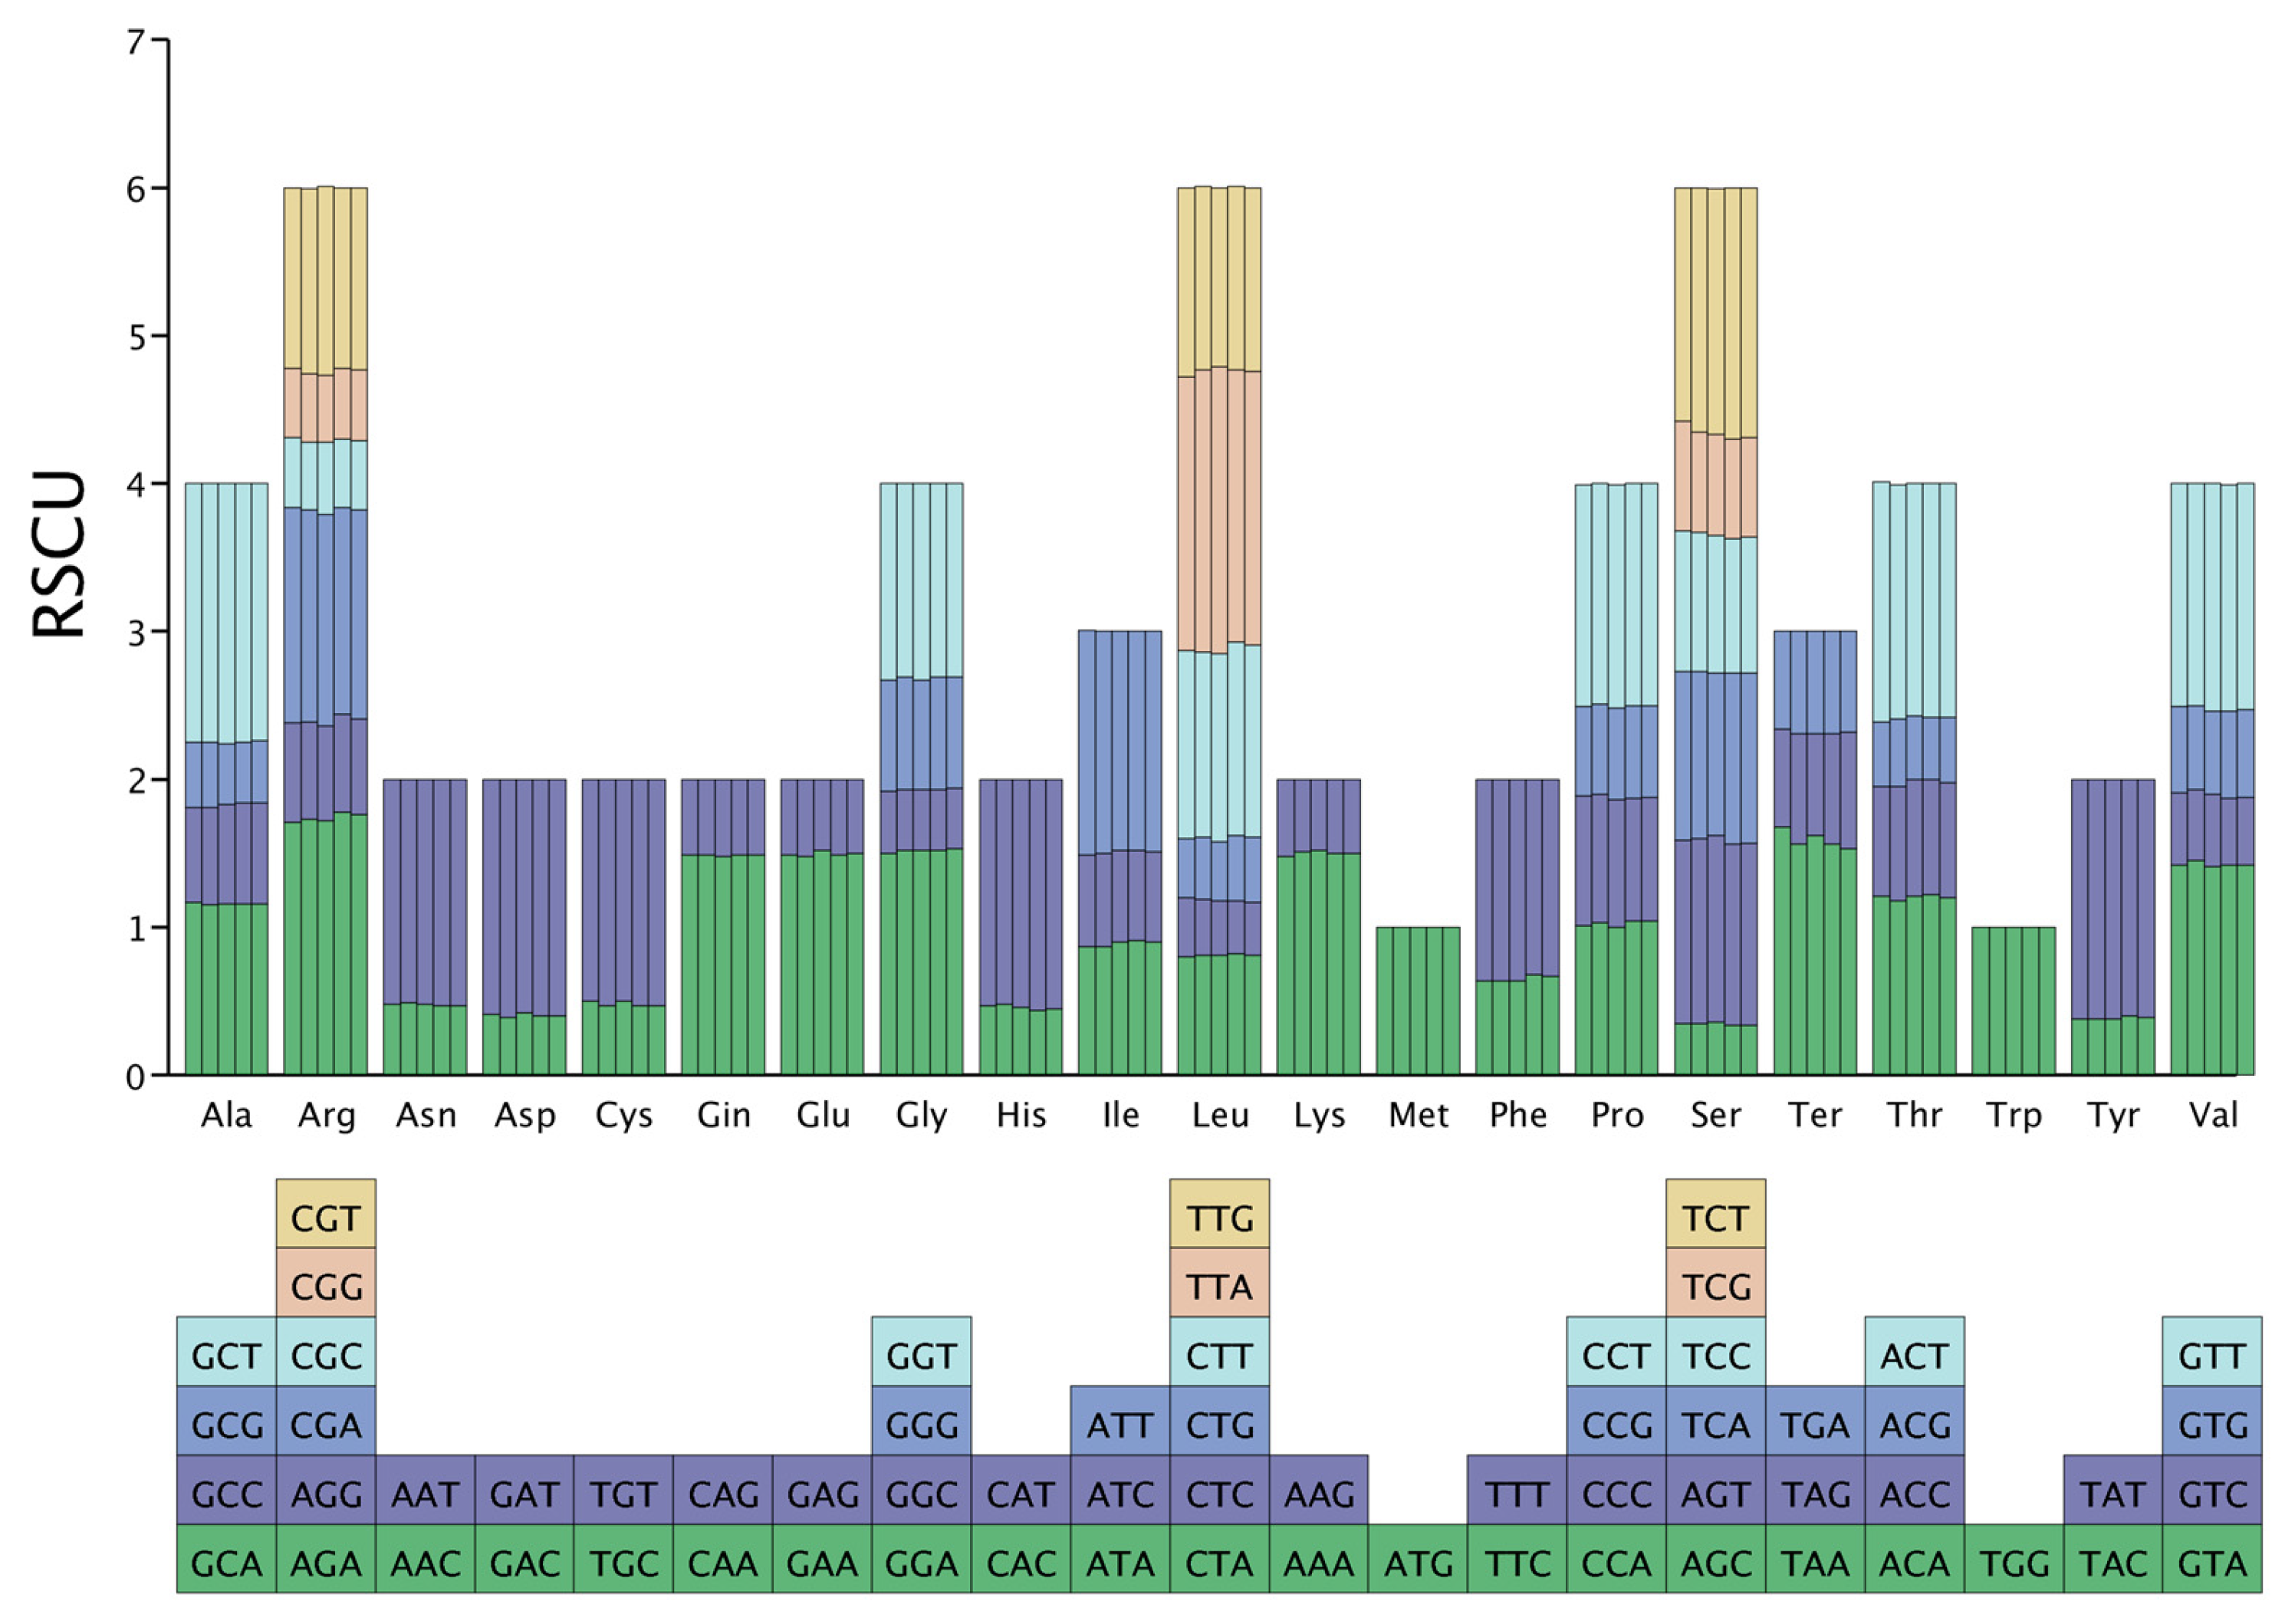
The RSCU chart was constructed to evaluate the rate of preference for codons employed by selected species. A value more than 1.0 indicates a higher preference of codons among all synonymous codons. RSCU analysis of the cp genome was carried out among the five highest percentages of identical cp genome sequences, including H. ringens, A. longifolia, and another 2 species Ruellia elegans (R. elegans) and Ruellia speciosa (R. speciosa). We identified 30,190 codons present in the entire H. polysperma cp genome. After eliminating the CDS gene sequences less than 300 bp (to minimize non-adaptive biases), only 50 CDSs were kept for RSCU analysis, and the total CDS length was 59,334 bp after merging. The codon TTA of leucine was the most used, and AGC and TAC were the codons least used. Arginine, leucine, and serine are the most universal amino acids among the 64 total RSCUs presented (Figure 4). The frequency of start codons ATG and TGG demonstrated no bias (RSCU = 1).
Codon usage preference is important in studying the origin and evolution of green plants, which have been published for various organisms [42]. RSCU demonstrated, out of 32 codons with RSCU values greater than 1, 29 that end with nucleotides A/T. This proves that the H. polysperma cp genome has a stronger preference for codons ending with A/T bases. High RSCU (>1) is often due to mutation bias and natural selection pressure [8].

3.6. IR Contraction and Expansion in the cp Genome

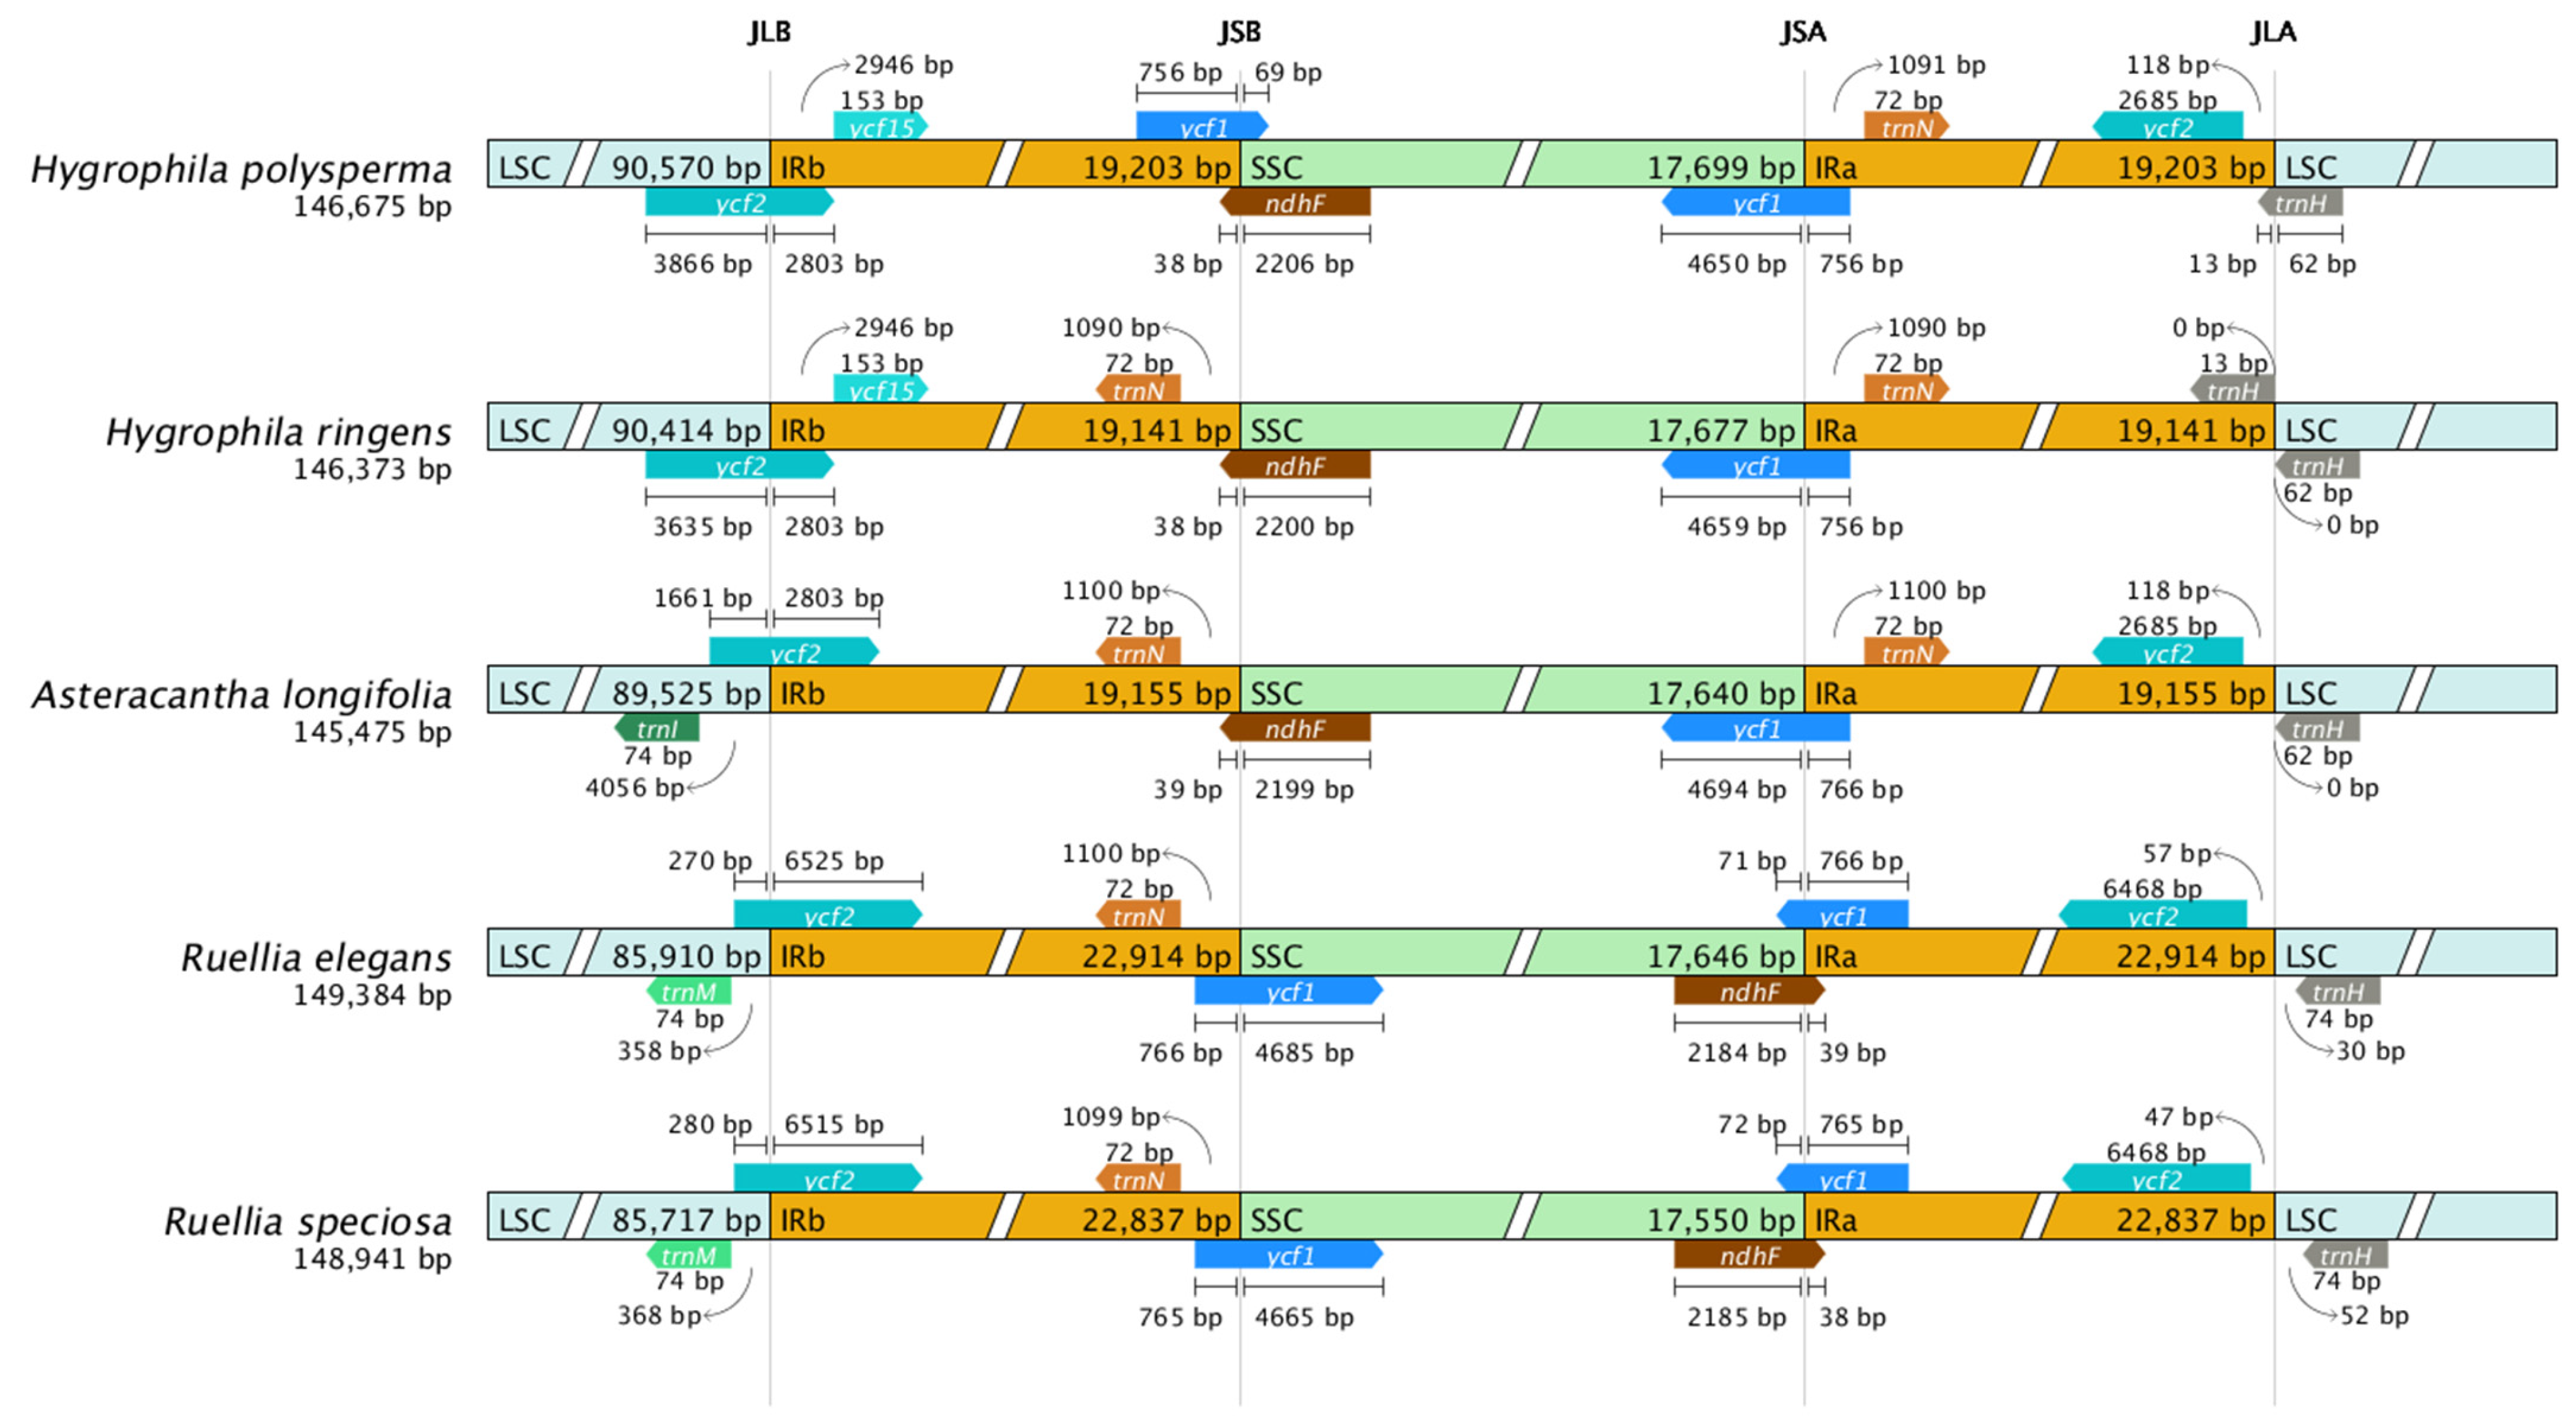
There are four boundary limits shown between LSC-IRb-SSC-IRa regions due to the unique circular quadripartite structure of the cp genome. The difference in IR (IRa and IRb) sequences indicates the variation and identity of species as IRs that are the most conserved regions of the cp genome, and the expansion and shortening of IR boundaries are suggested to be involved in the size difference of the cp genome [43]. The length of IRs among two Hygrophila species and A. longifolia ranges from 19,141 bp to 19,203 bp (Figure 5). The variations within the IR-SC boundary regions with H. ringens are similar except for the presence of ycf2 genes in the IRb regions of H. polysperma, which is different from H. ringens.
The IR contraction of H. polysperma species was then compared within the four closest sequence-similarity members based on the BLAST results. The gene content of H. polysperma was shown to be conserved as the similarity of gene contents in IRs among different species is not consistent, except for H. ringens. ycf2 genes were found in both IRs of all 5 species, but the gene length is significantly shorter than that of Ruellia sp. while being longer than those of H. ringens and A. longifolia in the LSC-IRb region. Similarly, the length of the trnH gene in the IRb region of Hygrophila sp. is longer than those of other species. This phenomenon only occurred in Hygrophila sp. Therefore, the position of the trnH gene that is located exactly in the IRa-LSC region of Hygrophila sp. is conserved. In contrast, the position of the trnH gene from another species is entirely located within the LSC region without elongation.
Genes that show similarity within 5 cp genomes through crossing the junction border include the ycf1 gene that crosses IR-SSC borders, as it has been reported that this ycf1 gene contributes to cp genome analysis in higher plants [44]. The ndhF gene also covers IR-SSC regions of five cp genomes displaying high similarity.

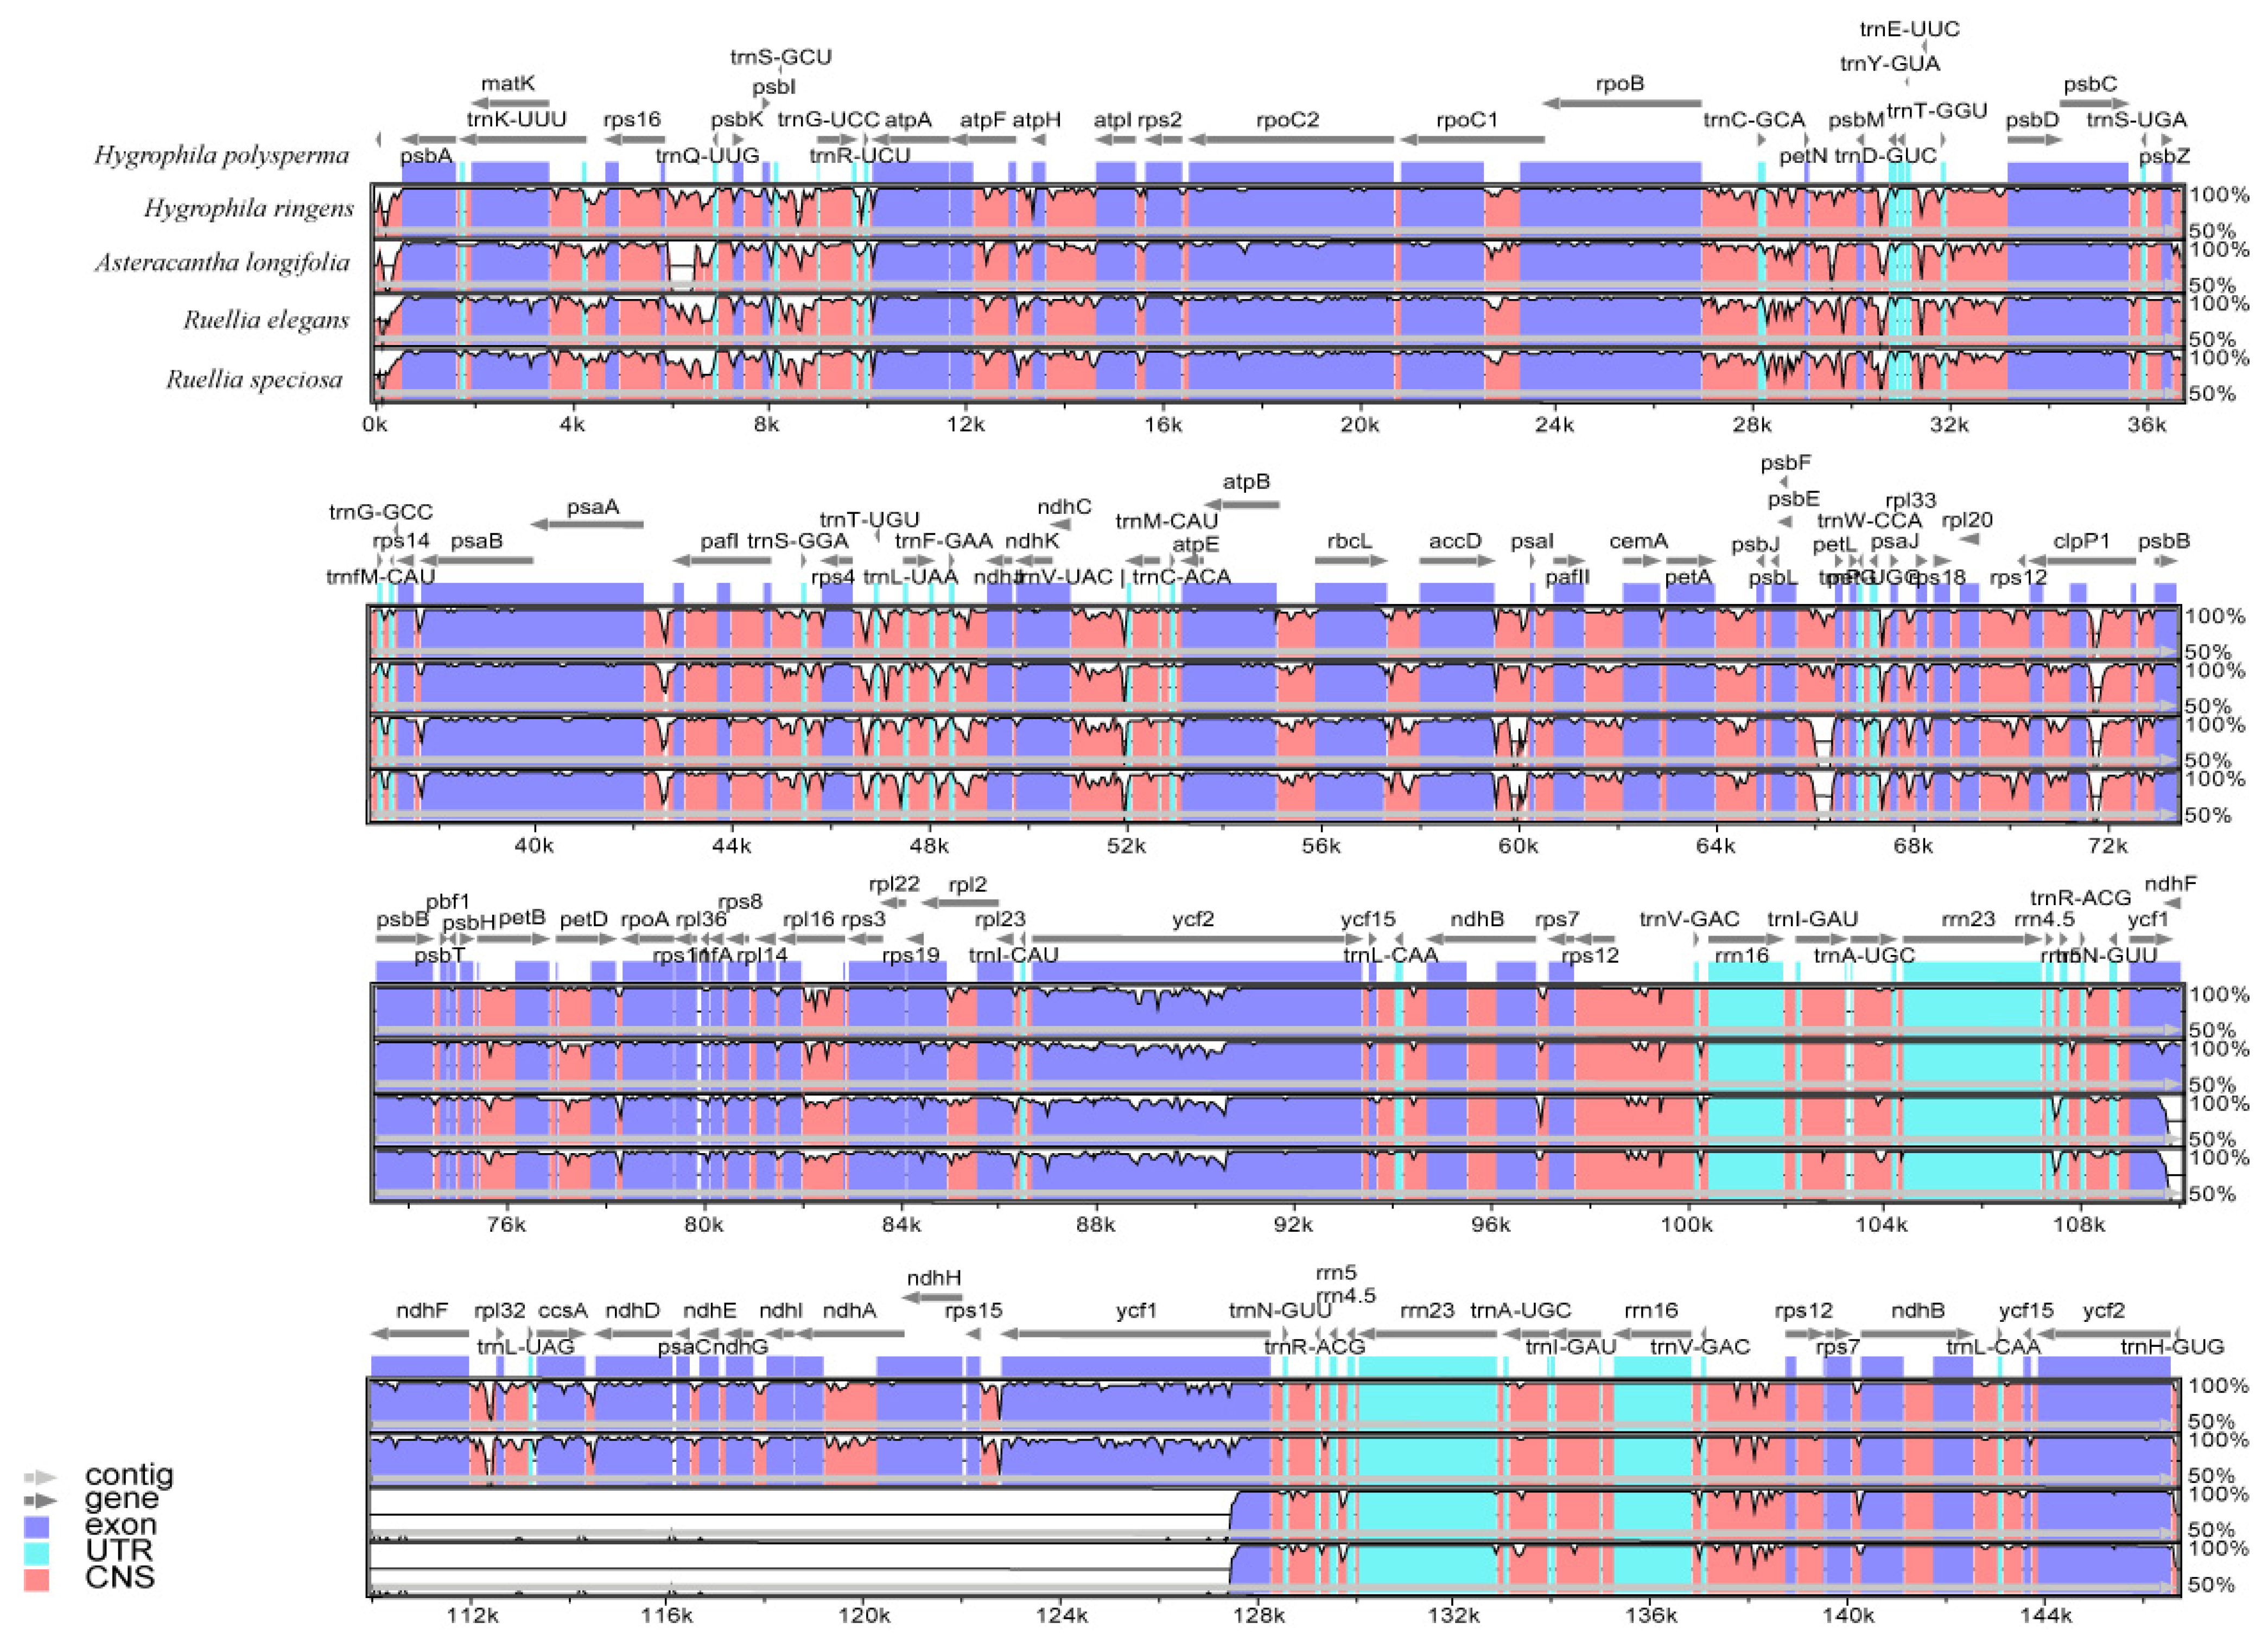
3.7. Comparative Analysis of cp Genome Structure

A comparison among five species was performed through online software mVISTA to visualize the alignment difference with annotation information, as well as to reveal the conservation of the cp genome sequence, as previously carried out with other species [43]. The cp genome was compared with H. polysperma as reference. Based on the result, we found that members from the Ruellia species (R. elegans and R. speciosa) were less divergent between 110,000 and 127,000 bp on the sequences that showed a large missing part due to highly conserved regions for both Hygrophila species and A. longifolia (Figure 6). Apart from that, the conserved non-coding sequences (CNSs) shown in mVISTA exhibited more nucleotide divergence than the coding regions of the sequences. The majority of the coding regions among five species are relatively conservative except ycf1, ndhF, rpl32, trnL-UAG, ccsA, ndhD, psaC, nhdE, ndhG, ndhl, ndhA, ndhH, and rps15, which showed less than 50% similarity compared with both Ruellia species. These results provide detailed information for the development of molecular markers in phylogenetic analysis and plant species identification.

3.8. Nucleotide Diversity (Pi)

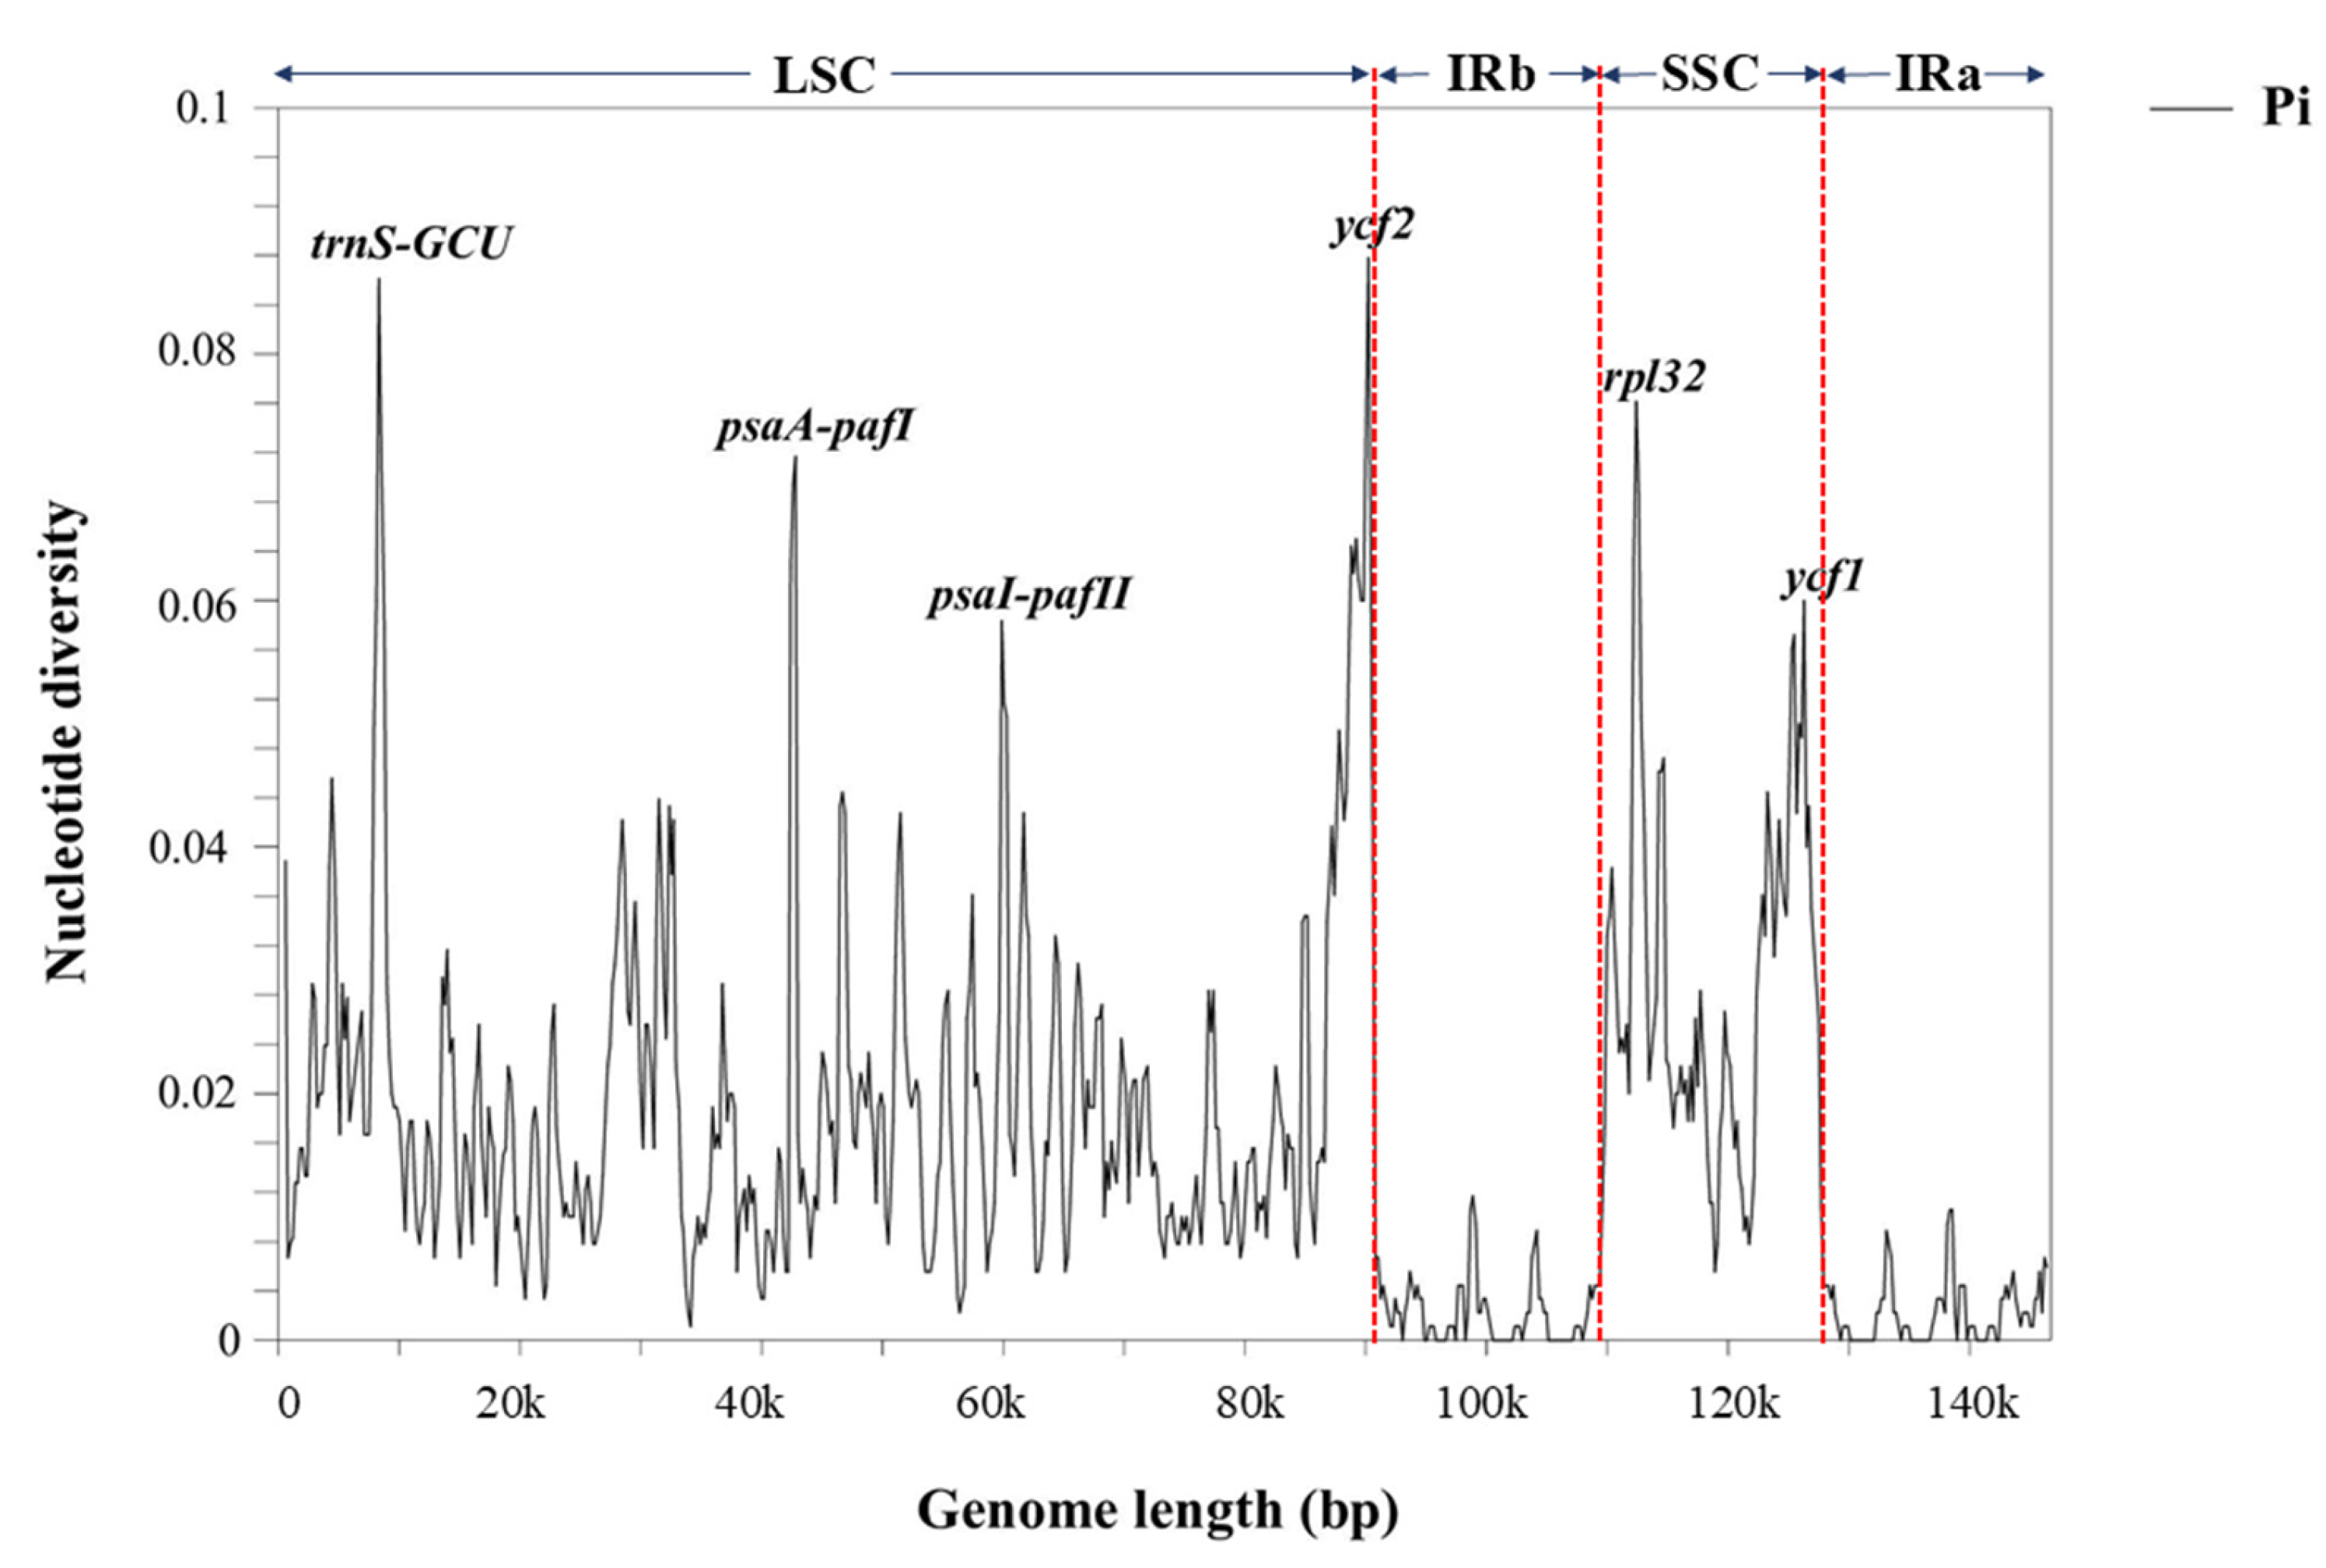
Nucleotide diversity (Pi) analysis was performed by selecting only three cp genomes (H. polysperma, H. ringens, and A. longifolia) since there was a substantial part missing in the SSC regions of Ruellia species when mVISTA alignment was carried out. The Pi values varied from 0 to 0.1 as demonstrated in DnaSP6.12 software analysis with a window length of 600 bp and step size of 200-bp. The result of Pi provides information to identify the most preferable sequence divergence. Six apparent peaks (trns-GCU, psaA-pafI, psaI-pafII, ycf2, rpl32, and ycf1) were observed from the result of the overall cp genome, where the trnS-GCU and ycf2 regions belong to the highest peak (Pi > 0.08) among all regions (Figure 7). There are 4 peaks located in the LSC region (trns-GCU, psaA-pafI, psaI-pafII, ycf2), whereas 2 peaks belong to the SSC region (rpl32 and ycf1). The Pi values of LSC and SSC are significantly higher than those of the IRs due to repeated nucleotides present in the sequence, as the circular structure of the genome occurs in a loop form and IRs are generally more conserved than LSC and SSC regions.

3.9. Phylogenetic Analysis

A phylogenetic tree was constructed with the information obtained from BLAST by selecting a complete cp genome of another 30 species that showed the highest percentage of identical sequences with H. polysperma (Table S1). Through multiple sequence alignment of 66 common CDSs for these 31 species, the phylogenetic relationship and the evolutionary process with H. polysperma were revealed. The phylogenetic tree was constructed through maximum likelihood (ML) analysis with almost all exhibiting 100% bootstrap support.
The constructed phylogenetic tree with the highest log likelihood (−181,279.27) is shown (Figure 8). According to the result, there are 15 cp genomes that belong to the Acanthaceae family, which is the same plant family as that of H. polysperma. Acanthaceae is a plant family that consists of one of the most taxonomically diverse, geographically widespread, morphologically and ecologically variable lineages in angiosperms [45]. Plants of genus Hygrophila are derived from the subtribe of Hygrophilinae within the Ruellieae subfamily of the Acanthaceae family, in which Ruellieae includes 10 different subtribes comprising various genera [9,45,46,47,48].
Another 15 cp genomes belong to another four different plant families (Apocynaceae, Gesneriaceae, Malvaceae, and Rubiaceae). There are 5 genera belonging to the Acanthaceae family (Hygrophila, Echinacanthus, Lepidagathis, Ruellia, and Strobilanthes), 1 genus from Apocynaceae (Wrightia), 3 genera belonging to Gesneriaceae (Oreocharis, Petrocodon, and Primulina), 1 from Malvaceae (Durio), and another 1 genus from Rubiaceae (Gardenia). The closely related species sharing the same branch as H. polysperma is H. ringens with 100% bootstrap support. The subgroup is closely connected to A. longifolia and Echinacanthus attenuates in this analysis. This entire group is sister to Strobilanthes tonkinensis and another four species from the Ruellia genus. The analysis robustly supported the species selected from genera Barleria, Lepidagathis, Echinacanthus, Strobilanthes, Hygrophila, Asteracanthus, Ruellia, Blepharis, and Acanthus forming the clade of the Acanthaceae family with species from genera Blepharis and Acanthus as the first diverged subtribe in this clade. This clade is sister to genera from Rubiaceae and Apocynaceae. Nevertheless, the whole tribe including Acanthaceae, Rubiaceae, and Apocynaceae is sister to the tribe of Gesneriaceae and Malvaceae supported with 100% ML bootstrap.

4. Discussion

While H. polysperma is known to be amphibious, the sequenced individual was grown under terrestrial conditions. The fresh plant sample was collected and initially identified as H. polysperma based on its morphological traits. The sample was then subjected to sequencing. The cp genome sequence showed the highest similarity with a species called Hygrophila sp. (accession number: OQ984266). Later, the psb-trnH intergenic spacer confirmed it as H. polysperma (accession number: KP744280) with 98.2% identity. This is a perfect example of plant species identification based on both morphological traits and cp genome.
Based on the results, the cp genome of H. polysperma demonstrated a typical circular quadripartite structure which is similar to most angiosperm with slightly different sizes when compared within same genus due to the different sizes of IR contraction and expansion, as well as in comparison with other closely related species. Especially, the expansion of trnH genes in the LSC-IR of the Hygrophila sp. cp genome was observed (Figure 5), which is different from those of Asteracantha and Ruellia.
From the general comparison of the cp genome sequence among the same genus, there are no homologs detected for ycf3, ycf4, clpP, and ycf68 genes in the H. polysperma cp genome compared with H. ringens. While homologs were not detected in our analysis, future studies employing more sensitive detection methods or examining potential pseudogenes could clarify whether these represent true gene losses in H. polysperma. The variation in ycf3, ycf4, and ycf68 genes was suggested to indicate the evolutionary adaptation and specialized functions of chloroplast considering the occurrence of evolutionary pressures and ecological niches for the plant species [29]. The lack of detectable sequence similarity to annotated clpP genes but the presence of clpP1 in the H. polysperma cp genome suggest that clpP1 protease as part of the Clp structure may provide the potential to serve as an editing site for this species since the clpP gene was previously found to have one RNA editing site [49].
Repetitive sequences are widely dispersed in the cp genome and play an important role in genetic diversity and evolution [50]. In this report, there are 30 SSRs found in the H. polysperma cp genome (Table 4). Based on the overall result of SSRs and Pi (Table 4 and Figure 7), the psaA-pafI intergenic region located in the LSC region, as well as showing high nucleotide diversity in our Pi analysis, may serve as a reference of DNA molecular markers for species identification. A previous article stated that the ycf1 gene is the second-largest gene in the chloroplast genome, which is crucial for plant viability [43]. It was proposed that the ycf1 gene is the most variable site in the chloroplast genome to serve as a DNA molecular marker of land plants [44], while the ycf1 gene located in the SSC region of the H. polysperma cp genome exhibits high Pi. In addition, the presence of the ndhD gene can also be treated as a genic marker of the high-variation region for plant molecular identification [43]. Thus, the complete chloroplast genome sequence has provided the data for suitable DNA markers and exact species identification.
This study has reconstructed the well-supported phylogenetic relationship of H. polysperma within the Acanthaceae family among species with similar cp genome sequences and sharing the same CDSs (Figure 8). The taxonomic diversity of Acanthaceae gives the result that almost half of the genera from the phylogenetic tree constructed among 31 species are derived from the Acanthaceae family, whereas the remaining 15 species originate from up to four different plant families such as Apocynaceae, Gesneriaceae, Malvaceae, and Rubiaceae. The latest revised classification reported that, overall, there are 10 subtribes classified into Ruellieae, for instance, Erantheminae (5 genera), Dinteracanthinae (1 genus), Ruelliinae (5 genera), Trichantherinae (6 genera), Strobilanthinae (1 genus), Hygrophilinae (2 genera), Petalidiinae (6 genera), Mcdadeinae (1 genus), Phaulopsidinae (1 genus), and Mimulopsidinae (4 genera), and there are 2 genera that belong to Hygrophilinae, Brillantaisia and Hygrophila, due to the nonmonophyletic nature of the genus Hygrophila [9,45]. However, there is an absence of Brillantaisia sp. shown from the result of cp genome sequence similarity, but only H. ringens from the Hygrophila genus. This showed that the phylogenetic relationship of the Hygrophila genus among the Acanthaceae family should undergo multi-factor verification in addition to comparing the cp genomes and morphological traits. There is an interesting phenomenon to note: only 1 species belonged to the same genus as H. polysperma out of 30 species when comparing the cp genome sequence similarity despite there being numerous species in genus Hygrophila, such as H. difformis, which is also an amphibious plant [8]. In contrast, many other Hygrophila species, including H. difformis, exhibit minimal or no identical sequences when compared to H. polysperma. It is likely that the shared similarities between these Hygrophila species give them the unique characteristics.

5. Conclusions

In this study, we assembled the complete cp genome of H. polysperma. The cp genome exhibits the typical quadripartite architecture and is highly conserved; duplicated genes flank the contracted IR boundaries, and the single-copy regions (LSC and SSC) are intact. These features make the genome a robust reference for developing molecular markers to identify H. polysperma and guide its genetic breeding. H. polysperma is most closely related to H. ringens, and together, they form a clade that is sister to A. longifolia, all belonging to the Acanthaceae (subtribe Hygrophilinae) family. However, based on cp genome sequence similarity, Brillantaisia sp. (the other genus in Hygrophilinae) was absent from our analysis, which only identified H. ringens from the Hygrophila genus. Collectively, our results provide the first genomic resource for H. polysperma, expand the available intraspecific variation data, and facilitate future comparative studies.

Supplementary Materials

The following supporting information can be downloaded at https://www.mdpi.com/article/10.3390/horticulturae11101240/s1, Table S1: Data source of species selected in phylogenetic analysis.

Author Contributions

L.-X.C.: contributed to formal analysis, preparation of figures and writing—original draft preparation; Q.H. and Q.F.: resource collection; H.T., Y.L. (Yuping Li), C.P. and Y.D.: species identification, photograph, supervision and validation; Y.L. (Yongqing Li): investigation, conceptualization, writing—review and editing of manuscript. All authors have read and agreed to the published version of the manuscript.

Funding

This research was funded by the Biological Resources Programme, Chinese Academy of Sciences (KFJ-BRP-007-017).

Data Availability Statement

The genbank data of H. polysperma is available at NCBI, accession ID number: PV915200.

Acknowledgments

During the preparation of this manuscript, the authors used Kimi K2 and Deepseek V3.1 for the purposes of language editing. The authors have reviewed and edited the output and take full responsibility for the content of this publication.

Conflicts of Interest

The authors declare no conflicts of interest.

References

  1. Kew Royal Botanic Gardens. Hygrophila polysperma (Roxb.) T. Anderson. Available online: https://powo.science.kew.org/taxon/urn:lsid:ipni.org:names:49756-1#distributions (accessed on 18 April 2023).
  2. NCBI. Hygrophila polysperma (Miramar-Weed). Available online: https://pubchem.ncbi.nlm.nih.gov/taxonomy/Hygrophila-polysperma (accessed on 30 March 2025).
  3. Qiu, X.; Xie, Y. New Records of Acanthaceae to Jiangxi Province. Jiangxi Sci. 2020, 38, 643–644. [Google Scholar]
  4. Mukherjee, A. Prospects for Classical Biological Control of the Aquatic Invasive Weed Hygrophila polysperma (Acanthaceae). Ph.D. Thesis, University of Florida, Gainesville, FL, USA, 2011. [Google Scholar]
  5. Doyle, R.D.; Francis, M.D.; Smart, R.M. Interference competition between Ludwigia repens and Hygrophila polysperma: Two morphologically similar aquatic plant species. Aquat. Bot. 2003, 77, 223–234. [Google Scholar] [CrossRef]
  6. Mukherjee, A.; Williams, D.; Gitzendanner, M.A.; Overholt, W.A.; Cuda, J.P. Microsatellite and chloroplast DNA diversity of the invasive aquatic weed Hygrophila polysperma in native and invasive ranges. Aquat. Bot. 2016, 129, 55–61. [Google Scholar] [CrossRef]
  7. Kew Royal Botanic Gardens. Hygrophila ringens . Available online: https://powo.science.kew.org/taxon/urn:lsid:ipni.org:names:60454721-2 (accessed on 30 March 2025).
  8. Li, G.; Zhao, X.; Yang, J.; Hu, S.; Ponnu, J.; Kimura, S.; Hwang, I.; Torii, K.U.; Hou, H. Water wisteria genome reveals environmental adaptation and heterophylly regulation in amphibious plants. Plant Cell Environ. 2024, 47, 4720–4740. [Google Scholar] [CrossRef] [PubMed]
  9. Tripp, E.; Daniel, T.; Fatimah, S.; McDade, L. Phylogenetic relationships within Ruellieae (Acanthaceae) and a revised classification. Int. J. Plant Sci. 2013, 174, 97–137. [Google Scholar] [CrossRef]
  10. Jiao, H.; Chen, Q.; Xiong, C.; Wang, H.; Ran, K.; Dong, R.; Dong, X.; Guan, Q.; Wei, S. Chloroplast genome profiling and phylogenetic insights of the “Qixiadaxiangshui” pear (Pyrus bretschneideri Rehd.1). Horticulturae 2024, 10, 744. [Google Scholar] [CrossRef]
  11. Langmead, B.; Salzberg, S.L. Fast gapped-read alignment with Bowtie 2. Nat. Methods 2012, 9, 357–359. [Google Scholar] [CrossRef]
  12. Dierckxsens, N.; Mardulyn, P.; Smits, G. NOVOPlasty: De novo assembly of organelle genomes from whole genome data. Nucleic Acids Res. 2017, 45, e18. [Google Scholar] [CrossRef]
  13. Tillich, M.; Lehwark, P.; Pellizzer, T.; Ulbricht-Jones, E.S.; Fischer, A.; Bock, R.; Greiner, S. GeSeq—Versatile and accurate annotation of organelle genomes. Nucleic Acids Res. 2017, 45, W6–W11. [Google Scholar] [CrossRef]
  14. Greiner, S.; Lehwark, P.; Bock, R. OrganellarGenomeDRAW (OGDRAW) Version 1.3.1: Expanded toolkit for the graphical visualization of organellar genomes. Nucleic Acids Res. 2019, 47, W59–W64. [Google Scholar] [CrossRef]
  15. Okonechnikov, K.; Golosova, O.; Fursov, M. Unipro UGENE: A unified bioinformatics toolkit. Bioinformatics 2012, 28, 1166–1167. [Google Scholar] [CrossRef] [PubMed]
  16. Beier, S.; Thiel, T.; Münch, T.; Scholz, U.; Mascher, M. MISA-Web: A web server for microsatellite prediction. Bioinformatics 2017, 33, 2583–2585. [Google Scholar] [CrossRef] [PubMed]
  17. Huang, L.; Yu, H.; Wang, Z.; Xu, W. CPStools: A package for analyzing chloroplast genome sequences. iMetaOmics 2024, 1, e25. [Google Scholar] [CrossRef]
  18. Benson, G. Tandem repeats finder: A program to analyze DNA sequences. Nucleic Acids Res. 1999, 27, 573–580. [Google Scholar] [CrossRef]
  19. Li, H.; Guo, Q.; Xu, L.; Gao, H.; Liu, L.; Zhou, X. CPJSdraw: Analysis and visualization of junction sites of chloroplast genomes. PeerJ 2023, 11, e15326. [Google Scholar] [CrossRef]
  20. Mayor, C.; Brudno, M.; Schwartz, J.R.; Poliakov, A.; Rubin, E.M.; Frazer, K.A.; Pachter, L.S.; Dubchak, I. VISTA: Visualizing global DNA sequence alignments of arbitrary length. Bioinformatics 2000, 16, 1046–1047. [Google Scholar] [CrossRef]
  21. Tamura, K.; Stecher, G.; Kumar, S. MEGA11: Molecular evolutionary genetics analysis version 11. Mol. Biol. Evol. 2021, 38, 3022–3027. [Google Scholar] [CrossRef]
  22. Xue, S.; Shi, T.; Luo, W.; Ni, X.; Iqbal, S.; Ni, Z.; Huang, X.; Yao, D.; Shen, Z.; Gao, Z. Comparative analysis of the complete chloroplast genome among Prunus mume, P. armeniaca, and P. salicina. Hortic. Res. 2019, 6, 89. [Google Scholar] [CrossRef]
  23. Raman, G.; Park, K.T.; Kim, J.-H.; Park, S. Characteristics of the completed chloroplast genome sequence of Xanthium spinosum: Comparative analyses, identification of mutational hotspots and phylogenetic implications. BMC Genom. 2020, 21, 855. [Google Scholar] [CrossRef]
  24. Boudreau, E.; Takahashi, Y.; Lemieux, C.; Turmel, M.; Rochaix, J. The chloroplast ycf3 and ycf4 open reading frames of Chlamydomonas reinhardtii are required for the accumulation of the photosystem I complex. EMBO J. 1997, 16, 6095–6104. [Google Scholar] [CrossRef]
  25. Naver, H.; Boudreau, E.; Rochaix, J.D. Functional studies of ycf3: Its role in assembly of photosystem I and interactions with some of its subunits. Plant Cell 2001, 13, 2731–2745. [Google Scholar] [CrossRef] [PubMed]
  26. Wang, X.; Yang, Z.; Zhang, Y.; Zhou, W.; Zhang, A.; Lu, C. Pentatricopeptide repeat protein PHOTOSYSTEM I BIOGENESIS FACTOR2 is required for splicing of ycf3. J. Integr. Plant Biol. 2020, 62, 1741–1761. [Google Scholar] [CrossRef] [PubMed]
  27. Krech, K.; Ruf, S.; Masduki, F.F.; Thiele, W.; Bednarczyk, D.; Albus, C.A.; Tiller, N.; Hasse, C.; Schöttler, M.A.; Bock, R. The plastid genome-encoded ycf4 protein functions as a nonessential assembly factor for photosystem I in higher plants. Plant Physiol. 2012, 159, 579–591. [Google Scholar] [CrossRef] [PubMed]
  28. Al-Andal, A. Comparative analysis of chloroplast genomes in Commiphora gileadensis from Saudi Arabia and Oman reveal evolutionary genetic divergence. Cogent Food Agric. 2025, 11, 2477796. [Google Scholar] [CrossRef]
  29. Yan, M.; Dong, S.; Gong, Q.; Xu, Q.; Ge, Y. Comparative chloroplast genome analysis of four Polygonatum species insights into DNA barcoding, evolution, and phylogeny. Sci. Rep. 2023, 13, 16495. [Google Scholar] [CrossRef]
  30. Wu, M.; Lan, S.; Cai, B.; Chen, S.; Chen, H.; Zhou, S. The complete chloroplast genome of Guadua angustifolia and comparative analyses of neotropical-paleotropical bamboos. PLoS ONE 2015, 10, e0143792. [Google Scholar] [CrossRef]
  31. Gao, L.-Z.; Liu, Y.-L.; Zhang, D.; Li, W.; Gao, J.; Liu, Y.; Li, K.; Shi, C.; Zhao, Y.; Zhao, Y.-J.; et al. Evolution of Oryza chloroplast genomes promoted adaptation to diverse ecological habitats. Commun. Biol. 2019, 2, 278. [Google Scholar] [CrossRef]
  32. Majeran, W.; Wollman, F.A.; Vallon, O. Evidence for a role of clpP in the degradation of the chloroplast cytochrome b6f complex. Plant Cell 2000, 12, 137–149. [Google Scholar] [CrossRef]
  33. Kuroda, H.; Maliga, P. The plastid clpP1 protease gene is essential for plant development. Nature 2003, 425, 86–89. [Google Scholar] [CrossRef]
  34. Ramundo, S.; Rochaix, J.-D. Chloroplast unfolded protein response, a new plastid stress signaling pathway? Plant Signal. Behav. 2014, 9, e972874. [Google Scholar] [CrossRef]
  35. Shikanai, T.; Shimizu, K.; Ueda, K.; Nishimura, Y.; Kuroiwa, T.; Hashimoto, T. The chloroplast clpP gene, encoding a proteolytic subunit of ATP-dependent protease, is indispensable for chloroplast development in Tobacco. Plant Cell Physiol. 2001, 42, 264–273. [Google Scholar] [CrossRef]
  36. Nishimura, K.; van Wijk, K.J. Organization, function and substrates of the essential Clp protease system in plastids. Biochim. Biophys. Acta BBA Bioenerg. 2015, 1847, 915–930. [Google Scholar] [CrossRef] [PubMed]
  37. Torabi, S.; Umate, P.; Manavski, N.; Plöchinger, M.; Kleinknecht, L.; Bogireddi, H.; Herrmann, R.G.; Wanner, G.; Schröder, W.P.; Meurer, J. psbN is required for assembly of the photosystem II reaction center in Nicotiana tabacum. Plant Cell 2014, 26, 1183–1199. [Google Scholar] [CrossRef] [PubMed]
  38. Plöchinger, M.; Schwenkert, S.; von Sydow, L.; Schröder, W.P.; Meurer, J. Functional update of the auxiliary proteins psbW, psbY, HCF136, psbN, terC and ALB3 in maintenance and assembly of PSII. Front. Plant Sci. 2016, 7, 423. [Google Scholar] [CrossRef] [PubMed]
  39. Lang, Z.; Wills, D.M.; Lemmon, Z.H.; Shannon, L.M.; Bukowski, R.; Wu, Y.; Messing, J.; Doebley, J.F. Defining the role of Prolamin-Box Binding Factor1 gene during maize domestication. J. Hered. 2014, 105, 576–582. [Google Scholar] [CrossRef]
  40. Daniell, H.; Lin, C.-S.; Yu, M.; Chang, W.-J. Chloroplast genomes: Diversity, evolution, and applications in genetic engineering. Genome Biol. 2016, 17, 134. [Google Scholar] [CrossRef]
  41. Yao, X.; Ye, Q.; Kang, M.; Huang, H. Microsatellite analysis reveals interpopulation differentiation and gene flow in the endangered tree Changiostyrax dolichocarpa (Styracaceae) with fragmented distribution in central China. New Phytol. 2007, 176, 472–480. [Google Scholar] [CrossRef]
  42. Yao, H.; Xu, Y.; Lan, Y.; Xiang, D.; Jiao, P.; Xu, H.; Qiao, D.; Cao, Y. Codon usage bias analysis in the chloroplast genomes of diatoms within the family Thalassiosiraceae and Skeletonemataceae. Plant Mol. Biol. Rep. 2025. [Google Scholar] [CrossRef]
  43. Huang, Y.; Li, J.; Yang, Z.; An, W.; Xie, C.; Liu, S.; Zheng, X. Comprehensive analysis of complete chloroplast genome and phylogenetic aspects of ten Ficus species. BMC Plant Biol. 2022, 22, 253. [Google Scholar] [CrossRef]
  44. Dong, W.; Xu, C.; Li, C.; Sun, J.; Zuo, Y.; Shi, S.; Cheng, T.; Guo, J.; Zhou, S. ycf1, the most promising plastid DNA barcode of land plants. Sci. Rep. 2015, 5, 8348. [Google Scholar] [CrossRef]
  45. Manzitto-Tripp, E.A.; Darbyshire, I.; Daniel, T.F.; Kiel, C.A.; McDade, L.A. Revised classification of Acanthaceae and worldwide dichotomous keys. TAXON 2022, 71, 103–153. [Google Scholar] [CrossRef]
  46. Wood, J.R.I. Nees, Arnott and some forgotten Acanthaceae types from Asia. Edinb. J. Bot. 1994, 51, 103–115. [Google Scholar] [CrossRef]
  47. McDade, L.; Moody, M. Phylogenetic relationships among Acanthaceae: Evidence from noncoding trnL-trnF chloroplast DNA sequences. Am. J. Bot. 1999, 86, 70–80. [Google Scholar] [CrossRef]
  48. McDade, L.; Daniel, T.; Masta, S.; Riley, K. Phylogenetic relationships within the tribe Justicieae (Acanthaceae): Evidence from molecular sequences, morphology, and cytology. Ann. Mo. Bot. Gard. 2000, 87, 435. [Google Scholar] [CrossRef]
  49. Zhang, J.; Liu, H.; Xu, W.; Wan, X.; Zhu, K. Comparative analysis of chloroplast genome of Lonicera japonica cv. Damaohua. Open Life Sci. 2024, 19, 20220984. [Google Scholar] [CrossRef]
  50. Shukla, N.; Kuntal, H.; Shanker, A.; Sharma, S.N. Mining and analysis of simple sequence repeats in the chloroplast genomes of genus Vigna. Biotechnol. Res. Innov. 2018, 2, 9–18. [Google Scholar] [CrossRef]
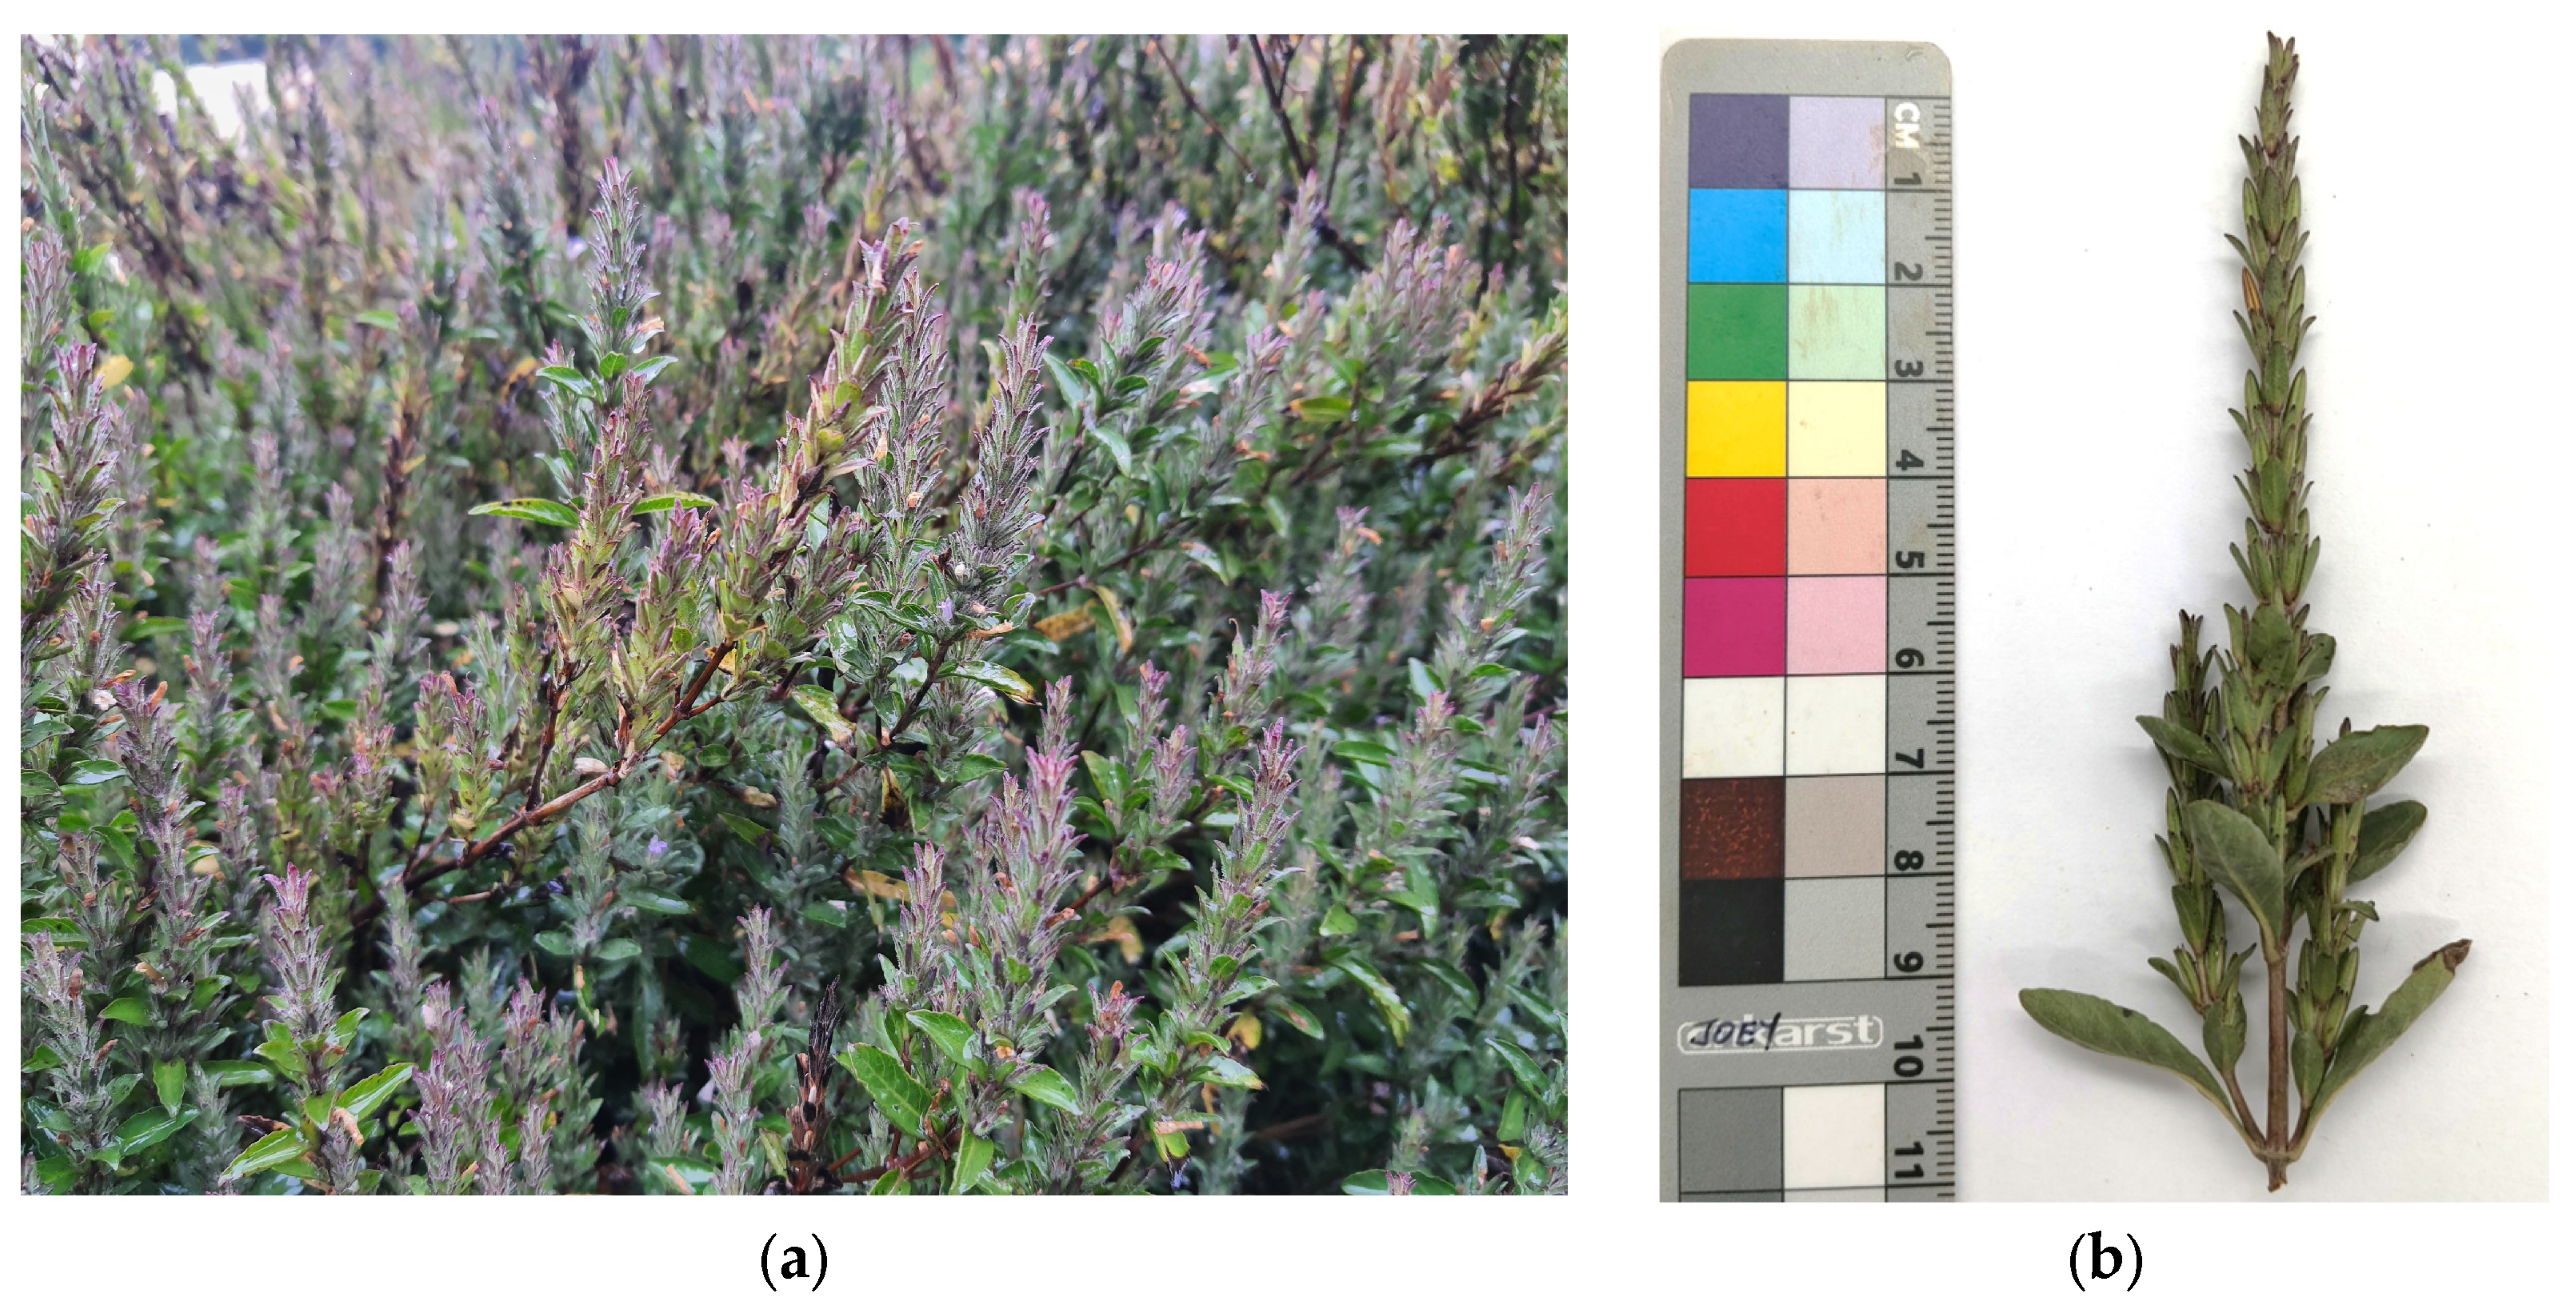
Figure 1. Morphological characteristics of H. polysperma. (a) The phenotype of terrestrial H. polysperma; (b) morphological characteristics of seed capsules.
Horticulturae 11 01240 g001
Figure 2. Chloroplast genome of H. polysperma. Genes with introns are marked with asterisks (*).
Horticulturae 11 01240 g002
Figure 3. GC content and gene distribution of each region of the H. polysperma cp genome. The yellow region refers to the LSC region, the blue regions refer to IRs, and the green region refers to the SSC region. The coloured arrows represent the gene distribution in the cp genome.
Horticulturae 11 01240 g003
Figure 4. Relative Synonymous Codon Usage (RSCU) analysis for 20 amino acids and termination codons (Ter) among five species of cp genomes. Codon contents for CDSs of H. polysperma, H. ringens, A. longifolia, R. elegans, and R. speciosa arranged from left to right corresponding to each column in the bar graph. Each amino acid is represented by codons in the boxes below the bar graph, with box colour corresponding to the respective column.
Horticulturae 11 01240 g004
Figure 5. Comparison of LSC, SSR, and IR boundaries of H. polysperma cp genomes and four different species. The LSC, SSC, and IRs are represented with different colours. JLB, JSB, JSA, and JLA represent the connective sites between respective regions of the genome sequence. Gene names are displayed in boxes.
Horticulturae 11 01240 g005
Figure 6. Comparative genome analysis among five species through mVISTA diagram. Light grey arrows and dark grey arrows above the alignments represent genes with their orientation and distribution. Exons are shown in purple, UTR represents 5′- and 3′-untranslated regions (turquoise rectangle), CNS represents a conserved non-coding sequence (red), the size of the sequences is shown on the x-axes, and the percent identities (50–100%) are shown on the y-axes.
Horticulturae 11 01240 g006
Figure 7. Comparative analysis of the nucleotide availability via Pi values of H. polysperma, H. ringens, and A. longifolia presented in a sliding window (window length: 600 bp; step size: 200 bp). The X-axis denotes the midpoint of each window; the Y-axis denotes the nucleotide diversity in each window. LSC represents large single copy; SSC represents small single copy; IR represents inverted-repeat.
Horticulturae 11 01240 g007
Figure 8. The phylogenetic relationship of H. polysperma with another 30 species based on cp genome similarity. The phylogenetic tree was constructed with common protein coding genes among 31 species using the ML method, with bootstrap values displayed at each branch node. H. polysperma is highlighted in red.
Horticulturae 11 01240 g008
Table 1. Summary of cp genome features of H. polysperma.
Genome FeaturesH. polysperma
Genome size (bp)146,675
LSC size (bp)90,570
SSC size (bp)17,699
IR size (bp)19,203
GC content (%)38.3
No. of genes130
No. of PCGs86
No. of tRNA36
No. of rRNA8
Notes: LSC represents large single copy; SSC represents small single copy; IR represents inverted-repeat; GC represents guanine-cytosine; PCG represents protein coding gene.
Table 2. List of genes annotated in cp genomes of H. polysperma.
CategoryGene GroupGene NameQuantity
PhotosynthesisSubunits of photosystem IpsaB, psaA, psaI, psaJ, psaC5
Subunits of photosystem IIpsbA, psbK, psbI, psbM, psbD, psbC, psbZ, psbJ, psbL, psbF, psbE, psbB, psbT, psbH14
Subunits of cytochrome b/f complexpetN, petA, petL, petG, petB, petD6
NADH dehydrogenase subunitndhJ, ndhK, ndhC, ndhB (×2), ndhD, ndhF, ndhE, ndhG, ndhI, ndhA, ndhH12
Subunits of ATP synthaseatpA, atpF, atpH, atpI, atpE, atpB6
Large subunits of rubiscorbcL1
Self-replicationProteins of large ribosomal subunitrpl33, rpl20, rpl36, rpl14, rpl16, rpl22, rpl2, rpl23, rpl329
Proteins of small ribosomal subunitrps12 (×2), rps16, rps2, rps14, rps4, rps18, rps11, rps8, rps3, rps19, rps7 (×2), rps1514
Subunits of RNA polymerase rpoC2, rpoC1, rpoB, rpoA4
Ribosomal RNAsrrn16 (×2), rrn23 (×2), rrn4.5 (×2), rrn5 (×2)8
Transfer RNAstrnH-GUG, trnK-UUU, trnQ-UUG, trnS-GCU, trnG-UCC, trnR-UCU, trnC-GCA, trnD-GUC, trnY-GUA, trnE-UUC, trnT-GGU, trnS-UGA, trnG-GCC, trnfM-CAU, trnS-GGA, trnT-UGU, trnL-UAA, trnF-GAA, trnV-UAC | trnC-ACA, trnM-CAU, trnW-CCA, trnP-UGG, trnI-CAU, trnL-CAA (×2), trnV-GAC (×2), trnI-GAU (×2), trnA-UGC (×2), trnR-ACG (×2), trnN-GUU (×2), trnL-UAG37
Other genesMaturasematK1
ProteaseclpP11
Acetyl-CoA carboxylaseaccD1
c-type cytochrome synthesis geneccsA1
Translation initiation factorinfA1
Envelope membrane carbon uptake proteincemA
OtherpafI, pafII, pbf13
Genes of unknown functionConserved hypothetical chloroplast ORFycf1 (×2), ycf2 (×2), ycf15 (×2)6
Notes: Genes marked with the sign (×2) refer to duplicated genes.
Table 3. Summary of nucleotide concentration in each region of the H. polysperma cp genome.
RegionLength (bp)A (%)T (%)C (%)G (%)GC (%)
LSC90,57031.332.218.717.736.4
SSC17,69933.833.517.115.532.7
IRa19,20327.827.021.423.845.2
IRb19,20327.027.823.821.445.2
Total genome146,67530.631.119.518.838.3
CDS74,49330.231.417.920.538.4
Notes: LSC represents large single copy; SSC represents small single copy; IR represents inverted-repeat; CDS represents coding sequence.
Table 4. Type of repeat sequences in H. polysperma cp genome.
No.TypeQuantityStartEndLocLoc Type
1TA646314642trnK-UUU_1-rps16_2IGS
2C1546514665trnK-UUU_1-rps16_2IGS
3A1161526162rps16_1-trnQ-UUGIGS
4TA670397050trnQ-UUG-psbKIGS
5A1212,28312,294atpF_2-atpF_1Intron
6T1012,37512,384atpF_2-atpF_1Intron
7T1113,08213,092atpF_1-atpHIGS
8A1016,36016,369rps2-rpoC2IGS
9TCAA429,27929,294petN-psbMIGS
10T1030,45730,466psbM-trnD-GUCIGS
11T1235,74935,760psbC-trnS-UGAIGS
12A1136,52936,539psbZ-trnG-GCCIGS
13A1036,99837,007trnG-GCC-trnfM-CAUIGS
14TA642,63742,648psaA-pafI_3IGS
15A1144,61444,624pafI_2-pafI_1Intron
16T1170,95070,960clpP1_3-clpP1_2Intron
17A1571,09971,113clpP1_3-clpP1_2Intron
18A1171,58771,597clpP1_2-clpP1_1Intron
19A1177,19777,207petD_1-petD_2Intron
20T1078,56378,572rpoAGene
21A1781,50081,516rpl14-rpl16_2IGS
22T1186,72486,734ycf2Gene
23A1086,89886,907ycf2Gene
24T1187,24887,258ycf2Gene
25G11103,922103,932trnA-UGC_1-trnA-UGC_2Intron
26T10112,269112,278ndhF-rpl32IGS
27T11124,973124,983ycf1Gene
28T11125,270125,280ycf1Gene
29T10125,571125,580ycf1Gene
30C11133,314133,324trnA-UGC_2-trnA-UGC_1Intron
Notes: IGS represents intergenic sequences.
Disclaimer/Publisher’s Note: The statements, opinions and data contained in all publications are solely those of the individual author(s) and contributor(s) and not of MDPI and/or the editor(s). MDPI and/or the editor(s) disclaim responsibility for any injury to people or property resulting from any ideas, methods, instructions or products referred to in the content.