Article

Development of Fruit-Specific Spectral Indices and Endmember-Based Analysis for Apple Cultivar Classification Using Hyperspectral Imaging

1
Digital Breeding Convergence Division, National Institute of Agricultural Science, Rural Development Administration, Jeonju 54874, Republic of Korea
2
Supercomputing Center, National Institute of Agricultural Science, Rural Development Administration, Jeonju 54874, Republic of Korea
3
Department of Biological Sciences, Chungnam National University, Daejeon 34134, Republic of Korea
*
Author to whom correspondence should be addressed.
Horticulturae 2025, 11(10), 1177; https://doi.org/10.3390/horticulturae11101177
Submission received: 7 August 2025 / Revised: 22 September 2025 / Accepted: 25 September 2025 / Published: 2 October 2025
(This article belongs to the Section Fruit Production Systems)

Abstract

Hyperspectral imaging (HSI) has emerged as a powerful tool for non-destructive phenotyping, yet fruit crop applications remain underexplored. We propose a methodological framework to enhance the spectral characterization of apple fruits by identifying robust vegetation indices (VIs) and interpretable endmembers. We screened 284 Vis, which were evaluated using four feature selection algorithms (Boruta, MI+Lasso, RFE, and ensemble voting), generalizing across red, yellow, green, and purple apple cultivars. An ensemble criterion (≥2 algorithms) yielded 50 selected VIs from the NDSI/DSI/RSI families, preserving > 95% classification accuracy and capturing cultivar-specific variation. Pigment-sensitive wavelength bands were identified via PLS-DA VIP scores and one-vs-rest ANOVA. Using these bands, we formulated a new normalized-difference, ratio, and difference spectral indices tailored to cultivar-specific pigmentation. Several indices achieved >89% classification accuracy and showed patterns consistent with those of anthocyanin, carotenoid, and chlorophyll. A two-stage spectral unmixing pipeline (K-Means → N-FINDR) achieved the lowest reconstruction RMSE (0.043%). This multi-level strategy provides a scalable, interpretable framework for enhancing phenotypic resolution in apple hyperspectral data, contributing to fruit index development and generalized spectral analysis methods for horticultural applications.

1. Introduction

Apples (Malus domestica Borkh.) are among the most economically important and widely consumed fruit crops worldwide. Their value arises from high nutritional content, postharvest storability, and diverse organoleptic qualities. Rich in dietary fiber, vitamins, and polyphenols, apples are known for their health-promoting effects, including antioxidant, anti-inflammatory, and cardiovascular benefits [1]. The global production of apples continues to grow in response to increasing consumer demand for high-quality fruits with appealing skin color, firm texture, and desirable flavor profiles. Consumer acceptance studies have shown that visual characteristics, particularly skin color and the absence of visible defects, play a decisive role in purchasing decisions [2].
As the fruit industry moves toward data-driven and precision agriculture systems, the need for reliable, non-destructive, and high-throughput methods for evaluating fruit quality is becoming more urgent. In this context, hyperspectral imaging (HSI) has emerged as a powerful tool that combines conventional imaging with spectroscopy to collect both spatial and spectral information from plant organs [3,4]. HSI has proven effective for assessing diverse crop traits, such as moisture content, chlorophyll concentration, surface defects, firmness, and sugar levels, thereby offering insights beyond human visual perception [5,6,7]. Additionally, compared with machine vision (RGB) and multispectral systems, HSI provides continuous spectral information. While RGB and multispectral modalities are cost- and speed-efficient for deployment, their limited bands may under-sample red-edge/anthocyanin signals and do not natively support spectral unmixing. We mitigate HSI’s known burdens—calibration/BRDF sensitivity and data volume—and provide selected VIs that can guide leaner multispectral designs. In plant phenotyping, hyperspectral imaging is extensively used for monitoring canopy traits, photosynthetic activity, and nutrient status in leaves [8]. Despite these advances, the application of HSI in fruit phenotyping remains comparatively underexplored. Most prior studies in fruit focus on individual traits, such as ripeness or sugar content, and often employ vegetation indices (VIs) originally developed for canopy or foliage analysis [9,10]. However, leaf-derived indices such as the Normalized Difference Vagetation Index (NDVI) and Photochemical Reflectance Index (PRI)—effective in planar, diffuse leaf tissues—behave inconsistently on fruit surfaces because glossy, waxed peel and spherical curvature introduce specular glare and Bidirectional Reflectance Distribution Function (BRDF)-driven view dependence, the skin–flesh layered structure causes subsurface scattering and mixed spectra, and mosaic pigmentation (anthocyanins, carotenoids, chlorophyll) shifts/overlaps absorption features across cultivars [5,11,12,13,14]. Consequently, traditional VIs can saturate or become unstable on fruits, motivating fruit-specific indices that reflect the optical and structural attributes of peel tissues. Accordingly, we adopt a fruit-focused analytical framework: we screen 284 candidate vegetation indices to derive a consensus set of selected VIs, identify pigment-aware wavelength bands using PLS-DA VIP scores and one-vs-rest ANOVA, and apply spectral unmixing to account for peel heterogeneity across five cultivars.
Several recent studies have attempted to design indices adapted to fruit traits. However, most efforts remain focused on individual parameters, lacking a systematic evaluation of the applicability and performance of existing VIs in fruit. Moreover, very few studies have applied advanced spectral decomposition techniques to fruit spectra. One promising approach is spectral unmixing, which decomposes hyperspectral reflectance signals into constituent components or ‘endmembers’ that represent distinct biochemical or structural features. The recently developed SUnSeT (Spectral Unmixing for Seed Trait phenotyping) algorithm has shown success in extracting endmembers from seed hyperspectral data, enabling the quantification of trait-relevant spectral abundance maps [15]. Applying such approaches to fruit holds potential for improving trait discrimination and defect detection.
In this study, we propose a multi-pronged approach to enhance the analytical capabilities of hyperspectral imaging for apple fruit phenotyping. Specifically, we (1) evaluate 284 published vegetation indices to identify those most applicable to apple fruits using principal component analysis (PCA) and feature filtering; (2) formulate new pigment-sensitive indices based on statistically discriminative bands derived from ANOVA across cultivars; and (3) apply a spectral unmixing workflow adapted from the SUnSeT model to extract fruit-specific endmembers and compute abundance maps. These methods are tested on five apple cultivars with distinct skin pigmentation to assess their effectiveness in cultivar discrimination and detection of surface-related quality traits. By integrating index selection and unmixing, this study introduces spectral tools that are computationally robust and specifically adapted to the optical properties of apple fruits. These contributions provide a scalable framework for cultivar discrimination and surface-related quality assessment in horticultural applications.

2. Materials and Methods

2.1. Plant Materials and Hyperspectral Imaging

A total of 75 apples from five cultivars—Hongro (HR), Fuji (FJ), Hwangok (HO), Enbu (EB), and Summer King (SK)—were collected for this study. The fruits displayed diverse pericarp colors, ranging from red with yellow stripes (HR, FJ) to magenta (EB), yellow (HO), and green (SK). These five cultivars were selected to capture a broad span of peel phenotypes and surface morphologies commonly encountered in apple fruit, thereby enabling rigorous assessment of cross-phenotype generalization in vegetation-index screening and validation. The Sampling prioritized diversity in external appearance (e.g., hue variation, patterning, and albedo) while avoiding redundant phenotypes, so that variance in the spectral domain would reflect genuine biological differences rather than sampling artifacts. Samples were stored at 4 °C and acclimated to room temperature (25 °C) for 4 h before imaging. Hyperspectral acquisition used a push-broom (line-scan) system (MV.Scan Package, Headwall Photonics; Micro-E/VNIR-E, Bolton, MA, USA). The sensor covered 400–1000 nm with 369 spectral bands at ~1.63 nm spectral sampling (16-bit radiometry) and an across-track spatial dimension of 1600 px (maximum frame rate 250 Hz, manufacturer specifications). Illumination was provided by quartz–tungsten–halogen lamps (Newport, Irvine, CA, USA). Radiometric calibration employed a 99% white Teflon reference and dark frames with a capped lens; all acquisitions used identical settings for Top and Side views. Data were captured and inspected using Headwall Starter Kit (VNIR-E, version 3.1.5.1; Headwall, Photonics, Bolton, MA, USA) and Rotary (VNIR-E, version 3.1.5.1; Headwall, Photonics, Bolton, MA, USA) applications together with the HSI viewer (version 3.1.5.1; Headwall, Photonics, Bolton, MA, USA) on a Windows 10 Pro workstation (Microsoft Corp., Redmond, WA, USA) equipped with an Intel® Core™ i7-9700K 3.60 GHz CPU and Intel UHD Graphics 630 (Intel Corp., Santa Clara, CA, USA), and a 1 TB 860 PRO SSD (Samsung Electronics Co., Ltd., Suwon, Republic of Korea).

2.2. Calibration and ROI Extraction

The white calibration was acquired a white Teflon board with the spectral reflectance of about 99%. The dark calibration was obtained by turn-off the halogen lamp and covering carmera lens with the cap. All raw hyperspectral images ( I r a w ) were calibrated by the white ( I w h i r e ) and dark ( I d a r k ) images according to following equation:
I c a l = I r a w I d a r k I w h i t e I d a r k
An improvement in the acquisition of apple fruit region of interest (ROI) from hyperspectral images was achieved, addressing the interference caused by shading areas. By identifying specific wavelength bands with distinct differences between fruit and shading regions, we adjusted new formula (A/B ratio) in python spectral library (Figure S1).

2.3. Feature Selection and Spectral Discrimination Workflow for Hyperspectral Apple Data

Hyperspectral reflectance data were collected from five apple cultivars exhibiting distinct skin colors. From these spectral measurements, a total of 284 vegetation indices (VIs)—originally developed for leaf-level physiological analysis—were calculated across the visible to near-infrared range (400–1000 nm). Each apple sample was annotated with its corresponding cultivar label for supervised classification. Prior to analysis, all VI values were standardized using z-score normalization.
To identify the most informative vegetation indices for cultivar discrimination, three feature selection methods were independently applied: Boruta [16], Mutual Information (MI) with Lasso regression [17], and Recursive Feature Elimination (RFE). Boruta uses a wrapper-based Random Forest approach that compares real features with permuted shadow variables to identify all relevant predictors. The MI+Lasso method first calculates mutual information scores to assess dependency between each VI and the cultivar label, and then applies L1-regularized logistic regression to select a sparse subset of predictive indices. RFE iteratively eliminates the least important features, using Random Forests as the estimator, until a predefined number of features is retained. An ensemble selection approach was implemented to improve stability and consensus in feature selection. Features chosen by at least two of the three individual methods were retained in the final set. This voting-based approach reduces the influence of any one method’s selection bias while maintaining consistency across strategies [18].
To evaluate classification performance, the selected feature sets from each method were used to train Random Forest classifiers with a 70:30 stratified train–test split. Performance metrics included overall accuracy, macro-average F1 score, and weighted-average F1 score. Principal Component Analysis (PCA) was conducted using the selected features to assess the separability of apple cultivars in reduced dimensions. Additionally, a heatmap was generated using the ensemble-selected features, with hierarchical clustering applied to the feature axis and cultivar ordering preserved on the sample axis. Confusion matrices were constructed for each method to assess classification agreement and identify potential misclassifications.

2.4. Spectral Differentiation of Five Apple Cultivars

Hyperspectral reflectance data were collected from the peel surfaces of apple fruits representing five distinct cultivars (coded EB, FJ, HO, HR, and SK), each exhibiting characteristic peel colors such as red, yellow, green, or purple. Spectral images were acquired using a VNIR (visible–near-infrared) hyperspectral camera with a spectral range spanning 400 to 1000 nm. Preprocessing was performed using standard normal variate (SNV) transformation [19] to minimize variability due to scattering and lighting conditions. To identify common discriminative wavelengths across all cultivars, a partial least squares discriminant analysis (PLS-DA) model was trained on the full dataset [20]. Variable Importance in Projection (VIP) scores were computed and ranked [21], and the top 10 most informative wavelengths were selected with a constraint that no two selected wavelengths were within 30 nm of each other. Additionally, the range below 450 nm was excluded to avoid sensor instability and spectral noise known to affect the blue region of VNIR. Using the selected 10 wavelengths, spectral indices were constructed through all possible two-band combinations, generating three index types for each pair: the normalized difference spectral index (NDSI), the ratio spectral index (RSI), and the difference spectral index (DSI) [22]. Each index was evaluated via five-fold cross-validation using a linear support vector machine (SVM), and classification accuracy was used to rank the performance of the indices.

2.5. Cultivar-Specific Optimal Index Selection

To further extract cultivar-specific features, a one-vs-rest strategy was employed for each cultivar. For every target cultivar, ANOVA-based F-value analysis was performed to compare the spectral responses of that cultivar versus the others [23]. The top 5 wavelengths with the highest F-values were selected with a 30 nm separation rule and used to form pairwise combinations, resulting in 10 wavelength pairs. For each pair, the three aforementioned index types (NDSI, RSI, DSI) were computed. This process yielded 30 candidate indices per cultivar, which were each assessed for their ability to distinguish the target cultivar using SVM classification. The index with the highest classification accuracy was selected as the optimal index for that cultivar. All index accuracies were recorded to facilitate evaluation of overall distribution and index type effectiveness.

2.6. Spectral Unmixing for Identifying Apple Fruit Specific Endmembers

Hyperspectral images, compatible with the ENVI-compatible file format (pairs of *.raw and *.hdr files), were collected and preprocessed from seed plates of varieties HR, FJ, HO, EB, and SK. To enhance measurement precision, the first and last 5% of spectral channels were omitted, yielding an effective wavelength window of approximately 426–970 nm. Raw reflectance spectra were then smoothed via a Savitzky–Golay filter (polynomial order = 2, window length = 13) [24]. The filter output spectrum y j at position j is represented by:
y j = i = m m c i · y j + i
where c i are filter coefficients, m is half the window length, and y j + i represents original spectra points at neighboring positions.
Subsequently, spectra were normalized by vector normalization [25]:
y n o r m = y y 2
Differential spectra were computed as first-order derivatives to further enhance spectral feature differentiation [19]:
y j = y j + 1 y j
Spectral endmembers were extracted using a combination of K-Means clustering, Pixel Purity Index (PPI), and Vertex Component Analysis (VCA). These algorithms were first applied individually to the preprocessed spectra of each cultivar, resulting in a set of initial endmembers, Global endmembers (GEMs) were subsequently extracted by applying K-Means, PPI, VCA, and N-FINDR algorithms on the combined initial endmembers. These global endmembers were evaluated by reconstructing spectral data and calculating the Root Mean Squared Error (RMSE) [26], defined by the following equation:
R M S E = 1 n i = 1 n ( X i X ^ i ) 2
where X i is the observed spectrum, X ^ i is the spectrum reconstructed from selected GEMs, and n is the number of pixels analyzed. The GEMs combination exhibiting the lowest RMSE was selected for subsequent analyses. Pixels within ROIs were assigned to extracted GEMs based on cosine distance metrics [27], defined by:
d c o s A , B = 1 A · B A B
where A and B are spectral vectors. Extracted global endmember spectra and their spatial distributions were visualized, facilitating comparative analyses across different extraction algorithms. Subsequently, imperfect fruits (surface blemishes) were selected from cultivars FJ, HO and SK. The same preprocessing pipeline described above was applied, after which the final GEM set was projected onto these samples to generate abundance maps and abundance values for each GEM [15].

3. Results

3.1. Extraction of Spectral Reflectance Data from Apple Fruits

To ensure precise retrieval of hyperspectral reflectance from apple fruit surfaces, a region of interest (ROI)-based segmentation strategy was implemented. A total of 75 fruits, representing five cultivars (15 fruits per cultivar), were imaged from both the top and side orientations, yielding 150 hyperspectral images for subsequent analysis. Initial segmentation attempts using conventional vegetation-sensitive wavelengths (e.g., 550 nm) resulted in erroneous inclusion of shaded regions due to variable illumination conditions. To address this issue, spectral profiles were systematically compared across the upper, middle, lower, and shaded regions of fruit surfaces, as well as background areas. This comparative analysis identified 711 nm and 474 nm as the most diagnostically divergent wavelengths between fruit tissue and shadowed areas.
A segmentation formula based on the ratio of reflectance at 711 nm to 474 nm (A/B ratio) was constructed to enhance ROI discrimination (Figure S1). A threshold value of ≥1.2 was applied to this ratio, facilitating robust and reproducible detection of fruit surfaces. This approach enabled consistent ROI extraction that ensures exclusion of non-fruit pixels, including background and shaded regions, thereby improving the accuracy of subsequent spectral analyses. After establishing the fruit ROI extraction procedure, the apple fruit analysis was conducted as illustrated in Figure 1A.

3.2. Identification of Robust Vegetation Indices Reflecting Pigment Diversity in Apple Cultivars

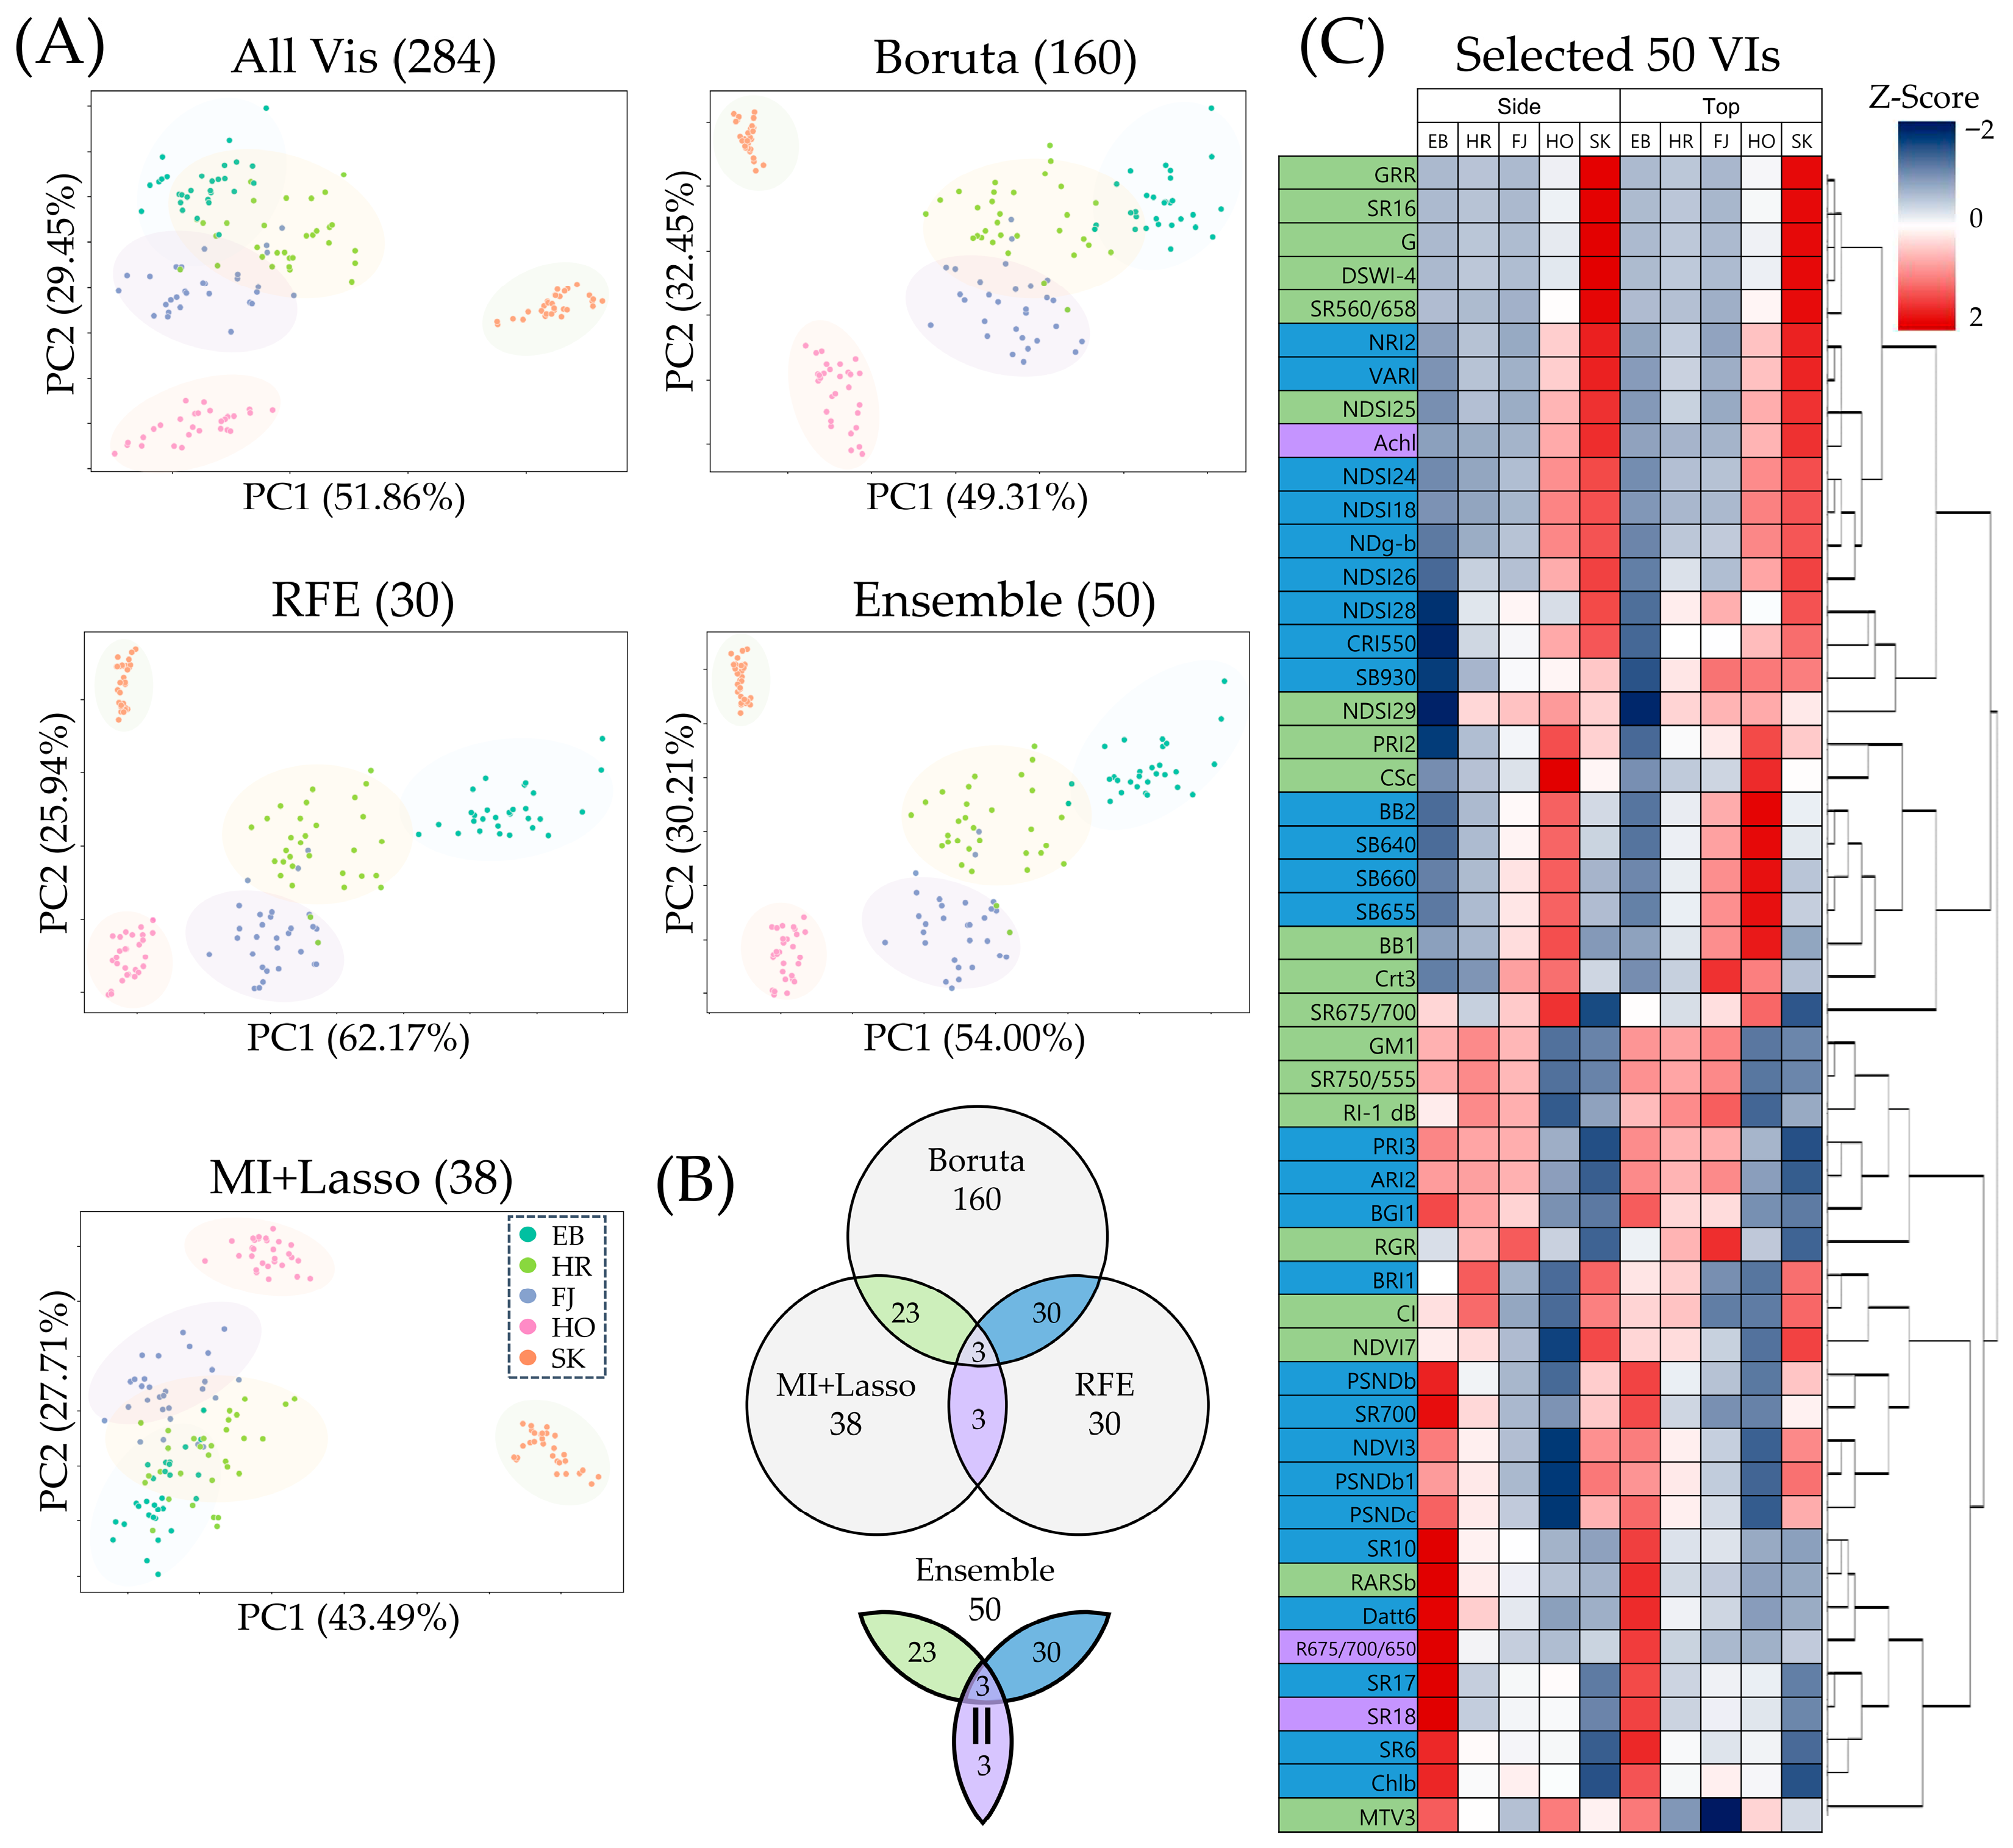
To establish a subset of VIs with consistent diagnostic relevance across apple cultivars exhibiting distinct skin pigmentation, we evaluated four representative feature selection algorithms—Boruta, Mutual Information with Lasso (MI+Lasso), Recursive Feature Elimination (RFE), and an ensemble voting scheme—using a curated library of 284 VIs sourced from the Index Database (IDB: https://www.indexdatabase.de/, accessed on 15 March 2025), which includes both published and publicly released indices (Table S1). Unlike prior studies that focused on classification accuracy as an endpoint, the primary objective of this analysis was to identify a minimal yet in-formative set of VIs that are broadly applicable across apples with red, yellow, green, and purple skin colors. To that end, five cultivars (HR, FJ, EB, HO, SK) were selected to encompass a wide phenotypic spectrum in terms of skin pigmentation. The number of selected indices varied substantially across methods, ranging from 30 (RFE) to 160 (Boruta). Despite this variation in feature dimensionality, all reduced sets achieved classification accuracies above 95%, indicating that the discriminatory capacity of hyperspectral VIs is retained even with substantial feature reduction (Table 1). Notably, MI+Lasso identified only 38 indices yet achieved an accuracy of 97.78%, equivalent to the full VI set. However, in this context, classification performance is interpreted not as a cultivar differentiation objective but as validation that selected indices retain spectral information relevant across diverse pigment compositions, supporting their robustness for generalized applications.
PCA performed on the selected features illustrated the capacity of each method to preserve phenotypic variance in a reduced spectral space (Figure 2A). The RFE and ensemble methods produced well-separated clusters in PC1–PC2 plots, capturing cumulative variances of 88.11% and 84.21%, respectively. These results indicate that these methods effectively summarize cultivar-specific spectral patterns using compact feature sets. In contrast, MI+Lasso explained 71.20% of cumulative variance, reflecting its prioritization of minimal redundancy rather than total variance coverage (81.31%). To enhance interpretability and mitigate method-specific bias, a consensus feature set was generated by retaining indices selected by at least two algorithms. This ensemble approach yielded 50 VIs that integrate diverse spectral cues, offering a pragmatic balance between dimensionality reduction and phenotypic coverage (Figure 2B). Feature overlap analysis indicated that Boruta and MI+Lasso shared 23 common indices, Boruta and RFE shared 30, and MI+Lasso and RFE shared only 3, with only three indices selected by all three base algorithms, highlighting the potential advantage of ensemble-based selection in enhancing the generalizability and robustness of index identification across diverse spectral profiles. The physiological validity of ensemble-selected indices was examined via hierarchical clustering heatmaps constructed using z-score standardized reflectance values from both top and side views. Clear, cultivar-consistent spectral patterns were observed—particularly for cultivars with pronounced pigmentation such as EB (purple) and SK (green)—suggesting that many of the selected indices are sensitive to anthocyanin and chlorophyll-related variation (Figure 2C). Importantly, these patterns were not restricted to individual cultivars but were consistently represented across diverse phenotypes, indicating that the ensemble-selected indices capture pigment-related spectral variation in a cultivar-specific manner (Figure S2).
Collectively, these findings demonstrate that it is feasible to identify a concise and interpretable set of vegetation indices from existing literature that can be reliably applied across genetically and visually diverse apple cultivars. Rather than focusing exclusively on cultivar discrimination, this approach emphasizes cross-cultivar applicability, which is important for extending the utility of hyperspectral imaging in fruit classification, postharvest evaluation, and quality monitoring. The inclusion of cultivars with divergent pigmentation was critical in validating the robustness of the selected indices, ensuring that the derived spectral features are not narrowly tuned to a specific skin type but remain broadly applicable across commercial apple varieties.

3.3. Development of Cultivar-Specific Spectral Indices Based on Pigment-Associated Bands in Apples

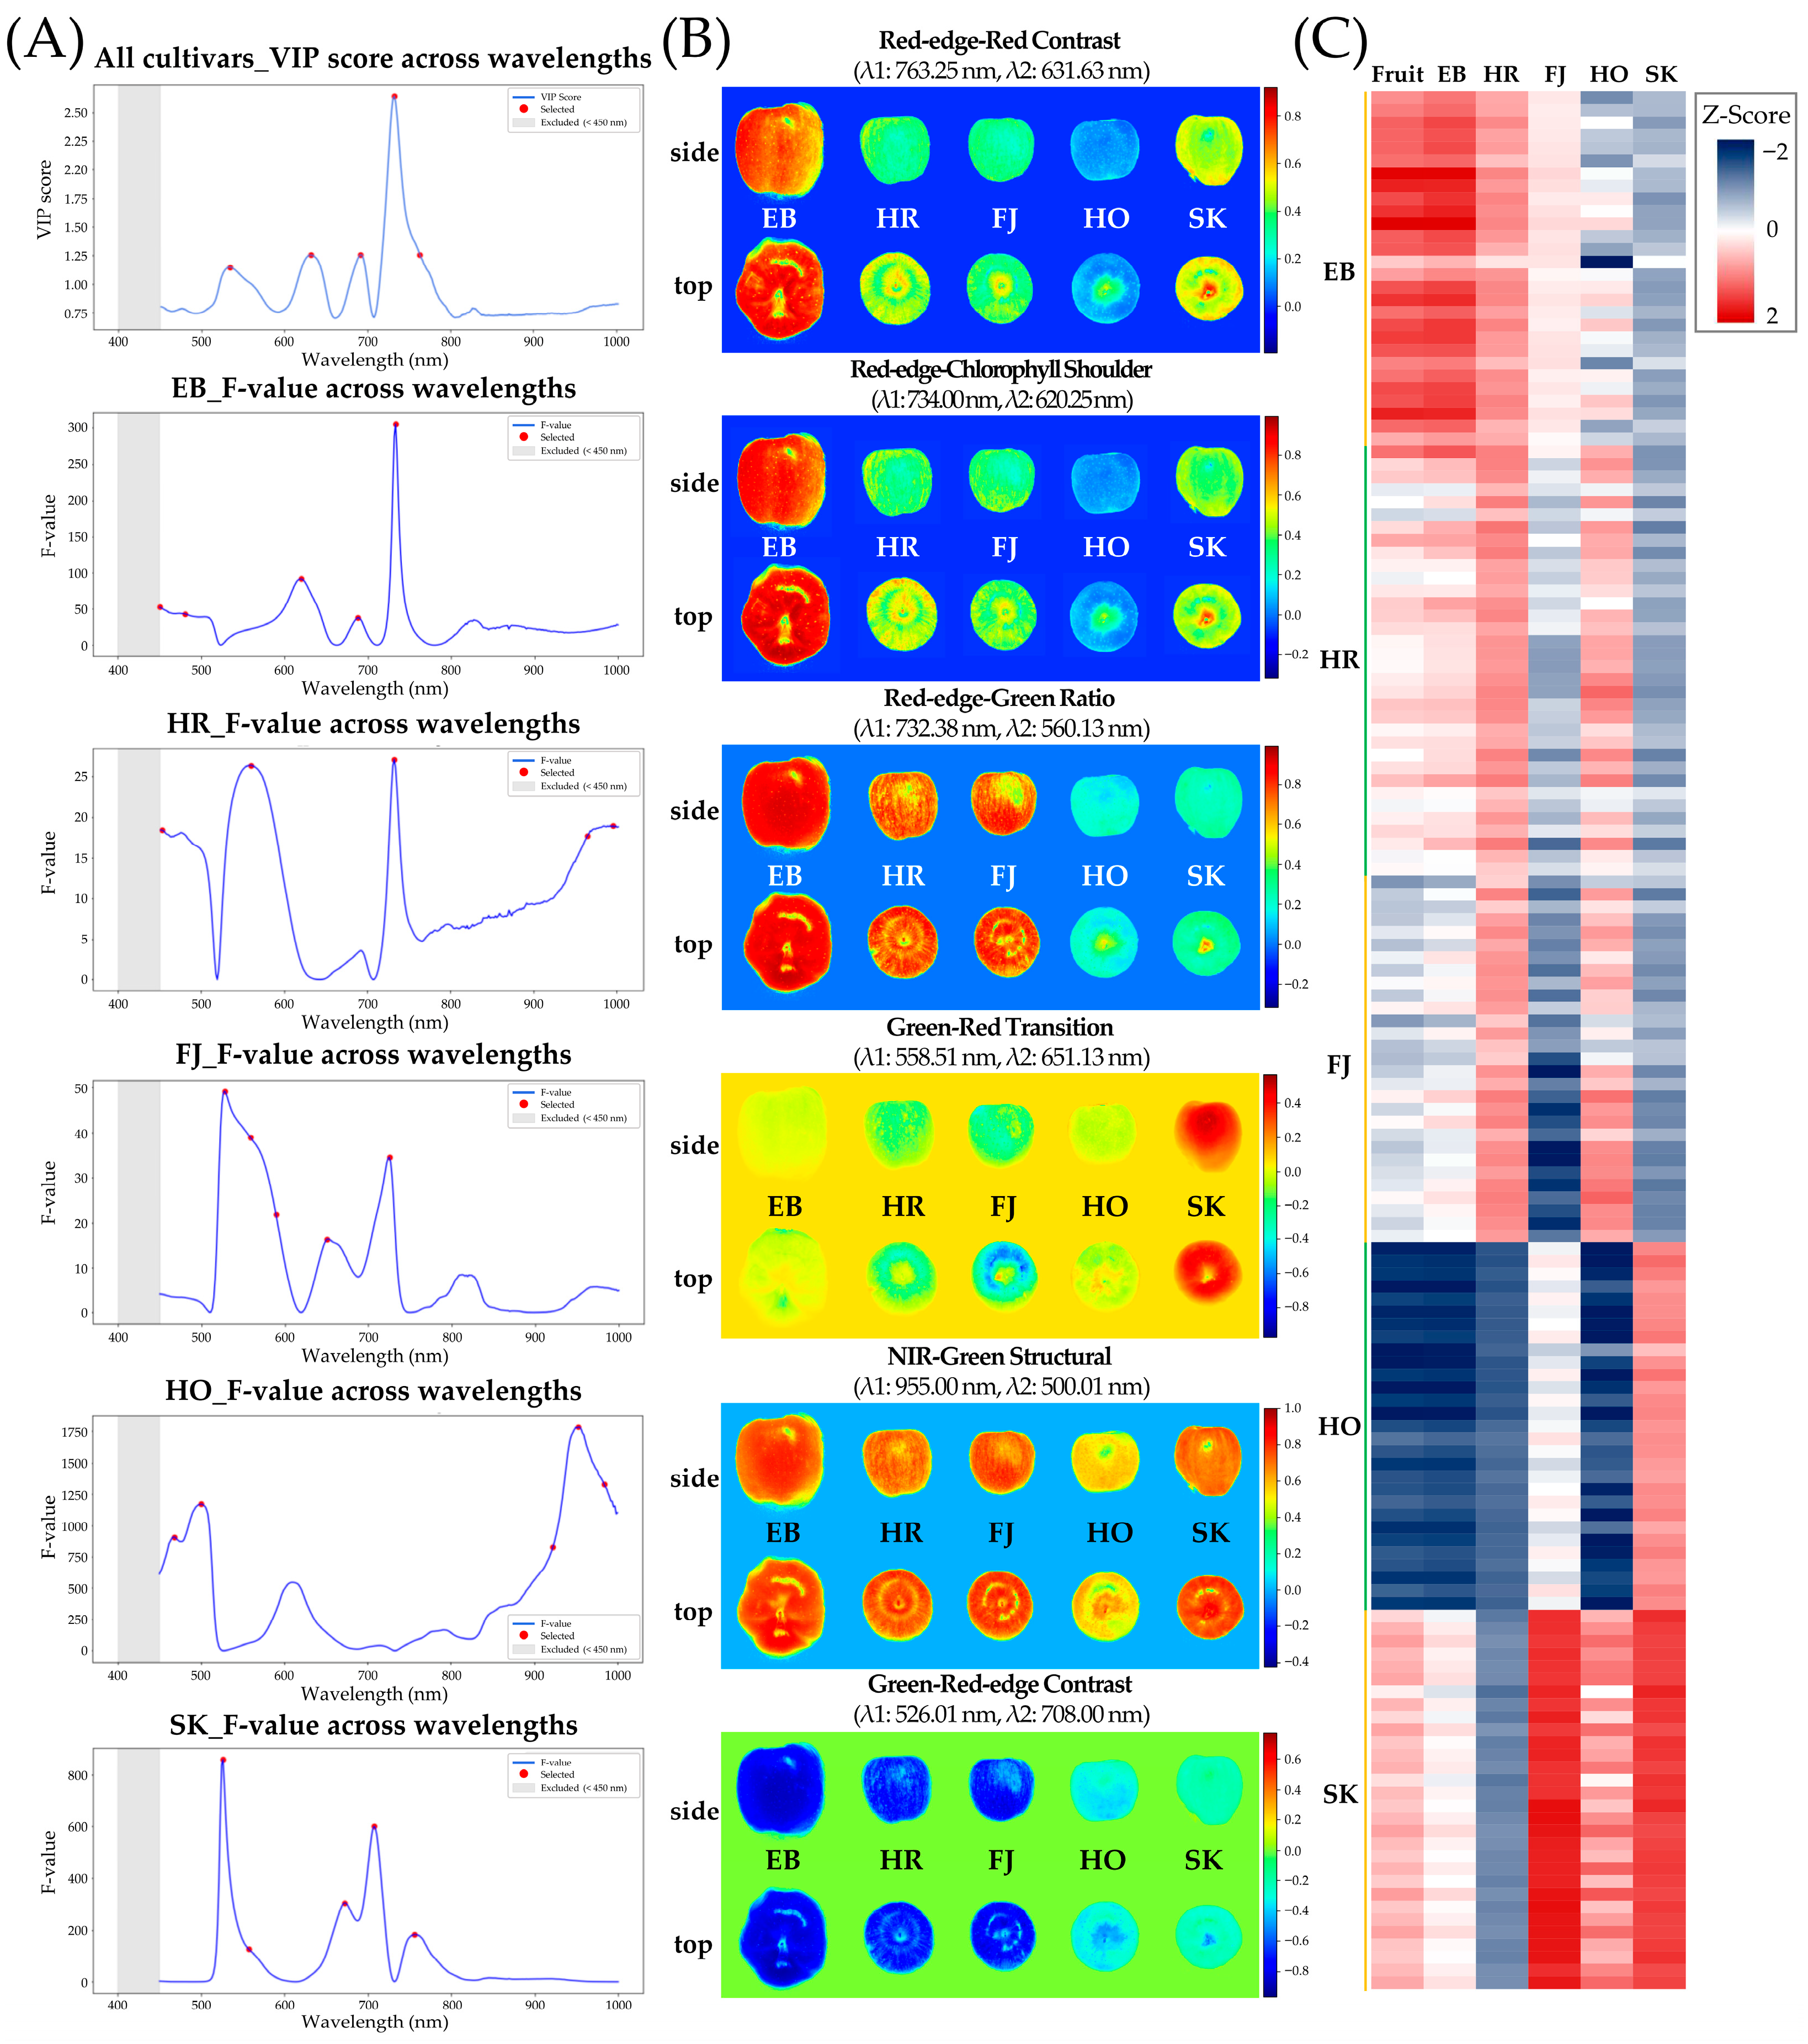
To develop spectral indices specifically suited for the analysis of apple fruit skins, pigment-sensitive wavelengths were identified using two complementary statistical ap-proaches: Variable Importance in Projection (VIP) scores derived from Partial Least Squares Discriminant Analysis (PLS-DA), and one-vs-rest analysis of variance (ANOVA). Both methods focused on wavelengths above 450 nm to exclude the high-noise region present in the short-wavelength range. The VIP-based analysis yielded an initial set of 15 candidate bands. Applying a threshold of VIP score ≥ 1 and enforcing a minimum 30 nm interval to reduce redundancy, five non-overlapping bands were selected. These bands, located between 534.13 nm and 763.25 nm, coincide with regions commonly associated strongly associated with anthocyanin and chlorophyll absorption, which are key determinants of skin pigmentation in apple fruits (Table 2, Figure 3A). In parallel, the ANOVA-based strategy identified cultivar-discriminative bands by calculating F-values for each wavelength using a one-vs-rest framework. The top five bands per cultivar were selected under the same 30 nm spacing constraint, yielding a set of bands with distinctive spectral specificity for each cultivar (Figure 3A). Analysis of the F-value distributions revealed that EB exhibited a peak at 734.00 nm, closely aligning with the highest VIP score region. Red-skinned cultivars HR and FJ shared common high-response regions in the 527.63–560.13 nm and 725.88–732.38 nm intervals. HO showed its strongest response above 900 nm, while SK exhibited cultivar-specific peaks near 500 nm, despite partially overlapping with FJ. These findings illustrate the spectral diversity present across apple cultivars and justify the need for cultivar-informed index development.
All possible pairwise combinations of the five VIP-derived bands were used to con-struct 30 indices across three formulations: Normalized Difference Spectral Index (NDSI), Ratio Spectral Index (RSI), and Difference Spectral Index (DSI). Linear support vector ma-chine (SVM) classification was conducted for each index. Among the top 10 indices ranked by accuracy, five were NDSIs, four were DSIs, and one was an RSI. Notably, the top two indices—all NDSIs—achieved 81%, 89% accuracy, respectively, with two of them (763.25–631.63 nm) and (631.63–534.13 nm) involving bands with high VIP scores, further supporting the selection approach. Similarly, 150 indices were constructed using cultivar-specific bands derived from ANOVA (30 per cultivar). For each cultivar, the highest classification accuracy was achieved using distinct wavelength combinations: 734.00–620.25 nm for EB, 732.38–560.13 nm for HR, 558.51–651.13 nm for FJ, 955.00–500.01 nm for HO, and 526.01–708.00 nm for SK. These cultivar-specific combinations exhibited strong classification performance and hold potential as spectral markers for identifying cultivar identity or associated traits. Finally, z-score normalized heatmaps of selected indices (Figure 3C) revealed consistent index patterns corresponding to fruit skin pigmentation. Indices derived from both VIP and ANOVA approaches showed elevated values in EB (purple), HO (yellow), and SK (green), suggesting that the selected indices effectively capture differences in anthocyanin, carotenoid and chlorophyll concentrations. These results demonstrate the potential of carefully selected band combinations to enhance spectral index design for apple fruit analysis and support accurate cultivar discrimination (Table 2 and Table S2).

3.4. Spectral Unmixing and Endmember Mapping Across Cultivars

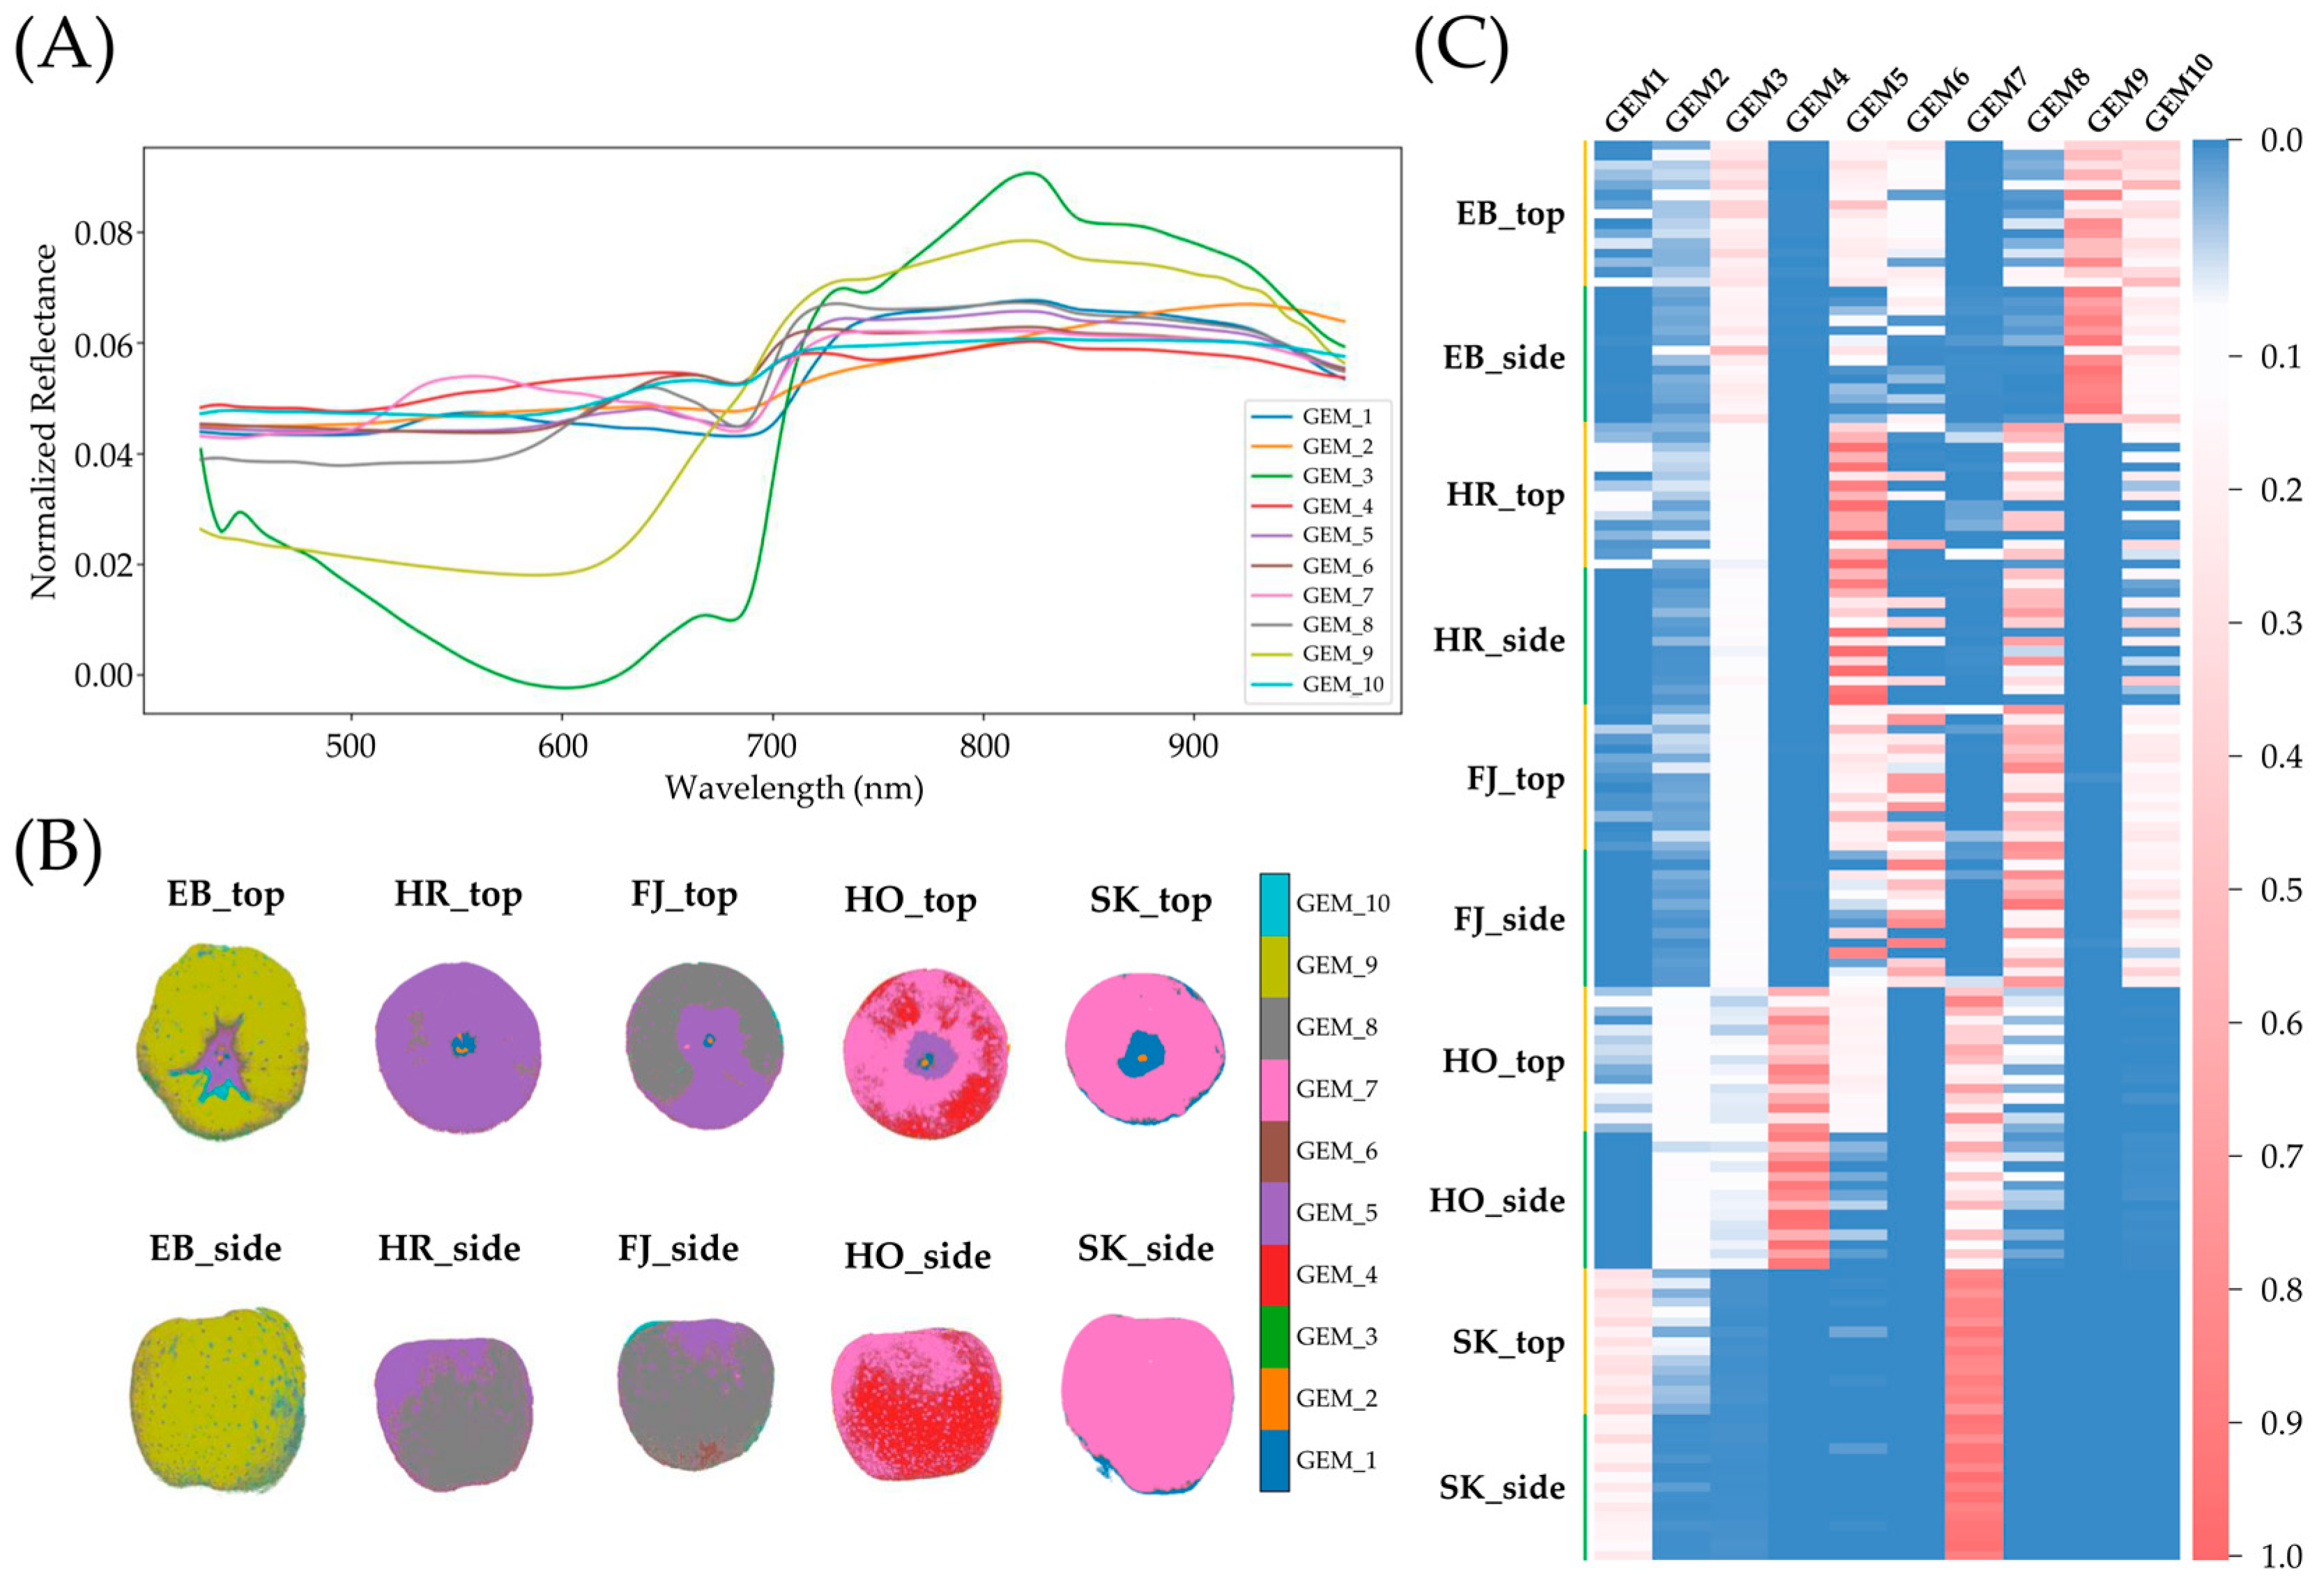
To decompose the spectral complexity of apple fruit surfaces, a global endmember (GEM) extraction pipeline was implemented. This involved a two-stage process: (1) cultivar-specific candidate endmember extraction using K-Means, Pixel Purity Index (PPI), and Vertex Component Analysis (VCA); and (2) global integration using multiple algorithms (K-Means, PPI, VCA, NFINDR) applied to the pooled candidates. The combination of K-Means (stage I) and NFINDR (stage II) yielded the lowest reconstruction error (RMSE = 0.043%) across all ROI pixel spectra, outperforming other configurations (e.g., VCA-VCA, RMSE = 0.056%) (Table S3). The final GEM set consisted of 10 spectrally distinct endmembers spanning the 426–970 nm range (Figure 4A, Table S4). When projected onto the ROIs of each fruit, the GEMs produced pixel-level abundance maps that captured cultivar-specific spectral patterns and surface heterogeneity (Figure 4B,C and Figure S2, Table S5). For example, EB showed dominant contributions from GEM 3, 9, and 10, while SK was primarily represented by GEM 1 and 7. HR and FJ exhibited substantial overlap in their dominant GEMs 5, 6, and 8, consistent with classification confusion noted earlier. Spatial abundance analysis also revealed differences between top-view and side-view images, particularly in HO and SK, reflecting directional variability in surface reflectance. These findings confirm the potential of spectral unmixing to reveal subtle, spatially resolved differences in fruit surface characteristics.

4. Discussion

HSI has been widely adopted in crop research for species such as wheat, rice, and soybean, serving to estimate important physiological traits including chlorophyll concentration, water status, and developmental stage. These assessments often rely on canopy-level reflectance captured through leaf-based hyperspectral analysis conducted under controlled or field conditions [33,34]. In particular, predictive models built using vegetation indices like PRI, Red Edge Position, and modified NDVI have achieved reliable performance in characterizing leaf greenness and physiological stress [33]. By contrast, HSI applications targeting fruit crops—especially apples—remain narrowly focused. Most studies have concentrated on detecting surface bruising or estimating soluble solids content [35,36], rather than capturing broader phenotypic or biochemical traits of fruit tissues.
VIs offer a streamlined means to derive meaningful metrics from hyperspectral data. Although indices targeting non-chlorophyll pigments—such as ARI for anthocyanins or CRI for carotenoids—have been proposed, their empirical validation in fruit tissues is scarce [37]. These limitations are rooted in fundamental structural and biochemical differences between leaves and fruit, including heterogeneous pigment layers and wax coatings that alter light scattering and reflectance in ways not addressed by traditional indices [38].
To overcome these challenges, this study adopted a comprehensive approach. First, a broad suite of 284 existing vegetation indices was screened using feature selection techniques to identify those most coincided with apple skin spectral responses. Second, new pigment-sensitive indices were formulated by selecting discriminative wavelength pairs identified via PLS-DA and ANOVA. Lastly, spectral unmixing methods were applied to deconstruct pixel-level reflectance into spatially explicit endmembers that reflect the biochemical and structural heterogeneity of fruit surfaces. These steps aim to establish indices that remain both interpretable and applicable across diverse apple cultivars, facilitating more robust organ-specific HSI analysis for fruit phenotyping.

4.1. Ensemble-Based Selection of Vegetation Indices for Apple Fruits

To identify diagnostically stable VIs applicable to diverse apple cultivars, we employed four complementary feature selection strategies—Boruta, MI+Lasso, RFE, and an ensemble consensus method. Each algorithm emphasizes different aspects of spectral information, leading to variation in the number and type of selected features. Boruta and RFE, both tree-based methods, tend to preserve features capturing nonlinear dependencies, often resulting in larger index sets that maintain high classification accuracy [16,23]. In practical terms, Boruta is robust against overfitting but can be computationally intensive for large datasets, whereas RFE provides relatively efficient feature reduction but remains sensitive to initial model configuration. Conversely, MI+Lasso prioritizes sparsity and linear discriminability, yielding a minimal subset of 38 indices that nonetheless matched the full VI set’s accuracy of 97.78%. This indicates that MI+Lasso is highly efficient, although it may be biased toward features with strong individual predictive power and less capable of capturing nonlinear spectral interactions [39]. While individual feature selection algorithms offer distinct advantages, each may capture different aspects of spectral variability depending on their underlying assumptions. To ensure broader coverage of biologically relevant indices and reduce method-specific bias, we employed an ensemble strategy that retained VIs selected by at least two out of the three primary methods. This ensemble approach enhances stability and generalizability, though it introduces additional computational complexity and requires careful parameter tuning. The ensemble strategy resulted in a curated set of 50 indices that preserved high classification performance (>95%) while offering improved interpretability and applicability across cultivars. Principal component analysis based on these indices revealed robust clustering patterns across cultivars, with ensemble- and RFE-based projections explaining over 84% of total variance. Furthermore, hierarchical clustering heatmaps constructed from the ensemble-selected VIs exhibited consistent pigment-associated spectral trends across both top and side views, particularly in cultivars with high anthocyanin or chlorophyll content such as EB and SK. To further clarify the differences in classification accuracy between cultivars, we also provide confusion matrices in Figure S3, which show that performance remained comparable across feature selection methods, with no cultivar disproportionately misclassified. This consistency suggests that the discriminative indices identified are inherently stable and not strongly dependent on a specific algorithm.
Notably, the limited overlap among the indices selected by different algorithms—only three indices were common to all three methods—highlights the complementary nature of the selection approaches and justifies the ensemble methodology. Prior studies have suggested that ensemble feature selection can stabilize model performance and improve biological relevance in omics and plant imaging datasets [18,40]. In the context of hyperspectral analysis, this is particularly valuable when aiming for application across heterogeneous fruit surfaces. By ensuring that the final indices capture spectral cues reflective of pigment composition and surface structure, our ensemble-derived set provides a robust analytical foundation for generalized fruit classification and cultivar-agnostic quality monitoring.

4.2. Development of Pigment-Sensitive Spectral Indices Through Dual Statistical Band Selection

To address the limitations of existing vegetation indices in capturing pigment-related variation on fruit surfaces, the present study implemented a dual statistical framework to identify wavelengths informative for apple skin reflectance. Specifically, we used VIP scores from PLS-DA and F-values from one-vs-rest ANOVA to extract pigment-sensitive bands above 450 nm—thereby avoiding the short-wavelength region often associated with sensor noise [41]. Each method targeted different spectral properties: VIP identified global importance in multivariate class separation, while ANOVA highlighted cultivar-specific discriminatory power. The final sets consisted of five non-redundant VIP-based bands and 25 cultivar-specific bands (five per cultivar), selected using a 30 nm spacing threshold to reduce collinearity. These wavelength regions aligned with known anthocyanin, chlorophyll, and carotenoid absorption features, consistent with previous findings on pigment characterization. While we recognize that employing both cross-cultivar and cultivar-specific indices could initially appear conceptually inconsistent, these approaches were deliberately chosen as complementary. The cross-cultivar (fruit-specific) indices establish a broadly applicable baseline that captures spectral domains consistently relevant across diverse pigmentation patterns, whereas the cultivar-specific indices reveal distinctive wavelength responses unique to each variety. Notably, overlap between the cross-cultivar and Red-edge-Chlorophyll Shoulder selections indicates that global discriminant bands can coincide with particular cultivar traits, while other cultivars exhibited clearly different spectral signatures. Taken together, this dual perspective provides richer spectral information: it balances broad applicability with the capacity to highlight cultivar-level uniqueness, thereby offering a more comprehensive framework for apple analysis [42]. The constructed indices—using three common formulations (NDSI, RSI, DSI)—demonstrated strong classification accuracy. In particular, two VIP-derived NDSIs achieved 81% and 89% accuracy, confirming that bands identified through multivariate VIP selection possess significant diagnostic utility. Similarly, 150 ANOVA-based indices (30 per cultivar) yielded high cultivar-specific classification rates, with unique band pairings emerging for each cultivar. This cultivar-dependent variability highlights the spectral heterogeneity inherent in apple skin phenotypes and supports the need for phenotype-informed index development. Previous studies have shown that anthocyanin and chlorophyll exhibit distinct reflectance features across wavelengths above 500 nm, particularly in red and green cultivars [30,43]. In Table 2, each newly developed spectral index is accompanied by a descriptive name, methodological origin, and its putative linkage to pigment absorption or optical domains. For example, the Red-edge–Chlorophyll Shoulder Index (734:620 nm) combines a red-edge band with a chlorophyll absorption shoulder, consistent with previously reported spectral features in pigmented apple skins. Similarly, indices involving green wavelengths (e.g., 526–560 nm) align with anthocyanin-sensitive domains reported in previous study [30], while near-infrared bands (>700 nm) capture structural scattering and red-edge effects. Although direct biochemical validation of pigment content was not performed in this study, these associations provide a mechanistic rationale grounded in established plant photobiology. Our findings extend this knowledge by demonstrating that such features can be effectively captured through statistically guided wavelength selection, enabling index construction that reflects underlying biochemical composition.
Importantly, the heatmap analysis revealed that both VIP- and ANOVA-based indices maintained consistent spectral patterns across cultivars, with elevated values observed in purple (EB), yellow (HO), and green (SK) apples. These results suggest that the selected indices are not only statistically robust but also spectrally interpretable, capturing chromatic variation associated with skin pigmentation. Unlike prior studies that primarily rely on raw reflectance or full-spectrum machine learning models [44], this approach offers a transparent and scalable method for index formulation. Overall, the dual-method selection strategy offers a reliable basis for developing phenotype-specific vegetation indices in horticultural research.

4.3. Spectral Unmixing Optimization for Robust Endmember Extraction in Apple Fruits

To effectively capture cultivar-specific spectral signatures in apple hyperspectral imaging, we initially implemented a spectral unmixing approach using the PPI derived from the SUnSeT method [15]. Although previously validated with high efficacy (rRMSE of 2.12% and seed segmentation accuracy of 95.8%) on soybean datasets, the direct application of PPI to apple spectra resulted in high spectral noise and poorly distinguishable cultivar-specific endmembers (Table S3). This limitation arises due to PPI’s inherent reliance on repeated random projections and its sensitivity to spectral variability, illumination inconsistencies, subtle surface features, and instrument-induced variations common in fruit imaging, thereby violating its fundamental assumption of pixel purity [45,46,47].
To address these challenges and identify a more robust spectral unmixing framework tailored specifically to apple fruit spectral data, we developed a two-stage optimization strategy comprising twelve algorithmic pipelines. In Stage I, three candidate selection methods—K-Means, VCA, and PPI—were applied. In Stage II, four integration algorithms—K-Means, PPI, VCA, and N-FINDR—were compared based on RMSE metrics. Each method exhibited distinct strengths and limitations: VCA, despite computational efficiency, is sensitive to noise and assumptions regarding pixel purity [48]; PPI is intuitive but vulnerable to parameter tuning and spectral outliers [45]; N-FINDR offers superior robustness under high mixing conditions but incurs substantial computational costs [49]; and K-Means provides speed and scalability but lacks direct interpretability in terms of spectral purity [50,51]. Due to computational constraints, N-FINDR was not included in Stage I. Then, abundance maps were created using the selected global end members (Figure S2). These abundance maps facilitate the detection of quality-related traits such as bruising, pigment asymmetry, and ripeness gradients [52]. Among the evaluated methods, the combination of K-Means clustering followed by N-FINDR refinement demonstrated superior performance, achieving the lowest RMSE (0.043%). While K-Means initially reduced spectral redundancy efficiently, N-FINDR robustly extracted spectrally distinct endmembers via its simplex volume maximization approach. Previous studies have demonstrated that K-Means is effective for large-scale clustering [53] and that N-FINDR performs well in hyperspectral unmixing tasks [54]. This pipeline balances computational efficiency, accuracy, and stability, providing a scalable endmember extraction approach for noisy, heterogeneous fruit hyperspectral data.
Taken together, under controlled imaging across five cultivars, our workflow—combining an interpretable panel of Selected VIs (NDSI/RSI/DSI) with a two-stage spectral unmixing step—yields immediately actionable outputs for laboratory/bench-top use. The Selected VIs provide standardized, low-complexity markers that (i) support consistent cross-cultivar screening (e.g., documenting blush/green fractions and spatial heterogeneity via abundance maps); (ii) enable postharvest quality control under fixed lighting at the bench using simple thresholds/flags rather than opaque models; and (iii) inform down-selection of candidate bands for pilot multispectral prototypes in follow-up work. With additional testing across other cultivars, fruit types, and operating conditions, this framework can be incrementally transitioned from research screening to pilot-scale evaluations in applied settings, while biochemical validation and cross-device/session studies remain clear next steps.

5. Conclusions

This study presents an integrated approach to improve the spectral interpretation of apple fruit hyperspectral data by combining statistical feature selection, pigment-targeted index formulation, and optimized spectral unmixing. The ensemble-based screening of 284 existing vegetation indices, supported by four complementary selection algorithms, enabled the identification of 50 robust indices applicable across cultivars with divergent skin pigmentation. By incorporating VIP- and ANOVA-derived wavelength bands, we further developed new indices sensitive to key pigment components, achieving consistent classification performance and phenotypic differentiation. The implementation of a two-stage spectral unmixing pipeline—leveraging K-Means for initial clustering and N-FINDR for high-resolution endmember extraction—demonstrated superior accuracy and interpretability, overcoming limitations associated with pixel purity and spectral noise in fruit imaging. Compared to previous methods that rely on predefined indices or single unmixing algorithms, our strategy offers a more adaptable and spectrally grounded framework for apple cultivar discrimination and surface-related quality assessment. These findings not only highlight the need for organ-specific spectral tools but also establish practical methodologies for developing them. The proposed workflow provides a scalable basis for applications in cultivar classification, postharvest quality monitoring, and precision horticulture.

Supplementary Materials

The following supporting information can be downloaded at https://www.mdpi.com/article/10.3390/horticulturae11101177/s1, Figure S1: Determination of the optimal ROI region in apple fruit by comparing spectral patterns across anatomical regions and deriving A/B ratio formulas.; Figure S2: Abundance maps of apple fruit ROIs generated using selected GEMs.; Figure S3: Confusion matrices showing classification performance across the five apple cultivars.; Table S1: List of 284 VIs evaluated in this study with cultivar-level mean reflectance values presented as a heatmap.; Table S2: Classification accuracies of spectral indices derived from VIP- and ANOVA-selected band combinations using NDSI, RSI, and DSI formulations.; Table S3: Reconstruction RMSE across endmember extraction pipelines and cultivars.; Table S4: Reconstructed reflectance from differentiated spectra using final GEMs.; Table S5: Abundance of GEMs across ROI samples from five apple cultivars.

Author Contributions

Image measurement, S.L. and E.G.; image data processing, H.J., J.B., Y.-J.L. and J.I.L.; data analysis, H.J., Y.-I.P., Y.-J.L. and J.I.L.; experimental design, S.L.K. and K.-H.K.; writing—original draft, Y.-J.L. and J.I.L.; writing—review and editing, S.-H.K. and J.I.L. All authors have read and agreed to the published version of the manuscript.

Funding

This research was supported by 2025 the RDA Fellowship Program (PJ017490) of National Institute of Agricultural Sciences (NIAS), and funded by NIAS Research Program for Agricultural Science and Technology Development (RS-2025-00512138, RS-2021-RD009026), Rural Development Administration, Republic Korea.

Institutional Review Board Statement

Not applicable.

Informed Consent Statement

Not applicable.

Data Availability Statement

The data supporting the reported results are available within the article and its Supplementary Materials, and are also openly accessible in Zenodo at the following DOI: https://doi.org/10.5281/zenodo.16751698.

Conflicts of Interest

The authors declare no conflicts of interest.

References

  1. Boyer, J.; Liu, R.H. Apple phytochemicals and their health benefits. Nutr. J. 2004, 3, 5. [Google Scholar] [CrossRef] [PubMed]
  2. Bonany, J.; Buehler, A.; Carbó, J.; Codarin, S.; Donati, F.; Echeverria, G.; Egger, S.; Guerra, W.; Hilaire, C.; Höller, I.; et al. Consumer eating quality acceptance of new apple varieties in different European countries. Food Qual. Prefer. 2013, 30, 250–259. [Google Scholar] [CrossRef]
  3. Gowen, A.A.; O’Donnell, C.P.; Cullen, P.J.; Downey, G.; Frias, J.M. Hyperspectral imaging–an emerging process analytical tool for food quality and safety control. Trends Food Sci. Technol. 2007, 18, 590–598. [Google Scholar] [CrossRef]
  4. Yang, W.; Feng, H.; Zhang, X.; Zhang, J.; Doonan, J.H.; Batchelor, W.D.; Xiong, L.; Yan, J. Crop phenomics and high-throughput phenotyping: Past decades, current challenges, and future perspectives. Mol. Plant 2020, 13, 187–214. [Google Scholar] [CrossRef]
  5. Baranowski, P.; Mazurek, W.; Wozniak, J.; Majewska, U. Detection of early bruises in apples using hyperspectral data and thermal imaging. J. Food Eng. 2012, 110, 345–355. [Google Scholar] [CrossRef]
  6. ElMasry, G.; Wang, N.; Vigneault, C. Detecting chilling injury in Red Delicious apple using hyperspectral imaging and neural networks. Postharvest Biol. Technol. 2009, 52, 1–8. [Google Scholar] [CrossRef]
  7. Çetin, N.; Karaman, K.; Kavuncuoğlu, E.; Yıldırım, B.; Jahanbakhshi, A. Using hyperspectral imaging technology and machine learning algorithms for assessing internal quality parameters of apple fruits. Chemom. Intell. Lab. Syst. 2022, 230, 104650. [Google Scholar] [CrossRef]
  8. Yendrek, C.R.; Tomaz, T.; Montes, C.M.; Cao, Y.; Morse, A.M.; Brown, P.J.; McIntyre, L.M.; Leakey, A.D.B.; Ainsworth, E.A. High-Throughput Phenotyping of Maize Leaf Physiological and Biochemical Traits Using Hyperspectral Reflectance. Plant Physiol. 2016, 173, 614–626. [Google Scholar] [CrossRef] [PubMed]
  9. Gitelson, A.A.; Merzlyak, M.; Zur, Y.; Stark, R.; Gritz, U. Non-destructive and remote sensing techniques for estimation of vegetation status. In Proceedings of the 3rd European Conference on Precision Agriculture, Montpelier, France, 18–20 June 2001. [Google Scholar]
  10. Li, J.; Zhang, Y.; Gu, L.; Li, Z.; Li, J.; Zhang, Q.; Zhang, Z.; Song, L. Seasonal variations in the relationship between sun-induced chlorophyll fluorescence and photosynthetic capacity from the leaf to canopy level in a rice crop. J. Exp. Bot. 2020, 71, 7179–7197. [Google Scholar] [CrossRef]
  11. Rouse, J.W., Jr.; Haas, R.H.; Deering, D.; Schell, J.; Harlan, J.C. Monitoring the Vernal Advancement and Retrogradation (Green Wave Effect) of Natural Vegetation; Legacy CDMS: Singapore, 1974. [Google Scholar]
  12. Gamon, J.A.; Penuelas, J.; Field, C. A narrow-waveband spectral index that tracks diurnal changes in photosynthetic efficiency. Remote Sens. Environ. 1992, 41, 35–44. [Google Scholar] [CrossRef]
  13. Curran, P.J. Remote sensing of foliar chemistry. Remote Sens. Environ. 1989, 30, 271–278. [Google Scholar] [CrossRef]
  14. Siedliska, A.; Baranowski, P.; Zubik, M.; Mazurek, W.; Sosnowska, B. Detection of fungal infections in strawberry fruit by VNIR/SWIR hyperspectral imaging. Postharvest Biol. Technol. 2018, 139, 115–126. [Google Scholar] [CrossRef]
  15. Jeong, S.W.; Lyu, J.I.; Jeong, H.; Baek, J.; Moon, J.-K.; Lee, C.; Choi, M.-G.; Kim, K.-H.; Park, Y.-I. SUnSeT: Spectral unmixing of hyperspectral images for phenotyping soybean seed traits. Plant Cell Rep. 2024, 43, 164. [Google Scholar] [CrossRef] [PubMed]
  16. Kursa, M.B.; Rudnicki, W.R. Feature Selection with the Boruta Package. J. Stat. Softw. 2010, 36, 1–13. [Google Scholar] [CrossRef]
  17. Zou, H.; Hastie, T. Regularization and variable selection via the elastic net. J. R. Stat. Soc. Ser. B Stat. Methodol. 2005, 67, 301–320. [Google Scholar] [CrossRef]
  18. Saeys, Y.; Abeel, T.; Van de Peer, Y. Robust feature selection using ensemble feature selection techniques. In Proceedings of the Joint European Conference on Machine Learning and Knowledge Discovery in Databases, Antwerp, Belgium, 14–18 September 2008; pp. 313–325. [Google Scholar]
  19. Barnes, R.; Dhanoa, M.S.; Lister, S.J. Standard normal variate transformation and de-trending of near-infrared diffuse reflectance spectra. Appl. Spectrosc. 1989, 43, 772–777. [Google Scholar] [CrossRef]
  20. Barker, M.; Rayens, W. Partial least squares for discrimination. J. Chemom. J. Chemom. Soc. 2003, 17, 166–173. [Google Scholar] [CrossRef]
  21. Chong, I.-G.; Jun, C.-H. Performance of some variable selection methods when multicollinearity is present. Chemom. Intell. Lab. Syst. 2005, 78, 103–112. [Google Scholar] [CrossRef]
  22. Zarco-Tejada, P.J.; Miller, J.R.; Mohammed, G.; Noland, T.L.; Sampson, P. Vegetation stress detection through chlorophyll a + b estimation and fluorescence effects on hyperspectral imagery. J. Environ. Qual. 2002, 31, 1433–1441. [Google Scholar] [CrossRef] [PubMed]
  23. Guyon, I.; Weston, J.; Barnhill, S.; Vapnik, V. Gene selection for cancer classification using support vector machines. Mach. Learn. 2002, 46, 389–422. [Google Scholar] [CrossRef]
  24. Savitzky, A.; Golay, M.J. Smoothing and differentiation of data by simplified least squares procedures. Anal. Chem. 1964, 36, 1627–1639. [Google Scholar] [CrossRef]
  25. Geladi, P.; Kowalski, B.R. Partial least-squares regression: A tutorial. Anal. Chim. Acta 1986, 185, 1–17. [Google Scholar] [CrossRef]
  26. Willmott, C.J.; Matsuura, K. Advantages of the mean absolute error (MAE) over the root mean square error (RMSE) in assessing average model performance. Clim. Res. 2005, 30, 79–82. [Google Scholar] [CrossRef]
  27. Chang, C.-I. Hyperspectral Data Exploitation: Theory and Applications; John Wiley & Sons: Hoboken, NJ, USA, 2007. [Google Scholar]
  28. Lightenthaler, H. Chlorophylls and carotenoids: Pigments of photosynthetic biomembranes. Methods Enzymol. 1987, 148, 350–382. [Google Scholar]
  29. Gitelson, A.; Merzlyak, M.N. Spectral reflectance changes associated with autumn senescence of Aesculus hippocastanum L. and Acer platanoides L. leaves. Spectral features and relation to chlorophyll estimation. J. Plant Physiol. 1994, 143, 286–292. [Google Scholar] [CrossRef]
  30. Merzlyak, M.N.; Solovchenko, A.E.; Gitelson, A.A. Reflectance spectral features and non-destructive estimation of chlorophyll, carotenoid and anthocyanin content in apple fruit. Postharvest Biol. Technol. 2003, 27, 197–211. [Google Scholar] [CrossRef]
  31. Merzlyak, M.N.; Chivkunova, O.B. Light-stress-induced pigment changes and evidence for anthocyanin photoprotection in apples. J. Photochem. Photobiol. B Biol. 2000, 55, 155–163. [Google Scholar] [CrossRef] [PubMed]
  32. Gitelson, A.A.; Zur, Y.; Chivkunova, O.B.; Merzlyak, M.N. Assessing carotenoid content in plant leaves with reflectance spectroscopy. Photochem. Photobiol. 2002, 75, 272–281. [Google Scholar] [CrossRef]
  33. Nagy, A.; Szabó, A.; Elbeltagi, A.; Nxumalo, G.S.; Bódi, E.B.; Tamás, J. Hyperspectral indices data fusion-based machine learning enhanced by MRMR algorithm for estimating maize chlorophyll content. Front. Plant Sci. 2024, 15, 1419316. [Google Scholar] [CrossRef]
  34. Zhou, J.; Li, F.; Wang, X.; Yin, H.; Zhang, W.; Du, J.; Pu, H. Hyperspectral and fluorescence imaging approaches for nondestructive detection of rice chlorophyll. Plants 2024, 13, 1270. [Google Scholar] [CrossRef]
  35. Tian, X.; Liu, X.; He, X.; Zhang, C.; Li, J.; Huang, W. Detection of early bruises on apples using hyperspectral reflectance imaging coupled with optimal wavelengths selection and improved watershed segmentation algorithm. J. Sci. Food Agric. 2023, 103, 6689–6705. [Google Scholar] [CrossRef] [PubMed]
  36. Fan, S.; Zhang, B.; Li, J.; Liu, C.; Huang, W.; Tian, X. Prediction of soluble solids content of apple using the combination of spectra and textural features of hyperspectral reflectance imaging data. Postharvest Biol. Technol. 2016, 121, 51–61. [Google Scholar] [CrossRef]
  37. Xue, J.; Su, B. Significant remote sensing vegetation indices: A review of developments and applications. J. Sens. 2017, 2017, 1353691. [Google Scholar]
  38. Zhang, B.; Zhou, J. Hyperspectral imaging and their applications in the nondestructive quality assessment of fruits and vegetables. In Hyperspectral Imaging in Agriculture, Food and Environment; IntechOpen: London, UK, 2018; p. 27. [Google Scholar]
  39. Qian, Y.; Ye, M.; Zhou, J. Hyperspectral image classification based on structured sparse logistic regression and three-dimensional wavelet texture features. IEEE Trans. Geosci. Remote Sens. 2012, 51, 2276–2291. [Google Scholar] [CrossRef]
  40. Liu, Y.; Yang, J.; Chen, Y.; Tan, K.; Wang, L.; Yan, X. Stability analysis of hyperspectral band selection algorithms based on neighborhood rough set theory for classification. Chemom. Intell. Lab. Syst. 2017, 169, 35–44. [Google Scholar] [CrossRef]
  41. Rinnan, Å.; Van Den Berg, F.; Engelsen, S.B. Review of the most common pre-processing techniques for near-infrared spectra. TrAC Trends Anal. Chem. 2009, 28, 1201–1222. [Google Scholar] [CrossRef]
  42. Zhao, Y.-R.; Li, X.; Yu, K.-Q.; Cheng, F.; He, Y. Hyperspectral imaging for determining pigment contents in cucumber leaves in response to angular leaf spot disease. Sci. Rep. 2016, 6, 27790. [Google Scholar] [CrossRef] [PubMed]
  43. Van Beers, R.; Aernouts, B.; Watte, R.; Schenk, A.; Nicolai, B.; Saeys, W. Effect of maturation on the bulk optical properties of apple skin and cortex in the 500–1850 nm wavelength range. J. Food Eng. 2017, 214, 79–89. [Google Scholar] [CrossRef]
  44. ElMasry, G.; Wang, N.; Vigneault, C.; Qiao, J.; ElSayed, A. Early detection of apple bruises on different background colors using hyperspectral imaging. LWT-Food Sci. Technol. 2008, 41, 337–345. [Google Scholar] [CrossRef]
  45. Chang, C.-I.; Plaza, A. A fast iterative algorithm for implementation of pixel purity index. IEEE Geosci. Remote Sens. Lett. 2006, 3, 63–67. [Google Scholar] [CrossRef]
  46. Bioucas-Dias, J.M.; Plaza, A.; Dobigeon, N.; Parente, M.; Du, Q.; Gader, P.; Chanussot, J. Hyperspectral unmixing overview: Geometrical, statistical, and sparse regression-based approaches. IEEE J. Sel. Top. Appl. Earth Obs. Remote Sens. 2012, 5, 354–379. [Google Scholar] [CrossRef]
  47. Borsoi, R.A.; Imbiriba, T.; Bermudez, J.C.M.; Richard, C.; Chanussot, J.; Drumetz, L.; Tourneret, J.-Y.; Zare, A.; Jutten, C. Spectral variability in hyperspectral data unmixing: A comprehensive review. IEEE Geosci. Remote Sens. Mag. 2021, 9, 223–270. [Google Scholar] [CrossRef]
  48. Nascimento, J.M.; Dias, J.M. Vertex component analysis: A fast algorithm to unmix hyperspectral data. IEEE Trans. Geosci. Remote Sens. 2005, 43, 898–910. [Google Scholar] [CrossRef]
  49. Winter, M.E. N-FINDR: An algorithm for fast autonomous spectral end-member determination in hyperspectral data. In Imaging Spectrometry V; SPIE: Bellingham, WA, USA, 1999; pp. 266–275. [Google Scholar]
  50. Xu, L.; Li, J.; Wong, A.; Peng, J. Kp-means: A clustering algorithm of k “purified” means for hyperspectral endmember estimation. IEEE Geosci. Remote Sens. Lett. 2014, 11, 1787–1791. [Google Scholar]
  51. Bilius, L.B.; Pentiuc, S.G. Unsupervised clustering for hyperspectral images. Symmetry 2020, 12, 277. [Google Scholar] [CrossRef]
  52. Qin, J.; Burks, T.F.; Ritenour, M.A.; Bonn, W.G. Detection of citrus canker using hyperspectral reflectance imaging with spectral information divergence. J. Food Eng. 2009, 93, 183–191. [Google Scholar] [CrossRef]
  53. Haut, J.M.; Paoletti, M.; Plaza, J.; Plaza, A. Cloud implementation of the K-means algorithm for hyperspectral image analysis. J. Supercomput. 2017, 73, 514–529. [Google Scholar] [CrossRef]
  54. Cecilia, A. Evaluation of Hyperspectral Unmixing Methods: A Comparative Study for Very-High Spatial Resolution Hyperspectral Images. In Proceedings of the 2024 IEEE Southwest Symposium on Image Analysis and Interpretation (SSIAI), Santa Fe, NM, USA, 17–19 March 2024; pp. 53–56. [Google Scholar]
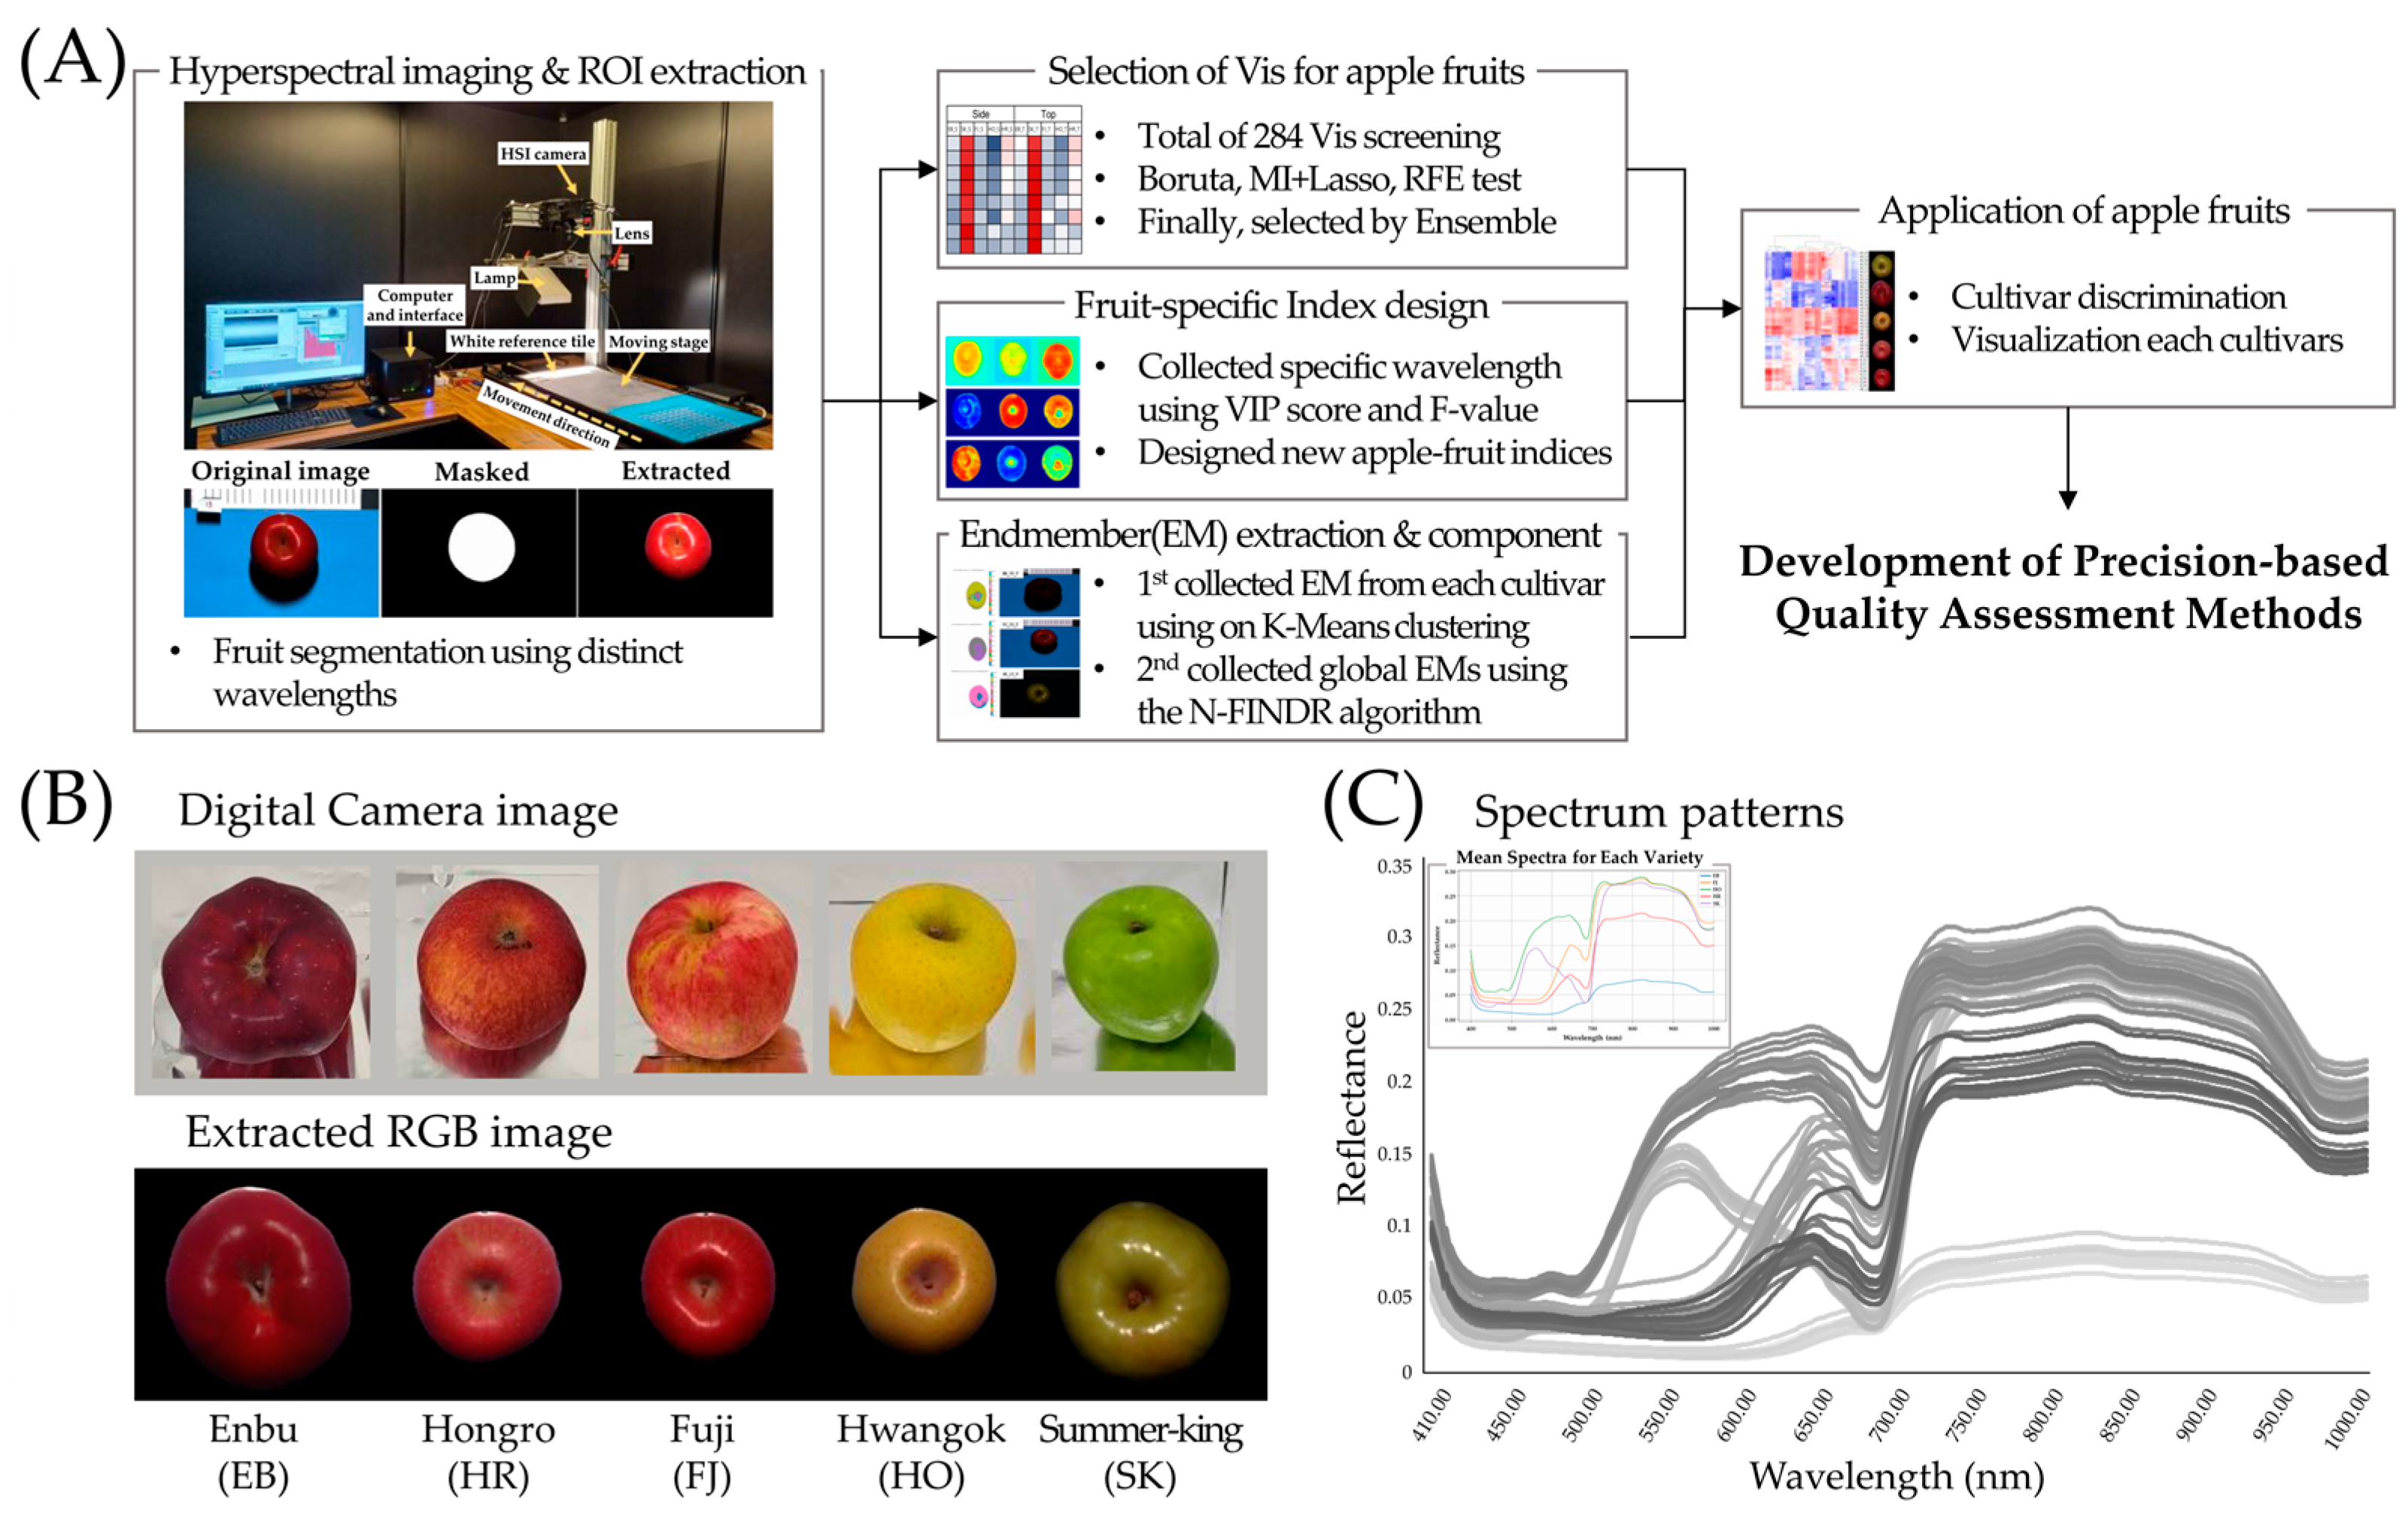
Figure 1. Overview of the analytical framework and spectral characteristics used in this study. (A) Schematic workflow of the proposed hyperspectral analysis pipeline for apple fruit phenotyping. Regions of interest (ROIs) were extracted using a customized A/B ratio-based thresholding method, followed by the calculation of 284 vegetation indices (VIs). Four feature selection techniques (Boruta, MI+Lasso, RFE, and ensemble voting) were employed to identify VIs most relevant to apple fruit classification. Subsequently, cultivar-specific discriminatory wavelengths were derived using Variable Importance in Projection (VIP) scores from PLS-DA and ANOVA-based F-values, and used to construct optimized spectral indices. Spectral unmixing was performed to extract endmembers for visualizing cultivar-specific spectral patterns, enabling a comprehensive phenotypic assessment. (B) Digital RGB images and representative RGB composites extracted from hyperspectral data for the five apple cultivars used in this study. (C) The VNIR (400–1000 nm) reflectance spectra for individual apple samples and the averaged spectral profiles for each cultivar, illustrating the spectral diversity among cultivars.
Horticulturae 11 01177 g001
Figure 2. Comparative analysis of feature selection strategies for cultivar discrimination using hyperspectral vegetation indices. (A) Principal component analysis (PCA) plots showing cultivar clustering patterns in the PC1–PC2 space based on vegetation indices (VIs) selected by Boruta, MI+Lasso, RFE, ensemble voting, and the full VI set. Cumulative variance explained by the first two components was highest for RFE (88.11%), followed by ensemble (84.21%), Boruta (81.76%), full VI set (81.31%), and MI+Lasso (71.20%). (B) Venn-style dendrogram indicating the number of VIs selected by each method and their overlaps: Boruta and RFE shared 30 indices, Boruta and MI+Lasso shared 23, and MI+Lasso and RFE shared 3, with only 3 indices selected by all three. The ensemble set includes 50 VIs retained by at least two methods. (C) Z-score-normalized heatmap of the 50 ensemble-selected VIs across top and side views of all samples. Clustering analysis revealed that cultivars with green (SK) and purple (EB) skin pigmentation showed stronger responses in specific indices, likely associated with higher chlorophyll and anthocyanin levels.
Horticulturae 11 01177 g002
Figure 3. Development and evaluation of cultivar-discriminative spectral indices using VIP and ANOVA approaches. (A) Wavelength selection based on VIP scores (up) and cultivar-specific ANOVA F-values (down), with bands below 450 nm excluded due to high noise. A minimum interval of 30 nm was applied to avoid redundancy. (B) Visualization of selected indices using SVM classification with selected wavelengths. (C) Heatmap of z-score normalized index values for five cultivars using the best-performing indices, revealing strong differentiation patterns consistent with fruit skin color.
Horticulturae 11 01177 g003
Figure 4. Spectral unmixing analysis identifies global endmembers (GEMs) that reflect cultivar- and view-specific surface reflectance patterns in apple fruits. (A) Spectral profiles of the 10 GEMs extracted using a two-stage pipeline. (B) Spatial abundance maps of each GEM overlaid on apple ROIs, highlighting cultivar-dominant endmembers and view-dependent patterns. (C) Heatmap of GEM abundances across five cultivars and two orientations (top vs. side), with clustering by skin color and viewing angle.
Horticulturae 11 01177 g004
Table 1. Summary of selected vegetation indices and classification performance across four feature selection methods (Boruta, MI+Lasso, RFE, Ensemble).
MethodSelected VIsAccuracy (%)Macro F1 Score
All VIs28497.780.977
Boruta16095.560.955
MI+Lasso3897.780.977
RFE3095.560.955
Ensemble5095.560.955
Table 2. Spectral indices identified by PLS-DA and ANOVA, including classification accuracy, methodological origin, and putative associations with pigment absorption domains.
IndexSelected
Wavelengths (nm)
λ1:λ2 (nm)Index
Type
Acc. (%)Derivation
&
Intent
Linked Pigment/
Optical Property
Refs
Red-edge–Red Contrast Index534.13, 631.63, 691.75, 732.38, 763.25763.25:631.63NDSI89PLS-DA VIP
(global discriminant wavelengths)
630–640 nm: chlorophyll absorption shoulder; 760–763 nm: red-edge/structural scattering[28,29]
Red-edge–Chlorophyll Shoulder Index451.26, 482.13, 620.25, 688.50, 734.00734.00:620.25NDSI99ANOVA
(EB vs. others; spectral difference)
620 nm: chlorophyll a red absorption; 734 nm: red-edge transition[29,30]
Red-edge–Green Ratio Index452.88, 560.13, 732.38, 964.75, 995.62732.38:560.13NDSI87ANOVA
(HR vs. others)
560 nm: green/putative anthocyanin absorption; 732 nm: red-edge/NIR[30]
Green–Red Transition DSI527.63, 558.51, 589.38, 651.13, 725.88558.51:651.13DSI91ANOVA
(FJ vs. others)
558 nm: green (anthocyanin-sensitive region); 651 nm: chlorophyll a absorption[28,31]
NIR–Green Structural Index467.51, 500.01, 924.12, 955.00, 985.87955.00:500.01NDSI100ANOVA
(HO vs. others)
500 nm: carotenoid/anthocyanin-sensitive region; 955 nm: NIR structural scattering and water absorption[32]
Green–Red-edge Contrast Index526.01, 556.88, 672.25, 708.00, 758.38526.01:708.00NDSI100ANOVA
(SK vs. others)
525–530 nm: green (chlorophyll b/anthocyanin-related); 708 nm: red-edge onset[29,30]
Disclaimer/Publisher’s Note: The statements, opinions and data contained in all publications are solely those of the individual author(s) and contributor(s) and not of MDPI and/or the editor(s). MDPI and/or the editor(s) disclaim responsibility for any injury to people or property resulting from any ideas, methods, instructions or products referred to in the content.