Article

Manganese Deficiency Exacerbates Boron Deficiency-Induced Corky Split Vein in Citrus by Disrupting Photosynthetic Physiology and Enhancing Lignin Metabolism

1
National Navel Orange Engineering Research Center, College of Navel Orange, Gannan Normal University, Ganzhou 341000, China
2
College of Agronomy, Jiangxi Agricultural University, Nanchang 330045, China
3
College of Tropical Agriculture and Forestry, Hainan University, Danzhou 570228, China
*
Author to whom correspondence should be addressed.
Horticulturae 2025, 11(10), 1172; https://doi.org/10.3390/horticulturae11101172
Submission received: 29 August 2025 / Revised: 20 September 2025 / Accepted: 28 September 2025 / Published: 1 October 2025
(This article belongs to the Special Issue Fruit Tree Physiology and Molecular Biology)

Abstract

Corky split vein (CSV) is a common physiological disease in citrus that can result from multiple types of stresses. Preliminary field investigation found that more severe CSV in citrus cultivated in orchards lacking both boron (B) and other photosynthesis-related nutrients, including manganese (Mn). In this study, two-year-old ‘Newhall’ navel orange seedlings were treated with control (CK), B deficiency (BD), Mn deficiency (MnD), and combined B and Mn deficiency (BD + MnD). After 31 weeks, typical CSV symptoms appeared on old leaves (OLs) and secondary new leaves (SLs) in BD, while BD + MnD symptoms were more severe. BD and BD + MnD significantly reduced B concentrations in all leaf types, but there were no significant differences between them. Except for OLs in MnD, the net photosynthetic rate (Pn) of all leaf types significantly decreased in all treatments, with BD + MnD showing significantly lower Pn values than BD. Compared with BD, BD + MnD significantly increased minimal fluorescence (Fo) of all leaves at the later stage and significantly decreased Y(II) of new leaves. BD significantly increased sucrose and starch contents in all type leaves, while the OL starch content was significantly higher in BD + MnD than that in BD. BD + MnD significantly decreased the enzyme activities of Rubisco, TK, and FBA in OLs, FBPase and NI in PLs, and Rubisco in SLs compared with BD, while the activities of NI and AI in OLs and SS in SLs were significantly increased. BD + MnD significantly enhanced lignin concentrations and the expression of key lignin synthesis genes in leaves compared with BD. In conclusion, Mn deficiency exacerbates B-deficiency-induced CSV not only by intensifying photosynthetic dysfunction and carbohydrate accumulation but also by promoting lignin biosynthesis. These findings highlight the synergistic nature of B and Mn deficiencies in impairing leaf function and structure, providing new insights into the physiological and molecular mechanisms underlying CSV development.

1. Introduction

Boron (B) is an essential micronutrient for the growth and development of higher plants [1,2]. It regulates plant cell elongation and division, as well as the formation and development of reproductive organs, through contributing to biological functions including the structure and function of plant cell walls, sugar transport, auxin synthesis and transport, carbohydrate and phenolic metabolism, and lignin synthesis [3,4,5,6,7,8]. On a global scale, B deficiency is the most widespread plant micronutrient deficiency and represents one of the main limiting factors for the production of 132 crops in many regions [9,10]. Studies have shown that 60–98% of B in plants is bound to the cell wall. When plants are deficient in B, their cell walls thicken and the arrangement of the cell wall becomes disordered [4,11]. Therefore, B deficiency symptoms typically first appear in growing regions rather than mature tissues, leading to stem tip necrosis, inhibited root elongation, suppressed leaf expansion, and decreased fertility [12].
As one of the most important fruit tree species in southern China, citrus often experiences growth and development issues due to B deficiency, resulting in reduced yield and quality [13,14,15]. The major navel orange production areas of China are concentrated in the region encompassing southern Jiangxi, southern Hunan, northern Guangxi, and Three Gorges, where soil conditions are relatively poor. In particular, acidic soil areas in southern Jiangxi are deficient in a variety of micronutrients [16,17,18]. Due to frequent high temperatures and rainy weather in southern Jiangxi, B is easily leached from the soil, leading to widespread B deficiency in the soils of navel orange orchards [17]. B deficiency symptoms include stem tip necrosis, thickened new leaves, malformed leaf veins, inhibited root development, and root tip swelling, among which the most typical symptom is corky split vein (CSV). CSV has been reported in many citrus species, including navel orange [8,19,20], sweet orange [14], pummelo [15,21], trifoliate orange, and fragrant citrus [22,23]. The causes of CSV are diverse. For example, both magnesium (Mg) deficiency and Huanglongbing disease can induce CSV [24,25,26]. Recent studies have shown that lignin metabolism plays an important role in the development of CSV symptoms caused by B deficiency or Mg deficiency [8,25,26].
Photosynthesis serves as the foundation of tree growth and fruiting. More than 90% of the dry matter content of roots, stems, leaves, flowers, and fruits is contributed by photosynthetic products produced by leaves. Both the economical yield and fruit quality of fruit trees are closely related to photosynthesis [27]. B plays a fundamental role in governing the efficiency of photosynthetic processes and thereby facilitates the subsequent translocation of photoassimilates [28,29]. Current research indicates that deficient or excessive B affects the photosynthetic parameters of plants, especially the synthesis and transport of photosynthetic products [10,30,31,32]. Therefore, regulating the application of B fertilizer can improve the growth and development of crops. For instance, applying B can enhance the photosynthetic efficiency of soybeans during their vegetative growth period [33]. In citrus, B deficiency reduces the photosynthetic pigment content of leaves. For example, research has demonstrated that B deficiency significantly reduces the contents of chlorophyll a (Chl a), chlorophyll b (Chl b), and carotenoid (Car) photosynthetic pigments in sweet orange leaves [14]. B deficiency also induces a decrease in photosynthetic pigment content in the leaves of a variety of citrus rootstocks, including trifoliate orange, Carrizo citrange, Chongyi tangerine, red tangerine, Cleopatra mandarin, and sour orange [22,30]. Furthermore, deficient or excessive B affects photosynthetic gas exchange parameters such as the leaf net photosynthetic rate (Pn). In citrus plants, the net assimilation of CO2 and the stomatal conductance (Gs) leaf gas exchange parameters were found to be reduced under excess B in the leaves of Verna lemon trees grafted onto four different rootstocks (Carrizo citrange, Cleopatra mandarin, Citrus macrophylla, and sour orange), and this reduction was less pronounced for trees grafted onto Citrus macrophylla and Cleopatra mandarin rootstock. However, analysis of the intercellular CO2 concentration (Ci) and chlorophyll fluorescence showed that the reduction in net CO2 assimilation under excess B is mainly induced by non-stomatal factors [34]. B deficiency also affects the photosynthetic characteristics of citrus. For example, research has shown that B deficiency significantly decreases the Pn value of sweet orange leaves [14], significantly reduces CO2 assimilation efficiency and photosystem II (PSII) photochemical efficiency in the seedling leaves of Citrus grandis [14,35], significantly inhibits leaf gas exchange parameters in ‘HB’ pummelo [21], and significantly affects the seedling leaf gas exchange parameters and diurnal photosynthetic dynamics of ‘Newhall’ navel orange [36,37]. Moreover, B deficiency may decrease the Pn value of the leaves of trifoliate orange and Carrizo citrange, which are widely utilized as citrus rootstocks [32]. In addition, B deficiency also affects the contents of photosynthetic products. In previous work, anatomical observations showed that B deficiency resulted in the obvious accumulation of starch granules in leaf cells [23]. Further investigation demonstrated that the contents of photosynthetic products such as soluble sugars, sucrose, fructose, and starch significantly increased under B deficiency stress [10,14,32,35]. The accumulation of large quantities of photosynthetic products in leaf cells may result in the feedback inhibition of photosynthesis, thereby leading to a decline in photosynthetic performance. In summary, deficient or excessive B impacts citrus photosynthesis through three main pathways: (i) reducing the contents of Chl a, Chl b, and Car photosynthetic pigments in leaves to weaken the capability of citrus leaves to capture light energy; (ii) altering photosynthesis-related leaf gas exchange parameters such as the net CO2 assimilation, Gs, and Ci to reduce the photosynthetic performance of citrus leaves; and (iii) influencing the synthesis and transport of photosynthetic products to induce the feedback inhibition of photosynthesis in citrus leaves.
In addition to B, other micronutrients also play crucial roles in citrus photosynthesis. These micronutrients act as enzyme cofactors or components of the electron transport chain, participating directly or indirectly in the photosynthetic process [37,38,39]. Because changes in citrus photosynthetic characteristics induced by micronutrient deficiency usually occur before the appearance of visible leaf symptoms, such changes may provide as an important basis for the early diagnosis of micronutrient deficiency [37]. Therefore, investigating the relationship between micronutrients and photosynthetic characteristics in citrus is of great practical significance. Manganese (Mn), a key micronutrient, is directly involved in photosynthesis, serving as a structural component of PSII. The oxygen-evolving complex composed of Mn4CaO5 forms in the thylakoid lumen, playing a key role in the water-splitting reaction of PSII and the photosynthetic electron transport process. Therefore, Mn is a core element in carbon assimilation [40,41,42], as well as an essential element for plant growth and development. In addition to its direct involvement in photosynthesis, Mn acts as a cofactor for a variety of enzymes, participating in the regulation of secondary metabolite synthesis, including proteins, lipids, carbohydrates, and lignin [42,43,44]. Furthermore, Mn is involved in the formation of superoxide dismutase in mitochondria and peroxisomes, playing a key role in the scavenging of reactive oxygen species [41,42,45]. Soil pH is the most important factor affecting Mn availability. Alkaline soils usually cause Mn deficiency, whereas acidic soils may lead to Mn toxicity. Mn availability is also influenced by other factors, such as soil microbial activity, soil moisture content, and soil organic matter content [42,46,47,48,49,50]. Therefore, even citrus grown in acidic soils may encounter Mn deficiency. There are also the citrus orchards deficient in both Mn and B [16,51,52]. In citrus, Mn deficiency symptoms mainly appear in newly emerged leaves. The typical symptom in the early stage of Mn deficiency is interveinal chlorosis with green veins forming a net-like pattern, followed by the appearance of brown spots in the later stage, while CSV does not appear [39].
Previous field investigations of citrus leaf nutrient status showed that mineral nutrient deficiencies were usually not limited to a single element, and the lack of two or more elements was common [16,53]. Deficiency in multiple mineral nutrients is caused by poor soil nutrient status and antagonistic or synergistic interactions between mineral elements. Plant growth and development rely on a balance of essential mineral nutrients. A deficiency in one element can alter the uptake and transport of other minerals and may trigger multiple regulatory pathways to redistribute minerals to support normal plant growth and development [54]. Therefore, examining the interactions between mineral elements and other types of stresses is of great importance for understanding their physiological and molecular functions in crops. For example, research on nitrogen (N)–calcium (Ca) interactions in nectarine has shown that N–Ca imbalance hinders the development of photosynthetic organs and reduces photosynthetic efficiency [55]. There are also clear interactions between phosphorus (P) and zinc (Zn) in plant roots. Zn deficiency may result in P toxicity to barley, while P deficiency can cause an increase in the Zn content of barley [56]. Previous studies have shown that B can interact with a variety of mineral nutrients and stress factors [33]. B deficiency stress acts simultaneously with other stresses (extreme temperatures, excessive light, high CO2 concentrations, drought, salinity, and heavy metal contamination), which can increase the sensitivity of plants to B toxicity or deficiency. B deficiency can alter the content of multiple mineral elements in plants. For example, many researchers have shown that the nitrate (N) contents of plant roots and leaves are markedly decreased under B deficiency [57,58]. B deficiency was reported to promote the uptake of Ca2+ by tobacco BY-2 cells, increase cytoplasmic Ca2+ concentrations in Arabidopsis roots, and enhance the Ca content in red orange leaves [22,59,60]. It is worth noting that B deficiency can change the content of multiple elements in citrus leaves and roots, notably causing a significant reduction in Mn content [22].
In recent years, the application of B fertilizer has been adopted by citrus growers and researchers to alleviate CSV symptoms. While such treatments have improved the nutritional status of trees and partially reduced symptom severity, CSV remains an unresolved issue under field conditions. Field observations indicated that CSV symptoms were more severe in orchards co-deficient in B and Mn (an essential nutrients involved in photosynthesis). Building on these findings, the present study employed ‘Newhall’ navel orange, a cultivar highly susceptible to CSV, to elucidate how Mn deficiency exacerbates B-deficiency-induced CSV. Through integrated physiological, biochemical, and molecular analyses—including assessments of symptom severity, photosynthetic performance, accumulation of photosynthetic products, activities of key metabolic enzymes, lignin content, and expression of lignin biosynthesis genes—we reveal the synergistic detrimental effects of combined B and Mn deficiency. Our results provide novel insights into the mechanisms underlying CSV development and offer a theoretical foundation for sustainable management strategies based on balanced nutrient regulation rather than B supplementation alone.

2. Materials and Methods

2.1. Plant Materials and Treatments

Two-year-old ‘Newhall’ navel orange [Citrus sinensis (L.) Osb. CV. Newhall] grafted onto trifoliate orange (Citrus trifoliata L.) rootstock was used in this experiment. Uniform size seedlings with relatively consistent growth were selected. Each seedling retains one scion stem; this scion stem was defined as old scion stem (OS) and the leaves on this scion stem were defined as old leaves (OLs). The residual substrate on the roots was washed with deionized water, and approximately one-third of the root system was pruned before transplanting into black plastic pots (8 L volume) filled with quartz sand: perlite (1:1, v/v). Each pot contained one plant, with four replicates per treatment. The seedlings were cultivated in a greenhouse with temperatures maintained at 22–28 °C and relative humidity at 50–75%. According to published method [8,61], one-week pretreatment with deionized water was conducted to acclimatize the plants to the sand culture system. The modified full-strength complete Hoagland’s No.2 nutrient solution contained: 6 mM KNO3, 4 mM Ca(NO3)2, 1 mM NH4H2PO4, 2 mM MgSO4, 50 μM Fe-EDTA, 25 μM H3BO3, 9 μM MnCl2, 0.8 μM ZnSO4, 0.3 μM CuSO4, and 0.01 μM H2MoO4.
The experiment set up three treatments and one control. Control (CK): Plants were cultivated with a 1/2-strength complete nutrient solution [8]; Boron deficiency (BD): 1/2-strength complete nutrient solution without H3BO3; Manganese deficiency (MnD): 1/2-strength complete nutrient solution without MnCl2, and KCl with the same molar concentration was added; Combined boron and manganese deficiency (BD + MnD): 1/2-strength complete nutrient solution without H3BO3 and MnCl2, supplemented with the same concentration of KCl. Based on the previous method, each pot was irrigated with nutrient solution twice a week, with 500 mL each time [8]. To prevent salt accumulation in the substrate, plants were irrigated with 10 L of deionized water every four weeks, ensuring that an excessive amount of solution drained out from the bottom of the pot [39]. The experiment started in December 2023 and ended in July 2024. At 10th weeks after treatment, two primary new scion stems (PNSs) were retained per plant, and their leaves were defined as primary new leaves (PLs). Similarly, at 21 weeks, two secondary new scion stems (SNSs) were retained on the primary new scion stems, and their leaves were designated as secondary new leaves (SLs).

2.2. Determination of Gas Exchange and Chlorophyll Fluorescence Parameters

The gas exchange parameters of ‘Newhall’ navel oranges leaves were determined at the 10th, 21st and 31st weeks of the experimental treatment, following the method described by Zhou et al. [37]. Measurements were conducted between 9:30 and 11:30 AM on a clear and cloudless day. The gas exchange parameter indicators net photosynthetic rate (Pn), transpiration rate (Tr), intercellular CO2 concentration (Ci), and stomatal conductance (Gs) were measured by portable photosynthesis measuring instrument (LI-6400XT, LI-COR, Lincoln, NE, USA) with the photosynthetic active radiation (PAR) set at 1000 μmol·m−2·s−1. OL was measured at the 10th, 21st, and 31st weeks, PL at the 21st and 31st weeks, and SL at the 31st week. For each plant, five leaves of each grade were selected for repeated measurement. After the data stabilized, the instantaneous gas exchange parameter values of each leaf were recorded five times.
After measuring the gas exchange parameters, the photochemical efficiency of the same leaves was determined using a Portable Pulse-Amplitude-Modulation Chlorophyll Fluorometer PAM-2500 (Heinz Walz GmbH, Effeltrich, BY, Germany), following the methods of Ling et al. [62] and Han et al. [35]. The leaves were dark-adapted for 30 min using a dark-adapted leaf clip. The optical fiber was then placed on the clip, and the ‘Fv/Fm’ button in the ‘Field Screen’ window was clicked. After one second, the maximal photochemical efficiency of PSII was measured. After the fluorescence value stabilized (approximately 2 min), ‘Y(II)’ button was clicked to measure the actual photochemical efficiency and other chlorophyll fluorescence parameters under the corresponding light intensity.

2.3. Determination of Chlorophyll Content

The determination of photosynthetic pigment (chlorophyll a and chlorophyll b) contents in leaves (OL, PL, and SL) was conducted following the method described by Zhou et al. [22]. The leaves were washed clean with deionized water, and the veins were removed. Fresh leaf samples (0.10 g) were taken and ground into a homogenate in a mortar with a small amount of quartz sand and 95% ethanol until the tissue turned white. The homogenate was then transferred and filtered into a 25 mL brown volumetric flask. A rubber-tipped dropper was used to rinse the residual debris in the mortar several times with a small amount of 85% acetone. The solution was brought to volume and thoroughly mixed. Samples were measured with a UV-1700 spectrophotometer (UV-1700, Shimadzu, Kyoto, Japan) at a wavelength of 663 and 644 nm, respectively. The concentration of chlorophyll a and b, in milligrams per gram of FW tissue, was calculated based on previous research [22].

2.4. Measurement of Plant Growth Parameters, Mineral Nutrient Concentrations, and Lignin Contents

After 31 weeks of treatment, all ‘Newhall’ navel orange seedlings were harvested and blotted with tissue paper. The plant height (cm) was measured using a scaled ruler. Then, the collected materials were divided into leaf (OL, PL, and SL), stem and root tissues. The fresh tissue materials were placed into a forced air oven at 105 °C for 15 min and then maintained at 75 °C until constant dry weights (g) were reached. All dried samples were then ground into fine powder for the determination of the mineral nutrient concentrations. The macro- and micro-nutrient concentrations of P, potassium (K), Ca, Mg, iron (Fe), Mn, B, Zn, copper (Cu) and molybdenum (Mo) in the leaves, stems, and roots of ‘Newhall’ navel orange plants were determined following the method described by Zhou et al. [61]. Briefly, 0.20 g of each sample was dry-ashed in a muffle furnace at 550 °C for 6 h, followed by dissolution in 5% HNO3. Suitable dilutions were subsequently made for the determination of various mineral concentrations. Each sample was measured three times repeatedly. The mineral nutrient concentrations were then determined using an Inductively Coupled Plasma Mass Spectrometry ICP-MS 7900 (Agilent Technologies Inc., Santa Clara, CA, USA).
For N analysis, the H2SO4-H2O2 digestion method was employed. Briefly, 0.30 g of each dried sample (in triplicate) was weighed into a 50 mL digestion tube. Then, 5 mL of concentrated sulfuric acid (H2SO4) was added, and the mixture was shaken and left to stand overnight. The digestion process was carried out on an electric heating plate with gradual temperature increase to 300 °C. After brief cooling, 10–20 drops of H2O2 solution were added intermittently, and the tube was returned to the heating plate. This step was repeated several times until the solution turned clear. After cooling, the digest was diluted to 50 mL with ultrapure water and filtered. Finally, the N content was determined using a fully automated discrete chemical analyzer Smartchem 200 (Alliance Instruments Inc., Villebon-sur-Yvette, Essonne, France).
The lignin contents in ‘Newhall’ navel oranges leaves (OL, PL, and SL) were determined following the method described by Xiong et al. [63], using a 72% concentrated sulfuric acid (H2SO4) hydrolysis approach. For each treatment group, four biological replicates were prepared per leaf type, with three technical replicates performed for each biological replicate.

2.5. Determination of Fructose, Sucrose and Starch Contents

After 31 weeks of experimental treatment, samples of leaves (OL, PL, and SL) of ‘Newhall’ navel oranges of different grades were collected during sunny weather between 9:30 and 11:30 AM. The determination of fructose, sucrose, and starch content in the leaves was performed following the instructions of their respective assay kits. In brief, 0.10 g of ground freeze-dried leaf sample was weighed, and the extraction of fructose, sucrose, and starch was conducted according to the protocols of the respective assay kits (Enzyme-linked Biotechnology, Shanghai, China). Samples were measured with a UV-1700 spectrophotometer (Shimadzu Corp., Nakagyo-ku, Kyoto, Japan) at a wavelength of 480 nm, 480 nm, and 620 nm, respectively. The contents of fructose, sucrose, and starch (mg·kg−1, dry weight) were then calculated based on standard curves.

2.6. Measurement of Enzyme Activity Related to Photosynthesis

At the 31st week of treatment, leaf samples (OL, PL, and SL) of ‘Newhall’ navel oranges were collected between 9:30 and 11:30 AM on clear days. The samples were immediately frozen in liquid nitrogen and stored at −80 °C. Prior to analysis, the samples were ground into powder on ice. The activities of ribulose-1,5-bisphosphate carboxylase/oxygenase (Rubisco), Rubisco activase (RCA), fructose-1,6-bisphosphatase (FBPase), sedoheptulose-1,7-bisphosphatase (SBPase), fructose-1,6-bisphosphate aldolase (FBA), and transketolase (TK) were determined using ELISA kits (Enzyme-linked Biotechnology, Shanghai, China) following the manufacturer’s instructions with slight modifications. Briefly, 0.10 g of sample was homogenized in 1 mL of 0.1 mol/L phosphate buffer, and the homogenate was centrifuged at 4500 r·min−1 for 20 min at 4 °C. The supernatant was collected for subsequent analysis. Enzyme activities were measured using a Spark Multimode Microplate Reader (Tecan Trading AG, Männedorf, Switzerland). Key enzyme activities in photosynthetic product synthesis were also carried out. The neutral invertase (NI), acid invertase (AI), sucrose synthetase (SS), and sucrose phosphate synthase (SPS) were measured using an Enzyme-linked Immunosorbent Assay (ELISA) kit following the manufacturer’s instructions (Enzyme-linked Biotechnology, Shanghai, China) and a Spark Multimode Microplate Reader.

2.7. Expression Analysis of Key Enzyme Genes Involved in Lignin Biosynthesis

According to the method of Zhou et al. [8], the expression patterns of key lignin biosynthesis enzyme genes in leaves of different grades from ‘Newhall’ navel oranges subjected to different treatments was conducted. Quantitative real-time PCR (qRT-PCR) primers for the lignin pathway genes and the internal reference gene (β-actin) are shown in Supporting Information Table S1. Differences in gene expression, expressed as fold change relative to control, were calculated using the 2−ΔΔCT method. Each measurement was performed four times by using independently prepared RNA/cDNA templates, and the error bars represent the SE of the mean fold-change in the four replicates.

2.8. Experimental Design and Statistical Analysis

The experiment was set up in a completely randomized 2 × 2 factorial design with two B concentrations (0 and 20 μmol L−1 B) and two Mn concentrations (0 and 9 μmol L−1 Mn). Unless otherwise specified, the data in the chart represents the average ± standard error of four individual plants (repetitions). The data underwent analysis of variance (ANOVA) in SAS software SAS 8.1 (SAS Institute Inc., Cary, NC, USA), and the differences were compared using Duncan’s test with a significance level of p < 0.05. The data distribution of each experimental group approximates a normal distribution, and the homogeneity of variance meets the requirements for further ANOVA. Microsoft Office Excel 2010 (Microsoft Corp., Redmond, WA, USA) was employed for basic statistics. Graphs were prepared using SigmaPlot 12.5 (Systat Softwares, San Jose, CA, USA) and OriginPro 8.0 (Origin Lab, Northampton, MA, USA).

3. Results

3.1. Visible Symptoms and Plant Growth

After 31 weeks of treatment, symptoms were visible on ‘Newhall’ navel orange plants in the BD, MnD, and BD + MnD treatment groups. Compared with the CK group, the SLs of the plants in the BD treatment group exhibited typical CSV symptoms in parallel with slight leaf yellowing; the SLs of the plants in the MnD treatment group showed interveinal chlorosis, but no CSV symptoms were observed. The SLs of the plants in the BD + MnD treatment group presented more severe CSV compared with the BD treatment group, as well as significantly curled leaf tips. BD-treated plants exhibited slight CSV on the tips of the OLs, and these leaves curled up. BD + MnD treated plants displayed CSV on OLs. The OLs of plants in the MnD treatment group did not display CSV. Compared with the CK group, the BD and BD + MnD treatments significantly inhibited the growth and development of root systems, while the MnD treatment had a lesser inhibitory effect on the root system (Figure 1). Compared with the CK, all three nutrient deficiency treatments significantly decreased the plant height, stem dry matter weight, and total dry matter weight. The BD and BD + MnD treatments exerted a significantly stronger effect on plant height than the MnD treatment; the BD and BD + MnD treatments significantly decreased leaf and root dry weight, while the MnD treatment did not show a significant effect; and the BD and BD + MnD treatments significantly increased the root: shoot ratio, while the MnD treatment did not have a significant impact (Table 1).

3.2. Mineral Nutrient Concentrations

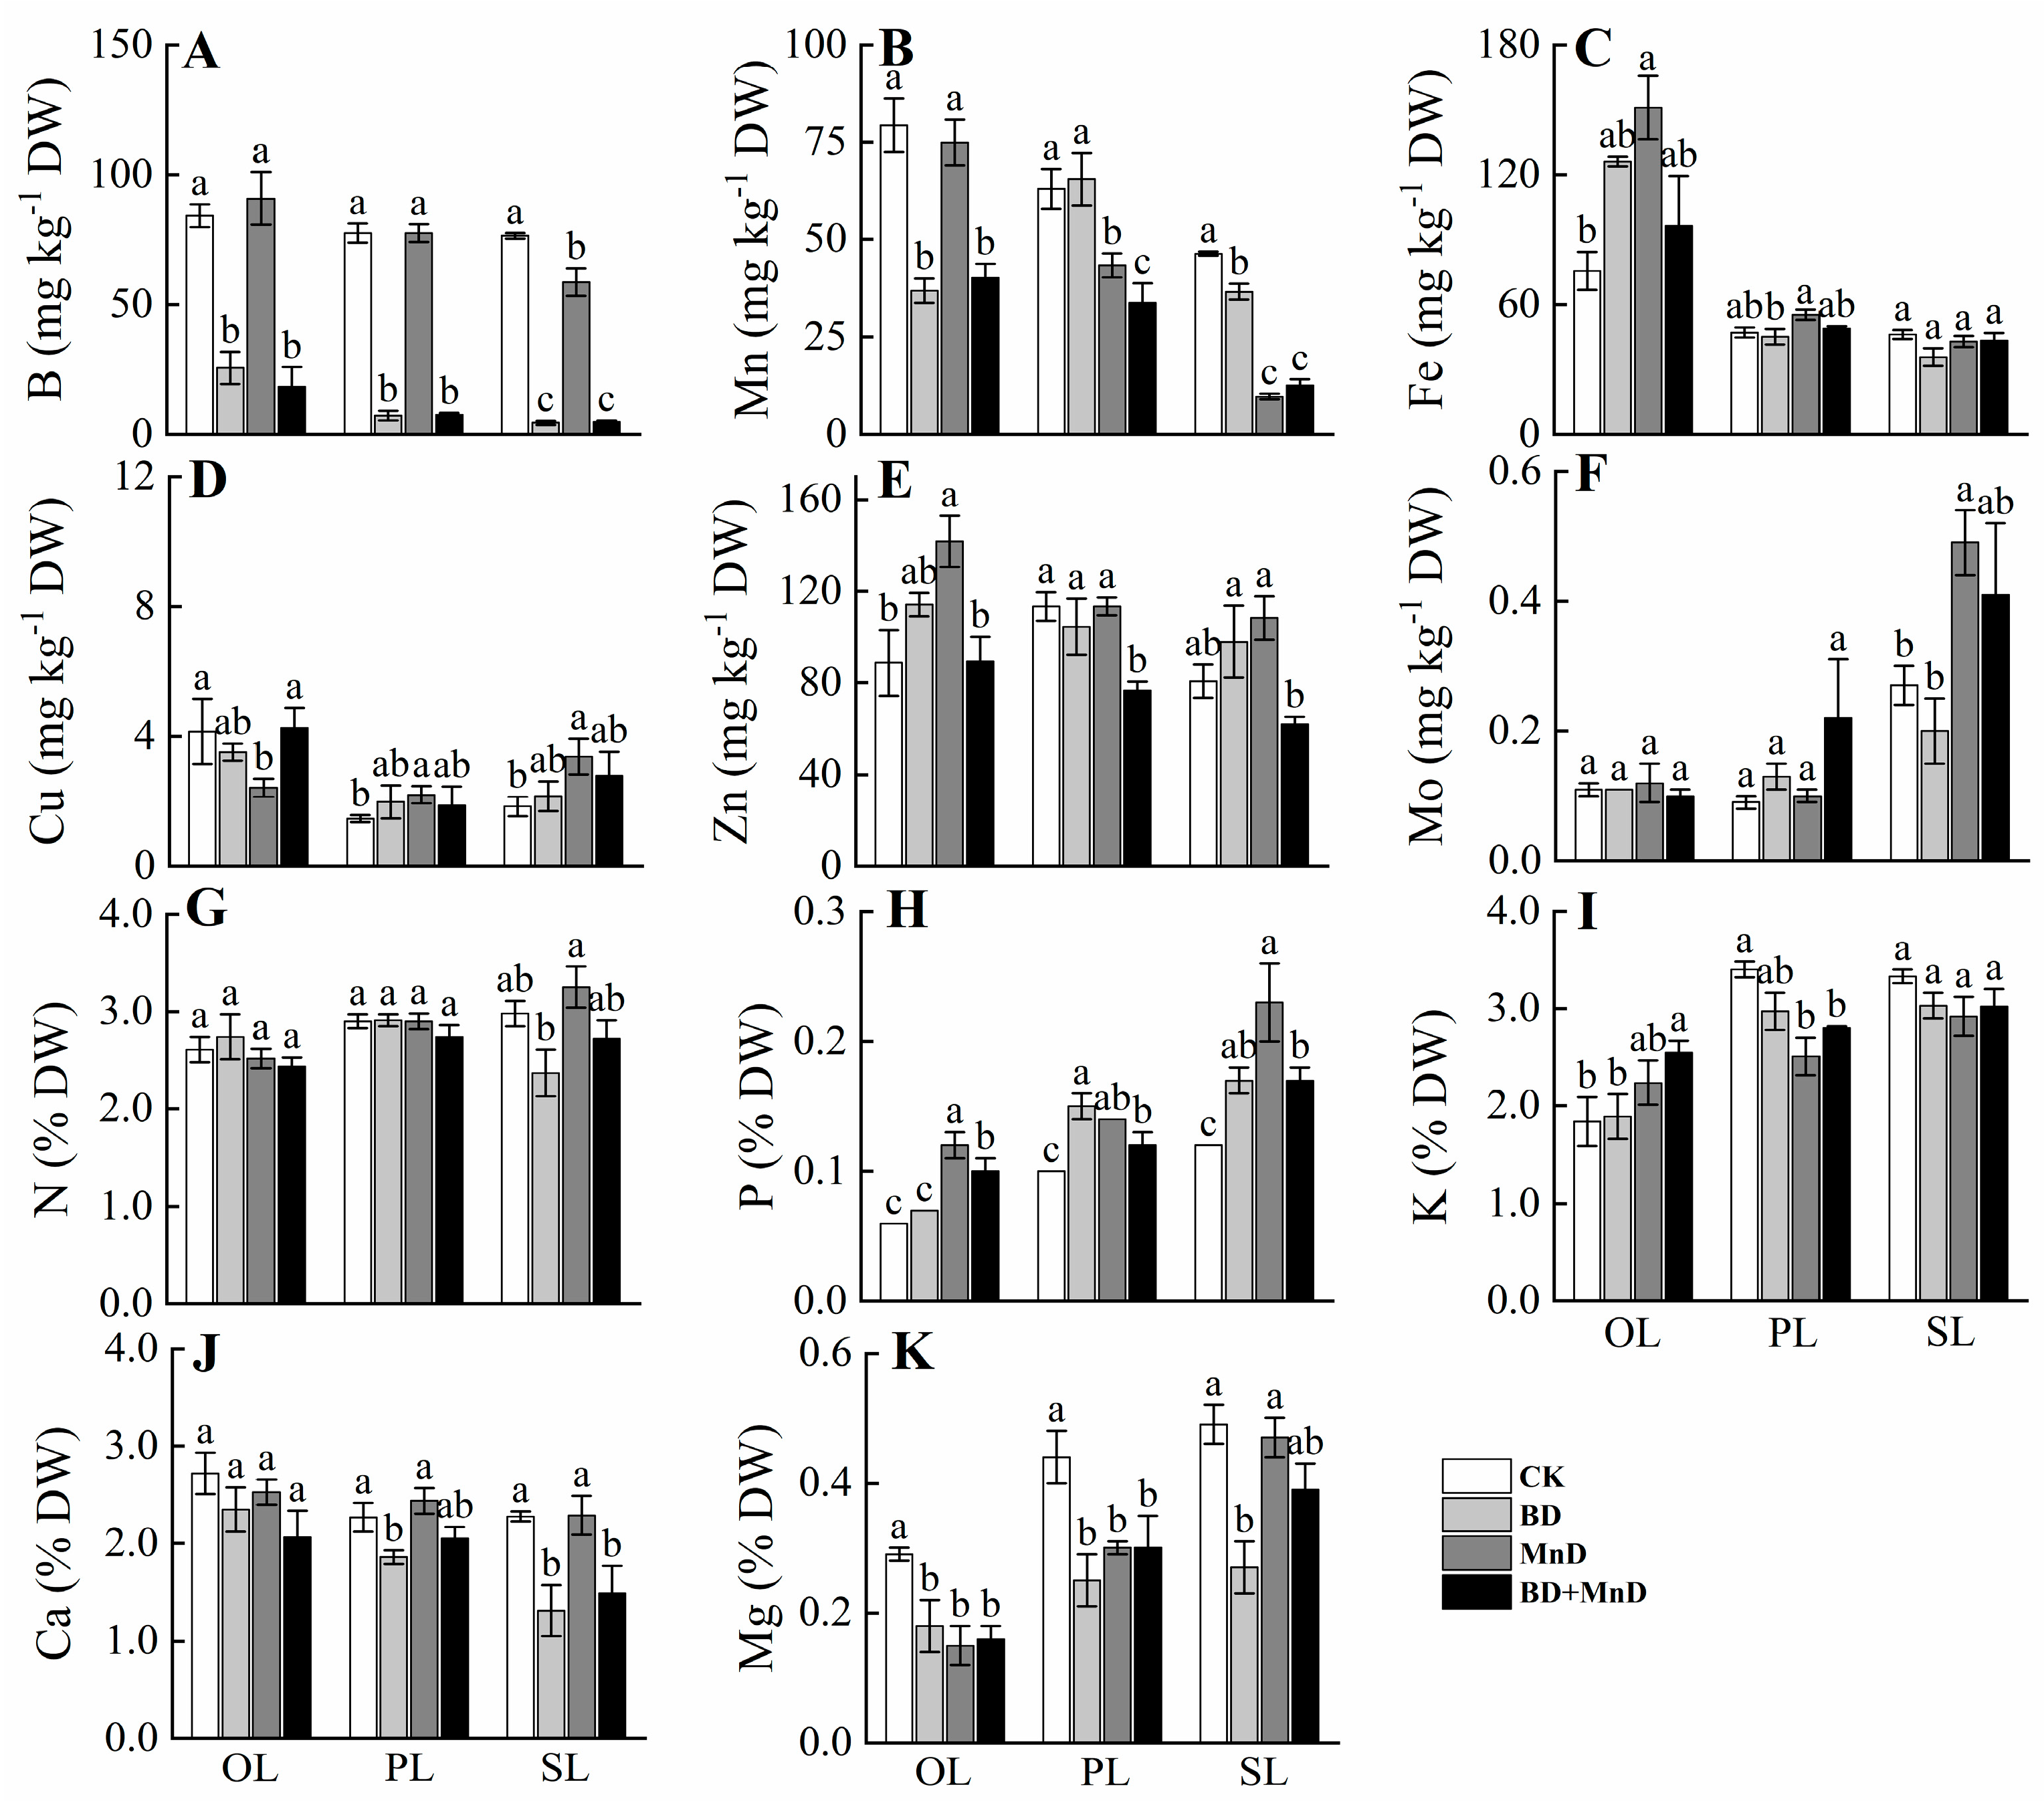
Compared with the CK group, the BD and BD + MnD treatments significantly decreased B concentrations in OLs, PLs, and SLs of ‘Newhall’ navel orange seedlings, and in all types of leaves the differences in B concentrations between the BD and BD + MnD treatment groups were non-significant. The MnD treatment significantly decreased B concentrations in SLs but did not affect the B concentrations in OLs and PLs. Except for the OLs in the MnD treatment group, the Mn concentrations in the OLs, PLs, and SLs in the MnD and BD + MnD treatment groups significantly decreased compared with the CK group, and the Mn concentrations in the OLs and PLs in the BD + MnD treatment group were significantly lower than that in the MnD treatment group. In addition, the BD treatment significantly decreased Mn concentrations in OLs and SLs. For other micronutrients, Fe significantly increased only in the OLs in the MnD treatment group. The concentration of Cu significantly decreased in the OLs in the MnD treatment group and significantly increased in PLs and SLs. Zn was significantly elevated in the OLs in the MnD treatment group compared with the CK group and significantly decreased in the PLs in the BD + MnD treatment group. The Mo concentration significantly increased only in the SLs in the MnD treatment group compared with the CK group. It is worth noting that the differences in Fe, Cu, and Mo concentrations in all types of leaves between the BD and BD + MnD treatment groups were non-significant. The Zn concentrations in PLs and SLs were significantly lower in the BD + MnD treatment group than those in the BD treatment group. For macronutrients, none of the three treatments significantly affected the N concentrations in all types of leaves compared with the CK group. Except for the OLs in the BD treatment group, the P concentrations in all types of leaves in all three treatment groups were significantly increased compared with the CK group. The K concentration significantly increased in the OLs in the BD + MnD treatment group and significantly decreased in the PLs in the MnD and BD + MnD treatment groups compared with that in the CK group. The Ca concentrations in the PLs and SLs of the BD treatment group and in the SLs of the BD + MnD treatment group significantly decreased compared with the CK group. The Mg concentrations in the OLs and PLs in all treatment groups and in the SLs in the BD treatment group significantly decreased compared with the CK group (Figure 2).
The mineral nutrient concentrations in the stems and roots of ‘Newhall’ navel orange seedlings were also determined (Figures S1 and S2). The results indicated that the BD and BD + MnD treatments significantly decreased B concentrations in all types of stems, and the MnD treatment significantly increased B concentrations in OSs and SNSs compared with the CK treatment. Compared with the BD treatment, the BD + MnD treatment did not decrease B concentration farther, and the B concentration was even increased in OSs and PNSs. Except for the OSs in the BD treatment, the Mn concentrations in all types of shoots in all treatment groups significantly decreased compared with the CK group. The B concentrations in the primary and lateral roots in the BD and BD + MnD treatment groups were significantly lower than those in the CK and MnD treatment group, and B was also significantly decreased in the lateral roots in the MnD treatment group. The MnD and BD + MnD treatments significantly decreased the Mn concentration of lateral roots but had no significant impact on primary roots.

3.3. Gas Exchange Parameters and Photosynthetic Pigment Content

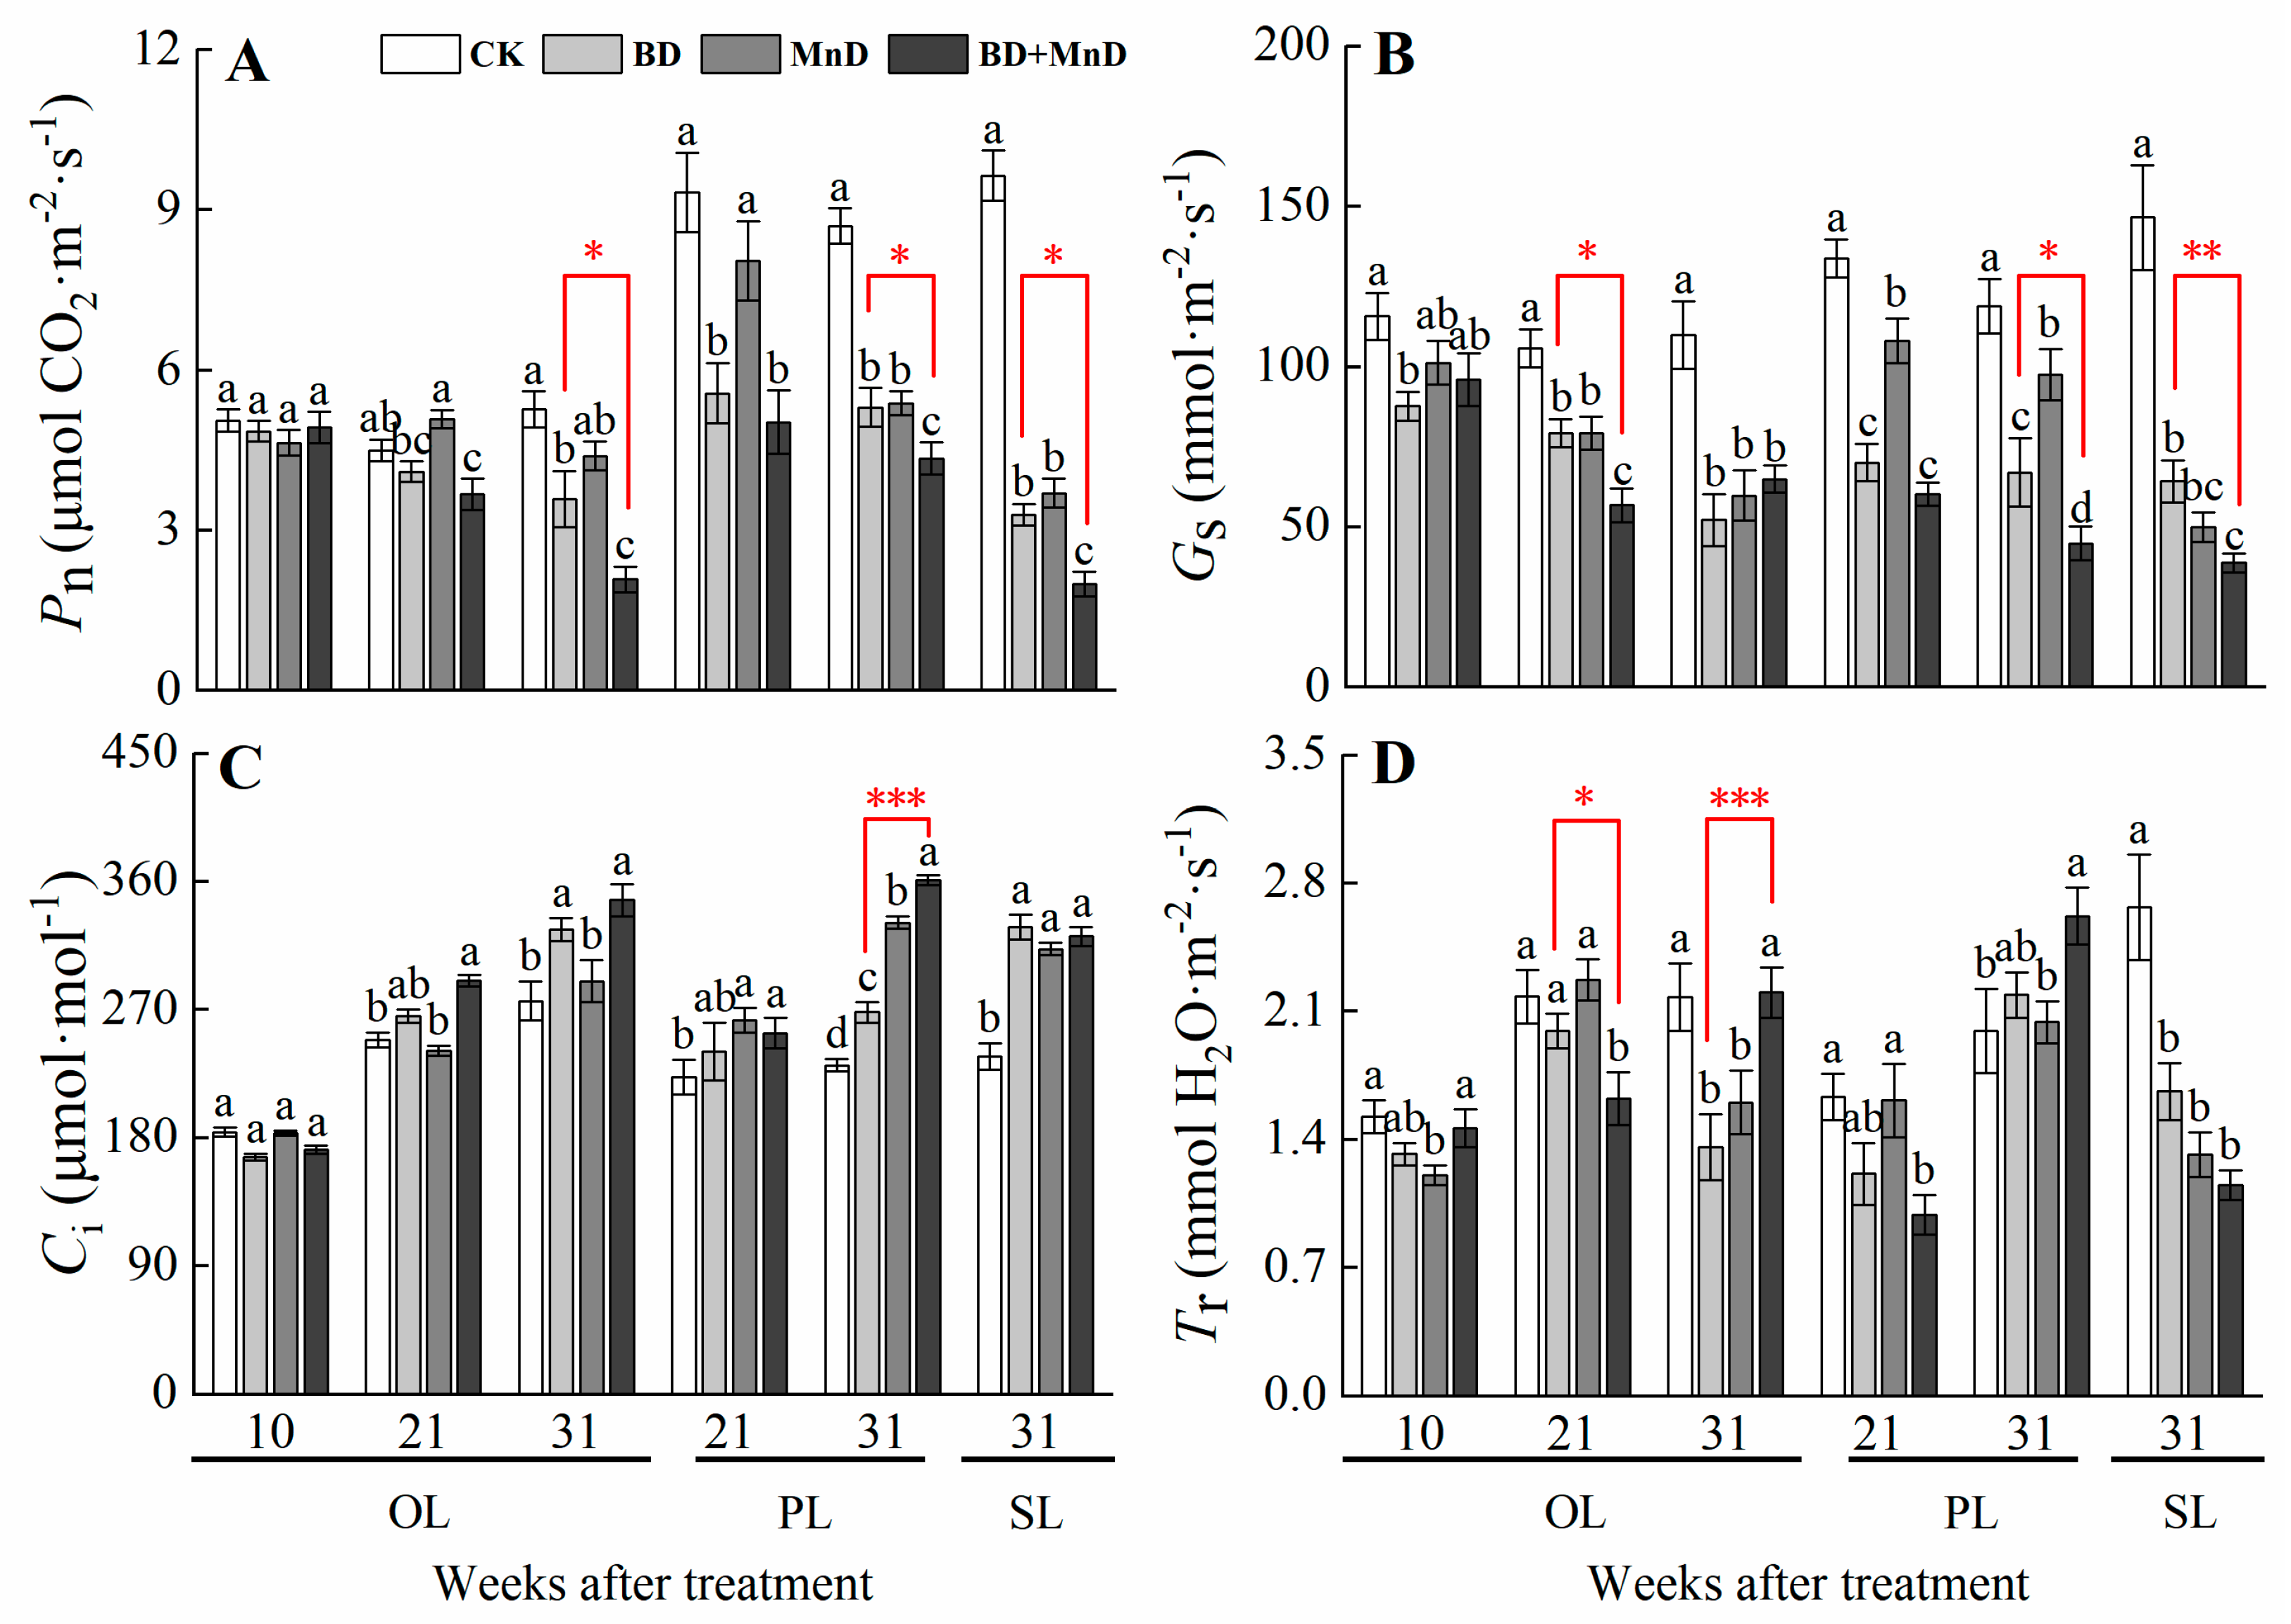
As shown in Figure 3, the Pn value of the OLs of ‘Newhall’ navel orange in the BD and BD + MnD treatment groups declined as the treatment duration increased compared with the CK group, and this increase became significant in the 21st and 31st weeks of treatment. In contrast, the MnD treatment had no significant effect on the Pn value of OLs. The Pn values of PLs in the BD and BD + MnD treatment groups significantly decreased in the 21st and 31st weeks of treatment, while a significant decrease in the Pn value of PLs in the MnD treatment group presented only in the 31st week of treatment. The Pn values of SLs in all treatment groups significantly decreased in the 31st week of treatment. It is worth noting that the Pn values of OLs, PLs, and SLs in the BD + MnD treatment group was significantly lower than that in the BD treatment group in the 31st week of treatment. Compared with the CK group, the MnD and BD + MnD treatments did not significantly affect the Gs value of OLs in the 10th week of treatment, but for all other types of leaves, treatment groups, and time points the Gs value significantly decreased. The Gs value of OLs in the 21st week and the Gs values of PLs and SLs in the 31st week of treatment were significantly lower in the BD + MnD treatment group than those in the BD treatment group. The Ci values of OLs in the 31st week of BD treatment and in the 21st and 31st week of BD + MnD treatment significantly increased compared with the CK group, and the differences in the Ci value of OLs between the BD and BD + MnD treatment groups were non-significant. Except for the 21st week of BD treatment, the Ci values of PLs and SLs in all treatment groups significantly increased, and the Ci value of PLs in the 31st week of treatment was significantly lower in the BD treatment group than that in the BD + MnD treatment group. The Tr values of OLs significantly decreased in the 31st week of BD treatment, in the 10th and 31st week of MnD treatment, and in the 21st week of BD + MnD treatment. The Tr value of PLs in the 21st week of BD + MnD treatment significantly decreased, whereas it significantly increased in the 31st week. The Tr value of SLs in the 31st week of all treatments significantly decreased.
After 31 weeks of treatment, the photosynthetic pigment contents of OLs, PLs, and SLs in ‘Newhall’ navel orange seedlings were measured (Table 2). The results revealed that Chl a, Chl b, and total chlorophyll contents displayed the same change trend. The Chl a, Chl b, and total chlorophyll contents of OLs were significantly reduced in the BD and BD + MnD treatment groups compared to the CK group, and were significantly lower in the BD + MnD treatment group than those in the BD treatment group. The Chl a, Chl b, and total chlorophyll contents of PLs were significantly lower in the MnD and BD + MnD treatment groups compared to those in the CK and BD groups, and the differences between the BD and CK groups were non-significant. The Chl a, Chl b, and total chlorophyll contents of SLs were significantly lower in all three treatment groups than those in the CK group, and the Chl b and total chlorophyll contents were significantly reduced in the BD + MnD treatment group compared to the BD group.

3.4. Chlorophyll Fluorescence Parameters

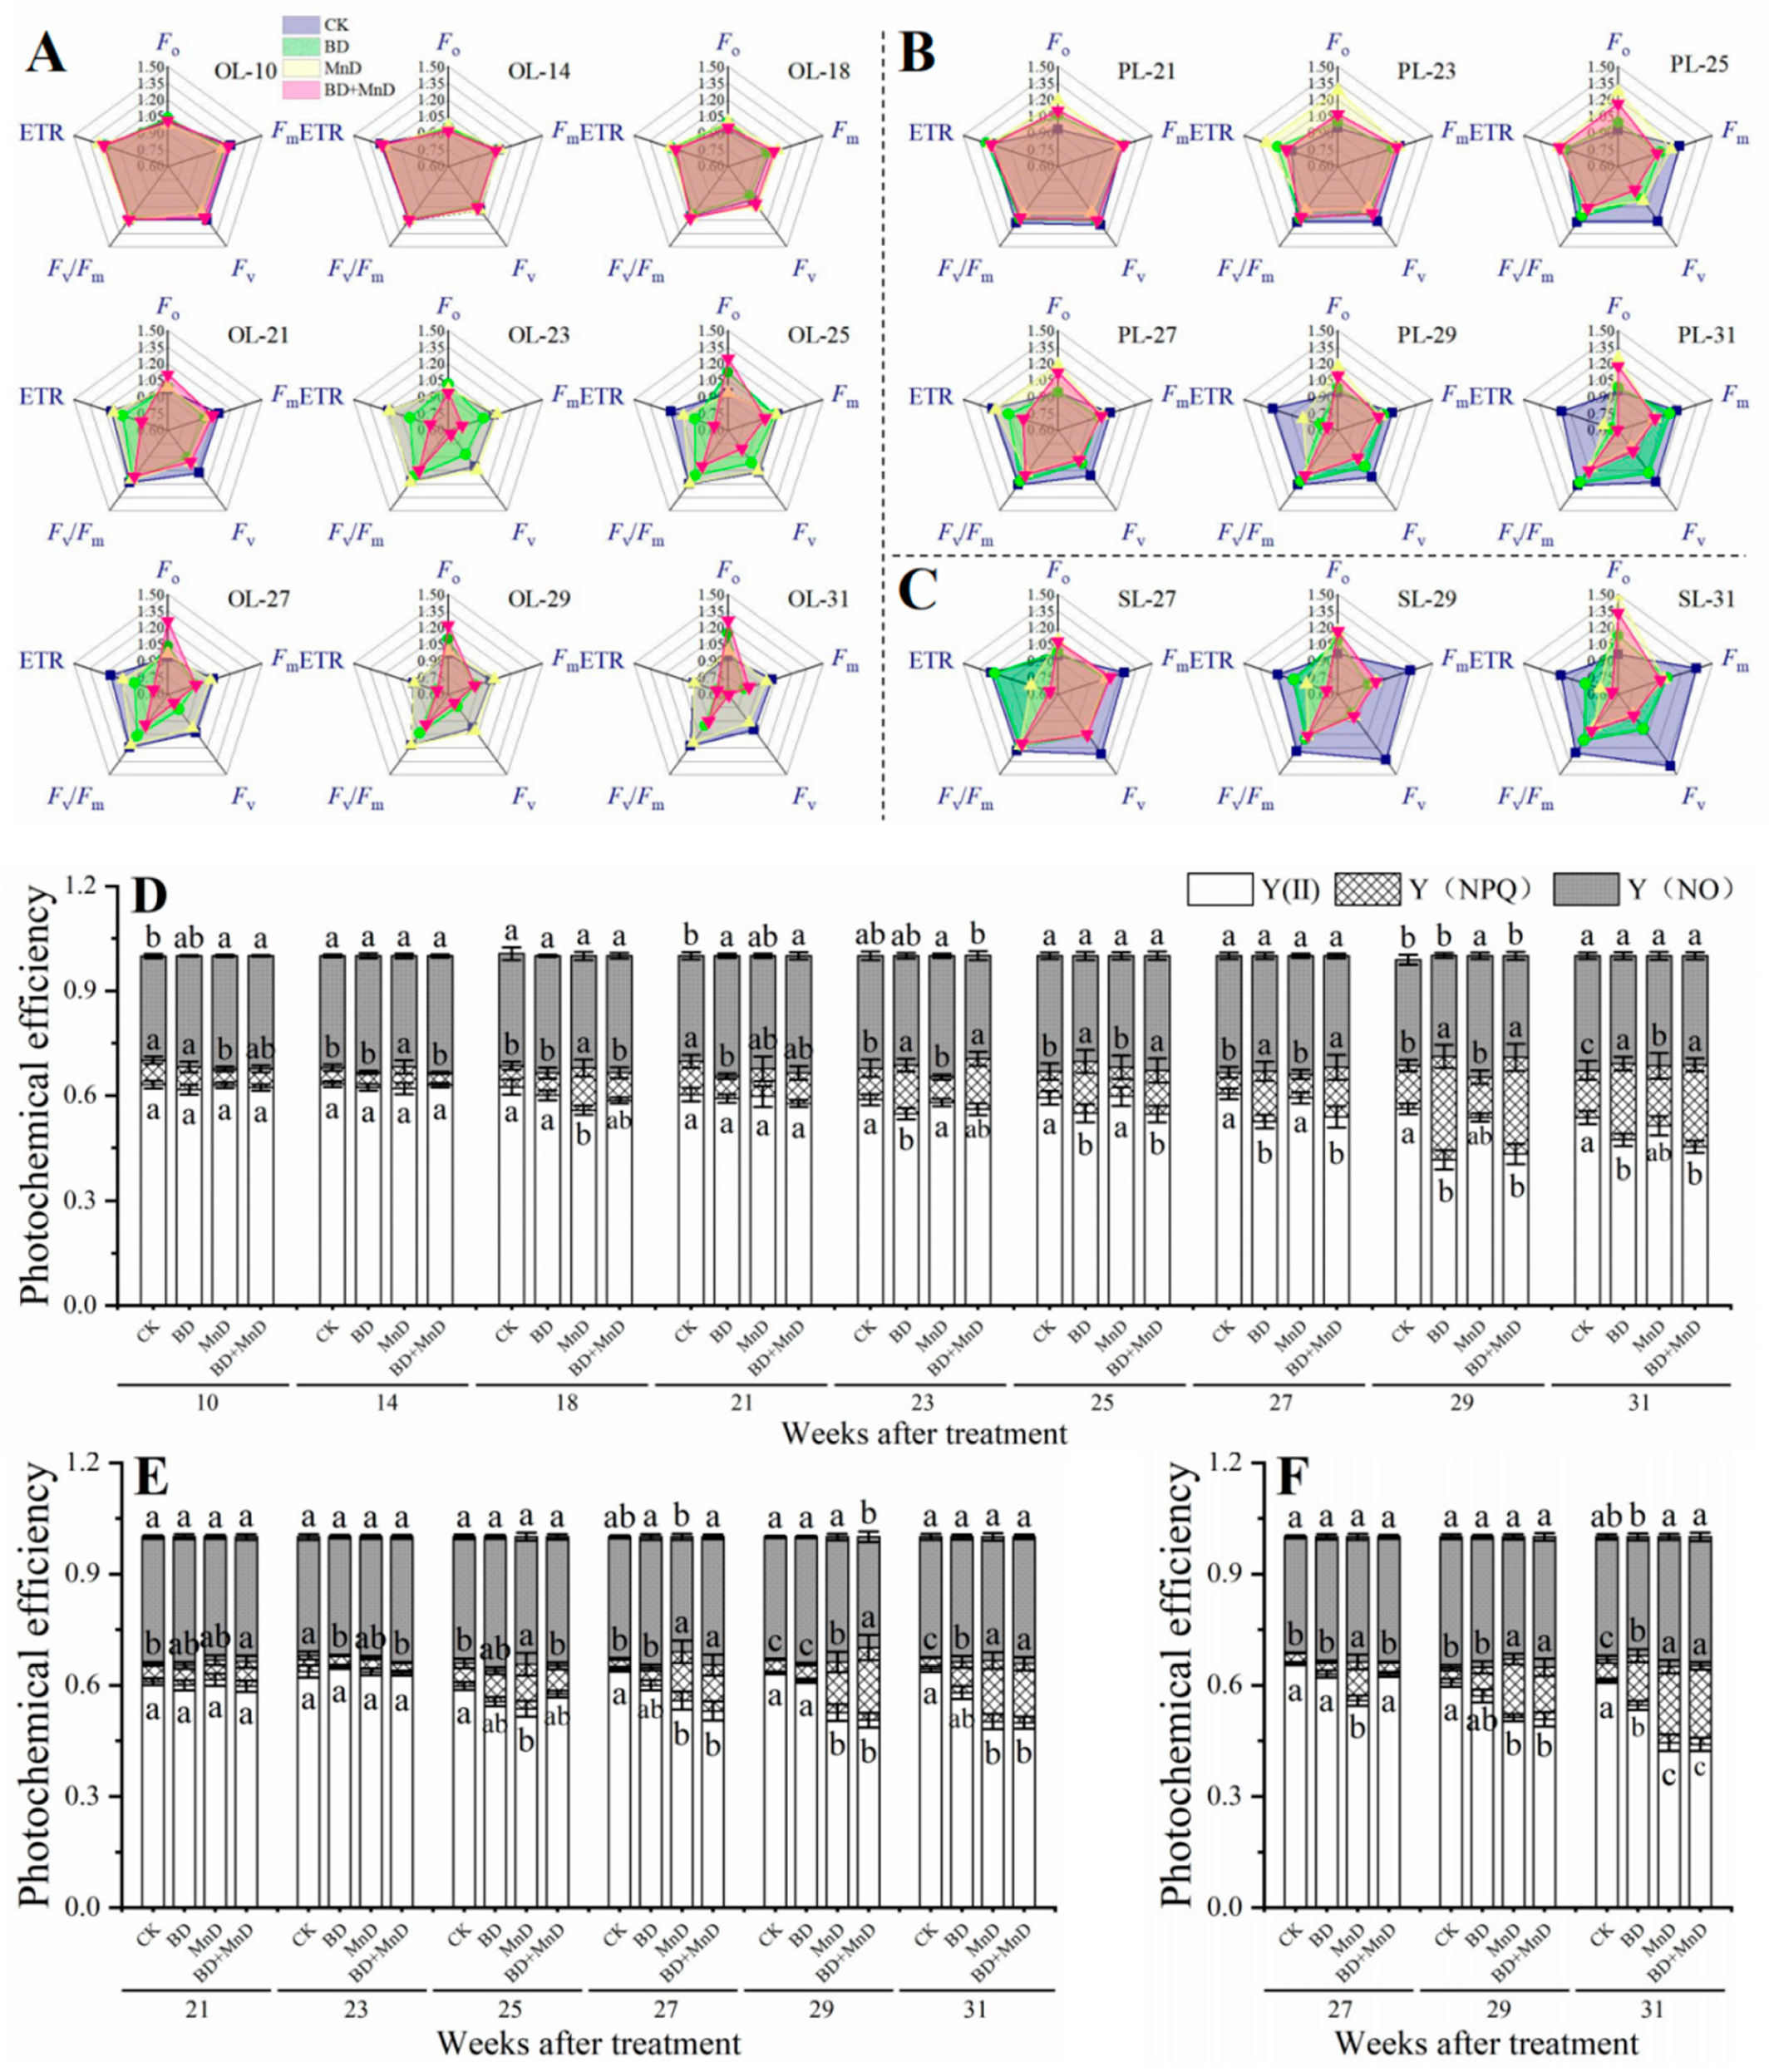
As shown in Figure 4 and Table S2, the chlorophyll fluorescence parameter minimal fluorescence (Fo) value of ‘Newhall’ navel orange began to increase in the 21st week of BD + MnD treatment and rose significantly in the 25th, 27th, 29th, and 31st weeks of treatment, while for the BD treatment the increase began in the 25th week and continued until the 31st week of treatment. The MnD treatment had no significant impact on the Fo value of OLs. For new leaves, except for the 21st week of the BD + MnD treatment, the Fo values of PLs and SLs at all treatment time points under the MnD and BD + MnD treatments were significantly elevated, while the BD treatment only significantly increased the Fo value of SLs in the 31st week. Compared with the BD treatment, the BD + MnD treatment significantly increased the Fo value of OLs in the 27th and 29th weeks, the Fo value of PLs in weeks 25–31, and the Fo value of SLs in the 27th and 31st weeks of treatment. In addition, the Fo values of OLs, PLs, and SLs began to decline 4 weeks earlier in the BD + MnD treatment group than those in the BD treatment group. The maximal fluorescence (Fm) value of OLs displayed a significant decreasing trend from the 21st week of BD treatment onward, apart from the 25th week, while the BD + MnD treatment showed a significant decrease starting in the 23rd week. The Fm value of PLs began to significantly decrease from the 25th week of the BD treatment onward, the 31st week of the MnD treatment onward, and in the 25th, 29th, and 31st weeks of the BD + MnD treatment. The Fm value of SLs significantly decreased in the 27th, 29th, and 31st weeks for all treatments. The variable fluorescence (Fv) and Fm values of ‘Newhall’ navel orange leaves, except for the PLs in the MnD treatment group, showed the same change trend in all treatment groups compared with that in the CK group. The Fv value of PLs significantly declined at all the time points under the MnD treatment. Compared with the CK group, the Fv/Fm value of OLs was significantly decreased in the 29th and 31st week under the BD treatment and in weeks 23–31 under the BD + MnD treatment. The Fv/Fm value of PLs significantly decreased in the 25th, 27th, 29th, and 31st weeks of the MnD treatment and in the 25th and 31st weeks of the BD + MnD treatment. The Fv/Fm values of SLs declined significantly in the 29th and 31st weeks of all treatments. Compared with the CK, the electron transport efficiency (ETR) values of OLs declined significantly in the 25th, 29th, and 31st weeks under the BD treatment and in weeks 21–31 under the BD + MnD treatment; the ETR values of PLs significantly decreased in the 29th and 31st weeks under the BD and MnD treatments and in weeks 27–31 under the BD + MnD treatment; and the ETR values of SL dropped significantly decreased in the 31st week of the BD treatment and in weeks 27–31 of the BD + MnD treatment. It is worth noting that the ETR values of OLs, PLs, and SLs decreased earlier in the BD + MnD treatment group than in the BD treatment group.
Compared with the CK group, the actual photochemical efficiency [Y(II)] values of OLs significantly decreased in weeks 23–31 under the BD treatment and in weeks 25–31 under the BD + MnD treatment; PLs displayed significantly reduced Y(II) values in weeks 25–31 of the MnD treatment and in weeks 27–31 of the BD + MnD treatment; and the Y(II) values of SLs dropped significantly in week 31 of the BD treatment, weeks 27–31 of the MnD treatment, and weeks 29–31 of the BD + MnD treatment. Interestingly, the Y(II) of PLs and SLs significantly decreased in the 29th and 31st weeks of the BD + MnD treatment, respectively. Compared with the CK group, the quantum yield of regulated energy dissipation [Y(NPQ)] values of OLs significantly declined in week 21 of the BD treatment and week 10 of the MnD treatment, whereas they significantly increased in weeks 23–31 of the BD and BD + MnD treatments and in weeks 14, 18, and 31 of the MnD treatment. In PLs, Y(NPQ) values significantly decreased in week 23 of the BD and BD + MnD treatments, while they significantly increased in week 31 of the BD treatment, weeks 25–31 of the MnD treatment, and weeks 21, 27, 29, and 31 of the BD + MnD treatment compared with the CK group. The Y(NPQ) values of SLs significantly increased in the 31st week under the BD treatment, in the 27th, 29th, and 31st weeks under the MnD treatment, and in the 29th and 31st weeks under the BD + MnD treatment compared with the CK group. The quantum yield of non-regulated energy dissipation [Y(NO)] values of OLs rose significantly in the 21st week of the BD treatment, the 10th and 29th weeks of the MnD treatment, and the 10th and 21st weeks of the BD + MnD treatment compared with the CK group. The Y(NO) values of PLs significantly declined in the 27th week of the MnD treatment and in the 29th week of the BD + MnD treatment compared with the CK (Figure 4D–F).

3.5. Leaf Photosynthetic Product Content and Related Enzyme Activity

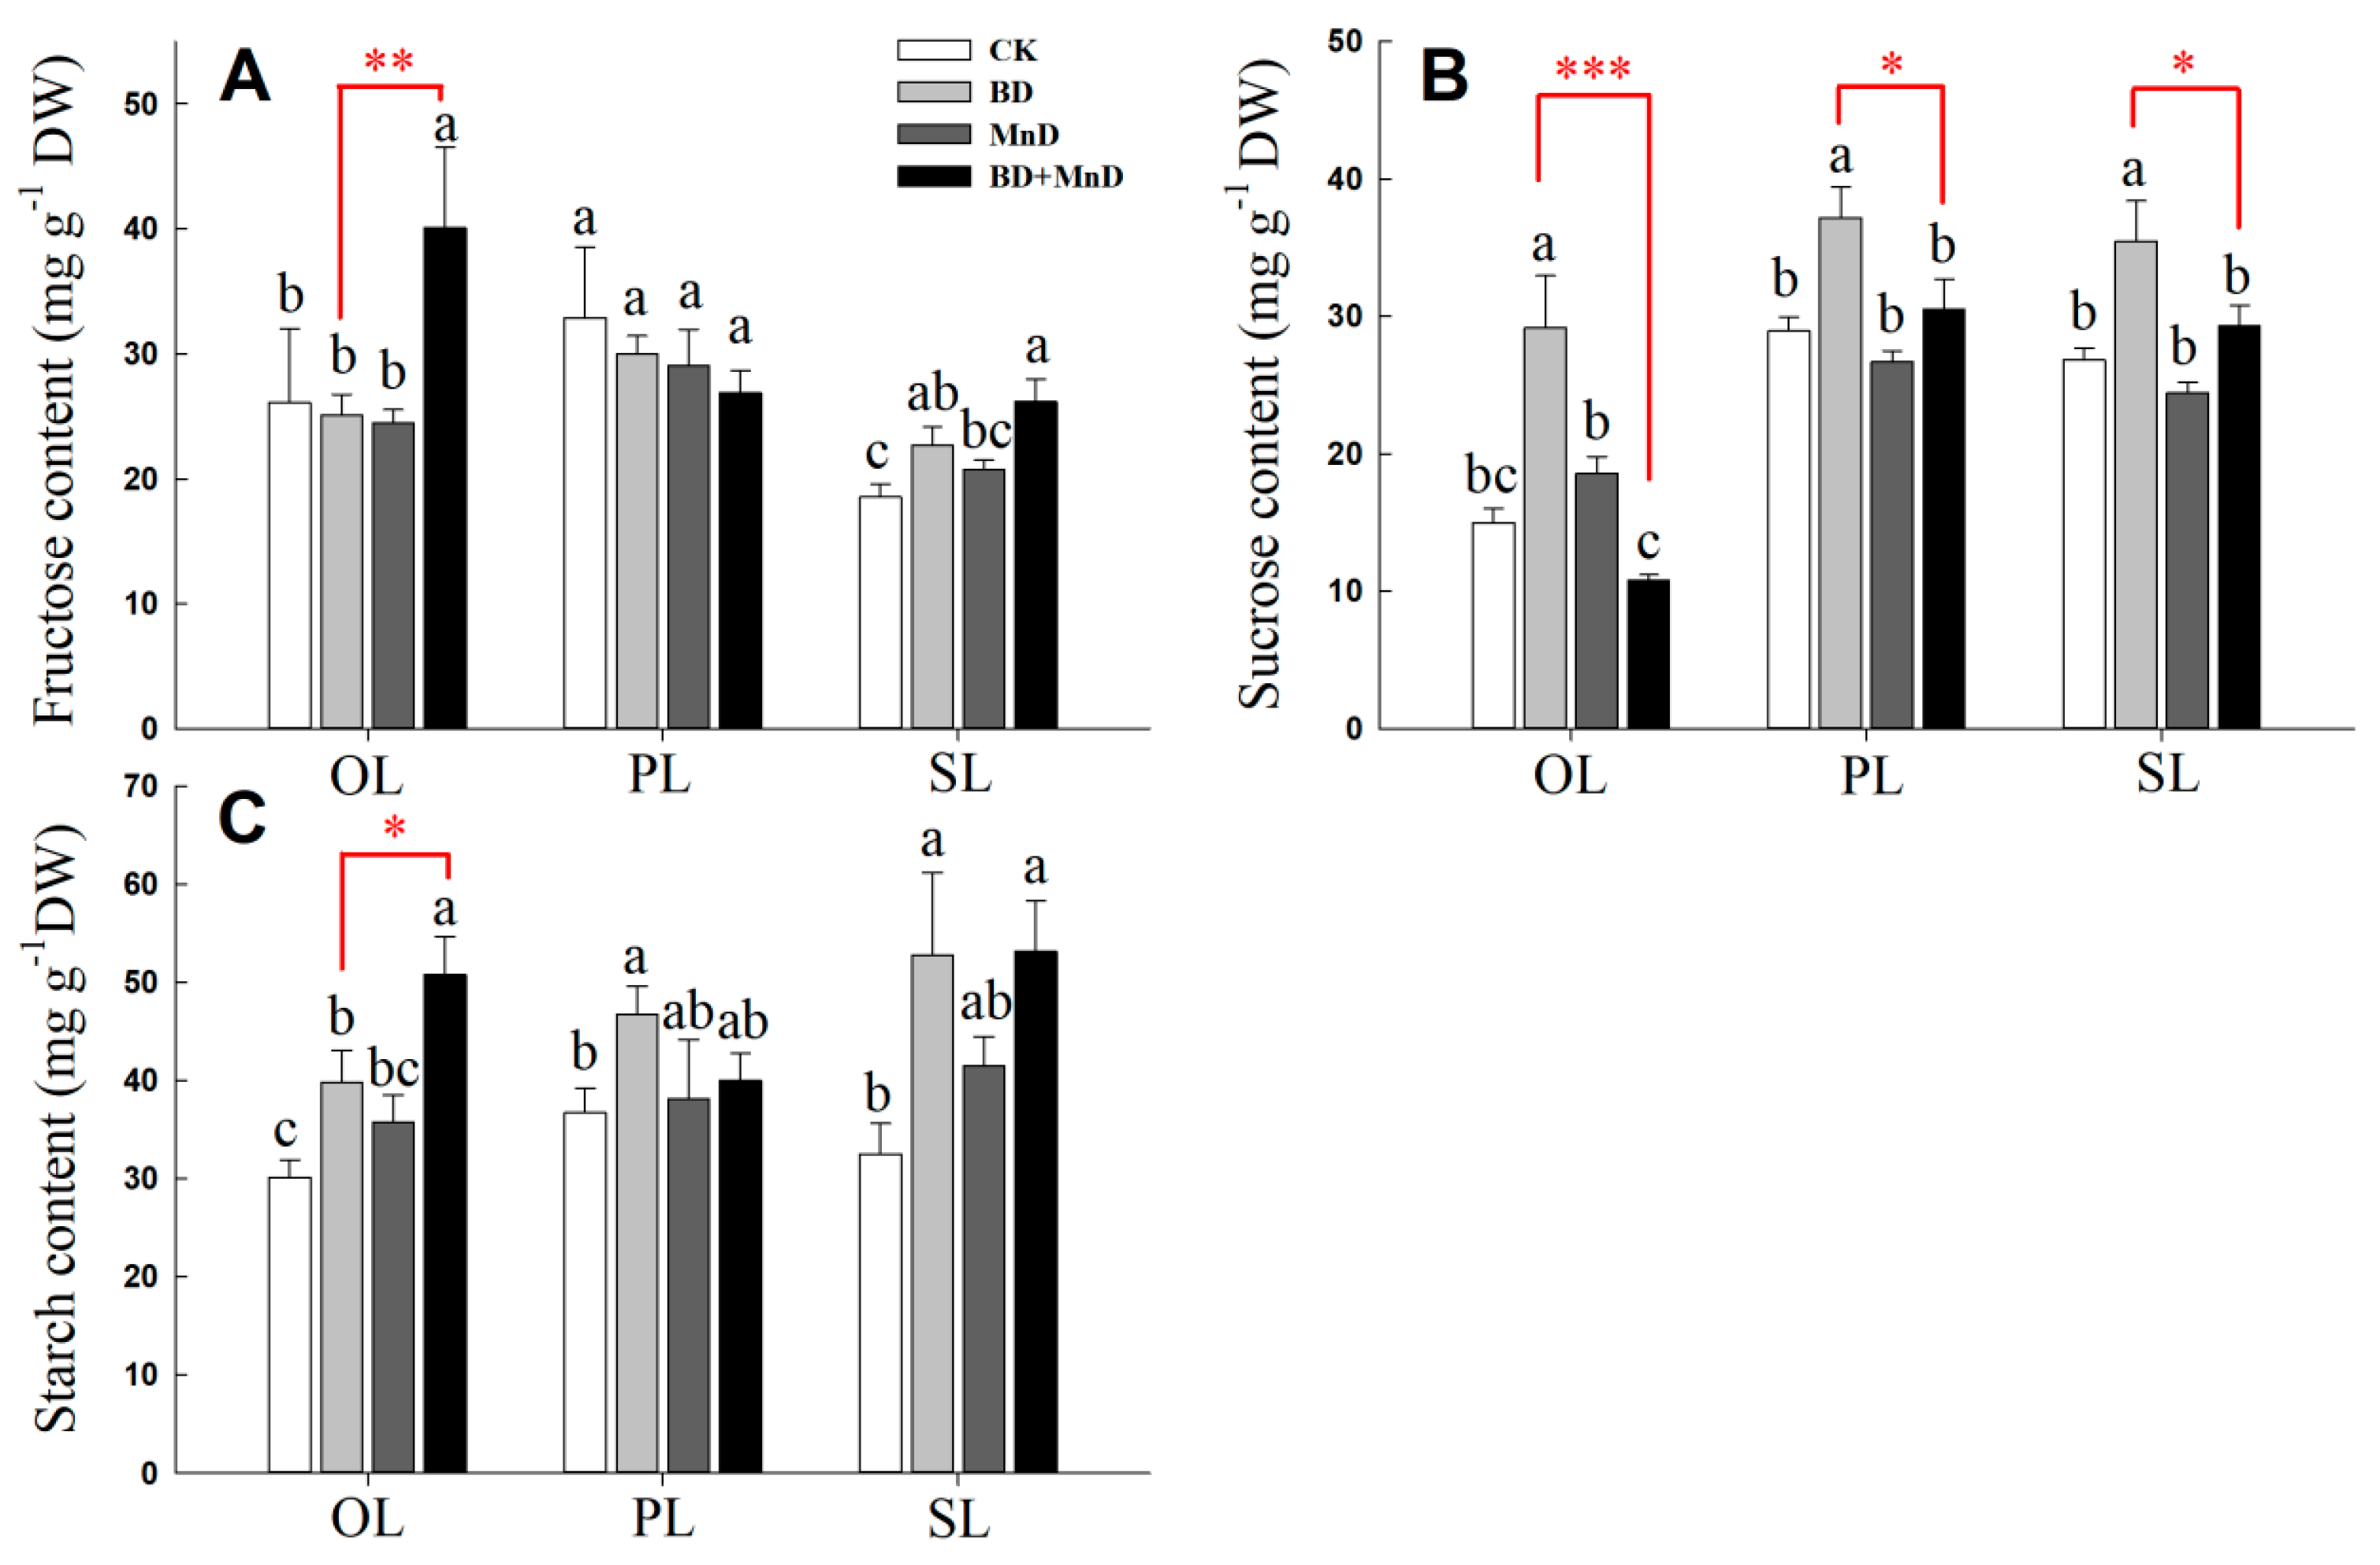
The BD treatment group displayed significantly enhanced fructose content in ‘Newhall’ navel orange SLs, while the BD + MnD treatment significantly increased the fructose contents of OLs and SLs. In contrast, the fructose contents of other treatment groups and leaf types did not exhibit significant differences compared with the CK group. Apart from the finding that the fructose content of OLs was higher in the BD + MnD group than that in the BD group, the difference in fructose content between the BD and BD + MnD treatment groups was not significant. Compared with the CK, the BD treatment significantly promoted the sucrose contents of OLs, PLs, and SLs, while the MnD and BD + MnD treatments did not exhibit significantly increased sucrose contents, and the sucrose content of OLs was decreased under the BD + MnD treatment. Notably, the sucrose contents of OLs, PLs, and SLs were significantly higher in the BD treatment group compared to the BD + MnD treatment group. Except for PLs in the BD + MnD treatment group, OLs, PLs, and SLs contained significantly elevated starch contents in the BD and BD + MnD treatment groups compared with then CK group, but in the MnD treatment group the differences in starch content between leaf types were non-significant. In addition, OLs showed higher starch content in the BD + MnD treatment than in the BD treatment (Figure 5).
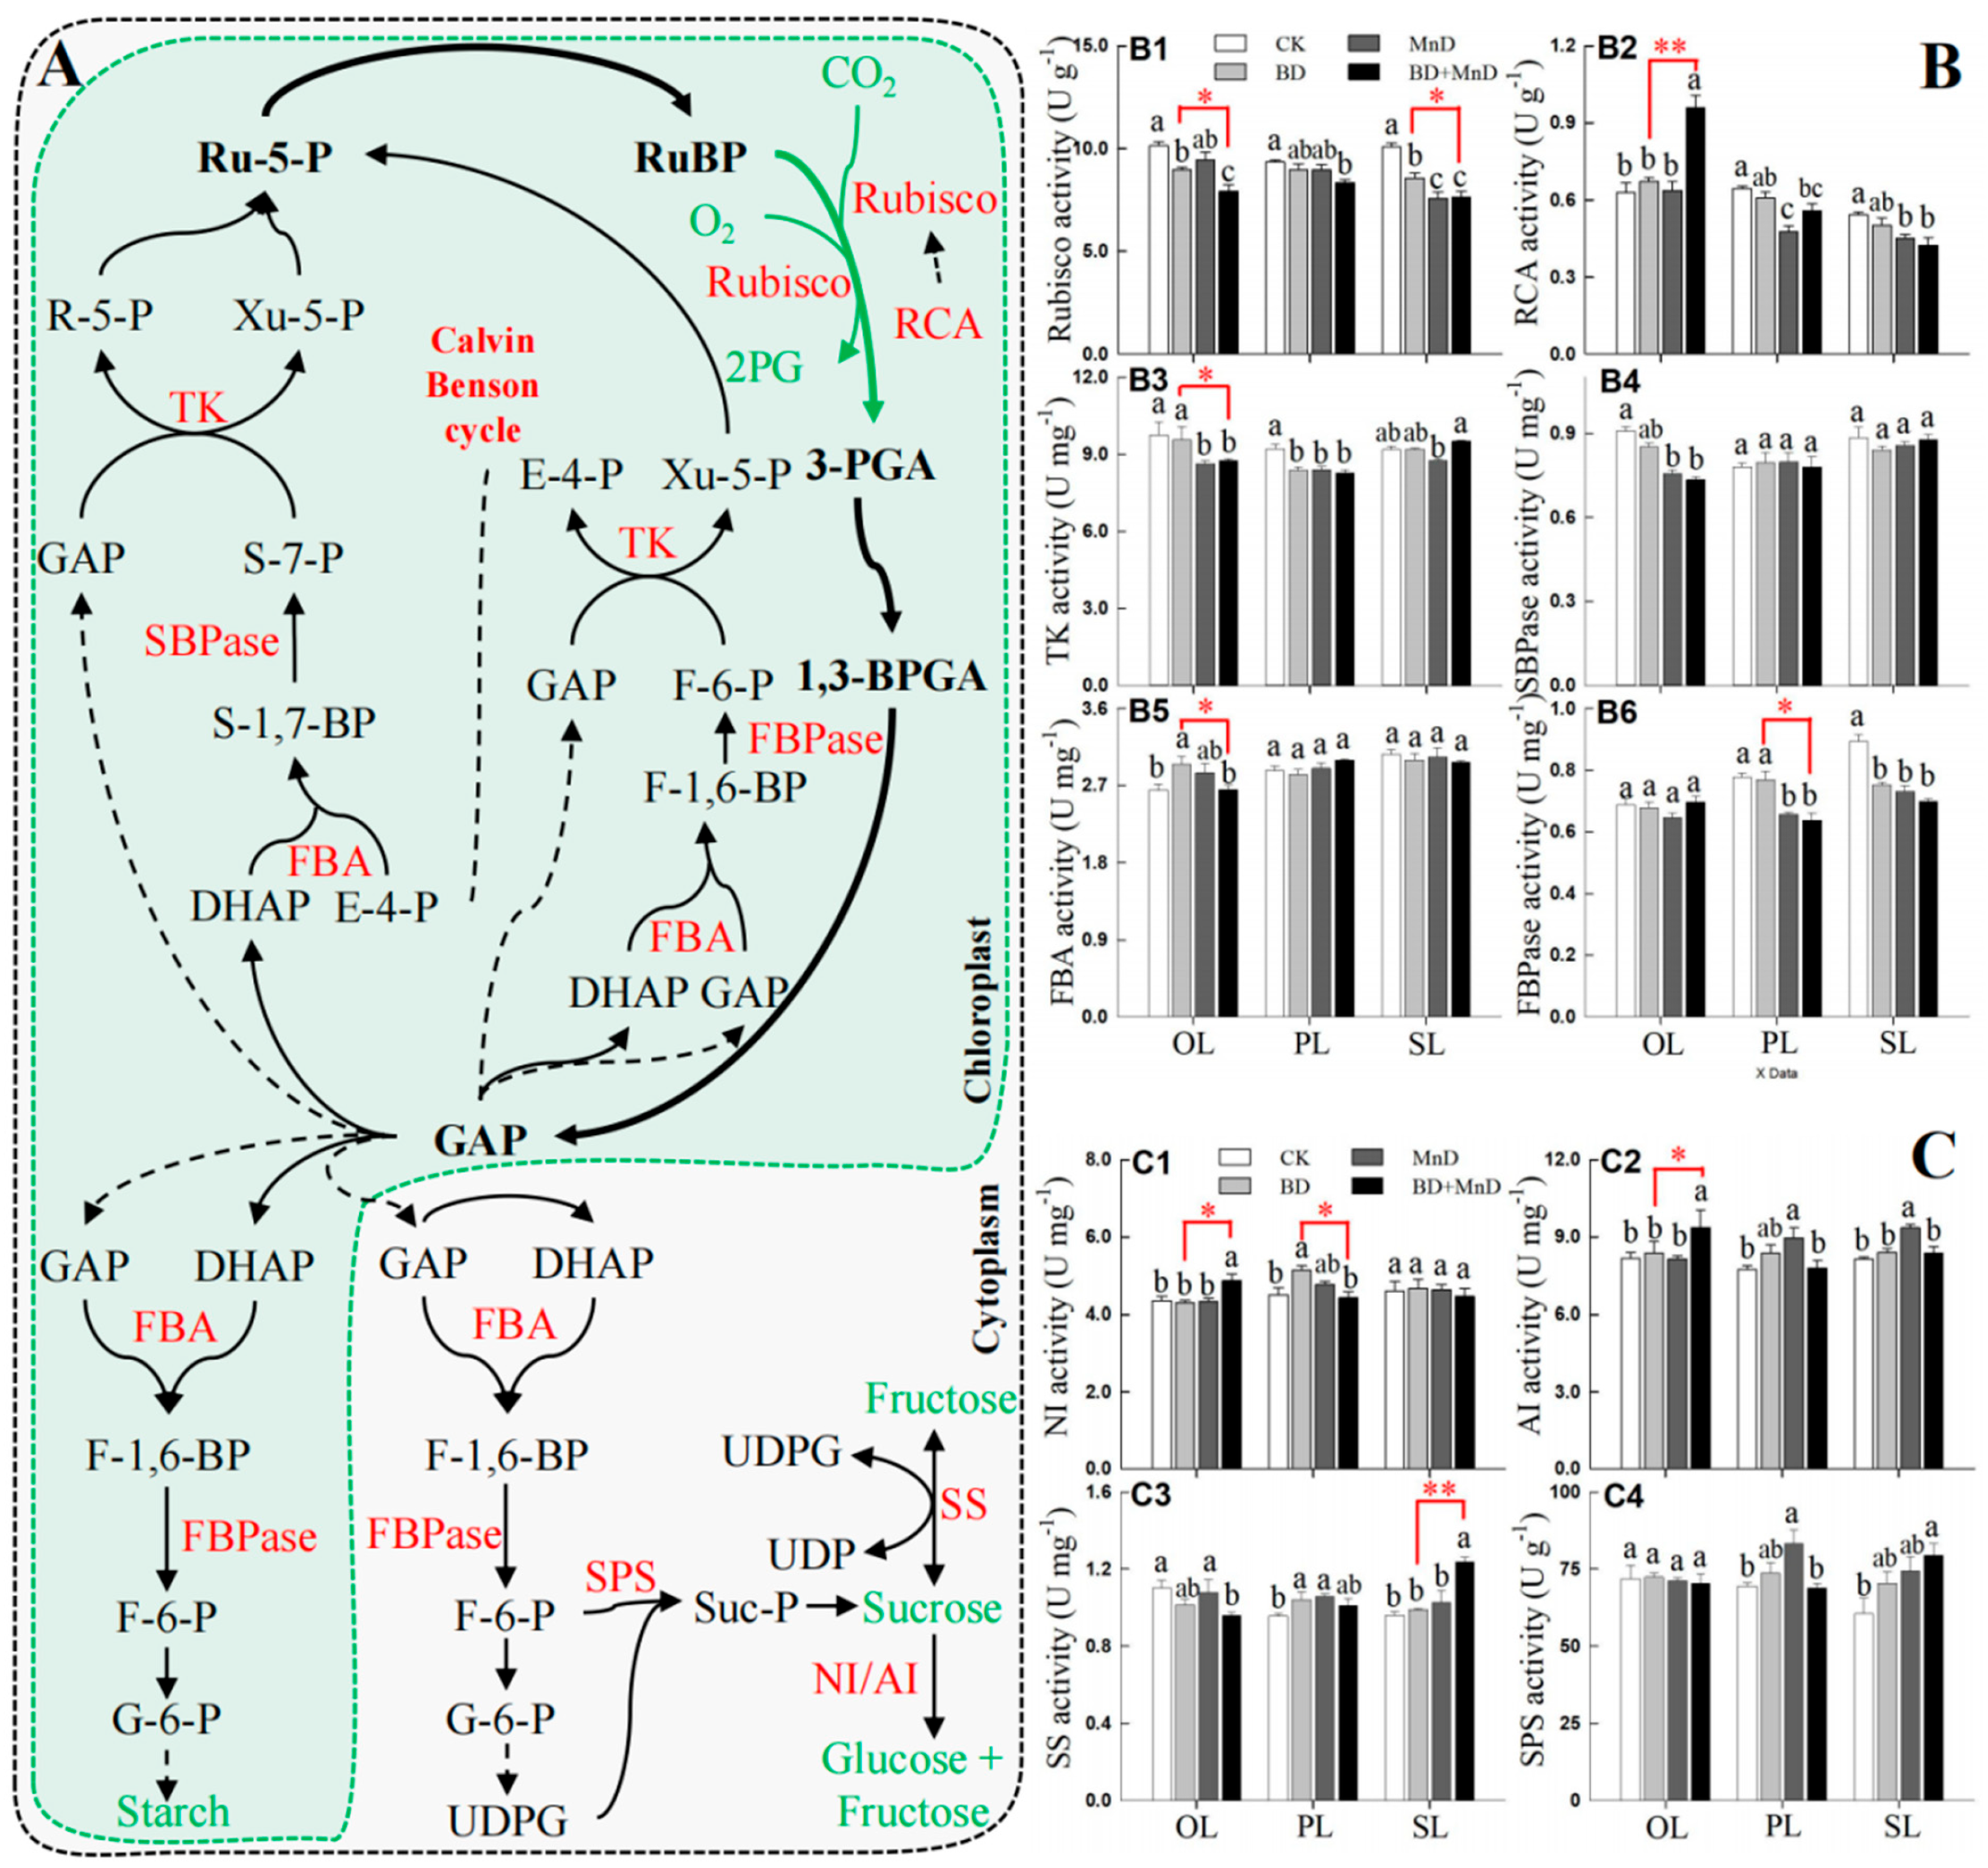
As shown in Figure 6, compared with the CK group, the BD treatment significantly reduced Rubisco activity in OLs, thymidine kinase (TK) activity in PLs, and Rubisco and fructose 1,6-bisphosphatase (FBPase) activity in SLs, whereas it significantly increased the activity of fructose 1,6-bisphosphate aldolase (FBA) in OLs. The MnD treatment significantly decreased the activity of TK in OLs; the activities of rubisco activase (RCA), TK, and FBPase in PLs; and the activities of Rubisco, RCA, TK, and FBPase in SLs. Under the BD + MnD treatment, the activity of RCA was significantly increased in OLs, while the activities of Rubisco, TK, and sedoheptulose 1,7-bisphosphatase (SBPase) were significantly decreased in OLs; Rubisco, RCA, TK, and FBPase displayed significantly reduced activities in PLs; and Rubisco, RCA, and FBPase showed significantly decreased activities in SLs. Interestingly, compared with the BD treatment, the BD + MnD treatment significantly increased RCA activity in OLs but significantly decreased the activities of Rubisco, TK, and FBA in OLs, that of FBPase in PLs, and that of Rubisco in SLs. Compared with the CK group, the BD treatment significantly promoted the activities of neutral invertase (NI) and synthetase (SS) in PLs; the MnD treatment significantly increased the activities of acid invertase (AI), SS, and sucrose phosphate synthase (SPS) in PLs and that of AI in SLs. The BD + MnD treatment significantly increased the activities of NI and AI in OLs and those of SS and SPS in SLs, whereas the SS activity in OLs was significantly decreased. Moreover, compared with the BD treatment, the BD + MnD treatment significantly suppressed NI activity in PLs but significantly enhanced NI and AI activities in OLs and SS activity in SLs.

3.6. Lignin Content and Related Key Gene Expression Level

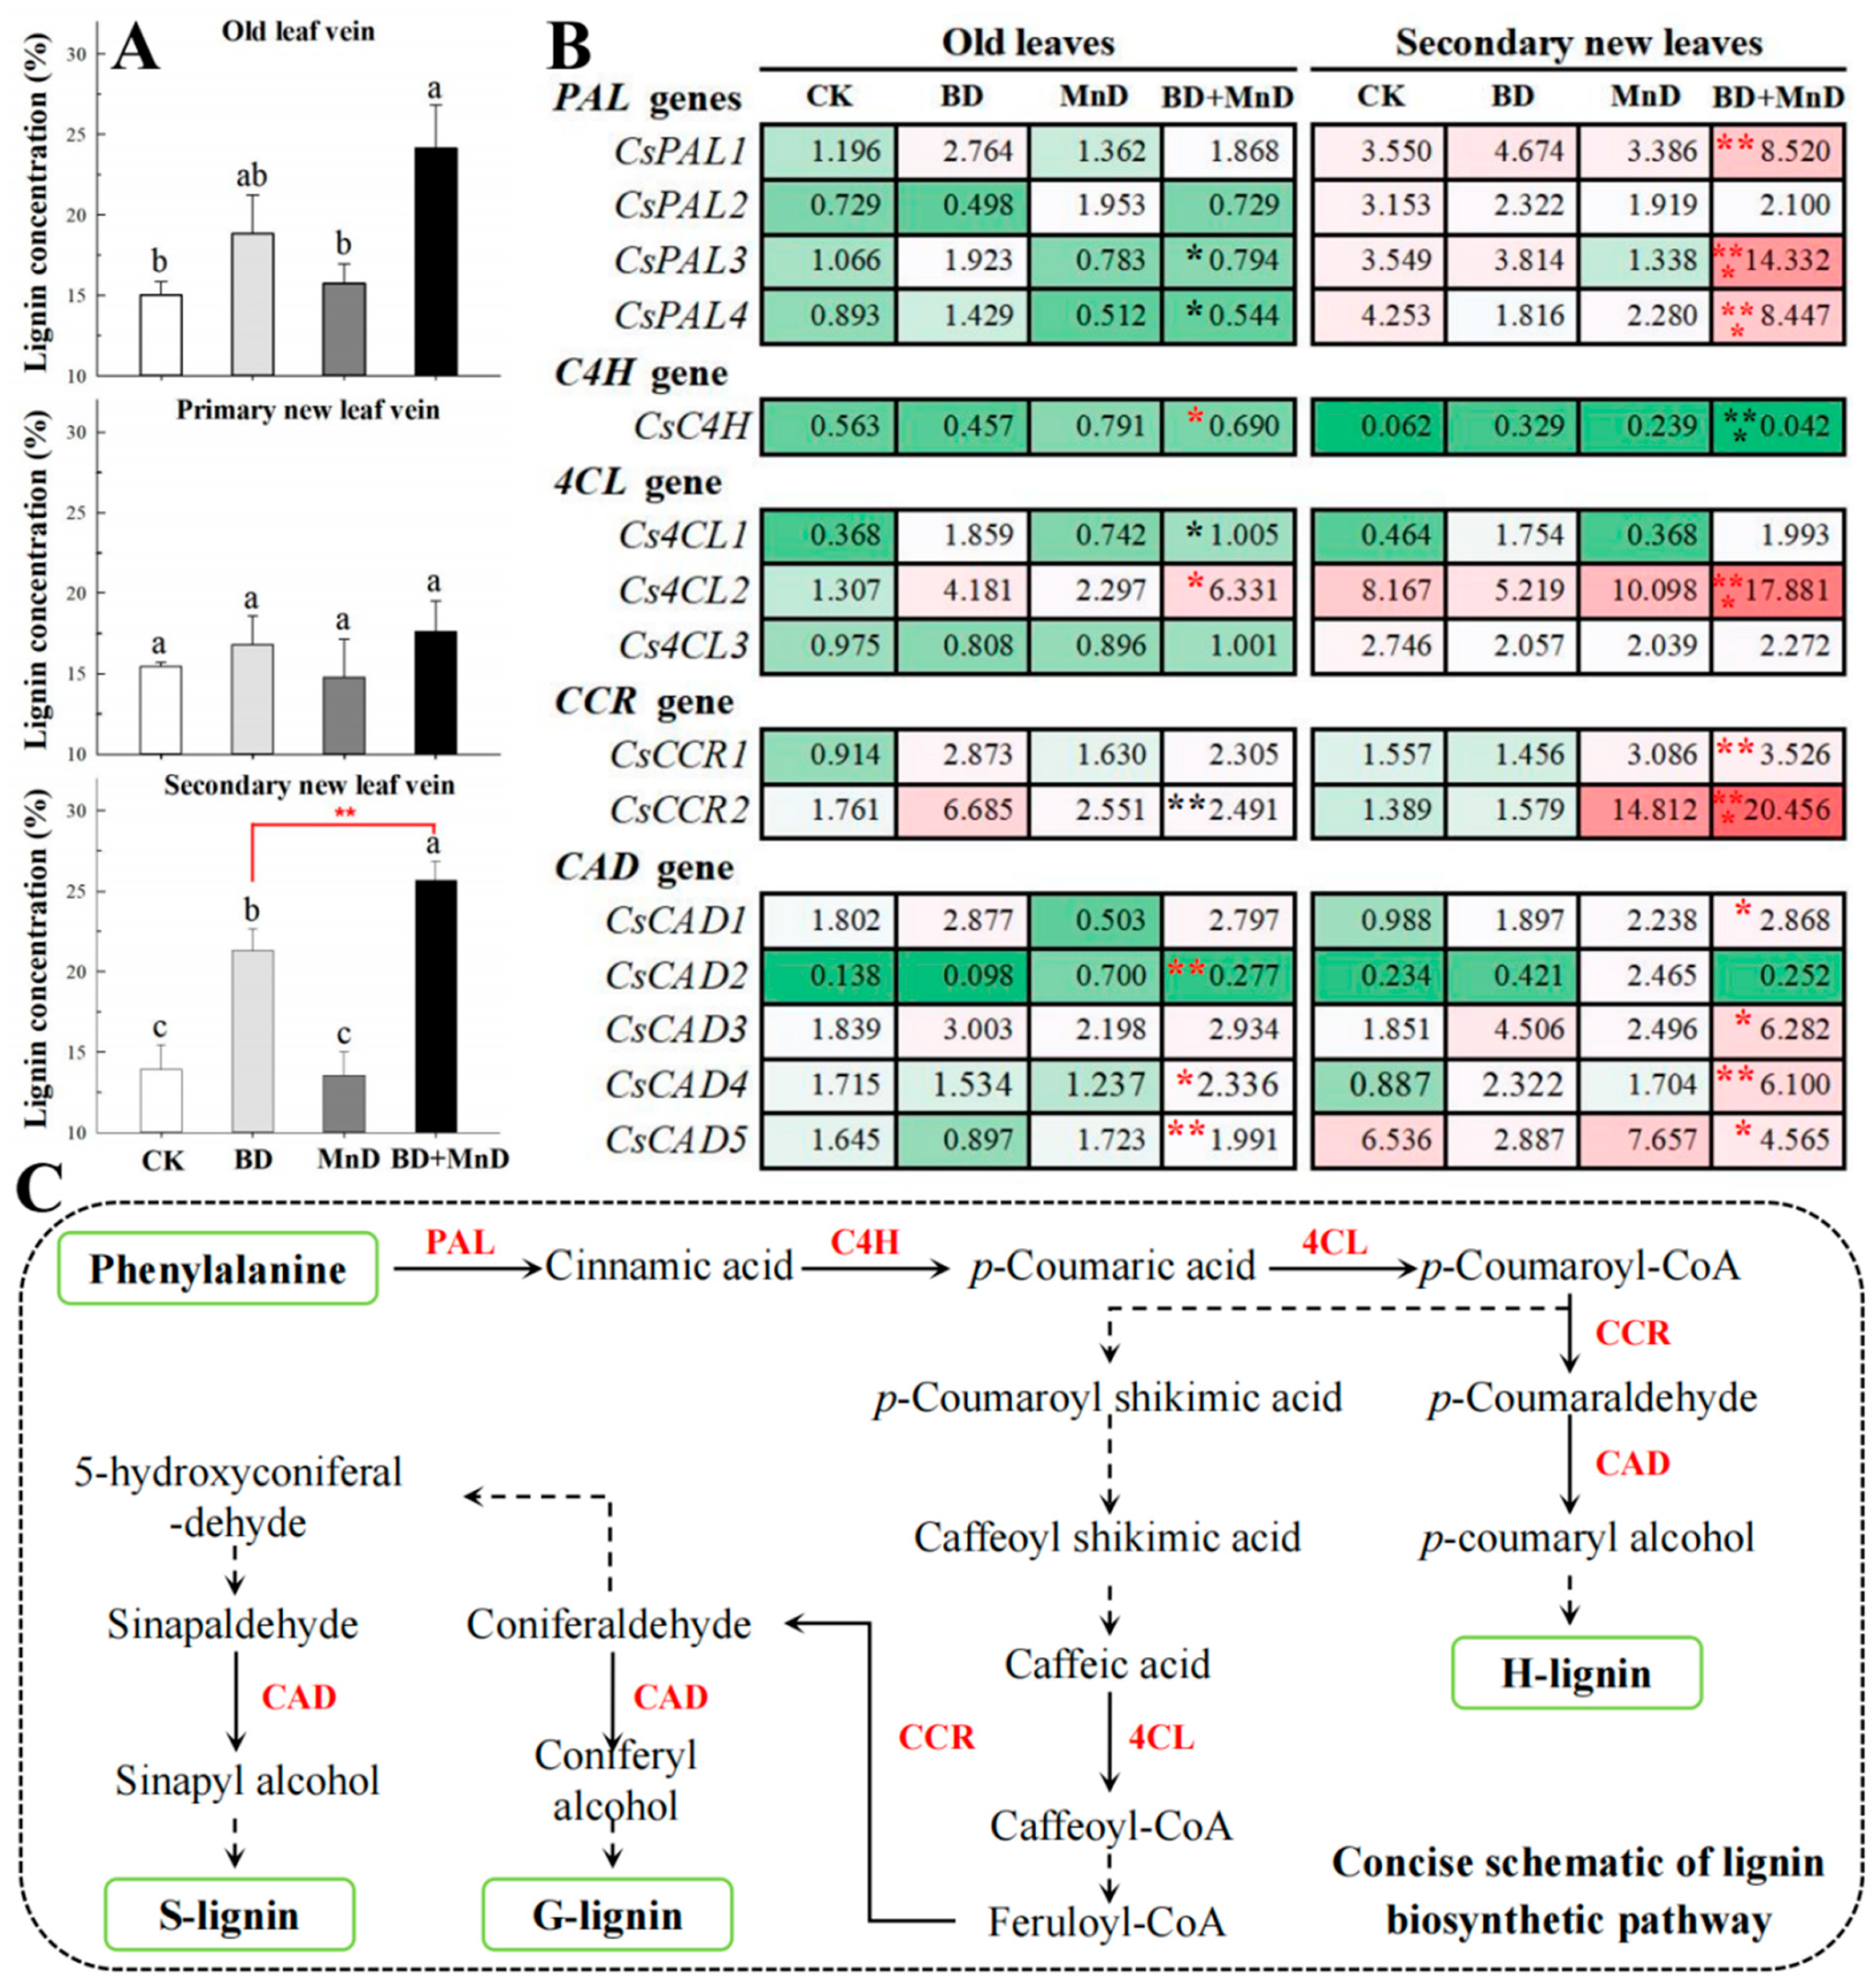
As shown in Figure 7A, compared with the CK group, the BD treatment significantly increased the lignin concentration in the veins of SLs; the BD + MnD treatment significantly enhanced the lignin concentration in the veins of OLs; and the MnD treatment had no significant effect on the lignin concentrations in the veins of all types of leaves. In addition, compared with the BD treatment, the BD + MnD treatment significantly promoted the lignin concentration in the veins of SL. The relative expression levels of key genes involved in lignin synthesis in OLs and SLs were analyzed. Compared with the CK group, in the BD treatment the CsPAL1, Cs4CL1, CsCCR1, CsCCR2, and CsCAD3 genes were significantly upregulated in OLs, while the CsCAD5 gene was significantly downregulated; CsPAL2, CsCCR1, and CsCAD2 were significantly upregulated in OLs in the MnD treatment; and CsPAL1, Cs4CL1, Cs4CL2, CsCCR1, CsCCR2, CsCAD1, CsCAD2, and CsCAD3 were significantly upregulated in OLs in the BD + MnD treatment. Compared with the BD treatment, in the BD + MnD treatment the expression levels of CsC4H, Cs4CL2, CsCAD2, CsCAD4, and CsCAD5 in OLs were significantly upregulated, while the expression levels of CsPAL3, CsPAL4, Cs4CL1, and CsCCR2 were downregulated. Compared with the CK group, in the BD treatment CsC4H, Cs4CL1, and CsCAD3 were significantly upregulated in SLs and CsCAD5 was significantly downregulated; in the MnD treatment, CsC4H, CsCCR1, CsCCR2, and CsCAD2 were significantly upregulated in SLs; and in the BD + MnD treatment, the expression levels of all other genes except for CsPAL2, CsC4H, Cs4CL3, CsCAD2, and CsCAD5 were significantly upregulated in SLs. Compared with the BD treatment, the BD + MnD treatment significantly promoted the expression levels of CsPAL1, CsPAL3, CsPAL4, Cs4CL2, CsCCR1, CsCCR2, CsCAD1, CsCAD3, CsCAD4, and CsCAD5 in SLs, while CsC4H was significantly downregulated (Figure 7B,C).

4. Discussion

CSV is a common physiological symptom of disease in citrus [8,10]. As early as 1950, it was reported that under B-deficient conditions, sour orange and ‘Wendan’ pomelo leaves developed CSV symptoms [64]. Apart from sour orange and ‘Wendan’ pomelo, CSV symptoms have been widely reported in various types of citrus, including trifoliate orange, fragrant citrus, navel orange, satsuma orange, Citrus sinensis, ‘HB’ pummelo, ‘Guanxi-miyou’ pummelo, and kumquat [8,14,15,21,22,37,65]. Research indicates that CSV occurs across all three genera (Citrus, Poncirus, and Fortunella) of cultivated citrus species. Among citrus species, Citrus sinensis, Citrus trifoliata, and Citrus grandis have been extensively studied. These citrus species are the most sensitive to nutritional deficiencies such as B deficiency, and their symptoms are the most pronounced [8,15,22]. However, CSV is not unique to citrus. For example, tip blight in Eucalyptus not only causes tip die-back and branch deformation but also results in raised and cracked leaf veins, resembling the CSV symptoms in citrus [66]; similarly, mulberry trees under B-deficient conditions exhibit swelling and cracking in leaf veins [67]. Our results showed that under the BD and BD + MnD treatments, ‘Newhall’ navel orange exhibited CSV symptoms in OLs and SLs, with greater severity under the BD + MnD treatment than under the BD treatment. In contrast, no CSV was observed in the MnD treatment group (Figure 1). Therefore, these findings suggest that B deficiency is the main cause of CSV symptoms. This conclusion is in accordance with previous studies of trifoliate orange, Citrus sinensis, and pummelo [8,14,21,22,68]. Although B deficiency results in CSV symptoms in multiple citrus species, these symptoms can be induced by a variety of factors [66]. For example, studies have shown that Mg deficiency also causes CSV symptoms in citrus [25,26,65,69]. An investigation in the citrus production area of Fujian Province showed that 86.2% of CSV symptoms were induced by Mg deficiency, with combined B and Mg deficiency being the second greatest contributor to CSV symptoms, while B deficiency only accounted for 2.3% of CSV symptoms. Although both Mg and B deficiency can induce CSV, these CSV symptoms display marked differences. CSV due to Mg deficiency is characterized by swelling and cracking veins on the leaf tip, which typically displays an inverse V-shaped chlorotic area, whereas B-deficiency-induced CSV exhibits cracking leaf veins, but the diseased leaves remain green [65]. Furthermore, some biological stresses, such as citrus Huanglongbing and citrus yellow vein clearing disease, can also lead to the occurrence of CSV symptoms when the diseases are severe [24,70].
Previous studies have shown that B deficiency not only affects the B concentrations in various parts of citrus plant, but also significantly influences the concentrations of other nutrients [22,39]. In this study, compared with the CK group, the BD and BD + MnD treatments significantly decreased B concentrations in leaves (OLs, PLs, and SLs), stems (OSs, PSs, and SSs) and roots (taproots and lateral roots) of ‘Newhall’ navel orange seedlings, while the MnD treatment alone significantly reduced B concentrations only in SLs and lateral roots (Figure 2, Figures S1 and S2). This result indicates that B deficiency treatment significantly reduces the B concentrations in various parts of citrus plants, which is consistent with the research results of previous studies [8,21,22,39]. In addition, in all types of leaves the differences in B concentrations between the BD and BD + MnD treatment groups were non-significant (Figure 2A). This indicates that while MnD alone can reduce B concentrations in SLs and lateral roots, the combination of B deficiency and Mn deficiency does not lead to a further decrease in B concentration in citrus leaves. Therefore, the exacerbation of CSV symptoms under BD + MnD treatment is not attributable to additional reduction in leaf B concentrations. In this study, the Mn concentrations in various parts of citrus were significantly decreased under MnD and BD + MnD conditions, except in OLs and taproots. In addition, the BD treatment significantly decreased Mn concentrations in OLs, SLs, PSs, and SSs (Figure 2, Figures S1 and S2). This result indicates that B deficiency treatment not only reduces the B concentrations in various parts of citrus plants, but also leads to significant reduction in the Mn concentration in the above-ground tissues. Similarly, previous studies have also shown that the Mn concentration was significantly reduced in the leaves of trifoliate orange, Carrizo citrange, Chongyi tangerine, and sour orange under B deficiency conditions [22]. The above research indicates that there is an interaction relationship between B and Mn in citrus, but the specific mechanism still needs further research. In addition to Mn, B deficiency also has a significant impact on the concentration of other mineral nutrients in citrus, particularly the Mg concentration in leaves. In this study, the Mg concentrations in the SLs, PLs, and OLs were significantly decreased under BD conditions compared with the CK (Figure 2). This is consistent with the previous research results on trifoliate orange, Carrizo citrange, Chongyi tangerine, Cleopatra mandarin, red tangerin, and ‘Nanfeng’ tangerine [22,39].
Both Mn and Mg directly participate in plant photosynthesis [40,41,42,71]. CSV symptoms induced by Mg deficiency disrupt the photosynthetic performance of citrus plants and significantly impact the synthesis and transport of photosynthetic products [26,69]. However, whether Mn deficiency aggravates CSV symptoms induced by B deficiency through influencing photosynthesis in citrus remains unclear. Our results showed that the BD, MnD, and BD + MnD treatments significantly affected the content of photosynthetic pigments, gas exchange parameters, chlorophyll fluorescence parameters, photosynthetic enzyme activities, photosynthetic products, and activity of key enzymes involved in the synthesis of photosynthetic products in the leaves of ‘Newhall’ navel orange (Table 2, Figure 3, Figure 4, Figure 5 and Figure 6). Although B does not directly participate in the metabolism of photosynthetic pigments, studies have shown that B deficiency can lead to reduced photosynthetic pigment content in citrus leaves [14,22,32]. In our study, both the BD and BD + MnD treatments significantly reduced the Chl a, Chl b, and total chlorophyll content in the OLs and SLs of ‘Newhall’ navel orange (Table 2), which was consistent with previously reported findings in sweet orange and trifoliate orange [14,22,32]. However, our study also found that the contents of Chl a, Chl b, and total chlorophyll in OLs, as well as the Chl b and total chlorophyll contents in SLs, were significantly lower in the BD + MnD treatment group than those in the BD treatment group (Table 2). This result implies that under B deficiency, photosynthetic pigment content is closely associated with the severity of CSV symptoms. Further analysis of chlorophyll fluorescence parameters revealed that the BD, MnD, and BD + MnD treatments significantly affected the chlorophyll fluorescence values of citrus leaves (Figure 4). Specifically, the Fo value of the OLs of ‘Newhall’ navel orange began to rise significantly from the 25th week under the BD treatment and continued to increase until the end of the experiment. The Fo value of SLs also rose significantly in the 31st week under the BD treatment. These findings are consistent with previous results [14]. Notably, compared with the BD treatment, the BD + MnD treatment significantly increased the Fo value of OLs in the 27th and 29th weeks of treatment, the Fo value of PLs in the 25th through 31st weeks of treatment, and the Fo value of SLs in the 27th and 31st weeks of treatment, while the Y(II) values of PLs and SLs were significantly decreased in the 29th and 31st weeks of treatment. Furthermore, significant declines in the ETR values of OLs, PLs, and SLs occurred earlier in the BD + MnD treatment group than in the BD treatment group (Figure 4). Altogether, these results showed that the BD + MnD treatment had a significantly stronger impact on photosynthetic pigments and chlorophyll fluorescence parameters than the BD treatment.
B deficiency affects both the photosynthetic rate and photochemical efficiency of citrus leaves. In our study, both the BD and BD + MnD treatments displayed significantly decreased Pn values in the 31st week of treatment, and the Pn values of OLs, PLs, and SLs were significantly lower in the BD + MnD treatment group compared to the BD treatment group (Figure 3A). In accordance with our results, the finding that B deficiency significantly decreases Pn has already been confirmed in sweet orange, ‘HB’ pummelo, trifoliate orange, and Carrizo citrange [14,21,32,36]. Moreover, a previous study indicated that a significant decline in the Pn value of citrus leaves could be detected before CSV symptoms became obvious [37]. The above-described results indicate that B deficiency can reduce the Pn value of citrus leaves, which occurs prior to the appearance of CSV symptoms. Our study found that, at the same time point, the Pn values of ‘Newhall’ navel orange OLs, PLs, and SLs were significantly lower in the BD + MnD treatment group than those in the BD treatment group (Figure 3A), which suggested that Mn deficiency exacerbated the decline in the Pn value of citrus leaves caused by B deficiency. Further analysis of PSII revealed that B deficiency significantly decreased the photochemical efficiency of PSII in Citrus grandis seedling leaves [35]. We also found that the Y(II) value of ‘Newhall’ navel orange OLs was significantly reduced in weeks 23–31 of the BD treatment, and the Y(II) value of SLs was significantly reduced in the 31st week of the BD treatment compared with that in the CK group. The Y(II) values of PLs and SLs were significantly lower in the 29th and 31st weeks of the BD + MnD treatment compared to the BD treatment (Figure 4). Mn participates directly in photosynthesis, serving as a structural component of PSII, and is involved in the water-splitting reaction and photosynthetic electron transport [40,41,42]. Therefore, the MnD treatment significantly reduced the Y(II) values of PLs and SLs in ‘Newhall’ navel orange (Figure 4). The above findings suggest that compared with the BD treatment, the BD + MnD treatment had a stronger impact on the PSII photochemical efficiency of citrus leaves, and as a result, the Y(II) value of new leaves was significantly lower in the BD + MnD treatment group than that in the BD treatment group.
B deficiency affects photosynthetic products and the activities of key enzymes involved in their synthesis. In our study, the BD treatment significantly increased the sucrose and starch contents of OLs, PLs, and SLs in ‘Newhall’ navel orange, and the starch content of OLs was significantly higher in the BD + MnD treatment group than that in the BD treatment group (Figure 5C). Previous studies have demonstrated that B deficiency leads to the accumulation of photosynthetic products such as sucrose and starch in citrus leaves [10,14,23,32,35]. The excessive accumulation of photosynthetic products in mesophyll cells can inhibit the activity of related enzymes through feedback mechanisms, significantly reducing the efficiency of photosynthesis and carbon assimilation. The results of our study showed that, compared with the CK group, the BD treatment significantly suppressed the activity of Rubisco in OLs, TK in PLs, and Rubisco and FBPase in SLs, while the activities of FBA in OLs and NI and SS in PLs were significantly increased (Figure 6). Previous research demonstrated that Rubisco, NADP-glyceraldehyde-3-phosphate dehydrogenase, and FBPase activities were lower in B-deficient sweet orange leaves than in controls [14]. Our findings are consistent with results reported by other authors. However, we found that the BD + MnD treatment could intensify this phenomenon. Compared with the BD treatment, the BD + MnD treatment significantly increased the starch content of OLs; significantly decreased the activities of Rubisco, TK, and FBA in OLs, FBPase and NI in PLs, and Rubisco in SLs; and significantly enhanced NI and AI activities in OLs and SS activity in SLs (Figure 6). Mn is a key element in plant carbon assimilation and serves as a cofactor for multiple enzymes involved in the synthesis of secondary metabolites, including carbohydrates [42,43,44]. These results suggest that Mn plays an important role in the physiological changes described above, though the specific regulatory mechanisms require further investigation.
The accumulation of photosynthetic products in the mesophyll cells of citrus mainly occurs due to impaired transport. Photosynthetic products must be transported from inside the cell to the outside and then moved out of the leaf through the vascular tissues of the veins. B deficiency induces the thickening of citrus mesophyll cell walls and the abnormal development of vascular tissues in the veins, which leads to the accumulation of photosynthetic products in citrus mesophyll cells [8,15]. Lignin accumulation is a major cause of cell wall thickening and the abnormal development of vascular bundles in the veins of citrus leaves. Our study showed that, compared with the CK group, the BD treatment significantly increased leaf vein lignin concentrations in the SLs of ‘Newhall’ navel orange, while the BD + MnD treatment significantly enhanced lignin concentrations in the veins of both OLs and SLs (Figure 7). Lignin is a macromolecule aromatic heteropolymer second only to cellulose in terms of abundance in plants. Lignin closely binds with cellulose and acts as major filler in the middle lamella and secondary cell wall. In higher plants, lignin plays key roles in water transport, mechanical support, and defense against plant pathogens [72,73]. Lignin can also respond to various forms of biotic and abiotic stress [74]. Studies have shown that lignin metabolism plays an important role in the formation of CSV symptoms. In accordance with previous reports, our study demonstrated that B deficiency significantly increased the lignin content in the leaves of ‘Newhall’ navel orange, boosted the activity of lignin-related metabolic enzymes, and upregulated the expression of key lignin biosynthesis genes [8,19]. In addition, we found that both the lignin content and the relative expression levels of key lignin biosynthesis genes (CsPAL1, CsPAL3, CsPAL4, Cs4CL2, CsCCR1, CsCCR2, CsCAD1, CsCAD3, CsCAD4, and CsCAD5) were significantly higher in SLs under the BD + MnD treatment than under the BD treatment (Figure 7). Mn is essential for the biosynthesis of chlorophyll, aromatic amino acids, and secondary products such as lignin and flavonoids [43,75]. Accordingly, this study demonstrated that combined B and Mn deficiency promoted lignin accumulation in citrus leaves, consequently aggravating the CSV symptoms on the leaves. Moreover, previous studies have shown that lignin is involved in plant responses to a range of biotic and abiotic stresses [76,77,78,79]. For example, both the intensity and quality of light affect lignin accumulation in plants [80,81,82]. Therefore, Mn deficiency may promote lignin accumulation under combined B and Mn deficiency through altering the absorption and utilization of light, ultimately leading exacerbating CSV symptoms.

5. Conclusions

In summary, Mn deficiency aggravates B-deficiency-induced CSV in the OLs and SLs of ‘Newhall’ navel orange. In the present study, the B concentrations in different types of leaves were not significantly different between the BD and BD + MnD treatment groups, which indicated that Mn deficiency aggravated CSV symptoms without further reducing the B concentration in leaves. B deficiency disrupted the physiological functions of ‘Newhall’ navel orange leaves, including photosynthetic characteristics, the synthesis and transport of photosynthetic products, and lignin metabolism. Mn is a key element for photosynthesis, and combined Mn and B deficiency intensifies the decline in leaf photosynthetic pigments, photochemical efficiency, and the Pn and increases starch accumulation. Compared with B deficiency alone, the lack of both B and Mn significantly promoted lignin concentrations and the relative expression levels of key lignin synthesis genes in the leaves of ‘Newhall’ navel orange. Therefore, Mn deficiency may aggravate CSV symptoms induced by B deficiency through negatively impacting the leaf photosynthetic characteristics and increasing the accumulation of photosynthetic products and lignin, although further research is necessary to elucidate the specific mechanism. This study provides a theoretical basis for addressing CSV symptoms in citrus production through regulating nutrient balance.

Supplementary Materials

The following supporting information can be downloaded at: https://www.mdpi.com/article/10.3390/horticulturae11101172/s1, Table S1: Primers used for qRT-PCR analysis of lignin biosynthesis genes; Table S2: Effect of boron and manganese co-deficiency on chlorophyll fluorescence parameters in the leaves of ‘Newhall’ navel orange seedlings; Figure S1: Effect of boron and manganese co-deficiency on mineral nutrient concentrations in the stems of ‘Newhall’ navel orange seedlings; Figure S2: Effect of boron and manganese co-deficiency on mineral nutrient concentrations in the roots of ‘Newhall’ navel orange seedlings.

Author Contributions

Conceptualization, G.Z. and F.Y.; Writing—original draft preparation, Y.L. and Y.F.; Data curation, software, visualization, Y.L., Z.G. and M.Y.; Resources, Q.W.; Writing—review and editing, G.Z.; Supervision, F.Y. All authors have read and agreed to the published version of the manuscript.

Funding

This research was funded by the National Natural Science Foundation of China (Nos. 31960573 and 32160680).

Data Availability Statement

The original contributions presented in the study are included in the article/Supplementary Materials; further inquiries can be directed to the corresponding author.

Conflicts of Interest

The authors declare no conflicts of interest.

Abbreviations

The following abbreviations are used in this manuscript:
CSVCorky split vein
BDBoron deficiency
MnDManganese deficiency
BD + MnDCombined boron and manganese deficiency
CKControl
OLOld leaf
PLPrimary new leaf
SLSecondary new leaf
OSOld scion stem
PNSPrimarynew scion stem
SNSSecondary new scion stem
Chl aChlorophyll a
Chl bChlorophyll b
CarCarotenoid
PnNet photosynthetic rate
TrTranspiration rate
CiIntercellular CO2 concentration
GsStomatal conductance
FoMinimal fluorescence
FmMaximal fluorescence
FvVariable fluorescence
Fv/FmMaximal photochemical efficiency of PSII
ETRElectron transport efficiency
Y(II)Actual photochemical efficiency
Y(NPQ)Quantum yield of regulated energy dissipation
Y(NO)Quantum yield of non-regulated energy dissipation
RubiscoRibulose bisphosphate carboxylase/oxygenase
RCARubisco activase
TKRubisco, thymidine kinase
SBPaseSedoheptulose 1,7-bisphosphatase
FBAFructose 1,6-bisphosphate aldolase
FBPaseFructose 1,6-bisphosphatase
NINeutral invertas
AIAcid invertase
SSSucrose synthetase

References

  1. Matthes, M.S.; Robil, J.M.; Mcsteen, P. From element to development: The power of the essential micronutrient boron to shape morphological processes in plants. J. Exp. Bot. 2020, 71, 1681–1693. [Google Scholar] [CrossRef]
  2. Bolaños, L.; Abreu, I.; Bonilla, I.; Camacho-Cristóbal, J.J.; Reguera, M. What can boron deficiency symptoms tell us about its function and regulation. Plants 2023, 12, 777. [Google Scholar] [CrossRef] [PubMed]
  3. Brown, P.H.; Bellaloui, N.; Wimmer, M.A. Boron in plant biology. Plant Biol. 2002, 4, 205–223. [Google Scholar] [CrossRef]
  4. O’Neill, M.A.; Ishii, T.; Albersheim, P.; Darvill, A.G. Rhamnogalacturonan II: Structure and function of a borate cross-linked cell wall pectic polysaccharide. Annu. Rev. Plant Biol. 2004, 55, 109–139. [Google Scholar] [CrossRef] [PubMed]
  5. Lu, Y.B.; Yang, L.T.; Li, Y.; Xu, J.; Liao, T.T.; Chen, Y.B.; Chen, L.S. Effects of boron deficiency on major metabolites, key enzymes and gas exchange in leaves and roots of Citrus sinensis seedlings. Tree Physiol. 2014, 34, 608–618. [Google Scholar] [CrossRef]
  6. Chatter, M.; Tabi, Z.; Galli, M.; Malcomber, S.; Buck, A.; Muszynski, M.; Gallavotti, A. The boron efflux transporter rotten ear is required for maize inflorescence development and fertility. Plant Cell 2014, 26, 2962–2977. [Google Scholar] [CrossRef]
  7. Durbak, A.R.; Phillips, K.A.; Pike, S.; O’Neill, M.A.; Mares, J.; Gallavotti, A.; Malcomber, S.T.; Gassmann, W.; McSteen, P. Transport of boron by the tassel-less1 aquaporin is critical for vegetative and reproductive development in maize. Plant Cell 2014, 26, 2978–2995. [Google Scholar] [CrossRef]
  8. Zhou, G.F.; Sun, X.N.; Zhang, L.P.; Zeng, X.L.; Liu, G.D.; Sheng, O. Lignin metabolism plays an essential role in the formation of corky split vein caused by boron deficiency in ‘Newhall’ navel orange (Citrus sinensis Osb.). Sci. Hortic. 2022, 294, 110763. [Google Scholar] [CrossRef]
  9. Shorrocks, V.M. The occurrence and correction of boron deficiency. Plant Soil 1997, 193, 121–148. [Google Scholar] [CrossRef]
  10. Wang, N.N.; Yang, C.Q.; Pan, Z.Y.; Liu, Y.Z.; Peng, S.A. Boron deficiency in woody plants: Various responses and tolerance mechanisms. Front. Plant Sci. 2015, 6, 916. [Google Scholar] [CrossRef]
  11. Cakmak, I.; Kurz, H.; Marschner, H. Short-term effects of boron, germanium and high light intensity on membrane permeability in boron deficient leaves of sunflower. Physiol. Plant. 1995, 95, 11–18. [Google Scholar] [CrossRef]
  12. Dell, B.; Huang, L. Physiological response of plants to low boron. Plant Soil 1997, 193, 103–120. [Google Scholar] [CrossRef]
  13. Xiao, J.X.; Yan, X.; Peng, S.A.; Deng, X.X.; Fang, Y.W. Relationship between boron deficiency occurrence and annual changes in contents of boron and sugar of ‘Newhall’ navel orange. Acta Hortic. Sin. 2006, 33, 356–359. [Google Scholar]
  14. Han, S.; Chen, L.S.; Jiang, H.X.; Smith, B.R.; Yang, L.T.; Xie, C.Y. Boron deficiency decreases growth and photosynthesis, and increases starch and hexoses in leaves of citrus seedlings. J. Plant Physiol. 2008, 165, 1331–1341. [Google Scholar] [CrossRef] [PubMed]
  15. Liu, Y.Z.; Li, S.; Yang, C.Q.; Peng, S.A. Effects of boron-deficiency on anatomical structures in the leaf main vein and fruit mesocarp of pummelo [Citrus grandis (L.) Osbeck]. Korean J. Hortic. Sci. 2013, 88, 693–700. [Google Scholar] [CrossRef]
  16. Ling, L.L.; Peng, L.Z.; Chun, C.P.; Cao, L.; Jiang, C.L. Characteristics analysis of microelement contents in ‘Newhall’ navel orange leaves in Southern Jiangxi Province. Acta Hortic. Sin. 2010, 37, 1388–1394. [Google Scholar]
  17. Wang, R.D.; Jiang, C.C.; Liu, G.D.; Wang, Y.H.; Peng, S.A.; Zeng, Q.L. Status and analysis on available boron content in soil of Gannan navel orange orchards. S. China Fruits 2011, 40, 1–3+7. [Google Scholar]
  18. Liu, X.S.; Zhang, Z.Y.; Wei, J.P. Influencing factors and intensity change of soil pH value in South Jiangxi Province. Bull. Soil Water Conserv. 2021, 41, 100–105. [Google Scholar]
  19. Yang, C.Q.; Liu, Y.Z.; An, J.C.; Li, S.; Jin, L.F.; Zhou, G.F.; Wei, Q.J.; Yan, H.Q.; Wang, N.N.; Fu, L.N.; et al. Digital gene expression analysis of corky split vein caused by boron deficiency in ‘Newhall’ navel orange (Citrus sinensis Osbeck) for selecting differentially expressed genes related to vascular hypertrophy. PLoS ONE 2013, 8, e65737. [Google Scholar] [CrossRef]
  20. Liu, G.D.; Dong, X.C.; Liu, L.C.; Wu, L.S.; Peng, S.A.; Jiang, C.C. Metabolic profiling reveals altered pattern of central metabolism in navel orange plants as a result of boron deficiency. Physiol. Plant. 2015, 153, 513–524. [Google Scholar] [CrossRef]
  21. Zhou, G.F.; Li, B.X.; Zhang, L.P.; Sheng, O.; Wei, Q.J.; Yao, F.X.; Guan, G.; Liu, G.D. Physiological and nutritional responses of ‘HB’ Pummelo [Citrus grandis (L.) Osbeck ‘Hirado Buntan’] to the combined effects of low pH levels and boron deficiency. HortScience 2020, 55, 449–456. [Google Scholar] [CrossRef]
  22. Zhou, G.F.; Peng, S.A.; Liu, Y.Z.; Wei, Q.J.; Han, J.; Islam, M.Z. The physiological and nutritional responses of seven different citrus rootstock seedlings to boron deficiency. Trees-Struct. Funct. 2014, 28, 295–307. [Google Scholar] [CrossRef]
  23. Zhou, G.F.; Zhang, L.P.; Li, B.X.; Sheng, O.; Wei, Q.J.; Yao, F.X.; Guan, G.; Liu, G.D. Genome-wide identification of long non-coding RNA in trifoliate orange (Poncirus trifoliata L. Raf) leaves in response to boron deficiency. Int. J. Mol. Sci. 2019, 20, 5419. [Google Scholar] [CrossRef] [PubMed]
  24. Folimonova, S.Y.; Achor, D.S. Early events of citrus greening (Huanglongbing) disease development at the ultrastructural level. Phytopathology 2010, 100, 949–958. [Google Scholar] [CrossRef]
  25. Huang, J.H.; Xu, J.; Ye, X.; Luo, T.Y.; Ren, L.H.; Fan, G.C.; Qi, Y.P.; Li, Q.; Ferrarezi, R.S.; Chen, L.S. Magnesium deficiency affects secondary lignification of the vascular system in Citrus sinensis seedlings. Trees-Struct. Funct. 2019, 33, 171–182. [Google Scholar] [CrossRef]
  26. Ye, X.; Chen, X.F.; Cai, L.Y.; Lai, N.W.; Deng, C.L.; Guo, J.X.; Yang, L.T.; Chen, L.S. Molecular and physiological mechanisms underlying magnesium-deficiency-induced enlargement, cracking and lignification of Citrus sinensis leaf veins. Tree Physiol. 2020, 40, 1277–1291. [Google Scholar] [CrossRef]
  27. Liang, D.; Ma, F.W. Photosynthesis and assimilate transport in fruit trees. In Modern Fruit Tree Biology; Li, T.Z., Zhang, Z.H., Eds.; Science Press: Beijing, China, 2008; pp. 141–152. ISBN 978-7-030-20116-4. [Google Scholar]
  28. Mishra, S.; Heckathorn, S.A.; Frantz, J.M.; Krause, C. The effect of boron availability, CO2, and irradiance on relative accumulation of the major boron transport proteins, bor1 and nip5;1. Biol. Plant. 2018, 62, 121–128. [Google Scholar] [CrossRef]
  29. Sharma, P.N.; Ramchandra, T. Water relations and photosynthesis in mustard plants subjected to boron deficiency. Indian J. Plant Physiol. 1990, 85, 150–154. [Google Scholar]
  30. Lu, X.P.; Jiang, C.C.; Dong, X.C.; Wu, X.W.; Yan, L. Leaf photosynthetic characteristics of citrus rootstocks with different boron efficiency. Plant Nutr. Fert. Sci. 2017, 23, 476–483. [Google Scholar]
  31. García-sánchez, F.; Simón-grao, S.; Martínez-nicolás, J.J.; Alfosea-simón, M.; Liu, C.; Chatzissavvidis, C.; Pérez-pérez, J.G.; Cámara-zapata, J.M. Multiple stresses occurring with boron toxicity and deficiency in plants. J. Hazard. Mater. 2020, 397, 122713. [Google Scholar] [CrossRef]
  32. Song, X.; Song, B.Q.; Huo, J.L.; Liu, H.J.; Adil, M.F.; Jia, Q.; Wu, W.Y.; Kuerban, A.; Wang, Y.; Huang, W.G. Effect of boron deficiency on the photosynthetic performance of sugar beet cultivars with contrasting boron efficiencies. Front. Plant Sci. 2023, 13, 1101171. [Google Scholar] [CrossRef]
  33. Fujiyama, B.S.; Silva, A.R.B.E.; Júnior, M.L.D.S.; Cardoso, N.R.P.; Fonseca, A.B.D.; Viana, R.G.; Sampaio, L.S. Boron fertilization enhances photosynthesis and water use efficiency in soybean at vegetative growth stage. J. Plant Nutr. 2019, 42, 2498–2506. [Google Scholar] [CrossRef]
  34. Gimeno, V.; Simón, I.; Nieves, M.; Martínez, V.; Cámara-zapata, J.M.; García, A.L.; García-Sánchez, F. The physiological and nutritional responses to an excess of boron by Verna lemon trees that were grafted on four contrasting rootstocks. Trees-Struct. Funct. 2012, 26, 1513–1526. [Google Scholar] [CrossRef]
  35. Han, S.; Tang, N.; Jiang, H.X.; Yang, L.T.; Li, Y.; Chen, L.S. CO2 assimilation, photosystem II photochemistry, carbohydrate metabolism and antioxidant system of citrus leaves in response to boron stress. Plant Sci. 2009, 176, 143–153. [Google Scholar] [CrossRef]
  36. Sheng, O.; Song, S.W.; Peng, S.A.; Deng, X.X. The effects of low boron on growth, gas exchange, boron concentration and distribution of ‘Newhall’ navel orange (Citrus sinensis Osb.) plants grafted on two rootstocks. Sci. Hortic. 2009, 121, 278–283. [Google Scholar] [CrossRef]
  37. Zhou, G.F.; Li, B.X.; Lin, H.Z.; Guan, G.; Liu, G.D.; Yao, F.X.; Zhong, B.L. Early and late symptoms of micronutrient deficiency and diurnal changes of photosynthesis of ‘Newhall’ navel orange. Plant Nutr. Fert. Sci. 2019, 25, 1957–1966. [Google Scholar]
  38. Zhang, G.J.; Jiang, H.; Zheng, L.Q.; Chen, J.; Qiu, D.L.; Liu, X.H. Effect of copper stress on photosynthesis of navel orange seedlings. Chin. J. Eco-Agric. 2009, 17, 130–134. [Google Scholar] [CrossRef]
  39. Zhou, G.F.; Li, B.X.; Fu, Y.L.; Guan, G.; Yao, F.X.; Liu, G.D. Effects of iron, manganese and zinc deficiency on the symptom, photosynthetic characteristics and nutrient status of ‘Nanfeng’ tangerine. Acta Hortic. Sin. 2019, 46, 691–700. [Google Scholar]
  40. Schmidt, S.B.; Jensen, P.E.; Husted, S. Manganese deficiency in plants: The impact on photosystem II. Trends Plant Sci. 2016, 21, 622–632. [Google Scholar] [CrossRef]
  41. Alejandro, S.; Höller, S.; Meier, B.; Peiter, E. Manganese in plants: From acquisition to subcellular allocation. Front. Plant Sci. 2020, 11, 300. [Google Scholar] [CrossRef]
  42. Xie, D.X.; Ma, X.N.; Zhao, Y.Q.; Li, J.X.; Fu, D.L.; Zhang, Z.Q.; Ju, C.F.; Wang, C. Absorption, transport and regulation of manganese in plants. Sci. Sin. 2023, 53, 1199–1212. [Google Scholar] [CrossRef]
  43. Millaleo, R.; Reyes-Diaz, M.; Ivanov, A.G.; Mora, M.L.; Alberdi, M. Manganese as essential and toxic element for plants: Transport, accumulation and resistance mechanisms. J. Soil. Sci. Plant Nutr. 2010, 10, 470–481. [Google Scholar] [CrossRef]
  44. Tao, Y.Z.; Liu, C.Z.; Piao, L.; Yang, F.Q.; Liu, J.Q.; Faheem, J.M.; Li, M. Effect of Mn deficiency on carbon and nitrogen metabolism of different genotypes seedlings in maize (Zea mays L.). Plants 2023, 12, 1407. [Google Scholar] [CrossRef]
  45. Pittman, J.K. Managing the manganese: Molecular mechanisms of manganese transport and homeostasis. New Phytol. 2005, 167, 733–742. [Google Scholar] [CrossRef]
  46. Bradl, H.B. Adsorption of heavy metal ions on soils and soils constituents. J. Colloid Interf. Sci. 2004, 277, 1–18. [Google Scholar] [CrossRef]
  47. Khabaz-Saberi, H.; Setter, T.L.; Waters, I. Waterlogging induces high to toxic concentrations of iron, aluminum, and manganese in wheat varieties on acidic soil. J. Plant Nutr. 2007, 29, 899–911. [Google Scholar] [CrossRef]
  48. Hansel, C.M.; Zeiner, C.A.; Santelli, C.M.; Webb, S.M. Mn(II) oxidation by an ascomycete fungus is linked to superoxide production during asexual reproduction. Proc. Natl. Acad. Sci. USA 2012, 109, 12621–12625. [Google Scholar] [CrossRef] [PubMed]
  49. Rengel, Z. Availability of Mn, Zn and Fe in the rhizosphere. J. Soil. Sci. Plant Nutr. 2015, 15, 397–409. [Google Scholar] [CrossRef]
  50. Huang, X.; Shabala, S.; Shabala, L.; Rengel, Z.; Wu, X.; Zhang, G.; Zhou, M. Linking waterlogging tolerance with Mn2+ toxicity: A case study for barley. Plant Biol. 2015, 17, 26–33. [Google Scholar] [CrossRef]
  51. Ying, J.G.; Liu, X.H.; Li, J.B.; Wu, Q.; Peng, S.A.; Jiang, C.C. Analysis of Cu and Mn contents in the soil and leaves of citrus orchards in Nanfeng and Quzhou. S. China Fruits 2016, 45, 15–18. [Google Scholar]
  52. Cheng, J.J.; Ding, C.F.; Li, X.G.; Zhang, T.L.; Wang, X.X. Soil quality evaluation for navel orange production systems in central subtropical China. Soil Till. Res. 2016, 155, 225–232. [Google Scholar] [CrossRef]
  53. Chun, C.P.; Peng, L.Z.; Ling, L.L.; Lai, J.J.; Cao, L.; Jiang, C.L. Study on the contents of macronutrients and medium nutrients in ‘Newhall’ navel orange leaves in Southern Jiangxi province of China. J. Fruit Sci. 2010, 27, 678–682. [Google Scholar]
  54. Andresen, E.; Peiter, E.; Küpper, H. Trace metal metabolism in plants. J. Exp. Bot. 2018, 69, 909–954. [Google Scholar] [CrossRef]
  55. Li, Z.Y.; Zhang, Y.; Han, L.H.; Xu, J.Z. The interactive effects of nitrogen and calcium on photosynthetic characteristics and chlorophyll fluorescence parameters of nectarine under protected culture. Plant Nutr. Fert. Sci. 2013, 19, 893–900. [Google Scholar]
  56. Huang, C.; Barker, S.J.; Langridge, P.; Smith, F.W.; Graham, R.D. Zinc deficiency up-regulates expression of high-affinity phosphate transporter genes in both phosphate-sufficient and -deficient barley roots. Plant Physiol. 2000, 124, 415–422. [Google Scholar] [CrossRef]
  57. Camacho-Cristóbal, J.J.; González-Fontes, A. Boron deficiency decreases plasmalemma H+-ATPase expression and nitrate uptake, and promotes ammonium assimilation into asparagine in tobacco roots. Planta 2007, 226, 443–451. [Google Scholar] [CrossRef] [PubMed]
  58. Matas, M.A.; González-Fontes, A.; Camacho-Cristóbal, J.J. Effect of boron supply on nitrate concentration and its reduction in roots and leaves of tobacco plants. Biol. Plant. 2009, 53, 120–124. [Google Scholar] [CrossRef]
  59. Koshiba, T.; Kobayashi, M.; Ishihara, A.; Matoh, T. Boron nutrition of cultured tobacco BY-2 cells. VI. Calcium is involved in early responses to boron deprivation. Plant Cell Physiol. 2010, 51, 323–327. [Google Scholar] [CrossRef] [PubMed]
  60. Quiles-Pando, C.; Rexach, J.; Navarro-Gochicoa, M.T.; Camacho-Cristóbal, J.J.; Herrera-Rodríguez, M.B.; González-Fontes, A. Boron deficiency increases the levels of cytosolic Ca2+ and expression of Ca2+-related genes in Arabidopsis thaliana roots. Plant Physiol. Biochem. 2013, 65, 55–60. [Google Scholar] [CrossRef]
  61. Zhou, G.F.; Wei, Q.J.; Li, B.X.; Zeng, X.L.; Liu, G.D. Establishment and optimization of hydroponic culture system for root morphologic and nutritional analysis of trifoliate orange [Poncirus trifoliata (L.) Raf]. Sci. Agr. 2020, 77, e20180261. [Google Scholar] [CrossRef]
  62. Ling, L.L.; Huang, Y.; Peng, L.Z.; Wu, Y.T.; Jiang, C.L.; Cao, L.; Chun, C.P. Influence of magnesium deficiency and excess on chlorophyll fluorescence characteristics of ‘Newhall’ navel orange leaves. Acta Ecol. Sin. 2014, 34, 1672–1680. [Google Scholar] [CrossRef]
  63. Xiong, S.M.; Zuo, X.F.; Zhu, Y.Y. Determination of cellulose, hemi-cellulose and lignin in rice hull. Cereal Feed Ind. 2005, 8, 40–41. [Google Scholar]
  64. Chowdhury, S.; Dutt, S. Vein-splitting, a boron deficiency disease of citrus in Assam. Sci. Cult. 1950, 15, 358–359. [Google Scholar]
  65. Li, J.; Xie, Z.C.; Xie, W.L.; Wu, X.M.; Shi, Q. Relationship between leaf vein splitting and mineral nutrition of citrus. Acta Hortic. Sin. 2011, 38, 425–433. [Google Scholar]
  66. Xi, F.S.; Wu, Y.J.; Xiang, D.Y. The causes of severe physiological shoot blight of fast-growing eucalyptus and emergency control measures. Guangxi For. Sci. 2005, 34, 73–75. [Google Scholar]
  67. Tewari, R.K.; Kumar, P.; Sharma, P.N. Morphology and oxidative physiology of boron-deficient mulberry plants. Tree Physiol. 2010, 30, 68–77. [Google Scholar] [CrossRef] [PubMed]
  68. Liu, G.D.; Jiang, C.C.; Wang, Y.H. Distribution of boron and its forms in young ‘Newhall’ navel orange (Citrus sinensis Osb.) plants grafted on two rootstocks in response to deficient and excessive boron. Soil Sci. Plant Nutr. 2011, 57, 93–104. [Google Scholar] [CrossRef]
  69. Ye, X.; Huang, H.Y.; Wu, F.L.; Cai, L.Y.; Chen, L.S. Molecular mechanisms for magnesium-deficiency-induced leaf vein lignification, enlargement and cracking in Citrus sinensis revealed by RNA-Seq. Tree Physiol. 2020, 41, 280–301. [Google Scholar] [CrossRef]
  70. Bagherian, S.A.A.; Izadpanah, K. Two novel variants of hop stunt viroid associated with yellow corky vein disease of sweet orange and split bark disorder of sweet lime. J. Kühn Arch. 2010, 427, 105–113. [Google Scholar]
  71. Ye, X.; Chen, X.F.; Deng, C.L.; Yang, L.T.; Guo, J.X.; Chen, L.S. Magnesium-deficiency effects on pigments, photosynthesis and photosynthetic electron transport of leaves, and nutrients of leaf blades and veins in Citrus sinensis seedlings. Plants 2019, 8, 389. [Google Scholar] [CrossRef]
  72. Zhao, Q.; Dixon, R.A. Transcriptional networks for lignin biosynthesis: More complex than we thought? Trends Plant Sci. 2011, 16, 227–233. [Google Scholar] [CrossRef]
  73. Liu, Q.Q.; Luo, L.; Zheng, L.Q. Lignins: Biosynthesis and biological functions in plants. Int. J. Mol. Sci. 2018, 19, 335. [Google Scholar] [CrossRef] [PubMed]
  74. Moura, J.C.M.S.; Bonine, C.A.V.; Viana, J.D.O.F.; Dornelas, M.C.; Mazzafera, P. Abiotic and biotic stresses and changes in the lignin content and composition in plants. J. Integr. Plant Biol. 2020, 52, 360–376. [Google Scholar] [CrossRef] [PubMed]
  75. Lidon, F.C.; Barreiro, M.; Ramalho, J. Manganese accumulation in rice: Implications for photosynthetic functioning. J. Plant Physiol. 2004, 161, 1235–1244. [Google Scholar] [CrossRef] [PubMed]
  76. Fan, L.; Linker, R.; Gepstein, S.; Tanimoto, E.; Yamamoto, R.; Neumann, P.M. Progressive inhibition by water deficit of cell wall extensibility and growth along the elongation zone of maize roots is related to increased lignin metabolism and progressive stelar accumulation of wall phenolics. Plant Physiol. 2006, 140, 603–612. [Google Scholar] [CrossRef]
  77. Wei, H.; Dhanaraj, A.L.; Arora, R.; Rowland, L.J.; Fu, Y.; Sun, L. Identification of cold acclimation-responsive Rhododendron genes for lipid metabolism, membrane transport and lignin biosynthesis: Importance of moderately abundant ESTs in genomic studies. Plant Cell Environ. 2006, 29, 558–570. [Google Scholar] [CrossRef]
  78. Moura-Sobczak, J.; Souza, U.; Mazzafera, P. Drought stress and changes in the lignin content and composition in Eucalyptus. BMC Proc. 2011, 5, 103. [Google Scholar] [CrossRef]
  79. Wang, Y.J.; Sheng, L.P.; Zhang, H.R.; Du, X.P.; An, C.; Xia, X.L.; Chen, F.D.; Jiang, J.F.; Chen, S.M. CmMYB19 over-expression improves aphid tolerance in chrysanthemum by promoting lignin synthesis. Int. J. Mol. Sci. 2017, 18, 619. [Google Scholar] [CrossRef]
  80. Liu, W.G.; Ren, M.L.; Liu, T.; Du, Y.L.; Zhou, T.; Liu, X.M.; Liu, J.; Hussain, S.; Yang, W.Y. Effect of shade stress on lignin biosynthesis in soybean stems. J. Integr. Agr. 2018, 17, 1594–1604. [Google Scholar] [CrossRef]
  81. Wen, B.X.; Zhang, Y.; Hussain, S.; Wang, S.; Zhang, X.W.; Yang, J.Y.; Xu, M.; Qin, S.S.; Yang, W.Y.; Liu, W.G. Slight shading stress at seedling stage does not reduce lignin biosynthesis or affect lodging resistance of soybean stems. Agronomy 2020, 10, 544. [Google Scholar] [CrossRef]
  82. Li, C.H.; Luo, Y.L.; Jin, M.; Sun, S.F.; Wang, Z.L.; Li, Y. Response of lignin metabolism to light quality in wheat population. Front. Plant Sci. 2021, 12, 729647. [Google Scholar] [CrossRef]
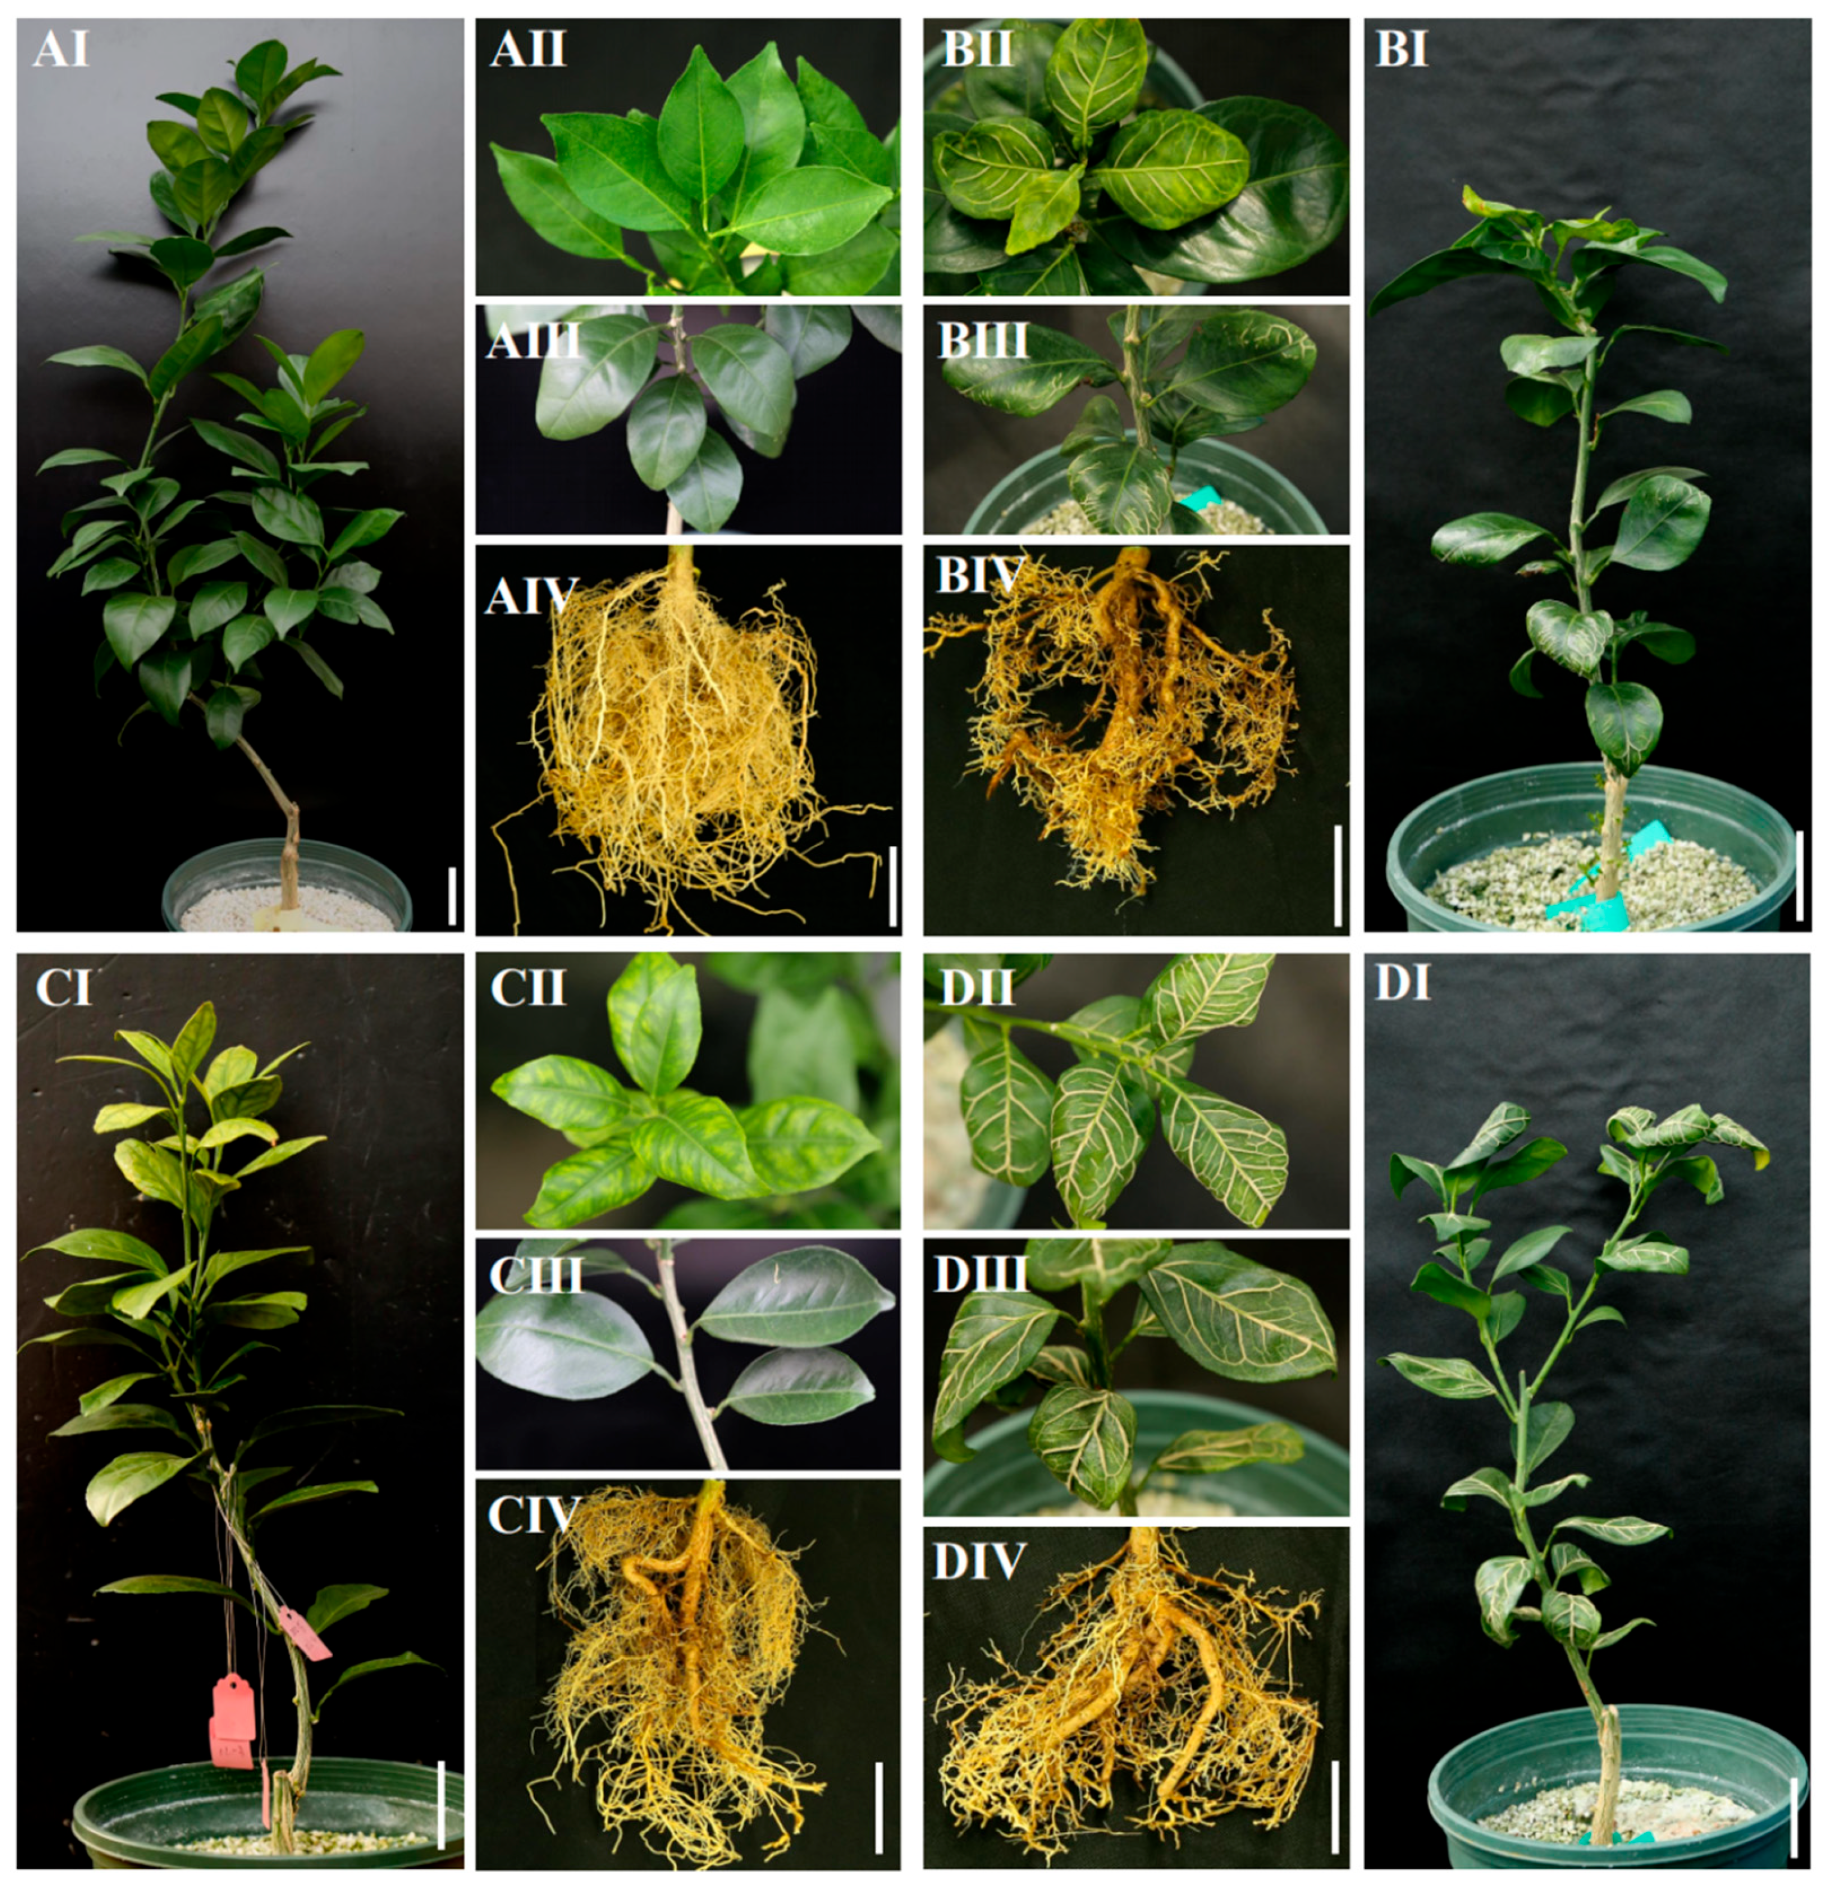
Figure 1. Symptoms of ‘Newhall’ navel orange [Citrus sinensis (L.) Osb. CV. Newhall] under boron and manganese co-deficiency treatment for 31 weeks. Two-year-old plants were grown in sand culture and treated under control (A), boron deficiency (B), manganese deficiency (C), and boron + manganese co-deficiency (D) for 31 weeks. I, whole plant; II, secondary new leaf; III, old leaf; IV, root.
Horticulturae 11 01172 g001
Figure 2. Effect of boron and manganese co-deficiency on mineral nutrient concentrations in the leaves of ‘Newhall’ navel orange [Citrus sinensis (L.) Osb. CV. Newhall] seedlings. (A) boron concentration; (B) manganese concentration; (C) iron concentration; (D) copper concentration; (E) zinc concentration; (F) molybdenum concentration; (G) nitrogen concentration; (H) phosphorus concentration; (I) potassium concentration; (J) calcium concentration; (K) magnesium concentration. Two-year-old ‘Newhall’ navel orange seedlings were grown under boron, manganese, or boron and manganese co-deficiency conditions for 31 weeks. CK: Control; BD: Boron deficiency; MnD: Manganese deficiency; BD + MnD: Boron + manganese co-deficiency. Data are presented as the mean ± standard error of four biological replicates. DW, dry weight. Different lowercase letters above the bars indicate significant differences (p < 0.05) between the different treatments. OL, old leaf; PL, primary new leaf; SL, secondary new leaf.
Horticulturae 11 01172 g002
Figure 3. Effect of boron and manganese co-deficiency on gas exchange parameters of ‘Newhall’ navel orange [Citrus sinensis (L.) Osb. CV. Newhall] seedlings. (A) Pn, net photosynthetic rate; (B) Gs, stomatal conductance; (C) Ci, intercellular CO2 concentration; (D) Tr, transpiration rate. CK: Control; BD: Boron deficiency; MnD: Manganese deficiency; BD + MnD: Boron + manganese co-deficiency. The data in the figure is the mean ± standard error. Lowercase letters indicate significant differences at the 5% level among different treatments at the same time. OL, old leaf; PL, primary new leaf; SL, secondary new leaf. The asterisk indicates the significance of the difference between BD and BD + MnD treatments, signiffcant level * p < 0.05, ** p < 0.01, *** p < 0.001.
Horticulturae 11 01172 g003
Figure 4. Effect of boron and manganese co-deficiency on chlorophyll fluorescence parameters in the leaves of ‘Newhall’ navel orange [Citrus sinensis (L.) Osb. CV. Newhall] seedlings. (A,D) Chlorophyll fluorescence parameters of old leaves (OL) after 10, 14, 18, 21, 23, 25, 27, 29, and 31 weeks treatment; (B,E) Chlorophyll fluorescence parameters of primary new leaves (PL) after 21, 23, 25, 27, 29, and 31 weeks treatment; (C,F) Chlorophyll fluorescence parameters of secondary new leaves (SL) after 27, 29, and 31 weeks treatment. CK: Control; BD: Boron deficiency; MnD: Manganese deficiency; BD + MnD: Boron + manganese co-deficiency. Fo minimal fluorescence; Fm, maximal fluorescence; Fv, variable fluorescence; Fv/Fm, maximal photochemical efficiency of PSII; ETR, electron transport efficiency; Y(II), actual photochemical efficiency; Y(NPQ), Quantum yield of regulated energy dissipation; Y(NO), Quantum yield of non-regulated energy dissipation. Data are presented as the mean ± standard error of 12 biological replicates. All the data in figure (AC) are relative values, which were calculated based on the chlorophyll fluorescence value of the old leaves being 1.00 at the 10th week after treatment. Different lowercase letters above the bars in (DF) indicate significant differences (p < 0.05) between the different treatments.
Horticulturae 11 01172 g004
Figure 5. Effect of boron and manganese co-deficiency on the fructose (A), sucrose (B), and starch (C) contents in the leaves of ‘Newhall’ navel orange [Citrus sinensis (L.) Osb. CV. Newhall] seedlings. CK: Control; BD: Boron deficiency; MnD: Manganese deficiency; BD + MnD: Boron + manganese co-deficiency. DW, Dry weight. OL, old leaf; PL, primary new leaf; SL, secondary new leaf. Data are presented as the mean ± standard error of four biological replicates. Different lowercase letters above the bars indicate significant differences (p < 0.05) between the different treatments. The asterisk indicates the significance of the difference between BD and BD + MnD treatments, significance level * p < 0.05, ** p < 0.01, *** p < 0.001.
Horticulturae 11 01172 g005
Figure 6. Effect of boron and manganese co-deficiency on the photosynthetic enzyme activity of ‘Newhall’ navel orange [Citrus sinensis (L.) Osb. CV. Newhall] seedlings. (A) Calvin Benson cycle and the synthetic pathways of starch and sucrose in chloroplasts and cytoplasmic, (B) photosynthetic enzyme activity and (C) the activity of key enzymes for the synthesis of photosynthetic products. Green arrow indicates carboxylation catalyzed by Rubisco resulting in the formation of 3-PGA and competing oxygenase reaction of Rubisco. (B1) Rubisco, ribulose bisphosphate carboxylase/oxygenase; (B2) RCA, rubisco activase; (B3) TK, thymidine kinase; (B4) SBPase, sedoheptulose 1,7-bisphosphatase; (B5) FBA, fructose 1,6-bisphosphate aldolase; (B6) FBPase, fructose 1,6-bisphosphatase; (C1) NI, neutral invertase; (C2) AI, acid invertase; (C3) SS, sucrose synthetase; (C4) SPS, sucrose phosphate synthase. Other abbreviations in (A): CO2, carbon dioxide; 2GP, 2-phosphoglycerate; RuBP, ribulose 1,5-bisphosphate; 3-PGA, 3-phosphoglyceric acid; 1,3-PGA, glycerate 1,3-bisphosphate; GAP, glyceraldehyde 3-phosphate; Ru-5-P, ribulose 5-phosphate; R-5-P, ribose 5-phosphate; DHAP, dihydroxyacetone phosphate; F-1,6-BP, fructose 1,6-bisphosphate; F-6-P, fructose 6-phosphate; Xu-5-P, xylose 5-phosphate; E-4-P, erythritose 4-phosphate; S-1,7-BP, sedoheptulose 1,7-bisphosphate; S-7-P, sedoheptulose 7-phosphate; G-6-P, glucose 6-phosphate; Suc-P, sucrose phosphate; UDPG, uridine diphosphate glucose; UDP, uridine diphosphate. Data are presented as the mean ± standard error of four biological replicates. Different lowercase letters above the bars indicate significant differences (p < 0.05) between the different treatments. CK: Control; BD: Boron deficiency; MnD: Manganese deficiency; BD + MnD: Boron + manganese co-deficiency. The asterisk indicates the significance of the difference between BD and BD + MnD treatments, signiffcant level * p < 0.05, ** p < 0.01.
Horticulturae 11 01172 g006
Figure 7. Effects of boron and manganese co-deficiency on lignin metabolism in the leaf of ‘Newhall’ navel orange [Citrus sinensis (L.) Osb. CV. Newhall] seedlings. (A) lignin concentrations in leaves, (B) relative expression levels of key enzyme genes involved in lignin synthesis in the old and secondary new leaves, (C) concise schematic of lignin synthetic pathway. Two-year-old ‘Newhall’ navel orange seedlings were grown under boron, manganese, or boron and manganese co-deficiency conditions for 31 weeks. Data are presented as the mean ± SE of four biological replicates. Different lowercase letters above the bars indicate significant differences (p < 0.05) between the different treatments. The asterisk indicates the significance of the difference between BD and BD + MnD treatments, significance level * p < 0.05, ** p < 0.01, *** p < 0.001; Red asterisk indicates significant increase, while black asterisk indicates significant decrease. CK: Control; BD: Boron deficiency; MnD: Manganese deficiency; BD + MnD: Boron + manganese co-deficiency. PAL, phenylalanine ammonia-lyase; C4H, Cinnamic acid 4-hydroxylase; 4CL, 4-coumarate: coenzyme A ligase; CCR, Cinnamoyl-CoA reductase; CAD, cinnamyl alcohol dehydrogenase.
Horticulturae 11 01172 g007
Table 1. Effects of boron and manganese co-deficiency on growth of ‘Newhall’ navel orange [Citrus sinensis (L.) Osb. CV. Newhall] seedlings.
TreatmentsPlant Height
(cm)
Dry Weight (g plant−1)Root-Shoot Ratio
LeafStemRootTotal
CK74.8 ± 5.6 a14.5 ± 1.9 a20.3 ± 1.3 a25.9 ± 1.6 a60.7 ± 2.3 a0.77 ± 0.11 b
BD56.6 ± 1.3 c8.6 ± 1.7 b13.8 ± 1.0 c20.4 ± 0.9 b42.8 ± 2.3 c0.92 ± 0.06 a
MnD65.4 ± 2.3 b12.6 ± 0.7 a17.7 ± 1.4 b22.6 ± 1.1 ab52.9 ± 2.7 b0.75 ± 0.06 b
BD + MnD54.3 ± 2.8 c6.6 ± 2.1 b14.5 ± 2.3 c18.0 ± 1.3 b39.1 ± 3.6 c0.90 ± 0.13 a
Note: Two-year-old ‘Newhall’ navel orange seedlings were grown under different micronutrient deficiency conditions for 31 weeks. CK: control, BD: boron deficiency, MnD: manganese deficiency, and BD + MnD: Boron + manganese co-deficiency. Data are presented as the mean ± standard error of four biological replicates. Different lowercase letters following the mean values indicate significant differences (p < 0.05) between different treatment conditions.
Table 2. Effects of boron and manganese co-deficiency on photosynthetic pigment contents in leaves of ‘Newhall’ navel orange [Citrus sinensis (L.) Osb. CV. Newhall] seedlings.
Photosynthetic PigmentCKBDMnDBD + MnD
Chlorophyll a
(mg g−1 FW)
OL1.67 ± 0.08 a1.32 ± 0.06 b1.79 ± 0.07 a1.10 ± 0.01 c
PL2.02 ± 0.11 a2.07 ± 0.12 a1.64 ± 0.06 b1.78 ± 0.11 ab
SL1.98 ± 0.15 a1.46 ± 0.21 b1.16 ± 0.13 c1.42 ± 0.13 b
Chlorophyll b
(mg g−1 FW)
OL1.13 ± 0.07 a0.83 ± 0.06 b1.02 ± 0.11 ab0.68 ± 0.07 c
PL1.08 ± 0.05 a1.11 ± 0.10 a0.65 ± 0.03 b0.70 ± 0.04 b
SL1.19 ± 0.05 a0.85 ± 0.09 b0.74 ± 0.01 bc0.62 ± 0.05 c
Total chlorophyll
(mg g−1 FW)
OL2.76 ± 0.02 a2.15 ± 0.09 b2.81 ± 0.18 a1.78 ± 0.07 c
PL3.10 ± 0.06 a3.18 ± 0.18 a2.30 ± 0.08 b2.48 ± 0.15 b
SL3.17 ± 0.12 a2.31 ± 0.12 b1.89 ± 0.12 c2.04 ± 0.18 c
Note: Two-year-old ‘Newhall’ navel orange seedlings were grown under boron, manganese, or boron and manganese co-deficiency conditions for 31 weeks. CK: Control; BD: Boron deficiency; MnD: Manganese deficiency; BD + MnD: Boron + manganese co-deficiency. OL, old leaf; PL, primary new leaf; SL, secondary new leaf. Data are presented as the mean ± standard error of four biological replicates. FW, fresh weight. Different lowercase letters following the mean values in same line indicate significant differences (p < 0.05) between different treatment conditions.
Disclaimer/Publisher’s Note: The statements, opinions and data contained in all publications are solely those of the individual author(s) and contributor(s) and not of MDPI and/or the editor(s). MDPI and/or the editor(s) disclaim responsibility for any injury to people or property resulting from any ideas, methods, instructions or products referred to in the content.