Article

Tree Species Overcome Edaphic Heterogeneity in Shaping the Urban Orchard Soil Microbiome and Metabolome

by
Emoke Dalma Kovacs
and
Melinda Haydee Kovacs
*
Research Institute for Analytical Instrumentation Subsidiary, National Institute of Research and Development for Optoelectronics INOE 2000, Donath 67, 400293 Cluj-Napoca, Romania
*
Author to whom correspondence should be addressed.
Horticulturae 2025, 11(10), 1163; https://doi.org/10.3390/horticulturae11101163
Submission received: 26 August 2025 / Revised: 25 September 2025 / Accepted: 26 September 2025 / Published: 30 September 2025
(This article belongs to the Section Fruit Production Systems)

Abstract

Despite the increasing recognition of the role of urban orchard ecosystems in sustainable urban development, the mechanistic understanding of how tree species soil biochemical heterogeneity drives microbial community assembly, the spatial patterns governing microbe-environment interactions, and their collective contributions to ecosystem multifunctionality remain poorly characterized. This study investigated how Prunus species and soil depth affect microbial biodiversity and metabolomic signatures in an urban orchard in Cluj-Napoca, Romania. Soil samples were collected from five fruit tree species (apricot, peach, plum, cherry, and sour cherry) across three depths (0–10, 10–20, and 20–30 cm), resulting in 225 samples. The microbial community structure was analyzed through phospholipid fatty acid (PLFA) profiling, whereas the soil metabolome was analyzed by mass spectrometry techniques, including gas chromatography–mass spectrometry (GC–MS/MS) and MALDI time-of-flight (TOF/TOF) MS, which identified 489 compounds across 18 chemical classes. The results revealed significant tree species-specific effects on soil microbial biodiversity, with bacterial biomarkers dominating and total microbial biomass varying among species. The soils related to apricot trees presented the highest microbial activity, particularly in the surface layers. Metabolomic analysis revealed 247 distinct KEGG-annotated metabolites, with sour cherry exhibiting unique organic acid profiles and cherry showing distinctive quinone accumulation. Depth stratification influenced both microbial communities and metabolite composition, reflecting oxygen gradients and substrate availability. These findings provide mechanistic insights into urban orchard soil biogeochemistry, suggesting that strategic species selection can harness tree species-soil microbe interactions to optimize urban soil ecosystem services and enhance urban biodiversity conservation.

1. Introduction

Urban orchards are key agroecosystems within cities, delivering a range of essential ecosystem services that include the provision of nutrient-rich fruits [1], the regulation of the urban microclimate [2], and the promotion of social cohesion [3]. The soil microbiome plays a leading role in maintaining these services by regulating nutrient cycles, increasing stress resistance, and suppressing pathogens in orchard trees [4].
Previous studies have shown that cover plants might influence the structure and abundance of the soil microbiome through species-specific root exudates and metabolite deposition patterns [5]. In studies performed on cork oak and associated grassland soils, Marcos-Romero et al. [6] reported that the bacterial diversity was similar but that the fungal diversity was not. Finney et al. [7], for example, reported that oat (Avena sativa) and cereal rye (Secale cereale) preferentially stimulate arbuscular-mycorrhizal fungi, whereas hairy vetch (Vicia villosa) promotes saprotrophic fungi through the differential release of organic acids and phenolic compounds. Similarly, Tosi et al. [8] reported that oilseed radish (Raphanus sativus) reshaped both fungal and prokaryotic communities, but the magnitude of this shift depended on the soil texture and preexisting nutrient status, suggesting that metabolite bioavailability and microbial substrate utilization could be modulated by edaphic properties. This finding was recently strengthened by the study conducted by Lasa et al. [9], which revealed distinct profiles of the soil microbial network and its metabolic profiles after samples taken from healthy and affected Pinus pinaster trees were analyzed. These findings suggest that the edaphic properties of the soil influence the biotic properties of the soil ecosystem through metabolite-mediated mechanisms. It has been reported that different grass species foster characteristic bacterial assemblages through distinct rhizodeposition profiles [10]. For example, in alkaline–sodic soils, the rhizospheres of Sporobolus indicus and Panicum coloratum were dominated by Proteobacteria according to Dip et al. [11], whereas Actinobacteria prevailed in the alpine grassland of the Tibetan Plateau according to Jiang et al. [12], likely reflecting species-specific metabolite signatures that selectively recruit these taxa. This contrast emphasizes phylum-level niche specialization across both managed and native ecosystems driven by chemical gradients in the soil solution. Other studies highlight the influence of physicochemical soil properties in shaping microbial assemblages through metabolite availability and transformation processes [13,14]. It has been reported that tree species richness and water treatment interactions impact microbial biomass and activity through their effects on microbial functional diversity and identity [15]. Sridhar et al. [16] and Wan et al. [17] reported that soils with near-neutral pH support greater bacterial and fungal richness than acidic soils do, confirming that soil pH is a significant driver of microbial diversity and community composition. Luan et al. [18] subsequently successfully integrated pH into the metabolic theory of soil ecology to predict bacterial diversity, as pH impacts metabolite solubility and bioactivity. Furthermore, Kaur et al. [19] and Lori et al. [20] reported that organic farming practices, which increase organic carbon and nutrient availability, support more diverse and metabolically active microbiomes than conventional management practices do.
Despite the steady progress in soil ecology, orchard ecosystems still have significant knowledge gaps, particularly regarding the soil edaphic properties and metabolite-mediated interactions of fruit trees with the soil microbiome. We do not yet know how strongly individual tree species influence the phenotypic configuration of belowground microbial communities. Although numerous studies have shown that cover plant species can change the relative abundance of broad taxonomic groups (e.g., dominant bacteria [11] and fungal phyla [16]) through differentially abundant metabolite release [21], the downstream effects of these chemical signals on the phenotypic and functional architecture of the microbiome have rarely been studied. Furthermore, in orchard ecosystems, the capacity of individual fruit tree species to modify key soil physicochemical attributes and associated metabolite pools has not been systematically quantified. Consequently, the extent to which these tree-induced edaphic changes and metabolite signatures propagate to restructure the microbial phenotypic profile and population densities of resident bacterial and fungal assemblages remains poorly understood. Targeted investigations integrating soil chemistry, soil metabolite profiling, microbial phenotypic group abundance, and species-specific tree traits are therefore needed to elucidate the cascade interactions mediated by bioactive molecules. The comprehensive characterization of orchard soil microbiomes and their associated metabolite landscapes is especially critical in urban landscapes, where pronounced spatial variation in soil particle-size distribution, bulk density, and parent material creates a mosaic of edaphic niches with distinct chemical microenvironments [22]. This heterogeneity can either constrain or amplify microbial functional potential through differentially abundant metabolite accessibility and turnover rates, underscoring the need for site-specific management approaches [23]. Elucidating how individual fruit-tree species recruit and stabilize microbial consortia through metabolite-mediated signalling will enable practitioners to select tree species that align with local soil properties, thereby opening the potential for maximizing nutrient-use efficiency and enhancing tolerance to abiotic stress.
This study aims to elucidate how orchard tree species and soil layers modulate the soil microbial communities and associated metabolite profiles within urban orchards. Our focus was to identify potential correlations between the soil microbial phenotypic structure, metabolite composition, and relevant environmental factors across various tree species of the Prunus genus and soil depth. Addressing these knowledge gaps through integrated metabolomic–microbial analysis will generate actionable insights for precision management of urban orchards to increase ecosystem resilience.

2. Materials and Methods

2.1. Sampling Design

Soil sampling was conducted in a mature urban orchard located in Cluj-Napoca (46°48′03″ N, 23°38′33″ E), the second-largest municipality in Romania between 2023 and 2024. Cluj-Napoca (411,379 inhabitants [24]) experiences a warm and temperate climate with a mean temperature of 8.9 °C and 840 mm yr−1 of even precipitation [25]. The assessment employed a stratified hierarchical sampling design tailored to five Prunus taxa: apricot (Prunus armeniaca), peach (Prunus persica), plum (Prunus domestica), cherry (Prunus avium), and sour cherry (Prunus cerasus). Within each taxon, three contiguous orchard rows were delineated as primary sampling units. Along each row, five soil samples were collected from 0.5 m from a fruit tree. In each case, the soil samples were collected from three different depth layers (0–10 cm; 10–20 cm; 20–30 cm). In total, 225 soil samples were obtained, representing 5 fruits tree species × 3 rows × 5 samples from each raw × 3 depth layer (Figure 1). Through sampling, soil samples (approximately 100 g) were placed in zip bags and stored at 4 °C until they arrived in the laboratory.

2.2. Assessment of Soil Physicochemical Properties

The soil physicochemical properties in terms of texture, bulk density (BD), pH, water-extractable ions ( N O 3 , N H 4 + , C a 2 + , C l , M g 2 + , K + ) and soil organic matter (SOM) were determined according to the methods described in Kovacs et al. [26]. Briefly, soil pH and water-extractable ions were measured with a multiparametric ion analyzer (Imacimus Multi Ion, El Catllar, Spain) following the manufacturer’s protocol. Soil organic matter (SOM) was determined titrimetrically using the Walkley–Black method. Soil texture was assessed by the jar (sedimentation) method to estimate sand, silt, and clay fractions, and bulk density (BD) was measured using intact core samples (oven-dry mass/undisturbed core volume).

2.3. PLFA Approach

The soil microbiota living fraction phenotypic structure abundance was determined by phospholipid derived fatty acids (PLFA) analysis following the method described in [27]. Briefly, lipids were extracted by modified Blight and Dyer reagents and fractionated on a silica column [28]. The phospholipid fraction was subjected to trans-esterification, and the resulting fatty acid methyl esters were quantified using GC-FID [27]. The MIDI Sherlock™ Microbial Identification System (Microbial ID, Newark, DE, USA) was involved to assign individual PLFA biomarkers to functional bacterial (B) and fungal (F) guilds: Gram-positive (GP) bacteria, Gram-negative (GN) bacteria, aerobic bacteria, anaerobic bacteria, actinomycetes, and fungi (F). The molar sums of each guild were expressed as nmol g−1 dry soil, and dominance indices were derived as GP:GN, Aerobe–Anaerobe, F:B (F / [GP + GN + Aerobe + Anaerobe + Actinomycetes]), Actinomycetes–PLFA, Bacteria–PLFA ([GP + GN + Aerobe + Anaerobe + Actinomycetes] / total PLFA), and Fungal–PLFA (F/total PLFA). The total PLFAs represented the sum of all the determined PLFA biomarkers. Ratios > 0.5 show the relative predominance of the numerator guild, providing a quantitative measure of shifts in community structure.

2.4. Mass Spectrometric Assessment of Untargeted Soil Metabolites

Soil untargeted metabolites were extracted from 1 g of lyophilized soil samples. The samples were homogenized in 750 µL of an ice-cooled 1:2 (v/v) chloroform/methanol mixture for 5 min. Next, 250 µL of ice-cooled chloroform was added, and the mixture was homogenized with sample-solvent mixtures. After 5 min, this step was repeated, with 250 µL of ice-cooled deionized water added to the mixture. The mixture was incubated for 30 min on ice, after which the homogenate was centrifuged at 2000 rpm for 15 min. Layer separation was performed on ice, where the upper layer was maintained and the lower layer was discarded. The obtained residual chloroform was subjected to re-extraction twice with 450 µL of ice-cooled 1:2 (v/v) chloroform/methanol, 150 µL of ice-cooled chloroform and 150 µL of ice-cooled deionized water. The resulting three upper layers were pooled together. The obtained approximately 1000 µL extracts were split into two approximately equal parts for mass spectrometric analysis as follows:
(a.) GC–MS/MS analysis of untargeted metabolites—In that case, to the extract 100 µL of methoxyamine hydrochloride solution (0.02 g·mL−1 in pyridine) was added and allowed to react for 60 min at 30 °C. Next, 100 µL of MSTFA was added, and the mixture was incubated at 50 °C for 30 min. After incubation, 2 µL was injected into a Thermo Finningan gas chromatograph linked to a triple quadruple mass spectrometer (Trace 1310 GC-TSQ 9000 MS, Thermo Scientific, Waltham, MA, USA) equipped with an SSL injector port set at 250 °C. The metabolites were separated through an HP-5MS capillary column (30 m × 0.25 mm × 0.25 µm; Hewlett Packard, Palo Alto, CA, USA). Helium was used as the carrier gas at a flow rate of 1 mL·min−1. The oven temperature programme started at 40 °C for 7 min−1, followed by a ramp of 5 °C·min−1 to 285 °C, held at this final temperature for 7 min. The solvent delay time was set at 3.5 min. The ion source was set at 230 °C and operated in electron ionization mode (EI) at 70 eV. The ion scanning range was 50–550 m/z. Primary data analysis was conducted by Thermo Scientific Xcalibur 4.0 software (Thermo Fisher Scientific), followed by MS-DIAL version 4.9 software according to the procedures described by Lai et al. [29] and Kovacs et al. [30].
(b.) MALDI TOF/TOF MS analysis of untargeted metabolites—In that case, the remaining part of the extract was dried under a gentle stream of N2, after which it was reconstituted in a 25 µL mixture of 0.05% TFA, water and 2% ammonium hydroxide. Next, 2.5 µL of reconstituted sample was mixed with 2.5 µL of 9-aminoacridine (9-AA matrix solution of 10 mg·mL−1 in 0.1% TFA in acetone). One microliter of this obtained sample mixture was pipetted onto a MALDI-TOF target (MTP 384 polished steel target Bruker Daltonics, Bremen, Germany) and allowed to air dry at room temperature. Mass spectra were acquired with a MALDI TOF/TOF IMS analyser (Autoflex maX, Bruker Daltonics, Bremen, Germany) equipped with a Smartbeam-II laser (Nd:Yag—355 nm). Prior to analysis, calibration was performed in linear mode using a standard mixture of metabolites (lactate, succinate, malate, AMP, ATP, CoA). The instrument was operated in linear negative ion mode. For acquisition, the laser intensity was set to 35%, and the laser frequency was set to 500 Hz. Approximately 2000 laser shots were totaled per raster position. Data analysis was performed by Bruker data management software flexAnalysis version 3.4 with the centroid peak detection algorithm and the baseline subtraction TopHat. The R-MetaboList 2 and rMSIfragment tools were subsequently used for metabolite annotation according to the procedures of Baquer et al. [31] and Peris-Diaz et al. [32].

2.5. Statistical Analysis

All analyses were performed with R (v 4.3.3, R Core Team) with the packages ‘tidyr’, ’dplyr’, ‘ggplot2’, ‘viridis’, ‘agricolae’, ‘FactoMineR’, ‘ComplexHeatmap’, ‘cluster’, ‘clusterProfiler’, ‘ReactomePA’ and ‘igraph’. Descriptive statistics (means ± SE) were calculated for microbial parameters across tree species and soil depths. Prior to statistical analysis, data normality and homogeneity of variance were assessed with Shapiro–Wilk and Levene’s tests, respectively. One-way ANOVA was used to examine differences in microbial communities between soil depths and among tree species, with post hoc Tukey’s honest significant difference (HSD) tests applied for multiple comparisons (significance set at p < 0.05). The results are presented as bar plots with error bars (±SE) and alphabetic annotations to denote statistically homogeneous groups. The uppercase letters indicate variation among depths, whereas the lowercase letters indicate variation among tree species. Pearson correlation analysis was employed to assess the relationships between the microbial community parameters and the soil properties. Principal component analysis (PCA) was applied to examine the relationships between the soil microbial community composition and the physicochemical properties across the three soil depths. The variables were centred and scaled prior to PCA. For metabolomic analysis, hierarchical clustering of identified metabolites was performed with the Euclidian distance. The data were z score normalized prior to clustering, followed by dendrogram visualization. Metabolic pathway enrichment analysis was subsequently conducted with network topology construction by force-directed layout algorithms, and statistical significance was visualized through node sizing and FDR-corrected p-value colour mapping.

3. Results

3.1. Soil Microbial Community Composition

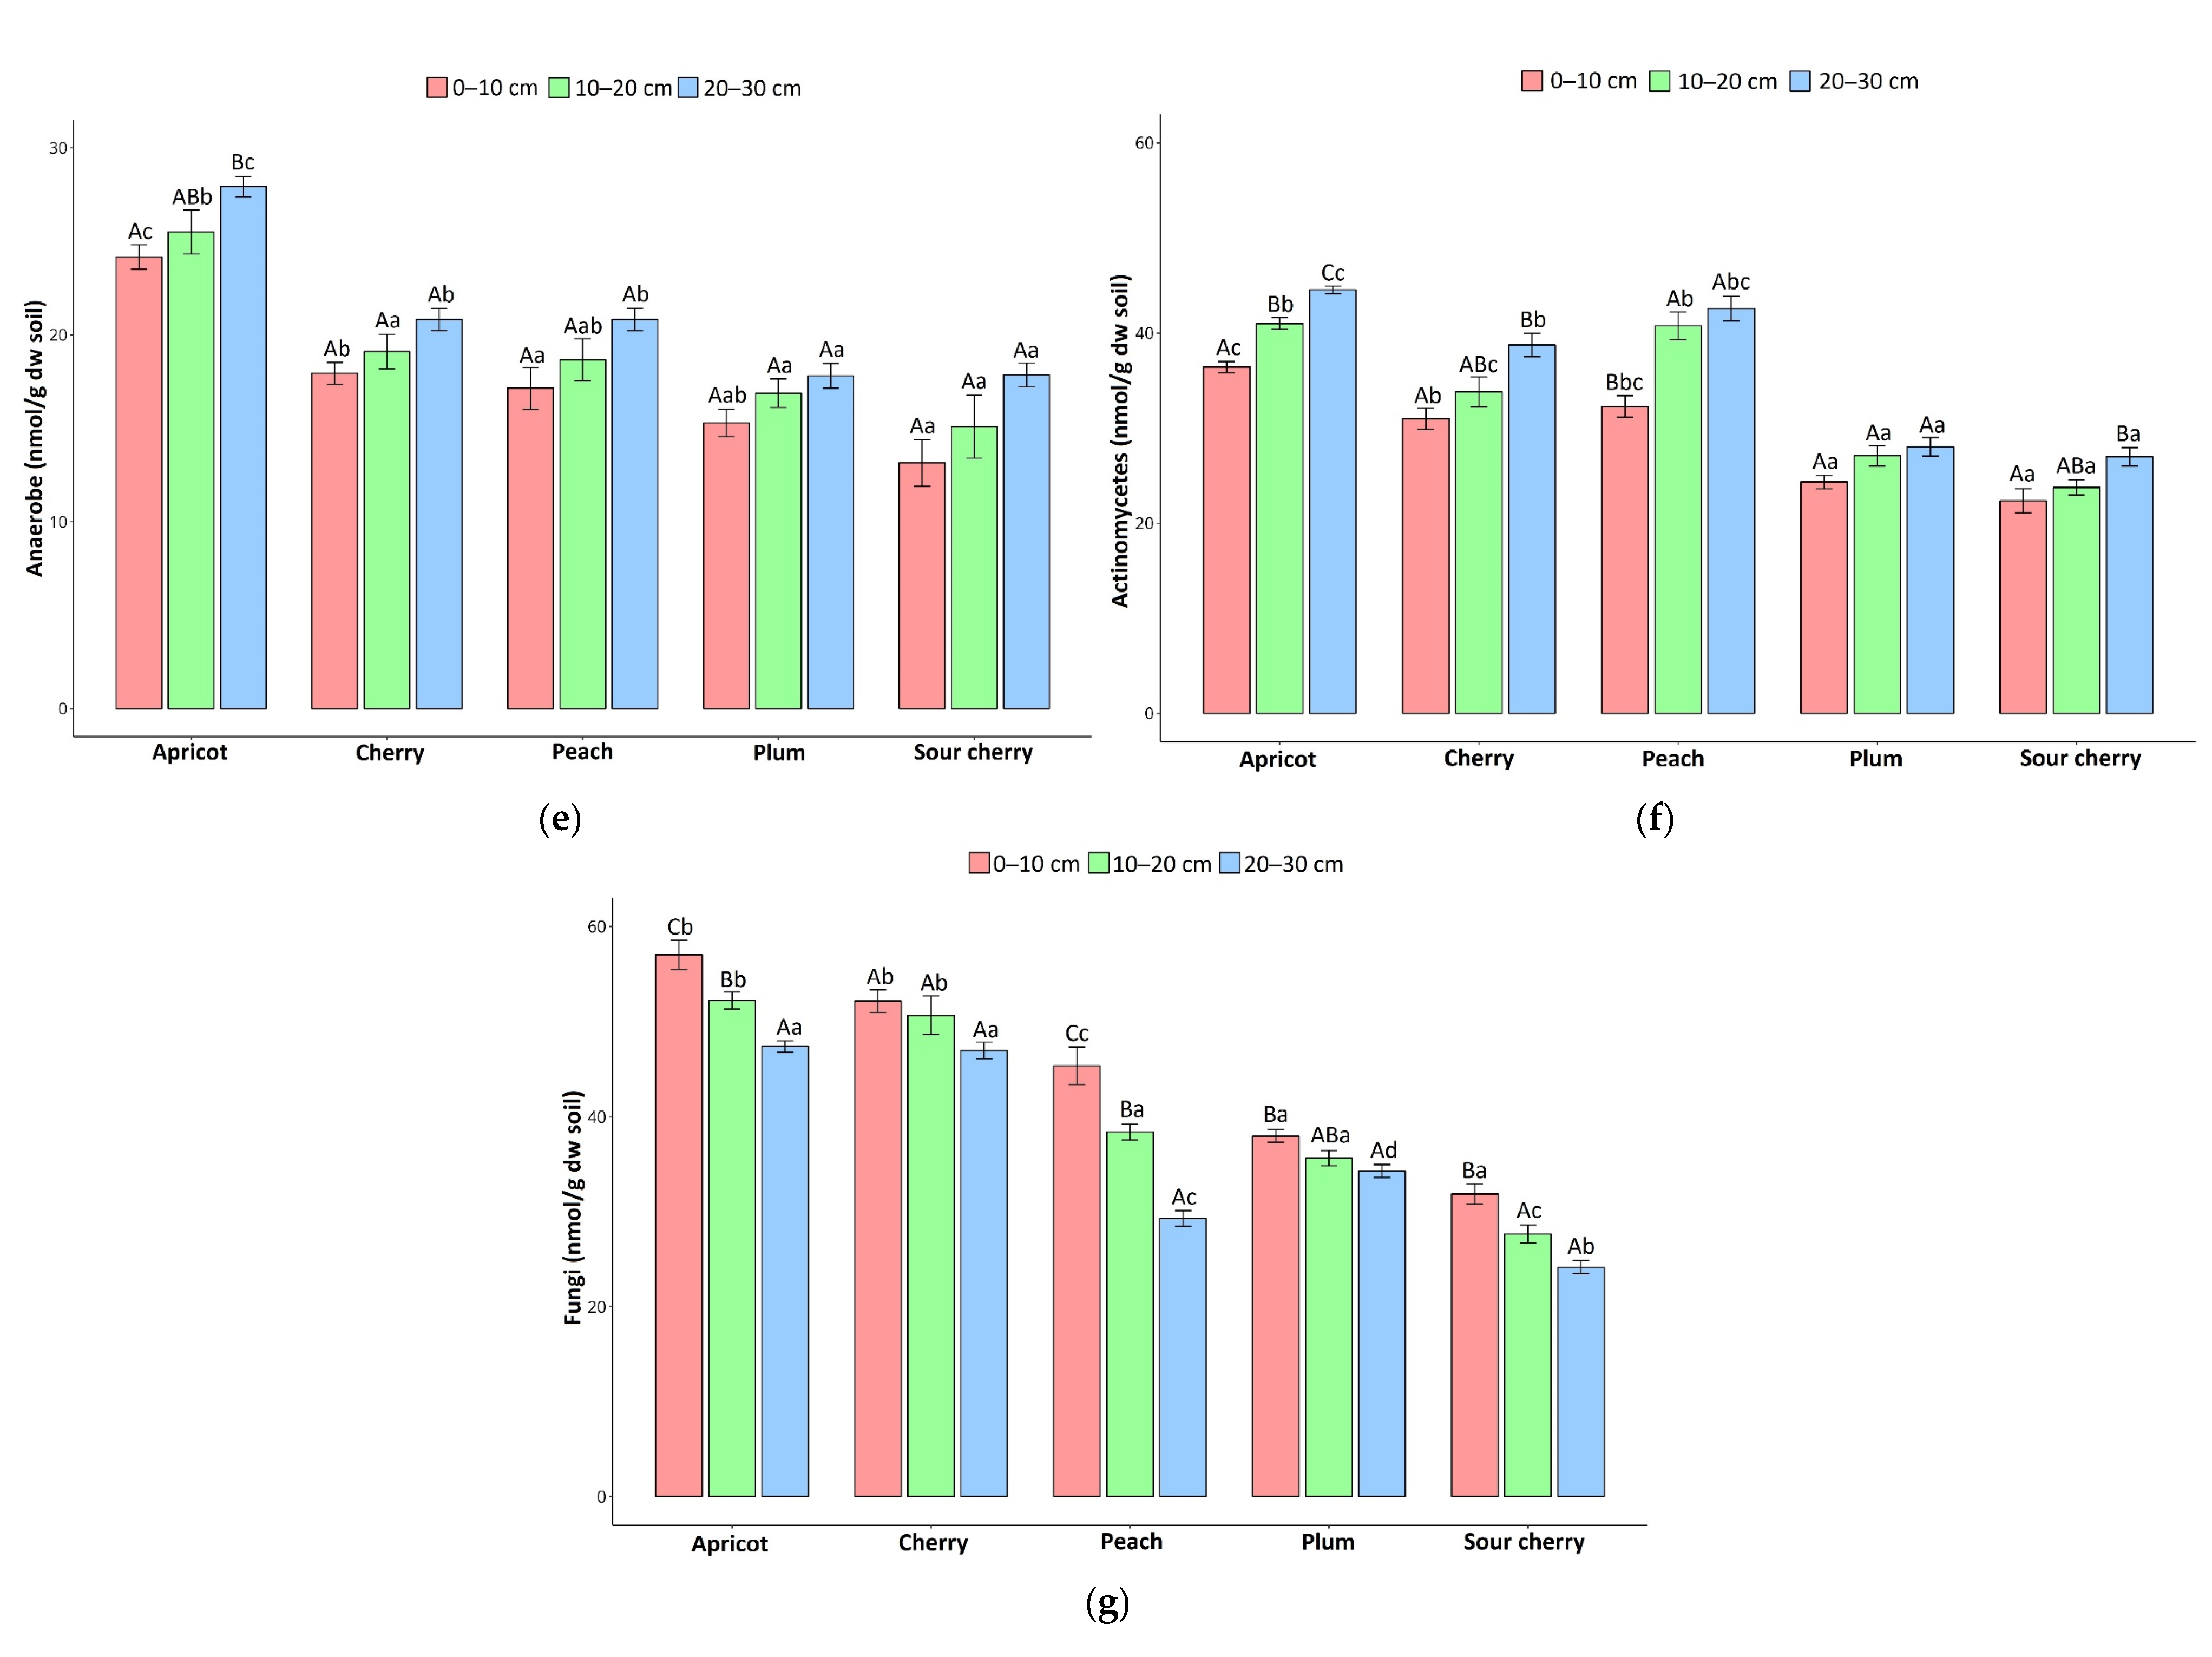
In urban orchard soil, the total PLFA abundance ranged from 168.9 to 422.7 nmol·g−1 d.w. soil. Bacterial biomarkers dominated, with total bacterial PLFA abundances varying between 144 and 373.7 nmol·g−1 d.w. soil, whereas total fungal PLFAs ranged from 22.8 to 59 nmol·g−1 d.w. The PLFA profile in urban orchard soils across tree species and depths is shown in Figure 2.
The soil microbial biomass varied significantly among the tree species (p < 0.05) and was highest under apricot, followed by cherry and peach, and lowest under plum and sour cherry. The total PLFA concentrations decreased with depth, peaking at 0–10 cm and declining at 20–30 cm (Figure 2a). Among the phenotypes, Gram-negative (GN) bacteria were the most abundant, followed by Gram-positive (GP) bacteria, both of which peaked in apricot soils and were lowest in soils under sour cherry, decreasing significantly with depth across species (p < 0.05) (Figure 2b,c). Aerobic bacterial biomarkers were most abundant under apricot, cherry, and peach and least abundant under plum and sour cherry (p < 0.05), with maxima at 0–10 cm and sharp declines with depth (Figure 2d). In contrast, anaerobic bacterial biomarkers were highest under apricot and lower in other species, increasing with depth: lowest at 0–10 cm and progressively higher across all species (Figure 2e). Actinomycetes were most abundant under apricot and peach, intermediate under cherry, and lowest under plum and sour cherry (p < 0.05) and increased with depth (Figure 2f). Fungal biomarkers were highest under apricot and lowest under plum and sour cherry (p < 0.05), decreasing with depth, with maxima at 0–10 cm and lower levels deeper across all species (Figure 2g).
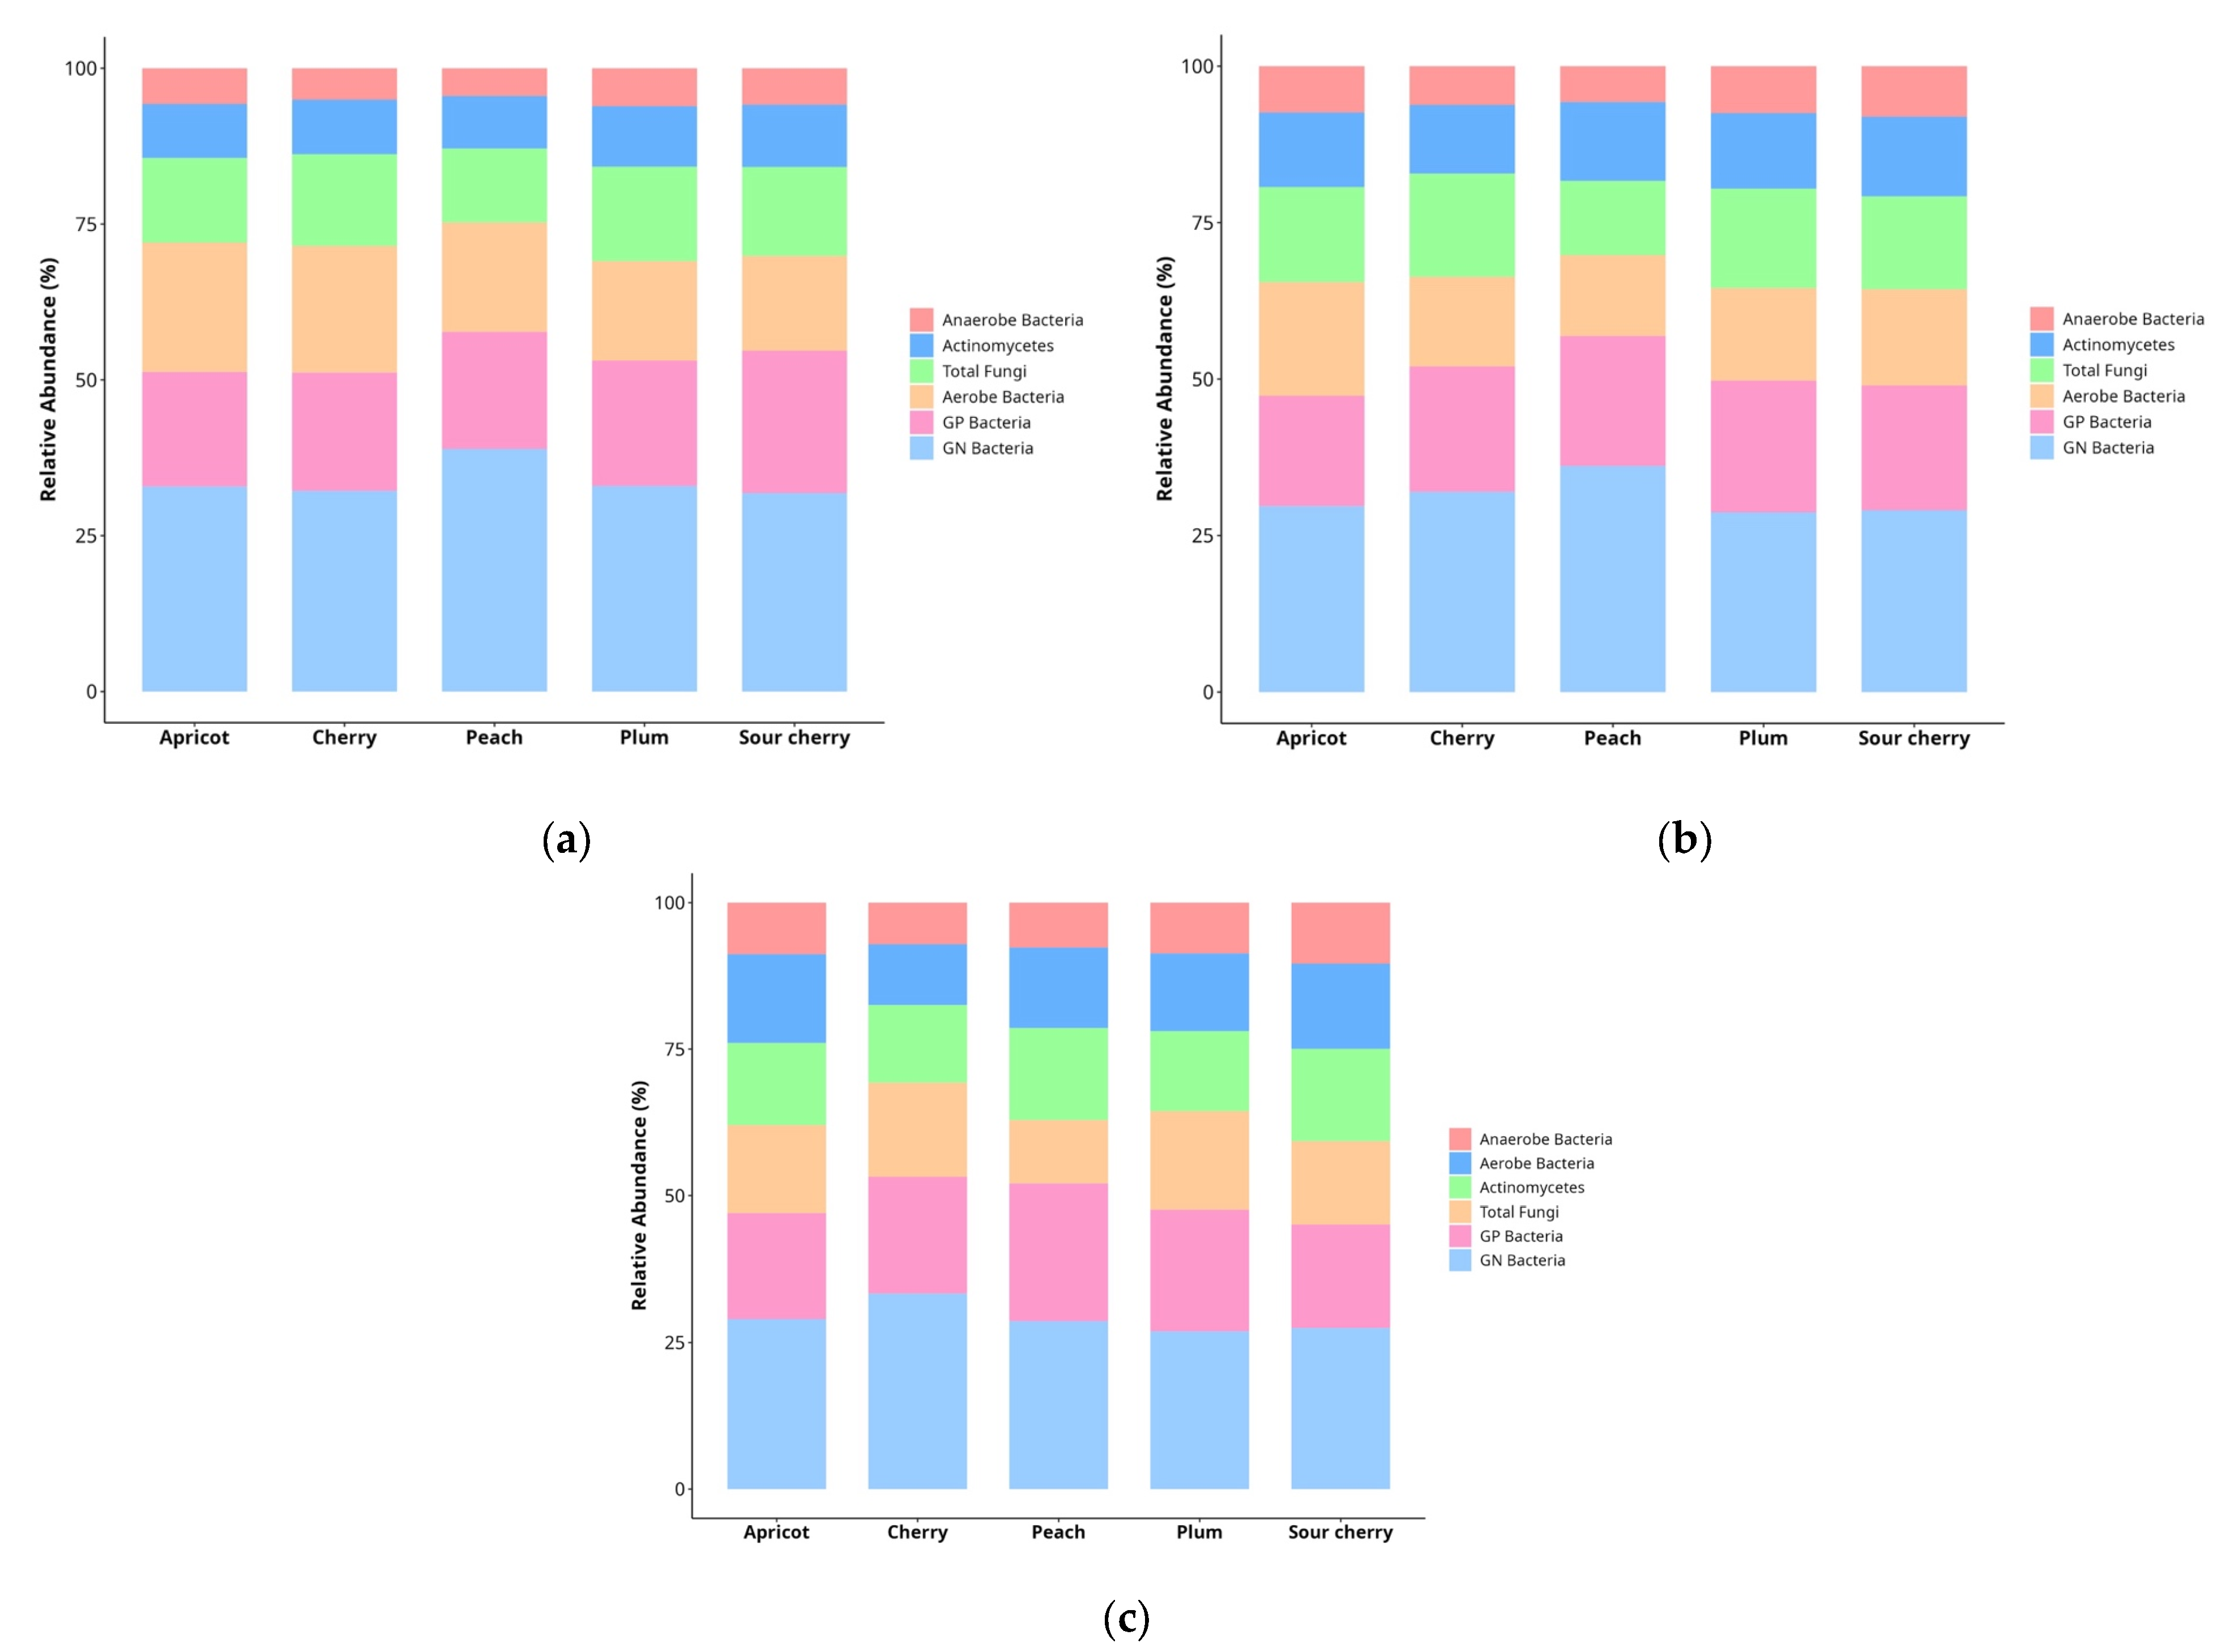
At the 0–10 cm depth, the relative abundance of GN was significantly greater in peach, at 18.2%, than in sour cherry. Among the GPs, sour cherry had a higher relative abundance (19.5%) than apricot did. Additionally, the percentage of aerobic bacteria in sour cherry was lower (26.6%) than that in apricot, whereas the percentage of fungal markers was substantially greater (21.9%) in plum than in peach (Figure 3a). At the 10–20 cm depth, peach maintained the highest proportion of GN bacteria (20.5%) relative to plum, whereas compared with apricot, plum had the greatest percentage of GP bacteria (16.3%). In this layer, the percentage of aerobic bacteria was significantly greater, at 29%, in apricot than in peach, and the percentage of anaerobic bacteria was greater in sour cherry, at 28.7%, than in peach (Figure 3b). At the 20–30 cm depth, plum presented the lowest proportion (19.3%) of GN bacteria compared with cherry. Moreover, GP bacteria were significantly more prevalent under peach, at 24.6%, than under sour cherry, while aerobic bacteria were more prevalent in apricot, at 31.6%, than in cherry. Fungal abundance was substantially greater in plums (35.4%) than in Peaches, and anaerobic bacteria were enriched in sour cherries (31.7%) relative to cherry (Figure 3c).

3.2. Correlations Between Soil Microbial Communities and Abiotic Parameters

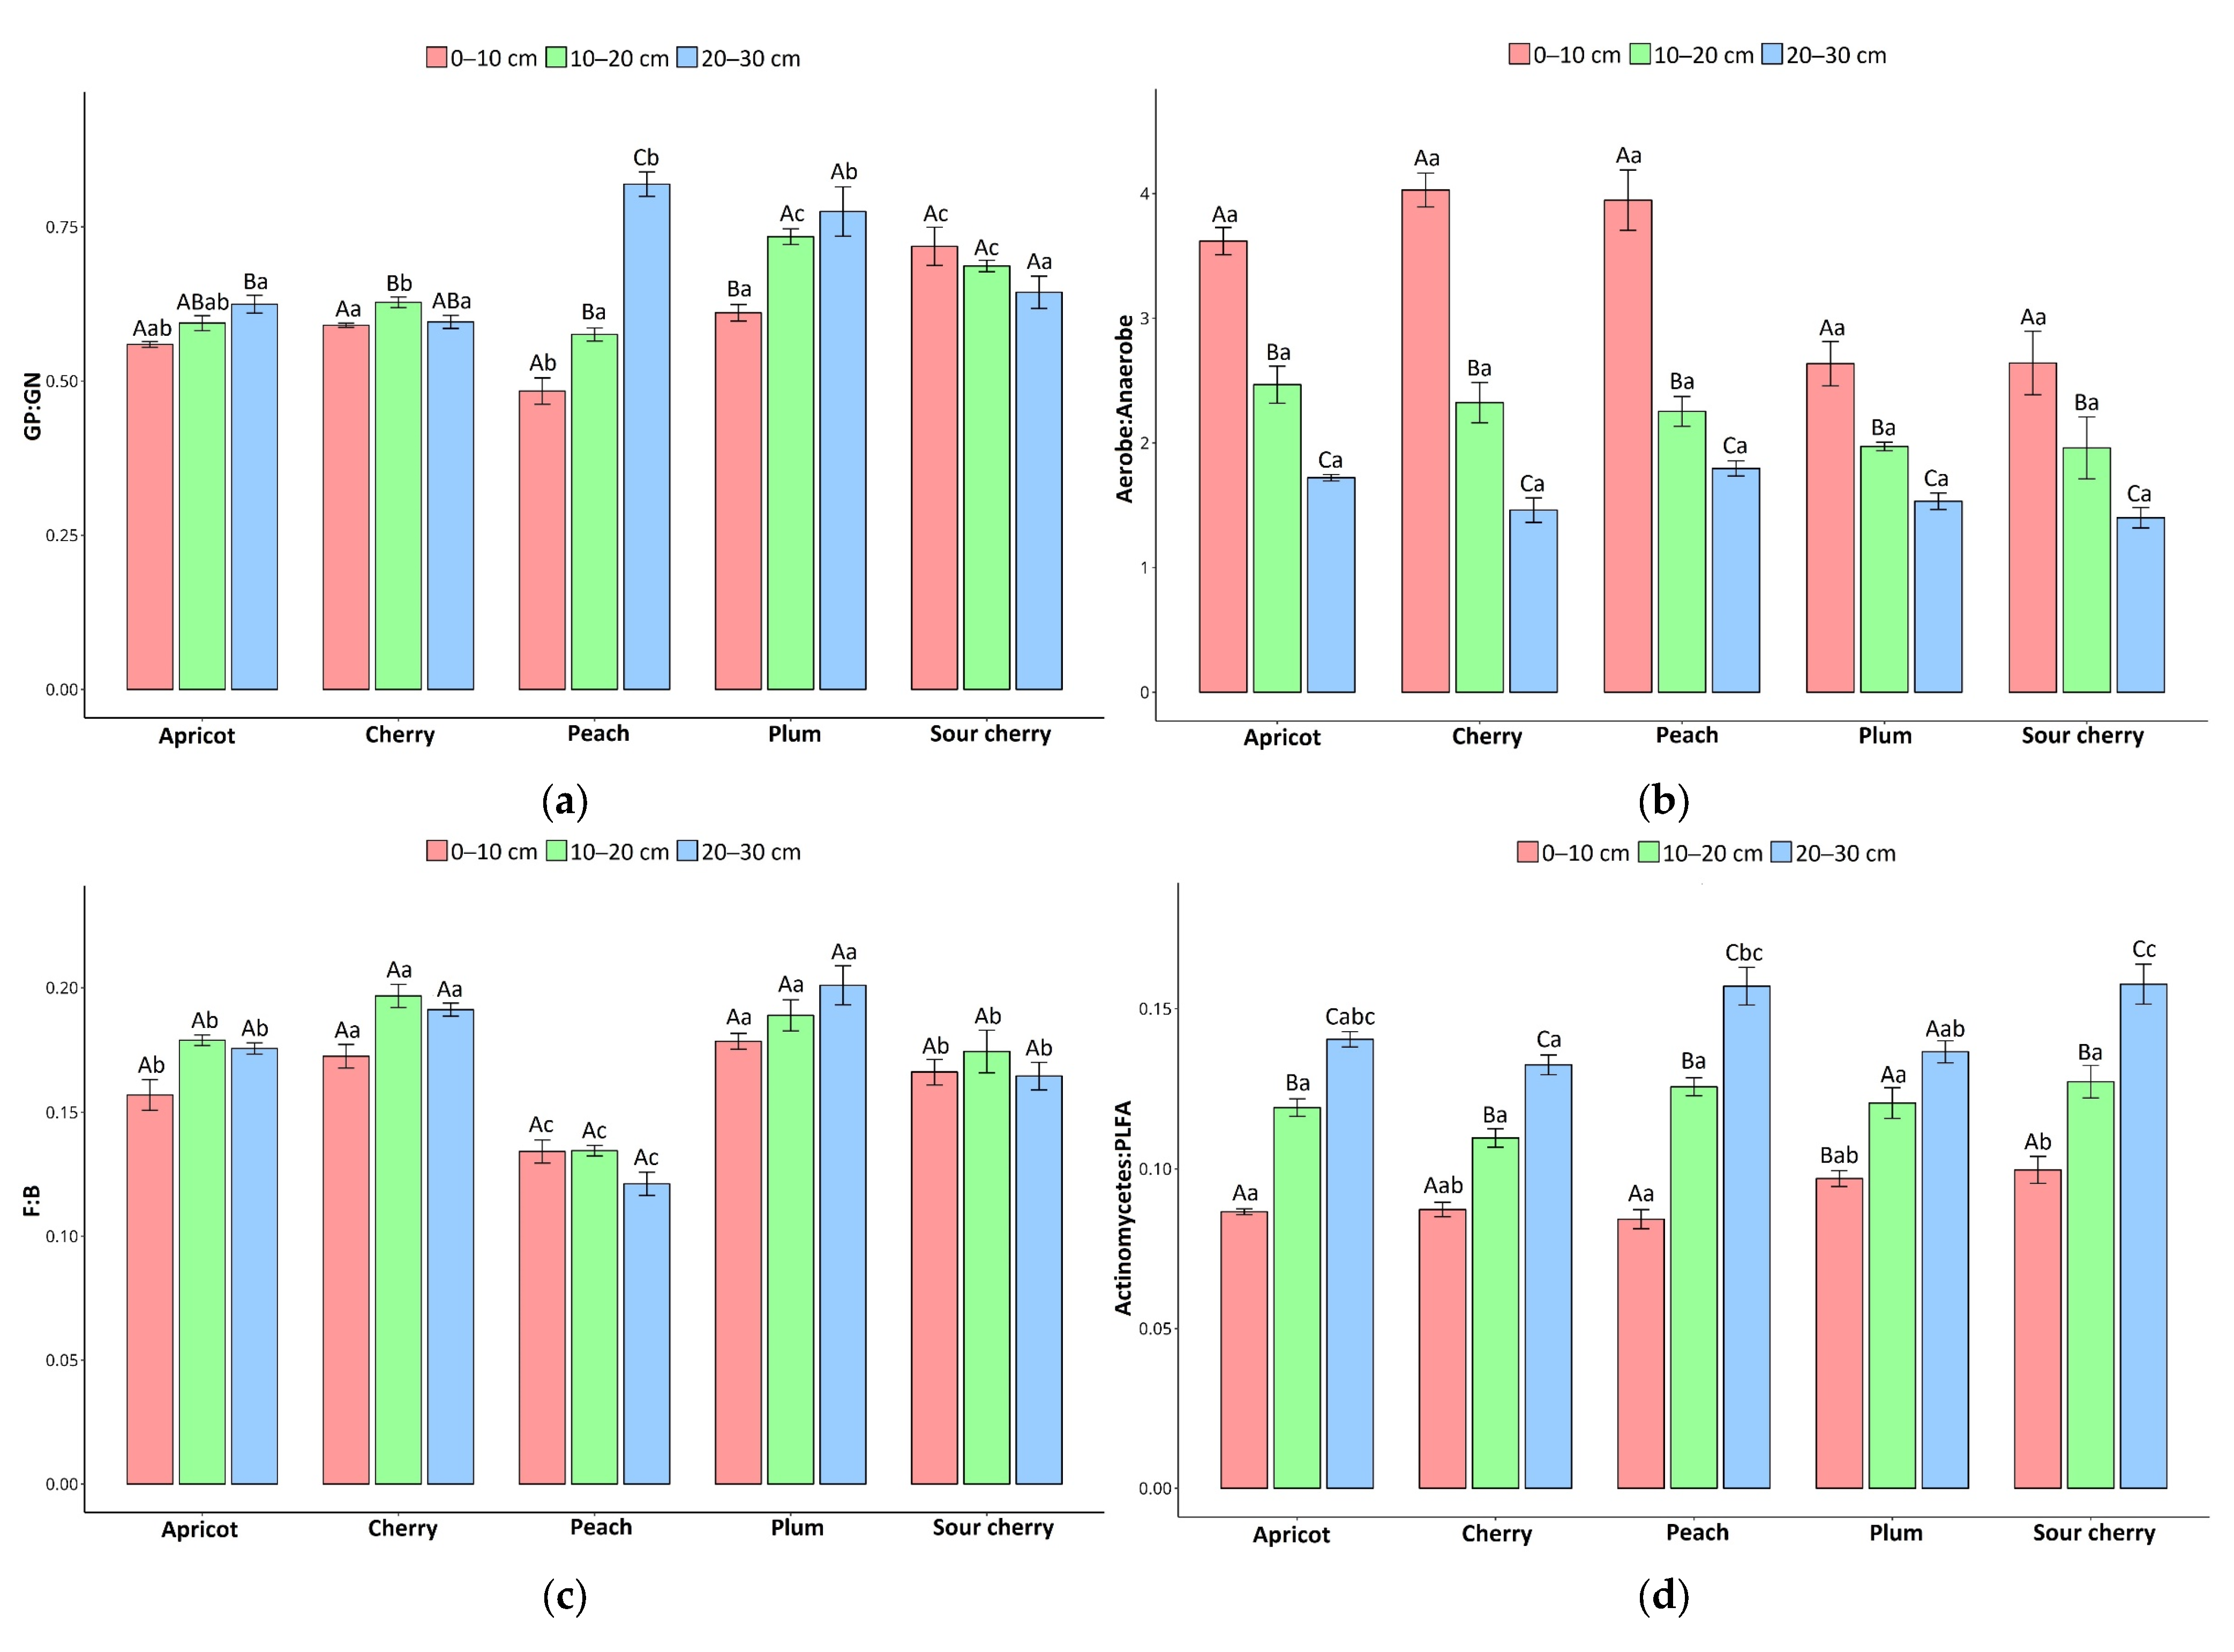
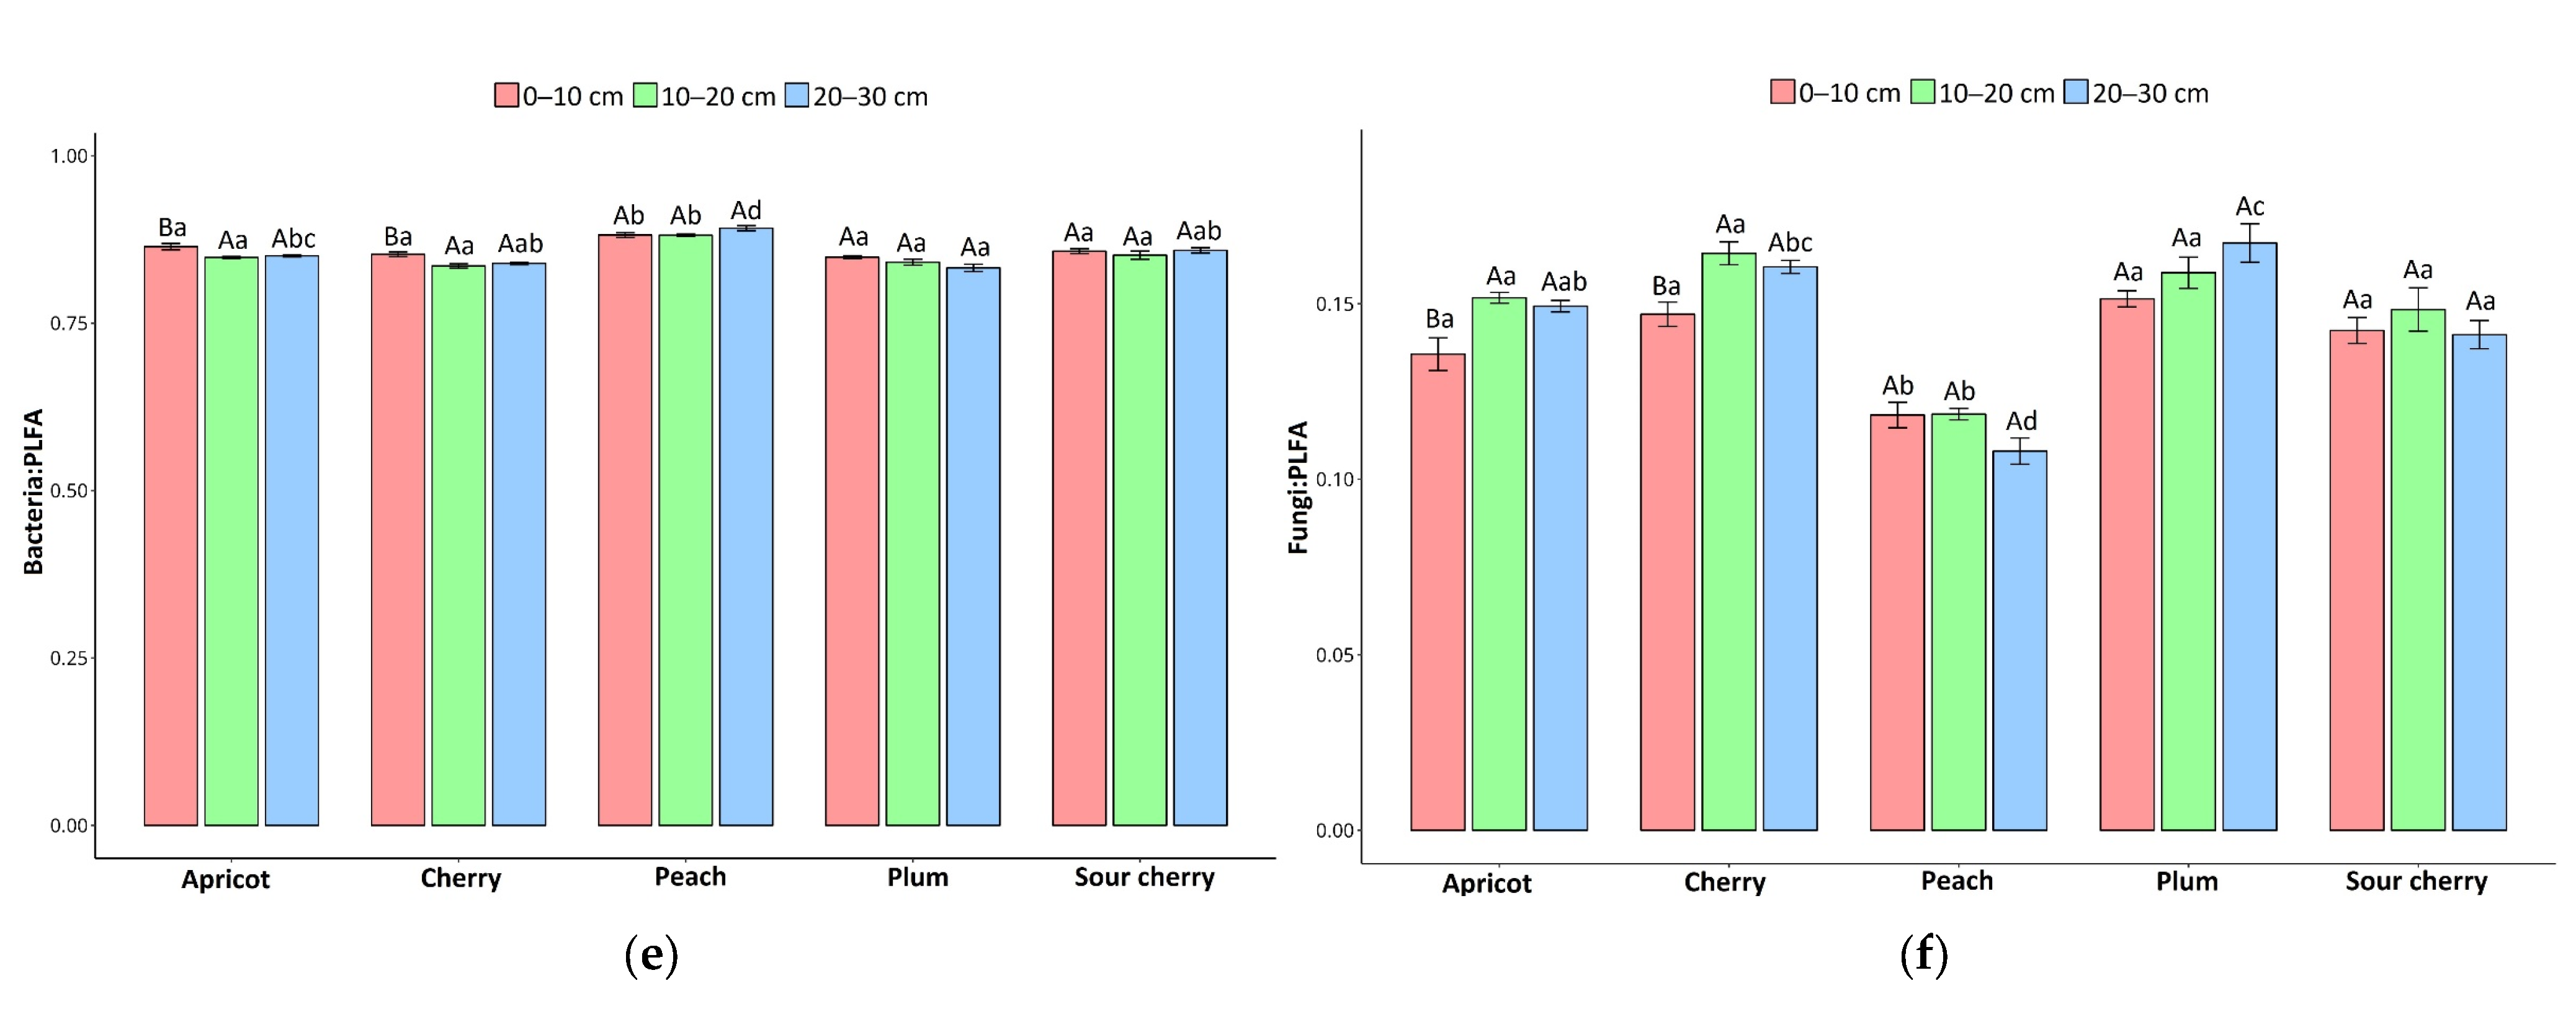
The orchard soil microbiome dominance based on the PLFA ratios is shown in Figure 4. The GP:GN bacterial ratio varied significantly among the species (p < 0.05), with the highest values in sour cherry, followed by cherry, while plum and apricot presented intermediate levels. It increased significantly with depth (p < 0.05) from 0–10 cm to 20–30 cm and was most pronounced in Peach (Figure 4a). The aerobe–anaerobe ratio was significantly greater at 0–10 cm and decreased with depth for Apricot, Cherry, and Peach, reaching minimum values at 20–30 cm. Plum and sour cherry maintained consistently lower ratios across all depths (p < 0.05) (Figure 4b). The F:B ratio was significantly greater in Cherry and Plum across depths (p < 0.05), lowest in Peach, and increased with depth in Cherry and Plum (highest at 20–30 cm), whereas Apricot and Sour Cherry presented intermediate values with minimal depth variation (Figure 4c). The Actinomycetes–PLFA ratio increased more under Peach and Sour Cherry than under Cherry, Plum, and Apricot (p < 0.05) and increased from 0–10 cm to 20–30 cm across all species (Figure 4d). The bacteria–PLFA ratios were highest in Peach, whereas those of the other species were significantly lower (p < 0.05). With depth, Peach remained relatively uniform, whereas the other species presented the highest values at 0–10 cm and decreased slightly with depth (Figure 4e). The fungi–PLFA ratio was highest under Cherry and Plum, lowest in Peach, followed by Apricot and Sour Cherry (p < 0.05), and increased with depth (lowest at 0–10 cm; highest at 20–30 cm) across all species (Figure 4f).
The total microbial abundance in the 0–10 cm depth layer was significantly positively correlated with soil pH and SOC (p < 0.001) but negatively correlated with bulk density (BD; p < 0.01). The identified bacterial phenotypes in this layer demonstrated distinct relationships with the measured soil physicochemical properties. All bacterial phenotypic groups were positively correlated with pH (p < 0.01), and positive correlations with SOC were also observed (p < 0.01), except for anaerobic bacteria. Similarly, fungal biomass was significantly positively correlated with both pH and SOC (p < 0.001). Among the bacteria-related ratios, the GP:GN ratio was characterized by significant negative correlations with pH and N O 3 (p < 0.01) and SOC (p < 0.05) and a positive association with BD (p < 0.01). The aerobe–anaerobe ratio was positively correlated with pH (p < 0.01) and SOC (p < 0.001). For the PLFA-based ratios, the bacterial–PLFA ratio was negatively correlated with BD and N H 4 + (p < 0.01), whereas the fungal–PLFA ratio and F:B ratio were positively correlated with these parameters (p < 0.001). The Actinomycetes–PLFA ratio was negatively associated with pH and SOC (p < 0.01), as presented in Table 1.
Our results revealed that at the 10–20 cm depth layer (Table 2), all bacterial phenotypes were positively correlated with pH (p < 0.01), whereas all bacterial groups except the GP were significantly negatively correlated with BD (p < 0.05). Fungal biomass maintained strong positive correlations with both pH and SOC (p < 0.01). Among the ratios, the GP:GN ratio continued to exhibit negative correlations with pH (p < 0.05), whereas the aerobe–anaerobe ratio remained robustly and positively associated with SOC (p < 0.05).
At the 20–30 cm depth layer (Table 3), all bacterial phenotypes maintained positive correlations with pH, whereas fungal biomass continued to show strong positive correlations with both pH and SOC (p < 0.001). Among the ratios, the GP:GN ratio lost its previously significant correlations with pH and N O 3 . The fungal–PLFA and F:B ratios were strongly positively correlated with BD and N H 4 + (p < 0.001).

3.3. Principal Component Analysis of Abiotic/Biotic Parameter Variation in Urban Orchards

Principal component analysis (PCA, Figure 5) revealed distinct patterns in the relationships between microbial communities, soil properties, and soil depths across tree species. In the 0–10 cm depth layer, the first two components explained 72% of the total variance, with PC1 accounting for 51.7% and PC2 accounting for 20.3%. PC1 was strongly influenced by SOC, pH, and fungal biomass, whereas Ca2+, BD, and specific microbial ratios influenced PC2. The soils under the three species showed distinct clustering: apricot was associated with relatively high SOC and fungal biomass, cherry with elevated Mg2+ levels, peach with bacterial dominance, plum with actinomycetes, and sour cherry with relatively high GP:GN ratios and BD (Figure 5a). In the 10–20 cm depth layer, the first two principal components explained 66.4% of the total variance, with PC1 accounting for 41.2% and PC2 accounting for 25.2%. PC1 was driven predominantly by SOC, pH and fungal biomass, whereas mineral nutrients and specific microbial ratios influenced PC2. The tree species presented distinct clustering patterns: species with relatively high SOC, pH, and fungal biomass values grouped together, whereas others characterized by increased bacterial dominance and ratios, such as the GP:GN ratio, formed separate clusters (Figure 5b). In the 20–30 cm depth layer, the first two principal components explained 66.4% of the total variance, with PC1 accounting for 37.4% and PC2 accounting for 29%. PC1 was influenced by SOC, pH, and fungal biomass, whereas PC2 was driven by Ca2+, K+ and microbial ratios. The apricot and cherry trees presented associations with relatively high pH and SOC values, whereas the plum and sour cherry trees presented relatively high GP:GN ratios and BD (Figure 5c).

3.4. Soil Metabolites Variation in Urban Orchards

After mass spectrometric untargeted metabolites search analysis, 489 compounds were identified in the analyzed soil samples, of which only 247 were found in the Kyoto Encyclopedia of Genes and Genomes database of molecules (https://www.genome.jp/, accessed on 27 January 2025). These steps were subsequently considered in metabolite profiling and metabolite network construction. The 247 identified metabolites were distributed among 18 chemical class groups (Table 4). One-way ANOVA revealed significant interspecific variation in the soil metabolite profiles across the tree species. Among the 18 metabolite classes analyzed, 17 exhibited significant differences (p < 0.05), with 12 showing highly significant variation (p < 0.001). Amino acids and derivatives dominated the metabolome (24.5–32.4% relative abundance), followed by organic acids (13.3–23.5%). Sour cherry presented the most distinctive metabolic signature, particularly for organic acids (23.5 ± 2.9%) and pyridine alkaloids. Cherry showed unique accumulation patterns for pyridine alkaloids (3.8 ± 0.2%) and quinones. Only aldehydes showed nonsignificant variation (p = 0.1505).
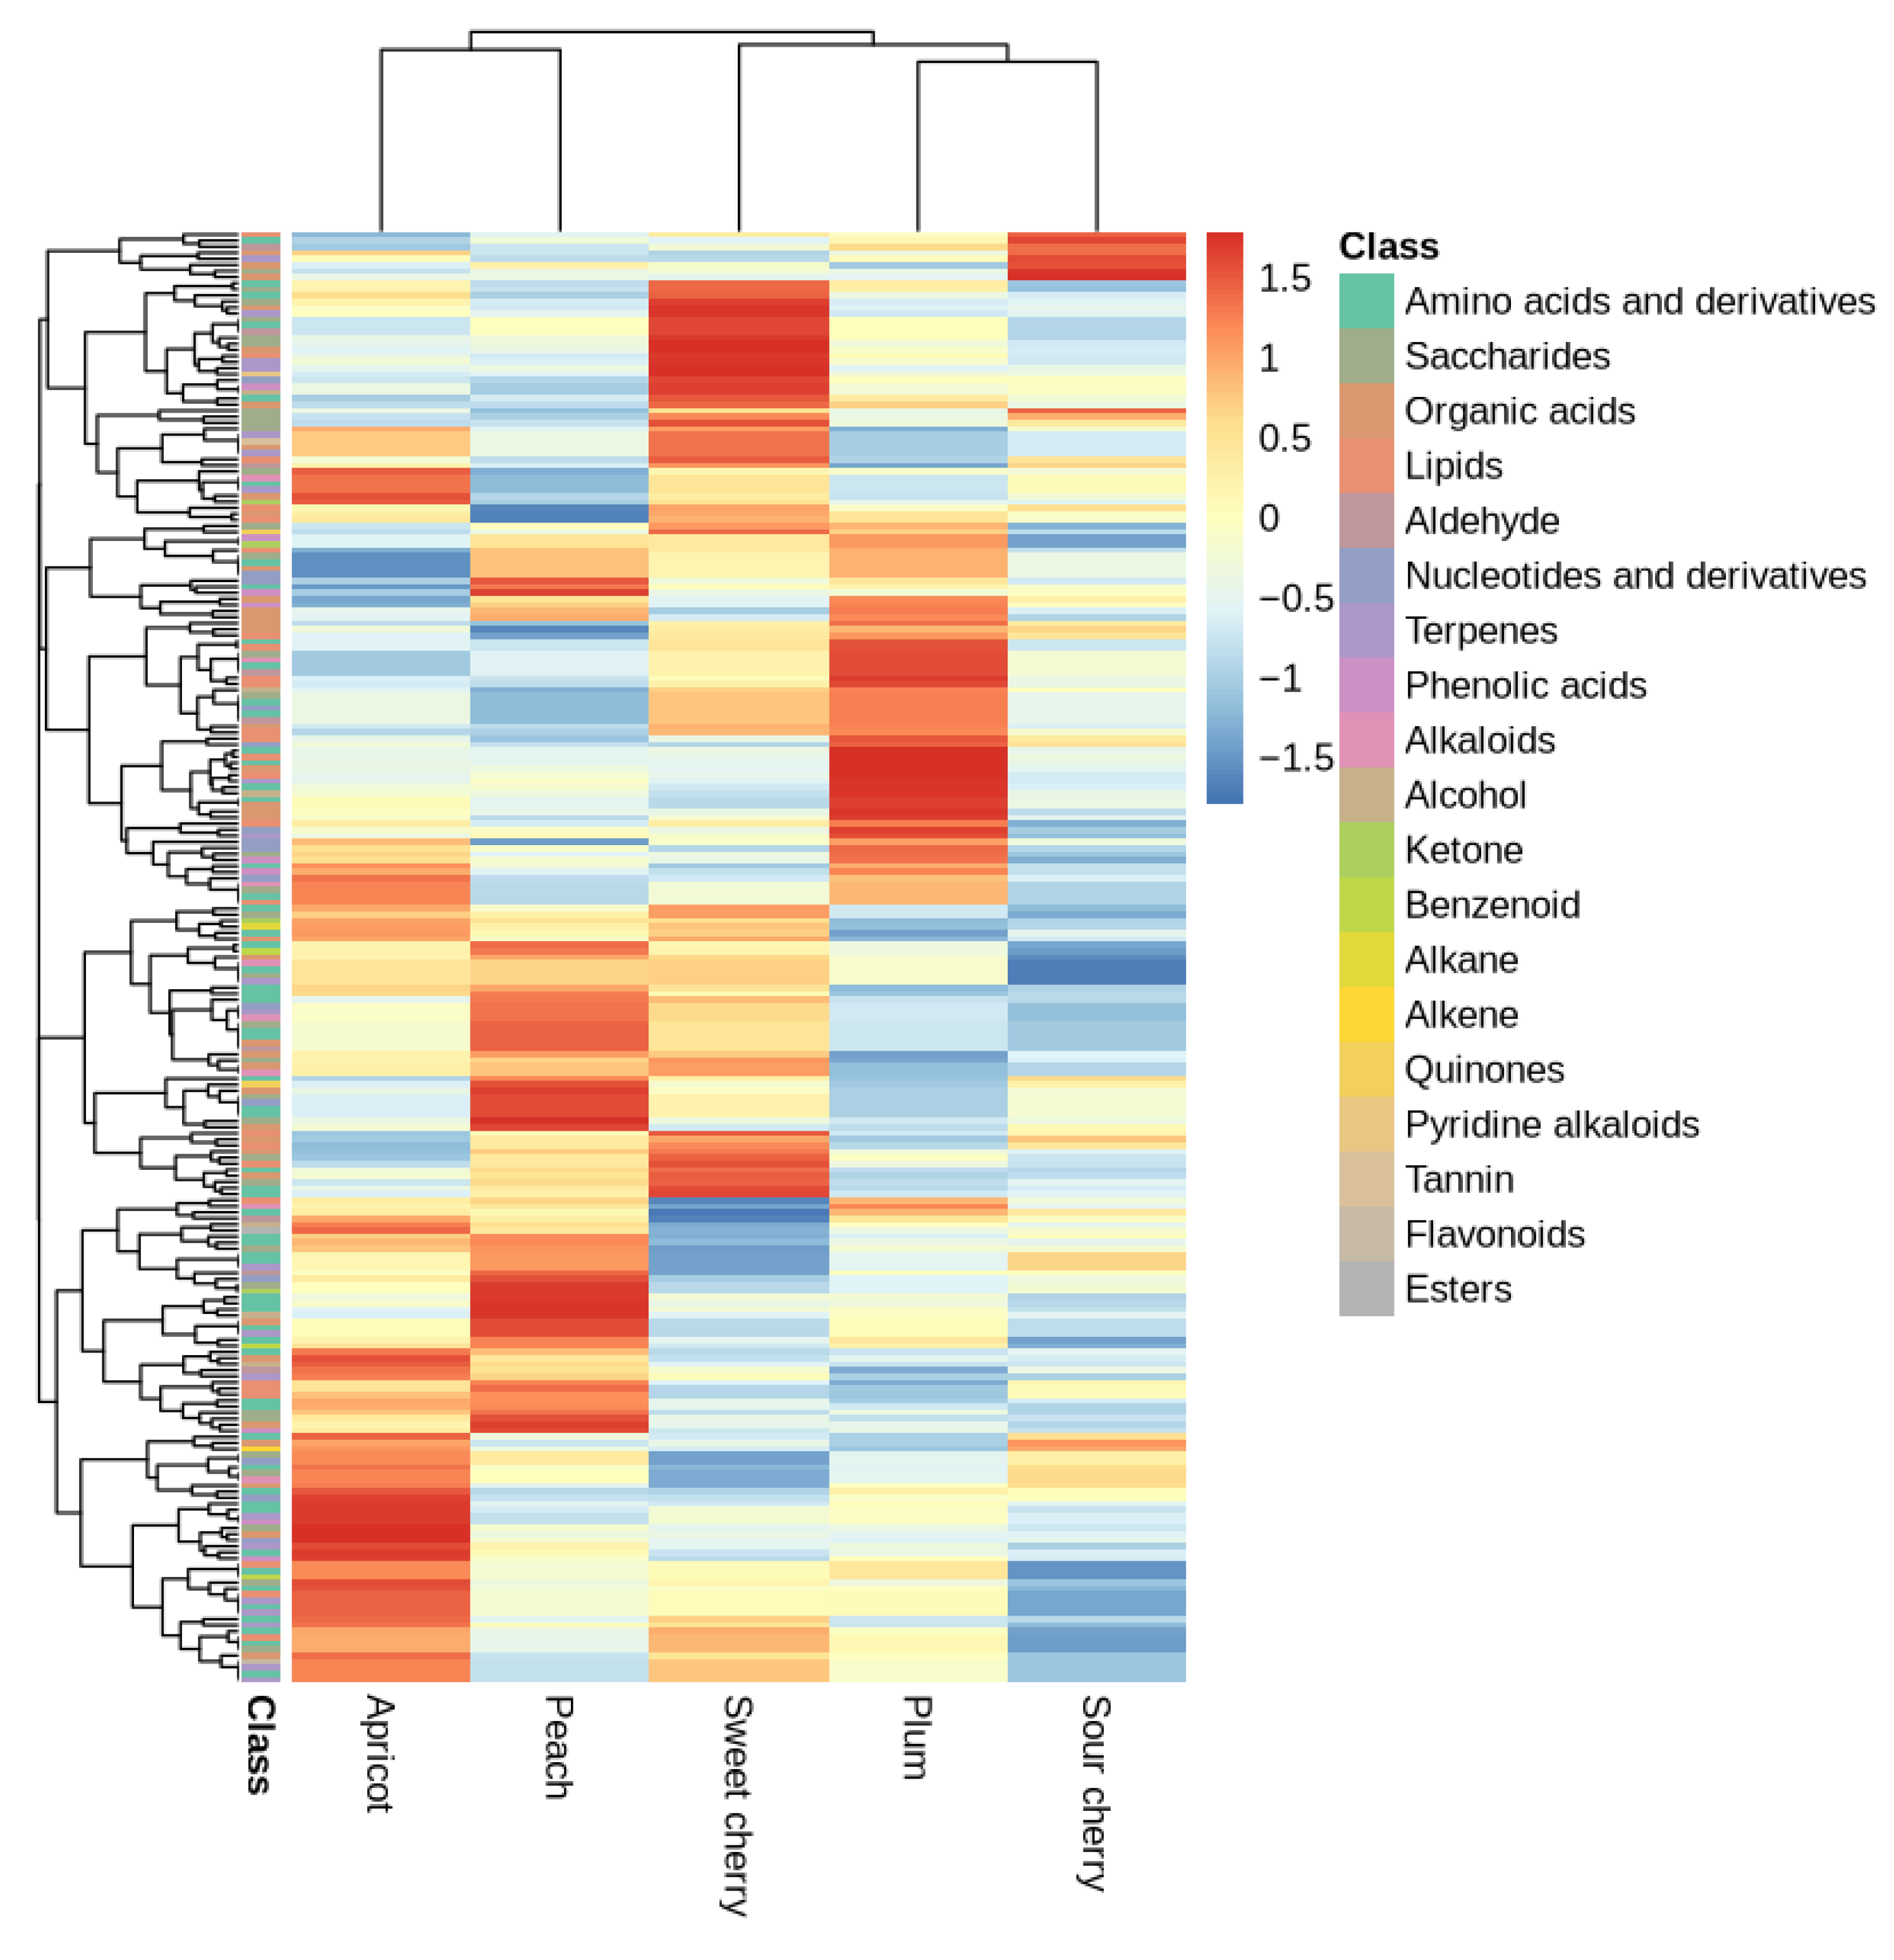
The clustered heatmap (Figure 6) employs hierarchical clustering with dendrograms on both axes to reveal metabolomic relationships among soils samples corresponding to different tree species.
The dendrogram structure shows that samples cluster primarily by metabolite class patterns rather than strict phylogenetic relationships. While sour cherry exhibits a distinctive metabolomic signature with notable differences in several metabolite classes (particularly visible in the organic acids, quinones, and pyridine alkaloids rows), the hierarchical clustering places it within the broader metabolomic continuum rather as a completely isolated cluster. The heatmap reveals that apricot, peach, and plum display more similar metabolic profiles, with moderate abundance levels across most compound classes. Sweet cherry shows intermediate characteristics, sharing some feature with sour cherry as well with the rest of fruit trees. In contrast, apricot, peach, and plum corresponding soils presented more convergent metabolic profiles, clustering together with moderate abundance levels across most compound classes. Ward’s linkage method with Euclidean distance metrics generates well-defined separation boundaries, effectively partitioning metabolically similar samples into discrete blocks of cooccurring metabolites. Clear dendrogram branching patterns indicate distinct metabolomic groupings, with cophenetic correlation coefficients supporting cluster validity. The hierarchical structure reveals metabolite co-occurrence networks and species-specific biochemical signatures. These clustering patterns demonstrate pronounced interspecific variation in soil metabolite composition, with distinct metabolomic fingerprints characterizing each tree species rhizosphere.

3.5. Metabolic Network Topology and Functional Organization Analysis of Urban Orchard Soils

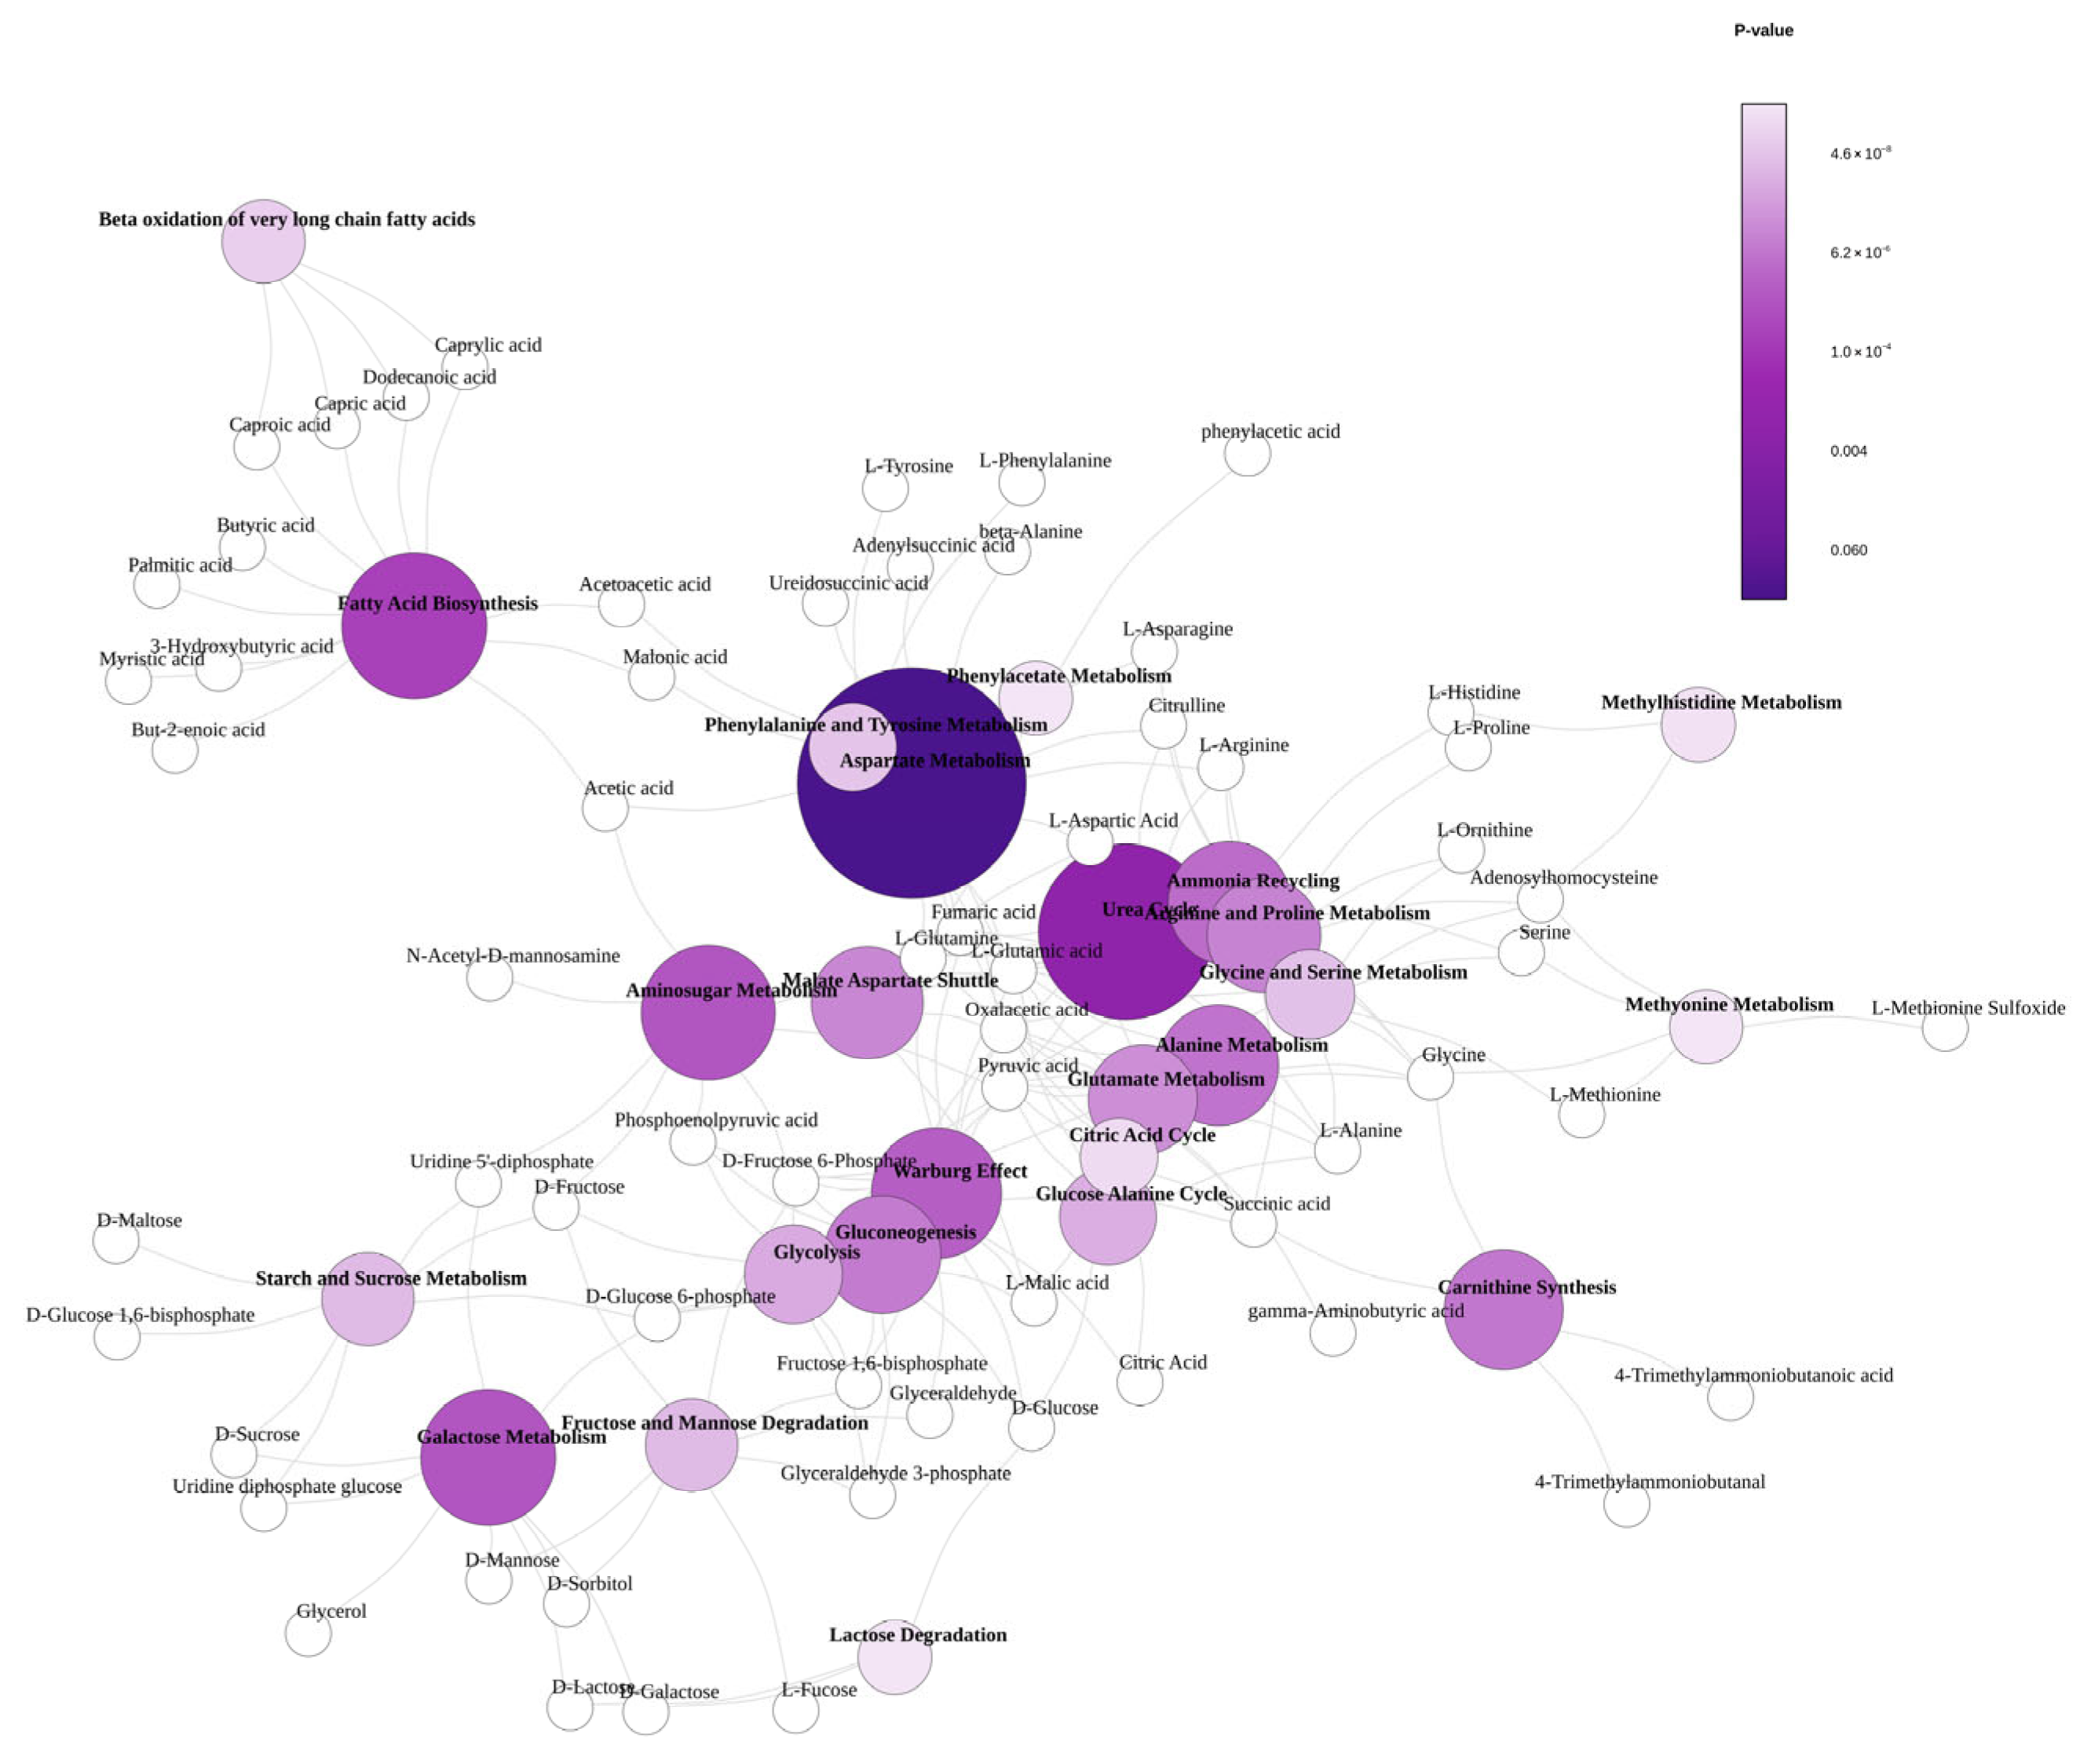
Analysis of the metabolic pathway network of untargeted metabolite data revealed a hierarchical hub-and-spoke topology with integrated statistical significance encoding. Node characteristics demonstrated significant heterogeneity, with p value distributions ranging from 4.6·10−9 to 0.06 (Figure 7).
Large purple nodes represent highly significant pathways (p < 0.001), whereas smaller white nodes indicate individual metabolites with reduced statistical significance. Centrality analysis revealed three primary metabolic hubs exhibiting the highest degree centrality (degree = 4): aspartate metabolism, fatty acid biosynthesis, and aminoacyl-tRNA biosynthesis. The secondary hubs included galactose metabolism, glycine and serine metabolism, and carnitine synthesis. The metabolic network presented a low network density (0.105), global clustering coefficient (0.12), and average path length (3.32). The modularity score was 0.6375, with community detection algorithms partitioning the network into six distinct metabolic modules. Modular organization revealed five major metabolic categories. Amino acid metabolism comprised the largest functional category (5 pathways), encompassing aspartate, glycine/serine, phenylalanine, tyrosine, and methionine metabolic pathways. Central carbon metabolism involves three pathways: glycolysis, the citric acid cycle, and gluconeogenesis. Lipid metabolism involves three pathways: fatty acid biosynthesis, β-oxidation, and carnitine synthesis. Carbohydrate metabolism involves two pathways: galactose metabolism and starch/sucrose processing. The specialized metabolic processes included protein synthesis (aminoacyl-tRNA biosynthesis), nitrogen metabolism (urea cycle), and secondary metabolite pathways (phenylacetate metabolism). Edge analysis revealed unweighted metabolic relationships between pathway components. Individual metabolites, including L-tyrosine, L-phenylalanine, and caprylic acid, formed peripheral connections to major pathway hubs. The network demonstrated scale-free topology characteristics with a power-law degree distribution, featuring high-degree hub nodes and numerous low-degree peripheral metabolites. Amino acid metabolism pathways represented the most abundant functional category within the network structure.

4. Discussion

4.1. Differences in Soil Microbial Communities Among Orchard Tree Species

Our results revealed that tree species in urban orchards drive distinct microbial community patterns in soil (Figure 2). These species-specific patterns support the fundamental role of plant-mediated selection in structuring soil microbiomes within urban orchard ecosystems. The significantly high PLFA abundance beneath apricot trees (p < 0.05), followed by those beneath cherry and peach trees, compared with that beneath plum and sour cherry trees, reflects species-specific differences in soil carbon allocation and biochemical signalling (Table 4, Figure 6). This hierarchical pattern extends beyond the moderate species effects typically reported in soil systems [5] and approaches the magnitude of plant species effects documented in natural and semi-natural ecosystems [6], where above-ground plant species [33], root exudates [34] and plant–microbe interactions [35] shape soil microbial diversity through differential rhizosphere priming and allelochemical release patterns. The higher GP and GN bacterial abundances beneath apricot trees suggest broader carbon compound spectra supporting diverse bacterial metabolic strategies and enhanced microbial resource partitioning. While previous studies by Shi et al. [36] and Ma et al. [37] demonstrated that litter accumulation influences resource availability by modifying soil microclimate, enhancing nutrient cycling, and increasing labile carbon input, our findings suggest that root-mediated effects are relevant in urban orchard systems. This contrasts with the limited microbial support under plum and sour cherry, indicating species-specific differences in carbon allocation to root exudates that exceed the functional similarity typically assumed among fruit tree species.
Vertical stratification of microbial communities provides compelling evidence for depth-dependent ecological niche partitioning (Figure 3). Previous research performed by Prescott and Versterdal [38] has established that these variations result from differential organic matter deposition through litterfall, creating distinct biogeochemical gradients influencing microbial community assembly. This enhances nutrient availability and supports richer microbial communities through enhanced substrate diversity and improved soil microclimate conditions [39]. The abundance of GP and GN bacteria, aerobic bacteria, and fungi in the surface layer (0–10 cm) suggests optimal conditions for rapid organic matter turnover and high oxygen availability [38]. Conversely, the predominance of anaerobic bacteria and actinomycetes in the 20–30 cm layer indicates adaptation to reduced oxygen conditions and recalcitrant organic substrate utilization as established by Keiluweit et al. [40]. Our depth stratification patterns confirm the biogeochemical stratification described by Rumpel and Kogel-Knabner [41], where oxygen gradients create distinct metabolic niches that select functionally specialized microbial communities. These conditions favour the adaptation of microorganisms to low-oxygen environments capable of decomposing complex substrates through anaerobic pathways [42]. The depth-dependent decline in total PLFA concentrations across all species, with peak values at 0–10 cm and the lowest values at 20–30 cm, reflects typical organic matter distribution patterns and decreasing substrate availability with depth [43,44]. However, our finding of relatively greater microbial biomass at depth beneath apricot and cherry trees suggests stronger biological modification of physical soil constraints than typically reported in orchard systems indicating that these species possess extensive root systems or produce root exudates with greater penetration capacity [45], facilitating enhanced carbon translocation to deeper horizons [46]. This increase in deep-soil microbial activity may improve nutrient cycling and soil structure development [47]. Our data on differential abundance patterns of aerobic versus anaerobic bacterial communities both confirm and extend established understanding of species-specific effects on soil redox conditions and oxygen gradients. Higher aerobic bacterial biomarkers under apricot, cherry, and peach trees suggest that these species maintain better soil aeration through root architecture modifications or organic matter inputs, increasing soil porosity and gas exchange [45,46]. Conversely, increasing anaerobic bacterial biomarkers with depth across all species, particularly under apricot, indicate that well-aerated surface soils develop anaerobic microsites at depth due to increased microbial respiration and reduced oxygen diffusion [40]. The magnitude of these species-specific redox modifications exceeds those typically documented in managed systems, suggesting that urban orchard environments may preserve stronger plant–soil interactions. Fungal biomarker patterns, showing the highest abundance under apricot and lowest abundance under plum and sour cherry, with consistent depth decreases, suggest species-specific differences in mycorrhizal associations and fungal community support through differential photosynthate allocation [48]. This pattern is particularly relevant for urban orchard sustainability, as fungal communities play crucial roles in nutrient acquisition, soil aggregation, and plant stress tolerance [35]. These species-specific microbial community patterns represent fundamental differences in plant–soil feedback mechanisms that may provide greater ecosystem resilience than previously recognized in urban ecosystems, potentially influence long-term orchard productivity and resilience in urban environments.

4.2. Factors Influencing Microbial Dominance in Urban Orchards

Correlating our microbial abundance data with soil edaphic properties demonstrated that the interplay of soil physicochemical properties and nutrient availability strongly influences the abundance and assembly of soil microbial communities across different tree species (Figure 5). Previous research across diverse ecosystems has established that SOC serves as a primary determinant of microbial community structure and function [7], but the magnitude of tree species effects on SOC-microbial relationships varies considerably among systems type. The elevated SOC content observed in apricot trees can be attributed to increased rhizosphere processes, which are recognized as key drivers of SOC accumulation and turnover [49,50]. Our findings demonstrate that these tree rhizosphere-mediated processes create distinct microenvironmental conditions that foster unique microbial assemblages, as evidenced by the differential community structures observed across our urban orchard soils. This supports and extends the interconnected framework proposed by Das et al. [51], who highlighted the interconnected roles of plant physiology, root architecture, microbial interactions, and environmental factors. These processes shape microbial metabolism and underpin a range of ecosystem services by providing energy and substrates for soil microorganisms [52].
Our carbon-microbial relationship data both established patterns and eveal quantitative thresholds. In this carbon-rich environment, we observed a substantial increase in the abundance of the soil microbiota (Figure 4 and Figure 5). The effect is particularly pronounced for fungal communities, which are strongly stimulated in apricot trees. While previous studies have documented positive SOC-fungal relationships [7], our data reveal that the fungal response magnitude in urban orchards approaches that of natural forest systems [14] rather than the modest responses typical for agricultural environments [8]. This increased fungal activity likely contributes to improved soil aggregation and nutrient cycling processes, creating positive feedback loops that further increase soil quality. Our fungal proliferation patterns under apricot trees extend the findings from Yang et al. [53], who demonstrated that specific fungal taxa such as Glomeromycetes, Dothideomycetes, Acremonium, and Archaeorhizomyces were more prevalent in the presence of a higher SOC content in soil. Furthermore, our results are consistent with those of Ramirez et al. [54], who demonstrated that labile carbon fractions are significant determinants of microbial community structure and taxonomic composition. The consistency of our findings with Sun et al. [55] and Wang et al. [56], who reported that carbon availability directly influences microbial metabolic pathways and community succession in soils, suggests that urban orchard systems follow fundamental ecological principles while exhibiting enhanced effect magnitudes. Conversely, our low-carbon soil data provide important comparative insights. We observed that soils with lower SOC contents, such as those under sour cherry, support less abundant microbial phenotypic structures. This observation suggests that tree species-specific effects on soil carbon dynamics create cascading effects through the soil food web, but the magnitude of these cascading effects in urban orchards exceeds those typically documented in managed systems [4,19]. This study pH-microbial community relationships reveal both expected patterns and novel species-specific modulations. Additionally, our findings revealed pronounced microbial community responses to soil pH under apricot trees compared with those under plum and sour cherry trees, as evidenced by increased actinomycete and total PLFA abundances in soils with higher pH values. These findings indicate that pH could be a key factor shaping the structure and activity of the soil microbiome in these orchard systems. Although our findings are in line with those reported by Yang et al. [57], though they contrast somewhat with the experimental data reported by Hou et al. [58] who showed that soil nutrients have different impacts on microbial diversity. This observation strongly supports previous research by Munner et al. [59], who identified pH as a primary driver of bacterial diversity and taxonomic community composition in soils. Building on Munner et al. [59], who reported that higher pH values favour the proliferation of specific microbial phenotypes, such as Proteobacteria, Actinobacteria, and Crenarchaeota, whereas the abundance of Firmicutes tends to decrease as the pH increases, our data reveal that tree species can amplify or dampen these pH-driven community shifts. Previous research has attributed these shifts in microbial phenotypes by changes in soil metabolic functions, including nutrient cycling and organic matter decomposition. Our data confirm and quantify this relationship, which is particularly evident in apricot soils, where relatively high pH values coincide with increased aerobe–anaerobe ratios and increased microbial biomass, characterized by a shift toward actinomycete-dominated communities (Figure 4). These findings suggest that pH-mediated effects on microbial community structure may contribute to the observed differences in soil biological properties among fruit tree species.

4.3. Urban Orchard Soil Metabolome Profile

The comprehensive metabolomic analysis revealed 489 compounds with 247 KEGG-annotated metabolites across 18 chemical classes, demonstrating biochemical complexity exceeding that reported in previous rhizosphere soil studies. The pronounced interspecific variation observed across the 17 chemical classes (p < 0.05) extends beyond the moderate metabolomic differences typically reported in managed systems [35,42] and supports the differential rhizosphere priming and allelochemical release patterns documented in tree–microbe interaction studies [5]. Our data shows that this metabolomic heterogeneity correlates with microbial community structure variations (PLFAs: 168.9–427.7 nmol·g−1), indicating that tree-derived metabolites function as selective pressures shaping soil biochemical landscapes with effect sizes approaching those documented in natural forests [34]. Our amino acids and derivatives dominance patterns (24.5–32.4%) both confirm and quantify established N cycling principles [56]. This reflects active N cycling mediated by bacterial communities, which is consistent with the findings of Shi et al. [36] and Ma et al. [37] concerning the effects of litter accumulation on microbial resource partitioning. The strong correlation between amino acid abundance and bacterial biomass (144–373.7 nmol·g−1) suggests that protein turnover and cellular metabolism drive nitrogen-containing metabolite pools, providing quantitative support for the Rumpel and Kogel-Knabner [41] biogeochemical stratification model, where microbial activity creates distinct chemical gradients. Our species-specific metabolomic signatures reveal novel biochemical adaptation mechanisms. Sour cherry’s distinctive organic acid signature (23.5 ± 2.9%) represents metabolomic adaptation parallel to enhanced anaerobic bacterial activity (reduced aerobic bacteria: 26.6% vs. apricot). This biochemical profile aligns with the substrate utilization framework of Keiluweit et al. [40], where organic acid accumulation creates oxygen-depleted microsites favouring anaerobic metabolism. Building on previous allelopathy research [5], concurrent pyridine alkaloid enrichment suggests that allelopathic mechanisms selectively influence microbial community composition, extending beyond carbon provision to active biochemical regulation [5,35]. The unique quinone accumulation of cherry (alongside 3.8 ± 0.2% pyridine alkaloids) demonstrated that species-specific secondary metabolite production was correlated with increased fungal abundance (21.9%). Quinones function as electron acceptors in fungal respiratory chains, supporting the observations of Yang et al. [57] regarding specific fungal taxa in response to carbon-rich environments. This metabolite–microbe relationship exemplifies how tree species biochemistry directly influences soil redox chemistry and microbial energetics, creating feedback loops between tree metabolism and soil biogeochemical processes.
The integration of metabolomic and PLFA datasets provides mechanistic insights that extend previous correlative studies [5]. Strong positive correlations between total PLFAs and pH (r = 0.857, p < 0.001) and SOC (r = 0.772, p < 0.001) demonstrate that metabolite diversity is constrained by soil variables, which is consistent with Ramirez et al. [54] findings that labile carbon fractions determine microbial community structure. However, the species-specific metabolomic signatures suggest that tree biochemistry can overcome these constraints through targeted metabolite production. The negative correlation of the GP:GN ratio with pH (r = −0.756, p < 0.01) suggests a mechanistic understanding of how the metabolomic composition influences the microbial community structure. The enhanced ability of GP bacteria to metabolize complex organic compounds, including identified phenolic acids and alkaloids, explains their dominance in acidic, metabolite-rich environments. These findings support the observations of Munner et al. [59] regarding the effects of pH on microbial composition in orchard soils while demonstrating metabolomic mediation. The robust correlation of the aerobe–anaerobe ratio with SOC (r = 0.848, p < 0.001) illustrates how metabolite availability influences microbial respiratory strategies, supporting biogeochemical stratification models in which oxygen gradients create distinct metabolic niches. Depth-dependent metabolomic profile changes correspond with shifts in the microbial community, reflecting increased carbon translocation through species-specific root exudation patterns [53,56]. Hierarchical clustering analysis reveals that metabolite class-based rather than phylogenetic groupings challenge traditional plant–soil interaction models, suggesting that biochemical function supersedes evolutionary relationships in determining soil metabolomic signatures [59]. This finding extends beyond previous rhizosphere studies by demonstrating that metabolomic fingerprints represent active biochemical processes rather than passive plant identity markers, providing a paradigm shift from taxonomic to functional approaches in plant–soil research. Our quantitative evidence demonstrates that urban orchard soil metabolomes result from dynamic plant–microbe-soil interactions where species-specific biochemical inputs create distinct biogeochemical niches, providing a mechanistic understanding that advances beyond correlative studies toward predictive frameworks for soil ecosystem management.

4.4. The Ecological Implications

Metabolic network topology analysis reveals profound ecological implications for urban orchard soil ecosystems. The hierarchical hub-and-spoke network structure, characterized by key metabolic hubs, including aspartate metabolism, fatty acid biosynthesis, and aminoacyl-tRNA biosynthesis, demonstrated that soil biochemical processes are organized around critical metabolic nodes that regulate ecosystem functioning. This scale-free topology suggests remarkable ecosystem resilience to random environmental perturbations while highlighting vulnerability to targeted disruptions of central metabolic pathways. The modular organization into six distinct functional categories—amino acid metabolism, central carbon metabolism, lipid metabolism, carbohydrate metabolism, and specialized metabolic processes—indicates compartmentalized biogeochemical cycling that enhances ecosystem stability and efficiency. This functional compartmentalization allows specialized microbial communities to optimize nutrient processing within their respective metabolic niches, promoting overall soil health and productivity.
The pronounced biochemical heterogeneity observed across tree species creates diverse microenvironmental conditions that support distinct microbial assemblages and metabolic capabilities. This spatial heterogeneity enhances ecosystem multifunctionality by providing multiple pathways for nutrient cycling, organic matter decomposition, and stress response mechanisms. Species-specific metabolite signatures, such as organic acids under sour cherry and quinones under cherry, demonstrate how tree species–soil–microbe interactions create unique biochemical landscapes that influence local ecosystem processes. The depth-dependent stratification of microbial communities and metabolic activities has significant implications for soil carbon sequestration and nutrient retention. Surface layers dominated by aerobic processes facilitate rapid organic matter turnover, whereas deeper anaerobic zones promote long-term carbon storage and specialized biogeochemical transformations.
From a management perspective, these findings suggest that strategic tree species selection and spatial arrangement can optimize soil ecosystem services in urban environments. The strong correlation between soil pH, organic carbon content, and metabolic network complexity indicates that targeted soil amendments could enhance ecosystem functionality and resilience. The network’s low density but high modularity implies that urban orchard soils maintain efficient resource utilization while preserving functional redundancy—critical attributes for ecosystem sustainability under urban environmental stressors. These insights provide a foundation for developing evidence-based management strategies that harness tree species–microbe interactions to enhance urban soil ecosystem services, including nutrient cycling, carbon sequestration, and biodiversity conservation.

5. Conclusions

This investigation establishes that urban orchard soils function as biochemically organized ecosystems governed by hierarchical metabolic networks with scale-free topological properties. Hub-and-spoke architecture studies suggested that soil biogeochemical processes operate through centralized regulatory mechanisms, where critical metabolic nodes orchestrate ecosystem-wide biochemical transformations. Tree species appear to be fundamental determinants of belowground metabolic organization, generating distinct biochemical signatures that structure microbial community assemblages and functional capabilities. Modular network partitioning reveals compartmentalized biogeochemical cycling that enhances system resilience and metabolic efficiency through specialized functional domains. The integration of metabolomic profiling with network topology analysis provides a mechanistic understanding of how tree species–soil microbe interactions regulate soil ecosystem processes across multiple organizational scales. Depth-stratified microbial communities coupled with species-specific metabolite distributions demonstrate the multidimensional nature of tree-related rhizosphere biochemical regulation. These findings advance the theoretical understanding of urban soil ecosystem functioning by revealing the underlying network principles that govern biogeochemical processes. The analytical framework establishes a foundation for the predictive modelling of soil ecosystem responses and provides evidence-based management strategies for optimizing urban orchard sustainability through targeted manipulation of tree–soil–microbe interaction networks.

Author Contributions

Conceptualization, E.D.K. and M.H.K.; methodology, M.H.K.; software, E.D.K.; data curation, E.D.K. and M.H.K.; writing—original draft preparation, E.D.K.; writing—review and editing, E.D.K. and M.H.K. All authors have read and agreed to the published version of the manuscript.

Funding

This research was funded by the European Union NextGeneration EU through the National Recovery and Resilience Plan, Component 9. I8., grant number 760104/23 May 2023, code CF 245/29, November 2022. This work was supported by the project “Sensing, Mapping, Interconnecting: Tools for soil functions and services evaluation” supported by the Romanian Government, Ministry of the Innovation and Digitization through the National Recovery and Resilience Plan (PNRR) PNRR-III-C9-2022-I8, contract no. CF245/29.11.2022.

Data Availability Statement

Data are available throughout the manuscript.

Conflicts of Interest

The authors declare that they have no conflicts of interest.

Abbreviation

AbbreviationDescription
PLFAPhospholipid derived fatty acid
GNGram-negative bacteria
GPGram-positive bacteria
F:BFungal-Bacterial ratio
GP:GNGram-negative bacteria–Gram-positive bacteria
GC-FIDGas chromatograph with Flame ionization Detector
GC-MS/MSGas Chromatography-Tandem Mass Spectrometer
SSLSplit/Splitless Injector
MALDI TOF/TOF IMSMatrix-Assisted Laser Desorption/Ionization Time-of-Flight/Time-of-Flight Imagistic Mass Spectrometry
MSTFAN-Methyl-N-(trimethylsilyl)trifluoroacetamide
TFATrifluoroacetic acid
AMPAdenosine Monophosphate
ATPAdenosine Triphosphate
CoACoenzyme A
KEGGKyoto Encyclopedia of Genes and Genomes
BDBulk density
SOCSoil organic carbon
C a 2 + Calcium ion
C l Chloride ion
K + Potassium ion
N H 4 + Ammonium ion
N O 3 Nitrate ion
M g 2 + Magnesium ion
PCAPrincipal Component Analysis

References

  1. Pascual, U.; Balvanera, P.; Anderson, C.B.; Chaplin-Kramer, R.; Christie, M.; González-Jiménez, D.; Martin, A.; Raymond, C.M.; Termansen, M.; Vatn, A.; et al. Diverse values of nature for sustainability. Nature 2023, 620, 813–823. [Google Scholar] [CrossRef]
  2. Bull, J.W.; Milner-Gulland, E.J.; Addison, P.F.E.; Arlidge, W.N.S.; Baker, J.; Brooks, T.M.; Burgass, M.J.; Hinsley, A.; Maron, M.; Robinson, J.G.; et al. Net positive outcomes for nature. Nat. Ecol. Evol. 2020, 4, 4–7. [Google Scholar] [CrossRef]
  3. McPhearson, T.; Cook, E.M.; Berbés-Blázquez, M.; Cheng, C.; Grimm, N.B.; Andersson, E.; Barbosa, O.; Chandler, D.G.; Chang, H.; Chester, M.V.; et al. A social-ecological-technological systems framework for urban ecosystem services. One Earth 2022, 5, 505–518. [Google Scholar] [CrossRef]
  4. Frac, M.; Hannula, E.S.; Bełka, M.; Salles, J.F.; Jedryczka, M. Soil mycobiome in sustainable agriculture. Front. Microbiol. 2022, 13, 1033824. [Google Scholar] [CrossRef] [PubMed]
  5. Wankhade, A.; Wilkinson, E.; Britt, D.W.; Kaundal, A. A review of plant–microbe interactions in the rhizosphere and the role of root exudates in microbiome engineering. Appl. Sci. 2025, 15, 7127. [Google Scholar] [CrossRef]
  6. Marcos-Romero, J.C.; Poveda, J.; Diez, J.J. Relation of the soil microbiota of cork oak groves and surrounding grasslands to tree decline. Appl. Soil Ecol. 2025, 212, 106165. [Google Scholar] [CrossRef]
  7. Finney, D.M.; Buyer, J.S.; Kaye, J.P. Living cover crops have immediate impacts on soil microbial community structure and function. J. Soil Water Conserv. 2017, 72, 361–373. [Google Scholar] [CrossRef]
  8. Tosi, M.; Drummelsmith, J.; Obregón, D.; Chahal, I.; Van Eerd, L.L.; Dunfield, K.E. Cover crop-driven shifts in soil microbial communities could modulate early tomato biomass via plant-soil feedbacks. Sci. Rep. 2022, 12, 9140. [Google Scholar] [CrossRef] [PubMed]
  9. Lasa, A.V.; Lopez-Hinojosa, M.; Villadas, P.J.; Fernandez-Gonzalez, A.J.; Cervera, M.T.; Fernandez-Lopez, M. Unravelling the shifts in the belowground microbiota and metabolome of Pinus pinaster trees affected by forest decline. Sci. Total Environ. 2025, 963, 178486. [Google Scholar] [CrossRef]
  10. Chauhan, P.; Sharma, N.; Tapwal, A.; Kumar, A.; Verma, G.S.; Meena, M.; Seth, C.S.; Swapnil, P. Soil microbiome: Diversity, benefits and interactions with plants. Sustainability 2023, 15, 14643. [Google Scholar] [CrossRef]
  11. Dip, D.P.; Sannazzaro, A.I.; Otondo, J.; Pistorio, M.; Estrella, M.J. Exploring Phosphate Solubilizing Bacterial Communities in Rhizospheres of Native and Exotic Forage Grasses in Alkaline-Sodic Soils of the Flooding Pampa. Curr. Microbiol. 2024, 81, 189. [Google Scholar] [CrossRef]
  12. Jiang, H.; Chen, Y.; Hu, Y.; Wang, Z.; Lu, X. Soil Bacterial Communities and Diversity in Alpine Grasslands on the Tibetan Plateau Based on 16S rRNA Gene Sequencing. Front. Ecol. Evol. 2021, 9, 630722. [Google Scholar] [CrossRef]
  13. Dasgupta, D.; Brahmaprakash, G.P. Soil Microbes are Shaped by Soil Physico-chemical Properties: A Brief Review of Existing Literature. Int. J. Plant Sci. 2021, 33, 59–71. [Google Scholar] [CrossRef]
  14. Dukunde, A.; Schneider, D.; Schmidt, M.; Veldkamp, E.; Daniel, R. Tree species shape soil bacterial community structure and function in temperate deciduous forests. Front. Microbiol. 2019, 10, 1519. [Google Scholar] [CrossRef]
  15. Strukelj, M.; Parker, W.; Corcket, E.; Augusto, L.; Khlifa, R.; Jactel, H.; Munson, A.D. Tree species richness and water availability interact to affect soil microbial processes. Soil Biol. Biochem. 2021, 155, 108180. [Google Scholar] [CrossRef]
  16. Sridhar, B.; Lawrence, G.B.; Debenport, S.J.; Fahey, T.J.; Buckley, D.H.; Wilhelm, R.C.; Goodale, C.L. Watershed-scale liming reveals the short- and long-term effects of pH on the forest soil microbiome and carbon cycling. Environ. Microbiol. 2022, 24, 6184–6199. [Google Scholar] [CrossRef] [PubMed]
  17. Wan, W.; Hao, X.; Xing, Y.; Liu, S.; Zhang, X.; Li, X.; Chen, W.; Huang, Q. Spatial differences in soil microbial diversity caused by pH-driven organic phosphorus mineralization. Land Degrad. Dev. 2021, 32, 766–776. [Google Scholar] [CrossRef]
  18. Luan, L.; Jiang, Y.; Dini-Andreote, F.; Crowther, T.W.; Li, P.; Bahram, M.; Zheng, J.; Xu, Q.; Zhang, X.X.; Sun, B. Integrating pH into the metabolic theory of ecology to predict bacterial diversity in soil. Proc. Natl. Acad. Sci. USA 2023, 120, e2207832120. [Google Scholar] [CrossRef]
  19. Kaur, M.; Li, J.; Zhang, P.; Yang, H.F.; Wang, L.; Xu, M. Agricultural soil physico-chemical parameters and microbial abundance and diversity under long-run farming practices: A greenhouse study. Front. Ecol. Evol. 2022, 10, 1026771. [Google Scholar] [CrossRef]
  20. Lori, M.; Kundel, D.; Mader, P.; Singh, A.; Patel, D.; Sisodia, B.S.; Riar, A.; Krause, H.M. Organic farming systems improve soil quality and shape microbial communities across a cotton-based crop rotation in an Indian Vertisol. FEMS Microbiol. Ecol. 2024, 100, fiae127. [Google Scholar] [CrossRef] [PubMed]
  21. Zhang, Y.; Du, Y.; Zhihao, Z.; Islam, W.; Zeng, F. Variation in root-associated microbial communities among three different plant species in natural desert ecosystem. Plants 2024, 13, 2468. [Google Scholar] [CrossRef] [PubMed]
  22. Nugent, A.; Allison, S.D. A framework for soil microbial ecology in urban ecosystems. Ecosphere 2022, 13, e3968. [Google Scholar] [CrossRef]
  23. Li, H.; Tang, B.; Lehmann, A.; Rongstock, R.; Zhu, Y.; Rillig, M.C. The dissimilarity between multiple management practices drives the impact on soil properties and functions. Soil Ecol. Lett. 2025, 7, 240278. [Google Scholar] [CrossRef]
  24. Rezultate Definitive ale Recensamantului Populatiei si Locuintelor-2011-Analiza. Cluj County Regional Statistics Directorate. 2013. Available online: https://www.recensamantromania.ro/rpl-2011/rezultate-2011/ (accessed on 18 February 2025).
  25. Morar, I.M.; Stefan, R.; Dan, C.; Sestras, R.E.; Truta, P.; Medeleanu, M.; Ranga, F.; Sestras, P.; Truta, A.M.; Sestras, A.F. FT-IR and HPLC analysis of silver fir (Abies alba Mill.) bark compounds from different geographical provenances. Helyon 2024, 10, e26820. [Google Scholar] [CrossRef] [PubMed]
  26. Kovacs, E.D.; Kovacs, M.H.; Barcelo, D.; Pereira, P. Nonsteroidal anti-inflammatory drugs impact the microbial community in three different soil types—A laboratory experiment. Case Stud. Chem. Environ. Eng. 2024, 10, 100833. [Google Scholar] [CrossRef]
  27. Kovacs, E.D.; Silaghi-Dumitrescu, L.; Roman, C.; Tian, D. Structural and metabolic profiling of Lycopersicon esculentum rhizosphere microbiota artificially exposed at commonly used non-steroidal anti-inflammatory drugs. Microorganisms 2022, 10, 254. [Google Scholar] [CrossRef]
  28. Blight, E.G.; Dyer, W.J. A rapid method of total lipid extraction and purification. Can. J. Biochem. Physiol. 1959, 37, 911–917. [Google Scholar] [CrossRef]
  29. Lai, Z.; Tsugawa, H.; Wohlgemuth, G.; Mehta, S.; Mueller, M.; Zheng, Y.; Ogiwara, A.; Meissen, J.; Showalter, M.; Takeuchi, K.; et al. Identifying metabolites by integrating metabolome databases with mass spectrometry cheminformatics. Nat. Methods 2018, 15, 53–56. [Google Scholar] [CrossRef]
  30. Kovacs, E.D.; Rusu, T.; Kovacs, M.H. Sustainable soil volatilome: Discrimination of land uses through GC–MS-identified volatile organic compounds. Separations 2025, 12, 92. [Google Scholar] [CrossRef]
  31. Baquer, G.; Semente, L.; Rafols, P.; Martin-Saiz, L.; Bookmeyer, C.; Fernandez, J.A.; Correig, X.; Garcia-Altares, M. rMSIfragment: Improving MALDI-MSI lipidomics through automated in-source fragment annotation. J. Cheminform. 2023, 15, 80. [Google Scholar] [CrossRef]
  32. Peris-Diaz, M.D.; Sweeney, S.R.; Rodak, O.; Sentandreu, E.; Tiziani, S. R-MetaboList 2: A flexible tool for metabolite annotation from high-resolution data-independent acquisition mass spectrometry analysis. Metabolites 2019, 9, 187. [Google Scholar] [CrossRef]
  33. Luo, X.; Xie, Y.; Yue, S.; Yang, M.; Han, C.; Zhao, Y.; Zhao, Y.; Li, J. Plant species richness enhances aboveground primary productivity via net biodiversity effects and bacterial community interactions. Appl. Soil Ecol. 2025, 209, 106052. [Google Scholar] [CrossRef]
  34. Sharma, I.; Kashyap, S.; Agarwala, N. Biotic stress-induced changes in root exudation confer plant stress tolerance by altering rhizospheric microbial community. Front. Plant Sci. 2023, 14, 1132824. [Google Scholar] [CrossRef] [PubMed]
  35. Molefe, R.R.; Amoo, A.E.; Babalola, O.O. Communication between plant roots and the soil microbiome; involvement in plant growth and development. Symbiosis 2023, 90, 231–239. [Google Scholar] [CrossRef]
  36. Shi, Z.; Fan, C.; Zhao, S.; Xiao, R.; Miao, R.; Yang, Z.; Wan, S. Effect of litter changes on soil microbial community and respiration in a coniferous—Broadleaf mixed forest. Ecosystems 2025, 28, 26. [Google Scholar] [CrossRef]
  37. Ma, Z.; Wu, J.; Li, L.; Zhou, Q.; Hou, F. Litter-Induced Reduction in Ecosystem Multifunctionality Is Mediated by Plant Diversity and Cover in an Alpine Meadow. Front. Plant Sci. 2021, 12, 773804. [Google Scholar] [CrossRef]
  38. Prescott, C.E.; Vesterdal, L. Decomposition and transformations along the continuum from litter to soil organic matter in forest soils. For. Ecol. Manag. 2021, 498, 119522. [Google Scholar] [CrossRef]
  39. Ortuno-Hernandez, G.; Silva, M.; Toledo, R.; Ramos, H.; Reis-Mendes, A.; Ruiz, D.; Martinez-Gomez, P.; Ferreira, I.M.P.L.V.O.; Salazar, J.A. Nutraceutical Profile Characterization in Apricot (Prunus armeniaca L.) Fruits. Plants 2025, 14, 1000. [Google Scholar] [CrossRef]
  40. Keiluweit, M.; Wanzek, T.; Kleber, M.; Nico, P.; Fendorf, S. Anaerobic microsites have an unaccounted role in soil carbon stabilization. Nat. Commun. 2017, 8, 1771. [Google Scholar] [CrossRef]
  41. Rumpel, C.; Kögel-Knabner, I. Deep soil organic matter-a key but poorly understood component of terrestrial C cycle. Plant Soil 2011, 338, 143–158. [Google Scholar] [CrossRef]
  42. Cao, J.; Zhang, C.; Li, X.; Wang, X.; Dai, X.; Xu, Y. Microbial community and metabolic pathways in anaerobic digestion of organic solid wastes: Progress, challenges and prospects. Fermentation 2025, 11, 457. [Google Scholar] [CrossRef]
  43. Pei, J.; Li, J.; Luo, Y.; Rillig, M.C.; Smith, P.; Gao, W.; Li, B.; Fang, C.; Nie, M. Patterns and drivers of soil microbial carbon use efficiency across soil depths in forest ecosystems. Nat. Commun. 2025, 16, 5218. [Google Scholar] [CrossRef]
  44. Zhou, W.; Han, G.; Liu, M.; Zeng, J.; Liang, B.; Liu, J.; Qu, R. Determining the distribution and interaction of soil organic carbon, nitrogen, pH and texture in soil profiles: A case study in the Lancangjiang river basin, Southwest China. Forests 2020, 11, 532. [Google Scholar] [CrossRef]
  45. Zhang, X.; Hu, J.; Wang, L.; Liu, K.; Tian, S.; Zhou, W. Alterations in litter chemical traits and soil environmental properties limit the litter decomposition of near-mature Robinia pseudoacacia plantations. Geoderma 2023, 439, 116668. [Google Scholar] [CrossRef]
  46. Ma, W.; Tang, S.; Dengzeng, Z.; Zhang, D.; Zhang, T.; Ma, X. Root exudates contribute to belowground ecosystem hotspots: A review. Front. Microbiol. 2022, 13, 937940. [Google Scholar] [CrossRef]
  47. Naylor, D.; McClure, R.; Jansson, J. Trends in microbial community composition and function by soil depth. Microorganisms 2022, 10, 540. [Google Scholar] [CrossRef]
  48. D’Entremont, T.W.; Kivlin, S.N. Specificity in plant-mycorrhizal fungal relationships: Prevalence, parameterization, and prospects. Front. Plant Sci. 2023, 14, 1260286. [Google Scholar] [CrossRef] [PubMed]
  49. Zhao, M.; Wang, M.; Zhao, Y.; Hu, N.; Qin, L.; Ren, Z.; Wang, G.; Jiang, M. Soil microbial abundance was more affected by soil depth than the altitude in peatlands. Front. Microbiol. 2022, 13, 1068540. [Google Scholar] [CrossRef]
  50. Cui, H.; Mo, C.; Chen, P.; Lan, R.; He, C.; Lin, J.; Jiang, Z.; Yang, J. Impact of rhizosphere priming on soil organic carbon dynamics: Insights from the perspective of carbon fractions. Appl. Soil Ecol. 2023, 189, 104982. [Google Scholar] [CrossRef]
  51. Das, S.; Beegum, S.; Acharya, B.S.; Panday, D. Soil carbon sequestration: A mechanistic perspective on limitations and future possibilities. Sustainability 2025, 17, 6015. [Google Scholar] [CrossRef]
  52. Gao, G.; Li, G.; Liu, M.; Liu, J.; Ma, S.; Li, D.; Liang, X.; Wu, M.; Li, Z. Microbial carbon metabolic activity and bacterial cross-profile network in paddy soils of different fertility. Appl. Soil Ecol. 2024, 195, 105233. [Google Scholar] [CrossRef]
  53. Yang, Y.; Xie, H.; Mao, Z.; Bao, X.; He, H.; Zhang, X.; Liang, C. Fungi determine increased soil organic carbon more than bacteria through their necromass inputs in conservation tillage croplands. Soil Biol. Biochem. 2022, 167, 108587. [Google Scholar] [CrossRef]
  54. Ramirez, P.B.; Fuentes-Alburquenque, S.; Diez, B.; Vargas, I.; Bonilla, C.A. Soil microbial community responses to labile organic carbon fractions in relation to soil type and land use along a climate gradient. Soil Biol. Biochem. 2020, 141, 107692. [Google Scholar] [CrossRef]
  55. Sun, H.; Sun, F.; Deng, X.; Storn, N.; Wan, S. Unfolding the roles of particulate- and mineral-associated organic carbon in soil microbial communities. Forests 2025, 16, 27. [Google Scholar] [CrossRef]
  56. Wang, S.; Yan, X.; Li, T.; Yang, J.; Zhao, L.; Yuan, D.; Guo, Z.; Liu, C.; Duan, C. Cahnges in soil microbe-mediated carbon, nitrogen and phosphorus cycling during spontaneous succession in abandoned Pb–Zn mining areas. Sci. Total Environ. 2024, 920, 171018. [Google Scholar] [CrossRef] [PubMed]
  57. Yang, Y.; Chai, Y.; Xie, H.; Zhang, L.; Zhang, Z.; Yang, X.; Hao, S.; Gai, J.; Chen, Y. Responses of soil microbial diversity, network complexity and multifunctionality to three land-use changes. Sci. Total Environ. 2023, 859, 160255. [Google Scholar] [CrossRef] [PubMed]
  58. Hou, Z.; Zhang, X.; Chen, W.; Liang, Z.; Wang, K.; Zhang, Y.; Song, Y. Differential responses of bacterial and fungal community structure in soil to nitrogen deposition in two planted forests in Southwest China in relation to pH. Forests 2024, 15, 1112. [Google Scholar] [CrossRef]
  59. Muneer, M.A.; Hou, W.; Li, J.; Huang, X.; ur Rehman Kayani, M.; Cai, Y.; Yang, W.; Wu, L.; Ji, B.; Zheng, C. Soil pH: A key edaphic factor regulating distribution and functions of bacterial community along vertical soil profiles in red soil of pomelo orchard. BMC Microbiol. 2022, 22, 38. [Google Scholar] [CrossRef]
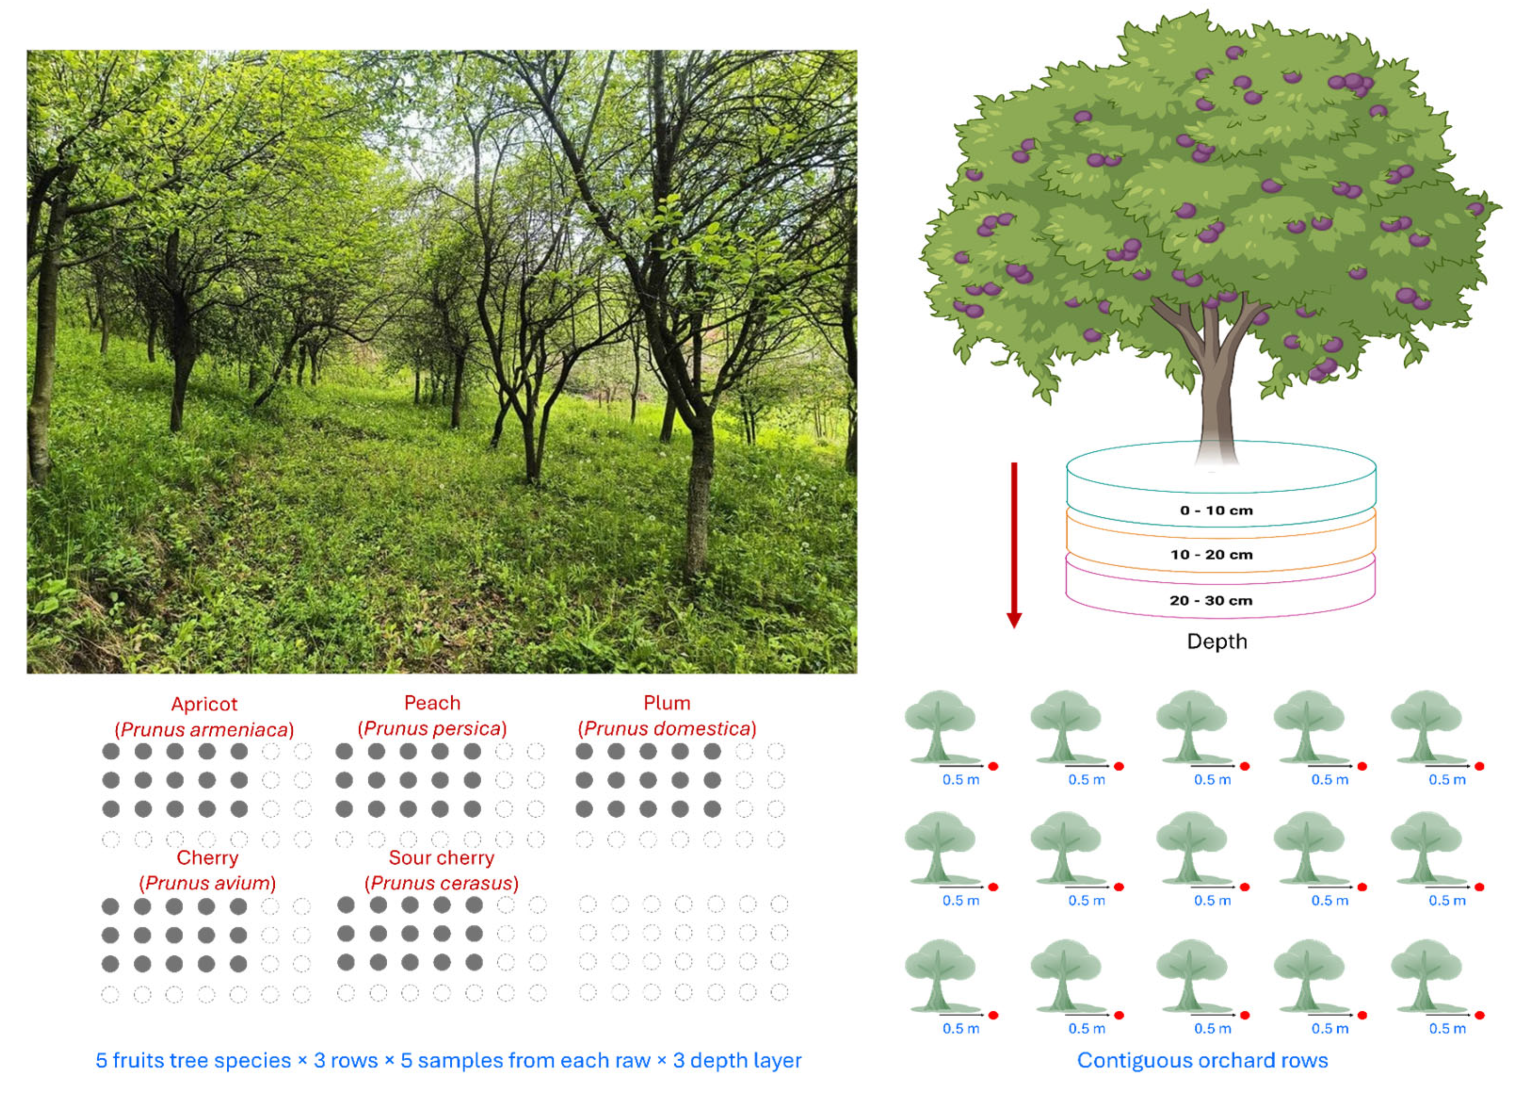
Figure 1. Schematic presentation of sampling designs.
Horticulturae 11 01163 g001
Figure 2. The PLFA contents of the soil microorganisms were measured at three depths. (a) Total PLFAs; (b) Gram−positive bacteria; (c) Gram−negative bacteria; (d) Aerobe bacteria; (e) Anaerobe bacteria; (f) Actinomycetes; (g) Fungi. The significant differences between layers and tree species are indicated by uppercase and lowercase letters, respectively (p < 0.05).
Horticulturae 11 01163 g002aHorticulturae 11 01163 g002b
Figure 3. The relative abundance of soil microorganism PLFA contents at three depths. (a) 0–10 cm, (b) 10–20 cm, (c) 20–30 cm.
Horticulturae 11 01163 g003
Figure 4. Relative ratios of the PLFA contents at the three depths. (a) GP:GN; (b) Aerobe–Anaerobe; (c) Fungi–bacteria; (d) Actinomycetes–PLFAs; (e) Bacteria–PLFAs; (f) Fungi–PLFAs. The significant differences between layers and tree species are indicated by uppercase and lowercase letters, respectively (p < 0.05).
Horticulturae 11 01163 g004aHorticulturae 11 01163 g004b
Figure 5. Principal component analysis of microbial dominance variation with respect to the soil properties of each studied tree species. (a) 0–10 cm; (b) 10–20 cm; (c) 20–30 cm.
Horticulturae 11 01163 g005
Figure 6. Heat map of soil metabolomic profile variation under tree species.
Horticulturae 11 01163 g006
Figure 7. Network Visualization of Statistically Significant Metabolic Pathways and Their Interconnections.
Horticulturae 11 01163 g007
Table 1. Correlation analysis between environmental factors and the soil microbial community in the 0–10 cm depth layer.
Soil MicrobiotapHBDCa2+ClK+NH4+NO3Mg2+SOC
GP0.787 ***−0.648 **−0.229−0.218−0.19−0.2720.0460.2660.759 **
GN0.79 ***−0.785 ***−0.3990.055−0.255−0.3450.318−0.0290.704 **
Aerobe0.87 ***−0.513−0.253−0.307−0.297−0.1590.0370.3320.799 **
Anaerobe0.714 **−0.513−0.358−0.205−0.522 *−0.118−0.0240.5450.509
Actinomycetes0.837 ***−0.623 *−0.322−0.177−0.318−0.250.1380.2590.719 **
Fungi0.855 ***−0.377−0.277−0.361−0.360.0320.070.3250.777 ***
Total PLFA0.857 ***−0.657 **−0.333−0.157−0.3−0.2380.160.1960.772 ***
GP:GN−0.756 **0.734 **0.618 *−0.3250.3940.25−0.658 **0.383−0.534 *
Aerobe–Anaerobe0.741 **−0.346−0.064−0.270.082−0.1290.1410.0010.848 ***
F:B−0.2940.761 ***0.151−0.303−0.0980.65 **−0.1730.143−0.308
Actinomycetes–PLFA−0.698 **0.515 *0.2810.0850.1740.087−0.1950.039−0.691 **
Bacteria–PLFA0.293−0.763 ***−0.1560.3080.096−0.644 **0.181−0.1520.306
*: p < 0.05; **: p < 0.01; ***: p < 0.001.
Table 2. Correlation analysis between environmental factors and the soil microbial community in the 10–20 cm depth layer.
Soil MicrobiotapHBDCa2+ClK+NH4+NO3Mg2+SOC
GP0.913 ***−0.49−0.348−0.169−0.177−0.0080.377−0.280.634 *
GN0.864 ***−0.529 *−0.305−0.193−0.086−0.1270.249−0.2060.646 **
Aerobe0.643 **−0.547 *−0.489−0.546 *−0.241−0.109−0.0470.3330.498
Anaerobe0.555 *−0.583 *−0.494−0.428−0.261−0.0640.0050.30.316
Actinomycetes0.826 ***−0.711 **−0.475−0.21−0.173−0.1680.205−0.1080.507
Fungi0.735 **−0.201−0.273−0.609 *−0.1630.2520.0540.2760.725 **
Total PLFA0.872 ***−0.552 *−0.405−0.357−0.174−0.0570.189−0.0180.654 **
GP:GN−0.636 *0.4790.1060.345−0.1870.3180.125−0.088−0.644 **
Aerobe–Anaerobe0.48−0.195−0.201−0.466−0.059−0.099−0.1030.1880.584 *
F:B−0.1750.59 *0.181−0.412−0.0420.597 *−0.180.460.148
Actinomycetes–PLFA−0.321−0.354−0.0880.4240.094−0.366−0.077−0.179−0.508
Bacteria–PLFA0.185−0.59 *−0.1790.4170.043−0.591 *0.187−0.468−0.14
*: p < 0.05; **: p < 0.01; ***: p < 0.001.
Table 3. Correlation analysis between environmental factors and the soil microbial community in the 20–30 cm depth layer.
Soil MicrobiotapHBDCa2+ClK+NH4+NO3Mg2+SOC
GP0.75 **−0.535 *−0.241−0.195−0.109−0.2760.226−0.3330.585 *
GN0.935 ***−0.207−0.001−0.6 *0.038−0.037−0.0540.1120.82 ***
Aerobe0.627 *−0.769 ***−0.495−0.463−0.3−0.561 *−0.2080.20.362
Anaerobe0.644 **−0.558 *−0.356−0.698 **−0.213−0.395−0.3530.4090.459
Actinomycetes0.729 **−0.627 *−0.198−0.413−0.011−0.436−0.1330.0070.59 *
Fungi0.908 ***0.019−0.181−0.742 **−0.2750.2110.0070.2670.748 **
Total PLFA0.905 ***−0.434−0.213−0.566 *−0.12−0.212−0.0420.0720.726 **
GP:GN−0.416−0.483−0.4770.766 ***−0.37−0.2870.592 *−0.831 ***−0.502
Aerobe–Anaerobe0.371−0.794 ***−0.5070.134−0.315−0.583 *0.164−0.280.084
F:B0.190.623 *−0.092−0.346−0.3850.642 **0.1890.2340.145
Actinomycetes–PLFA−0.593 *−0.3180.1990.3770.406−0.47−0.355−0.029−0.401
Bacteria–PLFA−0.192−0.626 *0.0840.3590.376−0.641 **−0.17−0.255−0.15
* p < 0.05; ** p < 0.01; *** p < 0.001.
Table 4. One-way ANOVA summary of identified metabolite classes.
MetabolitesNo. of
Comp.(a.)
ApricotPeachPlumCherrySour CherrySignificance
Organic acids3714.31 ± 0.9216.23 ± 0.2313.29 ± 0.3915.50 ± 0.7123.46 ± 2.88***
Nucleotides and derivatives155.51 ± 0.353.86 ± 0.164.35 ± 0.402.68 ± 0.464.03 ± 0.28***
Saccharides3910.06 ± 0.1610.19 ± 1.457.99 ± 0.2512.12 ± 1.649.25 ± 1.01*
Amino acids and derivatives5931.40 ± 0.7732.41 ± 1.6429.38 ± 0.8625.13 ± 1.3624.54 ± 2.04***
Lipids2610.88 ± 0.3411.66 ± 1.619.45 ± 1.6715.67 ± 0.6914.55 ± 1.07***
Terpenes2112.69 ± 0.599.62 ± 0.6311.57 ± 1.6514.12 ± 1.1511.02 ± 0.22**
Phenolic acids93.28 ± 0.284.17 ± 0.262.97 ± 0.211.58 ± 0.041.99 ± 0.15***
Ketone41.33 ± 0.111.36 ± 0.081.05 ± 0.070.98 ± 0.081.07 ± 0.13**
Alkaloids83.05 ± 0.213.14 ± 0.282.87 ± 0.362.49 ± 0.282.44 ± 0.20*
Aldehyde91.91 ± 0.082.49 ± 0.202.33 ± 0.392.26 ± 0.322.70 ± 0.55ns
Alkene20.73 ± 0.040.33 ± 0.210.14 ± 0.100.40 ± 0.070.74 ± 0.11***
Alcohol60.93 ± 0.051.03 ± 0.201.01 ± 0.130.49 ± 0.030.74 ± 0.21**
Flavonoids10.88 ± 0.110.48 ± 0.070.62 ± 0.050.93 ± 0.080.47 ± 0.07***
Esters11.16 ± 0.150.80 ± 0.070.53 ± 0.040.23 ± 0.100.89 ± 0.17***
Benzenoid31.18 ± 0.211.20 ± 0.090.97 ± 0.040.73 ± 0.030.65 ± 0.08***
Quinones50.17 ± 0.040.40 ± 0.030.46 ± 0.050.60 ± 0.100.27 ± 0.06***
Tannin10.22 ± 0.030.15 ± 0.040.08 ± 0.010.24 ± 0.030.10 ± 0.02***
Pyridine
alkaloids
10.32 ± 0.040.49 ± 0.060.95 ± 0.13.84 ± 0.211.07 ± 0.18***
* p < 0.05; ** p < 0.01; *** p < 0.001; ns—not significant. (a.) No. of comp.—number of compounds identified in the corresponding chemical class.
Disclaimer/Publisher’s Note: The statements, opinions and data contained in all publications are solely those of the individual author(s) and contributor(s) and not of MDPI and/or the editor(s). MDPI and/or the editor(s) disclaim responsibility for any injury to people or property resulting from any ideas, methods, instructions or products referred to in the content.