Article

Regulation of Cell Metabolism and Changes in Berry Shape of Shine Muscat Grapevines Under the Influence of Different Treatments with the Plant Growth Regulators Gibberellin A3 and N-(2-Chloro-4-Pyridyl)-N′-Phenylurea

1
College of Biological and Environmental Sciences, Zhejiang Wanli University, Ningbo 315100, China
2
Cixi Forestry and Specialty Technology Promotion Center, Ningbo 315300, China
*
Authors to whom correspondence should be addressed.
These authors contributed equally to this work.
Horticulturae 2025, 11(10), 1160; https://doi.org/10.3390/horticulturae11101160
Submission received: 18 August 2025 / Revised: 24 September 2025 / Accepted: 25 September 2025 / Published: 28 September 2025
(This article belongs to the Section Fruit Production Systems)

Abstract

Plant growth regulators Gibberellin A3 (GA3) and N-(2-chloro-4-pyridyl)-N′-phenylurea (CPPU) are widely used in ‘Shine Muscat’ cultivation to regulate berry shape and size. However, the molecular mechanisms underlying their regulation of berry shape remain poorly understood. This study was designed to elucidate the cytological processes and molecular basis through which GA3 and CPPU modulate berry morphology in ‘Shine Muscat’. The results showed that spraying GA3 or CPPU alone increases the hormone levels of endogenous auxin (IAA) and GA3 and reduces the levels of endogenous 6-benzyladenine (6-BA). GA3 treatment resulted in the number of cells per unit area being significantly reduced and the cell transverse and longitudinal diameters being significantly increased. CPPU treatment increases the number of cells per unit area, cell transverse and longitudinal diameters. In the results of CKvsG2 and CKvsC2 transcriptome sequencing, 2793 and 1082 differentially expressed genes (DEGs) were identified, respectively. These DEGs are significantly enriched in Gene Ontology (GO) terms related to plant hormones; the Kyoto Encyclopedia of Genes and Genomes (KEGG) analysis revealed that the zeatin biosynthesis pathway (ko03030) is significantly enriched. The Arabidopsis response regulator (ARR) is down-regulated in response to GA3 application and up-regulated in response to CPPU application. Transient overexpression of VvARR (OE-VvARR) in ‘Shine Muscat’ berry increased the number of berry cells and cell transverse and longitudinal diameters. Furthermore, virus-induced gene silencing of VvARR (VIGS-VvARR) reduced the number of berry cells but increased cell transverse and longitudinal diameters. The OE-VvARR grape hormone levels of endogenous GA3, 6-BA, and IAA were significantly increased. In VIGS-VvARR grape, the levels of endogenous IAA and 6-BA are significantly increased, but there is no significant difference in endogenous GA3. These findings offer novel insights into the molecular mechanisms by which GA3 and CPPU govern berry development, corroborating the hypothesis that VvARR acts as a pivotal regulator mediating the effects of these plant growth regulators on berry cell morphology and, consequently, berry shape.

1. Introduction

The formation of berry shape constitutes a complex physiological process encompassing cell division, cell expansion, endogenous hormone biosynthesis, signal transduction, and the expression of key genes. Cell proliferation represents a pivotal factor influencing berry shape. The direction and rate of cell division determine cellular morphology and quantity, whereas the volume of cell expansion governs cell size; collectively, these factors modulate the development of berry shape in specific orientations. The manifestation of typical berry shape variations is contingent upon four physiological stages during early berry development: ovary development, fruit set, intensive cell division, and subsequent cell endoreduplication [1,2]. As early as the floral development phase, following the transformation of the shoot apical meristem (SAM) into the inflorescence meristem (IM) and its subsequent differentiation into the floral meristem (FM), two cellular events—cell division and cell expansion—accompany tissue differentiation and subsequent biological activities. These events exert a decisive influence on the determination of final berry size and shape [3,4]. Studies conducted on horticultural crops including grapes [5], cucumbers [6], tomatoes [7], pumpkins [8], and pears [9] have demonstrated that during cell proliferation, factors such as the direction of cell expansion, cell volume, cell division cycle, and duration can induce alterations in berry shape and size. As a key ampelographic trait of grapes, berry shape significantly influences their commercial value and consumer preference. The ‘Shine Muscat’, a European-American hybrid cultivar [10], exhibits traits including firm and crisp flesh, a high soluble solid content, a rich rose aroma, and excellent storage and transport tolerance. It is recognized as one of the most developmentally promising grape varieties in China [11]. In grape cultivation practices, exogenous plant growth regulators exert a pivotal role in the regulation of grape berry shape. Gibberellins (GAs) are tetracyclic diterpenoid plant hormones [12] that find extensive application in grape varieties including ‘Shine Muscat’ [11], ‘Sumber Black’ [13], ‘Kyoho’ [14], and ‘Cabernet Franc’ [15]. The application of gibberellins at an appropriate concentration can enhance the longitudinal growth of grape cells, increase the longitudinal diameter of berries, and elevate the berry shape index, thereby facilitating the formation of oblong berry morphologies. Additionally, gibberellins participate in other developmental processes of grapes, such as by accelerating berry ripening, increasing soluble solid content, reducing inflorescence and berry abscission, and promoting inflorescence elongation [16]. N-(2-chloro-4-pyridyl)-N′-phenylurea (CPPU) is a synthetic phenylurea-type plant growth regulator with cytokinin activity. Previous studies have demonstrated that CPPU can promote transverse division of berry cells and extend the duration of division, thereby inducing the enlargement of berry cells [17,18]. In grape production, the combined application of CPPU and GA3 can achieve berry enlargement, and its effect in promoting grape berry enlargement is more pronounced than that of GA3 used alone [19]. However, the specific regulatory mechanism underlying berry size and shape remains to be elucidated.
Plant endogenous hormones, as organic signaling molecules that interact at multiple levels, coordinate diverse cellular activities within plants and mediate key processes including growth and development, environmental adaptation, responses to biotic and abiotic stresses, and productivity [20,21]. To date, a variety of endogenous hormones have been identified across different plant species, encompassing auxins (Aux), gibberellins (GAs), cytokinins (CKs), abscisic acid (ABA), jasmonates (JAs), brassinosteroids (BRs), salicylic acid (SA), strigolactones (SLs), and ethylene (ETH). Endogenous hormones play a pivotal role in regulating the size and shape of plant cells. Arabidopsis thaliana, rice, tomato, and cucumber, as model crops, serve as excellent models for understanding berry shape in Brassicaceae, Poaceae, Solanaceae, and Cucurbitaceae, respectively. Previous studies have demonstrated that plant endogenous hormones are regulated by different domain proteins and related endogenous hormone expression genes, achieving the regulation of berry shape by influencing cell morphology and quantity [22,23,24,25,26,27].
Transcriptome sequencing has been extensively utilized in research on plant berry quality; however, its outcomes are derived from plant signaling pathways associated with biological processes, cellular components, and molecular functions, alongside the expression of relevant genes. Elucidating the genetic basis of berry shape is pivotal for breeding varieties that cater to the diverse requirements of growers and consumers. Currently, research on the genetic regulation of grape berry shape remains in its preliminary stage relative to that on model plants such as tomato and Arabidopsis. With berry shape regulatory genes identified in model plants as reference points, exploring the complex genetic regulatory pathways of grape berry shape and excavating key genes via transcriptomics constitutes a prevalent research method for investigating the genetic mechanisms underlying grape berry shape.
In recent years, research investigating the effects of GA3 and CPPU treatments on ‘Shine Muscat’ has primarily focused on physiological diseases [28], leaf photosynthetic processes [29], and berry quality attributes including size, aroma, and sugar-acid ratio [30]. However, transcriptome-based studies examining berry shape changes in ‘Shine Muscat’ following GA3 and CPPU application remain scarce, and its underlying molecular regulatory mechanism awaits further clarification. Therefore, in the present study, ‘Shine Muscat’ was employed as experimental materials, with transcriptome sequencing conducted during the critical morphological stages of berry shape development. This study postulates that GA3 and CPPU differentially regulate berry cell morphology and consequently influence berry shape by modulating the expression of key genes in plant hormone signal transduction pathways. Therefore, the primary objective of this study was to dissect the cytological and molecular mechanisms through which exogenous GA3 and CPPU modulate berry morphology in ‘Shine Muscat’ by integrating cytophysiological characterization and hormonal crosstalk analysis.

2. Materials and Methods

2.1. Plant Material and Growth Conditions

The experiment was conducted at Dicuiyuan Farm in Zhenhai District, Ningbo, Zhejiang Province (30° N, 121° E) from April to August 2024. The climate condition at experiment location is characterized by an annual average temperature of 18.6 °C, annual average precipitation of 1788.3 mm, and annual average sunshine duration of 1617.2 h. The soil depth ranges from 90 to 100 mm, with a clayey texture. The experimental materials consisted of 5-year-old ‘Shine Muscat’ grapevines, cultivated using a vertical trellis system within the same multi-span greenhouse; the greenhouse roof was covered with a colorless polyvinyl chloride anti-drip film. The grapevines were planted at a spacing of 2 m × 3 m in a north–south orientation, with no spike trimming implemented. Irrigation, fertilization, and pest and disease control measures were administered in line with conventional field management protocols.

2.2. Treatment

With ‘Shine Muscat’ subjected to water spray treatment (CK) as the control, the experiment was designed to include exogenous plant growth regulators at distinct concentrations: 30 mg/L GA3 (G2) and 3 mg/L CPPU (C2). Each group consisted of 3 replicates, with 5 plants receiving treatment in each replicate. For each group, 15 plants exhibiting uniform growth were randomly selected, and their inflorescences were subjected to uniform spraying one week after flowering. The spray volume was determined based on the criterion that the inflorescences started to drip, with the treated inflorescences subsequently covered with white paper bags. Grape berry sampling was performed in line with the phenological stages defined by the Modified E-L system, with specimens harvested at the young fruit stage (YS), enlargement stage I (ESI), enlargement stage II (ESII), and mature stage (MS) [31]. The sampling methodology employed was Z-shaped harvesting. For each group, clusters were randomly selected from the upper, middle, and lower trellis position on both the sunlit and shaded position. From each cluster, 20 berries were randomly sampled from the upper, middle, and lower portions. Immediately following harvest, the berries were flash-frozen in liquid nitrogen, transported to the laboratory under low-temperature conditions in an ice box, and stored in a −80 °C ultra-low temperature refrigerator for subsequent analysis.

2.3. Determination of Grapevine Berry Growth Index

An electronic vernier caliper was used to randomly measure the longitudinal and transverse diameters of 30 grape berries from each treatment group, with a precision of 0.01 cm. The fruit shape index was computed as the ratio of the average longitudinal diameter to the average transverse diameter of the berries.

2.4. Microscopic Observation of Grapevine Berry Cell Morphology and Size

Three ‘Shine Muscat’ samples were selected from each of the three treatment groups at the enlargement stage II, sectioned into 0.5 cm × 0.5 cm × 0.5 cm fragments along equatorial plane of the berries, and immediately immersed in FAA fixative (5% formaldehyde, 5% glacial acetic acid, and 90% ethanol) for a 24-h period. The fixed berries were subjected to dehydration via the ethanol/xylene method, followed by embedding in paraffin, sectioning into 4 μm-thick slices, drying, and staining with safranin-fast green. The stained sections were examined using PANNORAMIC MIDI (3DHISTECH, Budapest, Hungary). Using SlideViewer 2.0 software, 20× zoom level was set to measure the longitudinal and transverse diameters of cells in the berry samples were measured, and the number of cells per unit area was computed.

2.5. Determination of Endogenous IAA, GA3 and 6-BA Concentrations in Grapevine Berry

The contents of endogenous gibberellin (GA3), 6-benzylaminopurine(6-BA), and auxin (IAA) in the berries were determined via the enzyme-linked immunosorbent assay (ELISA) with three replicates per group [32]. Fresh grape samples were collected, frozen in liquid nitrogen, and ground into powder. 10% homogenate was prepared by adding 9 mL of 0.01 mol/L PBS buffer (pH7.2–7.4) to 1 g of the powder. Following centrifugation, The ELISA procedures were conducted according to the instructions provided by the manufacturer (Kangsheng biological technology Co., Ltd., Ningbo, China).

2.6. Transcriptome Analysis

RNA sequencing was conducted on ‘Shine Muscat’ at the enlargement stage II subsequent to treatments with GA3 and CPPU, respectively. Total RNA was extracted utilizing the TIANGEN Polysaccharide & Polyphenol Plant Total RNA Extraction Kit (DP441, Beijing, China), with RNA quality evaluated via a NanoDrop 2000 Microspectrophotometer ( Thermo Fisher Scientific, Waltham, MA, USA). The construction and quality control of transcriptome libraries were performed by Gene Denovo biological technology Co., Ltd. (Guangzhou, China) using the Omicsmart platform. The threshold for differentially expressed genes (DEGs) was defined as p < 0.05 and |log2FC| > 1. KEGG enrichment and GO enrichment analyses were applied to compare the groups CK vs. C2 and CK vs. G2. Each sample group underwent sequencing with 3 biological replicates, which was followed by relevant analyses.

2.7. qRT-PCR Validation Analysis

Gene-specific primers were designed and synthesized by Hangzhou Youkang Biotechnology Co., Ltd. (Hangzhou, China). Total RNA was extracted utilizing the Polysaccharide/Polyphenol Plant RNA Rapid Extraction Kit (Huiling, Shanghai, China), while cDNA was synthesized via the NovoScript Plus All-in-one 1st Strand cDNA Synthesis SuperMix (gDNA Purge) reverse transcription kit (Novoprotein, Suzhou, China). Quantitative real-time PCR (qRT-PCR) was conducted in accordance with the protocol described in the NovoStart® SYBR qPCR SuperMix Plus kit (Novoprotein, Suzhou, China). qRT-PCR was conducted using a real-time fluorescent quantitative PCR instrument (Kubo, Guangzhou, China) under the following parameters: pre-denaturation at 95 °C for 60 s, followed by 45 cycles consisting of denaturation at 95 °C for 20 s and annealing/extension at 60 °C for 60 s. With grape actin (Actin) serving as the reference gene, each reaction incorporated 3 biological replicates and 3 technical replicates, and the 2−ΔΔCT method was employed for data analysis of differential gene expression levels.

2.8. Subcellular Localization of VvARR: Green Fluorescent Protein Fusion

Subcellular localization prediction of the protein was conducted using Plant-mPLoc online website. (https://www.csbio.sjtu.edu.cn/bioinf/plant-multi/) (accessed on 28 June 2025). The open reading frame (ORF) of VvARR was amplified and subsequently subjected to homologous recombination with the fusion expression vector pCAMBIA1300 harboring green fluorescent protein (GFP). The pCAMBIA1300-VvARR-GFP plasmid was introduced into Agrobacterium strain GV3101 through the heat shock method, with pCAMBIA1300-GFP serving as the positive control. The constructed vector plasmid was introduced into tobacco leaves for transient expression. The GFP signal was visualized using a Nikon A1R confocal laser microscope (Nikon, Tokyo, Japan).

2.9. Transient Transformation of Grapevine Berry

Specific primers were designed according to the CDS sequence deposited in the grape gene database (https://plants.ensembl.org/index.html) (accessed on 15 November 2024). for amplification of the VvARR gene. VvARR was inserted into the overexpression vector pCAMBIA1300-35S-Flag using 5× In-Fusion HD Enzyme, before being introduced into Agrobacterium strain GV3101 via the heat shock method. The specific gene silencing sequence fragment of VvARR was amplified and integrated into the pTRV2 vector. Agrobacterium strain GV3101 was transformed with the pTRV1 helper plasmid and the recombinant VvARR-pTRV2 plasmid. Injection with sterile water was used as the control. In accordance with the Agrobacterium-mediated transient transformation protocol for grape berries described by Jiannan Xie [33], Agrobacterium suspension was directly injected into ‘Shine Muscat’ berries at the enlargement stage II. The inoculated berry clusters were bagged and subjected to dark incubation for 72 h prior to sampling, with positive berries screened through polymerase chain reaction (PCR).

2.10. Statistical Analysis

All data in this experiment are presented as mean ± standard deviation derived from three biological replicates. Data processing was performed using Microsoft Office Excel 2010, and statistical analysis of the collected data was conducted with GraphPad Prism 9.5. Two-way ANOVA was employed to analyze the longitudinal/transverse diameters of berries, berry shape index, and endogenous hormone concentrations at different growth stages after plant growth regulator treatments. One-way ANOVA was used for the longitudinal/transverse diameters of berry cells, cell number per unit area, endogenous hormone concentrations, and relative expression levels of differentially expressed genes in different tissues at a single growth stage following plant growth regulator and transient transformation treatments. t-tests were applied to assess the relative expression levels of differentially expressed genes between transiently transformed berries and wild-type berries. Dunnett’s multiple comparisons test was used to establish significant differences at p < 0.05.

3. Results

3.1. Effects of GA3 and CPPU Application on Grape Berry Shape

The results demonstrated that the berry shape of ‘Shine Muscat’ underwent significant alterations following the application of GA3 and CPPU (Figure 1A). Berries in the CK group displayed an oval morphology, whereas those subjected to GA3 treatment exhibited an obovate shape with a longer longitudinal diameter relative to the CK group. In contrast, berries treated with CPPU possessed a larger transverse diameter compared to the CK group, presenting an obtuse oval shape. Overall, the berry shape index (Figure 1B), transverse diameter (Figure 1C), and longitudinal diameter (Figure 1D) of ‘Shine Muscat’ underwent significant changes following treatment with GA3 and CPPU. Specifically, the total increment in transverse diameter of the C2 treatment group was significantly greater than that of both the G2 treatment group and the CK group, accompanied by the smallest berry shape index. In contrast, the G2 treatment group exhibited the largest total increment in longitudinal diameter and the highest berry shape index. During the young fruit stage, both the transverse and longitudinal diameters of the G2 and C2 groups were larger than those of the CK group. The longitudinal diameter and berry shape index of the G2 group were significantly greater than those of the C2 group and CK group. In comparison, the transverse diameter of the C2 group exceeded that of both the CK group and G2 group, while its shape index was higher than that of the CK group yet lower than that of the G2 group. During the transition from berry enlargement stage I to enlargement stage II, the berry shape indices of all three treatment groups exhibited a decreasing trend, with the CK group displaying the most pronounced decline. At the mature stage of berry development, no significant differences in shape indices were observed among the three treatment groups, though the G2 group had the highest berry shape index and the C2 group the lowest.

3.2. Effects of GA3 and CPPU Application on Cell Morphology of Grape Berries

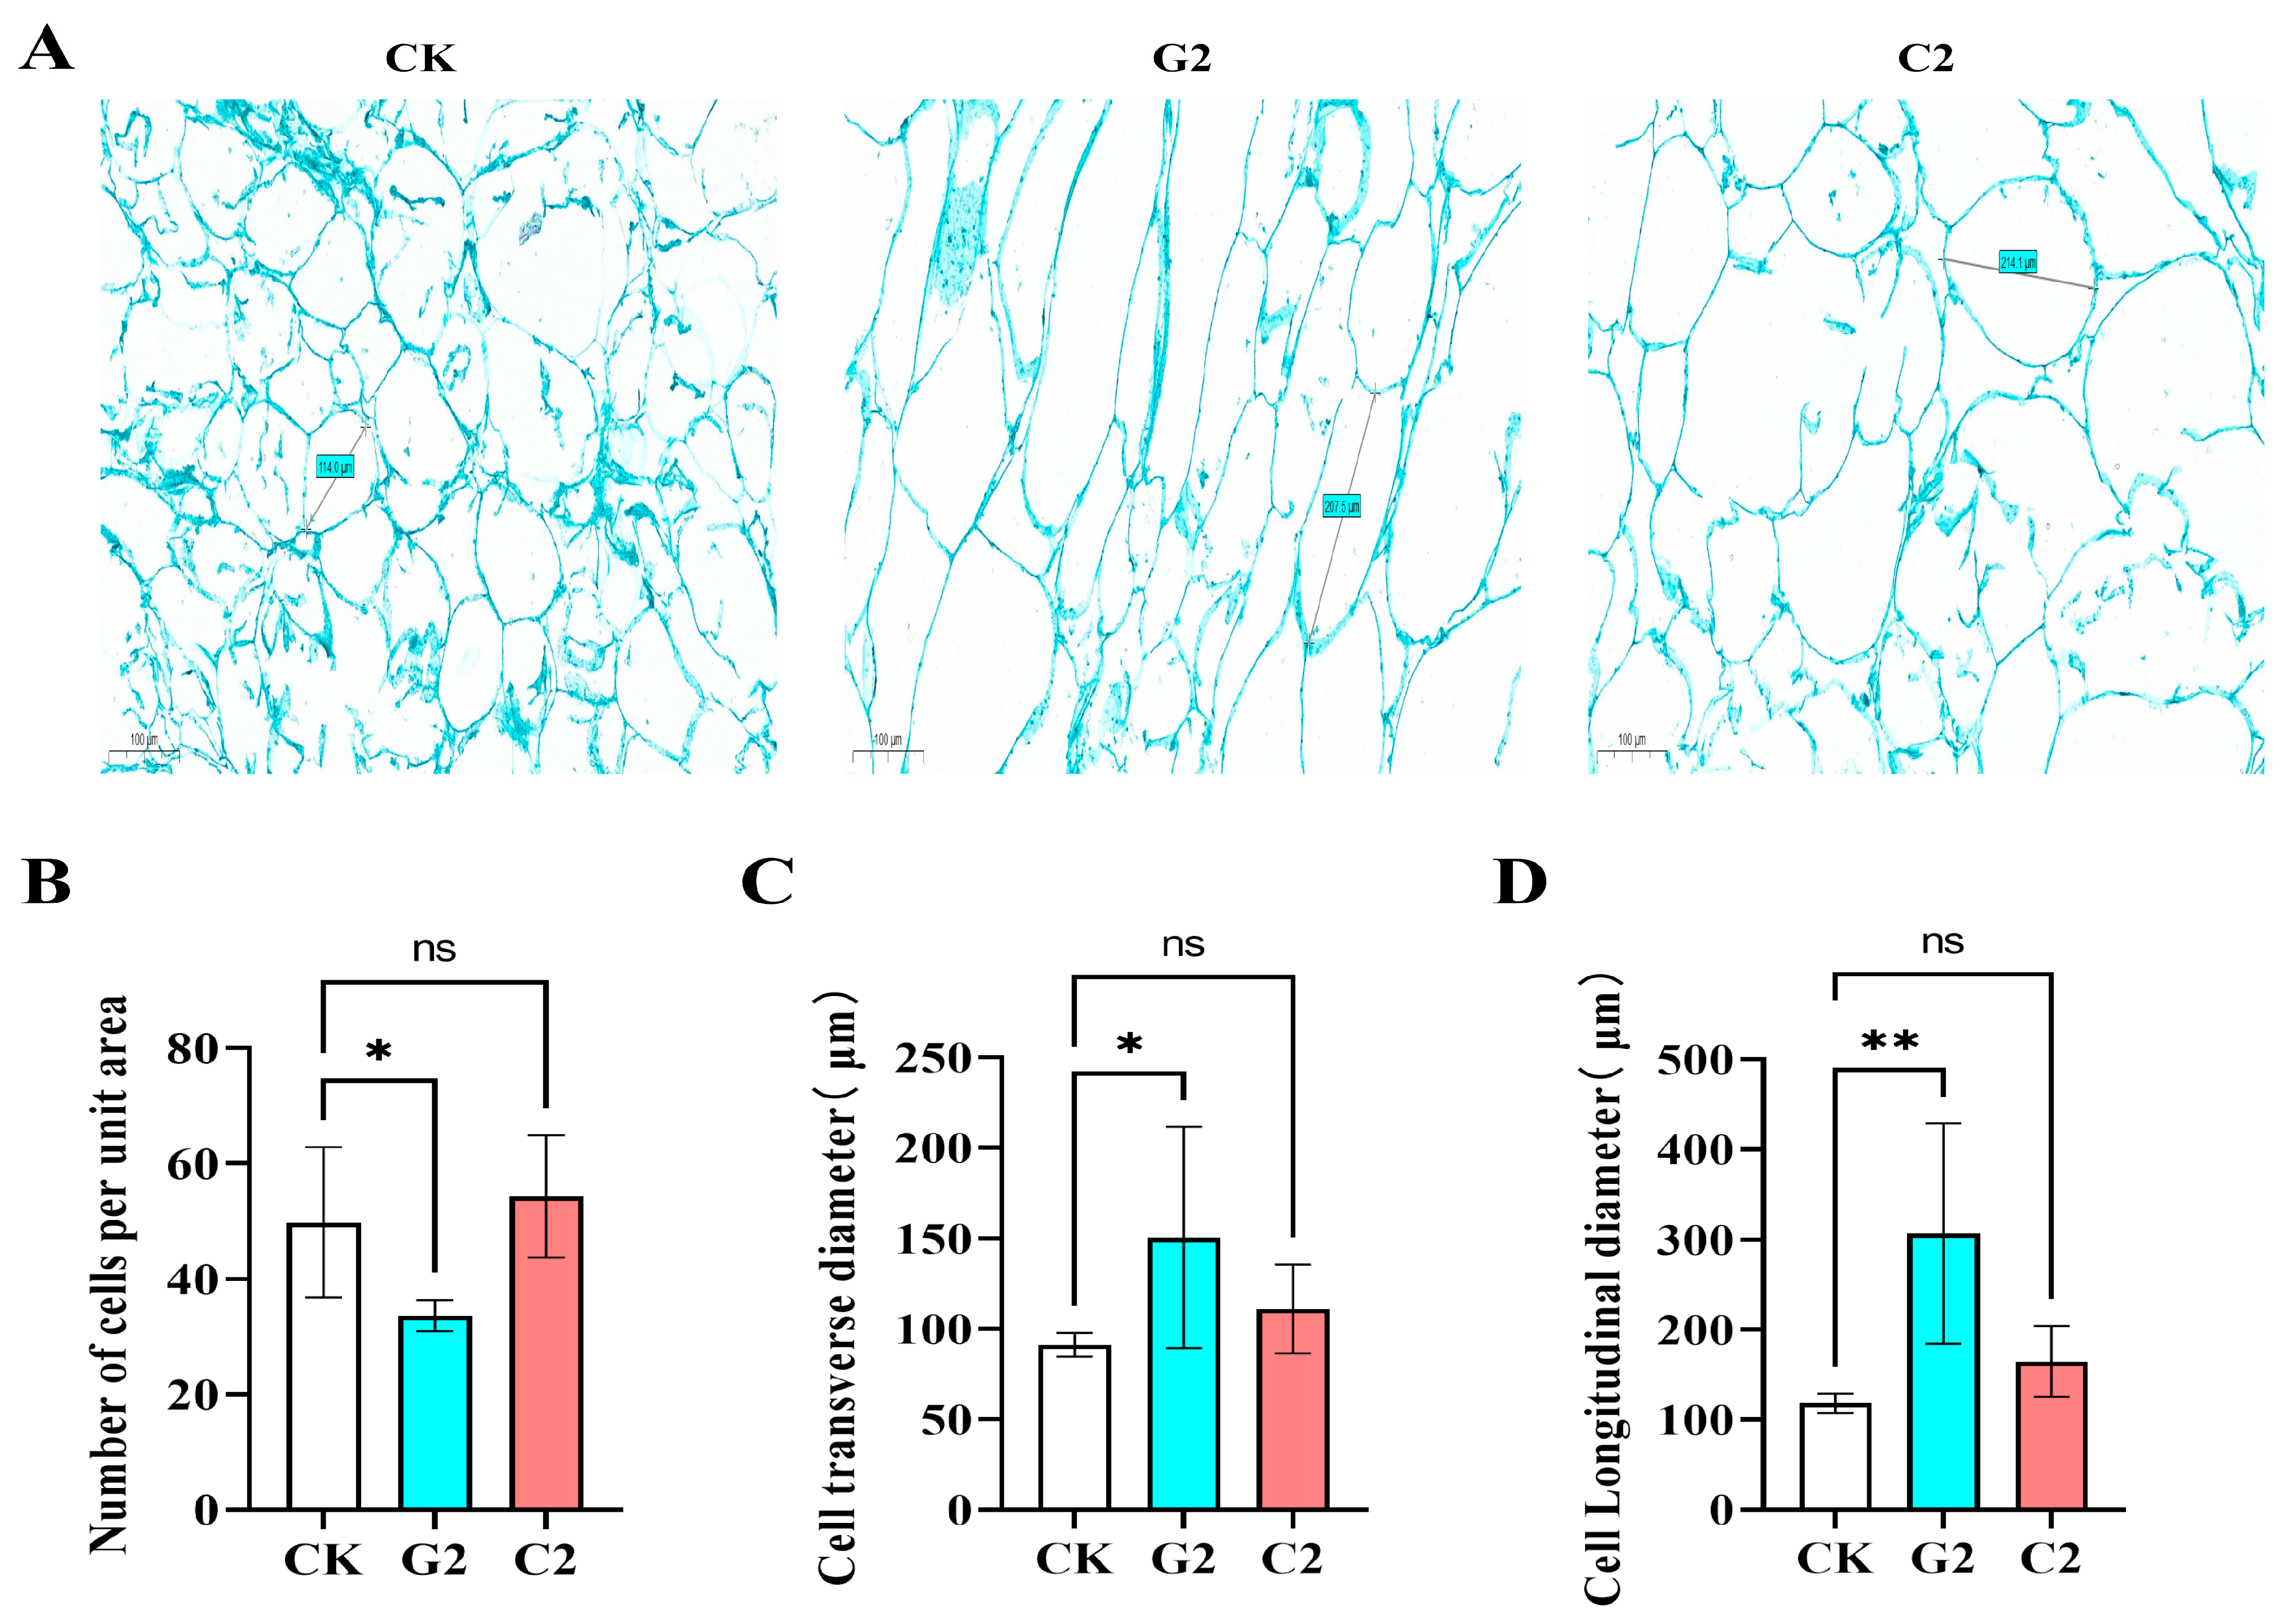
The berry shape of ‘Shine Muscat’ across different treatment groups exhibited a positive correlation with cell morphological characteristics (Figure 2A). At enlargement stage II, the number of cells per unit area in the C2 group was higher than that in the CK group, with no significant difference observed. Conversely, the number of cells per unit area in the G2 group was significantly lower than that in the CK group. The sequence of cell number per unit area was C2 > CK > G2 (Figure 2B). Regarding cell transverse diameter, the G2 group displayed the largest values, whereas the CK group showed the smallest. The cell transverse diameter in the C2 group was greater than that in the CK group, with no significant difference observed (Figure 2C). The longitudinal diameter of cells in the G2 group was significantly elongated relative to the control group, whereas the cell longitudinal diameter in the C2 group was increased compared with the CK group, albeit not significantly (Figure 2D). The results demonstrate that exogenous GA3 treatment enhances the elongation of berry cells in ‘Shine Muscat’ while decreasing cell number. Conversely, exogenous CPPU treatment induces an increase in berry cell number and an expansion of cell transverse diameter.

3.3. Effects of GA3 and CPPU Application on Endogenous Hormones in Grape

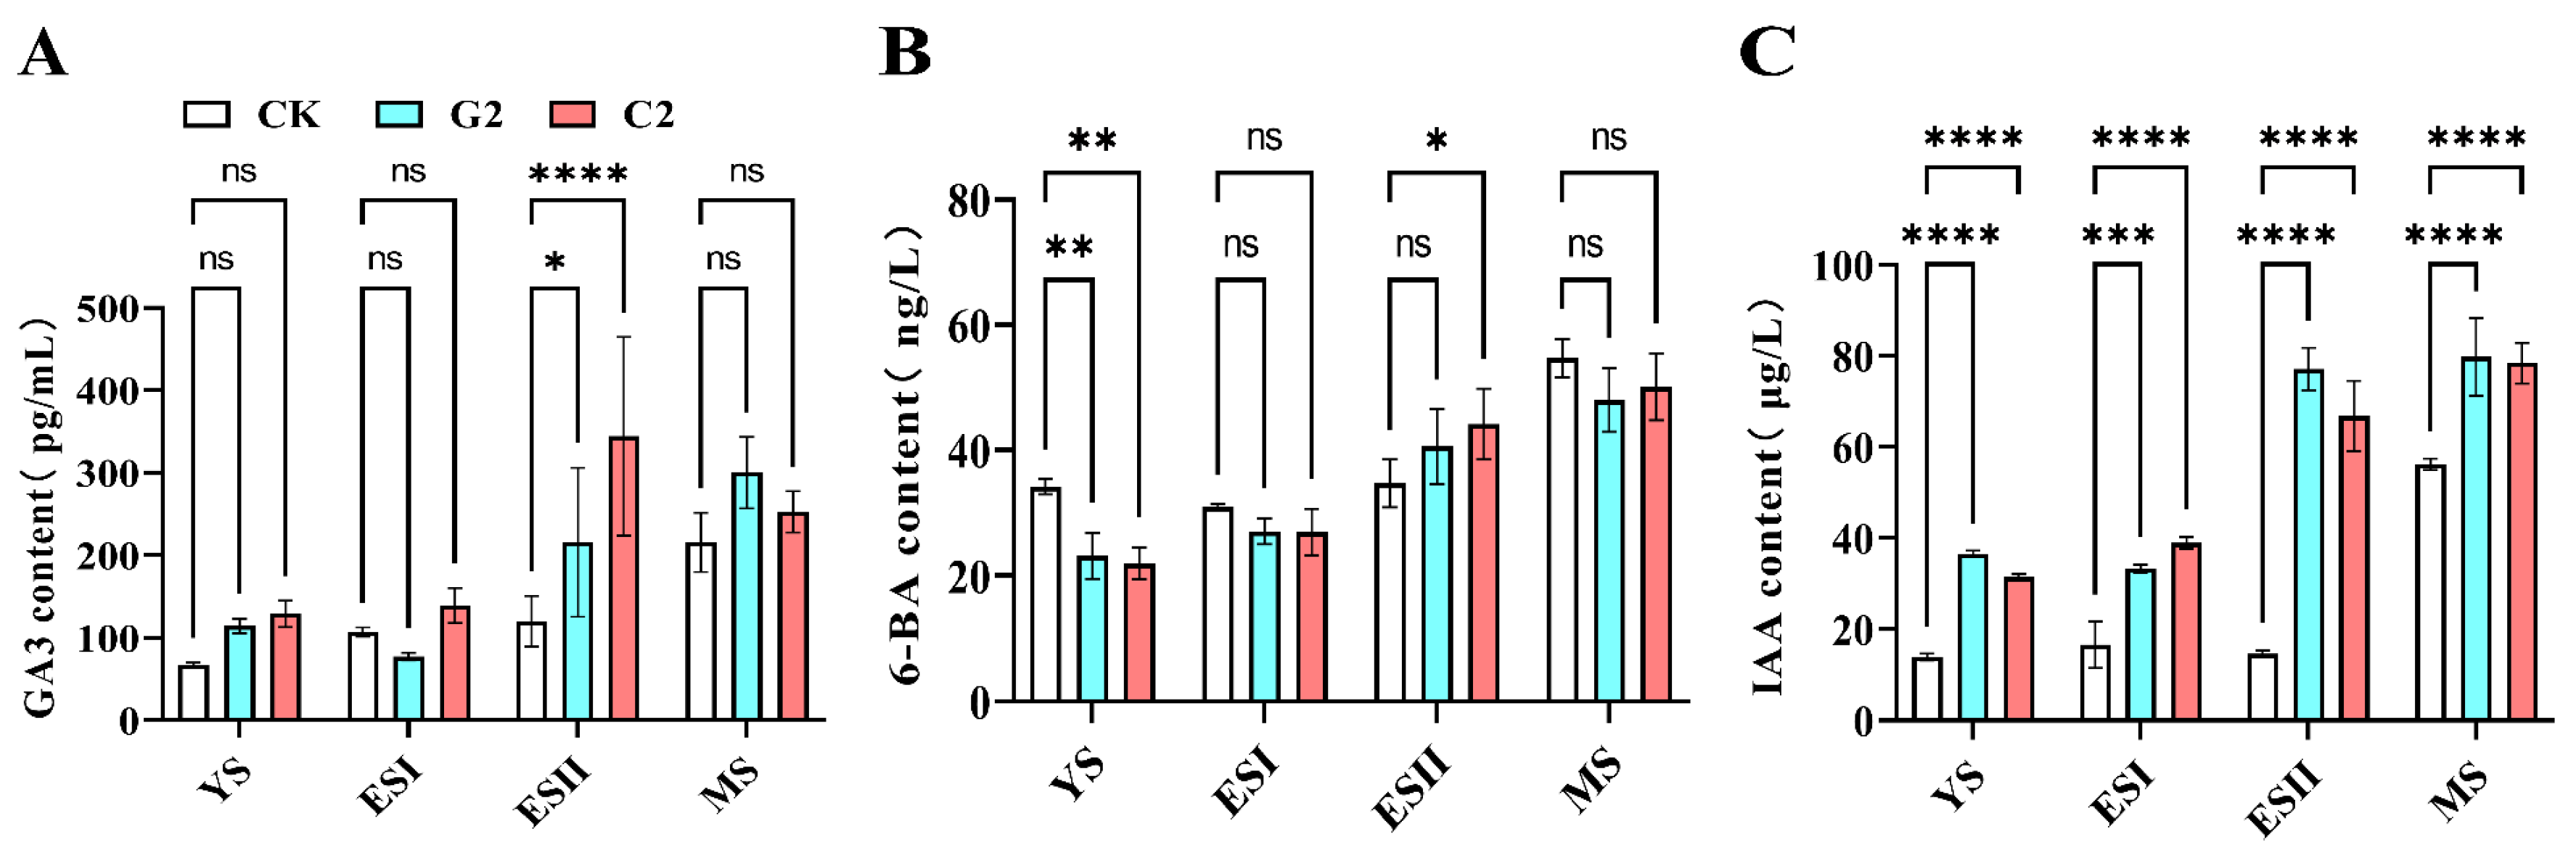
With respect to the overall hormonal changes across the berry growth cycle, the levels of endogenous GA3, 6-BA, and IAA in all three treatment groups exhibited an upward trend (Figure 3A–C). Notably, the endogenous IAA content in the G2 and C2 groups increased extremely significantly; at all four stages, the endogenous IAA content in the G2 and C2 groups was significantly higher than that in the CK group. In contrast, significant differences in endogenous GA3 were observed only when berries developed to enlargement stage II: specifically, the endogenous GA3 content in the C2 group was extremely significantly higher than that in the CK group, whereas the G2 group showed a significant increase compared to the CK group. At the young fruit stage, the endogenous 6-BA content in the CK group was significantly higher than that in both the G2 and C2 groups. As berries developed to enlargement stage II, only the endogenous 6-BA content in the C2 group was significantly higher than that in the CK group. However, no significant differences were detected at enlargement stage I or the mature stage, with the CK group exhibiting higher endogenous 6-BA content than the two treatment groups.

3.4. Transcriptome Data Analysis of ‘Shine Muscat’ After GA3 and CPPU Treatments

Following the application of exogenous GA3 and CPPU, the berry shape exhibits significant alterations at enlargement stage II. Notably, endogenous GA3, IAA, and 6-BA collectively display a marked upward trend during this stage. To elucidate the potential molecular mechanism underlying the relationship between plant hormones and berry shape, transcriptome analysis was conducted on the GA3-treated group, CPPU-treated group, and CK group at enlargement stage II, with the aim of identifying differentially expressed genes (DEGs) responsive to GA3 and CPPU treatments. Transcriptome analysis results indicated that 2793 and 1082 DEGs were identified in the CKvsG2 and CKvsC2 comparisons, respectively (Figure 4A). Within the CKvsG2 comparison, 674 DEGs were up-regulated and 2119 were down-regulated. In the CKvsC2 comparison, a total of 741 DEGs exhibited up-regulation and 341 showed down-regulation. Furthermore, the results of the Venn diagram indicated that there were 380 overlapping DEGs shared between the two comparison groups. (Figure 4B).
To further explore the regulatory roles of plant hormone-related DEGs during the critical period of berry shape variation, KEGG enrichment analysis and GO enrichment analysis were conducted. In the GO enrichment analysis, DEGs were predominantly enriched in three major categories: biological processes, cellular components, and molecular functions. Specifically, plant hormone-related GO terms in the CKvsG2 group were significantly enriched (p < 0.05) (Figure 4C), including auxin-activated signaling pathway (GO:0009734), cellular response to auxin stimulus (GO:0071365), cellular response to abscisic acid stimulus (GO:0071215), auxin homeostasis (GO:0010252), abscisic acid-activated signaling pathway (GO:0009738), auxin efflux (GO:0010315), salicylic acid metabolic process (GO:0009696), auxin transport (GO:0060918), brassinosteroid metabolic process (GO:0016131), regulation of auxin-mediated signaling pathway (GO:0010928), regulation of salicylic acid biosynthetic process (GO:0080142), response to auxin (GO:0009733), and abscisic acid binding (GO:0010427). Within the CKvsC2 group, significant enrichment was detected in the salicylic acid metabolic process (GO:0009696), jasmonic acid metabolic process (GO:0009694), cytokinin metabolic process (GO:0009690), regulation of salicylic acid biosynthetic process (GO:0080142), regulation of salicylic acid metabolic process (GO:0010337), ethylene-activated signaling pathway (GO:0009873), and response to ethylene (GO:0009723) (Figure 4D). KEGG enrichment pathway analysis indicated (p < 0.05) that the zeatin biosynthesis pathway (ko03030) was significantly enriched in G2 and C2 groups (Figure 4E,F). Furthermore, brassinosteroid biosynthesis (ko00905) and plant hormone signal transduction (ko04075) were significantly enriched in the CKvsG2 comparison.
Common genes involved in the “plant hormone signal transduction” pathway were identified through combined analysis of CKvsG2 and CKvsC2 (p < 0.05, |log2Fc| > 1). Among these, indole-3-acetic acid-amide synthetase GH3.17 (Vitvi01g01791), protein TIFY 9 (Vitvi01g02293), unnamed protein product PR1B1 (Vitvi03g00752), and putative protein phosphatase 2C8 PP2C51 (Vitvi16g01985) all exhibited downregulated expression in response to GA3 and CPPU treatments. The unnamed protein product ARR6 (Vitvi17g00732) was downregulated following GA3 treatment, whereas its expression was upregulated after CPPU application. Transcriptome data indicated that Vitvi17g00732, a key differentially expressed gene belonging to the type-A ARR family in the cytokinin signal transduction pathway, showed significant downregulation and upregulation in response to GA3 and CPPU treatments, respectively. Given the significant alterations in berry phenotype and cell shape observed during this period, Vitvi17g00732 (VvARR) is predicted to be a key candidate gene involved in the regulation of berry shape.

3.5. Analysis of Expression Characteristics of Differentially Expressed Genes

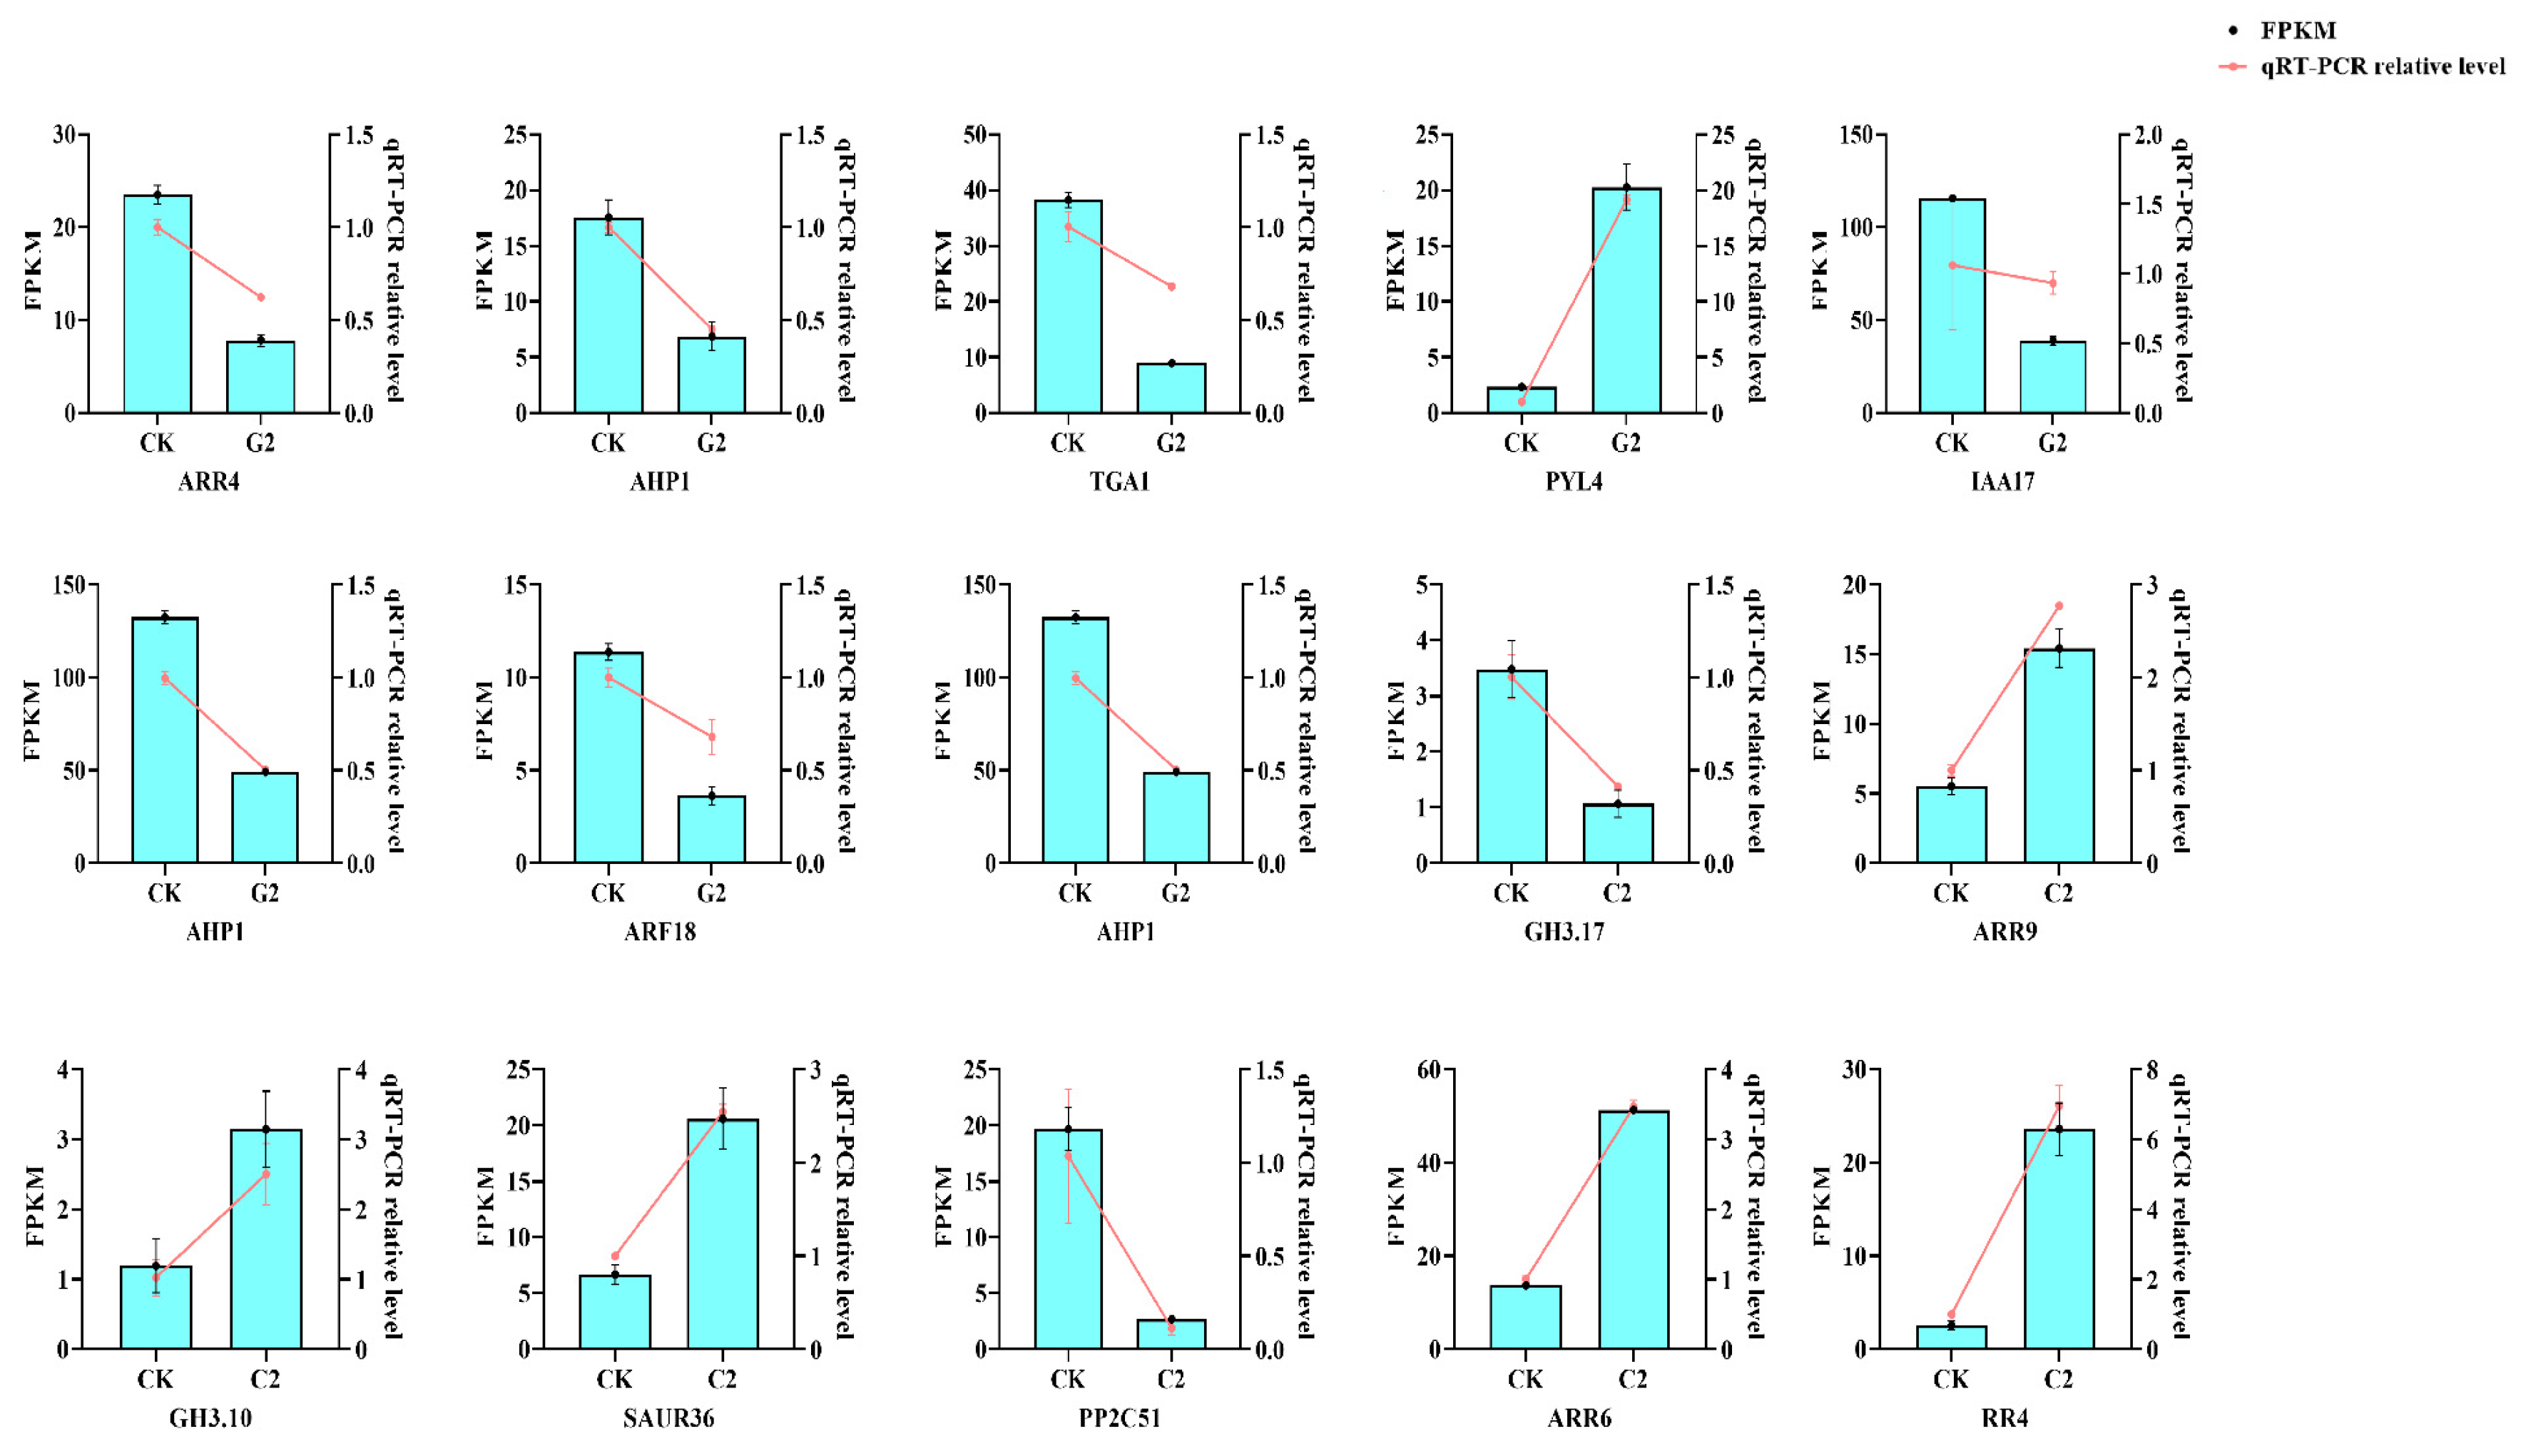
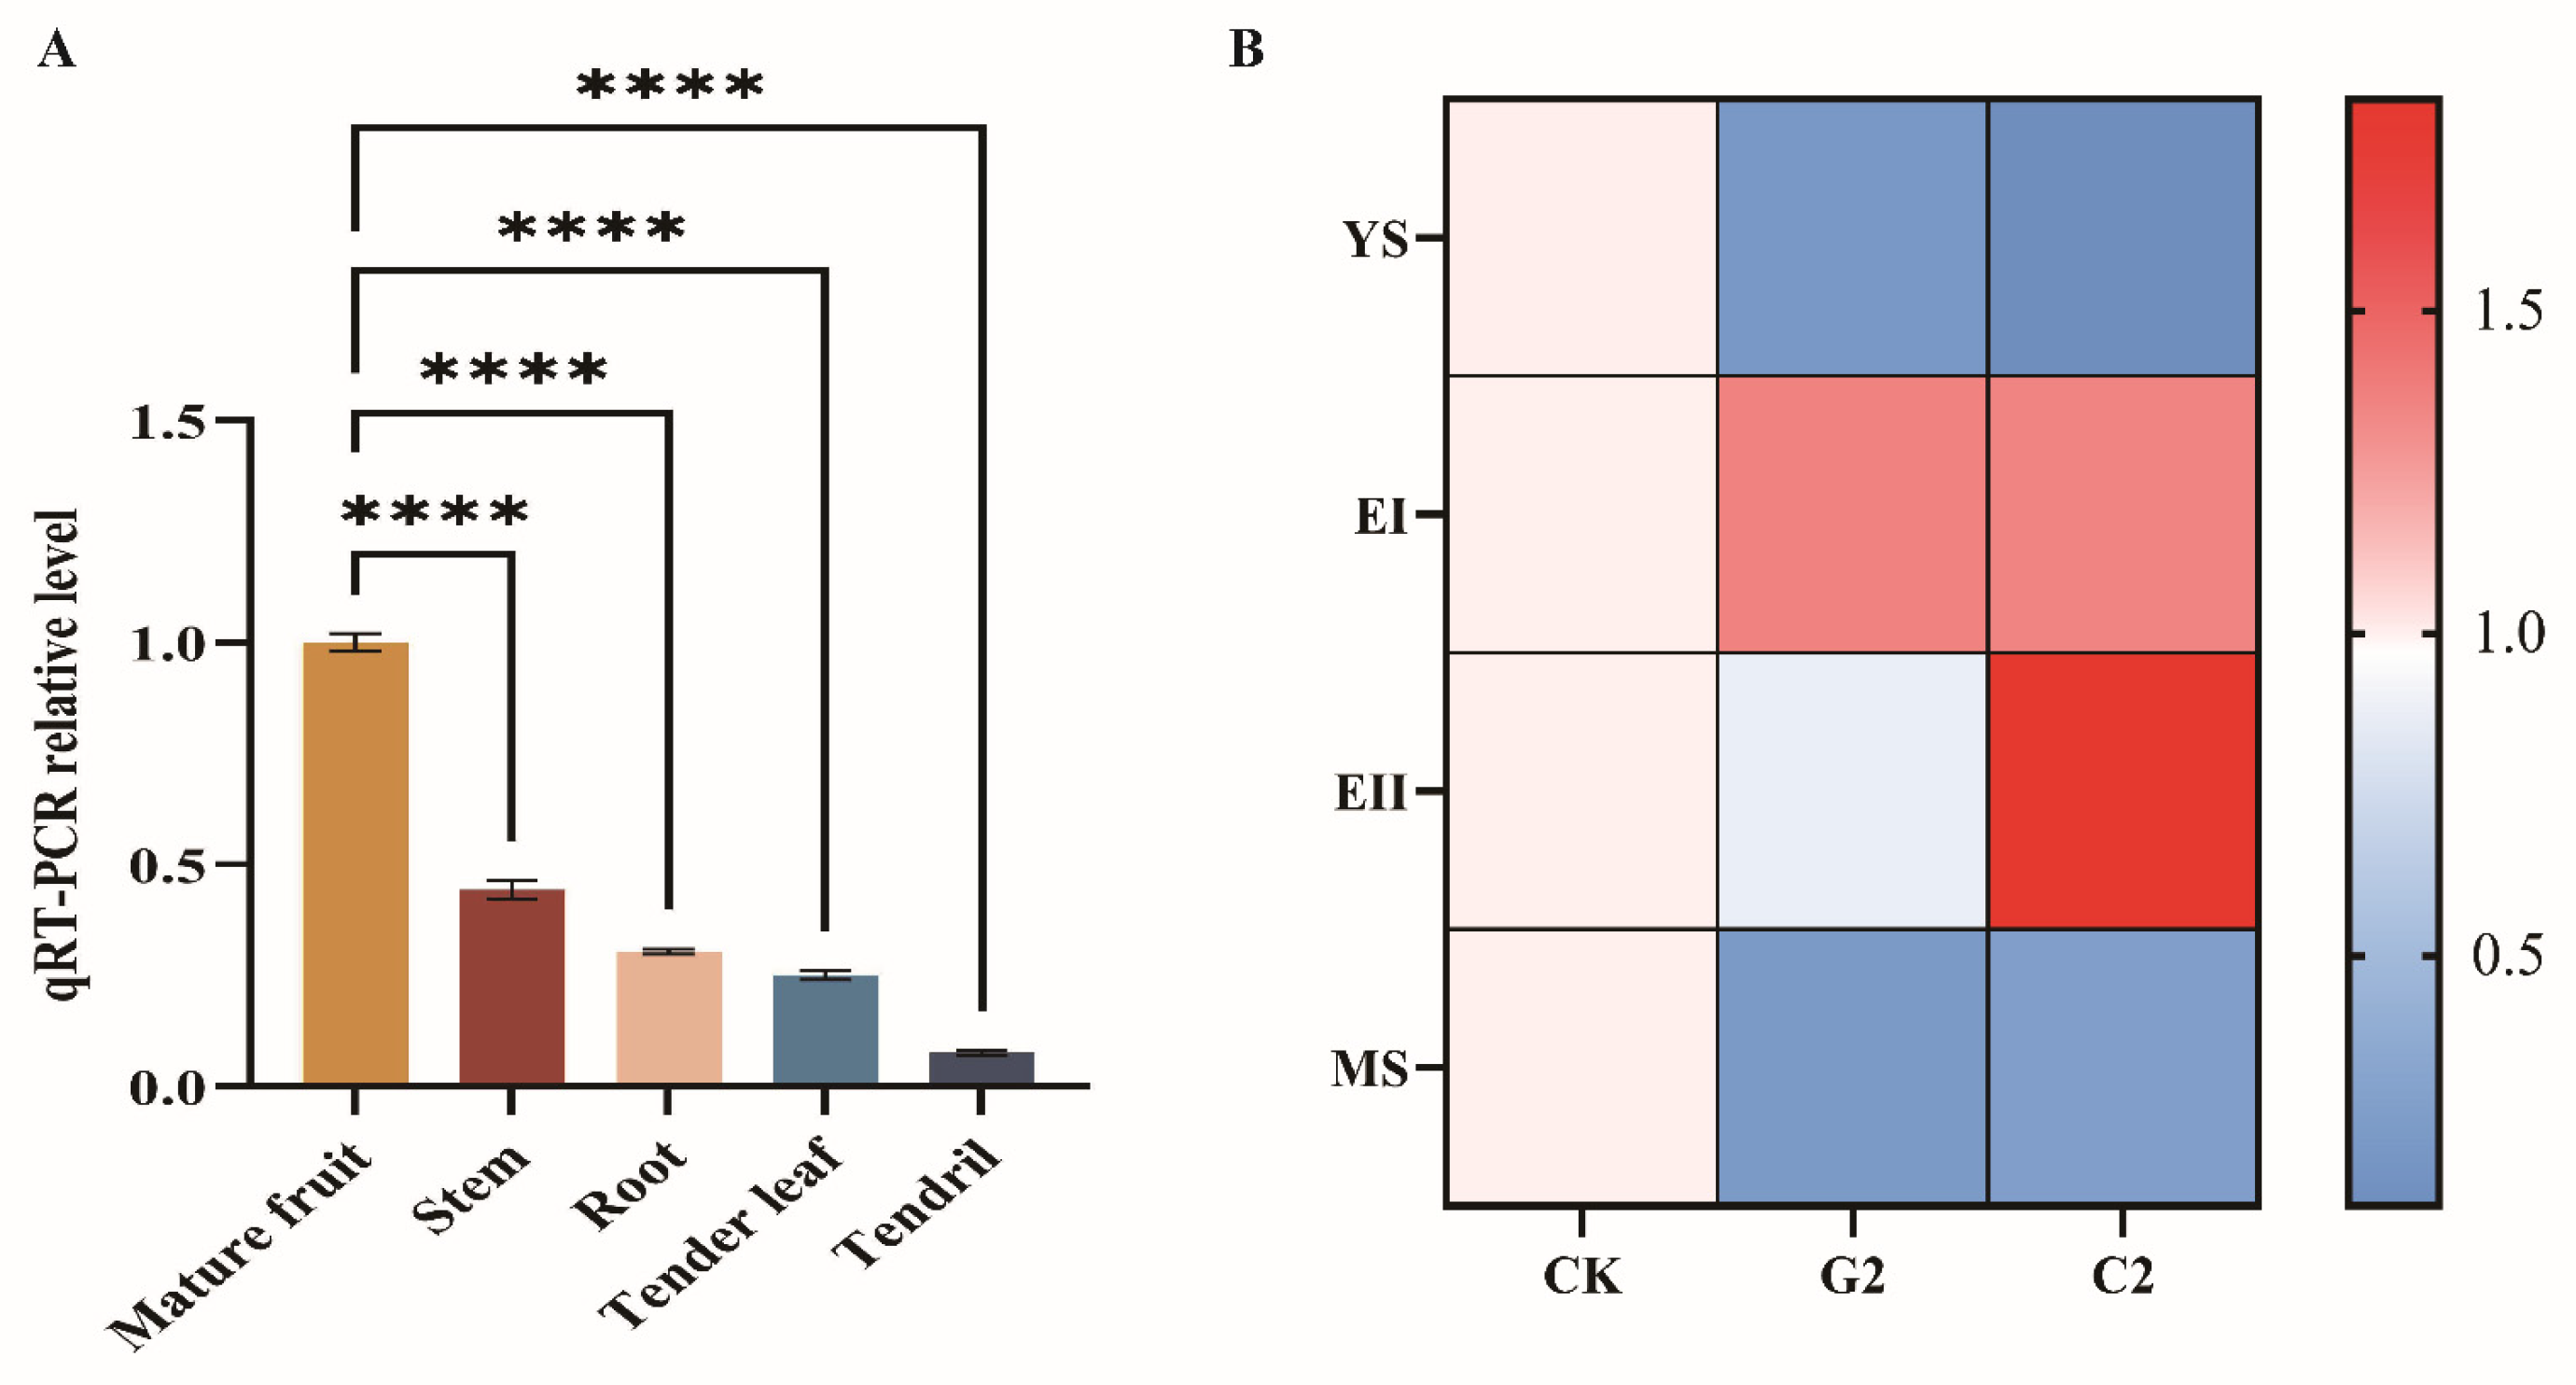
Fifteen differentially expressed genes were selected from the plant signal transduction pathway to validate the reliability of RNA-Seq data. According to the high FPKM values derived from transcriptome data and the results of quantitative real-time PCR (qRT-PCR), the relative expression levels of these 15 differentially expressed genes were highly consistent with those obtained from RNA-Seq (Figure 5). The results of quantitative real-time PCR analyzing tissue-specific expression patterns demonstrated that, with the relative expression level in ‘Shine Muscat’ berry as the reference, the expression levels of VvARR in stems, roots, young leaves, and tendrils of ‘Shine Muscat’ were 0.44, 0.3, 0.25, and 0.08 times that in berry, respectively. These values were substantially lower than the expression level in berry, indicating that VvARR is specifically expressed in berry (Figure 6A). Moreover, the results of spatiotemporal expression pattern analysis indicated that, with the fluorescent expression levels of VvARR in the young fruit stage, enlargement stage I, enlargement stage II, and mature stage of the ‘Shine Muscat’ CK group as the reference, the spatiotemporal expression levels of VvARR following GA3 application in the young fruit stage, enlargement stage I, enlargement stage II, and mature stage were 0.21, 1.36, 0.87, and 0.22 times those of the CK group, respectively. Subsequent to CPPU treatment, the spatiotemporal expression levels of VvARR in the young fruit stage, enlargement stage I, enlargement stage II, and mature stage were 0.11, 1.35, 1.83, and 0.26 times those of the CK group, respectively (Figure 6B).

3.6. Transient Overexpression and Virus-Induced Gene Silencing of VvARR Result in Changes in the Cellular Morphology of ‘Shine Muscat’

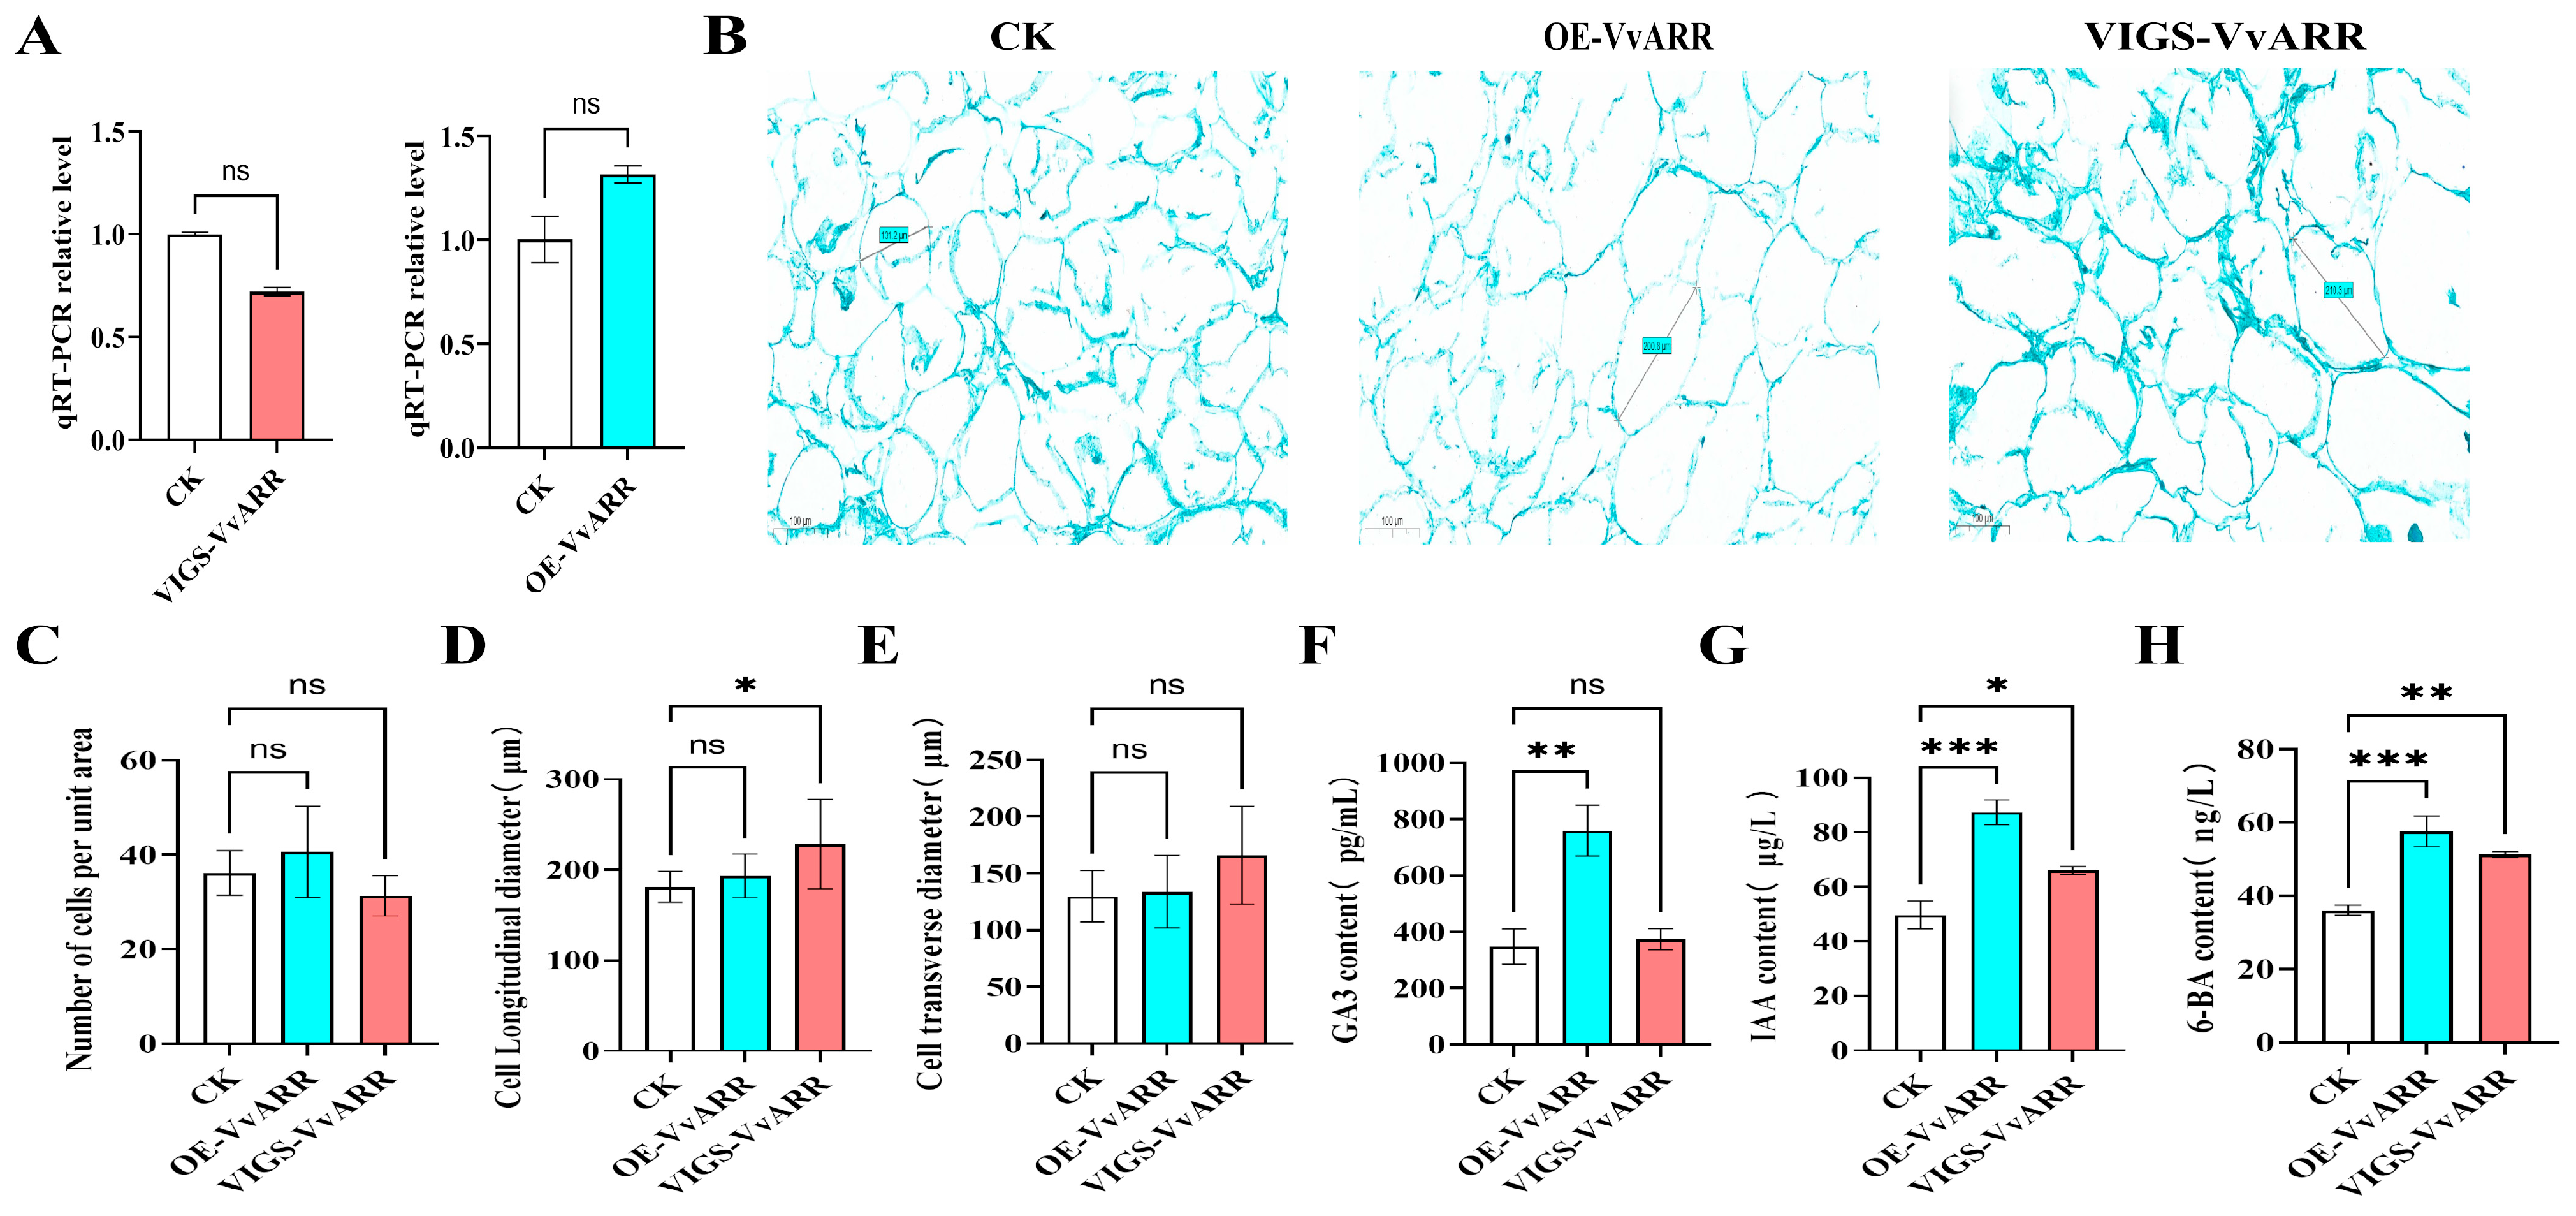
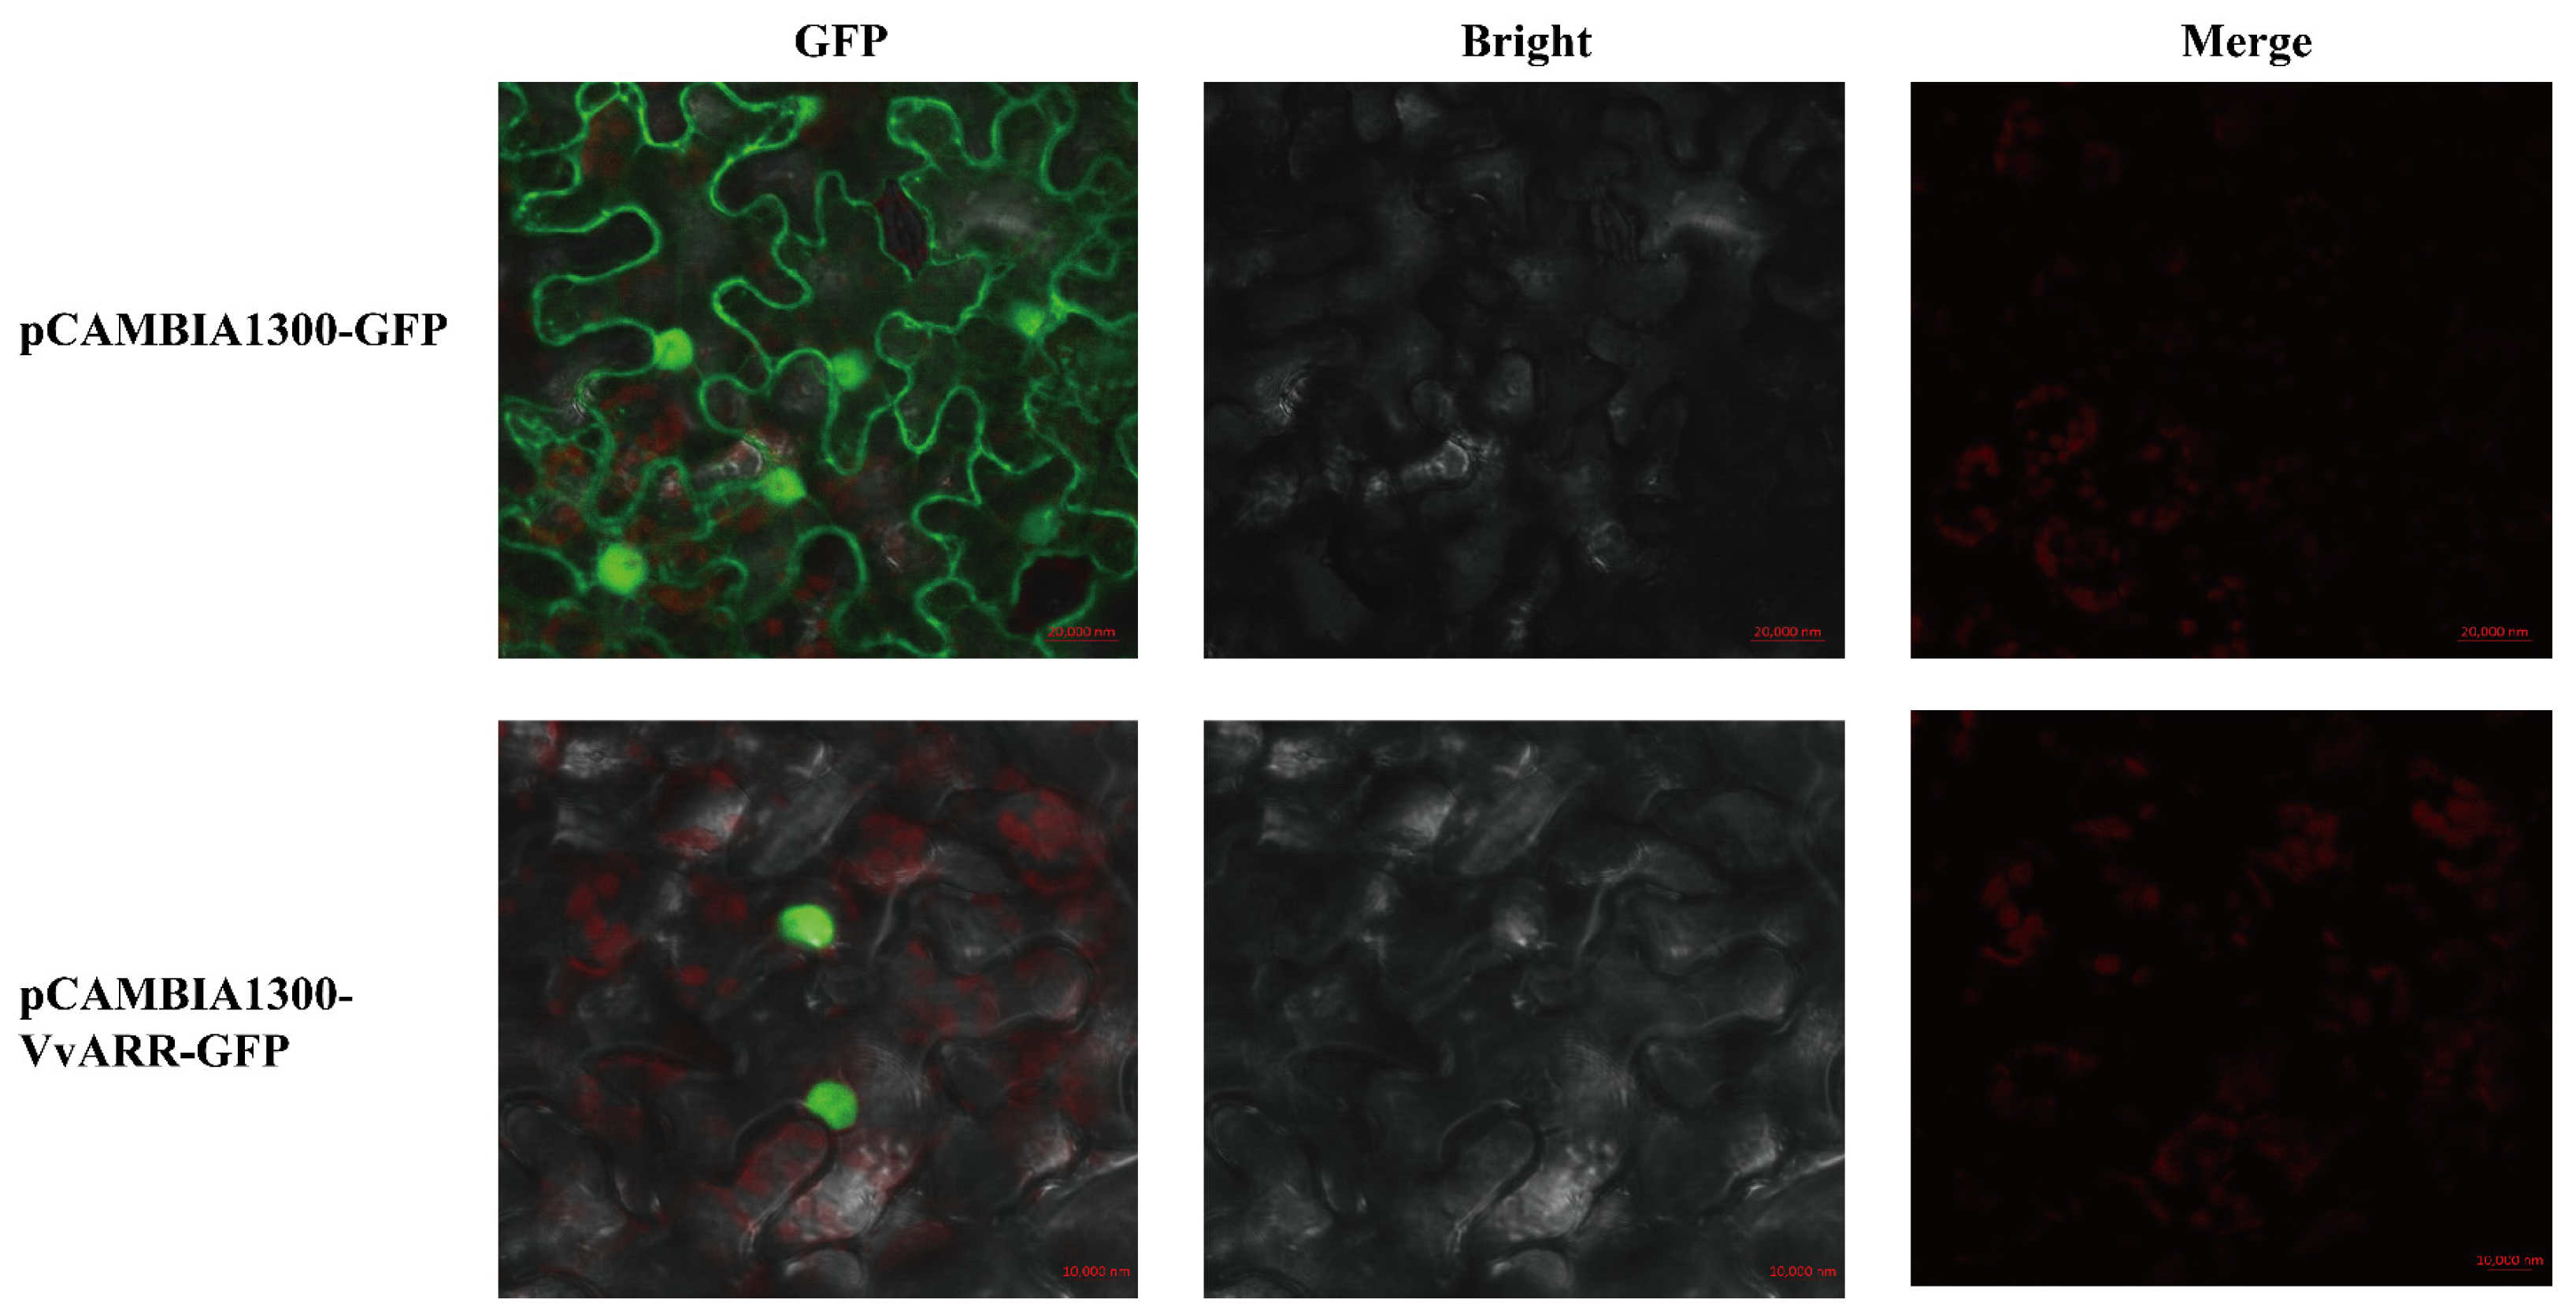
To explore the role of the VvARR gene in regulating the cellular morphology of berry, transient overexpression (OE) and virus-induced gene silencing (VIGS) of VvARR were conducted in grape. The expression level of VvARR in OE-VvARR berries was 1.31 times higher than that in the control group, whereas the expression level of VvARR in VIGS -VvARR berries was 0.72 times that in the control group (Figure 7A). Observations of paraffin sections demonstrated that the number of cells per unit area, cell transverse diameter, and cell longitudinal diameter in OE-VvARR berries were all greater than those in the control group, with no significant differences observed. In VIGS -VvARR berries, the number of cells per unit area was decreased compared to the control. Additionally, the cell transverse diameter exhibited an increase without statistical significance, whereas the cell longitudinal diameter showed a significant increase (Figure 7B–E). Determination results of endogenous hormones indicated that the contents of endogenous GA3, 6-BA, and IAA in OE-VvARR berries were significantly higher than those in the CK group. In contrast, the contents of endogenous IAA and 6-BA in VIGS -VvARR berries were significantly higher than those in the CK group, whereas no significant difference was observed in endogenous GA3 content (Figure 7F–H). Protein subcellular localization predictions via the Plant-mPLoc website indicated that the protein is localized to the nucleus. Consistent with this, fluorescence microscopy observations revealed that GFP in the control group was uniformly distributed across the entire cell, whereas the fluorescent protein of pCAMBIA1300-VvARR-GFP was exclusively detected in the nucleus (Figure 8).

4. Discussion

4.1. Potential Regulation of Plant Hormones on Berry Shape

Plant hormones mediate responses to external and endogenous stimuli via a complex regulatory network. Endogenous plant hormones act synergistically or antagonistically to modulate distinct stages of berry growth and development, ultimately governing berry shape and size [34,35,36]. Previous studies have reported that plant growth regulators modulate the interaction between transcription factors in grape endogenous hormone synthesis pathways and berry shape-related regulatory proteins [37,38], thereby inducing alterations in endogenous plant hormone levels and potentially influencing berry shape [39]. Notably, in the absence of exogenous plant growth regulators, variations in endogenous plant hormones are also observed among berries of differing shapes. Among grape varieties exhibiting long elliptical, elliptical, and round morphologies, the contents of endogenous hormones IAA, GA3, and ZT differ significantly across various growth stages [40], indicating a potential correlation between grape endogenous hormones and berry shape phenotypes.
The results of this study demonstrate that separate treatments of ‘Shine Muscat’ inflorescences with exogenous GA3 and CPPU induce significant alterations in berry shape during the subsequent growth and development of berries. Furthermore, the endogenous IAA content in both treatment groups was higher than that in the CK group at the young fruit stage, enlargement stage I, enlargement stage II and mature stage, exhibiting an overall upward trend, which aligns with previous research findings [41]. The auxin biosynthesis pathway is active across different of berry development; following the application of exogenous GA3, the expression of various auxin synthesis-related genes, such as YUCCA, is upregulated during the early and mature stages of berry development [42,43]. Transcriptome analysis in the present study further revealed that 18 differentially expressed genes associated with the auxin signaling pathway were identified following GA3 treatment, including 8 SAUR genes (Vitvi04g01831, Vitvi16g01359, Vitvi18g01091, Vitvi03g01353, Vitvi03g04029, Vitvi02g00507, Vitvi09g01495, Vitvi03g01348), 3 ARF genes (Vitvi18g01086, Vitvi10g00510, Vitvi15g00946), 3 GH3 genes (Vitvi01g01791, Vitvi07g00293, Vitvi07g01644), and 4 IAA genes (Vitvi09g00336, Vitvi09g00437, Vitvi05g00838, Vitvi07g00687). Exogenous GA3 elevates tryptophan content by facilitating protein degradation in grapes, and auxin synthesis is enhanced under the catalysis of tryptophan aminotransferase [44]. CPPU promotes ovary growth during the flowering stage via its inherent cytokinin activity [45], whereas the processes of pollination, fertilization, and ovary growth result in increased auxin content and accelerated signal transduction [46]. During the young fruit stage, endogenous GA3 contents in both treatment groups were significantly higher than those in the CK group, exhibiting an upward trend throughout the developmental process. Previous studies have demonstrated that exogenous GA3 application can enhance endogenous GA3 levels, resulting in significant differences in the expression of gibberellin biosynthesis-related genes and their signal transduction pathways compared with the control group [47]. GA3, IAA and CTK coordinately promote cell division and expansion, playing critical roles in berry development and enlargement [11]. An interesting observation was made following the application of CPPU and GA3: overall, the endogenous cytokinin 6-BA content in both treatment groups remained lower than that in the control group throughout the growth period. This phenomenon may be attributed to the accelerated cell division induced by GA3 and CPPU treatments, which prompted endogenous cytokinins to respond to external stimuli and be translocated to other tissues via transporters, thereby resulting in reduced hormone levels relative to the CK group [48]. Previous studies have demonstrated that endogenous cytokinin content in young grape berries decreases significantly after CPPU treatment, with VILOGs genes—key regulators in the cytokinin synthesis pathway—exhibiting differential expression.
Notably, alterations in endogenous GA3 and 6-BA contents following VvARR overexpression or silencing in ‘Shine Muscat’ berries may arise from the mutual inhibition of cytokinin and gibberellin biosynthesis. This inhibition occurs through competition for their shared precursor, isopentenyl pyrophosphate (IPP), thereby leading to changes in endogenous hormone levels [49].

4.2. Impact of Cell Morphology on Berry Shape

Berries typically develop from ovaries. Following inflorescences pollination and fertilization, ovary cells undergo continuous division and expansion, driving progressive berry growth and development. From a cytological standpoint, therefore, the number and volume of cells within the berry constitute the primary factors influencing growth and development. Cell division and cell expansion represent two key processes involved in the formation of the berry shape index during grape growth and development. The grape growth cycle follows a double “S”-shaped curve, generally encompassing three stages: the young fruit stage, the slow growth stage, and the veraison stage [50].
Berry shape is determined by the cellular morphology, size, and quantity of flesh cells. Histological observations in this study revealed that the significant increase in both transverse and longitudinal cell diameters following GA3 treatment may be attributed to the responsiveness of cell wall extensibility to exogenous GA3 stimulation. This mechanism regulates berry shape at the cellular level by modulating the expression of genes associated with cell expansion and division [51]. Additionally, the number of cells per unit area was significantly lower in the GA3-treated group compared to the CK group, resulting in an obovate berry shape. Application of exogenous CPPU at a specific concentration increased the transverse diameter, longitudinal diameter, and cell count per unit area of ‘Shine Muscat’ berries, though these differences were not statistically significant relative to the CK group. This suggests that CPPU influences berry shape by accelerating cell division and increasing cell volume. Consistent with this, a study on pears demonstrated that exogenous CPPU promotes cell proliferation by regulating the interaction between the cell proliferation regulator PbGIF1 and the cytokinin response factor PbRR1 [52].
Furthermore, results from transient infection experiments in this study indicated that overexpression of VvARR increases cell number per unit area and elongates both transverse and longitudinal cell diameters by promoting cell division. In contrast, silencing VvARR inhibits cell division, thereby reducing cell number per unit area while increasing transverse and longitudinal cell diameters. These findings confirm the potential role of the cytokinin synthesis-related gene VvARR in regulating berry shape at the cellular level.
Currently, the berry shapes of Shine Muscat in the market are predominantly oval and round [30], as these shapes reduce packaging and transportation costs while enhancing market value growth. However, the molecular mechanisms underlying the berry shape remain to be further elucidated. This study investigated the regulatory impacts of exogenous plant growth regulators on berry morphology at the cellular dimension. Specifically, GA3 promoted the longitudinal elongation of berries by enhancing the transverse and longitudinal diameters of grape berry cells while decreasing the cell density per unit area. In contrast, CPPU facilitated the transverse expansion of berries by increasing both the cell number per unit area and the cellular transverse/longitudinal diameters. Results from the berry transient overexpression assay showed that VvARR up-regulated the contents of endogenous GA3, IAA, and 6-BA, thereby augmenting the cell number per unit area and cellular dimensional parameters, which collectively contributed to the regulatory role in berry shaping. Building upon the findings of this investigation, future inquiries should endeavor to further dissect the upstream and downstream regulatory components of VvARR within the cytokinin signaling cascade. This could involve the identification of transcription factors that interact with the VvARR promoter, as well as the characterization of target genes modulated by VvARR, with the aim of delineating the comprehensive regulatory network through which VvARR governs grape berry morphogenesis. This research aims to decipher the potential correlations between berry cell morphology/quantity and berry shape under the synergistic regulation of plant endogenous hormones, providing a theoretical foundation for the subsequent clarification of molecular mechanisms governing berry shape determination.

5. Conclusions

In summary, this study systematically compared the regulatory impacts of GA3 and CPPU on Shine Muscat berry morphology across phenotypic, cellular, hormone, and molecular levels. The key finding that GA3 predominantly promotes cell elongation (by augmenting cellular transverse and longitudinal diameters) while reducing cell density per unit area, whereas CPPU primarily increases cell number per unit area (with negligible effect on cell size), elucidates the distinct cytological mechanisms through which these two plant growth regulators govern grape berry shape. In KEGG enrichment analysis, these DEGs were primarily enriched in zeatin biosynthesis and plant hormone signal transduction pathways, with GO enrichment terms also showing significant associations with plant hormones. Among these, VvARR was identified as a key candidate gene regulating berry shape changes. Results from transient infection experiments demonstrated that overexpression of VvARR increased cell number per unit area and cellular transverse and longitudinal diameters in grape berries, whereas silencing VvARR reduced cell number per unit area while increasing cellular transverse and longitudinal diameters. Correspondingly, overexpression or silencing of VvARR resulted in a significant overall increase in endogenous GA3, 6-BA, and IAA contents, suggesting that cell morphology and endogenous hormones play an active role in regulating berry shape. This study endeavours to elucidate the modulation of berry morphology by berry cells under the concerted interplay of plant endogenous hormones, furnishing an empirical foundation for the breeding of diversified grape berry configurations.

Author Contributions

Conceptualization, Y.W. and Z.Y.; methodology, J.C., Y.G. and H.H.; data curation, L.H., Z.L. and D.Z.; resources, C.F. and L.W.; writing—original draft preparation, J.C.; writing—review and editing, J.C. and Y.G.; project administration, Y.W. and Z.Y. All authors have read and agreed to the published version of the manuscript.

Funding

This research was funded by Public Welfare Research Program Key Project of Ningbo (2024S016), the Key Research and Development Program of Zhejiang Province (2021C02053), and the First Class Discipline-Bioengineering-Student Innovation Project in 2024 (CX2024002).

Data Availability Statement

The original contributions presented in this study are included in the article. Further inquiries can be directed to the corresponding author.

Conflicts of Interest

The authors declare no conflicts of interest.

References

  1. Xin, T.; Zhang, Z.; Li, S.; Zhang, S.; Li, Q.; Zhang, Z.; Huang, S.; Yang, X. Genetic regulation of ethylene dosage for cucumber fruit elongation. Plant Cell 2019, 31, 1063–1076. [Google Scholar] [CrossRef]
  2. Cong, B.; Liu, J.; Tanksley, S.D. Natural alleles at a tomato fruit size quantitative trait locus differ by heterochronic regulatory mutations. Proc. Natl. Acad. Sci. USA 2002, 99, 13606–13611. [Google Scholar] [CrossRef]
  3. Mauxion, J.; Chevalier, C.; Gonzalez, N. Complex cellular and molecular events determining fruit size. Trends Plant Sci. 2021, 26, 1023–1038. [Google Scholar] [CrossRef]
  4. Wang, C.; Cao, J.; Hao, N.; Wu, T. Genetic and molecular regulation mechanisms in the formation and development of vegetable fruit shape. Appl. Sci. 2022, 12, 1514. [Google Scholar] [CrossRef]
  5. Li, W.; Zhou, Q.; Ma, Z.; Zuo, C.; Chu, M.; Mao, J.; Chen, B. Regulatory mechanism of GA3 application on grape (Vitis vinifera L.) Berry size. Plant Physiol. Biochem. 2024, 210, 108543. [Google Scholar] [CrossRef]
  6. Liu, X.; Pan, Y.; Liu, C.; Ding, Y.; Wang, X.; Cheng, Z.; Meng, H. Cucumber fruit size and shape variations explored from the aspects of morphology, histology, and endogenous hormones. Plants 2020, 9, 772. [Google Scholar] [CrossRef]
  7. Chen, S.; Wang, X.; Tan, G.; Zhou, W.; Wang, G. Gibberellin and the plant growth retardant paclobutrazol altered fruit shape and ripening in tomato. Protoplasma 2020, 257, 853–861. [Google Scholar] [CrossRef]
  8. Nakata, Y.; Taniguchi, G.; Takazaki, S.; Oda-Ueda, N.; Miyahara, K.; Ohshima, Y. Comparative analysis of cells and proteins of pumpkin plants for the control of fruit size. J. Biosci. Bioeng. 2012, 114, 334–341. [Google Scholar] [CrossRef]
  9. Wang, G.; Gao, X.; Wang, X.; Liu, P.; Guan, S.L.; Qi, K.; Zhang, S.; Gu, C. Transcriptome analysis reveals gene associated with fruit size during fruit development in pear. Sci. Hortic. 2022, 305, 111367. [Google Scholar] [CrossRef]
  10. Yamada, M.; Yamane, H.; Sato, A.; Hirakawa, N.; Iwanami, H.; Yoshinaga, K.; Ozawa, T.; Mitani, N.; Shiraishi, M.; Yoshioka, M. New grape cultivar ‘shine muscat’. Bull. Natl. Inst. Fruit Tree Sci. 2008, 7, 21–38. [Google Scholar]
  11. Li, X.; Cai, Z.; Liu, X.; Wu, Y.; Han, Z.; Yang, G.; Li, S.; Xie, Z.; Liu, L.; Li, B. Effects of gibberellic acid on soluble sugar content, organic acid composition, endogenous hormone levels, and carbon sink strength in shine muscat grapes during berry development stage. Horticulturae 2024, 10, 346. [Google Scholar] [CrossRef]
  12. Hedden, P. The current status of research on gibberellin biosynthesis. Plant Cell Physiol. 2020, 61, 1832–1849. [Google Scholar] [CrossRef]
  13. Zhou, Y.; Cheng, Y.; Zhong, R.; Tang, J.; Pervaiz, T.; Zhou, S.; Liu, J.; Wang, B.; Jia, H. Brassinolide and gibberellin promote grape fruit development and quality. Sci. Hortic. 2024, 338, 113619. [Google Scholar] [CrossRef]
  14. Xue, H.; Sekozawa, Y.; Sugaya, S. Effects of gibberellin and abscisic acid on fruit quality and aromatic compound formation during fruit development in ‘kyoho’ grapes (Vitis vinifera L. × Vitis labrusca L.). Environ. Control Biol. 2022, 60, 67–78. [Google Scholar] [CrossRef]
  15. Gao, X.T.; Wu, M.H.; Sun, D.; Li, H.Q.; Chen, W.K.; Yang, H.Y.; Liu, F.Q.; Wang, Q.C.; Wang, Y.Y.; Wang, J. Effects of gibberellic acid (GA3) application before anthesis on rachis elongation and berry quality and aroma and flavour compounds in Vitis vinifera L. ‘cabernet franc’ and ‘cabernet sauvignon’ grapes. J. Sci. Food. Agric. 2020, 100, 3729–3740. [Google Scholar] [CrossRef]
  16. Marzouk, H.A.; Kassem, H.A. Improving yield, quality, and shelf life of thompson seedless grapevine by preharvest foliar applications. Sci. Hortic. 2011, 130, 425–430. [Google Scholar] [CrossRef]
  17. Peppi, M.C.; Fidelibus, M.W. Effects of forchlorfenuron and abscisic acid on the quality of ‘flame seedless’ grapes. Hortscience 2008, 43, 173–176. [Google Scholar] [CrossRef]
  18. Stern, R.; Shargal, A.; Flaishman, M. Thidiazuron increases fruit size of ‘spadona’and ‘coscia’pear (Pyrus communis L.). J. Horticult. Sci. Biotechnol. 2003, 78, 51–55. [Google Scholar] [CrossRef]
  19. Bhujbal, B.G.; Ranawade, D.B.; Jagtap, K.B. Effect of CPPU on quality of grapes cv. Tas-a-ganesh. J. Maharashtra Agric. Univ. 2002, 27, 13–14. [Google Scholar]
  20. Anfang, M.; Shani, E. Transport mechanisms of plant hormones. Curr. Opin. Plant Biol. 2021, 63, 102055. [Google Scholar] [CrossRef]
  21. Kudoyarova, G.; Akhiyarova, G. Special issue “phytohormones 2022–2023”. Biomolecules 2024, 14, 1146. [Google Scholar] [CrossRef]
  22. Yang, B.; Wendrich, J.R.; De Rybel, B.; Weijers, D.; Xue, H.W. Rice microtubule-associated protein IQ67-DOMAIN14 regulates grain shape by modulating microtubule cytoskeleton dynamics. Plant Biotechnol. J. 2020, 18, 1141–1152. [Google Scholar] [CrossRef]
  23. Kumari, P.; Dahiya, P.; Livanos, P.; Zergiebel, L.; Kölling, M.; Poeschl, Y.; Stamm, G.; Hermann, A.; Abel, S.; Müller, S. IQ67 DOMAIN proteins facilitate preprophase band formation and division-plane orientation. Nat. Plants 2021, 7, 739–747. [Google Scholar] [CrossRef]
  24. Vanneste, S.; Friml, J. Calcium: The missing link in auxin action. Plants 2013, 2, 650–675. [Google Scholar] [CrossRef]
  25. Kumar, R.; Khurana, A.; Sharma, A.K. Role of plant hormones and their interplay in development and ripening of fleshy fruits. J. Exp. Bot. 2013, 65, 4561–4575. [Google Scholar] [CrossRef]
  26. Yang, W.; Cortijo, S.; Korsbo, N.; Roszak, P.; Schiessl, K.; Gurzadyan, A.; Wightman, R.; Jönsson, H.; Meyerowitz, E. Molecular mechanism of cytokinin-activated cell division in arabidopsis. Science 2021, 371, 1350–1355. [Google Scholar] [CrossRef]
  27. Boualem, A.; Berthet, S.; Devani, R.S.; Camps, C.; Fleurier, S.; Morin, H.; Troadec, C.; Giovinazzo, N.; Sari, N.; Dogimont, C. Ethylene plays a dual role in sex determination and fruit shape in cucurbits. Curr. Biol. 2022, 32, 2390–2401. [Google Scholar] [CrossRef]
  28. Xu, Y.; Hou, X.; Feng, J.; Khalil-Ur-Rehman, M.; Tao, J. Transcriptome sequencing analyses reveals mechanisms of eliminated russet by applying GA3 and CPPU on ‘shine muscat’ grape. Sci. Hortic. 2019, 250, 94–103. [Google Scholar] [CrossRef]
  29. Xin, S.P.; Liu, S.; Yu, Y.; Nie, S.Q.; Gao, Z.H.; Tao, J.M. Effects of GA, and CPPU on grape fruit adjacent leaf photosynthesis and fruit quality. Ying Yong Sheng Tai Xue Bao = J. Appl. Ecol. 2015, 26, 1814–1820. [Google Scholar]
  30. Choi, S.; Ban, S.; Choi, C. The impact of plant growth regulators and floral cluster thinning on the fruit quality of ‘shine muscat’ grape. Horticulturae 2023, 9, 392. [Google Scholar] [CrossRef]
  31. Coombe, B.G. Adoption of a system for identifying grapevine growth stages. Aust. J. Grape Wine Res. 1995, 1, 104–110. [Google Scholar] [CrossRef]
  32. Leng, F.; Cao, J.; Wang, S.; Jiang, L.; Li, X.; Sun, C. Transcriptomic analyses of root restriction effects on phytohormone content and signal transduction during grape berry development and ripening. Int. J. Mol. Sci. 2018, 19, 2300. [Google Scholar] [CrossRef]
  33. Xie, J.; He, C.; Li, Z.; Li, M.; He, S.; Qian, J.; Tan, B.; Zheng, X.; Cheng, J.; Wang, W. A rapid and efficient agrobacterium-mediated transient transformation system in grape berries. Protoplasma 2024, 261, 819–830. [Google Scholar] [CrossRef]
  34. Li, S.; Chen, K.; Grierson, D. Molecular and hormonal mechanisms regulating fleshy fruit ripening. Cells 2021, 10, 1136. [Google Scholar] [CrossRef]
  35. Ali, S.; Baloch, A.M. Overview of sustainable plant growth and differentiation and the role of hormones in controlling growth and development of plants under various stresses. Recent Pat. Food Nutr. Agric. 2020, 11, 105–114. [Google Scholar] [CrossRef]
  36. Zhang, S.; Zhang, D.; Fan, S.; Du, L.; Shen, Y.; Xing, L.; Li, Y.; Ma, J.; Han, M. Effect of exogenous GA3 and its inhibitor paclobutrazol on floral formation, endogenous hormones, and flowering-associated genes in ‘fuji’ apple (Malus domestica borkh.). Plant Physiol. Biochem. 2016, 107, 178–186. [Google Scholar] [CrossRef]
  37. Zheng, H.; Dong, Y.; Nong, H.; Huang, L.; Liu, J.; Yu, X.; Zhang, Y.; Yang, L.; Hong, B.; Wang, W. VvSUN may act in the auxin pathway to regulate fruit shape in grape. Hortic. Res. 2022, 9, uhac200. [Google Scholar] [CrossRef]
  38. Liu, Z.; Wang, Y.; Guan, P.; Hu, J.; Sun, L. Interaction of VvDELLA2 and VvCEB1 mediates expression of expansion-related gene during GA-induced enlargement of grape fruit. Int. J. Mol. Sci. 2023, 24, 14870. [Google Scholar] [CrossRef]
  39. El-Mergawi, R.A.; Abd El-Wahed, M.S. Effect of exogenous salicylic acid or indole acetic acid on their endogenous levels, germination, and growth in maize. Bull. Natl. Res. Cent. 2020, 44, 167. [Google Scholar] [CrossRef]
  40. Nan, X.; Xie, M.; Li, W.; Chen, L.; Jiang, S.; Zhao, Y.; Ma, Z. Analysis of the regulatory mechanisms of morphogenesis in grape berries with different fruit shapes based on transcriptome. Plant Stress 2025, 15, 100792. [Google Scholar] [CrossRef]
  41. He, J.; Yu, S.; Ma, C. Effects of plant growth regulator on endogenous hormone levels during the period of the red globe growth. J. Agric. Sci. 2009, 1, 92. [Google Scholar] [CrossRef]
  42. Dong, Y.; Huang, L.; Zhang, W.; Liu, J.; Nong, H.; Wang, X.; Zheng, H.; Tao, J. Transcriptomic and functional analysis reveals that VvSAUR43 may be involved the elongation of grape berries. Sci. Hortic. 2023, 318, 112119. [Google Scholar] [CrossRef]
  43. Zhang, Y.; Yu, J.; Xu, X.; Wang, R.; Liu, Y.; Huang, S.; Wei, H.; Wei, Z. Molecular mechanisms of diverse auxin responses during plant growth and development. Int. J. Mol. Sci. 2022, 23, 12495. [Google Scholar] [CrossRef]
  44. Chai, L.; Li, Y.; Chen, S.; Perl, A.; Zhao, F.; Ma, H. RNA sequencing reveals high resolution expression change of major plant hormone pathway genes after young seedless grape berries treated with gibberellin. Plant Sci. 2014, 229, 215–224. [Google Scholar] [CrossRef]
  45. Hayata, Y.; Li Xinxian, L.X.; Osajima, Y. Pollination and CPPU treatment increase endogenous IAA and decrease endogenous ABA in muskmelons during early development. J. Am. Soc. Hortic. Sci. 2002, 127, 908–911. [Google Scholar] [CrossRef]
  46. De Jong, M.; Wolters Arts, M.; Feron, R.; Mariani, C.; Vriezen, W.H. The solanum lycopersicum auxin response factor 7 (SlARF7) regulates auxin signaling during tomato fruit set and development. Plant. J. 2009, 57, 160–170. [Google Scholar] [CrossRef]
  47. Upadhyay, A.; Maske, S.; Jogaiah, S.; Kadoo, N.Y.; Gupta, V.S. GA 3 application in grapes (Vitis vinifera L.) Modulates different sets of genes at cluster emergence, full bloom, and berry stage as revealed by RNA sequence-based transcriptome analysis. Funct. Integr. Genom. 2018, 18, 439–455. [Google Scholar] [CrossRef]
  48. Wang, L.; Xue, J.; Yan, J.; Liu, M.; Tang, Y.; Wang, Y.; Zhang, C. Expression and functional analysis of VviABCG14 from Vitis vinifera suggest the role in cytokinin transport and the interaction with VviABCG7. Plant Physiol. Biochem. 2020, 153, 1–10. [Google Scholar] [CrossRef]
  49. Wang, J.; Zhang, C.; Liu, X.; Fan, X.; Zhang, Y.; Liu, C.; Sun, L. Structure and function of Vitis vinifera arabidopsis response regulator 1 (VvARR1) protein provide insights into the regulatory mechanism of grape fruit shape through gibberellin-cytokinin crosstalk. Int. J. Biol. Macromol. 2025, 319, 145246. [Google Scholar] [CrossRef]
  50. Sweetman, C.; Wong, D.C.; Ford, C.M.; Drew, D.P. Transcriptome analysis at four developmental stages of grape berry (Vitis vinifera cv. Shiraz) provides insights into regulated and coordinated gene expression. BMC Genom. 2012, 13, 691. [Google Scholar] [CrossRef]
  51. Marowa, P.; Ding, A.; Kong, Y. Expansins: Roles in plant growth and potential applications in crop improvement. Plant Cell Rep. 2016, 35, 949–965. [Google Scholar] [CrossRef] [PubMed]
  52. Wang, H.; Sha, G.; Gao, R.; Pang, J.; Zhai, R.; Yang, C.; Wang, Z.; Xu, L. PbGIF1 promoting cell-proliferation in pear fruit is transcriptionally activated by PbRR1. Hortic. Plant J. 2024, 10, 689–697. [Google Scholar] [CrossRef]
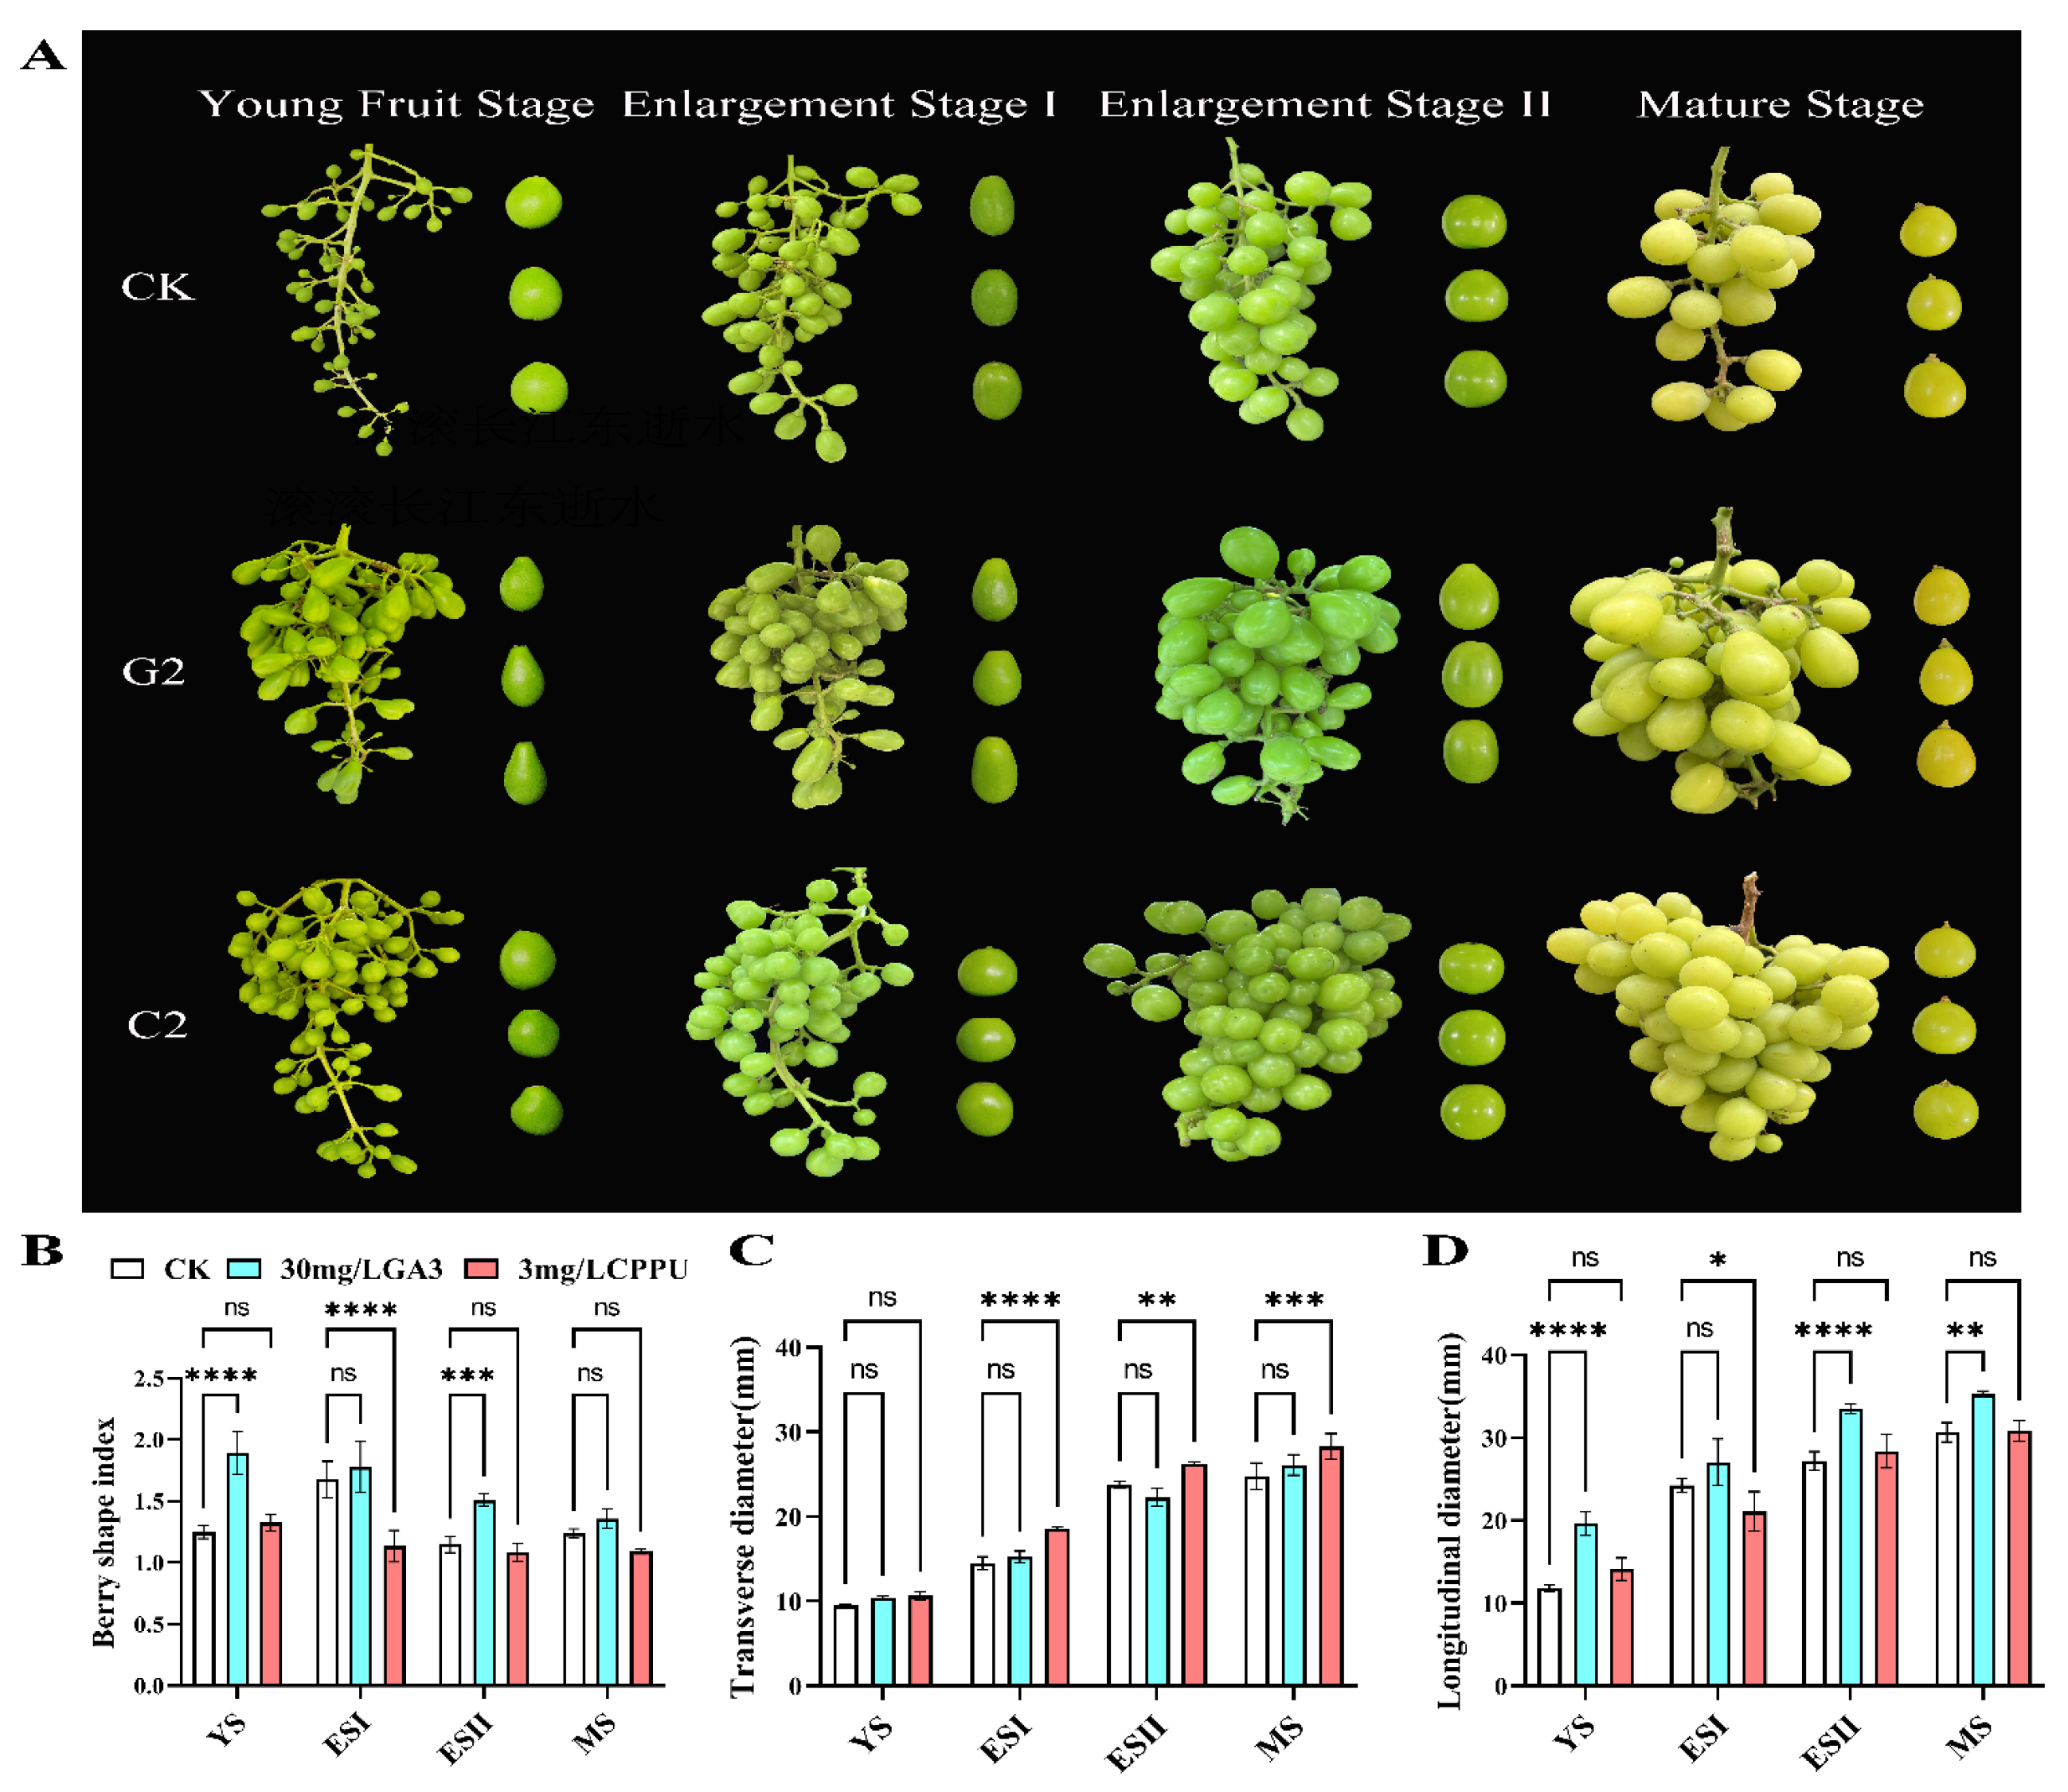
Figure 1. Spatial and temporal variation diagrams of berry shape, transverse/longitudinal diameters, and berry shape index of ‘Shine Muscat’ at four growth stages after treatments with clear water, GA3, and CPPU. (A) berry shapes of ‘Shine Muscat’ in different treatment groups across four growth stages, where CK represents clear water treatment, G2 represents 30 mg/L GA3 treatment, and C2 represents 3 mg/L CPPU treatment; (B) berry shape index at the young fruit stage, enlargement stage I, enlargement stage II, and mature stage after treatments with clear water, 30 mg/L GA3, and 3 mg/L CPPU. YS indicates the young fruit stage, ESI indicates enlargement stage I, ESII indicates enlargement stage II, and MS indicates the mature stage; “ns”, “*”, “**”, “***” and “****” indicate differences at the levels of p > 0.05, p < 0.05, p < 0.01, p < 0.001 and p < 0.0001, respectively. (C) transverse diameter (D) longitudinal diameter.
Horticulturae 11 01160 g001
Figure 2. Observation of paraffin sections of ‘Shine Muscat’ berries at enlargement stage II (A) Cell morphology of CK, G2, and C2 groups at enlargement stage II (B) Number of cells per unit area (C) Cell transverse diameter (D) Cell longitudinal diameter. “ns”, “*”, and “**” indicate differences at the levels of p > 0.05, p < 0.05, and p < 0.01, respectively.
Horticulturae 11 01160 g002
Figure 3. Dynamic variations in endogenous hormone contents of ‘Shine Muscat’ within the CK, G2, and C2 groups across four growth stages: (A) endogenous GA3 content, (B) endogenous 6-BA content, and (C) endogenous IAA content. “ns”, “*”, “**”, “***” and “****” indicate differences at the levels of p > 0.05, p < 0.05, p < 0.01, p < 0.001 and p < 0.0001, respectively.
Horticulturae 11 01160 g003
Figure 4. Bar chart of the number of DEGs in CKvsG2 and CKvsC2 (A) and Venn diagram (B); GO enrichment analysis (C,D) and KEGG enrichment analysis (E,F) for CKvsG2/CKvsC2.
Horticulturae 11 01160 g004
Figure 5. qRT-PCR Transcriptome Validation of ‘Shine Muscat’ at Enlargement Stage II.
Horticulturae 11 01160 g005
Figure 6. Analysis of VvARR expression patterns. (A) Analysis of tissue-specific expression patterns of VvARR; (B) Analysis of spatiotemporal expression patterns of VvARR. “****” indicate differences at the levels of p < 0.0001.
Horticulturae 11 01160 g006
Figure 7. Transient outcomes of transient overexpression and virus-mediated gene silencing of VvARR. (A) qRT-PCR analysis of VvARR at 3 days post-transient expression; (B) Paraffin sections of berries; (C) Number of berry cells per unit area; (D) Longitudinal cell diameter; (E) Transverse cell diameter; (F) Endogenous GA3 content; (G) Endogenous IAA content; (H) Endogenous 6-BA content. “ns”, “*”, “**” and “***” indicate differences at the levels of p > 0.05, p < 0.05, p < 0.01 and p < 0.001, respectively.
Horticulturae 11 01160 g007
Figure 8. Results of subcellular localization of VvARR.
Horticulturae 11 01160 g008
Disclaimer/Publisher’s Note: The statements, opinions and data contained in all publications are solely those of the individual author(s) and contributor(s) and not of MDPI and/or the editor(s). MDPI and/or the editor(s) disclaim responsibility for any injury to people or property resulting from any ideas, methods, instructions or products referred to in the content.