Article

Advancing Industrial Production of White Grifola frondosa: Liquid Inoculum Culture Parameter Optimization and Molecular Insights into Fruiting Body Development

1
College of Horticulture, Hebei Agricultural University, Baoding 071001, China
2
College of Life Science, Fujian Agriculture and Forestry University, Fuzhou 350002, China
3
Hebei Key Laboratory of Vegetable Germplasm Innovation and Utilization, Baoding 071001, China
4
Collaborative Innovation Center of Vegetable Industry of Hebei Province, Baoding 071001, China
*
Authors to whom correspondence should be addressed.
These authors contributed equally to this work.
Horticulturae 2025, 11(10), 1151; https://doi.org/10.3390/horticulturae11101151
Submission received: 18 August 2025 / Revised: 18 September 2025 / Accepted: 23 September 2025 / Published: 25 September 2025
(This article belongs to the Section Medicinals, Herbs, and Specialty Crops)

Abstract

Grifola frondosa is a valuable medicinal and edible mushroom whose industrial cultivation and developmental mechanisms remain poorly understood. In this study, we systematically investigated the optimal cultivation parameters and molecular basis of fruiting body development using the white strain Gr0001+3 through integrated physiological and transcriptomic approaches. The results showed that the optimal liquid medium composition was glucose (28.5 g/L), yeast extract (11.5 g/L), and MgSO4 (2 g/L), with a C/N ratio of 10:1. This composition achieved a mycelial biomass of 2.333 g/L via an orthogonal design. Ideal culture conditions were 100 mL/250 mL liquid volume, 10% inoculum size, and pH 4.0 in single-factor experiments. The fruiting body developmental transcriptomes were analyzed in four stages: early primordia (EP), middle primordia (MP), late primordia (LP), and mature fruiting body (FB). Principal component analysis revealed distinct transcriptional profiles, with greater similarities among later developmental stages. Differential gene expression peaked during the LP vs. FB transition. Functional enrichment (GO/KEGG) showed conserved biological processes in the MP-LP-FB transitions. Heat shock proteins (hsp_78/hsp_82) and the cAMP signaling pathway component (PKAC) were involved in fruiting body development, based on RT-qPCR. This work establishes practical cultivation parameters and offers fundamental insights into the molecular regulation of G. frondosa development, providing a comprehensive foundation for advancing the industrial production of this mushroom.

1. Introduction

Grifola frondosa (commonly known as maitake; hen-of-the-woods; or Huishuhua, its Chinese name), which has gray or dark-gray coloration, is a highly valued edible and medicinal basidiomycete fungus taxonomically classified within the Basidiomycota phylum, Agaricomycetes class, Polyporales order, and Meruliaceae family [1,2]. Widely regarded as the “king of medicinal mushrooms”, this species is particularly prized for its tender sporocarp and rich content of bioactive compounds, including β-glucans, glycoproteins, and essential minerals. Modern pharmacological studies have demonstrated the remarkable therapeutic potential of this mushroom, which exhibits significant immunomodulatory effects [3], potent antitumor activity [4], notable hypoglycemic properties [5,6], effective antiviral capabilities [7], and prebiotic effects on the gut microbiota [8]. The combination of its delicate umami flavor and proven health benefits has led to rapidly growing global demand for this species. Currently recognized as a premium functional food resource, G. frondosa presents substantial commercial value in both nutraceutical and pharmaceutical markets worldwide.
Liquid inoculum technology represents a transformative advancement in the global edible mushroom industry, offering substantial advantages over traditional solid inoculum methods. This innovative approach demonstrates three key benefits: a significant reduction in production cycles, improved fruiting body uniformity, and considerable cost savings in large-scale operations. These characteristics make liquid inoculum technology the cornerstone for standardized, industrial-scale edible mushroom production. The foundation for liquid cultivation of G. frondosa was laid by Ohno et al. [9], who first achieved successful mycelium cultivation in a liquid medium. Suzuki et al. [10] later replicated and validated these findings using similar methodologies. Subsequent research has primarily focused on optimizing mycelial biomass and polysaccharide yields through parameter adjustments, including medium composition (carbon/nitrogen sources), physical conditions (temperature, pH), and operational parameters (inoculum size, agitation, aeration). Bu et al. [11] identified glucose and wheat bran as optimal nutrients, establishing baseline fermentation conditions (pH 6.0, 150 mL/500 mL liquid volume, 10% inoculum size, 25 °C, and 150–180 rpm) through single-factor experiments. Deng et al. [12] employed an orthogonal design to determine optimal conditions, including 4.0% corn flour (carbon source), 0.2% soybean meal (nitrogen source), an initial pH of 7, and a 6-day cultivation period, achieving a maximum biomass yield of 12.12 g/L. Further refining these parameters, Feng et al. [13] demonstrated that soybean powder and maltose represent optimal nitrogen and carbon sources, respectively, while MgSO4 was identified as the most effective inorganic salt for the liquid seed medium of G. frondosa. Shen et al. [14] incorporated traditional Chinese medicine extracts into liquid media, evaluating mycelial biomass and exopolysaccharide (EPS) yields. Coix seed and gastrodia tubers significantly enhanced fermentation: 8 g/L coix seed alcohol yielded peak biomass (14.43 g/L), while a 6 g/L combination of both extracts maximized EPS production (3.61 g/L). Despite these advancements, a critical gap remains. No comprehensive study to date has systematically evaluated both mycelial yield and pellet quality—including the size, density, and germination rate in liquid cultures. Addressing this gap is essential to further optimize industrial-scale production.
The pursuit of economically superior edible mushroom cultivars offering enhanced yield, quality, and stress resistance remains a paramount objective in fungal genetic breeding. Recent technological breakthroughs in transcriptome sequencing have revolutionized our capacity to elucidate the functional genes and molecular networks governing critical biological traits. In Flammulina filiformis, RNA-seq analysis, including elongation region (ER), transition region (TR), and stable region (SR) samples, confirmed that long-chain fatty acid synthesis genes mediate stipe elongation gradients via NADPH oxidase-dependent ROS signaling pathways [15]. In a previous study, 19,655 differentially expressed genes (DEG) between mature mycelia and the primordium were identified in Pleurotus eryngii, implicating critical processes including cell wall degradation, carbohydrate hydrolysis, light perception, and cAMP signal transduction [16]. In Ophiocordyceps sinensis, Li et al. [17] established developmental stage-specific transcriptomes uncovering core pathways, network hub genes, and sexual reproduction regulators in Chinese cordyceps formation. In G. frondosa, Nie et al. [18] decoded the polysaccharide synthesis machinery through mycelial transcriptomics, providing pathway identification, candidate gene validation, and metabolic network modeling. Wang et al. [19] conducted whole transcriptome sequencing of mycelia and primordia, identifying differentially expressed genes primarily associated with carbohydrate metabolism, lipid metabolism, nucleic acid metabolism, and cellular membrane systems in the primordia of G. frondosa. Zhang et al. [20] obtained a high-resolution genomic assembly through RNA-seq-assisted genome scaffolding, generating a refined gene annotation atlas. In addition, the molecular regulatory mechanism of fruiting body development in G. frondosa has not been reported.
This study utilized a naturally occurring albino strain of G. frondosa (designated as Gr0001+3), isolated through tissue separation during standard cultivation practices. Previous research has genetically characterized the albino phenotype as resulting from a frameshift mutation (single-nucleotide deletion) in the tyr2 gene encoding tyrosine synthase [21,22]. The industrial cultivation parameters (substrate packaging, fruiting induction, and environmental controls) of white strain Gr0001+3 were previously studied [23]. However, the liquid culture requirements and developmental biology of white-pigmented strains remain unexplored.
In a previous study employing a multi-factorial experimental design, we systematically optimized liquid culture conditions, including the formula and culture conditions of the liquid spawn medium, taking the mycelial biomass as the main index and combining the results for pellet diameter, pellet density, and germination time. Subsequently, utilizing the optimized liquid culture formula for the industrial-scale cultivation of white G. frondosa, we conducted RNA-seq analysis across four distinct developmental stages of fruiting body differentiation with a focus on identifying significantly enriched functional categories and key functional genes involved in fruiting body development. This investigation provides a validated protocol for optimizing white G. frondosa liquid culture conditions and fundamentally understanding fruiting body formation mechanisms in the white G. frondosa strain to advance the industrialized production of premium-quality maitake mushrooms.

2. Experimental Materials and Methods

2.1. Fungal Strain

The white G. frondosa strain Gr0001+3 was used as the experimental strain, preserved at the Mycological Research Center of Fujian Agriculture and Forestry University. Strains were preserved on a potato dextrose agar medium (PDA: 200 g/L of potato infusion; 20 g/L of glucose; 20 g/L of agar) at 4 °C.

2.2. Single-Factor Experiments

The seed culture of strain Gr0001+3 was prepared via incubation in a seed liquid medium (Glucose 30 g/L, Yeast extract 6 g/L, Peptone 2 g/L, MgSO4 0.5 g/L, KH2PO4 0.5 g/L) [23] at 25 °C with 170 rpm shaking in darkness for 8 days. Based on the basal medium (Glucose 30 g/L, Peptone 10 g/L, KH2PO4 1 g/L, MgSO4 1 g/L, and natural pH) [23], the medium components, including carbon sources (glucose, maltose, fructose, sucrose, and soluble starch), nitrogen sources (peptone, soybean meal powder, yeast powder, beef extract, and corn meal), inorganic salts (CaCl2, MnCl2, MgS04, KH2PO4, CuSO4), and carbon-to-nitrogen (C/N) ratios (5:1, 10:1, 15:1, 20:1, and 25:1) were optimized sequentially using the mycelial pellet biomass, pellet diameter, pellet density, and germination time as evaluation criteria.
After determining the optimal medium formulation, the inoculum size (2.5%, 5%, 7.5%, 10%, 12.5%), flask filling volume (50 mL, 75 mL, 100 mL, 125 mL, 150 mL), and initial pH (3, 4, 5, 6, 7) were further optimized. The same evaluation metrics were used to determine the optimal inoculation age, filling volume, and pH. All single-factor experiments were conducted with three biological replicates.

2.3. Orthogonal Experiments

Based on the results of the single-factor experiments, superior carbon sources, nitrogen sources, carbon-to-nitrogen ratios, and inorganic salts were selected to design an L9 (34) orthogonal test for optimizing the liquid medium composition. The best formulation was determined by measuring the mycelial pellet biomass. The factor levels are shown in Table 1.

2.4. Cultivation and Collection of G. frondosa for RNA-Seq Analysis

To obtain fruiting bodies for RNA Seq analysis, white dikaryotic strains of G. frondosa were cultivated using the following protocol. The growth substrate consisted of 45% sawdust, 15% cottonseed hulls, 15% cornmeal, 8% bran, 1% glucose, and 1% calcium superphosphate, with 65% moisture content. After thorough mixing, the substrate was packed into polypropylene cultivation bags (1200 g/bag) and sterilized at 121 °C for 2.5 h. After cooling to 25 °C, each bag was inoculated with 12 mL of liquid spawn.
Mycelial colonization was conducted at 25 °C with 60–65% relative humidity in complete darkness for 55 days. Fruiting was induced by creating side holes (1.5 cm diameter) in the colonized bags and adjusting the environmental conditions as follows: 200–400 lux illumination (8 h/day), a CO2 concentration < 2000 ppm, and temperature reduction to 18 °C. After primordium formation, conditions were modified to 20 °C, CO2 ≤ 1000 ppm, and >90% humidity. Fruiting body maturity was determined by the disappearance of the white growth line at the cap edge. Samples were collected at four developmental stages: Early Primordia (EP) for the initial formation stage of the primordia at 60 days, Middle Primordia (MP) for the early differentiation stage of the primordia at 63 days, Late Primordia (LP) for the initial pileus differentiation stage at 66 days, and Mature Fruiting Body (FB) for the maturation stage of the fruiting body at 69 days (Figure 1). For each stage, morphologically uniform apical sections were collected, immediately frozen in liquid nitrogen, and stored at −80 °C. Three biological replicates were obtained for each developmental stage from the same cultivation batch.

2.5. RNA Extraction, cDNA Library Construction, and Transcriptome Sequencing

Total RNA was extracted using Trizol reagent (Invitrogen, Carlsbad, CA, USA). The RNA concentration was determined using Qubit 2.0. A Qubit RNA Assay Kit (Life Technologies China Ltd., Shanghai, China) was used to accurately quantify the qualified total RNA solutions to determine the amount added for library construction.
Sequencing libraries were generated using an NEBNext® Ultra TM RNA Library Prep Kit for Illumina® (NEB, Ipswich, MA, USA) following the manufacturer’s recommendations. To ensure the quality of the information analysis, raw data were processed using Trimmomatic (version 0.36) [24]. The G. frondosa ASM168373v1 genome was used as the reference. HISAT2 aligned the quality-controlled sequencing sequences to the reference genome [25], and RSeQC was used for alignment statistics [26]. Gene expression levels were calculated using FPKM (Fragments Per Kilobase of transcript per Million mapped reads).

2.6. Differential Gene Expression Analysis, Functional Enrichment Analysis, and Differential Gene Expression Clustering Analysis

Differentially expressed genes (DEGs) were identified using the DESeq software (1.26.0) [27] with the screening criteria qValue < 0.05 and |FoldChange| > 2. To clarify the functions of DEGs, the “top GO” and “clusterProfiler” packages in the R software (version 3.5.2) [28,29] were used for GO and KEGG pathway enrichment analyses of DEGs at different growth stages, respectively. DEGs were considered significantly enriched in GO terms or metabolic pathways with a Bonferroni-corrected p-value < 0.05. To infer the functional similarity of the genes, the gplots package in the R software (version 3.5.2) [30] was used for expression pattern clustering analysis of significantly different genes, analyzing commonalities in gene expression to infer functional similarity.

2.7. Real-Time Quantitative PCR (RT-qPCR) Validation

Total RNA was extracted from each group of fruiting body samples using a TransZol Up Plus Kit (TransGen). cDNA was synthesized using a TransScript RT Kit (TransGen). qRT-PCR was performed as previously reported [31], and GAPDH was used as an internal standard [32]. Relative gene expression levels were calculated using the 2−ΔΔCT method [33]. The obtained data represented three biological replicates, with two technical replicates each.

2.8. Statistical Analysis

GraphPad Prism 9.0 was used for graphing. The SPSS 25.0 software was used for data analysis, expressed as the mean ± standard deviation. Differences between groups were compared using the t-test, with p < 0.05 considered statistically significant. Each transcriptome experiment included three replicate samples to ensure reproducible trends and relationships. All data were statistically analyzed using the R software (version 3.5.2), with p < 0.05 considered significantly different.

3. Results

3.1. Effect of Different Carbon Sources on Pellet Growth

As presented in Figure 1, among the five carbon sources located on the vertical axis, glucose offered the best performance, producing a higher pellet biomass (1.71 g/L) while maintaining favorable morphological characteristics, including a small diameter (0.85 mm) and high density (400 pellets/mL). Fructose achieved the shortest germination time (5.7 h) but produced less biomass compared with glucose. Maltose yielded the smallest pellet diameter (only 0.32 mm) and a relatively short germination time (6.4 h). Sucrose and soluble starch had similar effects, though sucrose cultivation led to higher pellet density.

3.2. Effect of Different Nitrogen Sources on Pellet Growth

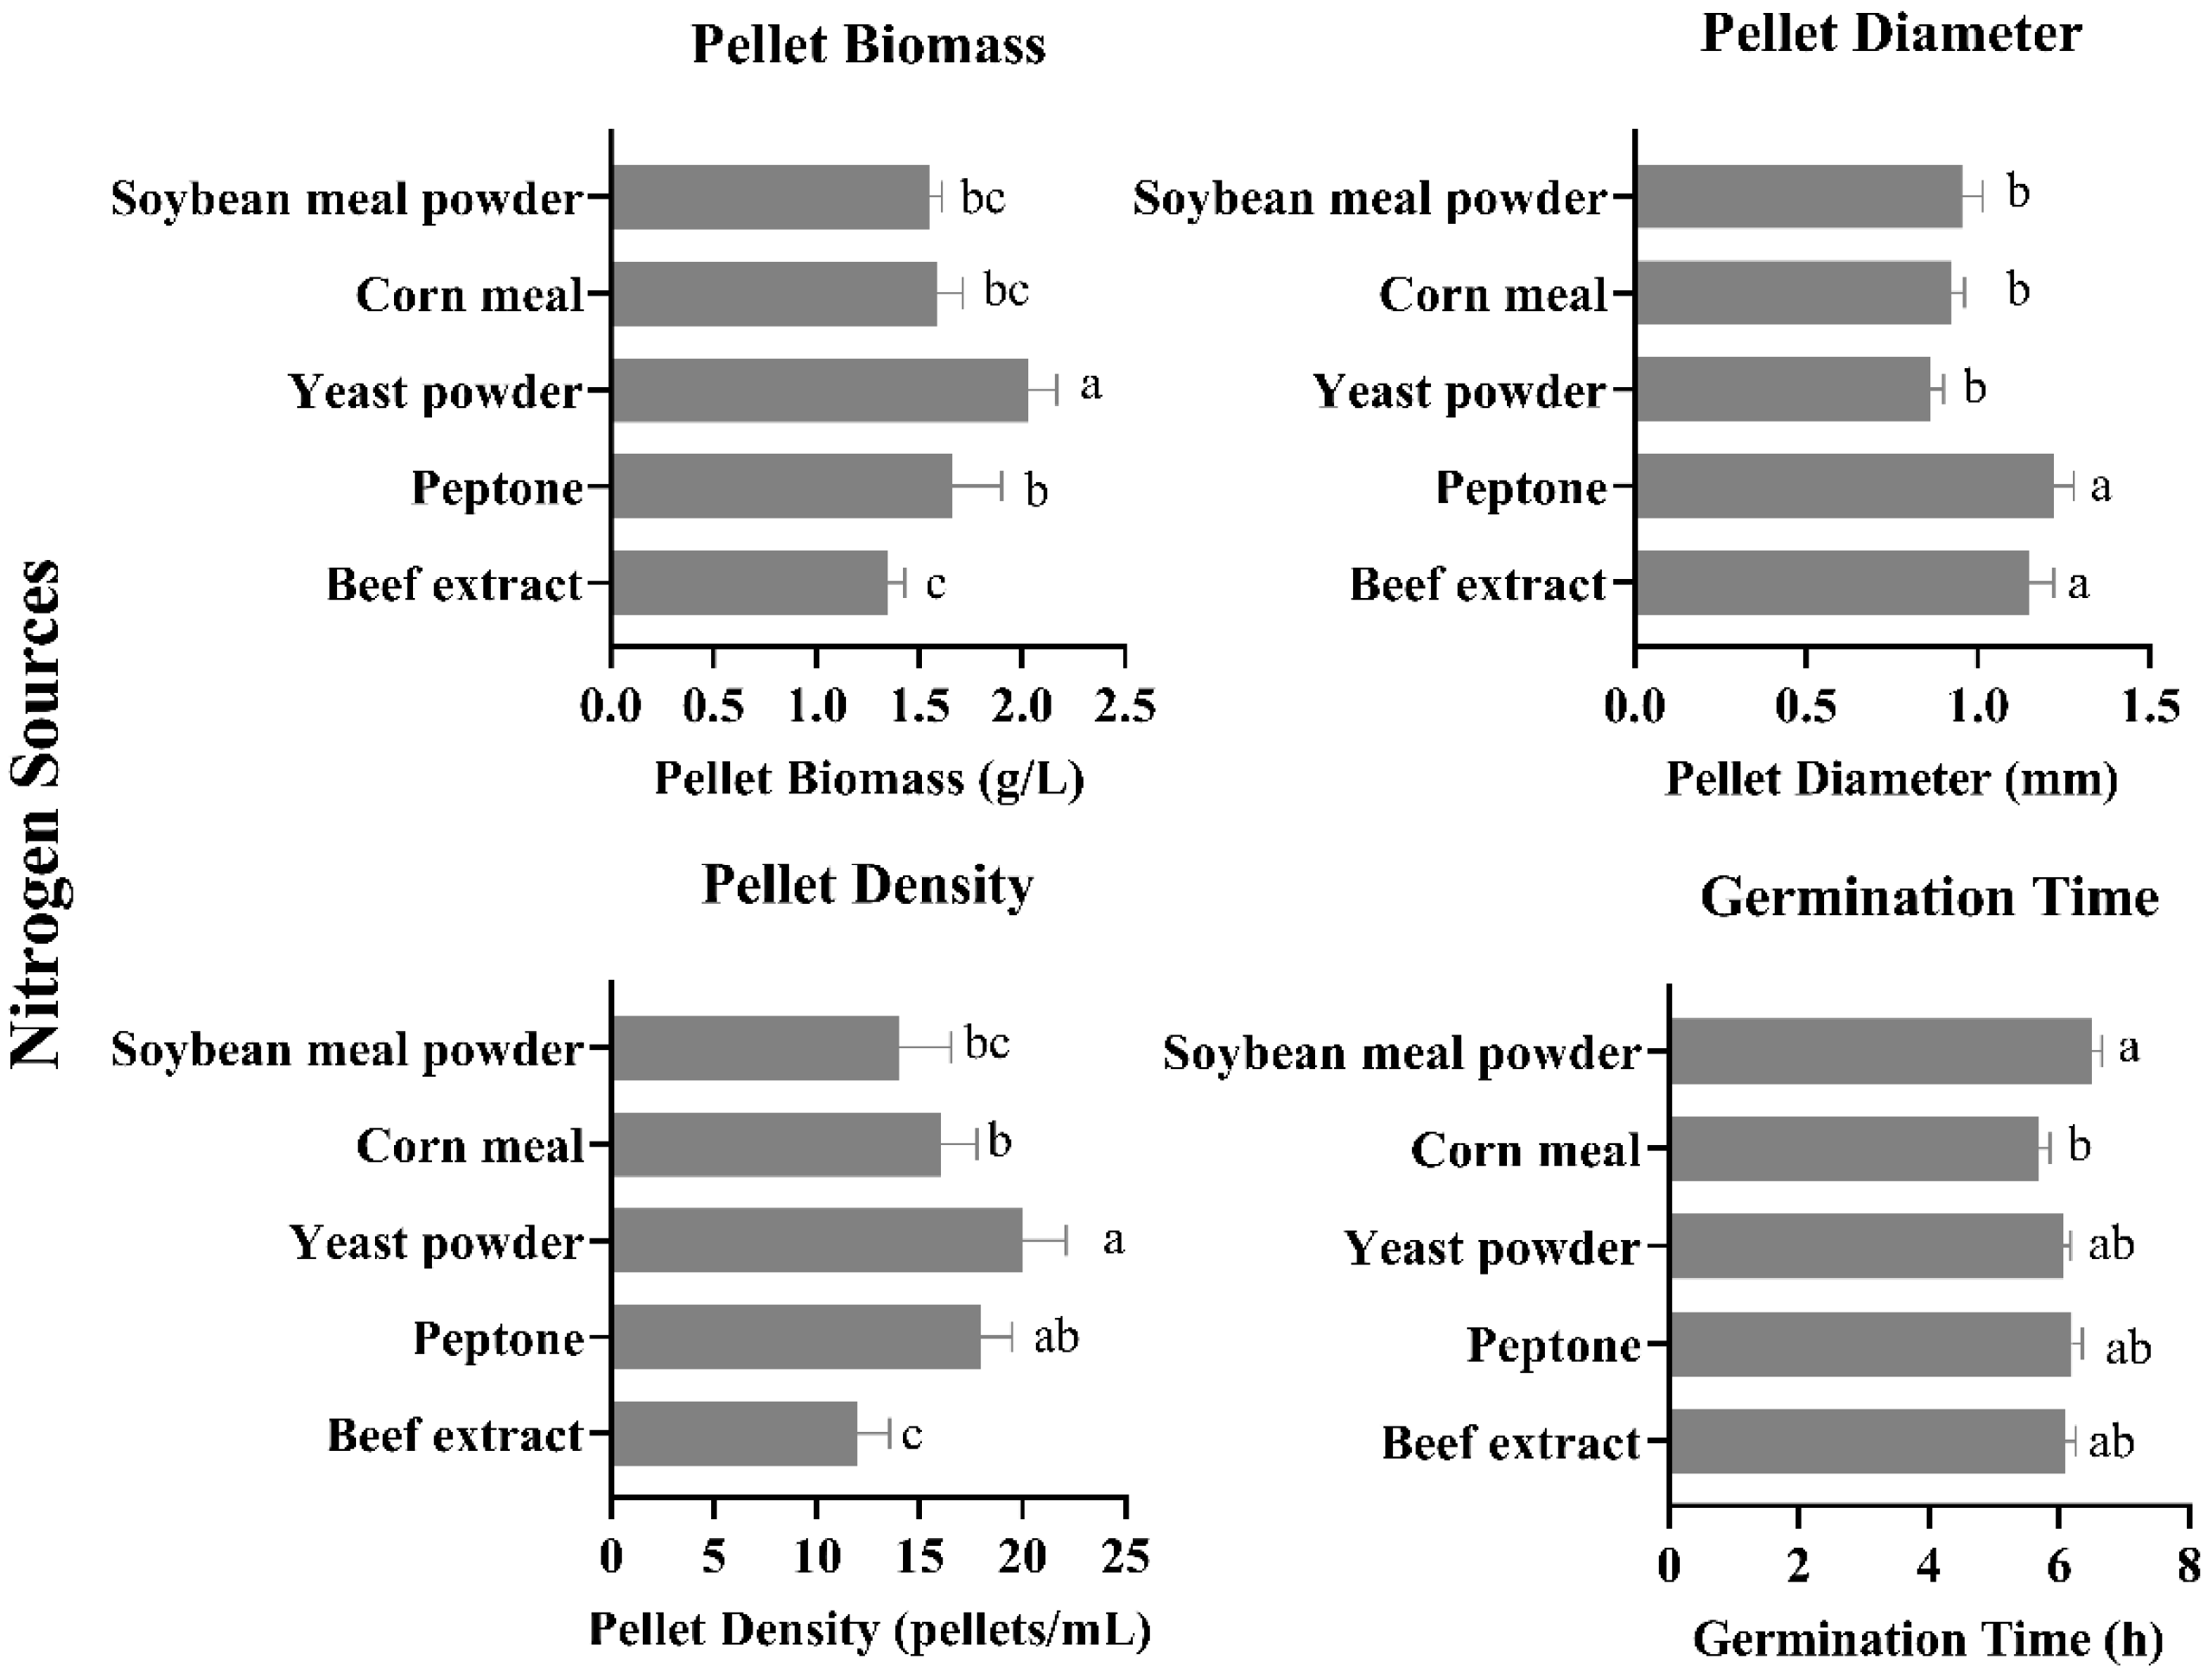
The growth characteristics of mycelial pellets were influenced by different nitrogen sources (p < 0.05) (Figure 2). Yeast powder emerged as the most effective nitrogen source, yielding the highest pellet biomass (2.03 g/L) while maintaining optimal morphological characteristics including a small diameter and high density. Corn meal resulted in the shortest germination time (5.7 h) and a relatively smaller pellet diameter (0.92 mm). Peptone, beef extract, and soybean meal powder had similarly minimal effects on pellet growth.

3.3. Effect of Different C/N Ratios on Pellet Growth

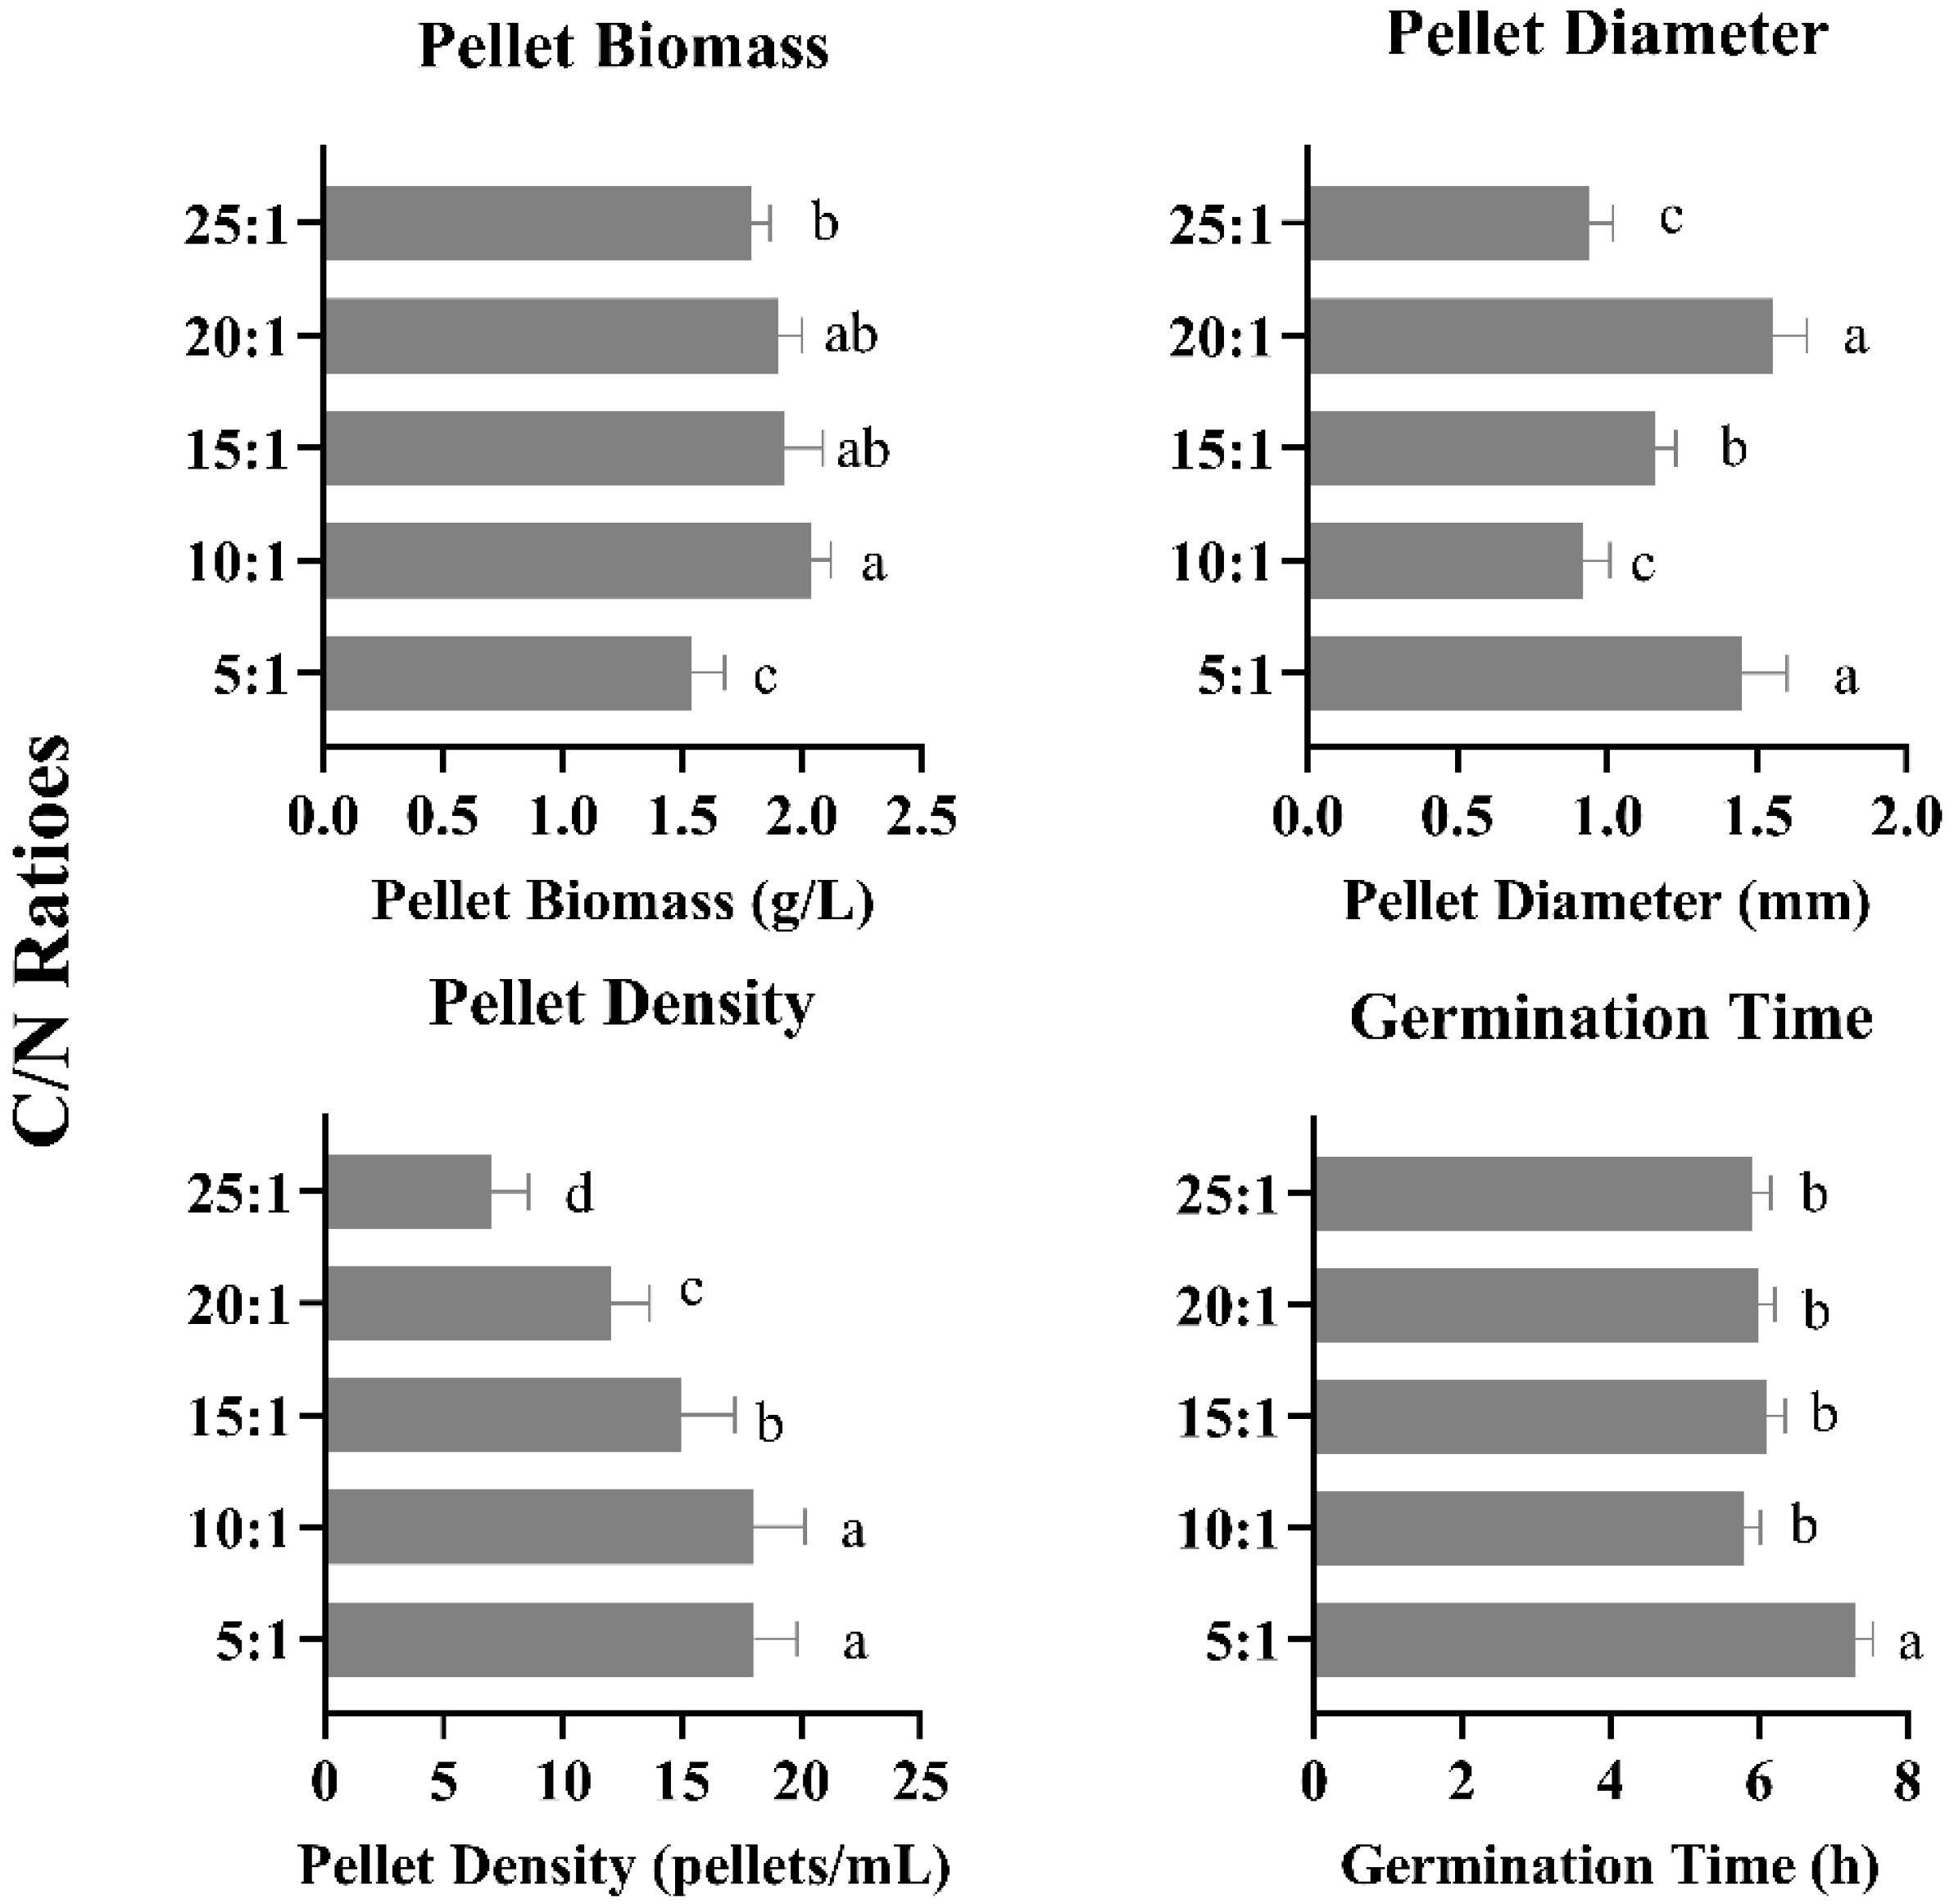
The pellet biomass obtained at a C/N ratio of 5:1 was significantly lower than that of the four other experimental groups (Figure 3). While C/N ratios of 10:1, 15:1, and 20:1 yielded a comparable maximum pellet biomass, no statistically significant differences were observed among these three groups (Figure 3). A 10:1 C/N ratio proved particularly advantageous, demonstrating optimal growth parameters including the smallest pellet diameter (0.92 mm), highest pellet density (18 pellets/mL), and shortest germination time (5.8 h) (Figure 3).

3.4. Effect of Different Inorganic Salts on Pellet Growth

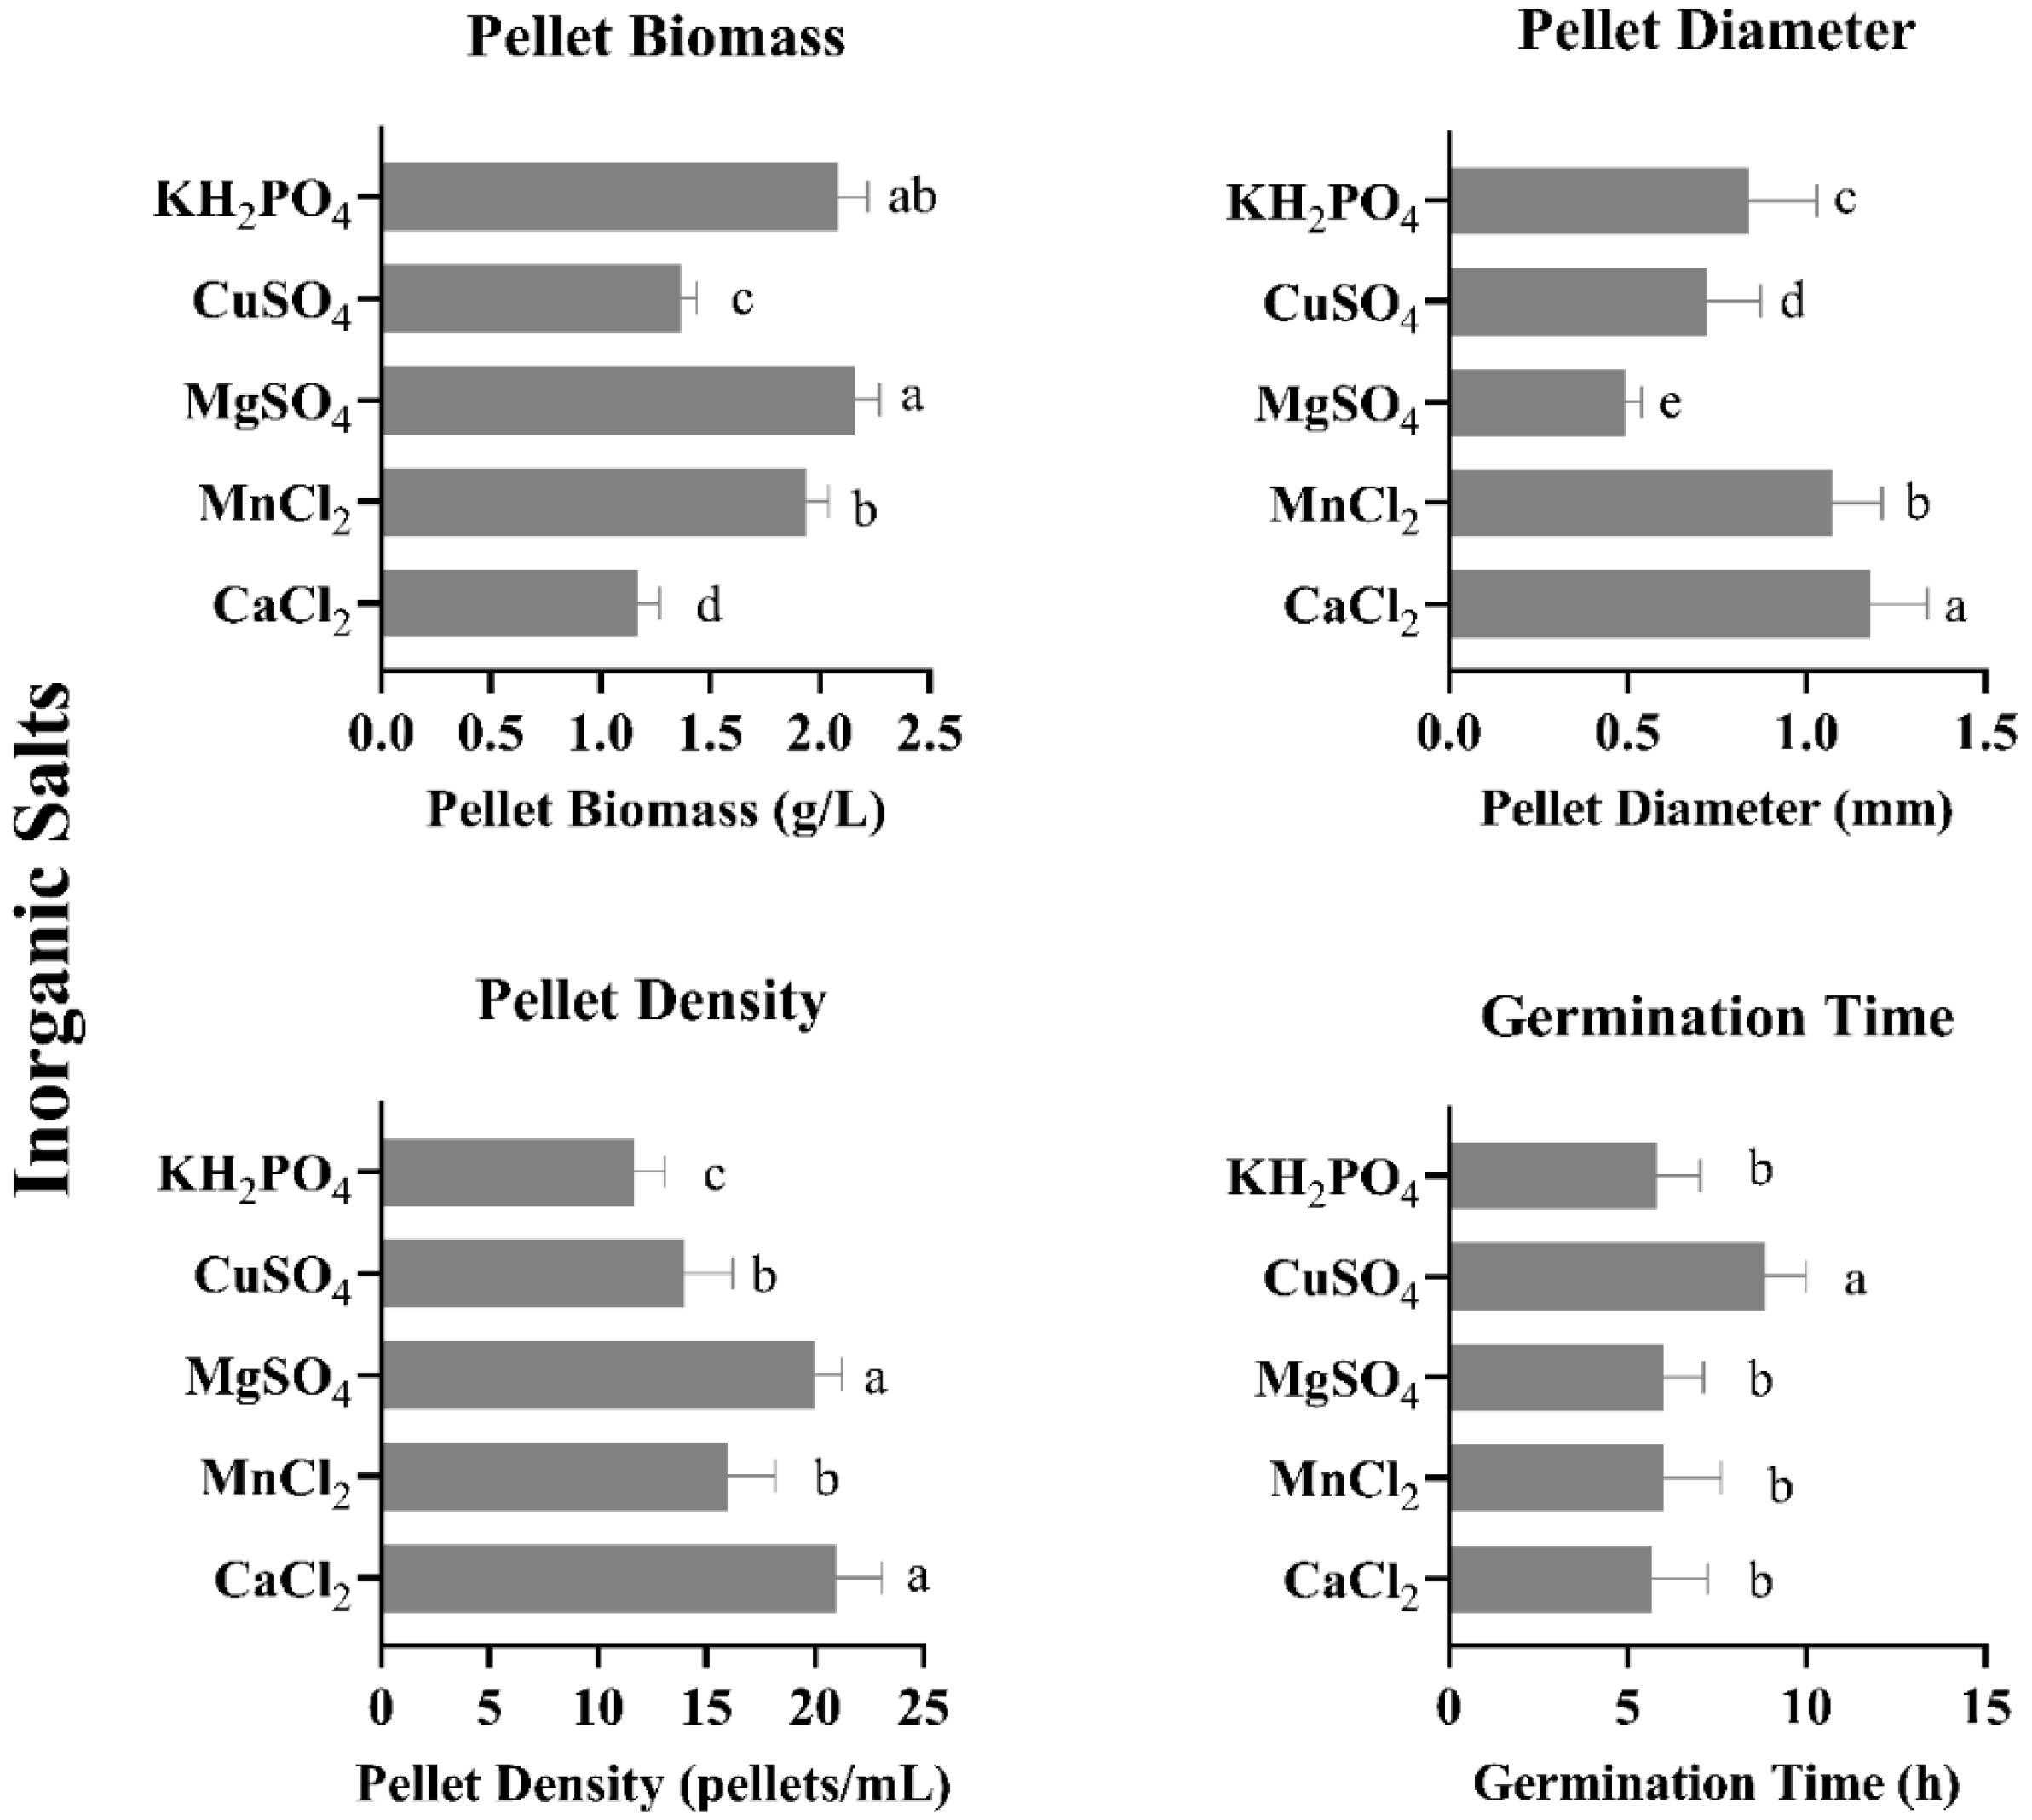
The tested inorganic salts exhibited distinct influences on pellet biomass, diameter, density, and germination time (Figure 4). The MgSO4, KH2PO4, and MnCl2 groups offered the highest biomass production, with MgSO4 producing the greatest amount of biomass (2.16 g/L). In contrast, the CaCl2 group yielded the lowest biomass accumulation (1.17 g/L). Notably, the MgSO4 group also yielded pellets with the smallest diameter (0.4 mm) and highest density (20 each/mL). While CuSO4 exhibited the longest germination time (Figure 4), it presented optimal overall performance by promoting balanced biomass production, compact morphology (small diameter), and favorable density. Based on these findings, MgSO4 was identified as the superior inorganic salt for pellet cultivation.

3.5. Effect of Different pH Values on Pellet Growth

The growth characteristics of mycelium pellets revealed a clear pH dependence, with optimal development occurring in slightly acidic conditions (pH 3–5) (Figure 5). The maximum biomass production and pellet density were achieved at pH 4, indicating that this pH value is the preferred growth condition for G. frondosa mycelia. In marked contrast, a neutral pH (7) resulted in significantly poorer performance, yielding minimal biomass (0.11 g/L) and the longest germination time (8.4 h). Comprehensive evaluation of the growth parameters established pH 4 as the optimal condition for G. frondosa mycelial pellet cultivation.

3.6. Effect of Different Flask Filling Volumes on Pellet Growth

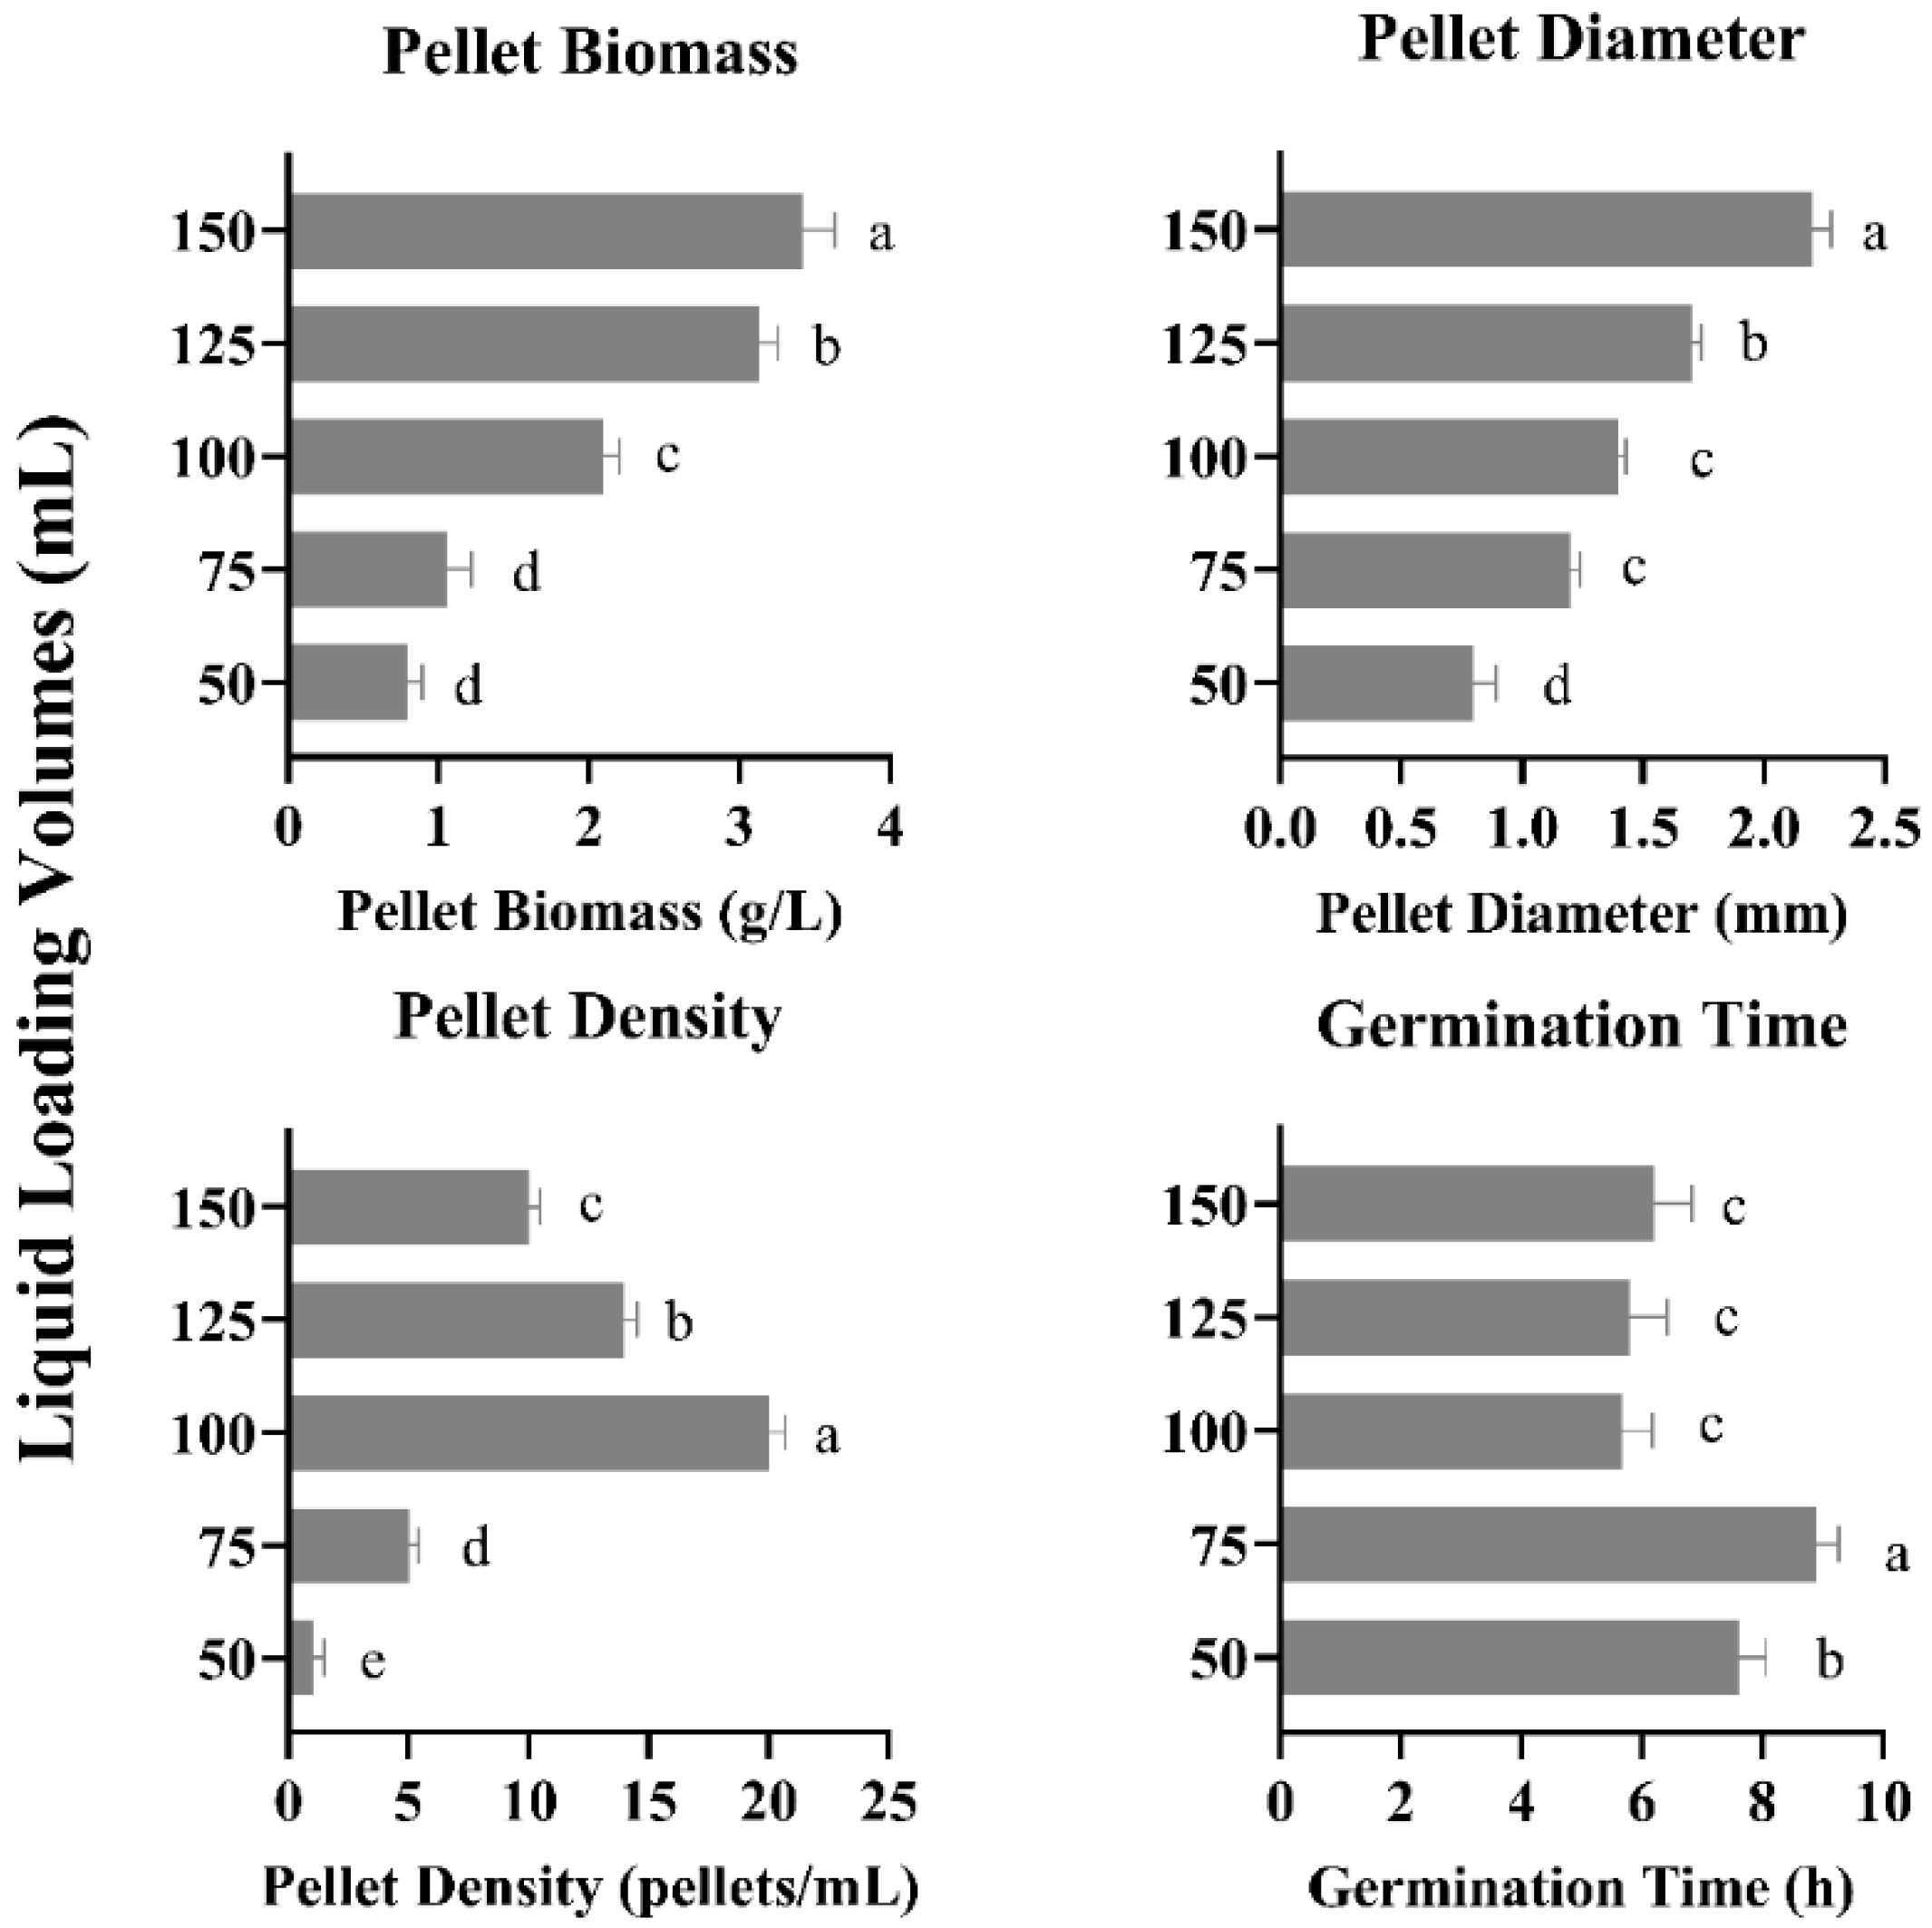
The biomass and pellet diameter showed significant positive correlation with an increase in filling volume, reaching maximum values of 3.42 g/L and 2.2 mm, respectively, at 150 mL (Figure 6). However, the optimal pellet density (20 pellets/mL) and shortest germination time (5.7 h) were achieved at a 100 mL filling volume. Based on a comprehensive evaluation of these growth parameters, the 100 mL condition demonstrated superior overall performance for mycelial pellet cultivation.

3.7. Effect of Different Inoculation Volumes on Pellet Growth

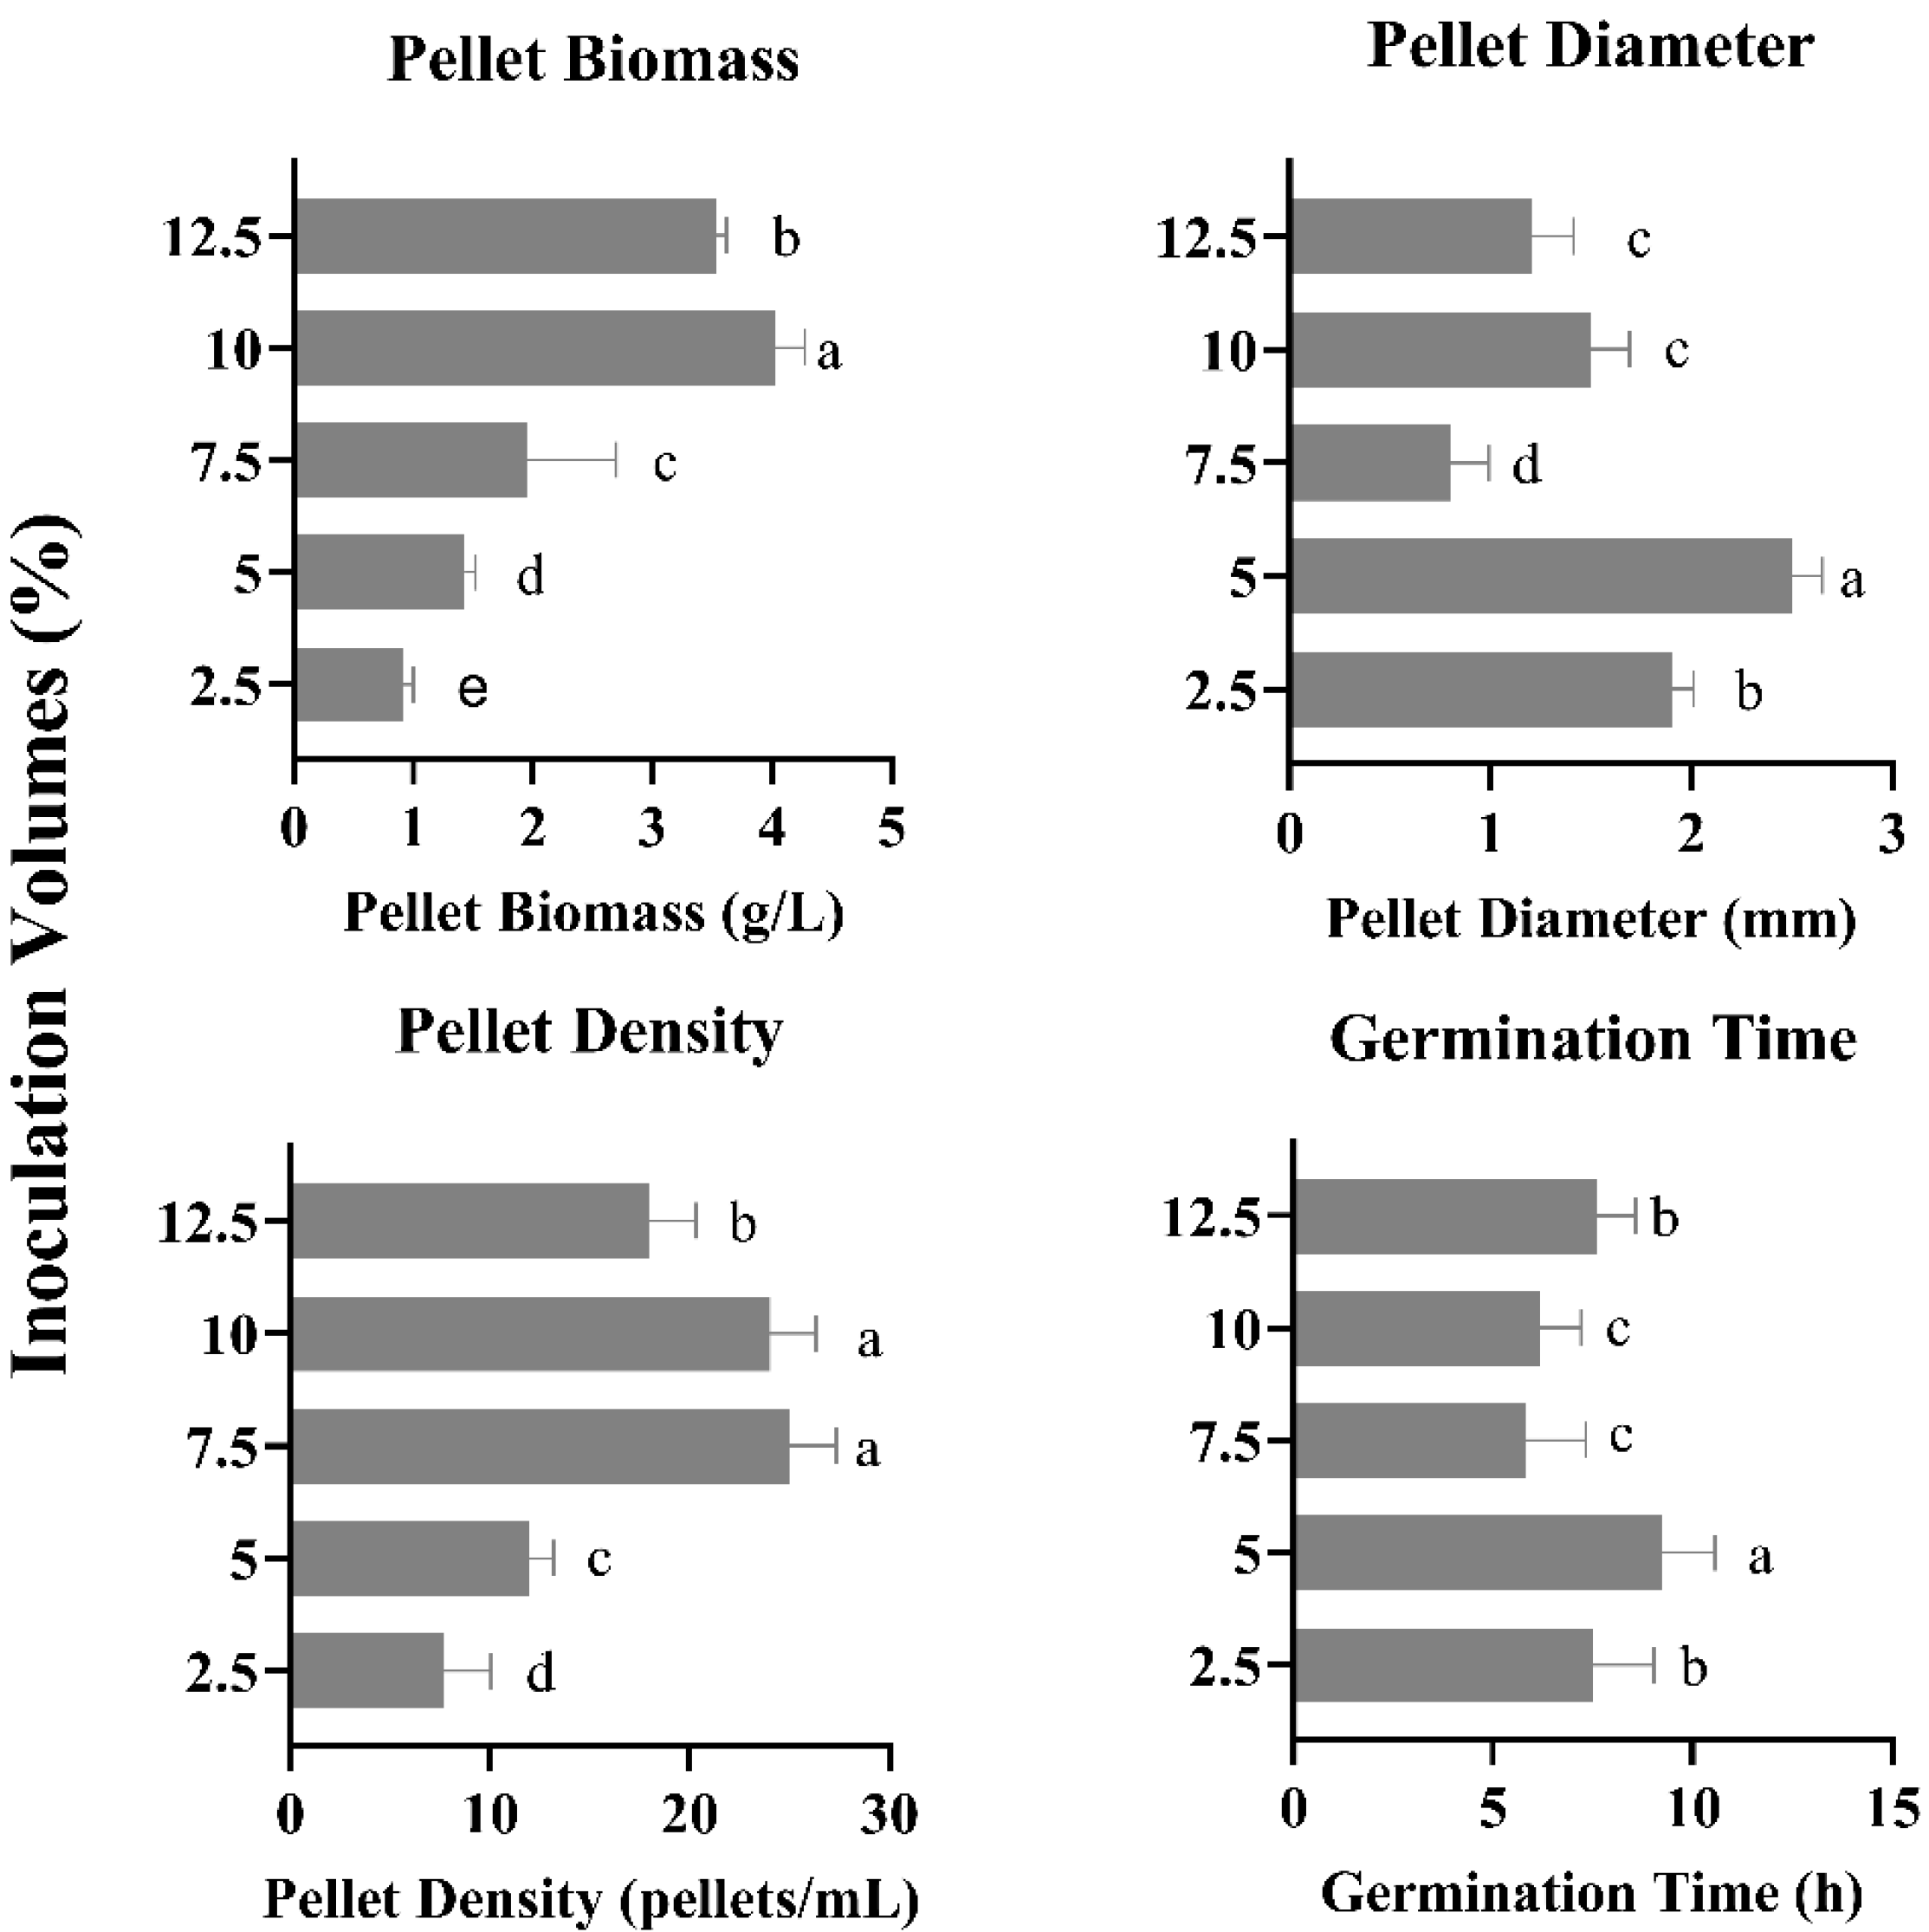
Moderate increases in inoculation volume were found to enhance pellet growth (Figure 7). Biomass production demonstrated a significant positive correlation with inoculation volume, peaking at 10% (4.0306 g/L), which represented a 4.4-fold increase compared to the lowest biomass observed at 2.5% (0.9210 g/L). Interestingly, while a 7.5% inoculation volume produced pellets with the smallest diameter (0.8 mm), highest density, and shortest germination time, a 10% volume offered superior overall performance when considering all growth parameters collectively. These findings suggest that although moderate inoculation volumes (7.5%) optimize certain morphological characteristics, higher volumes (10%) are required for maximal biomass production.

3.8. Orthogonal Experiment Analysis

The orthogonal test results (Table 2, Supplementary File S1: Table S1) revealed the relative influence of various factors on liquid spawn growth, ranked by range R values as follows: Carbon source > Nitrogen source > C/N ratio > Inorganic salt, with carbon sources demonstrating the most pronounced effect. Analysis of the k values identified the optimal combination as follows: Glucose (carbon source), Yeast powder (nitrogen source), a C/N ration of 10:1, and MgSO4 (inorganic salt). Subsequent validation experiments using this optimized formulation achieved an average pellet biomass of 2.3853 g/L, exceeding the highest value obtained in the orthogonal test matrix. These results confirm that the orthogonal design represents an effective and feasible approach for optimizing the liquid spawn medium composition.

3.9. Morphological Characteristics of White G. frondosa

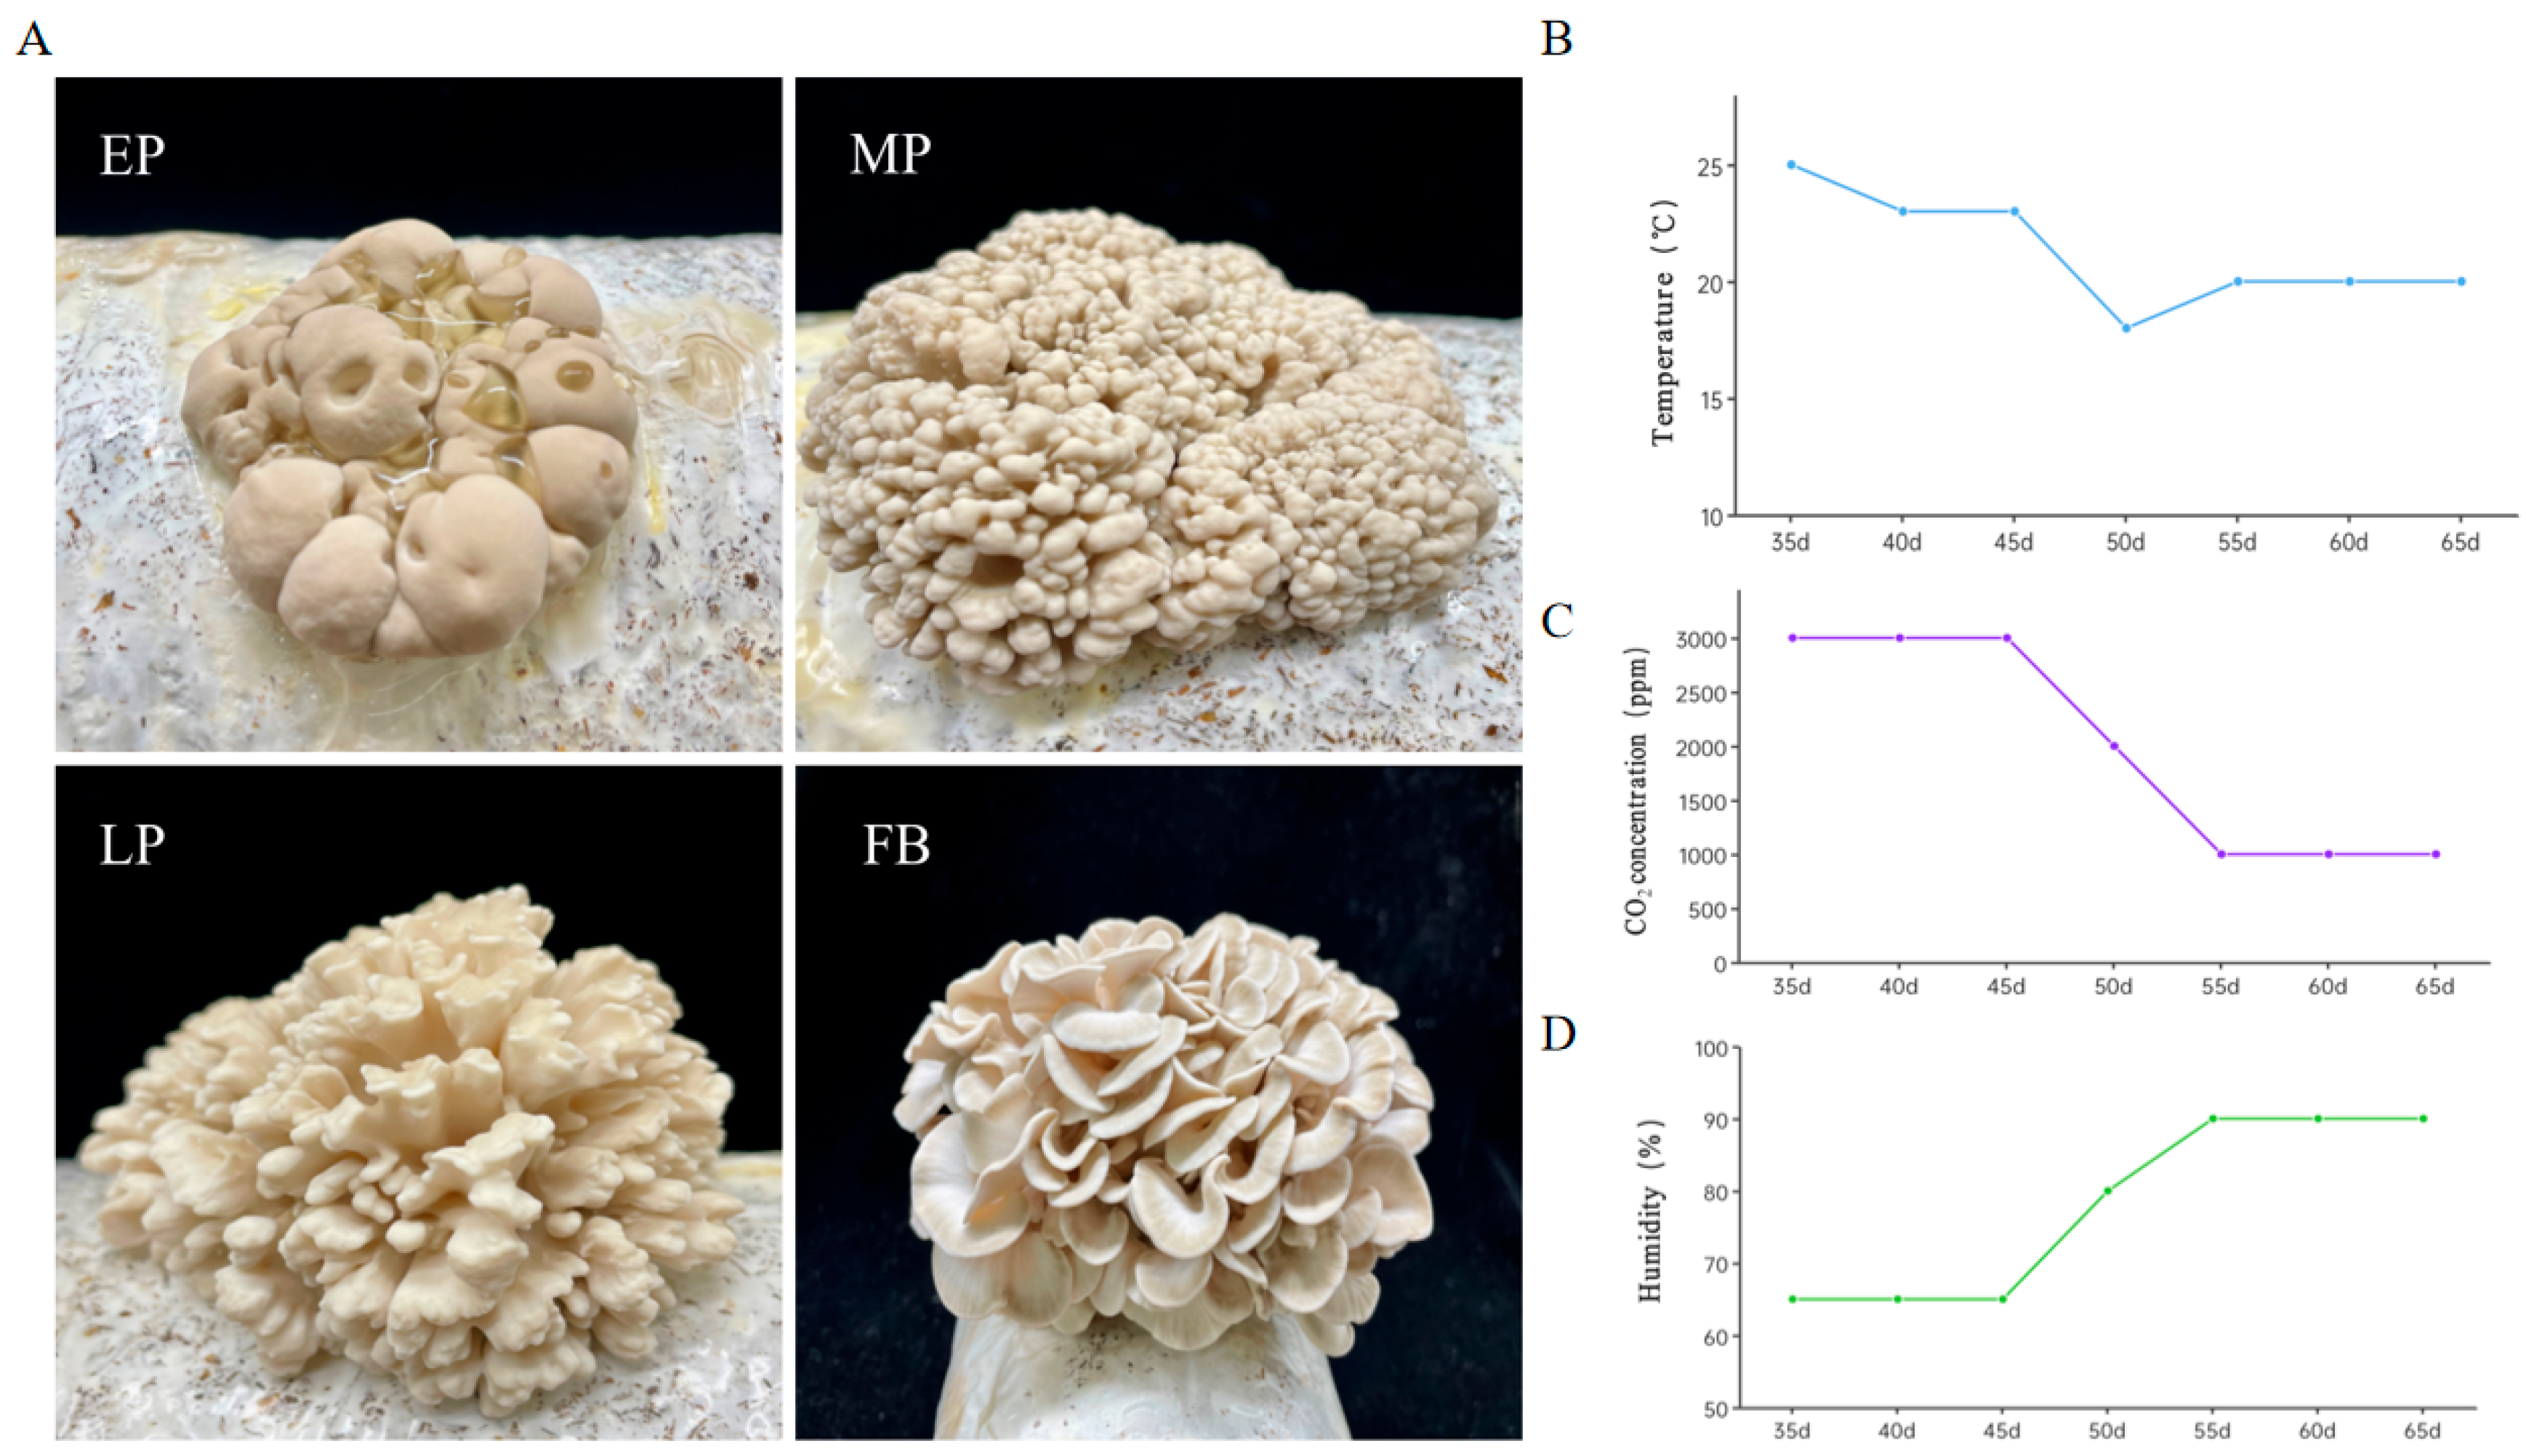
Under standardized industrial cultivation conditions, the liquid spawn prepared using the optimized culture parameters (as determined above) was inoculated into the cultivation substrate. The inoculated substrates were subsequently maintained at 24 °C in darkness for a 35-day incubation period until full mycelial colonization was achieved. Subsequent temperature adjustment to 23 °C promoted continued mycelial development for an additional 15 days. To induce primordia, the cultivation parameters were carefully modulated. The temperature was reduced to 18 °C, CO2 concentration was gradually decreased to 2000 ppm, and relative humidity was increased to 80%. Following primordium formation (Figure 8A), the cultivation conditions were further optimized to 20 °C with the CO2 concentration maintained at 1000 ppm and relative humidity exceeding 90% to support fruiting body development (Figure 8B–D). After 10 days of induction, primordia formation was observed; with continued induction for 3 days, the primordia progressively enlarged and underwent further differentiation; after another 3 days of culturing, the primordia differentiated further, forming pilei with clearly visible white growing margins; upon completion of a final 3-day, the pilei fully expanded, resulting in mature fruiting bodies (Figure 8A).

3.10. Global Transcriptomic Analysis

We constructed twelve RNA-seq libraries representing four distinct growth stages, with three biological replicates per stage (Figure 8A). Illumina paired-end sequencing generated 775.0 million raw reads, which were subsequently processed to yield 754.2 million high-quality clean reads. The average sequencing depth reached 62.9 million reads per replicate, ensuring robust data coverage. Quality metrics demonstrated excellent sequencing performance (Q20 scores > 97.21%, Q30 scores > 92.79%) (Supplementary File S1: Table S2). Pairwise Pearson’s correlation coefficients > 0.98 between biological replicates (Supplementary File S2: Figure S1) and clear clustering of replicates in 3D PCA space (Supplementary File S2: Figure S2) confirmed the technical reproducibility of these results. The PCA analysis revealed distinct separation between the four growth stage groups (Supplementary File S2: Figure S2), confirming significant transcriptional differences across developmental phases.
Analysis of the RNA-Seq data revealed distinct patterns of gene expression throughout fungal development (Supplementary File S2: Figure S3). On a global scale, all genes could be divided into four categories according to their FPKM values, with the majority of genes moderately expressed (10 ≤ FPKM < 100) in all samples during development. The MP stage exhibited the highest proportion of highly expressed genes (FPKM ≥ 100), while the LP stage showed the lowest representation of highly expressed genes. The EP stage contained the largest fraction of low-expressed genes (0 < FPKM ≤ 10) (Supplementary File S2: Figure S3). In total, approximately 75.37, 78.30, 78.28, and 77.52% of genes were expressed in the EP, MP, LP, and FB stages, respectively.

3.11. Differential Gene Expression Analysis Across Developmental Transitions

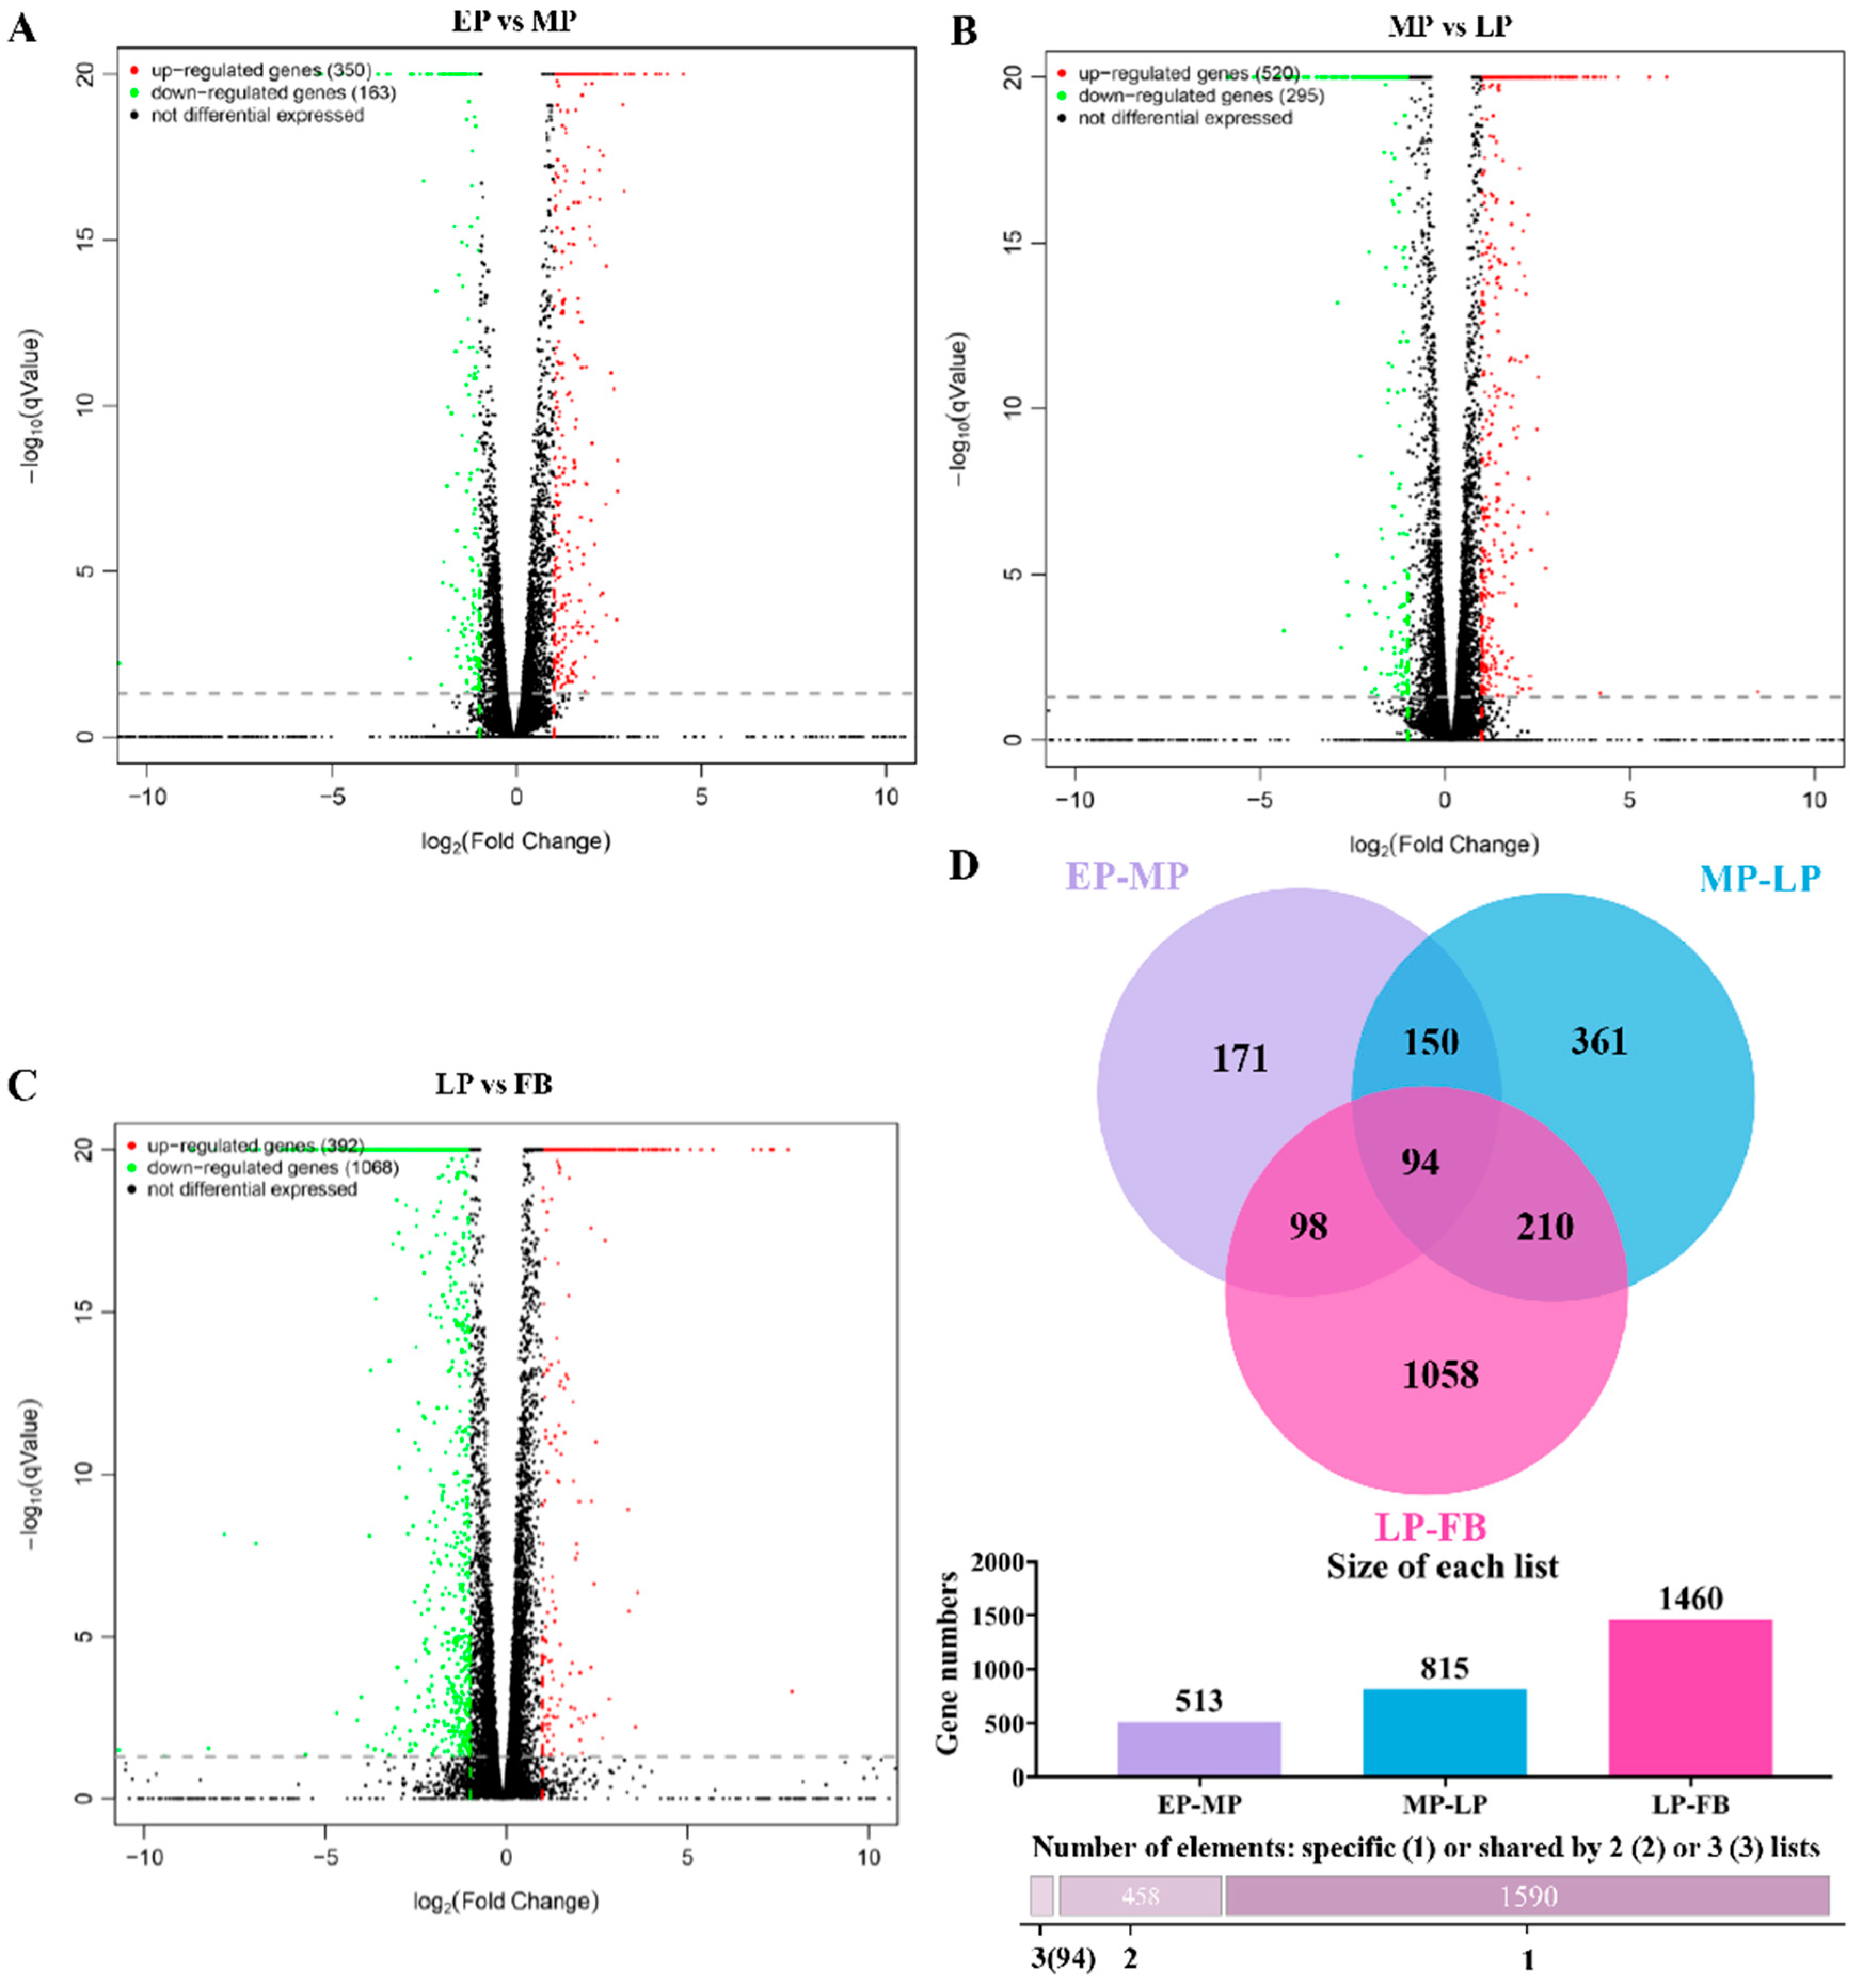
Ultimately, 2788 differentially expressed genes (DEGs) were identified across consecutive developmental stages. The four stages were systematically compared through three pairwise comparisons: EP vs. MP, MP vs. LP, and LP vs. FB. For EP vs. MP, 513 DEGs were identified, including 350 upregulated and 163 downregulated genes (Figure 9A). For the MP vs. LP transition, 815 DEGs were detected with 520 upregulated and 295 downregulated genes (Figure 9B). The LP vs. FB transition revealed the most dramatic transcriptional reprogramming (1460 genes), exhibiting significantly more downregulated (1068 genes) than upregulated genes (392) (Figure 9C). Across all three developmental stage comparisons, a core set of 94 DEGs was conserved across all transitions (Figure 9D).

3.12. Cluster-Based Analysis of Differential Gene Expression Across Developmental Stages

Transcriptional profiling revealed distinct stage-specific expression patterns, with the EP, MP, and LP stages grouped together showing relative similarity. However, the FB stage formed a distinct branch separate from the other three groups, exhibiting dramatic transcriptomic reprogramming (Figure 10A). Hierarchical clustering of significantly differentially expressed genes identified nine co-expression clusters with unique temporal patterns. Clusters 1 and 9 were associated with early development, comprising 1643 and 1394 transcripts, respectively. The expression of these clusters exhibited sharp downregulation after the MP stage and maintained stable expression from LP to FB, indicating potential involvement in primordium initiation and early fruiting body development (Figure 10B,C). Cluster 2 contained 918 transcripts, showing stable expression during EP-MP, significant upregulation at LP, and rapid downregulation at FB, which likely mediated critical LP-stage biological processes (Figure 10B,C). Clusters 5 and 8 contained 2093 and 1077 transcripts, respectively, with consistent expression during early development and marked upregulation during the FB transition, suggesting key roles in fruiting body maturation (Figure 10B,C).

3.13. Functional Categorization of Differentially Expressed Genes

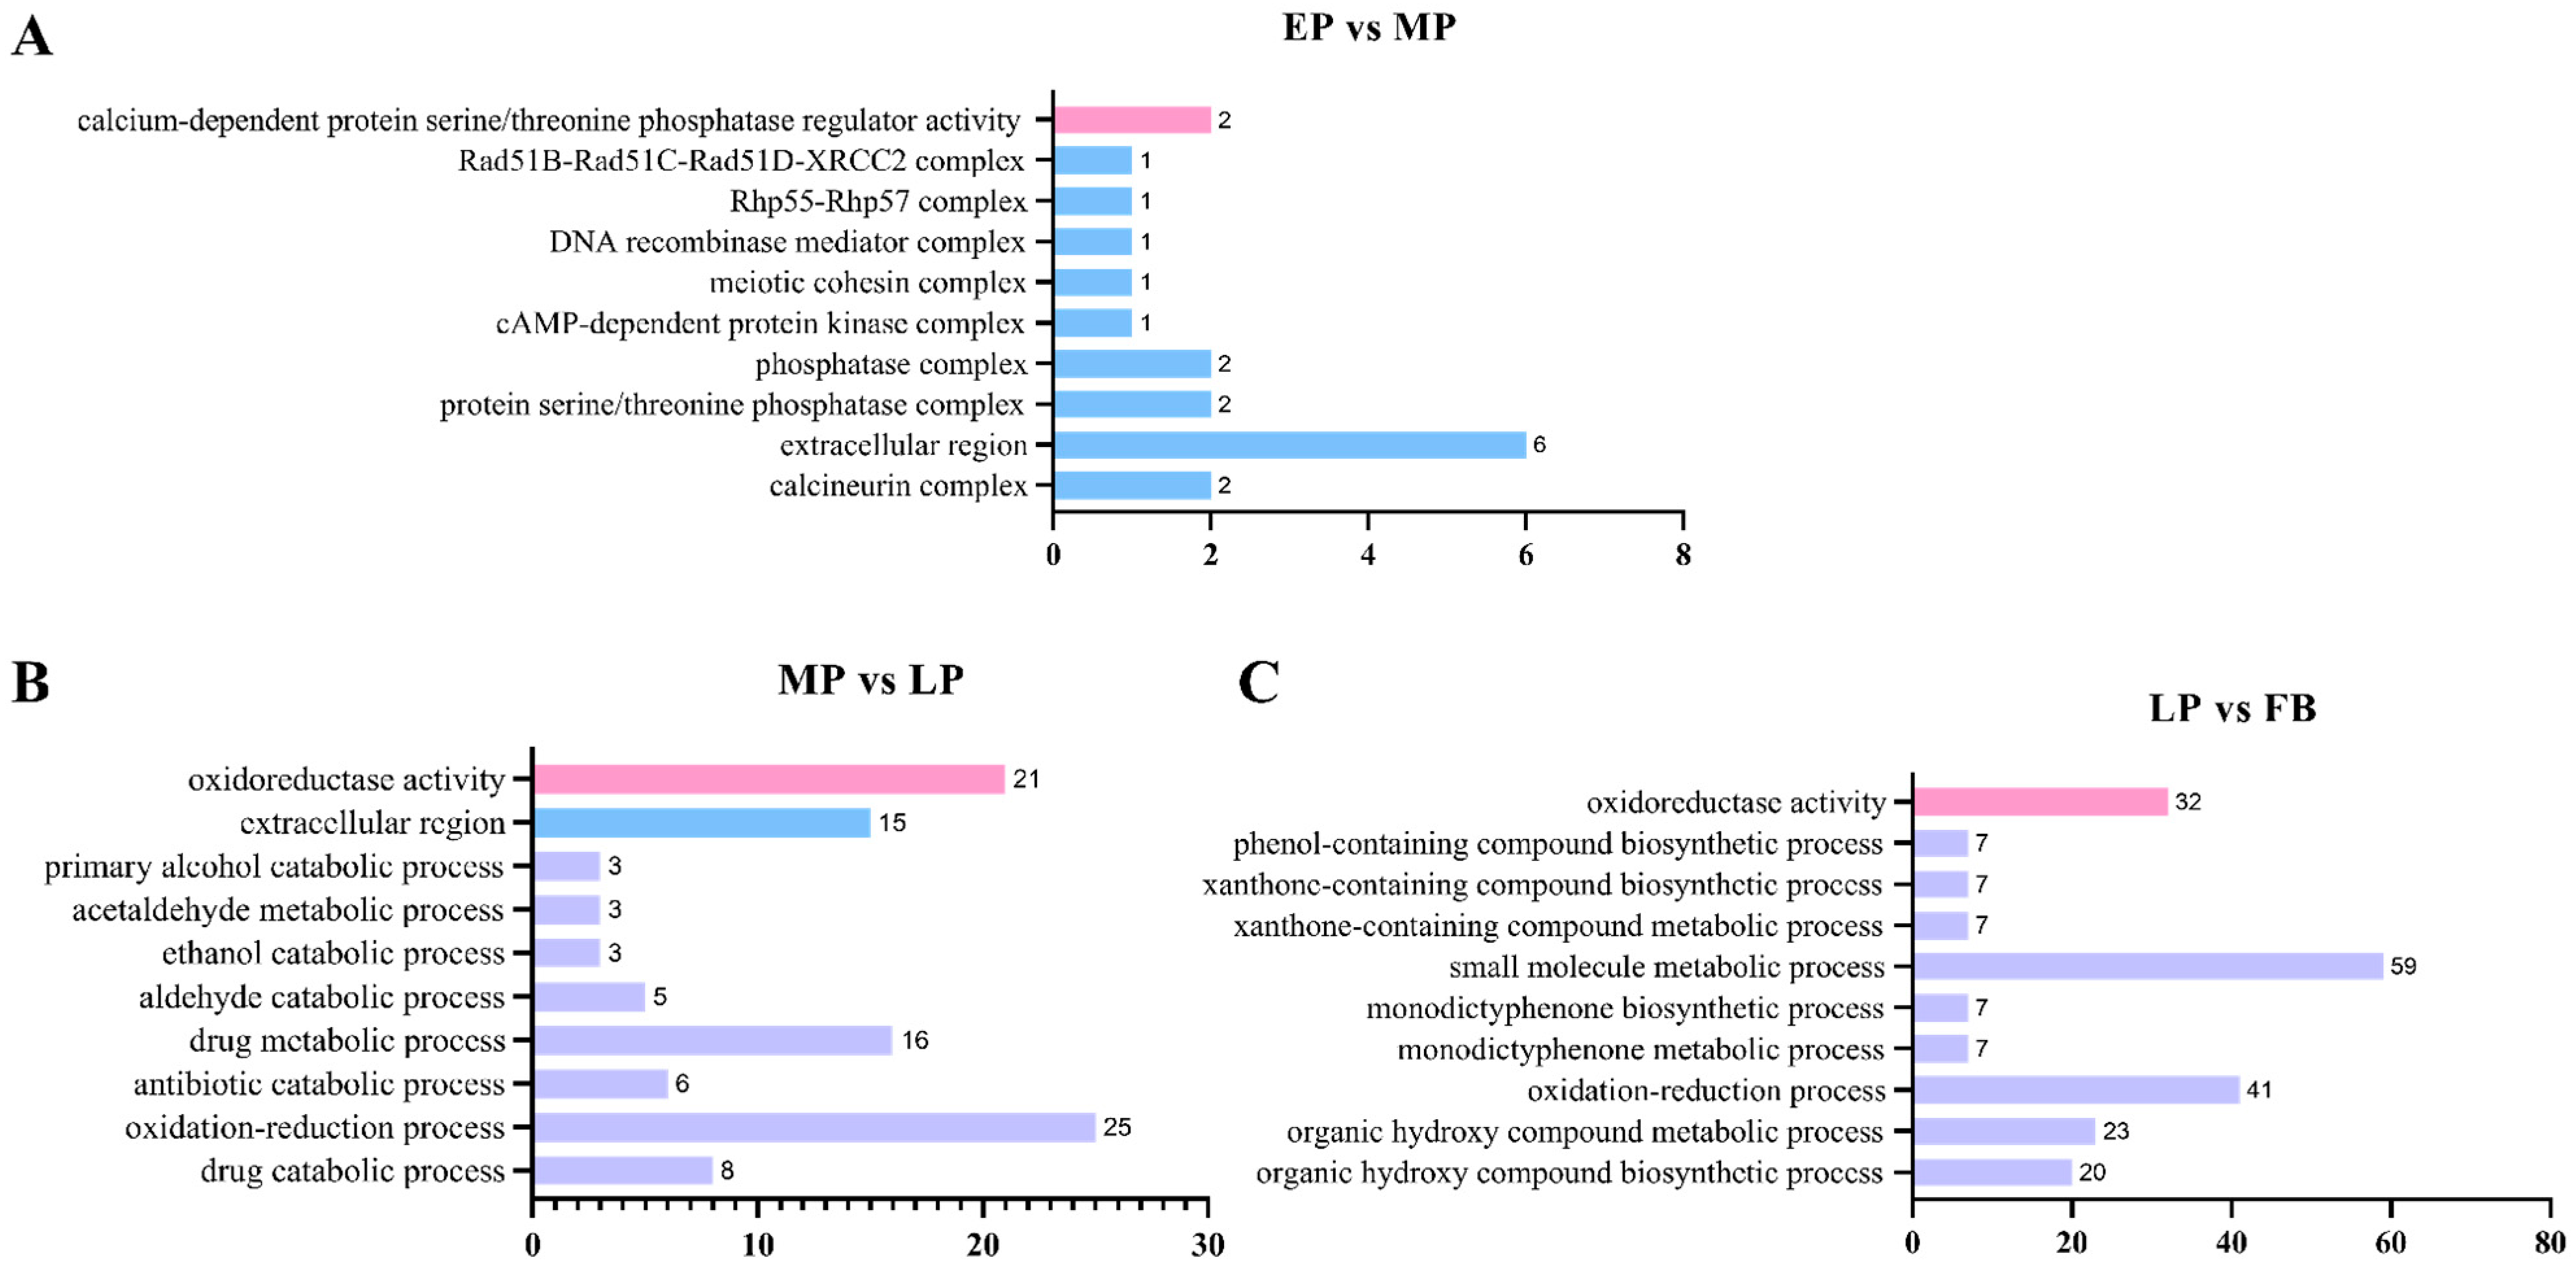
All identified DEGs were systematically classified into three GO categories: Biological Process (BP), Cellular Component (CC), and Molecular Function (MF). The top 10 significantly enriched terms revealed distinct functional patterns across developmental transitions. In the EP vs. MP comparison, cellular components dominated the enriched terms (9 CC terms). The extracellular region (GO:0005576) contained the highest number of DEGs (n = 6), followed by the protein serine/threonine phosphatase complex (GO:0008287) and phosphatase complex (GO:1903293). Only one molecular function term was enriched: calcium-dependent protein serine/threonine phosphatase regulator activity (GO:0008597, n = 2) (Figure 11A). The MP vs. LP comparison showed predominant enrichment in biological processes (8 BP terms), with the oxidation–reduction process (GO:0055114) containing the highest number of DEGs. The extracellular region (GO:0005576) was the only enriched cellular component, while oxidoreductase activity (GO:0016491) represented the only enriched molecular function (Figure 11B). This pattern of oxidoreductase activity enrichment was also observed in the LP vs. FB comparison. For LP vs. FB, biological processes accounted for 9 of the top 10 enriched terms. The small molecule metabolic process (GO:0044281) contained the most DEGs (n = 59), followed by the oxidation–reduction process (n = 41) (Figure 11C). Across all comparisons, FP vs. FB presented the most DEGs, while EP vs. MP had the fewest. Notably, MP vs. LP and FP vs. FB exhibited the greatest similarities in their enrichment patterns.
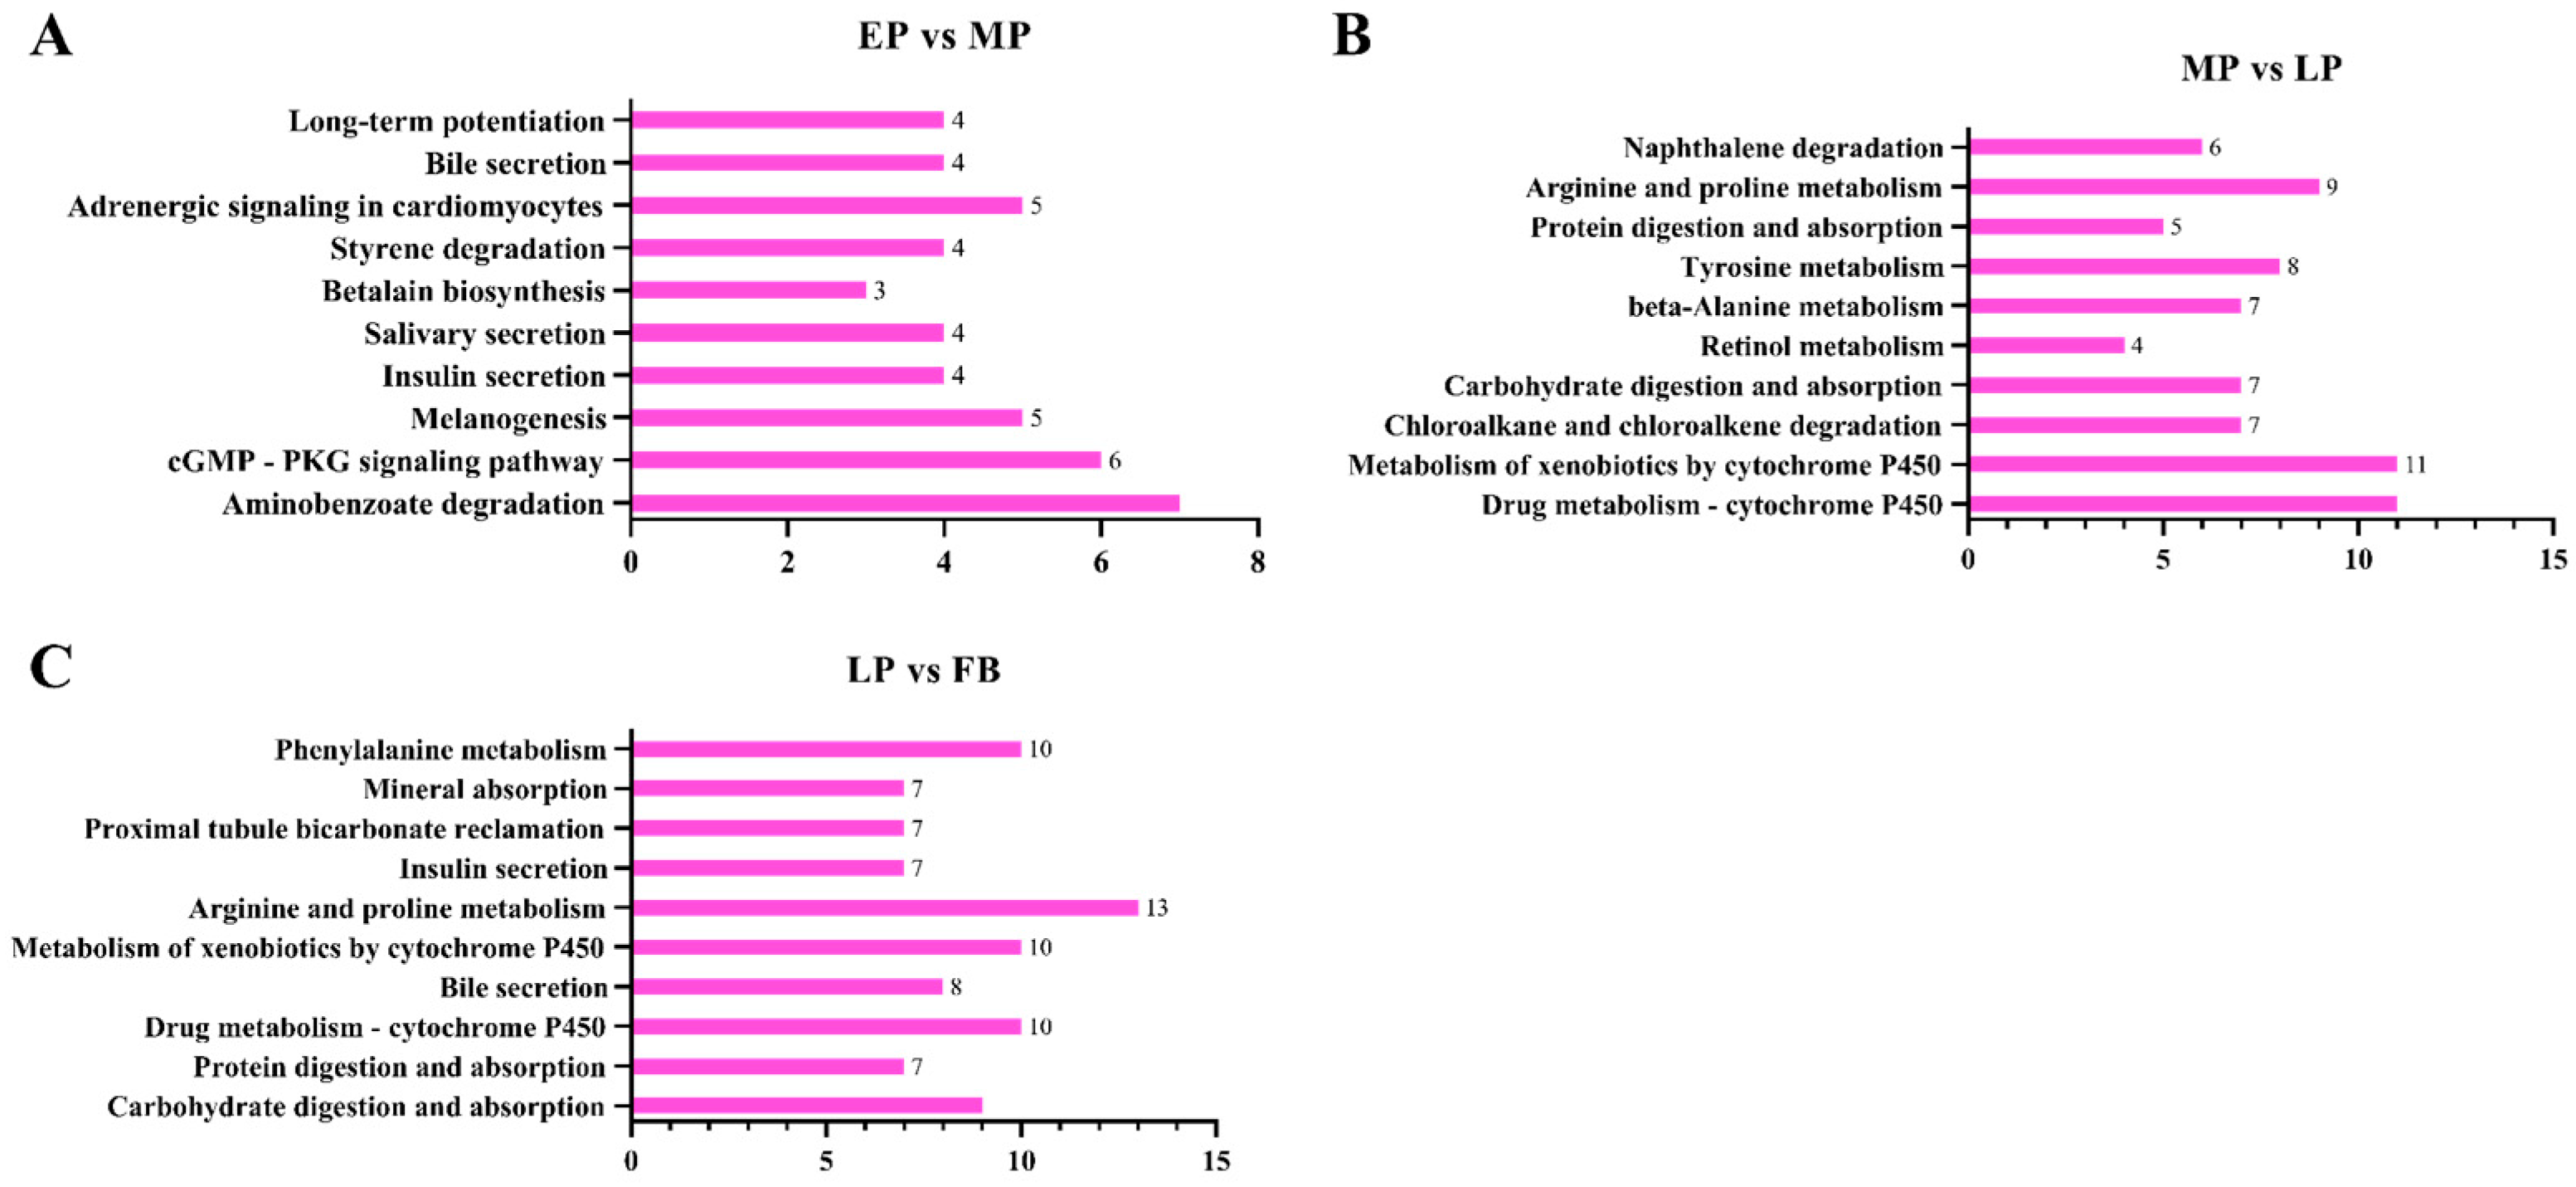
Pathway analysis revealed distinct metabolic signatures for each developmental transition. KEGG pathway analysis revealed that the comparison between EP and MP mainly involved pathways such as Aminobenzoate degradation (ko00627), the cGMP–PKG signaling pathway (ko04022), Melanogenesis (ko04916), and Adrenergic signaling in cardiomyocytes (ko04261) (Figure 12A). The results of the MP vs. LP comparison primarily involved enriched pathways such as Cytochrome P450 (ko00982), the metabolism of xenobiotics with cytochrome P450 (ko00980), Arginine and proline metabolism (ko00330), and Tyrosine metabolism (ko00350) (Figure 12B). The LP vs. FB comparison mainly involved Arginine and proline metabolism (ko00330), the metabolism of xenobiotics via cytochrome P450 (ko00980), drug metabolism—cytochrome P450 (ko00982)—and Phenylalanine metabolism (ko00360) (Figure 12C). Consistent with the GO results, FP vs. FB yielded the highest pathway-associated DEG counts, while EP vs. MP had the lowest with MP vs. LP and FP vs. FB, which exhibited similar metabolic patterns.

3.14. Validation of Transcriptomic Data with RT-qPCR

To validate our RNA-Seq results, three representative differentially expressed genes involved in growth and development were selected for qRT-PCR analysis. Fruiting body induction and development are known to be regulated by various environmental factors, including temperature fluctuations and CO2 concentration [34]. Previous studies have demonstrated the involvement of heat shock protein (HSP) genes in temperature response and the protein kinase A (PKA) signaling pathway in CO2-mediated regulation during fruiting body development [35,36,37]. Our analysis revealed that HSP genes (hsp_78 and hsp_82) exhibited significantly lower expression levels during the early fruiting body development stage under low-temperature conditions compared with the results in later stages (MP, LP, and FB) (Figure 8B and Figure 13A,B). Conversely, PKAC genes showed markedly elevated expression during both the primordium formation and fruiting body maturation phases under low CO2 concentrations, relative to the early development stage, in which higher CO2 concentrations were maintained (Figure 13C). The qRT-PCR results exhibited strong concordance with our RNA-Seq data across all examined developmental stages, confirming the reliability of our transcriptomic data.

4. Discussion

Most studies on mycelial liquid fermentation in G. frondosa have focused on polysaccharide extraction. However, the molecular mechanisms underlying fruiting body development remain poorly understood. In the present study, liquid spawn optimization established the optimal medium composition (Glucose 28.5 g/L, Yeast Extract Powder 11.5 g/L, MgSO4 2 g/L, C/N 10:1) and culture conditions (medium volume 100 mL/250 mL flask, Inoculum size 10%, initial pH 4.0) for the factory cultivation of G. frondosa. The transcriptomes from different developmental stages of the G. frondosa fruiting body were compared using the same batch of samples, covering the entire developmental process of the fruiting body. Notably, the transcriptional profiles and functional annotations of differentially expressed genes (DEGs) during mid-development (MP/LP) and maturation (FB) exhibited greater similarity to each other than to those of the early primordium (EP) stage. Furthermore, our analysis highlighted the critical influence of environmental factors—particularly CO2 concentration and temperature—on primordium initiation and sexual reproduction, modulating developmental progression through conserved signaling pathways, including cAMP/PKA-dependent regulation and heat shock protein (HSP)-mediated stress responses.
The orthogonal experiments first identified an optimal medium composition for white G. frondosa liquid inoculum production via shake-flask fermentation. Using mycelial biomass as the primary growth parameter, supplemented by morphological assessments (pellet size, density) and germination kinetics, we identified glucose as the optimal carbon source; yeast extract powder as the preferred nitrogen source, with an ideal C/N ratio of 10:1; and MgSO4 as the most effective organic salt (Table 2). Li et al. [38] reported ammonium nitrate to be the optimal nitrogen source and KH2PO4 as the preferred mineral element for G. frondosa liquid culture, though glucose remained the best carbon source. Zhou et al. [39] identified glucose and yeast extract powder as the optimal carbon and nitrogen sources, respectively. Zhao [40] confirmed that the G. frondosa submerged culture medium was composed of the following: glucose 5 g/L, peptone 5 g/L, KH2PO4 4 g/L, MgSO4 1 g/L. Our findings align partially with those of previous reports, where glucose was consistently identified as the optimal carbon source in G. rondose [38,39,40], while nitrogen source preferences varied between the yeast extract [39] (current study), NH4NO3 [38], and peptone [40]. These discrepancies are potentially attributable to differences in nutrient formulation. While previous investigations have characterized carbon and nitrogen sources independently, the optimal C/N balance for liquid inoculum production remains unexplored. Notably, existing research has only established a 30:1 ratio (sucrose/peptone) as optimal for solid-substrate cultivation in G. frondosa [41]. Through systematic optimization, we demonstrated for the first time that a significantly lower 10:1 C/N ratio (glucose/peptone) maximizes mycelial biomass production in liquid culture systems. Using culture parameters with an initial pH of 4.0, medium volume of 100 mL/250 mL flask, and inoculum size of 10% (Figure 5, Figure 6 and Figure 7) agreed with the results of Zhao [40]. These findings have important implications for industrial-scale inoculum production, emphasizing the need for system-specific medium optimization.
Comparative transcriptome analysis was conducted across four key fruiting body developmental stages. Progressively increasing numbers of DEGs across developmental stages were observed (Figure S3). The peak in DEG numbers during later stages suggested increasingly complex gene regulatory networks required for advanced morphogenesis. These findings corroborate previous reports by Li et al. [17] and Duan et al. [42] regarding transcriptional complexity during O. sinensis and Sarcomyxa edulis development, respectively. GO term analysis showed stage-dependent functional specialization: oxidoreductase activity (GO:0016491) was the only term shared across the three comparisons indicating that core metabolic processes (particularly amino acid and carbohydrate metabolism) maintain consistent importance throughout later development (Figure 11). The majority of biological process terms were enriched in the MP vs. LP and LP vs. FB comparisons, which was consistent with the GO term changes observed during fruiting body development in O. sinensis [17]. Meanwhile, KEGG analysis revealed four pathways consistently enriched in both MP vs. LP and LP vs. FB comparisons: Arginine and proline metabolism (ko00330), carbohydrate digestion and absorption (ko04973), the metabolism of xenobiotics by cytochrome P450 (ko00980), and protein digestion and absorption (ko04974) (Figure 12). These results demonstrate that the transcriptional programs of the mid-development (MP/LP) and maturation (FB) stages offer greater functional similarities to each other than to the early primordium (EP) stage.
Fruiting body induction and development are intricately regulated by environmental factors, including nutrient availability, temperature fluctuations, and CO2 concentration [34]. Thermal shifts play a pivotal role in fungal morphogenesis, where a temperature increase (“heat shock”) during the transition from the mycelial to fruiting phase promotes fruiting body formation in Morchella importuna [43], while cold shock stimulates primordia in F. filiformis [34]. Conversely, heat stress inhibits hypha growth in Ganoderma lucidum while upregulating heat shock protein (HSP) expression [44]. In this study, HSP genes exhibited significant differential expression across G. frondosa developmental stages, with the lowest expression observed during low-temperature primordium formation further validated by RT-qPCR analysis of hsp_78 and hsp_82 (Figure 8B and Figure 13A,B). This validation supports the biological relevance of the identified expression patterns in fungal development under temperature stress conditions.
Beyond temperature, CO2-mediated signaling pathways contribute to fungal development. Adenylate Cyclase (AC), activated by CO2, elevates intracellular cAMP levels, thereby stimulating protein kinase A (PKA) signaling [37]. Elevated cAMP concentrations have also been reported during primordium formation in V. volvacea [45] and are essential for developmental progression in Ustilago maydis [46]. Our transcriptomic analysis revealed significant enrichment of differentially expressed genes (DEGs) in the cAMP signaling pathway during both the early and mature fruiting body stages (Table S4). Notably, the high expression of PKAC suggested its potential involvement in sporulation (Figure 13), supporting the hypothesis that CO2-induced cAMP cascades play a regulatory role in primordium formation and reproductive processes in G. frondosa, agreeing with the results in V. volvacea [45] and Ustilago maydis [46]. While the fruiting of Cordyceps militaris is more dependent on the MAPK pathway than the cAMP-dependent PKA pathway [17]. In future studies, the biological functions of HSP genes and PKAC gene during G. frondosa fruiting body development will be further investigated through genetic manipulation approaches, including gene interference and overexpression.
This study advances the industrial cultivation of white G. frondosa through comprehensive investigations spanning from liquid culture optimization to the molecular characterization of fruiting body development. Culture optimization established the optimal medium composition and culture conditions for liquid spawn production. Comparative transcriptomics across four fruiting body developmental stages revealed conserved transcriptional profiles across three late developmental stages, involving key processes like oxidoreductase activity and amino acid and carbohydrate metabolism. We also demonstrated the pivotal role of cAMP/PKA signaling in primordium formation and the HSP-mediated regulation of sexual reproduction. These findings provide both practical technical parameters for industrial production and fundamental insights into the molecular mechanisms governing G. frondosa development. The integration of cultivation optimization with systems biology approaches establishes a robust framework for future strain improvements and production scaling.

Supplementary Materials

The following supporting information can be downloaded at https://www.mdpi.com/article/10.3390/horticulturae11101151/s1. Figure S1. Heatmap of inter-sample correlation analysis. Figure S2. Three-dimensional PCA of 12 samples. Figure S3. The distribution of genome-wide gene transcription levels derived from RNA-seq data. Table S1. Analysis of Variance Table. Table S2. Summary of the sequencing data for the Grifola frondosa transcriptome at different growth stages. Table S3. GO functional classification of differentially expressed genes. Table S4. KEGG-enriched pathway analysis of differentially expressed genes. Table S5. Oligonucleotide primer sequences used in this study.

Author Contributions

Conceptualization, Z.-Q.W. and X.L.; methodology, H.-H.R. and J.-Y.Z.; software, H.-H.R., J.-Y.Z., J.-Y.W., S.-S.X., S.-Y.L., B.-Y.S., S.-M.L. and M.L.; validation, J.-Y.Z., Z.-Q.W. and X.L.; formal analysis, H.-H.R.; investigation, H.-H.R., J.-Y.Z. and X.L.; resources, Z.-Q.W.; data curation, H.-H.R. and J.-Y.Z.; writing—original draft, H.-H.R. and J.-Y.Z.; writing—review & editing, Z.-Q.W. and X.L.; visualization, J.-Y.W.; supervision, Z.-Q.W. and X.L.; project administration, Z.-Q.W. and X.L.; funding acquisition, S.-M.L., Z.-Q.W. and X.L. All authors have read and agreed to the published version of the manuscript.

Funding

This research was funded by National Agro-Tech Extension and Service Center (NATESC) Edible Fungi Industry Technology System—Minor Species Cultivation Research Position (CARS-20), Fujian Agriculture and Forestry University Scientific and Technological Innovation Fund: Breeding of New Varieties for Industrialized Cultivation of Volvaria volvacea and Grifola frondosa (No. KFB24081A), National Natural Science Foundation of China (No. 32202569), Talent Introduction Scientific Research Special Project of Hebei Agricultural University (No. YJ202249), Fundamental Research Funds for the Provincial Universities of Hebei (No. KY2023055), Key Research and Development Planning Project in Science and Technology of Hebei Province (No. 21326315D), and Hebei Province Edible Fungus Industry Innovation Team—Rare Edible Fungi Post (No. HBCT2023090202).

Data Availability Statement

Data are contained within the article and Supplementary Material.

Conflicts of Interest

The authors declare no conflicts of interest.

References

  1. Kirk, P.M.; Cannon, P.F.; Minter, D.W.; Stalpers, J.A. Dictionary of the Fungi, 10th ed.; CABI: Wallingford, UK, 2008; pp. 1–784.
  2. Xie, X.J.; Wu, F.; Li, S.M.; Vlasák, J.; Zhang, X.; Tian, J.; Li, M.; Li, G. Revision of the scientific name for edible and medicinal fungus huishuhua (maitake) in China. Mycosystema 2024, 43, 230303. (In Chinese) [Google Scholar] [CrossRef]
  3. Li, Q.; Zhang, F.; Chen, G.; Chen, Y.; Zhang, W.; Mao, G.; Zhao, T.; Zhang, M.; Yang, L.; Wu, X. Purification, characterization and immunomodulatory activity of a novel polysaccharide from Grifola frondosa. Int. J. Biol. Macromol. 2018, 111, 1293–1303. [Google Scholar] [CrossRef] [PubMed]
  4. Wang, Y.; Shen, X.; Liao, W.; Fang, J.; Chen, X.; Dong, Q.; Ding, K. A heteropolysaccharide, L-fuco-D-manno-1,6-α-D-galactan extracted from Grifola frondosa and antiangiogenic activity of its sulfated derivative. Carbohydr. Polym. 2014, 101, 631–641. [Google Scholar] [CrossRef]
  5. Chen, Y.; Liu, D.; Wang, D.; Lai, S.; Zhong, R.; Liu, Y.; Yang, C.; Liu, B.; Sarker, M.R.; Zhao, C. Hypoglycemic activity and gut microbiota regulation of a novel polysaccharide from Grifola frondosa in type 2 diabetic mice. Food Chem. Toxicol. 2019, 126, 295–302. [Google Scholar] [CrossRef] [PubMed]
  6. Yan, X.; Yang, C.; Lin, G.; Chen, Y.; Miao, S.; Liu, B.; Zhao, C. Antidiabetic potential of green seaweed Enteromorpha prolifera flavonoids regulating insulin signaling pathway and gut microbiota in type 2 diabetic mice. J. Food Sci. 2019, 84, 165–173. [Google Scholar] [CrossRef] [PubMed]
  7. Zhao, C.; Gao, L.; Wang, C.; Liu, B.; Jin, Y.; Xing, Z. Structural characterization and antiviral activity of a novel heteropolysaccharide isolated from Grifola frondosa against enterovirus 71. Carbohydr Polym. 2016, 144, 382–389. [Google Scholar] [CrossRef]
  8. Guo, W.L.; Deng, J.C.; Pan, Y.Y.; Xu, J.X.; Hong, J.L.; Shi, F.F.; Liu, G.L.; Qian, M.; Bai, W.D.; Zhang, W.; et al. Hypoglycemic and hypolipidemic activities of Grifola frondosa polysaccharides and their relationships with the modulation of intestinal microflora in diabetic mice induced by high-fat diet and streptozotocin. Int. J. Biol. Macromol. 2020, 153, 1231–1240. [Google Scholar] [CrossRef]
  9. Ohno, N.; Adachi, Y.; Suzuki, I.; Sato, K.; Oikawa, S.; Yadomae, T. Characterization of the antitumor glucan obtained from liquid-cultured Grifola frondosa. Chem. Pharm. Bull. 1986, 34, 1709–1715. [Google Scholar] [CrossRef]
  10. Suzuki, I.; Hashimoto, K.; Oikawa, S.; Sato, K.; Osawa, M.; Yadomae, T. Antitumor and immunomodulating activities of a beta-glucan obtained from liquid-cultured Grifola frondosa. Chem. Pharm. Bull. 1989, 37, 410–413. [Google Scholar] [CrossRef]
  11. Bu, Q.M.; Wang, S.F.; Dong, H.X.; Huang, Q.R.; Lai, G.S. Study on the optimal conditions of liquid fermentation of Grifola frondosa. Hubei Agric. Sci. 2003, 22, 23–24+39. (In Chinese) [Google Scholar] [CrossRef]
  12. Deng, G.C.; Zhao, H.; Gong, L.A.; Li, Y.B.; Ma, Y.; Li, J.L.; Li, J. Optimization of liquid fermentation conditions for Grifola frondosa mycelium. Jiang Su Agric. Sci. 2013, 41, 216–218. (In Chinese) [Google Scholar] [CrossRef]
  13. Feng, L.G.; Xu, N.; Huang, X.H.; Deng, Z.L.; Xia, Y.L.; Zhou, N. Optimization of liquid seed medium for Grifola frondosa. J. Agric. Sci. Tech.-Iran 2020, 21, 40–44. [Google Scholar] [CrossRef]
  14. Shen, X.; Lui, H.N. Effects of the extracts of traditional Chinese medicines on the extracellular polysaccharide production of Grifola frondosa fermentation system. J. Fungal. Res. 2021, 19, 115–121. (In Chinese) [Google Scholar] [CrossRef]
  15. Yan, J.; Tong, Z.; Han, X.; Gan, Y.; Liu, Y.; Chen, J.; Duan, X.; Lin, J.; Gan, B.; Xie, B. Transcriptome profiling reveals candidate genes related to stipe gradient elongation of Flammulina filiformis. J. Fungi 2022, 9, 64. [Google Scholar] [CrossRef] [PubMed]
  16. Ye, D.; Du, F.; Zou, Y.; Hu, Q. Transcriptomics analysis of primordium formation in Pleurotus eryngii. Genes 2021, 12, 1863. [Google Scholar] [CrossRef]
  17. Li, X.; Wang, F.; Liu, Q.; Li, Q.; Qian, Z.; Zhang, X.; Li, K.; Li, W.; Dong, C. Developmental transcriptomics of Chinese cordyceps reveals gene regulatory network and expression profiles of sexual development-related genes. BMC Genom. 2019, 20, 337. [Google Scholar] [CrossRef]
  18. Nie, W.Q.; Wu, T.X.; Zhong, M.; Lu, H.Y. Transcriptome sequencing and analysis of Grifola frondosa mycelia. Food Sci. 2017, 38, 6–11. (In Chinese) [Google Scholar] [CrossRef]
  19. Wang, W.K.; Zhou, Z.F.; Chen, Q.; Yuan, W.D. Analysis of differentially expressed genes between mycelium and primordium of Grifola frondos. J. Shanghai Jiaotong Univ. (Agric. Sci.) 2016, 34, 74–80. (In Chinese) [Google Scholar] [CrossRef]
  20. Zhang, S.S.; Li, X.; Li, G.J.; Huang, Q.; Tian, J.H.; Wang, J.L.; Li, M.; Li, S.M. Genetic and molecular evidence of a tetrapolar mating system in the edible mushroom Grifola frondosa. J. Fungi 2023, 9, 959. [Google Scholar] [CrossRef]
  21. Kawaguchi, N.; Hayashi, M.; Chen, F.C.; Shimomura, N.; Yamaguchi, T.; Aimi, T. Genetic analyses of causal genes of albinism (white fruiting body) in Grifola frondosa. J. Wood Sci. 2019, 65, 32. [Google Scholar] [CrossRef]
  22. Kawaguchi, N.; Hayashi, M.; Nakano, S.; Shimomura, N.; Yamaguchi, T.; Aimi, T. Expression of tyrosinase genes associated with fruiting body formation and pigmentation in Grifola frondosa. Mycoscience 2019, 60, 262–269. [Google Scholar] [CrossRef]
  23. Chen, Y.L. Product Development and Functional Analysis of Solid State Fermentation Products of Grifola frondosa. Master’s Thesis, Fujian Agriculture and Forestry University, Fuzhou, China, 2022; pp. 1–94. [Google Scholar] [CrossRef]
  24. Bolger, A.M.; Lohse, M.; Usadel, B. Trimmomatic: A flexible trimmer for Illumina sequence data. Bioinformatics 2014, 30, 2114–2120. [Google Scholar] [CrossRef] [PubMed]
  25. Kim, D.; Langmead, B.; Salzberg, S.L. HISAT: A fast spliced aligner with low memory requirements. Nat. Methods 2015, 12, 357–360. [Google Scholar] [CrossRef] [PubMed]
  26. Wang, L.; Wang, S.; Li, W. RSeQC: Quality control of RNA-seq experiments. Bioinformatics 2012, 28, 2184–2185. [Google Scholar] [CrossRef] [PubMed]
  27. Love, M.I.; Huber, W.; Anders, S. Moderated estimation of fold change and dispersion for RNA-seq data with DESeq2. Genome Biol. 2014, 15, 550. [Google Scholar] [CrossRef]
  28. Tatusov, R.L.; Galperin, M.Y.; Natale, D.A.; Koonin, E.V. The COG database: A tool for genome-scale analysis of protein functions and evolution. Nucleic Acids Res. 2000, 28, 33–36. [Google Scholar] [CrossRef]
  29. Ogata, H.; Goto, S.; Sato, K.; Fujibuchi, W.; Bono, H.; Kanehisa, M. KEGG: Kyoto encyclopedia of genes and genomes. Nucleic Acids Res. 1999, 27, 29–34. [Google Scholar] [CrossRef]
  30. Li, H.; Handsaker, B.; Wysoker, A.; Fennell, T.; Ruan, J.; Homer, N.; Marth, G.; Abecasis, G.; Durbin, R. The Sequence Alignment/Map format and SAMtools. Bioinformatics 2009, 25, 2078–2079. [Google Scholar] [CrossRef]
  31. Li, S.M.; Ren, H.H.; Zhang, J.; Gao, S.P.; Chen, Z.X.; Li, G.J.; Tian, J.; Wang, J.; Li, M.; Li, X.; et al. Chitin synthases in Cordyceps militaris: Genome-wide gene identification, evolutionary insights, and life cycle transcript profiling. Horticulturae 2024, 10, 494. [Google Scholar] [CrossRef]
  32. Xie, H.Y.; Wan, L.Z.; Han, J.D.; Huang, C.Y.; Li, J.; Yang, P.; Zhang, Y.; Gong, Z.; Yu, H. TMT-based proteomic and transcriptomic analysis reveal new insights into heat stress responsive mechanism in edible mushroom Grifola frondosa. Sci. Hortic-Amsterdam. 2024, 323, 112542. [Google Scholar] [CrossRef]
  33. Livak, K.J.; Schmittgen, T.D. Analysis of relative gene expression data using real-time quantitative PCR and the 2(-Delta Delta C(T)) Method. Methods 2001, 25, 402–408. [Google Scholar] [CrossRef]
  34. Sakamoto, Y. Influences of environmental factors on fruiting body induction, development and maturation in mushroom-forming fungi. Fungal Biol. Rev. 2018, 32, 236–248. [Google Scholar] [CrossRef]
  35. Wang, G.Z.; Li, M.; Zhang, C.H.; Sun, C.Y.; Li, T.H.; Deng, W.Q. Dissecting the regulation network of high temperature inhibiting primordial formation of Cordyceps guangdongensis based on transcriptomic data. Mycosystema 2021, 40, 2940–2952. (In Chinese) [Google Scholar] [CrossRef]
  36. Hao, Z.; Zhang, C.H.; Huang, Q.J.; Huang, H.; Li, T.H.; Wang, G.Z.; Deng, W.Q. unction of the heat shock protein 40 gene CgDnaJ05 in Cordyceps guangdongensis analysed by RNAi. Mycosystema 2022, 41, 1786–1795. (In Chinese) [Google Scholar] [CrossRef]
  37. Bahn, Y.S.; Mühlschlegel, F.A. CO2 sensing in fungi and beyond. Curr. Opin. Microbiol. 2006, 9, 572–578. [Google Scholar] [CrossRef]
  38. Li, W.D.; Zhang, W.B.; Hua, J.; Wang, Z.J. Study on liquid culture characteristics and extracellular enzyme activities of Grifola frondosa. Edible Fungi. 2019, 41, 11–13. (In Chinese) [Google Scholar]
  39. Zhou, F.Z.; Chang, L.; Chen, X.F.; Li, Y.F.; Li, F. A priliminary study on Grifola frondosa liquid culture and its extracellular polysaccharides. Henan Sci. 2012, 30, 577–579. (In Chinese) [Google Scholar] [CrossRef]
  40. Zhao, L. Optimization of Fermentation Conditions for Grifola frondosa Using Traditional Chinese Medicine-Based Substrates; Gui Zhou University: Guizhou, China, 2008. (In Chinese) [Google Scholar]
  41. Sun, H.J.; Chen, J.W.; Yan, J.; Wang, J.; Xie, Y.; Wang, W.Z.; Jiang, F.Y.; Wu, F.L. Optimization of carbon-to-nitrogen ratio in culture medium for maximum mycelial growth of Grifola frondosa. Edible Fungi. 2019, 41, 18–20. (In Chinese) [Google Scholar]
  42. Duan, C.; Yao, L.; Lv, J.H.; Jia, C.W.; Tian, F.H.; Li, C.T. Systematic analysis of changes across different developmental stages of the mushroom Sarcomyxa edulis. Gene 2022, 824, 146450. [Google Scholar] [CrossRef]
  43. Hao, H.; Zhang, J.; Wang, H.; Wang, Q.; Chen, M.; Juan, J.; Feng, Z.; Chen, H. Comparative transcriptome analysis reveals potential fruiting body formation mechanisms in Morchella importuna. AMB Express 2019, 9, 103. [Google Scholar] [CrossRef]
  44. Zhang, X.; Ren, A.; Li, M.J.; Cao, P.F.; Chen, T.X.; Zhang, G.; Shi, L.; Jiang, A.L.; Zhao, M.W.; Brakhage, A.A. Heat stress modulates mycelium growth, heat shock protein expression, ganoderic acid biosynthesis, and hyphal branching of Ganoderma lucidum via Cytosolic Ca2+. Appl. Environ. Microbiol. 2016, 82, 4112–4125. [Google Scholar] [CrossRef]
  45. Lu, Y.; Lian, L.; Guo, L.; Xie, B.; Wang, W.; Chen, B.; van Peer, A.F.; Li, S.; Wu, T.; Xie, B. The accordant trend of both parameters (rgs expression and cAMP content) follows the pattern of development of fruiting body in Volvariella volvacea. Curr. Microbiol. 2015, 71, 579–584. [Google Scholar] [CrossRef]
  46. Lengeler, K.B.; Davidson, R.C.; D’souza, C.; Harashima, T.; Shen, W.C.; Wang, P.; Pan, X.; Waugh, M.; Heitman, J. Signal transduction cascades regulating fungal development and virulence. Microbiol. Mol. Biol. Rev. 2000, 64, 746–785. [Google Scholar] [CrossRef]
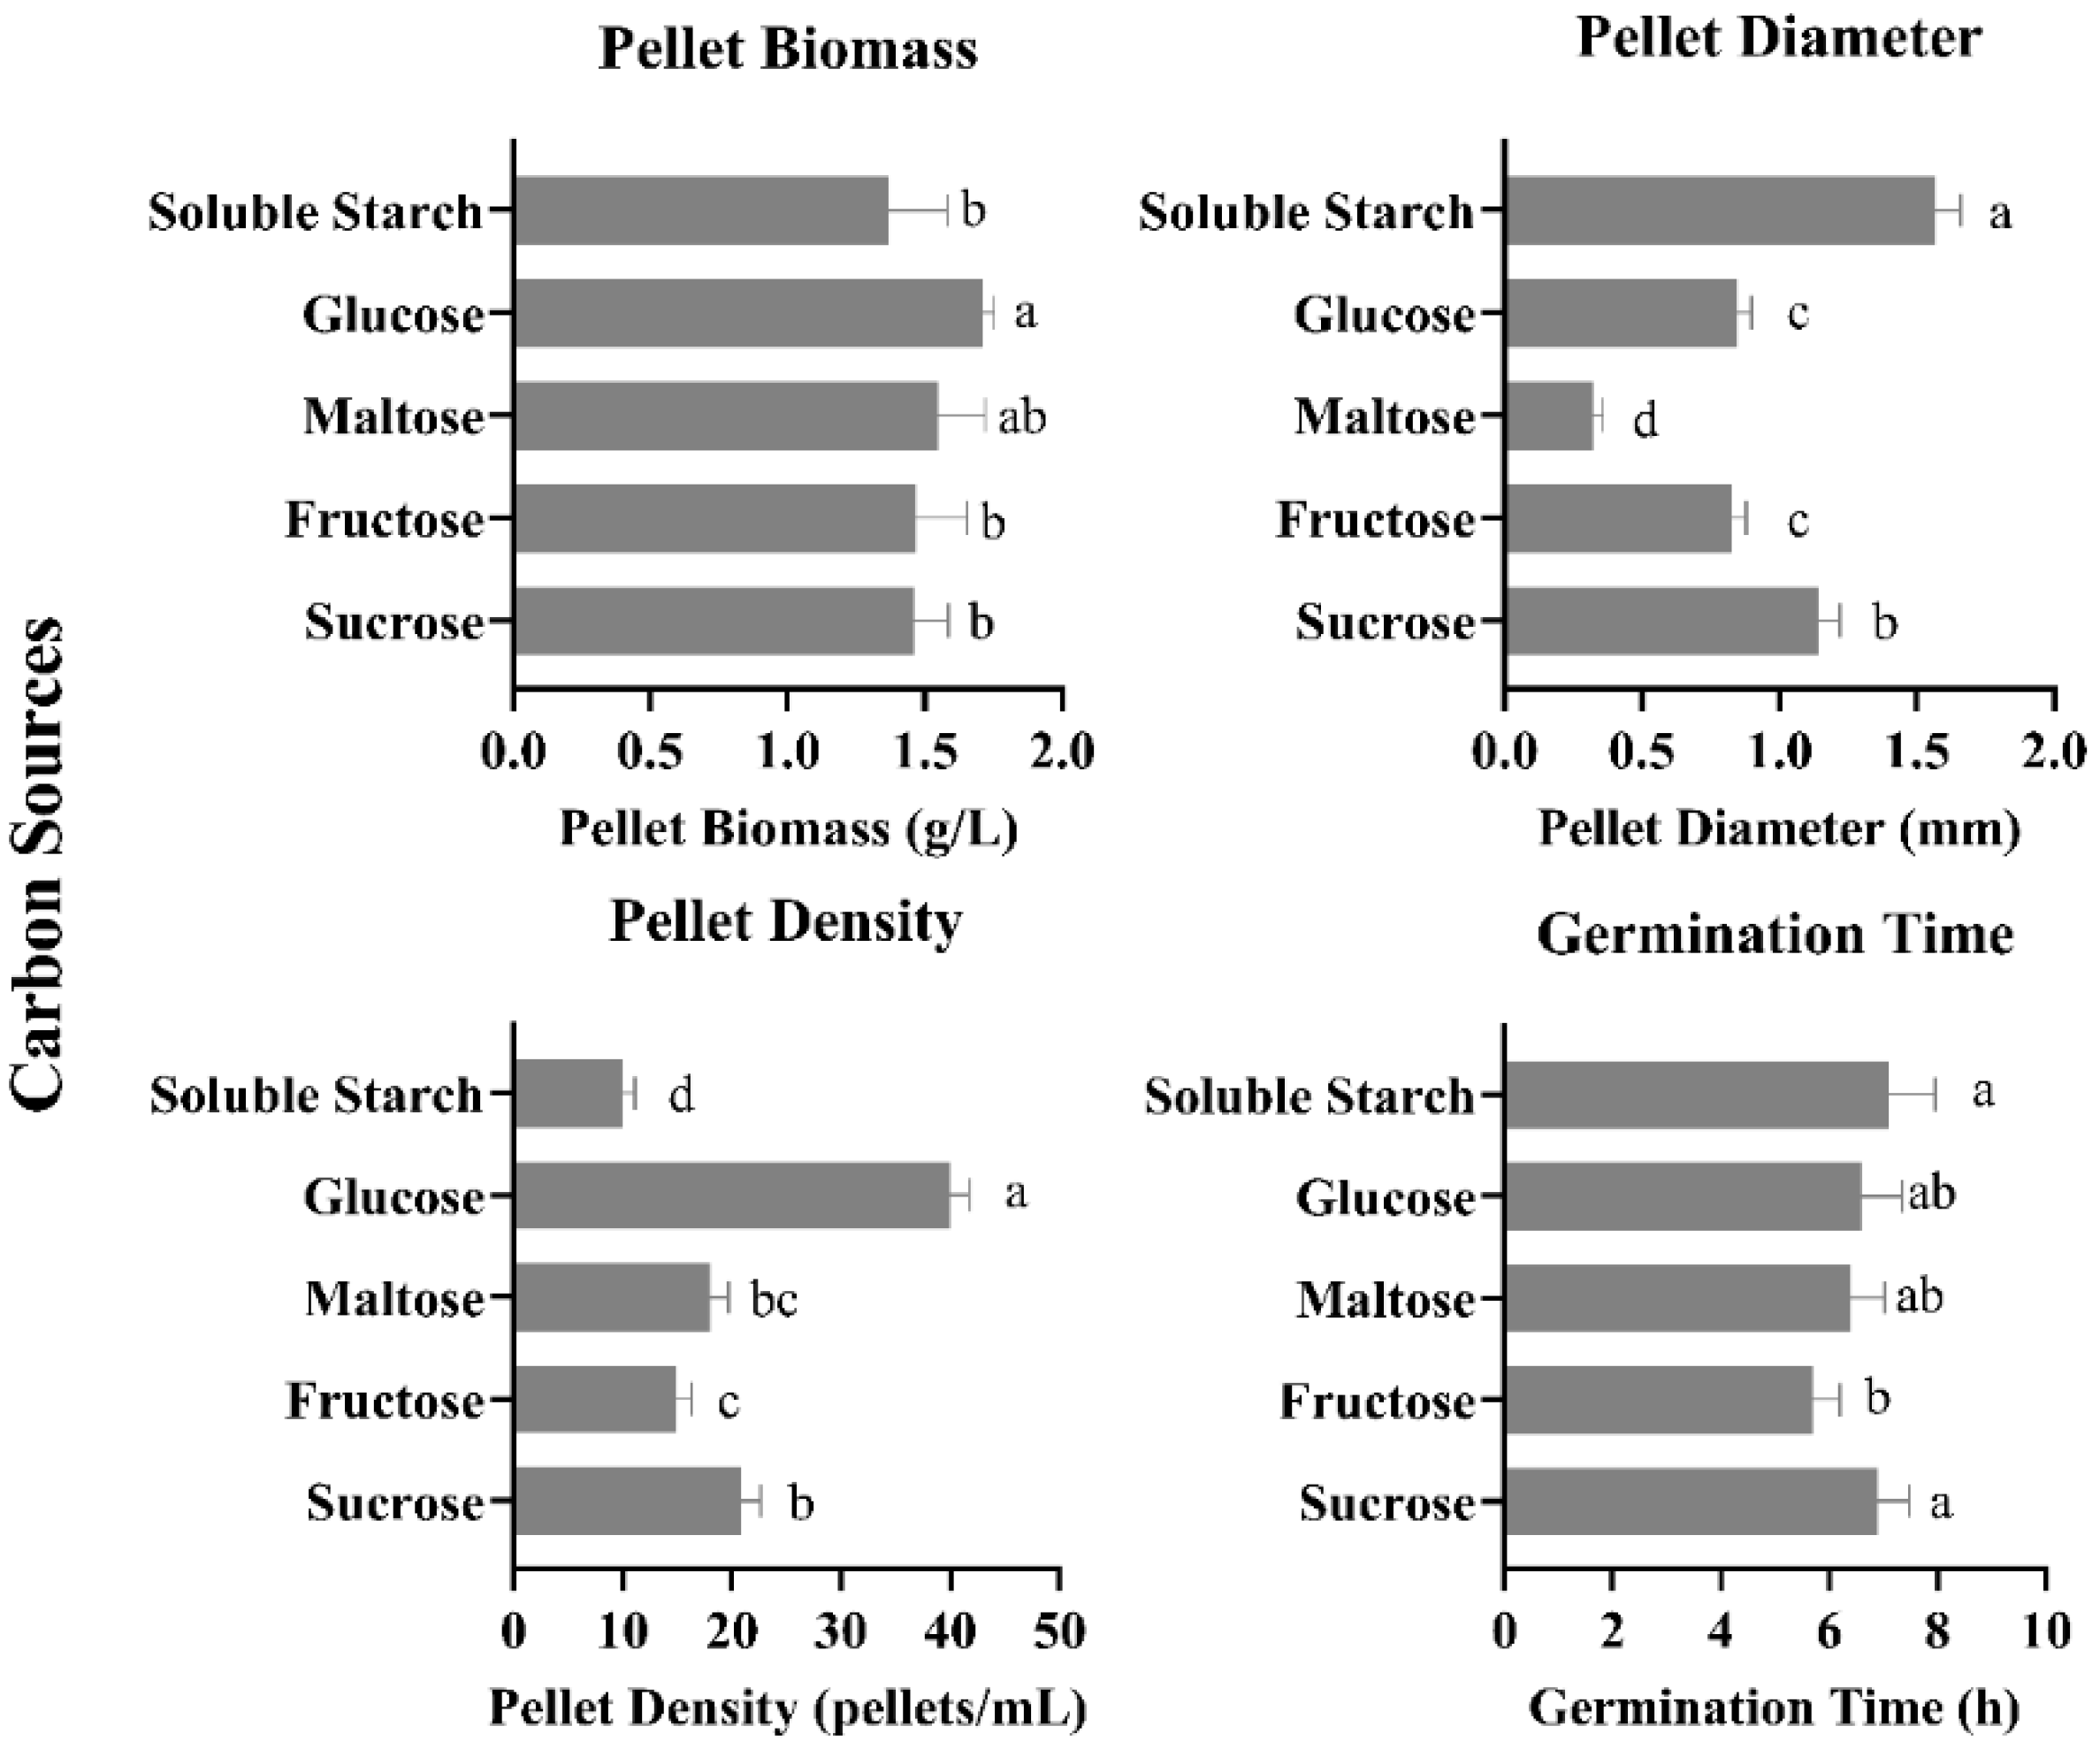
Figure 1. Growth characteristics of mycelium pellets under different carbon sources. Different letters indicate significant differences between means (p < 0.05).
Horticulturae 11 01151 g001
Figure 2. Growth characteristics of mycelium pellets under different nitrogen sources. Different letters indicate significant differences between means (p < 0.05).
Horticulturae 11 01151 g002
Figure 3. Growth characteristics of mycelium pellets under different C/N ratio. Different letters indicate significant differences between means (p < 0.05).
Horticulturae 11 01151 g003
Figure 4. Growth characteristics of mycelium pellets under different inorganic salts. Different letters indicate significant differences between means (p < 0.05).
Horticulturae 11 01151 g004
Figure 5. Growth characteristics of mycelium pellets under different pH values. Different letters indicate significant differences between means (p < 0.05).
Horticulturae 11 01151 g005
Figure 6. Growth characteristics of mycelium pellets under different flask filling volumes. Different letters indicate significant differences between means (p < 0.05).
Horticulturae 11 01151 g006
Figure 7. Growth characteristics of mycelium pellets under different inoculation volumes. Different letters indicate significant differences between means (p < 0.05).
Horticulturae 11 01151 g007
Figure 8. The different growth stages of the fruiting bodies of Grifola frondosa under factory cultivation conditions. (A) Different growth and development stages of G. frondosa under industrialized conditions. EP: Early-stage fruiting body, initial formation stage of the primordia at 60 days; MP: Mid-stage fruiting body, the early differentiation stage of the primordia at 63 days; LP: Late-stage fruiting body, the initial pileus differentiation stage with the characteristic white growing margin at the pileus edge at 66 days; FB: Mature fruiting body, the maturation stage of the fruiting body with complete expansion of the lamellae at 69 days. (B) Temperature change trend. (C) CO2 concentration change trend. (D) Air humidity change trend.
Horticulturae 11 01151 g008
Figure 9. Analysis of DEGs between adjacent growth stages. (A) Volcano plot of DEGs from EP vs. MP. (B) Volcano plot of DEGs from MP vs. LP. (C) Volcano plot of DEGs from LP vs. FB. (D) Each comparison plotted as a Venn diagram of DEGs between groups.
Horticulturae 11 01151 g009
Figure 10. Cluster analysis of differential gene expressions. (A) Clustering heatmap of DEGs. (B) Pseudo-time analysis of DEGs across 9 clusters. (C) Number of DEGs in different clusters in B.
Horticulturae 11 01151 g010
Figure 11. GO functional classification of DEGs. (A) GO enrichment profiles of DEGs from MP vs. EP. (B) GO enrichment profiles of DEGs from MP vs. EP. (C) GO enrichment profiles of DEGs from MP vs. EP. The purple bars indicate BP. The blue bars indicate CC. The pink bars indicate MF.
Horticulturae 11 01151 g011
Figure 12. KEGG pathway enrichment analysis of three PCGs. (A) EP vs. MP. (B) MP vs. LP. (C) LP vs. FB.
Horticulturae 11 01151 g012
Figure 13. Analysis of hsp_78, hsp_82 and PKAC gene expression in fruiting bodies at four developmental stages based on qRT-PCR. (A) Expression pattern of the hsp_78 gene. (B) Expression pattern of the hsp_82 gene. (C) Expression pattern of the PKAC gene. * = p < 0.05, ** = p < 0.01.
Horticulturae 11 01151 g013
Table 1. Orthogonal experimental design factor level.
LevelFactor
Carbon SourceNitrogen SourceC–N RatioInorganic Salt
1FructosePeptone10:1MnCl2
2MaltoseYeast powder15:1KH2PO4
3GlucoseCorn flour20:1MgSO4
Table 2. Results of the orthogonal experiment.
LevelFactorPellet Biomass (g/L)
Carbon SourceNitrogen SourceC–N RatioInorganic Salts
111111.4867
212321.8333
313231.3200
421330.6870
522211.1133
623120.8133
731221.3600
832132.3333
933311.3333
K11.5471.1781.5441.311
K20.8711.7601.2641.335
K31.6751.1551.2841.446
R0.8040.6042.2800.135
Disclaimer/Publisher’s Note: The statements, opinions and data contained in all publications are solely those of the individual author(s) and contributor(s) and not of MDPI and/or the editor(s). MDPI and/or the editor(s) disclaim responsibility for any injury to people or property resulting from any ideas, methods, instructions or products referred to in the content.