Article

Effect of LED Lights on Morphological Construction and Leaf Photosynthesis of Lettuce (Lactuca sativa L.)

1
College of Horticulture, Jilin Agricultural University, Changchun 130118, China
2
Jilin Academy of Vegetable and Flower Sciences, Changchun 130119, China
3
School of Biological and Agricultural Engineering, Jilin University, Changchun 130025, China
*
Authors to whom correspondence should be addressed.
Horticulturae 2025, 11(1), 43; https://doi.org/10.3390/horticulturae11010043
Submission received: 1 December 2024 / Revised: 1 January 2025 / Accepted: 2 January 2025 / Published: 6 January 2025

Abstract

:
During the overwintering production of lettuce in solar greenhouses, there exist a short duration of sunlight and low light intensity, which are detrimental to the growth and development of lettuce. Supplemental lighting is an effective solution to this issue. This study aims to explore the influence of adding different wavelengths of red light to white LEDs for supplemental lighting on the growth and photosynthesis of lettuce leaves in solar greenhouses. Four experimental zones were established, namely white LED + 630 nm (T1), white LED + 660 nm (T2), white LED + 690 nm (T3), and no supplemental lighting (CK). The results indicate that supplemental lighting significantly increased the plant height, leaf area, biomass, and root indices. The chlorophyll content measurements showed higher photosynthetic pigment levels in the treated plants, enhancing the net photosynthesis rate (Pn). Thus, the combination of red and white light provides a more comprehensive spectrum and enhances the photosynthetic capacity of plant leaves. Simultaneously, under supplemental lighting, the plant fluorescence parameters Y(II), Fv/Fm, qP, and ETR were significantly elevated. It was found from the chlorophyll fluorescence frequency distribution graph that the leftward shift in Y(II) in the control group (CK) indicated that it was in a state of weak light stress, but supplemental lighting effectively ameliorated this stress environment. Among the types of supplemental lighting, the combination of white LEDs with 660 nm red light provides the most significant improvement in the growth and photosynthetic characteristics of lettuce under winter greenhouse conditions, and this combination holds great application potential in winter greenhouse lettuce production.

1. Introduction

In modern agriculture, facility vegetable production has become a key method for meeting the growing global demand for food. Romaine lettuce (Lactuca sativa L. var. romana), a herbaceous plant from the Asteraceae family, is widely favored for its fresh consumption and high nutritional value [1]. Jilin Province, located in Northeastern China, experiences an average winter temperature of −18 ± 2 °C. The average daily sunshine duration is approximately 9 h, and the average photosynthetically active radiation (PAR) ranges from 200 to 400 μmol·m⁻2·s−1. Due to the short duration of sunlight and low light intensity, the photosynthesis of lettuce is limited, resulting in slow growth and reduced quality [2]. In such conditions, supplemental lighting is an effective solution. Supplemental lighting not only extends the photoperiod for lettuce, increasing photosynthetic efficiency, but also improves quality and enhances yield [3,4]. In recent years, LED lights, due to their narrow spectral bands, long lifespan, and energy efficiency, have been effectively used in greenhouse crop production [5,6,7]. Numerous studies have explored the effects of different light intensities, light source types, ratios, and photoperiods on vegetable growth, photosynthetic efficiency, and nutritional quality [8,9,10]. Given that various light wavelengths influence plant growth in distinct ways, researching the use of supplemental lighting with different spectra in facility vegetable production has considerable scientific and practical importance.
Studies have demonstrated that various monochromatic and combined LED light spectra influence plant growth in different ways. In the photosynthetically active radiation range of 400–700 nm, the quantum yield of light follows the sequence of red light > blue light > green light [11]. LED supplemental lighting not only ensures adequate light intensity but also influences plant morphology and metabolic activities by modifying the spectral composition. Red light facilitates stem elongation, supports photosynthesis by being absorbed through photosynthetic pigments, stimulates leaf growth, and boosts carbohydrate production, and it is essential in regulating plant responses to the photoperiod [12,13,14]. In greenhouse environments, monochromatic red LED light (660 nm with a 25 nm bandwidth) closely aligns with the optimal absorption wavelengths for chlorophyll and phytochromes, effectively supporting both photosynthesis and morphological development in crops. This enhances leaf photosynthesis, boosts biomass accumulation, and improves overall crop yield, while also increasing chlorophyll levels and photosynthetic efficiency [11,15,16,17]. Blue light inhibits stem elongation and influences phototropism, photomorphogenesis, stomatal opening, and leaf photosynthesis [18,19,20]. Monochromatic blue light primarily enhances the leaf thickness and chlorophyll content, though its effect on yield is limited [21].
In terms of plant absorption spectra, green light from sunlight is largely reflected by leaves and only minimally absorbed by chloroplasts, leading to its general perception as being ineffective. In tomato plants, green light alone reduces the photosynthetic rate and root activity, necessitating supplementation with other light spectra to achieve optimal growth [22]. Combining green light with other light spectra has been found to substantially enhance vegetable growth, especially by promoting leaf expansion, increasing dry matter accumulation, improving photosynthetic efficiency, and delaying senescence [23,24,25,26]. However, using blue light alone may result in excessively compact plants, which can negatively affect overall growth and development. Plants grown under red light alone will exhibit an elongation response, while the use of green light alone is not beneficial for plant growth [27]. Therefore, there are certain limitations to using monochromatic LEDs for supplemental lighting.
At present, the majority of LED supplemental lighting systems used in greenhouses utilize a mix of red and blue light. Research has demonstrated that the ideal red-to-blue light ratio differs based on plant species and specific production goals [28,29,30]. This is because plants absorb red and blue light more effectively, reflecting less, making these wavelengths highly effective for plant growth [31,32]. Red and blue LED light supplementation can produce robust seedlings [33]. A light spectrum consisting of 75–95% red light combined with 5–25% blue light has the most significant effect on tomato growth and physiology. This combination enhances dry matter accumulation, stimulates root development, and boosts chlorophyll and carotenoid levels in the leaves [34]. Varying red-to-blue LED light ratios influence the plant height, leaf count, and the number of fruits and flowers. Lettuce, kale, and sweet pepper showed a notable increase in height under 100% red light. In contrast, a ratio of 91% red light and 9% blue light led to a significant rise in chlorophyll a and b and total chlorophyll levels [35]. Although red and blue light combinations greatly boost photosynthesis, relying solely on these wavelengths can result in physiological imbalances, including excessive stem elongation and leaf expansion, while overlooking the influence of other light spectra on overall plant development [36]. Compared to red–blue combinations, white LED lighting offers broader spectral coverage and more natural light distribution, providing unique advantages in promoting vegetable growth and development.
White LED lighting, which offers a broad spectrum similar to natural sunlight, promotes balanced plant growth, while red light primarily stimulates photosynthesis and biomass production. Generally, red light significantly enhances photosynthetic efficiency and plant growth performance through various mechanisms, including the activation of plant pigments, the stimulation of cell division and expansion, and the optimization of leaf morphology. These mechanisms provide strong theoretical support for the application of supplemental red light in greenhouse lettuce production [37]. Using a combination of white and red LED supplemental lighting can substantially enhance fruit weight, size, and total yield in crops such as tomatoes. Compared to the control group, tomato plants showed increased heights and a 14% boost in fruit yield, and the lycopene and lutein levels rose by 18% and 142%, respectively [38]. Additionally, this lighting accelerated fruit ripening, reduced the harvest time, and increased the cumulative yield, benefiting various aspects of plant growth. White LEDs provide a balanced light spectrum, and when combined with red light, they enhance chlorophyll absorption and improve photosynthetic efficiency. The use of white and red LED supplemental lighting lowered the transpiration rate in tomatoes by 40% while increasing the photosynthetic rate by 19% compared to the control. Red light plays a key role in stimulating photosystems, especially photosystem II [38]. Additionally, incorporating 60% red light into white LED supplemental lighting greatly enhanced the seedling index of eggplants, leading to an increase in both the leaf area index and the photosynthetic index [39].
LED supplemental lighting has demonstrated significant potential and promising applications in facility vegetable production. However, studies investigating the effects of combined spectra from white LEDs and red LEDs with different wavelengths on vegetable growth remain limited, and the mechanisms and effects of supplemental lighting are not yet well understood. This study explores the effects of combining white LEDs with three specific red light peaks, namely white LED + 630 nm (T1), white LED + 660 nm (T2), and white LED + 690 nm (T3), on the growth and development of lettuce. The findings will provide new insights into this field, offering optimized supplemental lighting strategies to enhance crop yield and quality in facility vegetable production. Furthermore, this study provides a theoretical basis and technical support for the sustainable development of the facility vegetable industry.

2. Materials and Methods

2.1. Experimental Materials and Site Description

Romaine lettuce (Lactuca sativa L. var. romana) was selected as the experimental sample, characterized by light green leaves, a compact and attractive plant structure, and good commercial value. This lettuce has a crisp texture and mildly sweet flavor, making it suitable for both raw and cooked consumption. The experiment was conducted from November 2023 to February 2024 at the Jilin Academy of Vegetable and Flower Science in a climate-controlled solar greenhouse located in Changchun, Jilin Province (latitude 43°83′24″ N, longitude 125°39′56″ E). The temperature in the greenhouse ranged from 18 °C to 25 °C, with humidity ranging between 40 and 70%.

2.2. Experimental Design

The experiment consisted of four treatment zones for growing lettuce, including CK (no supplemental lighting), white LED + 630 nm red light (T1), white LED + 660 nm red light (T2), and white LED + 690 nm red light (T3) (Figure 1). After germination and when the seedlings had 4–5 true leaves, five seedlings with similar morphology and size were selected and transplanted into cultivation pots (50 cm × 20 cm × 15 cm). Each cultivation zone had 14 pots, with a plant spacing of 10 cm in each pot. A total of 70 plants per treatment were grown. During leaf development, all treatments received a nutrient solution formulated by the Japan Garden Trial Formula, with 300 mL of nutrient solution irrigated per plant daily. Other management practices were consistent across all treatments. Except for the CK treatment, all other treatments received supplemental lighting daily from 5:00 to 8:00 and from 16:00 to 19:00 (in winter solar greenhouses, optimal natural light is available between 8:00 and 16:00, with light intensities ranging from 300 to 1000 μmol·m⁻2·s−1, making supplemental lighting unnecessary during this period). Considering energy consumption, the supplemental light intensity was maintained at 20.0 ± 1.0 μmol·m⁻2·s−1. In the experimental setup, light scattering or uneven light distribution may have contributed to differences in plant responses. To minimize this impact, multiple plants were used in each treatment as replicates, and plant positions were randomized to reduce the effects of localized variations in light intensity. Additionally, light intensity was measured at multiple points within each treatment area to ensure uniform lighting conditions.

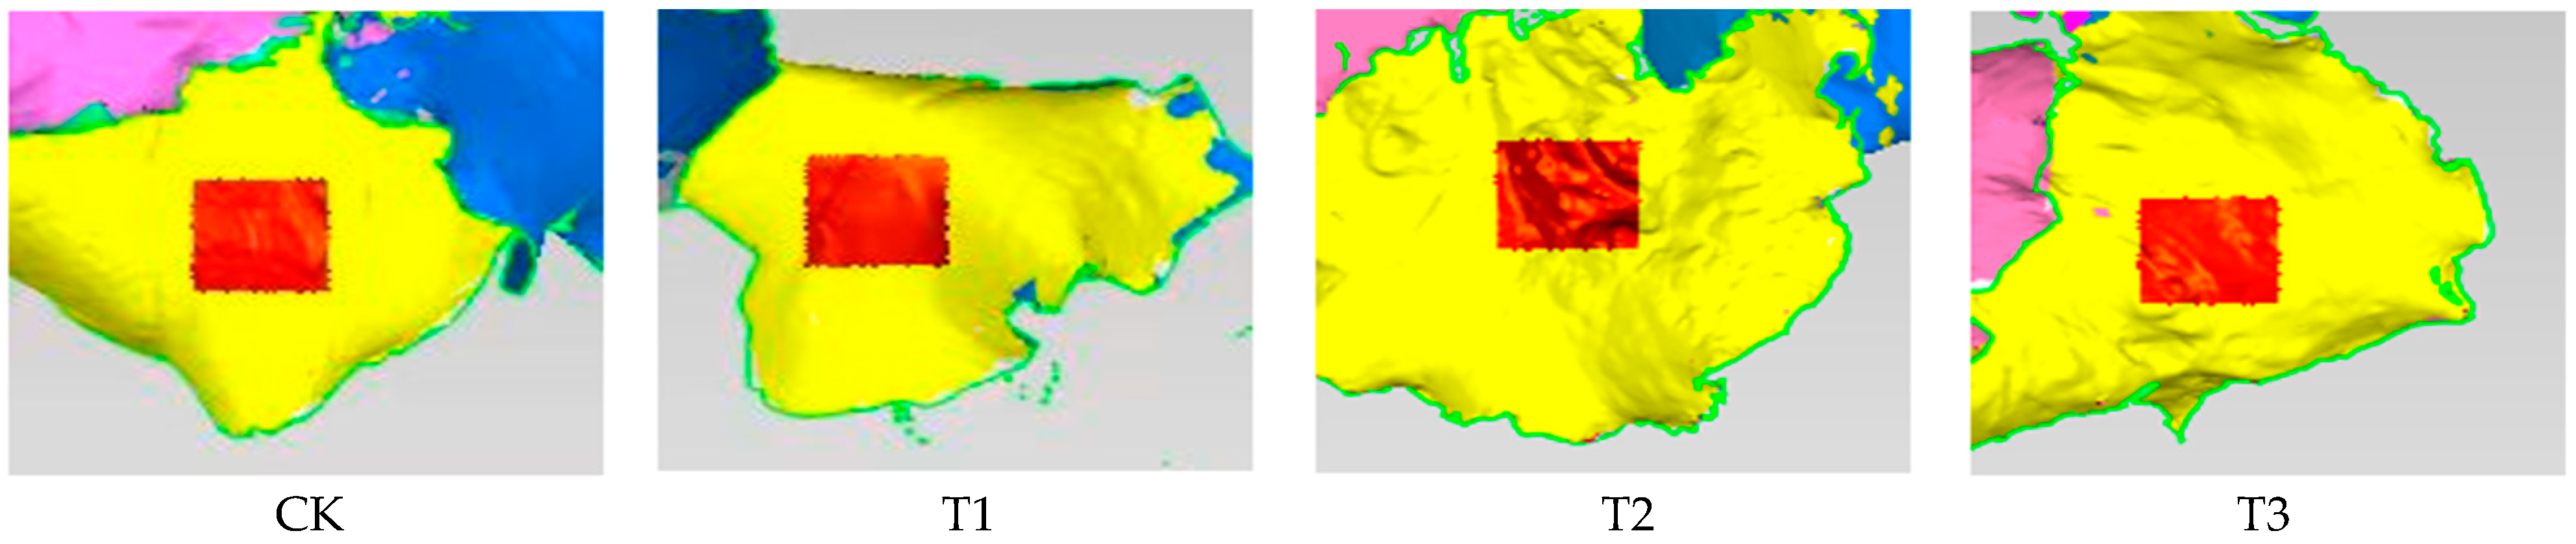
2.2.1. Plant 3D Phenotyping

A 3DScanner-630w binocular scanner (Nanyang Mengyang Machinery Co., Nanyang, China) was used to scan 10 plants of similar size from each treatment on the 40th day after transplanting.

2.2.2. Morphological Indicators

(1)
Plant Height: The height was determined by measuring from the base of the seedling to its highest growth point.
(2)
Stem Diameter: Measurements were taken 1 cm above the ground using a vernier caliper.
(3)
Leaf Count: Leaves longer than 2 cm were counted visually.
(4)
Leaf Area: All leaves were washed with distilled water and laid flat for measurement using the WinRHIZO Arabidopsis 2021 system.
(5)
Leaf Thickness: This was measured with a vernier caliper.
(6)
Fresh Weight: Plant material was quickly cut and weighed using an analytical balance.
(7)
Dry Weight: The lettuce was placed in an oven and dried at 105 °C for one and a half hours, after which it was weighed. Each treatment involved selecting 10 plants for measurement.

2.2.3. Photosynthetic Characteristics

Photosynthetic characteristics were assessed using a Li-6800 automatic photosynthesis system (Li-Cor, Lincoln, NE, USA). Measurements were taken from the second fully expanded mature leaf, starting from the outer leaves, between 9:00 and 11:00 on predominantly sunny days. Data collected under different weather conditions were preserved for a later analysis of weather impacts on photosynthesis. The measurement conditions included a light intensity of 800 μmol·m⁻2·s−1, a temperature of 24 °C, humidity at 60%, and a CO2 concentration of 400 μmol·mol⁻2. The parameters recorded were net photosynthetic rate (Pn), stomatal conductance (Gs), intercellular CO2 concentration (Ci), and transpiration rate (Tr). Ten plants per treatment group were analyzed.

2.2.4. Chlorophyll Content

The largest leaf was chosen, and two 2 cm × 1 cm leaf samples were taken from each side of the midrib. After cleaning, the samples were weighed to 0.1 g, finely chopped, and placed into 10 mL centrifuge tubes containing 10 mL of acetone solution. The samples were then soaked at 4 °C for 48 h. Since chlorophyll a, chlorophyll b, and carotenoids in acetone solution have maximum absorption peaks at 663, 645, and 470 nm, respectively, a chlorophyll analyzer was used to measure the absorbance at these wavelengths. The chlorophyll content was calculated using Arnon’s correction formula [40]. Ten plants from each treatment were measured.

2.2.5. Root Traits

The root morphology, including total root length, surface area, volume, number of root tips, and average diameter, was evaluated using the WinRHIZO Arabidopsis 2021 system (Regent, Québec, QC, Canada). Measurements were taken from ten plants per treatment.

2.2.6. Chlorophyll Fluorescence Parameters

Chlorophyll fluorescence parameters were assessed using a chlorophyll fluorescence imaging system (IMAGINPAM, Heinz Walz, Effeltrich, Germany). On the 40th day after transplanting, 10 plants from each treatment were selected. After 30 min of dark adaptation, the third fully functional leaf from the top was chosen for measurement. The leaf was laid flat on the fluorescence meter’s platform. Parameters measured included maximum photochemical efficiency (Fv/Fm), actual photochemical efficiency (Y(II), electron transport rate (ETR), photochemical quenching (qP), and non-photochemical quenching (NPQ).

2.2.7. Data Processing Methods

Data were processed using Excel 2022, and treatment differences were analyzed through one-way ANOVA followed by the Least Significant Difference (LSD) test using SPSS 25.0. Graphs were generated with Origin 2021 software.

3. Results and Discussion

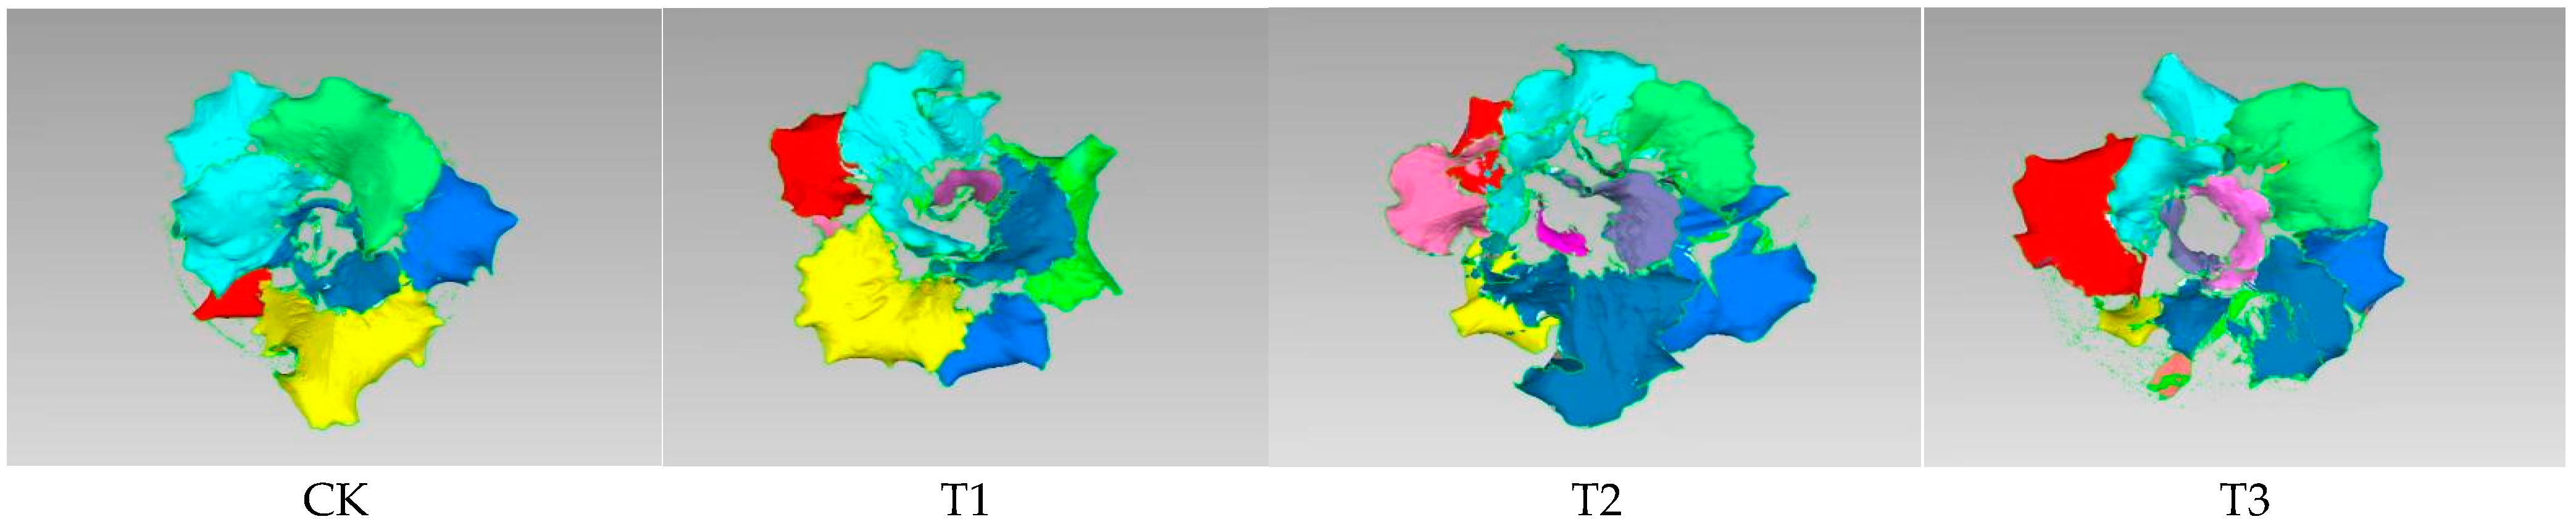
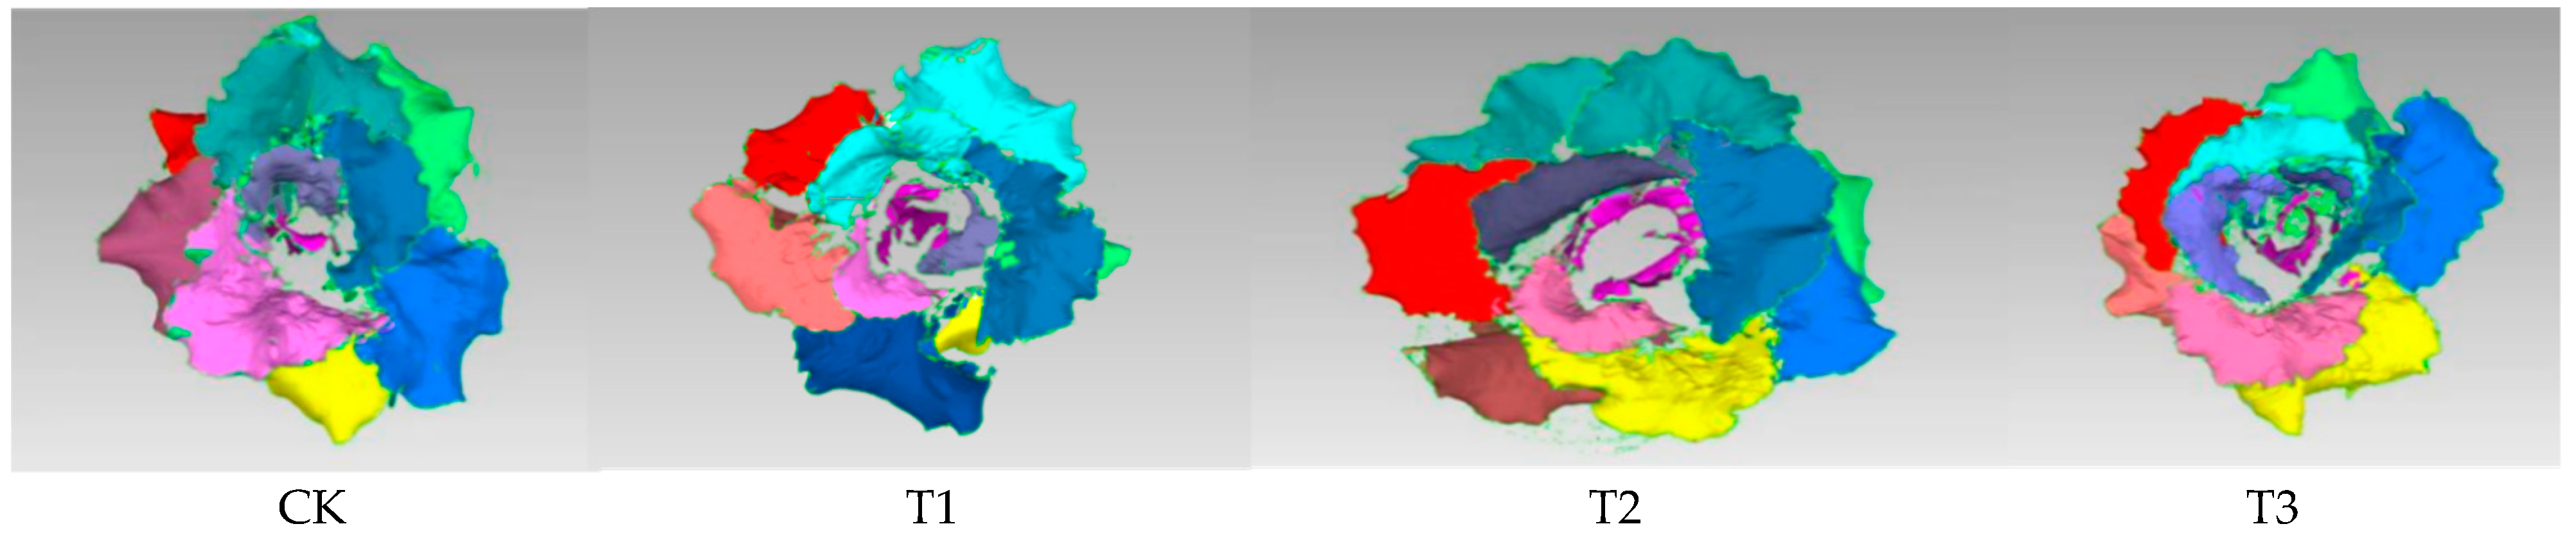
3.1. Effects of Different Treatments on Lettuce Phenotype

Figure 2 and Figure 3 represent scans of lettuce on the 20th and 40th days after transplantation under different treatments. The figures show that lettuce under the CK treatment exhibited smaller leaf areas, a sparse leaf distribution, minimal overlap between leaves, and an overall smaller plant size, indicating weaker growth potential. This suggests that photosynthetic capacity and biomass accumulation were limited in the control treatment. Compared to the CK, the leaf area in the T1 treatment increased, and the degree of leaf expansion was higher, indicating some promotion of growth. However, leaf distribution remained relatively concentrated, and leaf expansion was limited, suggesting that the T1 treatment had a modest impact on growth but did not achieve optimal results. Under the T2 treatment, the lettuce showed the largest leaf area and the most uniform leaf distribution. The leaves were more spread out and covered a larger area, and the plant size increased significantly with moderate leaf overlap. This indicates that T2 was the most beneficial for lettuce growth, promoting both leaf expansion and biomass accumulation. The plant size and leaf expansion in the T3 treatment were between those of T1 and T2. Although the leaf distribution and area increased, the growth performance of T3 was slightly less than that of T2. The leaves were less uniformly expanded and distributed, suggesting that T3 was less effective in promoting lettuce growth compared to T2.
Figure 4 shows the leaf area measurements of lettuce under different treatments 40 d after transplanting, with a 1 × 1 cm area selected along the main leaf vein in a 2D plane. The leaf areas measured for each treatment were 0.84 cm2, 1 cm2, 2.47 cm2, and 1.92 cm2, respectively. Among them, the CK treatment had the flattest leaves, resulting in the smallest leaf area in the same region, while the T2 treatment exhibited the most surface folds, leading to the largest leaf area. This indicates that supplemental lighting promotes leaf growth, improving photosynthetic efficiency and ultimately increasing overall yield.

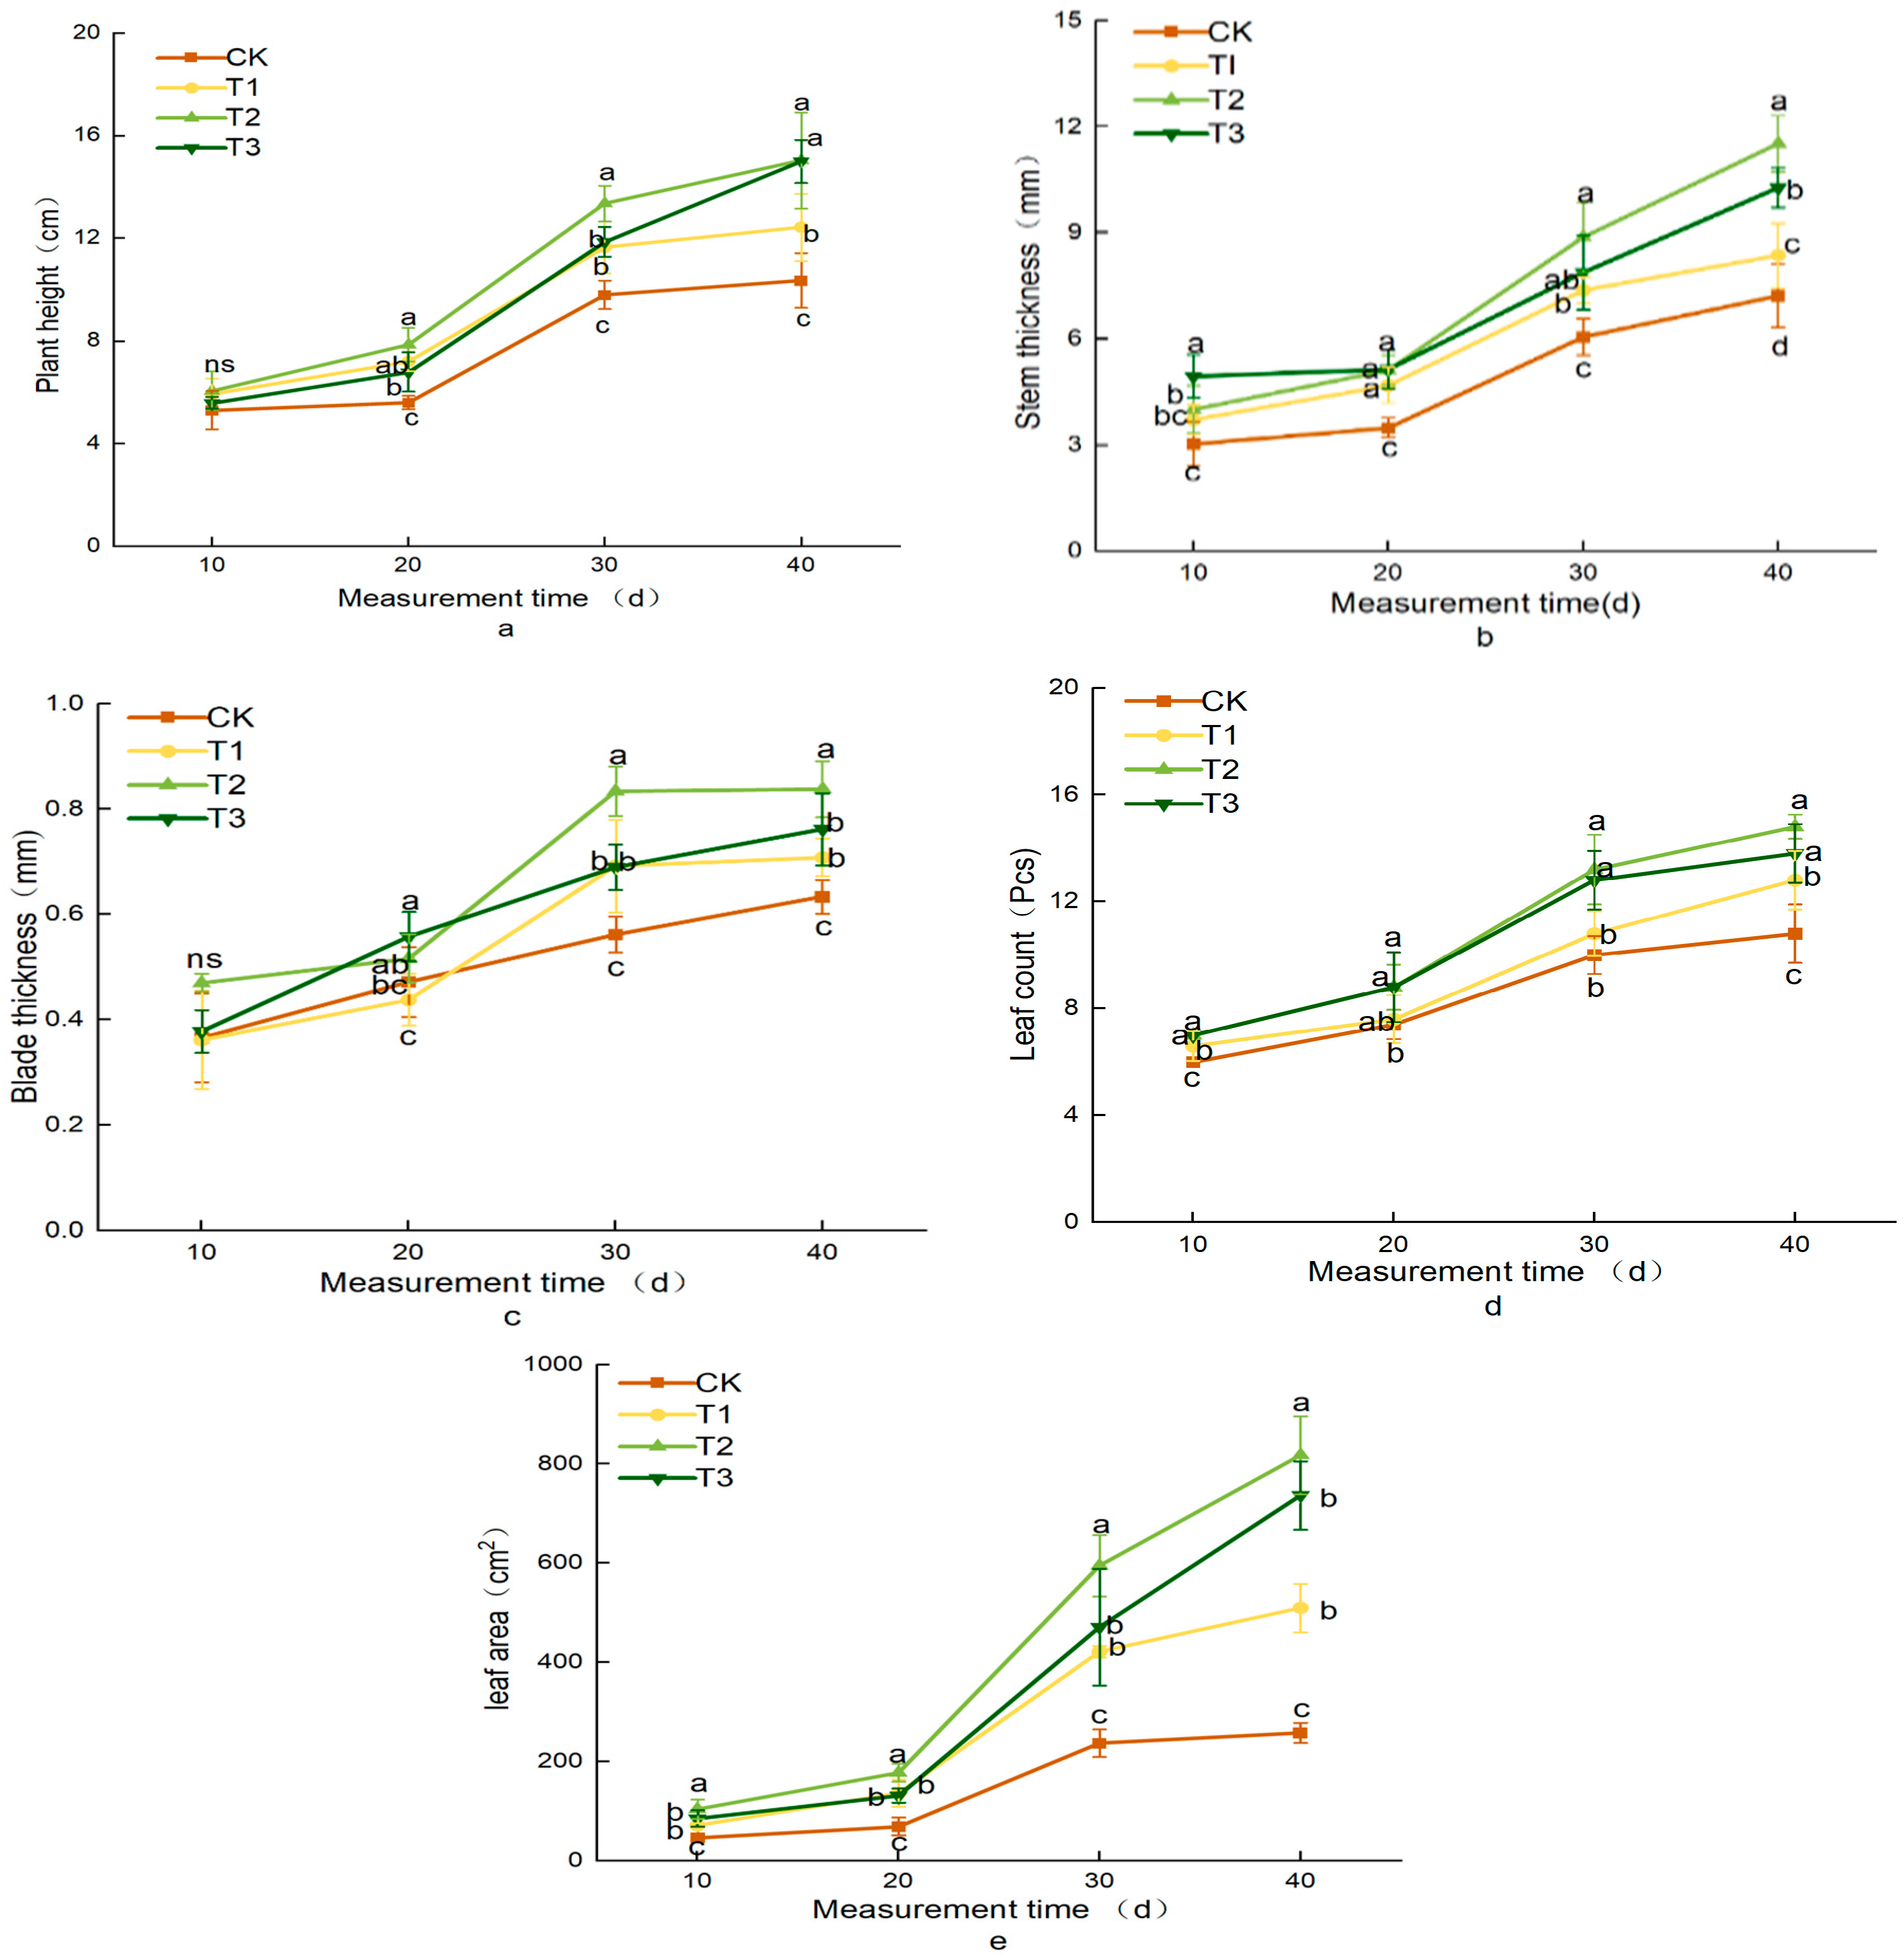
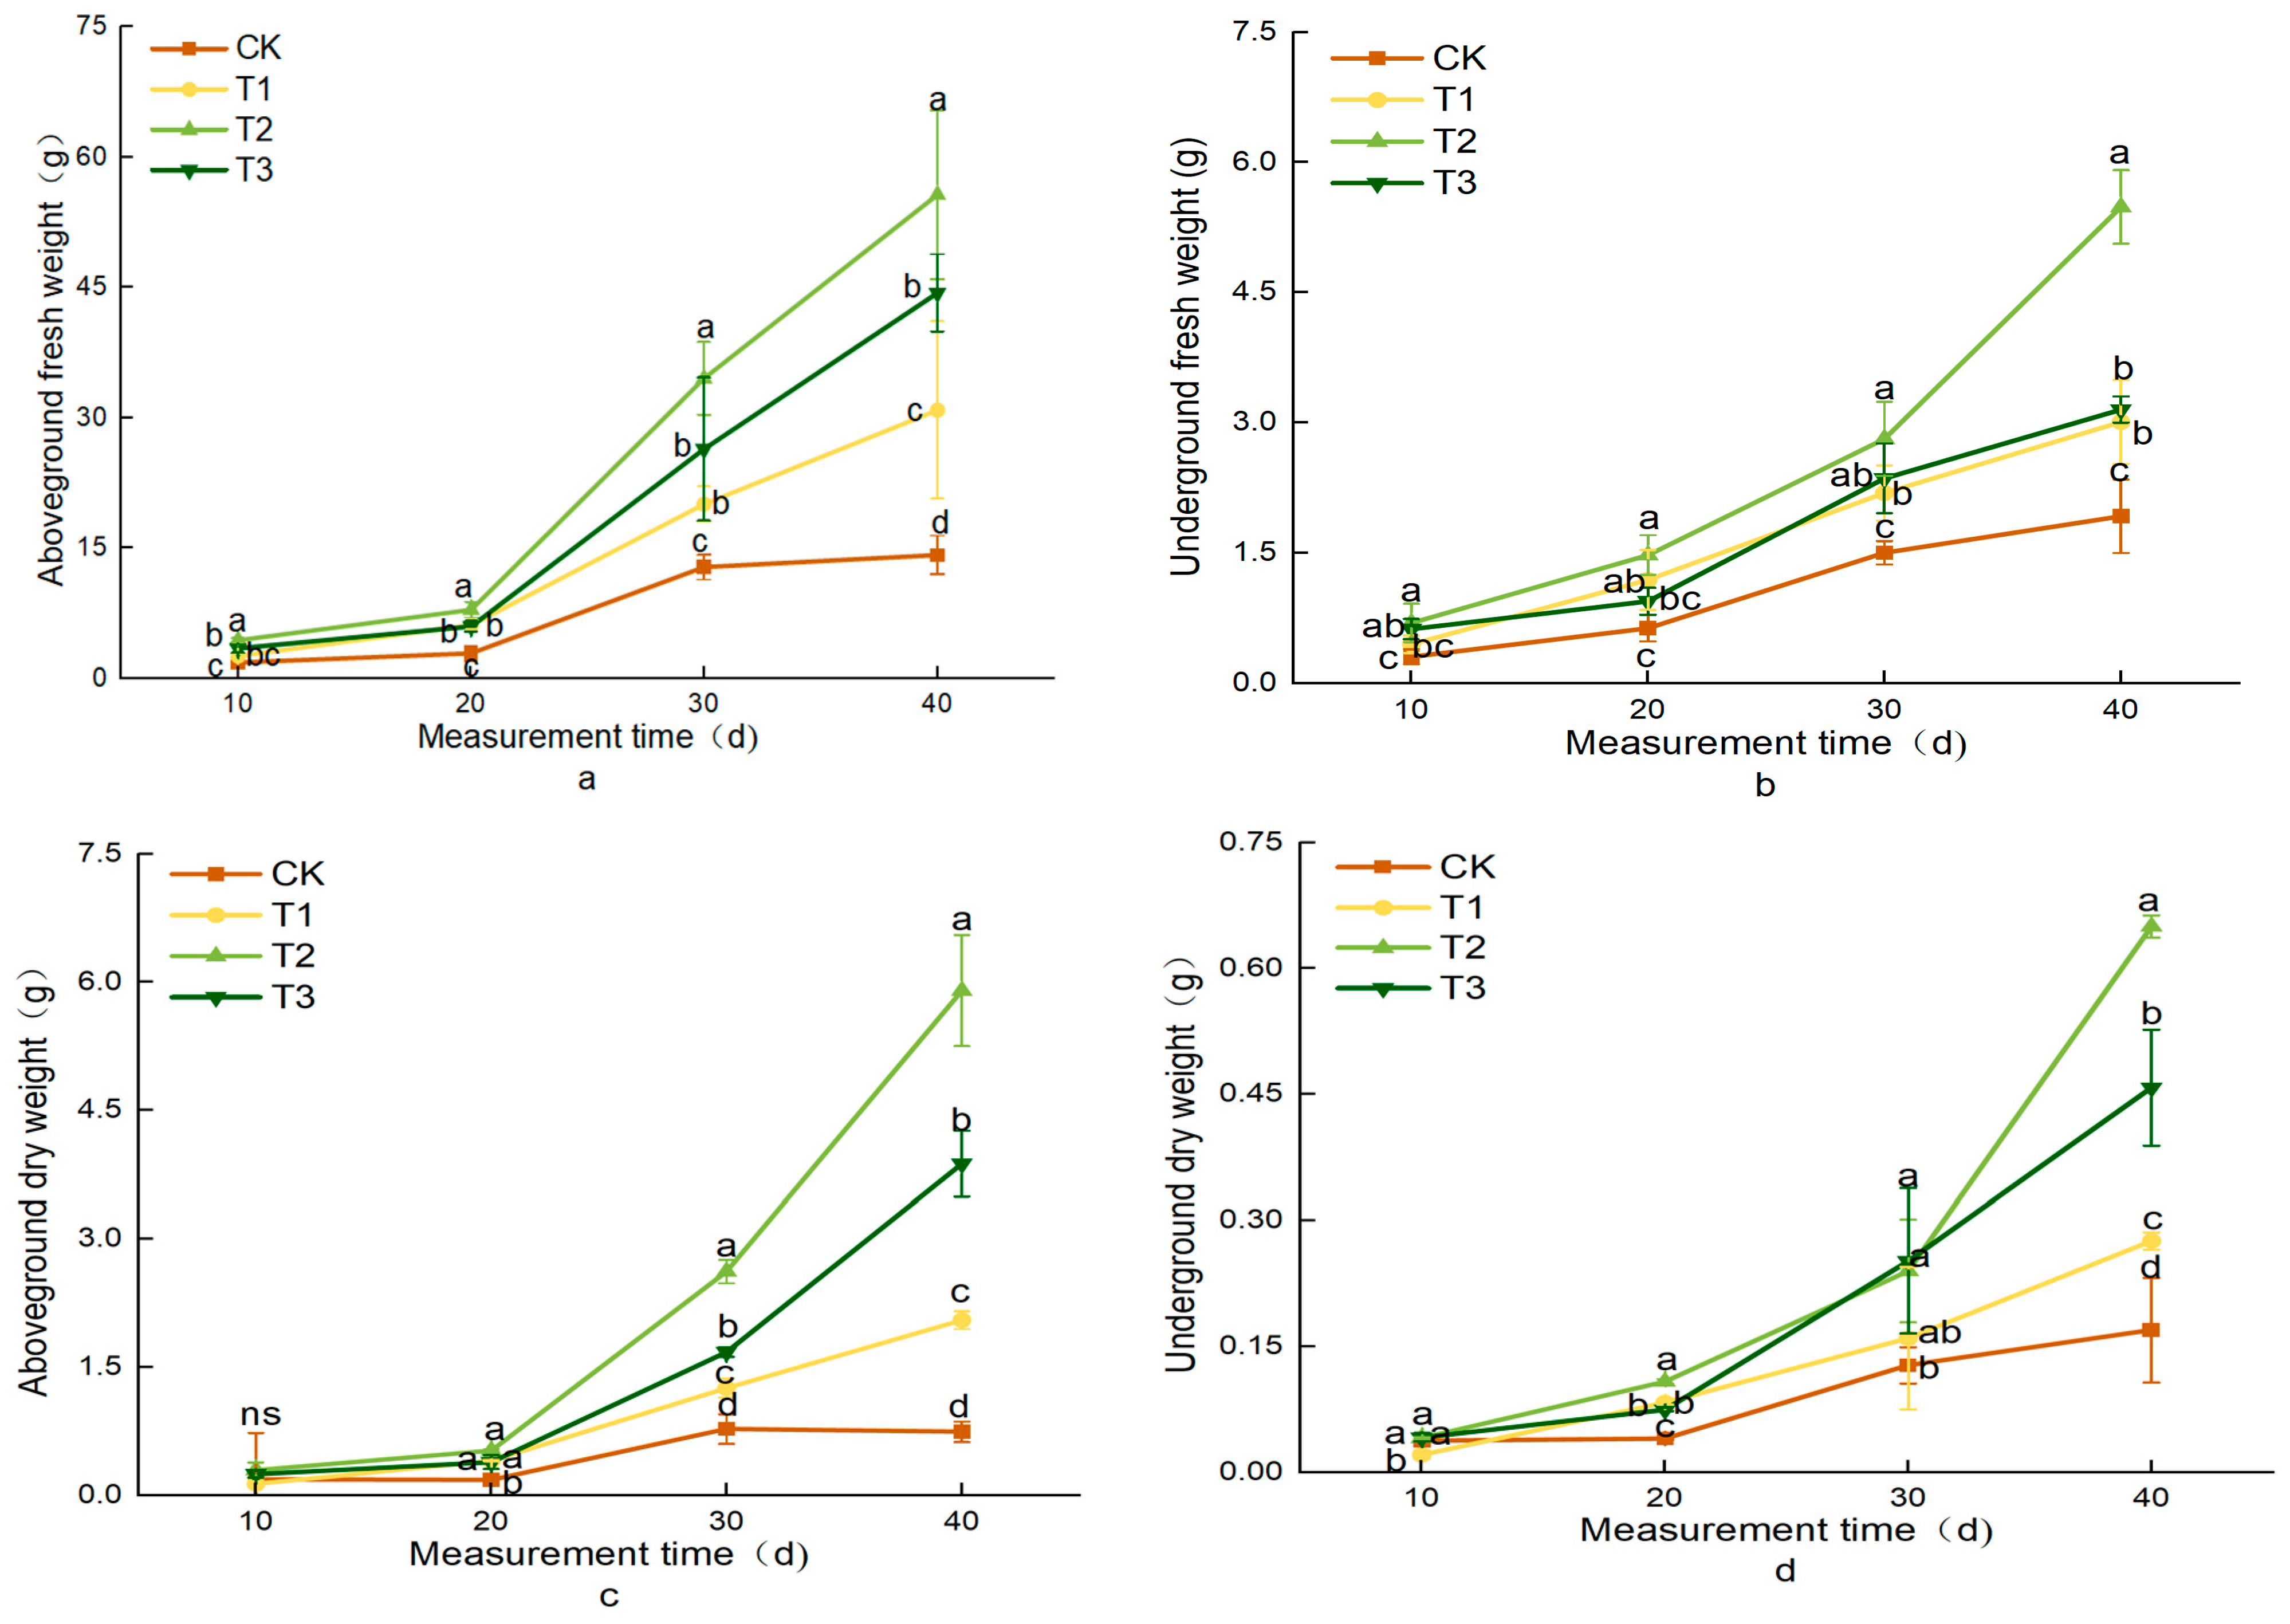
3.2. Effects of Different Treatments on Lettuce Growth Indicators

On the 40th day of supplemental lighting, the plant height and stem diameter in the T1, T2, and T3 treatments were significantly higher than those in the CK, with T2 showing the greatest increases, reaching 15.04 cm in height and 11.53 mm in stem diameter. On day 40 of supplemental lighting, the leaf thickness in T1, T2, and T3 increased significantly by 12.70%, 33.33%, and 20.63%, respectively, compared to the control. Among these, T1 and T3 showed no significant difference, but both were significantly higher than the control (CK). The number of leaves was significantly higher than in the CK for all treatments, with T2 having the most leaves, though there was no significant difference between T2 and T3 (Figure 5). The leaf area, an indicator of leaf quality and plant growth potential, varied among treatments, with that of T2 reaching as high as 817.76 cm2. No significant difference was observed between T1 and T3, but both were significantly greater than the CK. These results indicate that white LEDs supplemented with different red light wavelengths promoted increased plant height, stem diameter, leaf expansion, and leaf thickness in lettuce, with T2 being the most effective. The experiment also showed that the plant height, stem diameter, number of leaves, and leaf area increased with the duration of supplemental lighting in all treatments (Figure 5).
The fresh and dry weights of both the aboveground and underground parts of lettuce increased with the duration of supplemental lighting across different treatments (Figure 6). On day 40 of supplemental lighting for lettuce, the above-ground fresh weights of T1, T2, and T3 were significantly higher than that of CK, reaching 30.91 g, 55.67 g, and 44.39 g, respectively. The fresh weight of the roots in the T2 treatment was significantly higher than that of CK, reaching 5.49 g. There was no significant difference between T1 and T3, but both showed a substantial increase compared to the CK (Table 1). Compared to the CK, the above-ground dry weights of T1, T2, and T3 increased to 2.05 g, 5.96 g, and 3.88 g, respectively. Similarly, the below-ground dry weights of T1, T2, and T3 significantly increased compared to the CK, reaching 0.28 g, 0.65 g, and 0.46 g, respectively. These results indicate that supplemental lighting can significantly improve the photosynthetic rate and biomass accumulation, promoting lettuce root growth and facilitating nutrient transport, which, in turn, regulates photomorphogenesis and increases the fresh weight, thereby impacting the overall biomass. The T2 treatment outperformed the others, with the aboveground fresh and dry weights reaching 55.67 g and 5.90 g and the underground fresh and dry weights reaching 5.49 g and 0.65 g, respectively.

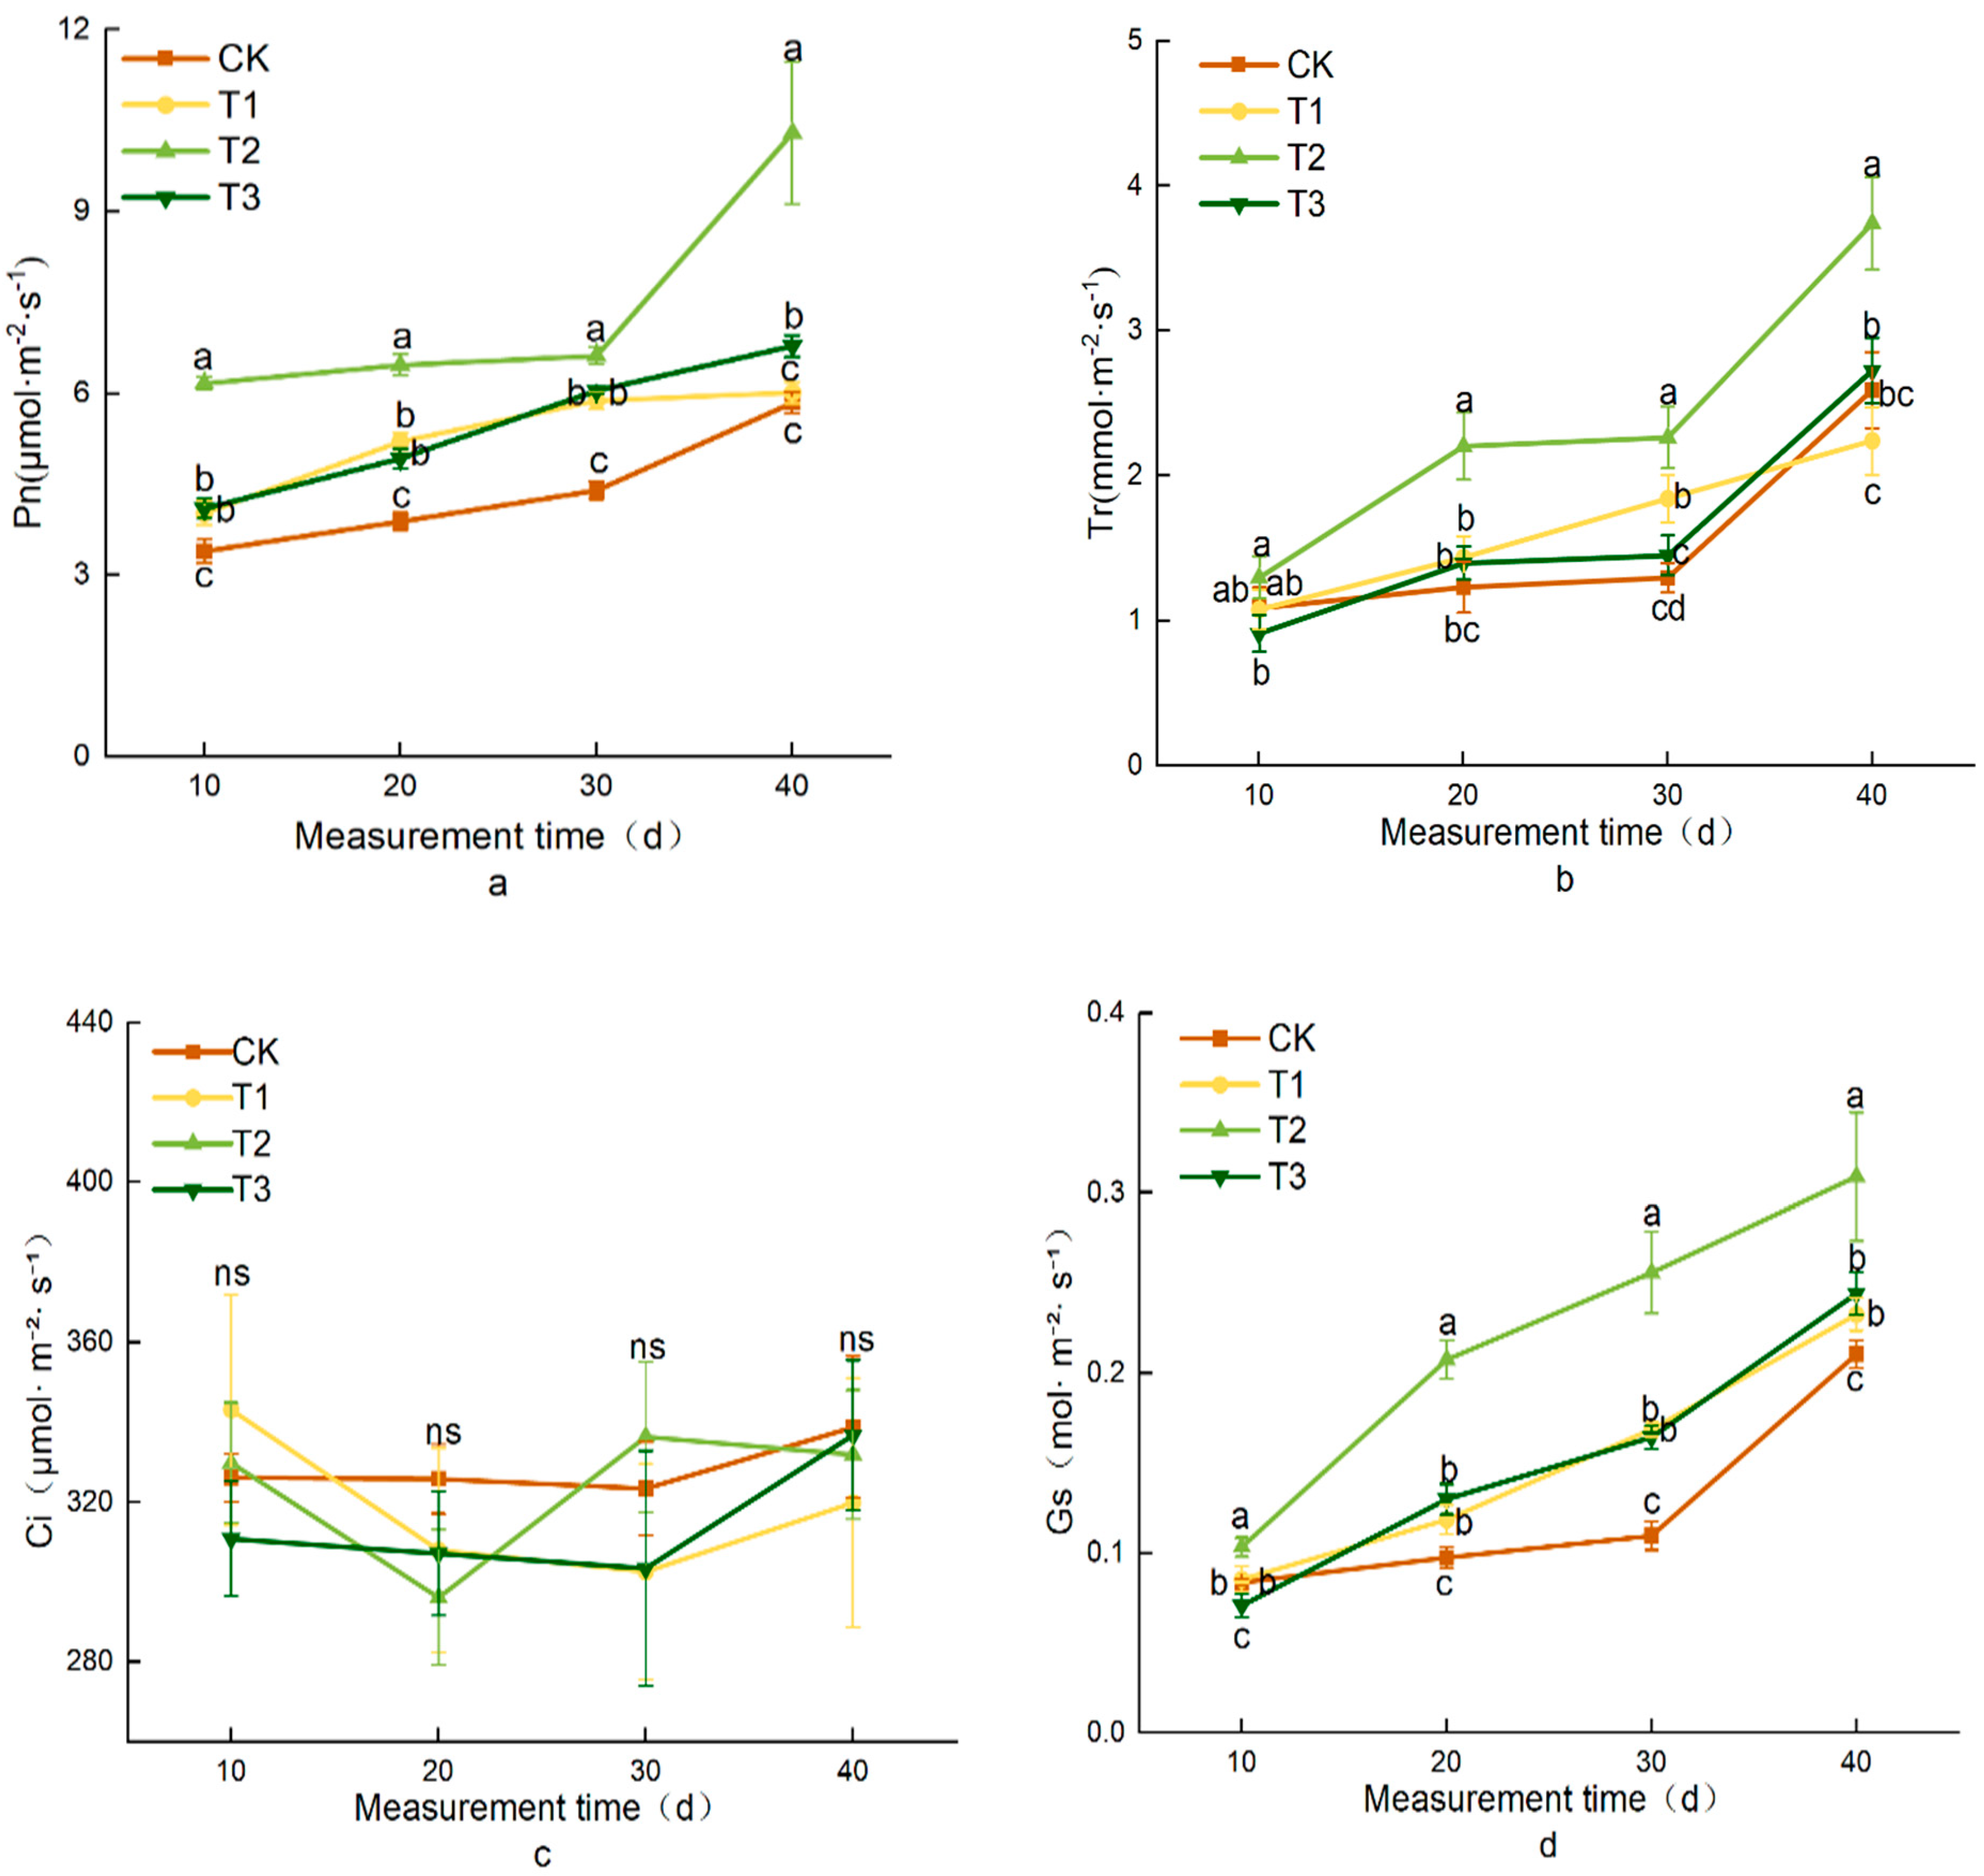
3.3. Effects of Different Treatments on Photosynthetic Characteristics of Lettuce

In the T2 treatment, the transpiration rate (Tr), net photosynthetic rate (Pn), and stomatal conductance (Gs) of lettuce increased with prolonged supplemental lighting (Figure 7). On the 40th day of supplemental lighting, the photosynthetic characteristics of T2 were higher than those of the CK. Compared to the CK, T2 showed a transpiration rate (Tr) of 3.74 mmol·m⁻2·s−1, a net photosynthetic rate (Pn) of 10.30 μmol·m⁻2·s−1, and stomatal conductance (Gs) of 0.31 mol·m⁻2·s−1. There was no significant difference in the intercellular CO2 concentration (Ci) across treatments, suggesting that variations in photosynthetic performance were attributed to non-stomatal factors, such as chloroplast function. This study revealed that supplementing white LEDs with red light improved photosynthesis, promoting leaf expansion and growth, with T2 showing significantly higher net photosynthetic and transpiration rates than T1 and T3. All three red light wavelengths enhanced photosynthetic efficiency, resulting in increased dry matter accumulation and growth, with the white LED + 660 nm red light (T2) treatment producing the strongest effect.
On the 40th day of plant growth, the CK exhibited the lowest transpiration rate and stomatal conductance, likely due to the continuous low-light environment. Under such conditions, plants need to adapt to reduced photosynthesis and maintain water balance, resulting in decreased transpiration and stomatal conductance (Table 2).

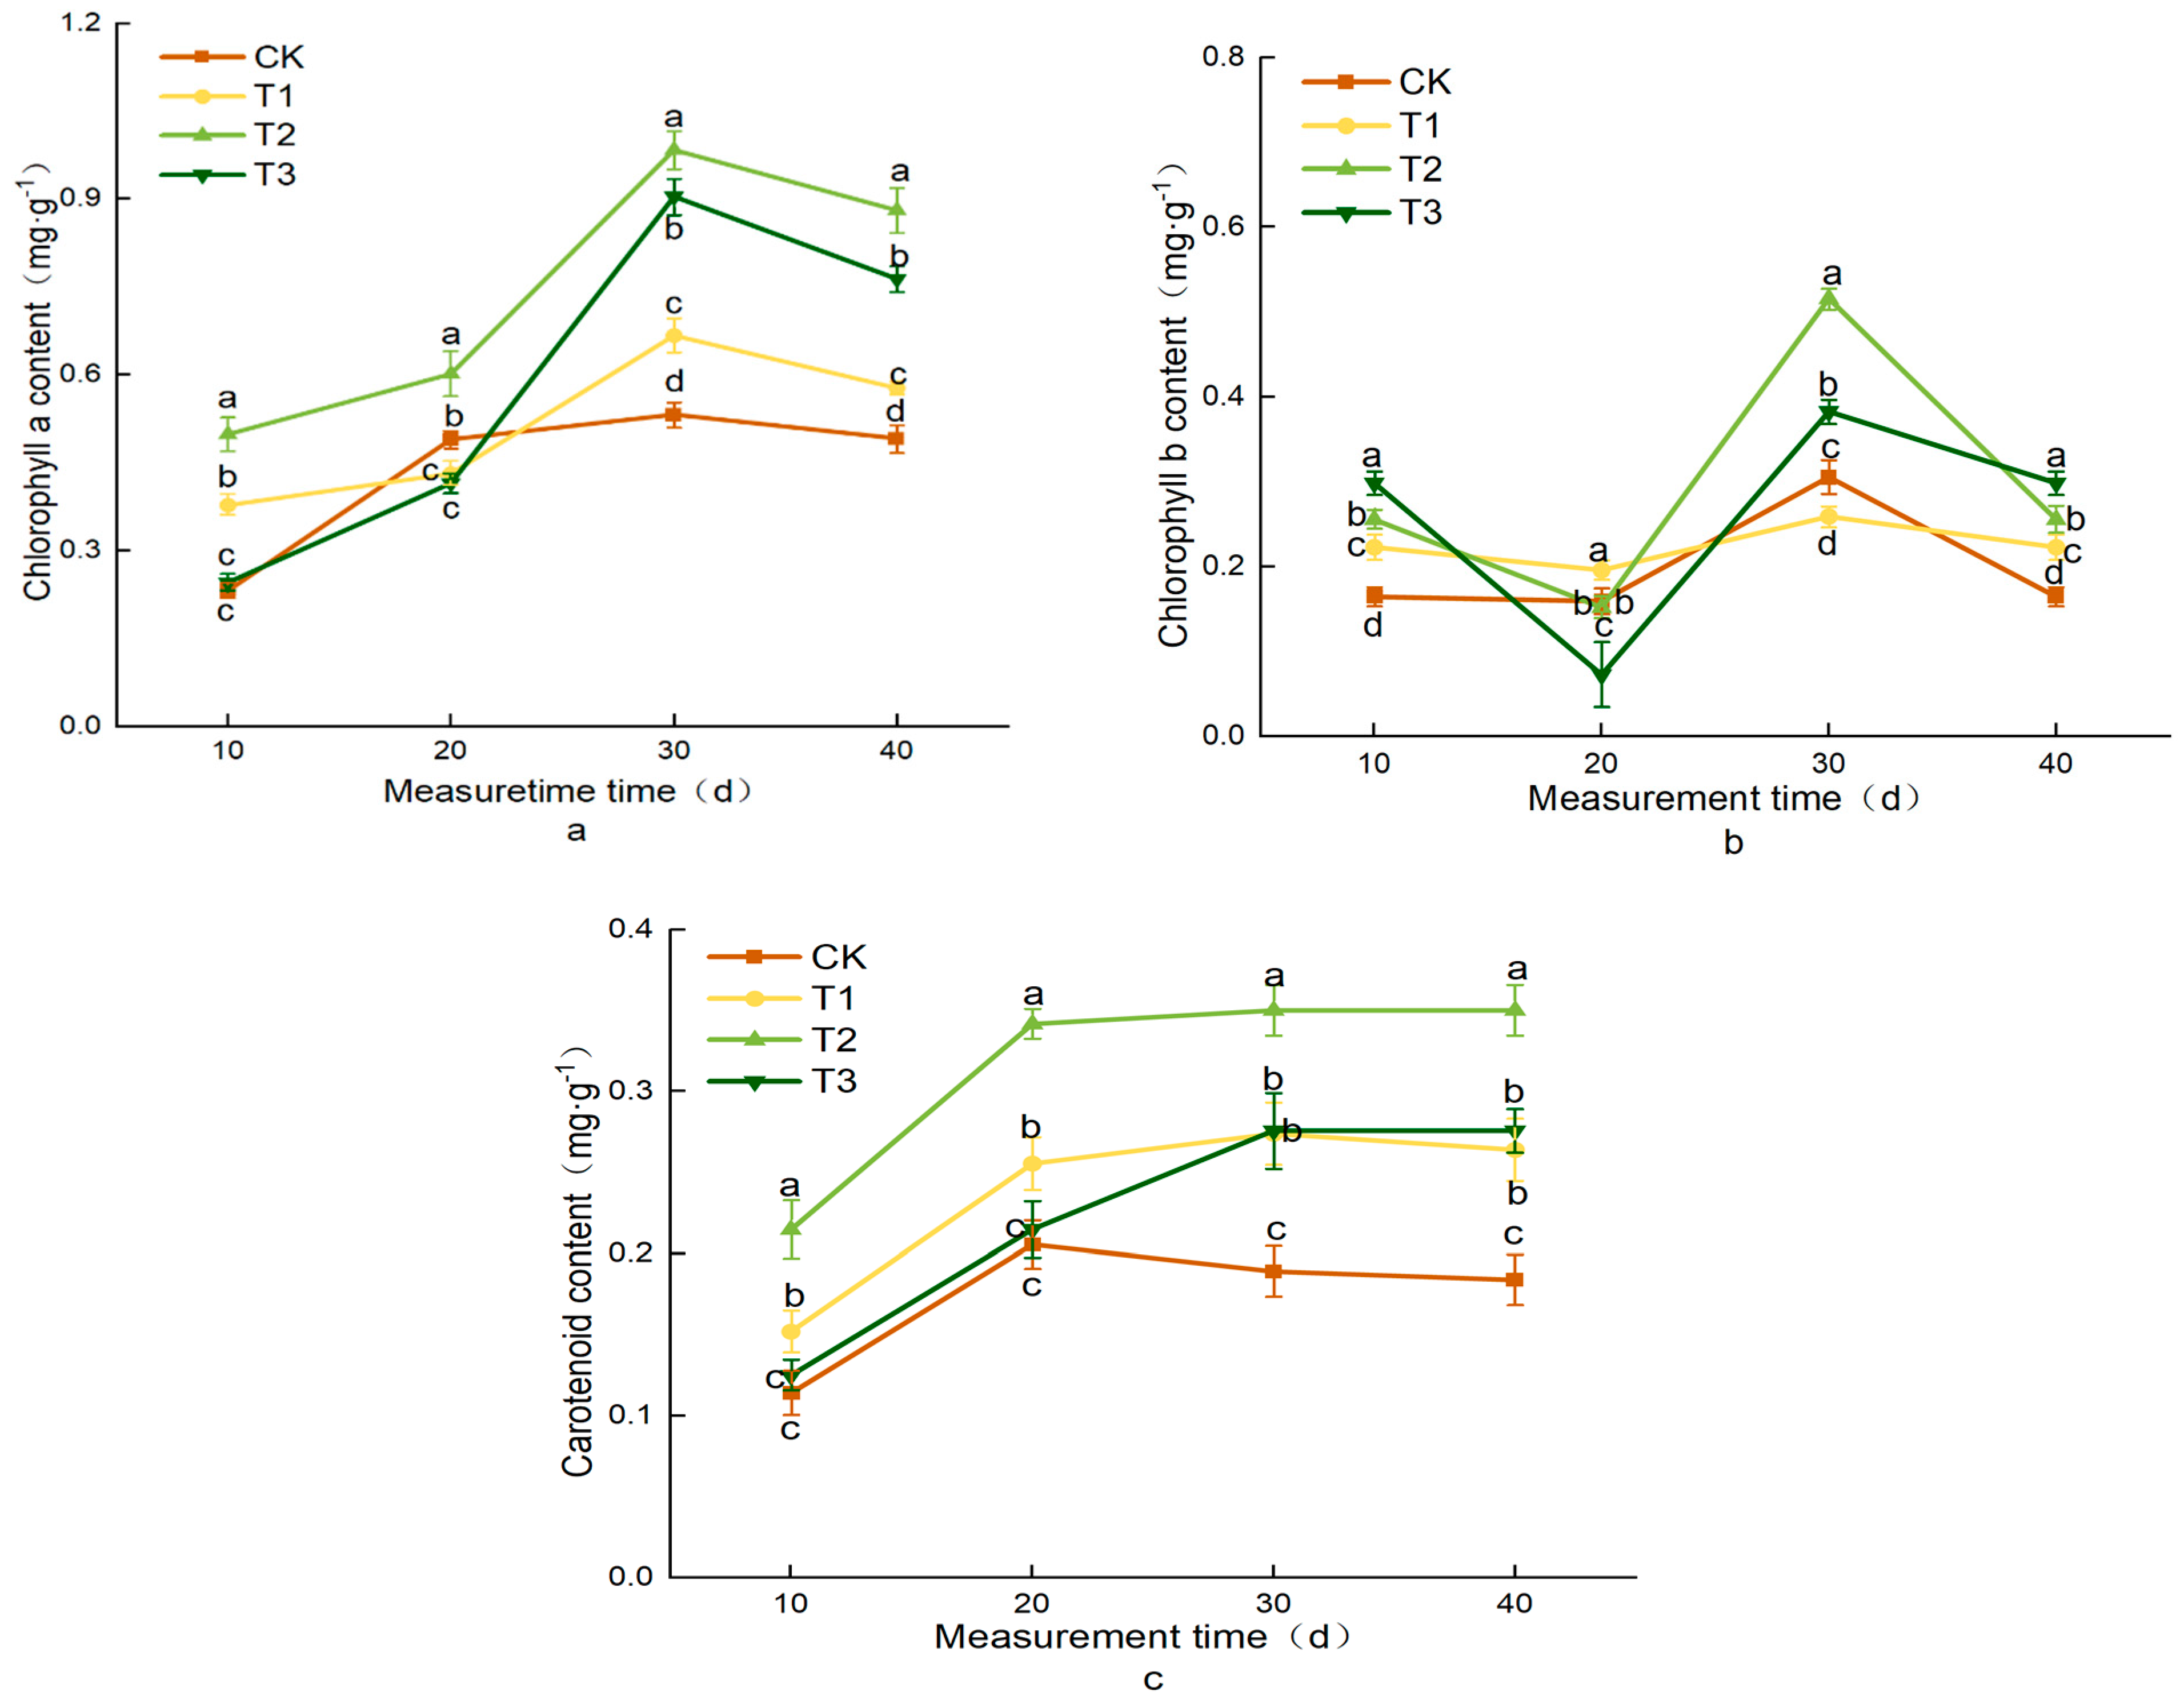
3.4. Effects of Different Treatments on Chlorophyll Content and Photosynthetic Pigments in Lettuce

On the 40th day of supplemental lighting, the chlorophyll a content in all supplemental lighting groups significantly increased, with T2 reaching the highest value at 0.88 mg/g. The chlorophyll b content also showed a significant rise compared to the CK (Table 3). The total chlorophyll content in T2 reached 1.14 mg/g, which was the most significant increase compared to the CK, followed by T3 and T1. The addition of 660 nm red light to white LEDs significantly enhanced the chlorophyll content in lettuce leaves. In terms of leaf morphology, red light delayed leaf senescence and yellowing, which was attributed to the increase in the chlorophyll content, thus improving photosynthetic efficiency and ensuring healthier plant growth. The ratio of chlorophyll a (Chl a) to chlorophyll b (Chl b) can infer the potential efficiency of photosynthesis, with the T2 treatment showing a 10.46% (Table 3) increase in this ratio compared to the CK, indicating that T2 facilitated more effective absorption of red light and enhanced the efficiency of light energy absorption and conversion in the leaves.
The carotenoid content in the T2 treatment was the highest, reaching 0.35 mg/g (Figure 8). Both T1 and T3 showed significant increases compared to the CK, though there was no significant difference between T1 and T3 (Table 3). These results suggest that the lower chlorophyll content in the CK may have been due to low light, which inhibited chlorophyll synthesis and led to the loss of chloroplast activity. The addition of red light to white LEDs in supplemental lighting increased the carotenoid content in lettuce.

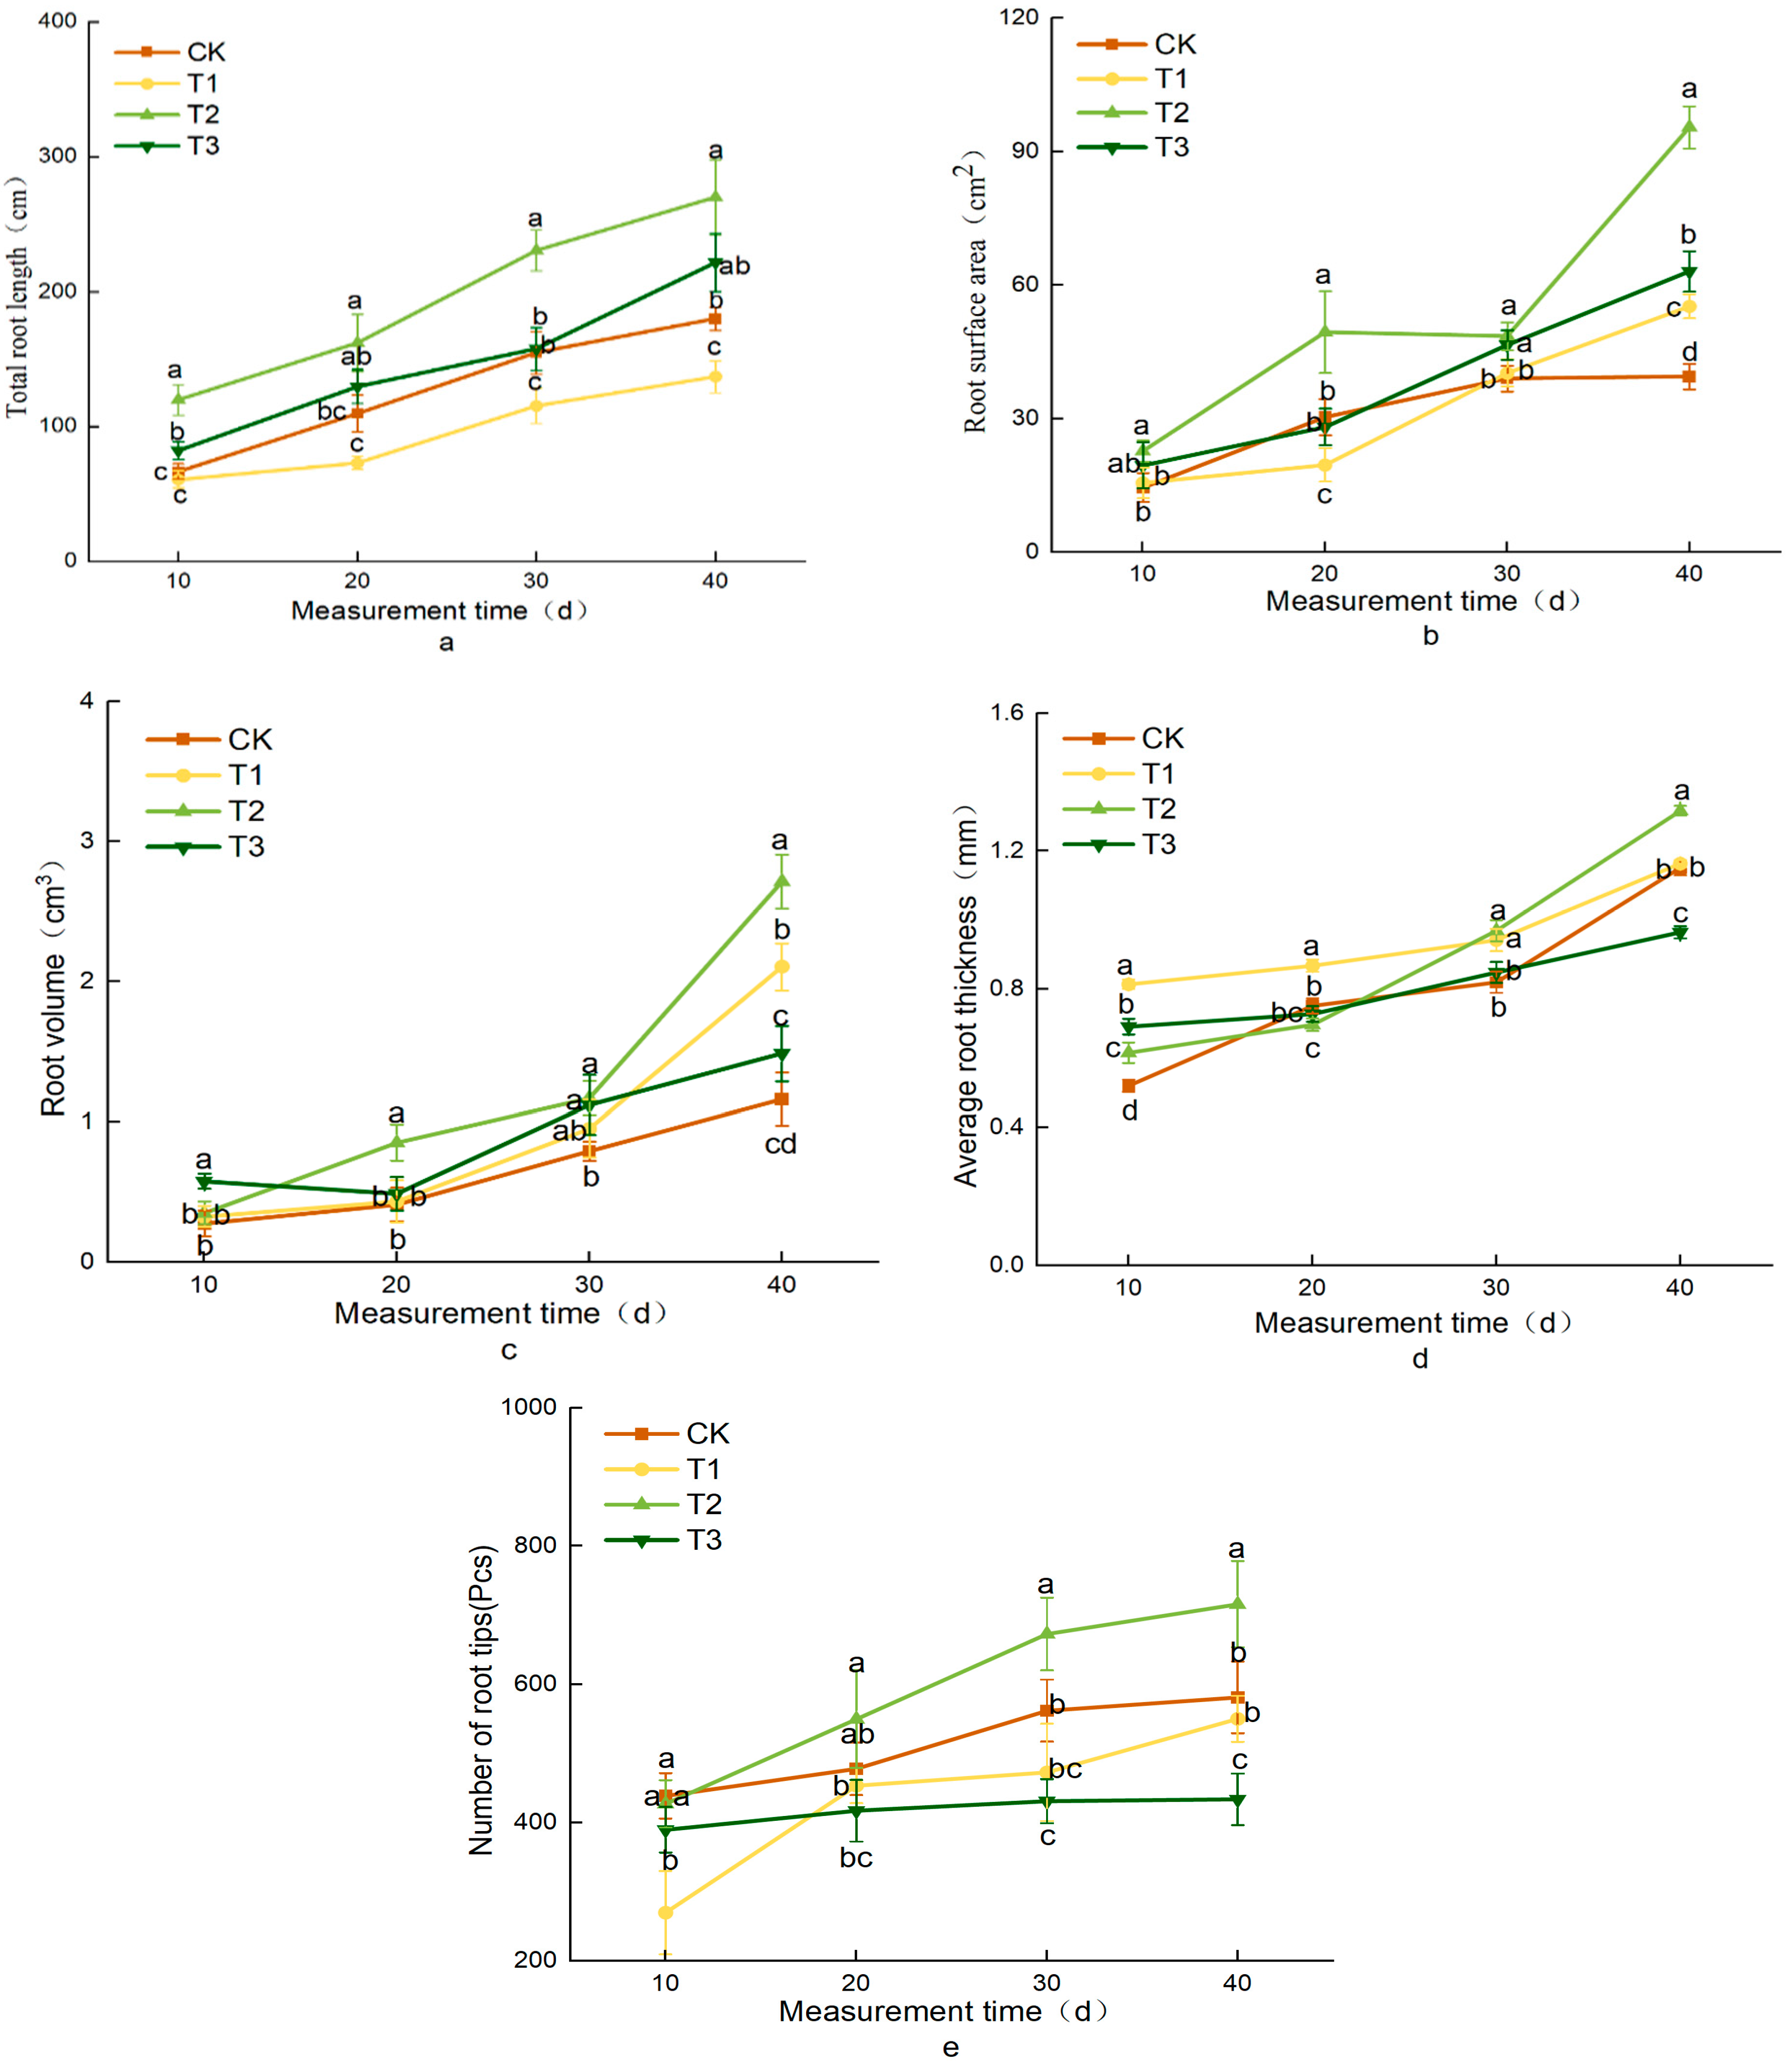
3.5. Effects of Different Treatments on Lettuce Root Traits

The results of this experiment indicate that supplemental lighting promotes root development, with root growth increasing across all treatments as the duration of supplemental lighting increased (Figure 9). On the 40th day of supplemental lighting, T2 had the longest total root length at 270.22 cm, followed by T3, with T1 being the shortest compared to the CK. The root surface area was significantly greater in all treatments than in the CK, with T2 reaching 95.45 cm2. Both T1 and T3 also showed notable increases, measuring 55.23 cm2 and 63.09 cm2, respectively. In terms of the root volume, the order from largest to smallest was T2 > T1 > T3 > CK, with T2 showing the most significant increase in the average root diameter, which increased by 14.78% compared to the CK. The number of root tips in T2 reached 716, with T3 having the fewest. These results demonstrate that the T2 treatment showed the best root morphological characteristics, indicating that supplemental lighting effectively promotes lettuce root development.

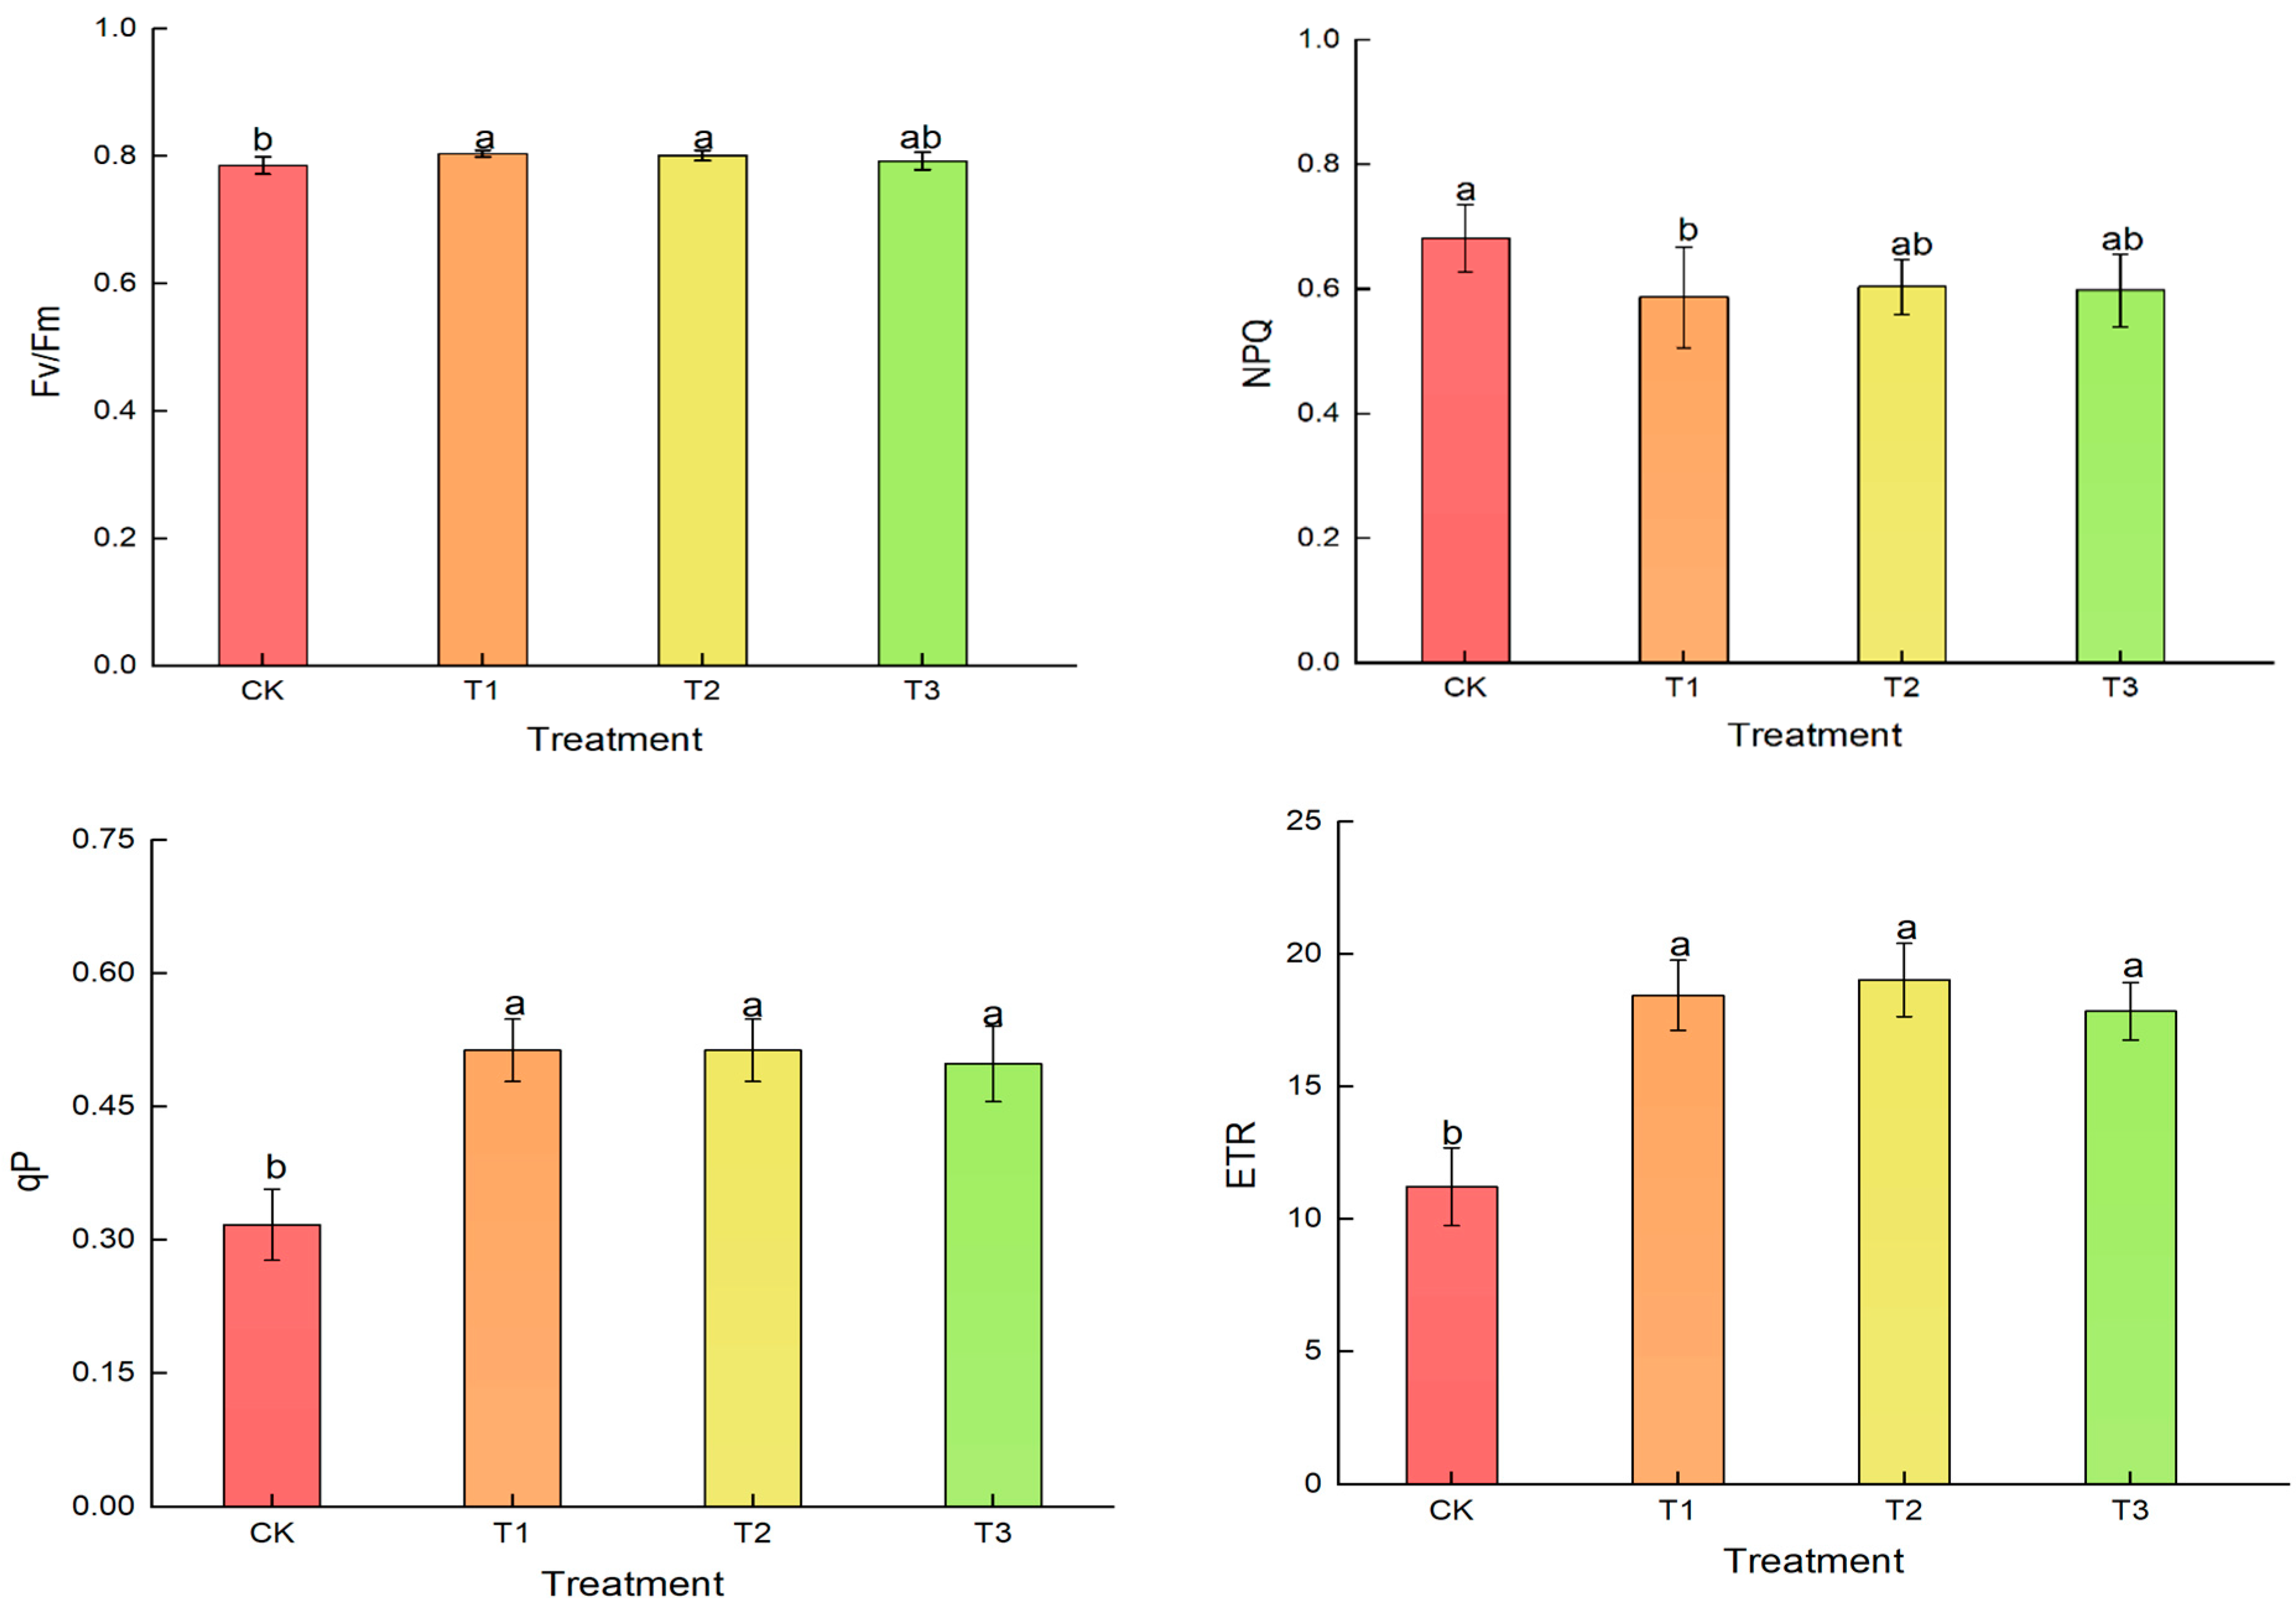
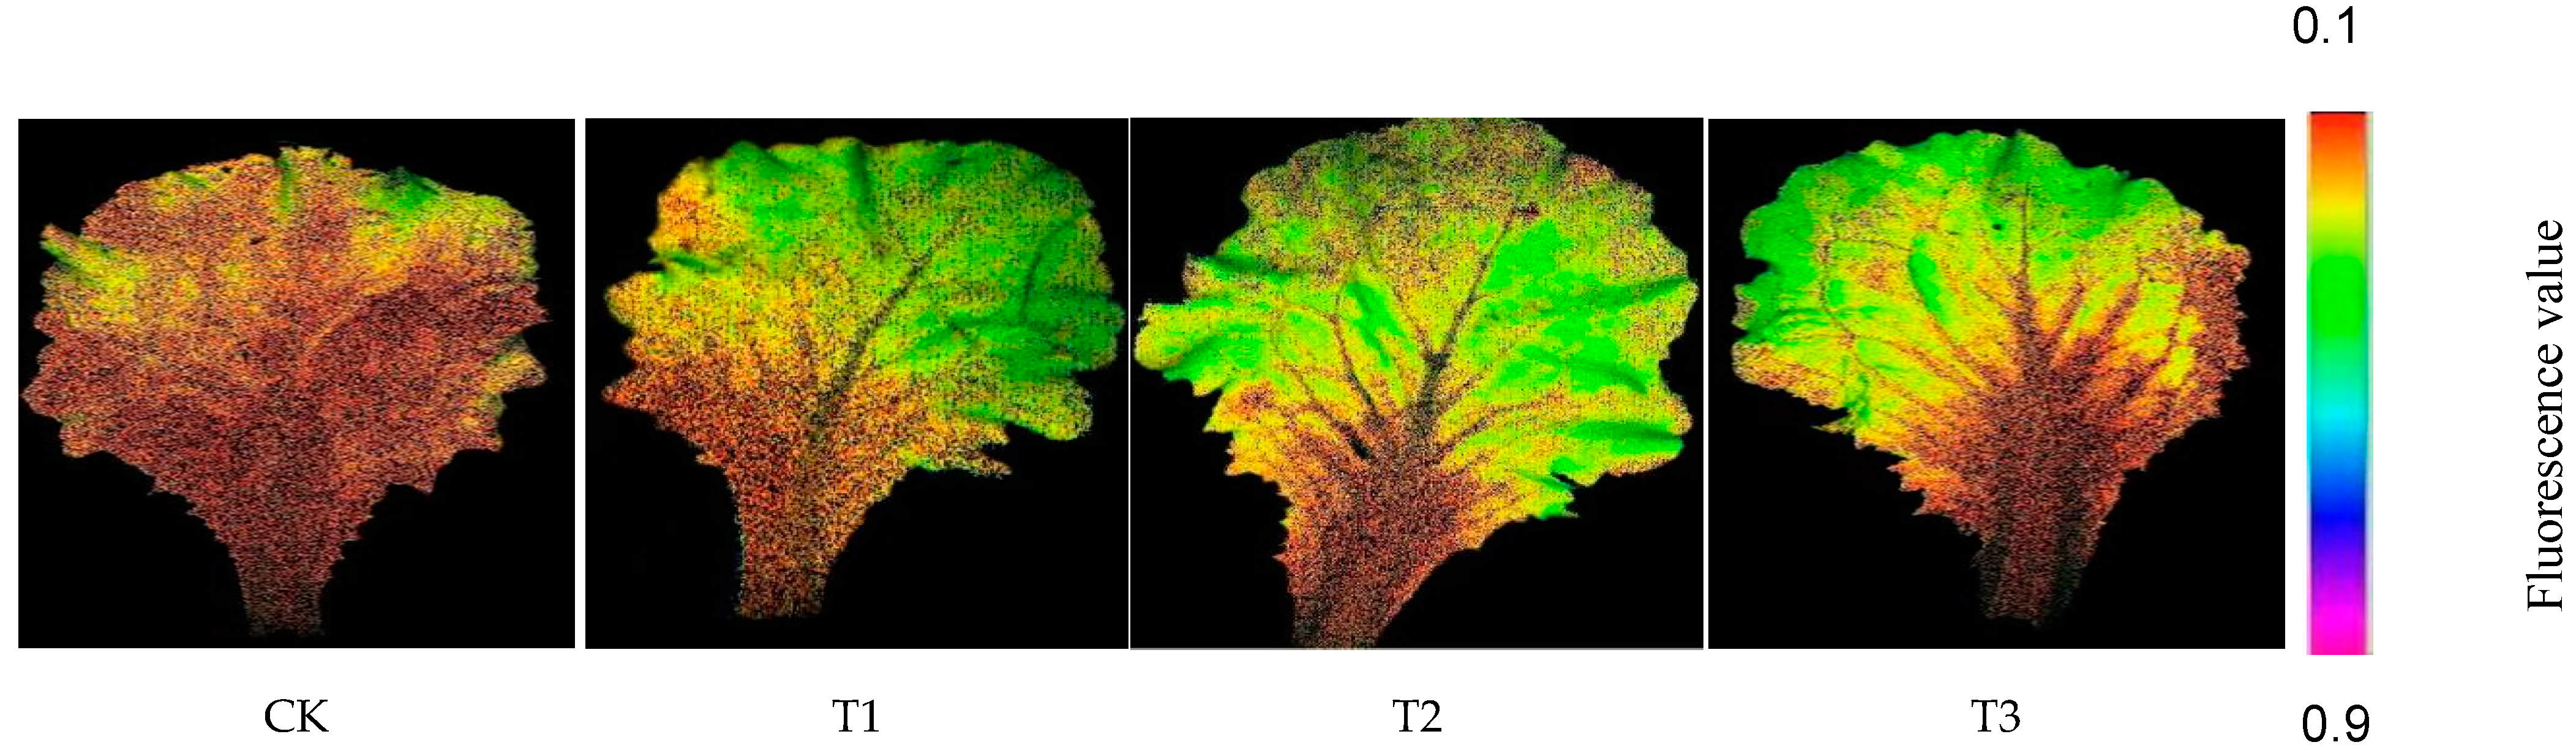
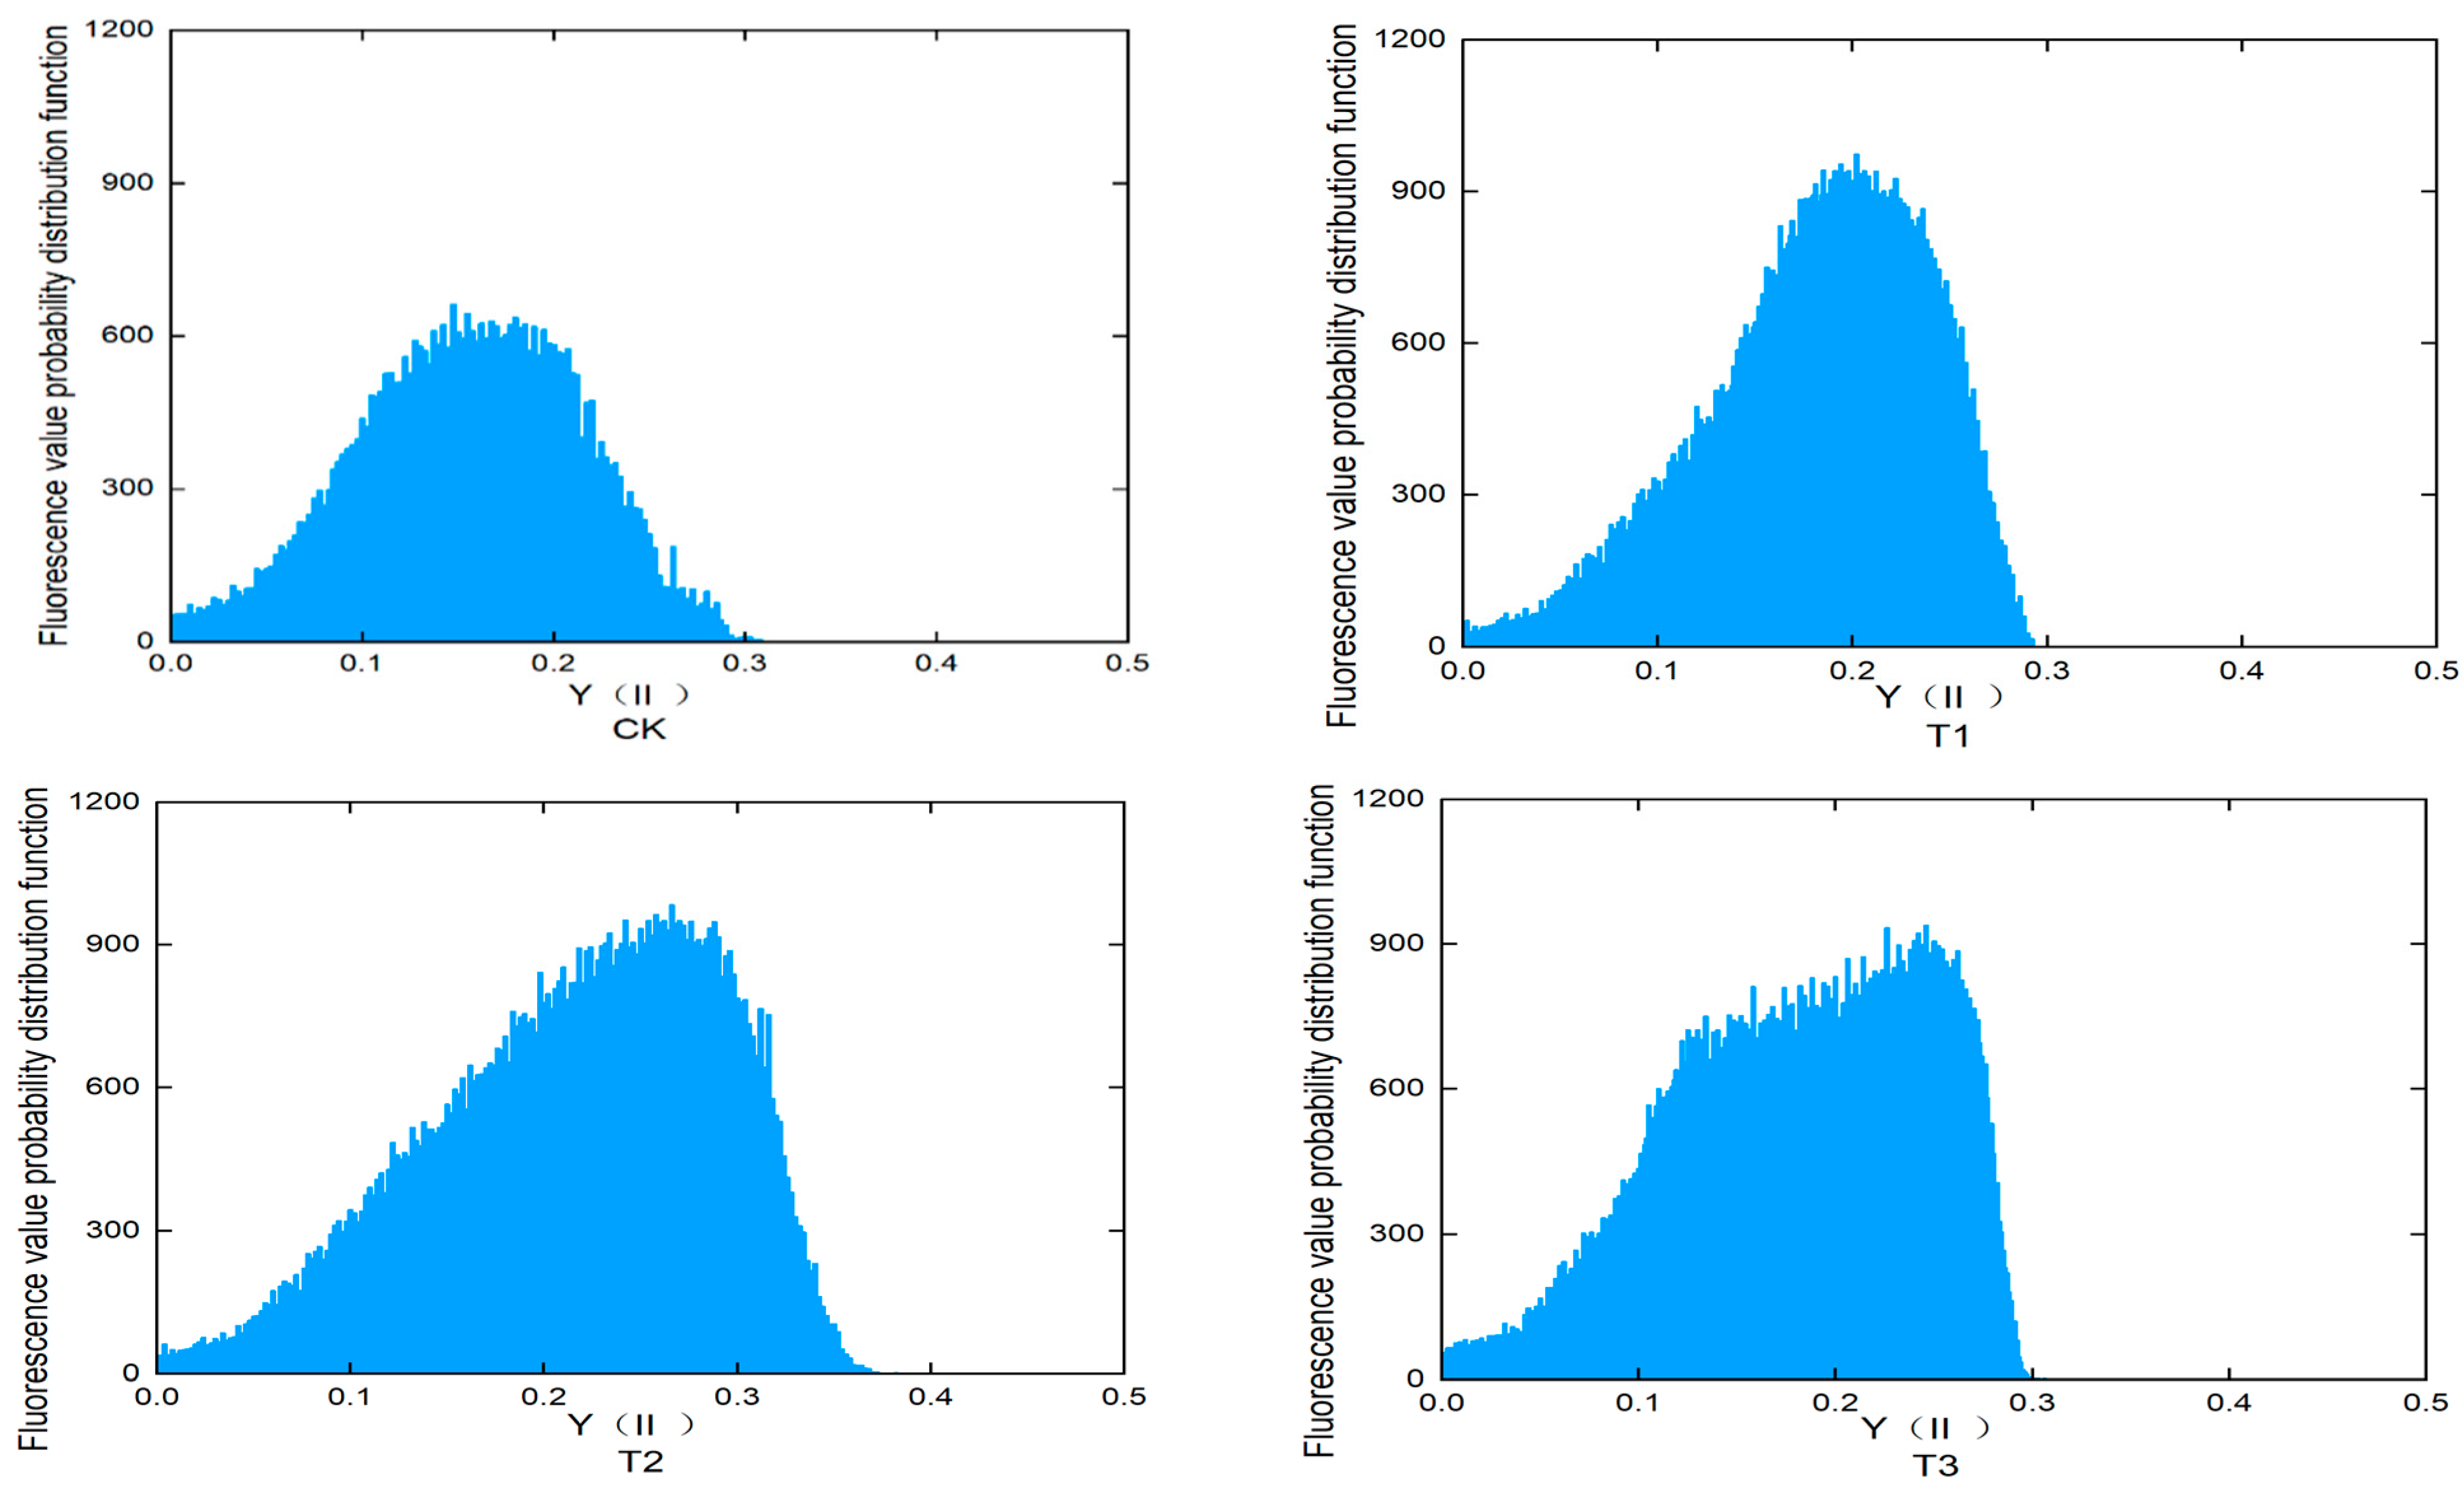
3.6. Effects of Different Treatments on Chlorophyll Fluorescence Parameters in Lettuce

By the 40th day of supplemental lighting, the ETR values in the CK treatment were significantly lower than those in T1, T2, and T3 (Figure 10), indicating that reduced light levels impaired electron transport efficiency in the PSII reaction center. This, in turn, limited the plant’s ability to fix and assimilate carbon, negatively impacting photosynthesis in the leaves. In this experiment, the qP value in the CK was also significantly lower than in the other treatments, suggesting that low-light stress significantly decreased photosynthetic efficiency (Figure 10). Under these conditions, the lettuce leaves could not fully utilize the absorbed light energy, leading to unbalanced electron transfer and excess energy accumulation. As shown in Figure 10, the NPQ values increased in the following order: T1 < T3 < T2 < CK. Higher NPQ values indicate that the plants were responding to low-light stress by actively stabilizing photosynthesis and preventing oxidative damage to PSII and other photosynthetic components. In a low-light environment, plants must balance photochemical reactions and protective mechanisms. When photochemical reactions are inhibited, as indicated by a decline in qP, plants increase their protective responses, reflected in the rise in NPQ, to safeguard the photosynthetic system from damage.
Y(II) is a key parameter for evaluating the efficiency of PSII, reflecting the energy conversion efficiency during the light reaction phase of photosynthesis. As shown in Figure 11, darker leaf colors correspond to higher Y(II) values, while lighter colors indicate lower Y(II) values. The Y(II) values in the CK were generally low, with T1 exhibiting lower Y(II) values in the root area and higher values in the leaf area. In the T2 treatment, the Y(II) values were higher in both the root and leaf areas compared to T1, while T3 also showed higher Y(II) values in the leaves than T1. Overall, the Y(II) values in T1, T2, and T3 were higher than that in the CK, indicating that the CK leaves were under low-light stress. Among the treatments, T2 displayed the best leaf condition, as chlorophyll a and b (Chl a and Chl b) have peak absorption at 660 nm, allowing 660 nm red light to more effectively stimulate photosynthesis and significantly enhance PSII electron transport efficiency, thereby increasing the accumulation of photosynthetic products.
To visualize this difference, Figure 12 presents a fluorescence histogram of Y(II). The x-axis represents Y(II) values ranging from 0 to 0.5, while the y-axis shows the frequency of these values. In the CK treatment, the peak Y(II) value was 0.147, and the distribution was relatively flat, indicating low photochemical efficiency under weak light stress and inhibited photosynthesis. The T1 treatment had a peak value of 0.202, with a more concentrated distribution compared to the CK, but the effect was not as pronounced as with 660 nm red light. The T2 treatment had the highest peak at 0.266, as 660 nm red light is one of the most effective spectra for photosynthesis, significantly enhancing PSII activity and improving photosynthetic efficiency, resulting in higher Y(II) photochemical efficiency. The T3 treatment peaked at 0.246; although 690 nm red light is also within the red light range, its effect was slightly less pronounced than 660 nm, leading to a less significant improvement in photosynthetic efficiency. Compared to the CK, the Y(II) values in T1, T2, and T3 were significantly higher, and the frequency of these values was notably more concentrated, indicating improved photosynthetic efficiency in these treatments.

4. Discussion

This study examined the effects of white LED combined with 630 nm, 660 nm, and 690 nm red light spectra on the growth and development of lettuce in winter greenhouse conditions. The results show that white LED combined with 660 nm red light was the most effective in promoting lettuce growth.
Previous research has shown that supplemental red LED light can greatly enhance plant biomass, leaf area, and leaf length while also boosting photosynthetic efficiency and leaf thickness, ultimately promoting overall plant growth [41,42,43]. Supplementing with red LED light in the morning can pre-activate the photosynthetic system, boost chlorophyll and carotenoid levels, encourage dry matter accumulation, and stimulate root development [44]. Red–blue LED combination lighting has been shown to more efficiently promote plant growth, enhance the accumulation of secondary metabolites, boost photosynthetic efficiency, and contribute to higher yields and improved nutritional value [45]. These combined effects promote better plant growth and higher yields [46,47].
Selecting the appropriate red light spectrum can influence plant growth and development, though studies on the distinct impacts of various red light spectra on lettuce are limited. Gaining insights into these effects is essential for optimizing crop production in controlled environments like greenhouses.
The addition of 630 nm, 660 nm, and 690 nm red light to white LEDs significantly increased the chlorophyll content in lettuce leaves, thereby enhancing photosynthesis efficiency, dry matter accumulation, and root growth. The results show that, compared to the CK, red light in T1, T2, and T3 had a significant impact on root development, with T2 performing the best. This is because 660 nm red light can activate the phytochrome (PHY), which regulates root development through light signal transduction pathways, promoting primary root elongation and lateral root formation. Additionally, 660 nm red light increases auxin synthesis and accumulation, further promoting root hair and adventitious root formation [48,49]. Although 630 nm red light also has a promotive effect, its absorption peak does not fully align with the optimal range for photosystem II (PSII), resulting in lower photon absorption efficiency compared to 660 nm. Therefore, the overall promotion of photosynthesis and root growth by 630 nm red light was less significant than that of 660 nm [50].
Both 660 nm and 690 nm red light significantly promoted root morphology and enhanced root cell division and elongation, thus increasing the overall growth capacity of the roots. However, 660 nm red light, which matches the absorption peak of PSII more closely, was more effective in stimulating photosystem activity, improving photosynthesis efficiency, and promoting root cell division and elongation. Although 690 nm red light also had a positive effect, its lower photon energy resulted in less efficient PSII excitation, leading to a weaker overall effect compared to 660 nm red light [51]. As a result, root development in T2 and T3 was superior to that in T1, with both treatments significantly outperforming the CK. In conclusion, red light promotes root growth and branching through multiple mechanisms, including light signal transduction, hormone regulation, and compound accumulation, which, in turn, promote stem and leaf elongation and increase the total biomass of lettuce [52,53].
Unlike previous studies, this experiment showed that white LED ensured a balanced spectrum for plant growth, while the addition of 630 nm, 660 nm, and 690 nm red light significantly affected plant growth indicators such as the plant height, stem diameter, leaf area, and fresh and dry weights. The results indicate that the T2 treatment significantly improved the plant height, stem diameter, photosynthetic characteristics, root parameters, and chlorophyll fluorescence compared to T1 and T3. This may be due to the high efficiency of 660 nm red light, which is highly absorbed by chlorophyll and phytochromes. Plants adjust their internal pigment composition, increasing the chlorophyll content and optimizing light capture and utilization, which enhance photosynthesis efficiency and promote biomass accumulation. In contrast, although 630 nm and 690 nm red light also promoted plant growth, their effects were less pronounced than 660 nm. This variation is mainly attributed to the fact that 660 nm red light aligns more closely with the absorption peaks of chlorophyll a and b, making it more effective in driving the photochemical reactions of PSII [54].
Chlorophyll a (Chl a) has a significant absorption peak at 660 nm, allowing 660 nm red light to more effectively drive photosynthesis, increasing the maximum quantum yield of PSII (Fv/Fm) and the electron transport rate (ETR) [54]. Although 630 nm red light can excite PSII, its effect is weaker compared to 660 nm due to its lower photon energy and suboptimal match with the PSII absorption peak. Similarly, the photon energy of 690 nm light is lower, resulting in weaker efficiency in driving PSII photochemical reactions. This difference in efficiency led to relatively weaker effects of 630 nm and 690 nm red light on enhancing photosynthesis and promoting plant growth [55].
Fv/Fm is a key chlorophyll fluorescence parameter that represents the maximum photochemical efficiency of PSII. This study found that the Fv/Fm values of T1, T2, and T3 remained within the normal range after supplemental lighting (Figure 10), while the CK values decreased, indicating that the CK plants experienced slight low-light stress. This suggests that T1, T2, and T3 all alleviated low-light stress, with T1 and T2 showing better results than T3. Both 630 nm and 660 nm red light promoted the opening of the PSII reaction center, enhancing light energy utilization and maintaining higher photosynthetic activity. The qP parameter reflects the openness of the PSII reaction center, and red light wavelengths can affect qP values [56]. In this experiment, the qP values in T1 and T2 were significantly higher than in the CK, though there was no significant difference between T1 and T2.
Y(II) indicates the efficiency of light energy utilization for photochemical reactions in PSII. The lowest Y(II) value was recorded in CK, likely due to reduced photon input under low-light conditions, limiting the energy available for PSII and thereby decreasing photochemical efficiency. Among the treatments, T2 exhibited the highest Y(II) value, surpassing both T1 and T3. This variation is due to plants absorbing and utilizing different light wavelengths with varying efficiencies. Chlorophyll absorbs light most efficiently at 660 nm, making this value the most effective for PSII excitation. In contrast, 630 nm red light had a lesser effect, as it only partially activated phytochrome B to enhance photosynthesis efficiency. The lower Y(II) value observed with 690 nm red light reflects its reduced absorption efficiency [57]. Supplemental lighting also regulates non-photochemical quenching (NPQ), which dissipates excess light energy as heat to protect the photosystem. The results of this study indicate that the NPQ values in the supplemental lighting groups were significantly lower than those in the control (CK). This is because supplemental lighting enhanced the photochemical efficiency of plants, promoting the rapid conversion of light energy into chemical energy. With more efficient utilization of photochemical reactions, the plants relied less on heat dissipation via NPQ, resulting in significantly reduced NPQ values. In contrast, the NPQ values in the control (CK) were significantly higher than those in the supplemental lighting groups. This suggests that in low-light environments, the photochemical efficiency of plants decreases, leading to reduced light energy utilization. When the absorbed light energy cannot be fully utilized, the excess energy is dissipated as heat. Consequently, plants activate protective mechanisms (increased NPQ) to maintain the stability of the photosystem.

5. Conclusions and Prospects

This study highlights the effects of combining white LEDs with red light spectra (peaks at 630 nm, 660 nm, and 690 nm) on lettuce growth in winter solar greenhouses, offering significant implications for controlled environment agriculture. The combination of white LEDs with 660 nm red light demonstrated the most pronounced effects, as this wavelength aligns closely with chlorophyll and phytochrome absorption peaks, optimizing photosynthesis and photomorphogenesis. Chlorophyll fluorescence imaging confirmed enhanced photosynthetic rates under this spectral combination. However, the underlying mechanisms and pathways require further investigation.
Although this study was conducted in winter solar greenhouses in Jilin Province, the findings may not be fully applicable to other regions or seasons. Future studies should explore the effects of supplemental lighting across different growth stages and environmental conditions to validate these results and identify optimal spectral combinations.
Economically, the spectral combination used is viable. White LEDs were cost-effective, and 660 nm red LEDs, though slightly more expensive, increased manufacturing costs by only 3% and energy consumption by approximately 5%. While this study partially addressed energy consumption, future research should include detailed cost–benefit analyses, focusing on energy efficiency, economic feasibility, and resource optimization to promote sustainable agricultural practices.

Author Contributions

J.Q. (Jianlei Qiao) revised the manuscript title and contributed to the experimental design and implementation, particularly in setting up the supplemental lighting system and monitoring environmental parameters; provided essential support for data collection and analysis; and participated in the discussion of the research findings. W.H. played a key role throughout the entire research process, including experiment execution, overseeing the setup of the supplemental lighting system, data collection and environmental monitoring; contributed extensively to data analysis and interpretation; and drafted the manuscript and carried out multiple revisions, ultimately finalizing the submission. S.C. provided analytical support for physiological data; assisted in various experimental measurements; participated in writing sections of the manuscript; and contributed to the data discussions, particularly those related to photosynthesis. H.C. led the design and implementation of the photosynthesis-related experiments, especially those measuring the photosynthetic rate and chlorophyll content; analyzed and interpreted photosynthesis data; and contributed to the writing of the Results Section. J.Q. (Jiangtao Qi) assisted in collecting and organizing data related to light intensity and environmental conditions, ensuring the smooth operation of the experimental setup. Y.Y. was responsible for measuring and recording growth indices, such as the plant height, leaf area, and fresh weight, and played a vital role in data collection and organization, ensuring the accuracy of the experimental results. S.L. provided technical support during the supplemental lighting experiment, including the installation, calibration, and maintenance of the experimental equipment. J.W. designed the experimental framework and oversaw the overall planning and direction of the study; provided critical support for data analysis and interpretation; and conducted a comprehensive review and revision of the final manuscript. All authors have read and agreed to the published version of the manuscript.

Funding

This research was funded by the Yunnan Science and Technology Talent and Platform Program (Academician and Expert Workstation), grant number 202405AF140119; the Jilin Provincial Key Laboratory of Facility Vegetables, fund number YDZJ202102CXJD042; the Scientific Research Project of Jilin Provincial Department of Education, project number JJKH20230403KJ; and the Jilin Province Youth Science and Technology Talent Support Project, project number QT202310.

Data Availability Statement

The original contributions presented in the study are included in the article, further inquiries can be directed to the corresponding author.

Conflicts of Interest

The authors declare no conflict of interest.

References

  1. Razzak, M.A.; Asaduzzaman, M.; Tanaka, H.; Asao, T. Effects of Supplementing Green Light to Red and Blue Light on the Growth and Yield of Lettuce in Plant Factories. Sci. Hortic. 2022, 305, 111429. [Google Scholar] [CrossRef]
  2. Ahmed, H.A.; Tong, Y.-X.; Yang, Q.-C. Optimal Control of Environmental Conditions Affecting Lettuce Plant Growth in a Controlled Environment with Artificial Lighting: A Review. South Afr. J. Bot. 2020, 130, 75–89. [Google Scholar] [CrossRef]
  3. Bian, Z.; Cheng, R.; Wang, Y.; Yang, Q.; Lu, C. Effect of Green Light on Nitrate Reduction and Edible Quality of Hydroponically Grown Lettuce (Lactuca sativa L.) under Short-Term Continuous Light from Red and Blue Light-Emitting Diodes. Environ. Exp. Bot. 2018, 153, 63–71. [Google Scholar] [CrossRef]
  4. Kang, W.H.; Park, J.S.; Park, K.S.; Son, J.E. Leaf Photosynthetic Rate, Growth, and Morphology of Lettuce under Different Fractions of Red, Blue, and Green Light from Light-Emitting Diodes (Leds). Hortic. Environ. Biotechnol. 2016, 57, 573–579. [Google Scholar] [CrossRef]
  5. Pennisi, G.; Orsini, F. Improving Light Management in Lettuce Crops. Nat. Food 2021, 2, 394–395. [Google Scholar] [CrossRef] [PubMed]
  6. Sipos, L.; Boros, I.F.; Csambalik, L.; Székely, G.; Jung, A.; Balázs, L. Horticultural Lighting System Optimalization: A Review. Sci. Hortic. 2020, 273, 109631. [Google Scholar] [CrossRef]
  7. Xu, J.; Guo, Z.; Jiang, X.; Ahammed, G.J.; Zhou, Y. Light Regulation of Horticultural Crop Nutrient Uptake and Utilization. Hortic. Plant J. 2021, 7, 367–379. [Google Scholar] [CrossRef]
  8. Kang, J.H.; KrishnaKumar, S.; Atulba, S.L.S.; Jeong, B.R.; Hwang, S.J. Light Intensity and Photoperiod Influence the Growth and Development of Hydroponically Grown Leaf Lettuce in a Closed-Type Plant Factory System. Hortic. Environ. Biotechnol. 2013, 54, 501–509. [Google Scholar] [CrossRef]
  9. Kozai, T.; Fujiwara, K.; Runkle, E.S. Led Lighting for Urban Agriculture; Springer: Singapore, 2016. [Google Scholar]
  10. Viršilė, A.; Olle, M.; Duchovskis, P. Led Lighting in Horticulture. In Light Emitting Diodes for Agriculture: Smart Lighting; Gupta, S.D., Ed.; Springer: Singapore, 2017; pp. 113–147. [Google Scholar]
  11. McCree, K.J. The Action Spectrum, Absorptance and Quantum Yield of Photosynthesis in Crop Plants. Agric. Meteorol. 1971, 9, 191–216. [Google Scholar] [CrossRef]
  12. Demotes-Mainard, S.; Péron, T.; Corot, A.; Bertheloot, J.; Le Gourrierec, J.; Pelleschi-Travier, S.; Crespel, L.; Morel, P.; Huché-Thélier, L.; Boumaza, R.; et al. Plant Responses to Red and Far-Red Lights, Applications in Horticulture. Environ. Exp. Bot. 2016, 121, 4–21. [Google Scholar] [CrossRef]
  13. Kumar, B.; Angulo, Y.; Smita, K.; Cumbal, L.; Debut, A. Capuli Cherry-Mediated Green Synthesis of Silver Nanoparticles under White Solar and Blue Led Light. Particuology 2016, 24, 123–128. [Google Scholar] [CrossRef]
  14. Mitchell, C.; Dzakovich, M.; Gomez, C.; Lopez, R.; Burr, J.; Hernández, R.; Kubota, C.; Currey, C.; Meng, Q.; Runkle, E.; et al. Light-Emitting Diodes in Horticulture. In Horticultural Reviews; Wiley-Blackwell: Hoboken, NJ, USA, 2015; Volume 43, pp. 1–87. [Google Scholar]
  15. Hooks, T.; Sun, L.; Kong, Y.; Masabni, J.; Niu, G. Short-Term Pre-Harvest Supplemental Lighting with Different Light Emitting Diodes Improves Greenhouse Lettuce Quality. Horticulturae 2022, 8, 435. [Google Scholar] [CrossRef]
  16. Lu, N.; Maruo, T.; Johkan, M.; Hohjo, M.; Tsukagoshi, S.; Ito, Y.; Ichimura, T.; Shinohara, Y. Effects of Supplemental Lighting with Light-Emitting Diodes (Leds) on Tomato Yield and Quality of Single-Truss Tomato Plants Grown at High Planting Density. Environ. Control Biol. 2012, 50, 63–74. [Google Scholar] [CrossRef]
  17. Paucek, I.; Pennisi, G.; Pistillo, A.; Appolloni, E.; Crepaldi, A.; Calegari, B.; Spinelli, F.; Cellini, A.; Gabarrell, X.; Orsini, F.; et al. Supplementary Led Interlighting Improves Yield and Precocity of Greenhouse Tomatoes in the Mediterranean. Agronomy 2020, 10, 1002. [Google Scholar] [CrossRef]
  18. Kinoshita, T.; Hayashi, Y. Chapter Three—New Insights into the Regulation of Stomatal Opening by Blue Light and Plasma Membrane H+-Atpase. In International Review of Cell and Molecular Biology; Jeon, K.W., Ed.; Academic Press: Cambridge, MA, USA, 2011; pp. 89–115. [Google Scholar]
  19. Matthews, J.; Vialet-Chabrand, S.; Lawson, T. Role of Blue and Red Light in Stomatal Dynamic Behaviour. J. Exp. Bot. 2019, 71, 2253–2269. [Google Scholar] [CrossRef]
  20. Trivellini, A.; Toscano, S.; Romano, D.; Ferrante, A. The Role of Blue and Red Light in the Orchestration of Secondary Metabolites, Nutrient Transport and Plant Quality. Plants 2023, 12, 2026. [Google Scholar] [CrossRef] [PubMed]
  21. Chiocchio, I.; Barbaresi, A.; Barbanti, L.; Mandrone, M.; Poli, F.; Torreggiani, D.; Trenta, M.; Tassinari, P. Effects of Led Supplemental Lighting on the Growth and Metabolomic Profile of Taxus Baccata Cultivated in a Smart Greenhouse. PLoS ONE 2022, 17, e0266777. [Google Scholar] [CrossRef]
  22. Johkan, M.; Shoji, K.; Goto, F.; Hahida, S.; Yoshihara, T. Effect of Green Light Wavelength and Intensity on Photomorphogenesis and Photosynthesis in Lactuca Sativa. Environ. Exp. Bot. 2012, 75, 128–133. [Google Scholar] [CrossRef]
  23. Mickens, M.A.; Torralba, M.S.; Robinson, S.A.; Spencer, L.E.; Romeyn, M.W.; Massa, G.D.; Wheeler, R.M. Growth of Red Pak Choi under Red and Blue, Supplemented White, and Artificial Sunlight Provided by Leds. Sci. Hortic. 2019, 245, 200–209. [Google Scholar] [CrossRef]
  24. Saito, Y.; Shimizu, H.; Nakashima, H.; Miyasaka, J.; Ohdoi, K. The Effect of Light Quality on Growth of Lettuce. IFAC Proc. Vol. 2010, 43, 294–298. [Google Scholar] [CrossRef]
  25. Trouwborst, G.; Schapendonk, A.H.C.M.; Rappoldt, K.; Pot, S.; Hogewoning, S.W.; van Ieperen, W. The Effect of Intracanopy Lighting on Cucumber Fruit Yield—Model Analysis. Sci. Hortic. 2011, 129, 273–278. [Google Scholar] [CrossRef]
  26. Xiao, L.; Shibuya, T.; Kato, K.; Nishiyama, M.; Kanayama, Y. Effects of Light Quality on Plant Development and Fruit Metabolism and Their Regulation by Plant Growth Regulators in Tomato. Sci. Hortic. 2022, 300, 111076. [Google Scholar] [CrossRef]
  27. Ieperen, W.; Savvides, A.; Fanourakis, D. Red and Blue Light Effects During Growth on Hydraulic and Stomatal Conductance in Leaves of Young Cucumber Plants. Acta Hortic. 2012, 956, 223–230. [Google Scholar] [CrossRef]
  28. Lu, N.; Mitchell, C.A. Supplemental Lighting for Greenhouse-Grown Fruiting Vegetables. In Led Lighting for Urban Agriculture; Kozai, T., Fujiwara, K., Runkle, E.S., Eds.; Springer: Singapore, 2016; pp. 219–232. [Google Scholar]
  29. Paucek, I.; Pennisi, G.; Pistillo, A.; Appolloni, E.; Crepaldi, A.; Calegari, B.; Spinelli, F.; Cellini, A.; Gianquinto, G.; Orsini, F. Effect of Supplementary Red and Blue Led Interlighting on Greenhouse-Grown Tomatoes During Spring Season in the Mediterranean. Acta Hortic. 2022, 1337, 31–38. [Google Scholar] [CrossRef]
  30. Zheng, Y.-J.; Zhang, Y.-T.; Liu, H.-C.; Li, Y.-M.; Liu, Y.-L.; Hao, Y.-W.; Lei, B.-F. Supplemental Blue Light Increases Growth and Quality of Greenhouse Pak Choi Depending on Cultivar and Supplemental Light Intensity. J. Integr. Agric. 2018, 17, 2245–2256. [Google Scholar] [CrossRef]
  31. Klein, R.M. Effects of Green Light on Biological Systems. Biol. Rev. Camb. Philos. Soc. 1992, 67, 199–284. [Google Scholar] [CrossRef] [PubMed]
  32. Smith, H. Sensing the Light Environment: The Functions of the Phytochrome Family. In Photomorphogenesis in Plants; Kendrick, R.E., Kronenberg, G.H.M., Eds.; Springer: Dordrecht, The Netherlands, 1994; pp. 377–416. [Google Scholar]
  33. Pan, T.; Ding, J.; Qin, G.; Wang, Y.; Xi, L.; Yang, J.; Li, J.; Zhang, J.; Zou, Z. Interaction of Supplementary Light and CO2 Enrichment Improves Growth, Photosynthesis, Yield, and Quality of Tomato in Autumn through Spring Greenhouse Production. HortSci. Horts 2019, 54, 246–252. [Google Scholar] [CrossRef]
  34. Wang, S.; Meng, X.; Tang, Z.; Wu, Y.; Xiao, X.; Zhang, G.; Hu, L.; Liu, Z.; Lyu, J.; Yu, J. Red and Blue Led Light Supplementation in the Morning Pre-Activates the Photosynthetic System of Tomato (Solanum lycopersicum L.) Leaves and Promotes Plant Growth. Agronomy 2022, 12, 897. [Google Scholar] [CrossRef]
  35. Naznin, M.T.; Lefsrud, M.; Azad, M.O.K.; Park, C.H. Effect of Different Combinations of Red and Blue Led Light on Growth Characteristics and Pigment Content of in Vitro Tomato Plantlets. Agriculture 2019, 9, 196. [Google Scholar] [CrossRef]
  36. Hogewoning, S.W.; Trouwborst, G.; Maljaars, H.; Poorter, H.; van Ieperen, W.; Harbinson, J. Blue Light Dose-Responses of Leaf Photosynthesis, Morphology, and Chemical Composition of Cucumis sativus Grown under Different Combinations of Red and Blue Light. J. Exp. Bot. 2010, 61, 3107–3117. [Google Scholar] [CrossRef]
  37. Thoma, F.; Somborn-Schulz, A.; Schlehuber, D.; Keuter, V.; Deerberg, G. Effects of Light on Secondary Metabolites in Selected Leafy Greens: A Review. Front. Plant Sci. 2020, 11, 497. [Google Scholar] [CrossRef] [PubMed]
  38. Dannehl, D.; Schwend, T.; Veit, D.; Schmidt, U. Increase of Yield, Lycopene, and Lutein Content in Tomatoes Grown under Continuous Par Spectrum Led Lighting. Front. Plant Sci. 2021, 12, 611236. [Google Scholar] [CrossRef]
  39. Ji, T.; Du, Y.; Wei, M.; Gu, D.; Li, J.; Wang, H.; Yang, F. Adding Different Proportions of Red/Blue = 3/1 to White Light Affects Eggplant Seedling Quality by Regulating Leaf Morphology and Photosynthetic System. Plant Growth Regul. 2023, 100, 593–607. [Google Scholar] [CrossRef]
  40. Lichtenthaler, H.K.; Wellburn, A.R. Determinations of Total Carotenoids and Chlorophylls a and B of Leaf Extracts in Different Solvents. Biochem. Soc. Trans. 1983, 11, 591–592. [Google Scholar] [CrossRef]
  41. Tan, T.; Li, S.; Fan, Y.; Wang, Z.; Raza, M.A.; Shafiq, I.; Wang, B.; Wu, X.; Yong, T.; Wang, X.; et al. Far-Red Light: A Regulator of Plant Morphology and Photosynthetic Capacity. Crop J. 2022, 10, 300–309. [Google Scholar] [CrossRef]
  42. Wassenaar, M.L.J.; van Ieperen, W.; Driever, S.M. Low Red to Far-Red Ratio Increases Resistance to CO2 Diffusion and Reduces Photosynthetic Efficiency in Low Light Grown Tomato Plants. Environ. Exp. Bot. 2022, 200, 104918. [Google Scholar] [CrossRef]
  43. Yan, Z.; Wang, C.; Li, Z.; Li, X.; Cheng, F.; Lin, D.; Yang, Y. Supplementary White, Uv-a, and Far-Red Radiation Differentially Regulates Growth and Nutritional Qualities of Greenhouse Lettuce. Plants 2023, 12, 3234. [Google Scholar] [CrossRef]
  44. Naznin, M.T.; Lefsrud, M.; Gravel, V.; Azad, M.O.K. Blue Light Added with Red Leds Enhance Growth Characteristics, Pigments Content, and Antioxidant Capacity in Lettuce, Spinach, Kale, Basil, and Sweet Pepper in a Controlled Environment. Plants 2019, 8, 93. [Google Scholar] [CrossRef]
  45. Lee, M.-J.; Son, K.-H.; Oh, M.-M. Increase in Biomass and Bioactive Compounds in Lettuce under Various Ratios of Red to Far-Red Led Light Supplemented with Blue Led Light. Hortic. Environ. Biotechnol. 2016, 57, 139–147. [Google Scholar] [CrossRef]
  46. Kochetova, G.V.; Avercheva, O.V.; Bassarskaya, E.M.; Kushunina, M.A.; Zhigalova, T.V. Effects of Red and Blue Led Light on the Growth and Photosynthesis of Barley (Hordeum vulgare L.) Seedlings. J. Plant Growth Regul. 2023, 42, 1804–1820. [Google Scholar] [CrossRef]
  47. Kong, J.; Zhao, Y.; Fan, P.; Wang, Y.; Xu, X.; Wang, L.; Li, S.; Duan, W.; Liang, Z.; Dai, Z. Far-Red Light Modulates Grapevine Growth by Increasing Leaf Photosynthesis Efficiency and Triggering Organ-Specific Transcriptome Remodelling. BMC Plant Biol. 2024, 24, 189. [Google Scholar] [CrossRef] [PubMed]
  48. Kumari, S.; Panigrahi, K.C.S. Light and Auxin Signaling Cross-Talk Programme Root Development in Plants. J. Biosci. 2019, 44, 26. [Google Scholar] [CrossRef]
  49. Yun, F.; Liu, H.; Deng, Y.; Hou, X.; Liao, W. The Role of Light-Regulated Auxin Signaling in Root Development. Int. J. Mol. Sci. 2023, 24, 5253. [Google Scholar] [CrossRef] [PubMed]
  50. Wu, H.-C.; Lin, C.-C. Red Light-Emitting Diode Light Irradiation Improves Root and Leaf Formation in Difficult-to-Propagate Protea Cynaroides L. Plantlets in Vitro. HortSci. Horts 2012, 47, 1490–1494. [Google Scholar] [CrossRef]
  51. Shen, Y.; Fan, K.; Wang, Y.; Wang, H.; Ding, S.; Song, D.; Shen, J.; Li, H.; Song, Y.; Han, X.; et al. Red and Blue Light Affect the Formation of Adventitious Roots of Tea Cuttings (Camellia sinensis) by Regulating Hormone Synthesis and Signal Transduction Pathways of Mature Leaves. Front. Plant Sci. 2022, 13, 943662. [Google Scholar] [CrossRef]
  52. Livadariu, O.; Maximilian, C.; Rahmanifar, B.; Cornea, C.P. Led Technology Applied to Plant Development for Promoting the Accumulation of Bioactive Compounds: A Review. Plants 2023, 12, 1075. [Google Scholar] [CrossRef]
  53. Zhang, T.; Shi, Y.; Piao, F.; Sun, Z. Effects of Different Led Sources on the Growth and Nitrogen Metabolism of Lettuce. Plant Cell Tissue Organ Cult. (PCTOC) 2018, 134, 231–240. [Google Scholar] [CrossRef]
  54. Wang, D.; Mao, Z.; Fahlman, B.D. Phosphors with a 660-Nm-Featured Emission for Led/Ld Lighting in Horticulture. In Phosphors, up Conversion Nano Particles, Quantum Dots and Their Applications; Liu, R.-S., Ed.; Springer: Singapore, 2016; Volume 2, pp. 83–117. [Google Scholar]
  55. Finlayson, S.A.; Hays, D.B.; Morgan, P.W. Phyb-1 Sorghum Maintains Responsiveness to Simulated Shade, Irradiance and Red Light: Far-Red Light. Plant Cell Env. 2007, 30, 952–962. [Google Scholar] [CrossRef]
  56. Zheng, W.; Lu, X.; Li, Y.; Li, S.; Zhang, Y. Hyperspectral Identification of Chlorophyll Fluorescence Parameters of Suaeda Salsa in Coastal Wetlands. Remote Sens. 2021, 13, 2066. [Google Scholar] [CrossRef]
  57. Ouzounis, T.; Rosenqvist, E.; Ottosen, C.-O. Spectral Effects of Artificial Light on Plant Physiology and Secondary Metabolism: A Review. HortSci. Horts 2015, 50, 1128–1135. [Google Scholar] [CrossRef]
Figure 1. Relative spectral distribution of different treatments.
Horticulturae 11 00043 g001
Figure 2. The phenotypic characteristics of lettuce under different treatments on the 20th day after colonization. Note: The same color within different treatments represents leaves from the same time period.
Horticulturae 11 00043 g002
Figure 3. The phenotypic characteristics of lettuce under different treatments on the 40th day after colonization. Note: The same color within different treatments represents leaves from the same time period.
Horticulturae 11 00043 g003
Figure 4. Effect of light supplementation on leaf area of same leaf of lettuce under different treatments.
Horticulturae 11 00043 g004
Figure 5. Effect of light supplementation on lettuce growth indexes under different treatments. (a) Plant height, (cm); (b) Stem diameter, (mm); (c) Leaf thickness, (mm); (d) Leaf count, (Pcs); (e) Leaf area, (cm2). Note: Different letters in the same column indicate significant differences (p < 0.05) based on Duncan’s multiple range test. NS represents no significant difference at the 5% level.
Horticulturae 11 00043 g005
Figure 6. Effect of light supplementation on dry and fresh weights aboveground and below ground in different treatments. (a) Aboveground fresh weight, (g); (b) Underground fresh weight, (g); (c) Aboveground dry weight, (g); (d) Underground dry weight (g). Note: Different letters in the same column indicate significant differences (p < 0.05) based on the Duncan’s multiple range test. NS represent no significant difference at the 5% level.
Horticulturae 11 00043 g006
Figure 7. Effect of light supplementation on photosynthetic characteristics of lettuce under different treatments. (a) Tr is the transpiration rate, (mmol·m−2·s−1); (b) Pn is the net photosynthetic rate, (μmol·m−2·s−1); (c) Ci is the transpiration rate, (μmol·m⁻2·s−1); (d) Gs is the stomatal conductance, (mol·m−2·s−1). Note: Different letters in the same column indicate significant differences (p < 0.05) based on the Duncan’s multiple range test. NS represent no significant difference at the 5% level.
Horticulturae 11 00043 g007
Figure 8. Effects of light supplementation on chlorophyll content and photosynthetic pigment content of lettuce under different treatments. (a) Chlorophyll a content, (mg·g−1); (b) Chlorophyll b content, (mg·g−1); (c) Carotenoid content, (mg·g−1). Note: Different letters in the same column indicate significant differences (p < 0.05) based on the Duncan’s multiple range test.
Horticulturae 11 00043 g008
Figure 9. Effect of light supplementation on root traits of lettuce under different treatments. (a) Total root length, (cm); (b) Root surface area, (cm2); (c) Root volume, (cm3); (d) Average root thickness, (mm); (e) Number of root tips, (Pcs). Note: Different letters in the same column indicate significant differences (p < 0.05) based on Duncan’s multiple range test.
Horticulturae 11 00043 g009
Figure 10. Effect of light supplementation on chlorophyll fluorescence in lettuce under different treatments. Note: Different letters in the same column indicate significant differences (p < 0.05) based on Duncan’s multiple range test.
Horticulturae 11 00043 g010
Figure 11. The actual quantum yield of PSII (Y(II)) in lettuce under different treatments on the 40th day.
Horticulturae 11 00043 g011
Figure 12. Histograms of the gray scale values of Y(II) in lettuce under different treatments on the 40th day. Note: The chlorophyll fluorescence histogram reflects the frequency of occurrence of each value in the image. The abscissa of the fluorescence histogram is the value of a specific parameter, and the ordinate is the frequency of occurrence of the value. From the point of view of probability, the frequency of occurrence can be seen as the probability of its occurrence, so the histogram corresponds to the probability density function, while the probability distribution function is the cumulative sum of the histograms.
Horticulturae 11 00043 g012
Table 1. Dry and fresh weights of aboveground and underground parts of lettuce under different treatments on 40th day.
TreatmentAboveground Fresh Weight (g)Underground Fresh Weight (g)Aboveground Dry Weight (g)Underground Dry Weight (g)
CK14.21 ± 2.23 d1.92 ± 0.42 c0.75 ± 0.12 d0.17 ± 0.06 d
T130.91 ± 10.22 c3.01 ± 0.38 b2.05 ± 0.10 c0.28 ± 0.01 c
T255.67 ± 9.74 a5.49 ± 0.42 a5.90 ± 0.65 a0.65 ± 0.01 a
T344.39 ± 4.45 b3.15 ± 0.15 b3.88 ± 0.38 b0.46 ± 0.07 b
Note: Different letters in the same column indicate significant differences (p < 0.05) based on the Duncan’s multiple range test.
Table 2. The photosynthetic characteristics of lettuce under different treatments on the 40th day.
TreatmentTr
(mmol·m−2·s−1)
Pn
(μmol·m−2·s−1)
Ci
(μmol·m⁻2·s−1)
Gs
(mol·m−2·s−1)
CK2.59 ± 0.26 bc5.84 ± 0.18 c338.81 ± 17.76 ns0.21 ± 0.01 c
T12.24 ± 0.24 c6.01 ± 0.18 c319.90 ± 31.20 ns0.23 ± 0.01 b
T23.74 ± 0.32 a10.30 ± 1.71 a331.91 ± 16.20 ns0.31 ± 0.04 a
T32.73 ± 0.23 b6.78 ± 0.18 b336.82 ± 18.73 ns0.24 ± 0.01 b
Note: Different letters in the same column indicate significant differences (p < 0.05) based on the Duncan’s multiple range test. NS represent no significant difference at the 5% level.
Table 3. The chlorophyll content and photosynthetic pigment content of lettuce under different treatments on the 40th day.
TreatmentChlorophyll a
(mg·g−1)
Chlorophyll b
(mg·g−1)
Carotenoid content (mg·g−1)Total Chlorophyll Content (mg·g−1)Chlorophyll a/b
CK0.49 ± 0.02 d0.16 ± 0.01 d0.18 ± 0.02 c0.65 ± 0.02 d3.06 ± 0.05 b
T10.58 ± 0.01 c0.22 ± 0.01 c0.26 ± 0.02 b0.80 ± 0.02 c2.64 ± 0.01 c
T20.88 ± 0.04 a0.26 ± 0.01 b0.35 ± 0.02 a1.14 ± 0.05 a3.38 ± 0.05 a
T30.76 ± 0.02 b0.30 ± 0.01 a0.28 ± 0.01 b1.06 ± 0.03 b2.53 ± 0.02 d
Note: Different letters in the same column indicate significant differences (p < 0.05) based on the Duncan’s multiple range test.
Disclaimer/Publisher’s Note: The statements, opinions and data contained in all publications are solely those of the individual author(s) and contributor(s) and not of MDPI and/or the editor(s). MDPI and/or the editor(s) disclaim responsibility for any injury to people or property resulting from any ideas, methods, instructions or products referred to in the content.

