Abstract
The quality of okra is crucial in satisfying consumer expectations, and the tenderness of okra is an essential parameter in estimating its condition. However, the current methods for assessing okra tenderness are slow and prone to errors, necessitating the development of a better, non-destructive method. The objective of the present study is to develop and test a non-destructive robotic sensor for assessing okra freshness and tenderness. A total of 120 pods were divided into two sets and stored under different conditions: 60 pods were kept in a cold chamber for 24 h (considered tender), while the other 60 pods were stored at room temperature for two days. First, the samples were assessed non-destructively using the force sensor of a collaborative robot, where a jamming pad (with internal granular fill) was capable of adapting and copying the okra shapes while controlling its force deformation. Second, the okra pods were evaluated with the referenced destructive tests, as well as weight loss, compression, and puncture tests. In order to validate the differences in the tenderness of the two sets, a discriminant analysis was carried out to segregate the okra pods into the two categories according to the destructive variables, confirming the procedure which was followed to produce tender and non-tender okra pods. After the differences in the tenderness of the two sets were confirmed, the variables extracted from the robotic sensor (maximum force (Fmax), first slope (S1), second slope (S2), the first overshoot (Os), and the steady state (Ss)) were significant predictors for the separation in the two quality categories. Discriminant analysis and logistic regression methods were applied to classify the pods into the two tenderness categories. Promising results were obtained using neural network classification with 80% accuracy in predicting tenderness from the sensor data, and a 95.5% accuracy rate was achieved in distinguishing between tender and non-tender okra pods in the validation data set. The use of the robotic sensor could be an efficient tool in evaluating the quality of okra. This process may lead to substantial savings and waste reduction, particularly considering the elevated cost and challenges associated with transporting perishable vegetables.
1. Introduction
Okra, scientifically known as Abelmoschus esculentus, belongs to the mallow family and is renowned for its semi-fibrous nature. Grown primarily in warm regions as an annual crop, and as a perennial in hotter climates, okra is valued not only for its edible fruit but also for its leaves, seeds, flower parts, and stems. This versatile vegetable is cultivated across tropical, subtropical, and temperate regions worldwide, making it a staple in various cuisines [1]. Known by different names, such as bhindi, okura, quimgombo, bamia, and gombo [2], okra has found global popularity. Although traditionally not a major crop in most European countries due to its preference for warm climates, some Southern European countries are experimenting with its cultivation due to changing agricultural practices and climate conditions. Despite being less commonly grown in Europe and North America, okra is gaining popularity in these regions due to its high nutritional value, which includes vitamins and other beneficial compounds [3]. Globally, okra production is estimated at approximately 9.96 million tons, with India leading at 6.18 million tons, followed by Nigeria with 1.82 million tons [4]. India is a significant exporter, sending substantial quantities to the Middle East, the United Kingdom, Western Europe, and the United States [5]. Okra pods are rich in calcium, dietary fiber, vitamins, polyphenols, and other bioactive compounds, offering numerous health benefits, including anti-inflammatory, antioxidant, anti-carcinogenic, anti-obesity, anti-diabetic, and anti-cardiovascular properties [6,7].
However, the loss of freshness during transportation poses significant waste and economic challenges. Okra quality is influenced by factors such as variety, growth environment, maturity stage, and harvesting and storage methods, leading to national economic challenges [8]. Fresh okra has a limited shelf life and is prone to water loss, with optimal sensory quality typically observed around six days post-harvest. Assessing okra tenderness is crucial for evaluating its quality, traditionally carried out through manual observation and destructive means, which are time-consuming, prone to errors, and can lead to harvest losses [9,10,11]. Okra’s desirable qualitative attributes include length, diameter, greenness, mucilage, and fiber content. Medium-sized fruits (8.9–12.7 cm) are preferred by industry and commerce, although smaller fruits are also often accepted. Certain levels of greenness and fruit diameter are necessary, but these are frequently assessed arbitrarily [12].
Traditional methods of assessing tenderness involve the manual observation of pod size, color, and tip flexibility, performed by experts. These methods are labor-intensive, tedious, prone to errors, and can cause harvest losses. Early harvesting results in a low yield, while late harvesting causes browning and fibrosis, rendering the okra inedible [13,14]. Destructive mechanical hardness is frequently measured using a texture analyzer. As fruits mature, texture changes occur, particularly during ripening, leading to softer produce. Additionally, moisture loss can impact texture. The current method for assessing okra tenderness involves using a penetrometer instrument. A penetrometer is a pressure tester that is inserted into the test fruit to a set depth, with the speed controlled by an operator. This method is destructive, as it causes irreversible damage to the pod, necessitating its disposal after measurement. Additionally, tenderness can vary significantly across the surface of the fruit, requiring multiple penetrometer tests in different locations to ensure a comprehensive assessment.
Different types of tactile sensors have been designed in recent years [15]. Tactile sensors allow robots to perceive external characteristics and obtain information about pressure, vibration, roughness, and temperature. In this paper, we propose a non-destructive method for testing okra tenderness. This new approach allows the user to test multiple surface areas with a single touch. Utilizing tactile sensing technology, the method enables end-effectors to retrieve multiple contact pressure readings from relatively small areas. It enhances the accuracy, precision, and speed of inspections, while simultaneously reducing production time and labor costs compared to manual methods. The incorporation of robots adds flexibility and autonomy to automated non-destructive testing. Automated robotic inspections are advantageous in various industrial contexts [16]. These methods examine internal and external characteristics without causing harm, thus preserving the product’s integrity [17]. Grading lines equipped with sensors for external parameters such as color, size, and appearance have become commonplace [18]. Visible and near-infrared (Vis-NIR) hyperspectral imaging is a non-destructive tool used to evaluate maturity and moisture content in okra, aiding in determining the optimal harvest time [19]. Robotic non-destructive testing and sensing leads the way in technological advancement, providing the ability to evaluate structural integrity, safety, and material quality across various industries [20].
Tactile sensation enables robots to measure physical interactions, leading to its widespread use in robotic systems. The development of affordable tactile sensors and fabrication techniques has driven extensive research in this area within the agri-food sector. Tactile sensation allows robots to gently harvest delicate foods without causing damage, assess the ripeness of soft fruits, and sort produce, addressing complex physical interaction challenges in the industry. It plays a crucial role in the harvesting, manipulation, and feature extraction of food items. Early research focused on using tactile sensing to determine key features, such as hardness, to estimate food ripeness. In the agri-food sector, advancements in tactile sensors and manufacturing methods have led to the development of robotic systems capable of non-destructive quality assessment. Tactile sensors enable robots to gently handle delicate foods, assess ripeness, and sort produce based on texture [21]. Different non-destructive methods have been developed to assess texture without destroying the product (non-destructive testing). Texture recognition is critical for robotic systems, allowing them to differentiate between diverse surface properties [22]. Non-destructive impact analysis has been applied to various fruits and vegetables [23], including peaches [24], apples [25], kiwis [26], and dragon fruit [27].
In crops like bananas, strawberries, watermelons, and tomatoes, visual cues have proven adequate for assessing ripeness and classifying produce accordingly. However, other vegetables such as okra do not offer useful visual differences between tender mature and overmature units. In okra pods, the decrease in glucose and sucrose levels and the accumulation of cinnamic acid are involved in the lignification of the tissue after harvesting [13]. The detection of this loss of tenderness related to the tissue lignification is crucial to assess okra quality. Currently, there are still not any established methods proposed to assess okra tenderness. This paper focuses on the development of a method for non-destructive tenderness assessment of okra.
This study aims to evaluate the freshness and tenderness of okra using a non-destructive impact device attached to a robotic arm. By leveraging advanced sensor technology, we seek to provide a more efficient, accurate, and non-damaging method of quality assessment, thereby reducing waste and improving supply chain efficiency.
2. Materials and Methods
The description outlines an experiment involving the evaluation of ‘Clemson’ variety fresh okra pods sourced from a local trader in Valencia, Spain.
2.1. Vegetal Material
Initially, 120 okra pods were chosen based on criteria such as homogeneity in size and color, the absence of physical damage, and the lack of diseases or infections. Each pod was individually numbered from 1 to 120.
2.2. Separation of Two Sets
The 120 pods were then randomly split into two groups, each consisting of 60 similar okra pods, Figure 1. In order to produce a set of products with acceptable quality conditions and another set with unacceptable quality conditions, one group (of 60 pods) was stored in a cold chamber condition for 24 h (“Acquired pods”; the tender set), while the other group (of 60 pods) was stored at ambient conditions for two days and then shifted to a cold environment for five more days (“Stored pods”; the non-tender set).
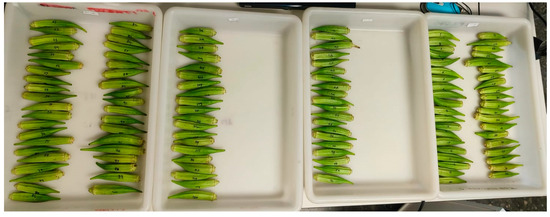
Figure 1.
Distribution of 120 okra pods into two groups of 60 similar okra pods, stored in a cold chamber (Group A) and ambient conditions (Group B), respectively.
2.3. Robot Sensor Design
The internal force sensor (inside (intrinsic in) the robot and located at the sixth robot axis) of a collaborative robot UR5e (Universal Robot, Odense, Denmark) was utilized as a tactile sensor to estimate the product decay (Figure 2). The force sensor, located just before its Tool Center Point (TCP), has six degrees of freedom. The robot is equipped with functions to establish internal control motion to ensure its TCP achieves the desired force value. In this instance, a gain adjustment of 1.5 and damping with a value of 0.01 were applied, with a nominal reference value set at 20 N for vertical forces. These adjustments were deduced from experimental results to achieve an underdamped response. Okra is sensitive to damage if excessive pressure is applied. To prevent damage, the robot’s TCP is equipped with a small silicone pad filled with granular fluid. This granular fluid undergoes a jamming transition by changing its pressure. In the soft state, when its pressure equals or exceeds the external pressure (quasi-liquid), granular particles can move freely. In the rigid state, when the pressure is lower than the external pressure (quasi-solid), granular particles collapse and cannot move freely. The control of this pad is managed through a vacuum generator (VADMI-300-LS-P, Festo, Esslingen, Germany).
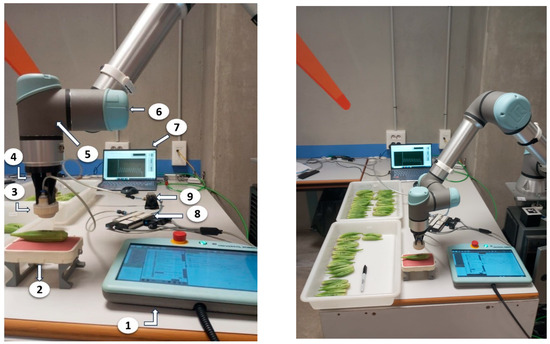
Figure 2.
Robot components: (1) teach pendant; (2) Bottom Jamming Pad; (3) upper jamming pad; (4) PLA 3D printed adapter; (5) first wrist of the UR5e; (6) second wrist of the UR5e; (7) PC, connected with the UR via Ethernet; (8) vacuum generator; (9) pressure regulator.
2.4. Robot Sensing Procedure
The okra rested on a Bottom Jamming Pad to prevent damage from hard contact with the table. The robot was positioned with its sixth axis vertically above the okra fruit. It was programmed to descend at 0.1 m/s in force control mode to reach a force of 20 N on the fruit. During the movement, overpressure was generated in the pad by activating the vacuum generator with a digital output for 0.5 s, making the pad soft before contacting the okra. The robot reached the desired force after a waiting period, allowing the pad’s surface to conform to the shape of the dragon fruit’s surface. Then, the robot activated the vacuum, causing the pad to transition to a rigid state and conform to the contact area on the dragon fruit. The robot then moved vertically up 50 mm and descended again in force control mode to achieve a force of 20 N on the fruit. Simultaneously, the vertical force signal was sent via Ethernet to a LabVIEW program (National Instruments, Austin, TX, USA). After 2 s, the signal usually reached a steady state. The robot returned to its initial position and stopped transmitting information. Figure 3 illustrates the entire process of the robot program, devices, and communication paths. Sensor information was acquired through Ethernet sockets using LabVIEW (National Instruments, Austin, TX, USA). The vertical forces were sampled at 500 Hz. Signal processing was also performed with LabVIEW, from which the parameters of the force–time curves were deduced.
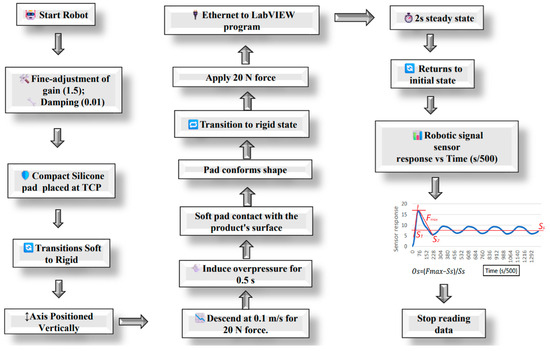
Figure 3.
Flow chart of the operational process of the robot arm, related devices, and communication paths (vacuum generator (VC)).
2.5. Non-Destructive Measurements
From the robotic signal sensor response versus time curve, several variables were extracted based on previous studies [27]. The non-destructive variables extracted from the robotic sensor signal were: maximum force (Fmax), first slope (S1), second slope (S2), the first overshoot (Os), and the steady-state (Ss) (Figure 3 and Equation (1)).
Os = (Fmax − Ss)/Ss
2.6. Destructive Measurements
After the non-destructive robotic measurements were completed, the weight, whole fruit firmness, and pulp firmness were tested. Weight loss was measured using a digital balance (Mettler Toledo AL104 electronic balance, Im Langacher 44, 8606 Greifensee, Switzerland). Fruit weight was measured both before and after storage. Firmness was measured using a universal stress–strain machine (Ibertest, model IBTH 2730, www.ibertest.es (accessed on 28 August 2024)) at a constant speed of 1.67 m/s. The firmness of each pod was assessed at the equatorial area of the pod using two different tests: a puncture compression test of 0.006 m (using a cylindrical needle with a diameter of 0.001 m) and a compression test of 6 mm (using a Magness-Taylor rod with a diameter of 0.008 m). Three repetitions were carried out per test and fruit.
2.7. Data Description, Signal Processing and Statistical Analysis
After the tests, different parameters were collected, both destructive and non-destructive. The reference fruit characterization magnitudes were weight, whole fruit firmness, and pulp firmness. The robot non-destructive magnitudes were extracted from the smoothed signals (sensor response versus time curve). Force-time signals were processed considering only the period where the robot made contact with the okra pod. LabVIEW program processed every signal to obtain the robotic non-destructive variables (maximum force, first slope, second slope, the first overshoot, and the steady-state).
The statistical analysis was performed with a commercially available software package (Statgraphics Centurion 18 Software, version 18.1.13, Statgraphics Technologies, Inc., The Plains, VA, USA). One-way analysis of variance was used to assess the effect of the treatments on the destructively measured variables (weight loss, fruit firmness). Then, a step-by-step discriminant analysis (based on the variables of firmness and weight loss) was used. A Bayesian neural network was carried out for the study of the sensor classification capability.
3. Results
3.1. Destructive Test Results
The loss of tenderness in the okra pods was confirmed destructively, by measuring the texture and weight loss differences in the two sets (“Acquired pods” and “Stored pods”). The texture change was assessed by the texture analysis tests (puncture test and compression test) and the loss of weight was assessed by measuring initial weight and weight at the moment of the destructive test. As expected, the results from the destructive compression test and puncture compression test were significantly different in both sets; the okras from the stored set had lost tenderness compared to the acquired set (Figure 4 and Figure 5).
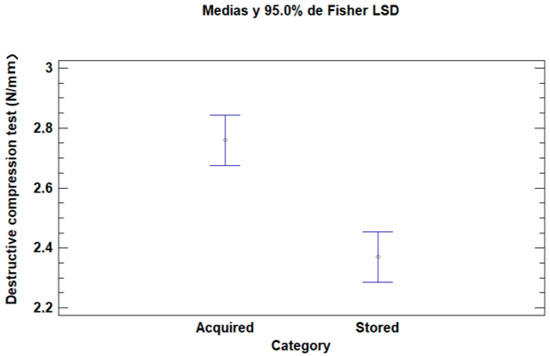
Figure 4.
Destructive compression test results (N/mm) for acquired set and stored set categories; mean values of the destructive compression test for each category, and 95.0% Least Significant Difference (LSD) intervals.
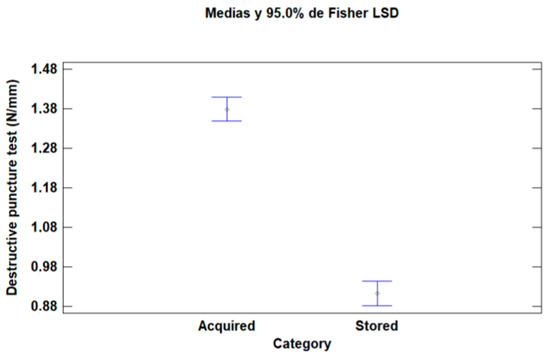
Figure 5.
Destructive puncture test results (N/mm) for acquired set and stored set categories; mean values of the destructive puncture test for each category, and 95.0% Least Significant Difference (LSD) intervals.
In the same vein, the weight loss was significantly higher for the stored pods, Figure 6.
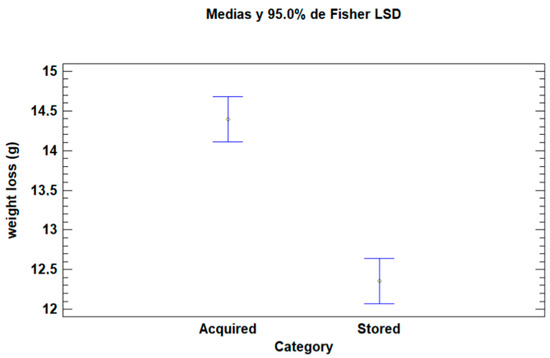
Figure 6.
Weight loss (%) for acquired set and stored set categories; mean values of weight loss for each category, 95.0% Least Significant Difference (LSD) intervals.
3.2. Confirmation of the Differences in the Tenderness of the Two Sets
In order to validate the capability of the destructive variables in correctly segregating the okra pods into the established categories (acquired and stored, corresponding to tender pods and non-tender pods), a discriminant analysis was carried out to separate the pods into the two categories according to percentage of weight loss, compression test and puncture test, shown in Figure 7. A well-classified product percentage of 95.5% was obtained.
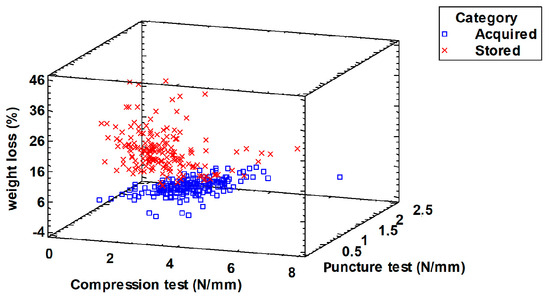
Figure 7.
Discriminant analysis to segregate the two categories based on the destructive variables.
3.3. Non-Destructive Classification of Okra Pods Based on the Robotic Sensor
After confirming the previous segregation of the two sets with the destructive variables and weight loss, a classification analysis was developed to segregate the pods into the two categories based on the non-destructive variables extracted from the robot impact sensor.
Three different classification methods were studied: discriminant analysis, logistic regression and a Bayesian neural network.
The discriminant analysis obtained a well-classified pod percentage of 64.6% (Figure 8), while the logistic regression indicated a variability of 41.1% of that explained by the model (Figure 9).
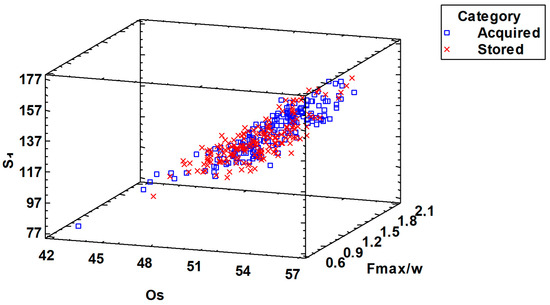
Figure 8.
Discriminant analysis to segregate the two categories based on the non-destructive variables extracted from the robotic sensor (maximum force over weight (Fmax/w), first slope (S1), second slope (S2), the first overshoot (Os), and the steady-state (Ss)).
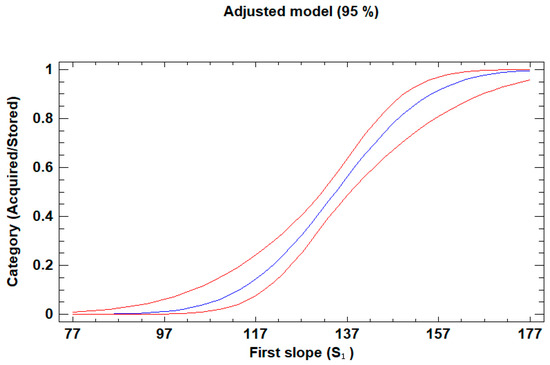
Figure 9.
Adjusted model (95%) from the logistic regression, 41.1% of variability explained by the model based on the non-destructive variables extracted from the robotic sensor (maximum force over weight (Fmax/w), first slope (S1), second slope (S2), the first overshoot (Os), and the steady-state (Ss)).
The best classification result was obtained with the Bayesian neural network (using the resampling methods jackknifing and nearest neighbor).
The variables used were first slope (S1), second slope (S2), first overshoot (Os) and maximum force over weight (Fmax/w) while performing the non-destructive impact. Well-classified okra pod percentages of 78.59% and 81.02% were found, for nearest neighbor and jackknifing, respectively (Figure 10 and Table 1).
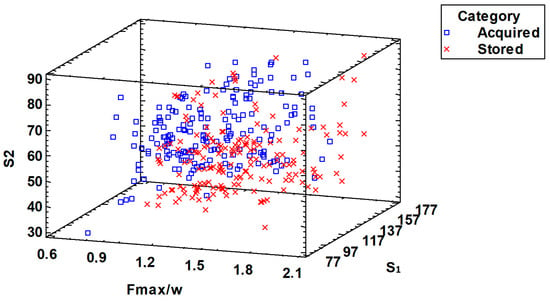
Figure 10.
Dispersion diagram from the neural network analysis to segregate the okra pods into the two quality categories according to the non-destructive variables extracted from the robotic sensor (first slope (S1), second slope (S2), first overshoot (Os) and maximum force over weight (Fmax/w)).

Table 1.
Classification table from the neural network analysis to segregate the okra pods into the two quality categories according to the non-destructive variables extracted from the robotic sensor.
From the category of “Acquired pods”, nine pods were wrongly classified as “Stored pods”. On the other hand, from the category of “Stored pods”, sixteen pods were wrongly classified as “Acquired”.
4. Discussion
In discussing the effectiveness of destructive and non-destructive methods for assessing fresh vegetable quality, it becomes evident that both approaches offer distinct advantages and face specific challenges. Destructive methods, such as compression and puncture tests, are renowned for their ability to provide precise quantitative data on product texture and firmness, accurately classifying 95.5% of them into categories based on storage conditions. These tests have demonstrated high reliability in distinguishing between fresh products of varying ripeness or storage conditions in numerous studies. However, the utilization of destructive methods comes with inherent limitations, particularly in their inability to assess product quality without altering or damaging the sample. This limitation underscores the value of non-destructive methods, such as those employing robotic sensors, which enable real-time assessment without compromising fruit or vegetable integrity. This capability is crucial for industries focused on maintaining product quality throughout the supply chain while minimizing waste. Defining and objectively measuring fresh product quality presents notable challenges, as attributes like firmness, color, and taste can vary significantly depending on factors such as variety, environmental conditions, and post-harvest handling practices. Standardizing protocols and reference methods is essential to ensure the consistent evaluation of product quality across diverse contexts, thereby supporting informed decision-making in the agricultural sector. Previous studies have shown promising results in evaluating fruit and vegetable texture quality using non-destructive techniques, for instance, in studies on mango [28], melon [29], kiwi [30] or nectarine [31]. In the present study, non-destructive variables extracted from a robot sensor successfully classified okra pods into tender and non-tender categories with an accuracy rate of almost 80%. Moreover, the study underscores the practical implications of classification errors in a quality assessment of fresh products. Misclassifying fruits and vegetables, particularly high-value products, can result in economic losses and impact consumer trust. This highlights the need for continuous improvement in classification models, incorporating additional parameters, and enhancing the robustness of assessment techniques to accommodate the inherent variability in fruit and vegetable characteristics. Looking ahead, advancements in machine learning and sensor technology hold promise for enhancing the accuracy and efficiency of product quality assessments. Future research efforts could focus on integrating multiple data sources and developing adaptive algorithms capable of adjusting to varying environmental conditions and fruit and vegetable types. By doing so, the industry can better meet consumer demands for high-quality products while optimizing resource utilization and reducing environmental impact. These innovations are crucial for fostering sustainable practices and ensuring the continued competitiveness of fruit and vegetable producers in global markets.
5. Conclusions
This research paper presents a comprehensive investigation into the assessment of okra pod tenderness and freshness using both destructive and non-destructive methods. The detection of tenderness loss, related to the tissue lignification during post-harvest storage, is crucial to evaluate okra quality. The study demonstrated that destructive tests, including weight loss measurements, compression, and puncture tests, were effective in assessing the tenderness of okra pods, achieving a high classification rate of 95.5% for well-segregated pods based on storage conditions. However, potential limitations exist, particularly regarding the initial conditions of the okra pods sourced from the local market. Variations in the initial state of the pods could have influenced the speed of deterioration, leading to discrepancies in classification. Despite this, destructive methods remain valuable for assessing okra tenderness and could serve as a reliable reference for quality evaluation. On the other hand, non-destructive techniques, utilizing a robotic impact device and extracting variables such as the first slope (S1) and the difference between the maximum value and the first overshoot (Os), demonstrated promising results. These non-destructive methods achieved nearly 80% accuracy in predicting tenderness and a 95.5% accuracy rate in distinguishing between tender and non-tender okra pods in the validation data set. Despite some misclassifications observed, the non-destructive methods offer efficiency and potential for automation, making them a practical solution for large-scale quality assessment. In practical applications, a combination of both destructive and non-destructive methods could offer a comprehensive approach to evaluating okra quality. Destructive tests provide a reliable benchmark for the assessment of tenderness, while non-destructive methods offer efficiency and potential for automation. By integrating these approaches, it is possible to enhance quality control processes and minimize waste in the okra supply chain. Furthermore, this study contributes to the broader field of food quality assessment, highlighting the importance of innovative techniques such as robotic impact devices in agricultural research. The continued exploration and refinement of both destructive and non-destructive methods will further advance our ability to ensure food quality and safety in agricultural production and distribution systems. This process may lead to substantial savings and waste reduction, particularly considering the elevated cost and challenges associated with transporting perishable vegetables.
Author Contributions
Conceptualization, C.O. and N.M.A.; methodology, C.O.; software, C.B. and C.O.; validation, C.O., C.B. and P.G.-P.; formal analysis, N.M.A.; investigation, N.M.A., P.G.-P. and N.D.; resources, C.O.; data curation, C.O., C.B. and P.G.-P.; writing—original draft preparation, N.M.A. and N.D.; writing—review and editing, C.O.; visualization, P.G.-P. and N.D.; supervision, C.O.; project administration, C.O.; funding acquisition, C.O. All authors have read and agreed to the published version of the manuscript.
Funding
This research was funded by the Valencia Government (Spain) through the project “RECOLECCIÓN INTELIGENTE Y AUTOMATIZADA DE CULTIVOS DE ALTO VALOR EN INVERNADEROS SOSTENIBLES (INNEST/2023/106)” and supported by the NAHEP, World Bank Project Authority, ICAR, New Delhi, Vasantrao Naik Marathwada Krishi Vidyapeeth, Parbhani Project Centre.
Data Availability Statement
Data are contained within the article.
Conflicts of Interest
The authors declare no conflicts of interest.
References
- Erdogan, H.; Sahin, Y.S.; Bütüner, A.K. Potential for early detection of powdery mildew in okra under field conditions using thermal imaging. Sci. Pap.-Ser. Manag. Econ. Eng. Agric. Rural. Dev. 2003, 23, 863–870. [Google Scholar]
- Jain, N.; Jain, R.; Jain, V.; Jain, S. A review on: Abelmoschus esculentus. Pharmacia 2012, 1, 84–89. [Google Scholar]
- VarmuDy, V. Need to boost okra exports. Facts You 2011, 31, 21–23. [Google Scholar]
- FAOSTAT. Food and Agricultural Organization Statistics. Available online: https://www.fao.org/food-agriculture-statistics/resources/en (accessed on 5 June 2024).
- Indian Horticultural Database. Available online: http://www.nhb.gov.in (accessed on 5 June 2024).
- Adelakun, O.E.; Oyelade, O.J.; Ade-Omowaye, B.I.O.; Adeyemi, I.A.; Van de Venter, M. Chemical composition and the antioxidative properties of Nigerian Okra Seed (Abelmoschus esculentus Moench) Flour. Food Chem. Toxicol. 2009, 47, 1123–1126. [Google Scholar] [CrossRef]
- Thöle, C.; Brandt, S.; Ahmed, N.; Hensel, A. Acetylated rhamnogalacturonans from immature fruits of Abelmoschus esculentus inhibit the adhesion of Helicobacter pylori to human gastric cells by interaction with outer membrane proteins. Molecules 2015, 20, 16770–16787. [Google Scholar] [CrossRef] [PubMed]
- Kemiklioglu, E.; Ozen, O. Design of a sensor to detect fruit freshness. Int. J. Sci. Technol. Res. 2018, 4, 1–6. [Google Scholar]
- Culpepper, C.W.; Moon, H.H. The Growth and Composition of the Fruit of Okra in Relation to its Eating Quality; Nº 595; US Department of Agriculture: Washington, DC, USA, 1941.
- Sistrunk, W.A.; Jones, L.G.; Miller, J.C. Okra pod growth habits. Proc. Am. Soc. Hortic. Sci. Am. Soc. Hortic. Sci. Alex. United States Am. 1960, 76, 486–491. [Google Scholar]
- Singh, P.; Tripathi, R.D.; Singh, H.N. Effect of age of picking on the chemical composition of the fruits of okra. Indian. J. Agric. Sci. 1974, 44, 22. [Google Scholar]
- Diaz, F.A.; Ortegon, M.A.S.; Loera, G.J. Fruit characteristics and yield of new okra hybrids. Subtrop. Plant Sci. 1997, 49, 8–11. [Google Scholar]
- Liu, J.; Yuan, Y.; Wu, Q.; Zhao, Y.; Jiang, Y.; John, A.; Wen, L.; Li, T.; Jian, Q.; Yang, B. Analyses of quality and metabolites levels of okra during postharvest senescence by 1H-high resolution NMR. Postharvest Biol. Technol. 2017, 132, 171–178. [Google Scholar] [CrossRef]
- Li, H.; Xie, L.; Ma, Y.; Zhang, M.; Zhao, Y.; Zhao, X. Effects of drying methods on drying characteristics, physicochemical properties and antioxidant capacity of okra. Lwt 2019, 101, 630–638. [Google Scholar] [CrossRef]
- Man, J.; Chen, G.; Chen, J. Recent progress of biomimetic tactile sensing technology based on magnetic sensors. Biosensors 2022, 12, 1054. [Google Scholar] [CrossRef]
- Mineo, C.; Herbert, D.; Morozov, M.; Pierce, S.G.; Nicholson, P.I.; Cooper, I. Robotic non-destructive inspection. In Proceedings of the 51st Annual Conference of the British Institute of Non-Destructive Testing, Northamptonshire, UK, 11–13 September 2012; pp. 345–352. [Google Scholar]
- El-Mesery, H.S.; Mao, H.; Abomohra, A.E.F. Applications of non-destructive technologies for agricultural and food products quality inspection. Sensors 2019, 19, 846. [Google Scholar] [CrossRef]
- Nicolaï, B.M.; Defraeye, T.; De Ketelaere, B.; Herremans, E.; Hertog, M.L.; Saeys, W.; Torricelli, A.; Vandendriessche, T.; Verboven, P. Nondestructive measurement of fruit and vegetable quality. Annu. Rev. Food Sci. Technol. 2014, 5, 285–312. [Google Scholar] [CrossRef]
- Xuan, G.; Gao, C.; Shao, Y.; Wang, X.; Wang, Y.; Wang, K. Maturity determination at harvest and spatial assessment of moisture content in okra using Vis-NIR hyperspectral imaging. Postharvest Biol. Technol. 2021, 180, 111597. [Google Scholar] [CrossRef]
- Mineo, C. Advancements in robotic-enabled sensing: A European perspective. Open Res. Eur. 2024, 4, 39. [Google Scholar] [CrossRef]
- Mandil, W.; Rajendran, V.; Nazari, K.; Ghalamzan-Esfahani, A. Tactile-sensing technologies: Trends, challenges and outlook in agri-food manipulation. Sensors 2023, 23, 7362. [Google Scholar] [CrossRef]
- Mayol-Cuevas, W.W.; Juarez-Guerrero, J.; Munoz-Gutierrez, S. A first approach to tactile texture recognition. In Proceedings of the IEEE International Conference on Systems, Man, and Cybernetics, San Diego, CA, USA, 14 October 1998; Volume 5, pp. 4246–4250, Cat. No. 98CH36218. [Google Scholar]
- De Ketelaere, B.; Howarth, M.S.; Crezee, L.; Lammertyn, J.; Viaene, K.; Bulens, I.; De Baerdemaeker, J. Postharvest firmness changes as measured by acoustic and low-mass impact devices: A comparison of techniques. Postharvest Biol. Technol. 2006, 41, 275–284. [Google Scholar] [CrossRef]
- Delwiche, M.J.; McDonald, T.; Bowers, S.V. Determination of peach firmness by analysis of impact forces. Trans. ASAE 1987, 30, 249–0254. [Google Scholar] [CrossRef]
- Shmulevich, I.; Galili, N.; Howarth, M.S. Nondestructive dynamic testing of apples for firmness evaluation. Postharvest Biol. Technol. 2003, 29, 287–299. [Google Scholar] [CrossRef]
- Ragni, L.; Berardinelli, A.; Guarnieri, A. Impact device for measuring the flesh firmness of kiwifruits. J. Food Eng. 2010, 96, 591–597. [Google Scholar] [CrossRef]
- Ortiz, C.; Blanes, C.; Gonzalez-Planells, P.; Rovira-Más, F. Non-Destructive Evaluation of White-Flesh Dragon Fruit Decay with a Robot. Horticulturae 2023, 9, 1286. [Google Scholar] [CrossRef]
- Scimeca, L.; Maiolino, P.; Cardin-Catalan, D.; del Pobil, A.P.; Morales, A.; Iida, F. Non-destructive robotic assessment of mango ripeness via multi-point soft haptics. In Proceedings of the IEE International Conference on Robotics and Automation, Montreal, QC, Canada, 20–24 May 2019; pp. 1821–1826. [Google Scholar]
- Sun, J.; Ma, B.; Dong, J.; Zhu, R.; Zhang, R.; Jiang, W. Detection of internal qualities of hami melons using hyperspectral imaging technology based on variable selection algorithms. J. Food Process Eng. 2017, 40, e12496. [Google Scholar] [CrossRef]
- Zhu, H.; Chu, B.; Fan, Y.; Tao, X.; Yin, W.; He, Y. Hyperspectral imaging for predicting the internal quality of kiwifruits based on variable selection algorithms and chemometric models. Sci. Rep. 2017, 7, 7845. [Google Scholar] [CrossRef]
- Munera, S.; Amigo, J.M.; Aleixos, N.; Talens, P.; Cubero, S.; Blasco, J. Potential of VIS-NIR hyperspectral imaging and chemometric methods to identify similar cultivars of nectarine. Food Control 2018, 86, 1–10. [Google Scholar] [CrossRef]
Disclaimer/Publisher’s Note: The statements, opinions and data contained in all publications are solely those of the individual author(s) and contributor(s) and not of MDPI and/or the editor(s). MDPI and/or the editor(s) disclaim responsibility for any injury to people or property resulting from any ideas, methods, instructions or products referred to in the content. |
© 2024 by the authors. Licensee MDPI, Basel, Switzerland. This article is an open access article distributed under the terms and conditions of the Creative Commons Attribution (CC BY) license (https://creativecommons.org/licenses/by/4.0/).