Abstract
Agriculture in controlled environments has gained popularity over time. Compared to traditional agriculture, controlled environments emerge as an alternative to mitigate the negative impacts of conventional farming methods. However, controlled environment agriculture, particularly plant factories with artificial lighting, incurs higher electricity costs, primarily for supplemental lighting and dehumidification of the cultivation area. Given these high costs, it is crucial to understand how efficiently plants utilize available light to convert it into biomass. This understanding can be used to design lighting strategies to reduce electricity usage. In this study, we cultivated ‘Rex’ lettuce (Lactuca sativa) plants on a soilless substrate and used an ebb-and-flow system for irrigation and fertilization. Plants grew in varying photosynthetic photon flux density (PPFD) levels ranging from 125 to 375 µmol·m−2·s−1 and were assessed for various physiological responses. Our findings revealed that plants exposed to higher light levels exhibited greater final dry weight, increased photosynthetic activity, higher water use efficiency, and accelerated growth compared to those under lower light conditions. Notably, plants subjected to higher light intensities did not show a significant increase in transpiration, suggesting a potential trade-off between energy expenditure on supplemental lighting and dehumidification. This finding opens the possibility of reducing energy consumption for dehumidification and achieving economic savings by subjecting plants to optimal growing conditions for shorter durations. This depends on whether higher savings on dehumidification are achieved compared to the energy required to maintain high PPFD levels.
1. Introduction
Agriculture is consistently associated with environmental problems, which have been aggravated due to the industrialization of this activity [1]. One of the main repercussions is water pollution. Often, the fate of residuals of chemical products is waterbodies. This water is subsequently consumed by living organisms that, in the worst scenario, can cause lethal effects [2]. Soils are also affected by agriculture. Constant tillage increases soil erosion [3], and the use of heavy machinery produces soil compaction [4]. Furthermore, the use of low-quality water and the inadequate use of fertilizers and pesticides can lead to the loss of organic matter and nutrients and increase soil salinity. This would result in a decrease in the soil’s productivity [5]. Agriculture also indirectly affects the environment. Most of the time, agricultural products have to be transported over long distances from the cultivation site to the final consumer. This transportation process contributes to the emission of greenhouse gases [6]. Additionally, in this process, close to 25–30% of global food is lost [7].
In the last few years, controlled environment agriculture (CEA) has become popular. Contrary to traditional agriculture, CEA uses less water and does not need soil for cultivation [8]. As soil is not needed, the use of herbicides is completely removed from the growing system [9], and the use of pesticides is considerably reduced. Further, CEA has high water use efficiency (WUE) and, in the case where a hydroponics system is used, the water consumption is 12.5 times lower when compared to traditional agriculture [10]. Additionally, by using CEA systems like plant factories with artificial lighting (PFAL), food production can take place close to urban areas [11].
PFAL refers to a closed growing space similar to a warehouse with multiple shelves vertically stacked. To produce food in a PFAL, various components are required. The space has to be sealed because carbon dioxide (CO2), a source of artificial light, a system that provides irrigation and fertilization to plants, fans and air conditioning, and finally, a system that controls the environment parameters is provided [11].
Despite the benefits that PFAL has in producing food, there are some high costs in its operations. This is the case of electricity, which might account for around 60% of the total operation costs every year [12]. Most of that energy is used to power the lighting and dehumidification systems [13]. Due to the high electricity cost of these agricultural systems, it is important to understand how efficiently they use the provided light to reduce electricity use associated with lighting and dehumidification.
Various studies have examined light use efficiency (LUE) under different light levels in controlled environments for different crops. Most of these studies have assessed LUE based on the total incident light in the growing area rather than the light intercepted by plants relative to their canopy area [14,15]. In contrast, there has been less focus on transpiration and water use efficiency (WUE), two physiological parameters closely linked to the dehumidification process in indoor controlled environments.
In this study, we cultivated lettuce (Lactuca sativa) plants under varying photosynthetic photon flux density (PPFD) levels ranging from 125 to 375 µmol·m−2·s−1 and assessed various physiological responses, particularly transpiration and WUE. We hypothesized that dry weight, photosynthesis, and transpiration would increase for plants subjected to higher PPFD levels.
2. Materials and Methods
2.1. Experimental Setup and Treatments
This study was performed at the University of Georgia, Athens, GA (latitude 33°57′26.676″ N, longitude 83°22′36.48″ W), in a walk-in growth chamber measuring 4.4 × 4.1 m in (width × length) from June to August 2022. Cooling was achieved through a top-mounted refrigeration system, and a dehumidifier controlled the relative humidity within the chamber. CO2 levels were monitored and regulated by a CO2 transmitter (GMC20; Vaisala, Helsinki, Finland) and a datalogger (CR6, Campbell Scientific, Logan, UT, USA), which triggered a solenoid valve to release CO2 from a compressed gas cylinder in 1 s intervals whenever concentrations fell below 800 µmol mol−1. Temperature and relative humidity were recorded every ten seconds using a probe (HMP50; Vaisala, Helsinki, Finland) connected to the datalogger, and these measurements were used to calculate the vapor pressure deficit (VPD). The average experimental conditions during the whole growing period were the following (means ± standard deviation): temperature of 23.50 ± 0.2140 °C, relative humidity of 65.22% ± 8.479%, CO2 concentration of 855.9 ± 65.48 mg·L−1, and a VPD of 1.011 ± 0.2545 kPa.
Three metal racks (each representing a block) were placed in the walk-in growth chamber. Each rack had three horizontal shelves, and each shelf was vertically divided into two equal parts to create six growing spaces per rack and 18 growing spaces in total. Two light-emitting diode (LED) fixtures (SPYDRx Plus with PhysioSpec indoor spectrum; Fluence Bioengineering, Austin, TX, USA) were placed above each growing space. Details of the light spectrum and rack layout are provided in Supplemental Figures S1 and S2. Additionally, four small fans (AD0412HB-C50; ADDA, Orange, CA, USA), evenly separated, were installed on the sides of each growing space to provide airflow. This study had six lighting treatments assigned in a randomized complete block pattern in the growing spaces. The lighting treatments were controlled using six dimmable drivers (4009715; Intertek/Fluence, Arlington, VA, USA). Each driver controlled three growing spaces (with the same lighting treatment), one per rack.
Plants were grown under six different photosynthetic photon flux density (PPFD) levels, and all treatments had a photoperiod of 20 h (Table 1). The different PPFD levels were controlled using a datalogger (CR6; Campbell Scientific, Logan, UT, USA), which sent dimming signals to the six LED drivers. The PPFD levels were measured at the middle of each growing space, at the pot-top level, using a quantum sensor (MQ-500; Apogee Instruments, Logan, UT, USA).

Table 1.
Six Photosynthetic Photon Flux Density (PPFD) levels and their corresponding daily light integral (DLI). Values are PPFD and DLI values averaging three growing spaces ± SD.
2.2. Plant Material
Ten cm square plastic pots were filled to a centimeter from the top edge with the soilless substrate (Metro-Mix® 830 Professional Growing Mix; Sun Gro Horticulture, Agawam, MA, USA). Three pelleted Butterhead ‘Rex’ lettuce seeds (REX MT OG-Pellet; Johnny’s Selected Seeds, Winslow, ME, USA) were sowed in each pot, and subsequently, the substrate was covered with calcined clay (Turface MVP; Turface Athletics, Buffalo Grove, IL, USA). Fifteen pots were placed in trays in a 5 × 3 array and inside the growing spaces. When the seeds germinated, thinning was performed to leave one seedling per pot to finally obtain fifteen plants per growing space. This resulted in having fifteen plants sowed in a 150 cm2 area. Plants were irrigated and fertilized by using an ebb-and-flow subirrigation system that provided a nutrient solution with 100 mg·L−1 of nitrogen using a 15N–2.2P–12.45K water-soluble fertilizer (Jack’s Professional® LX 15-5-15 Cal-Mag LX; JR Peters, Allentown, PA, USA). Plants were harvested 30 days after sowing.
2.3. Data Collection and Calculations
Canopy images were taken the first time after 7 days of sowing the seeds and twice weekly using a chlorophyll fluorescence imaging setup. In this set up we utilized a monochrome camera (CM3-U3-31S4M-CS, Chameleon3 USB3 camera, FLIR Systems, Inc., Arlington, VA, USA) equipped with a 665 nm long pass filter (LP665 Dark Red Long pass Filter; Midopt Midwest Optical Systems, Inc., Palatine, IL, USA) coupled to the lens. The camera was positioned to face downward inside a grow tent measuring 1.2 m × 0.6 m × 1.5 m. Additionally, two blue LED panels (11GRL009-LED_v; AplusChoice, Atlanta, GA, USA) were installed inside the tent next to the camera to stimulate chlorophyll and promote fluorescence [16]. Images were analyzed using a custom Python script to determine the projected canopy size (PCS), which is a morphological measure [16]. PCS measures the plant’s projected canopy area from a top view and it is used to determine the incident amount of light that plants can intercept.
The PCS was plotted against days after sowing (DAS), and the sigmoidal curve {PCS = a/[1 + e − (DAS − x0)/b]} was fitted to the data (SigmaPlot 11.0, Systat Software, San Jose, CA, USA).
From the regression equations, the PCS for each day (DAS 1 to 30) of the growing cycle was estimated. The daily PCS was multiplied by the DLI for each light treatment to calculate the daily incident light received by the canopy of each group of plants on each day of the growing cycle [incident daily light integral (mol·d−1) = PCS (mm2) × DLI (mol·m−2·d−1)]. Using these values, the incident light on the canopy throughout the whole growing cycle was calculated.
Prior to harvesting the plants, we visually examined each plant tray from all treatments to assess the occurrence of tipburn in the plants and captured overhead photos to document this condition. Shoots of the plants from each growing space were harvested and placed in a drying oven at 80 °C for 72 h, and the final dry weight was measured. Light use efficiency (LUE, g·mol−1) was calculated as shoot biomass (g)/total incident light (mol). The number of days that the crops needed to reach a specific size (25%, 50%, 75%, and 100% of coverage of the trays that held the plants, 0.15 m2) was calculated based on the estimated PCS for each day of the growing cycle.
Net photosynthesis and transpiration were measured, and WUE was calculated [Assimilation (µmol·m−2·d−1)/Transpiration (mmol·m−2·d−1)] on one of the plants from each growing space at 28 DAS using a portable photosynthesis system (CIRAS-3; PP Systems, Amesbury, MA, USA).
2.4. Statistical Analysis
We used linear regression to determine the effect of different light levels on dry weight, total incident light, light use efficiency, efficiency of photosystem II, electron transport rate, net photosynthesis, transpiration, and water use efficiency. Also, linear regression was also used to assess the effect of total incident light on fry weight and the effect of electron transport rate on net photosynthesis. Additionally, we employed an analysis of variance (ANOVA) to evaluate the differences in the number of days required for plants to achieve specific sizes depending on the light level they grew under. For linear regression and ANOVA, we used statistical software (R version 4.1.2; R Project for Statistical Computing, Vienna, Austria).
3. Results
3.1. Dry Weight
The final total shoot dry weight showed a positive correlation with PPFD. Lettuce plants exhibited higher final total shoot dry weight when grown under higher PPFD levels (p < 0.0001) (Figure 1). Specifically, an increase of 50 µmol·m−2·s−1 from 125 to 175 µmol·m−2·s−1 resulted in a 1.5-fold increase in dry weight. Similarly, for subsequent increases of 50 µmol·m−2·s−1 from 175 µmol·m−2·s−1 for the remaining PPFD levels, a dry weight gain of 1.1 times was observed in comparison to the respective previous PPFD level.
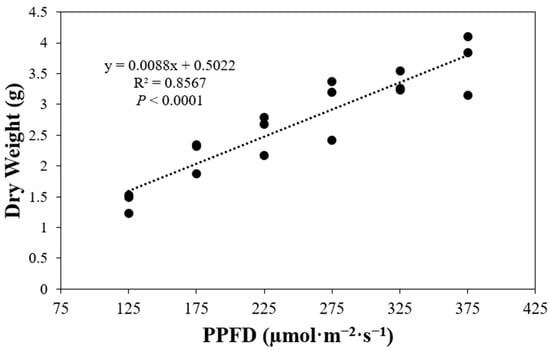
Figure 1.
Final total shoot dry weight per plant of ‘Rex’ lettuce (Lactuca sativa) grown under different photosynthetic photon flux densities (PPFDs).
3.2. Total Incident Light
The average total incident light per plant showed a positive correlation with the photosynthetic photon flux density (PPFD) (Figure 2). A higher PPFD level corresponded to a greater total incident light received by plants throughout their growth cycle, from germination to the harvest day (p < 0.0001). The PPFD levels in each treatment increased by 50 µmol·m−2·s−1, ranging from 125 to 375 µmol·m−2·s−1. Comparing the total incident light at different PPFD levels, the results showed that at a PPFD of 175 µmol·m−2·s−1, the total incident light increased by 1.5 times compared to a PPFD of 125 µmol·m−2·s−1. Similarly, at PPFDs of 225, 275, and 325 µmol·m−2·s−1, the total incident light increased by 1.2 times compared to the previous PPFD level. Finally, at a PPFD of 375 µmol·m−2·s−1, the total incident light increased by 1.1 times compared to a PPFD of 325 µmol·m−2·s−1.
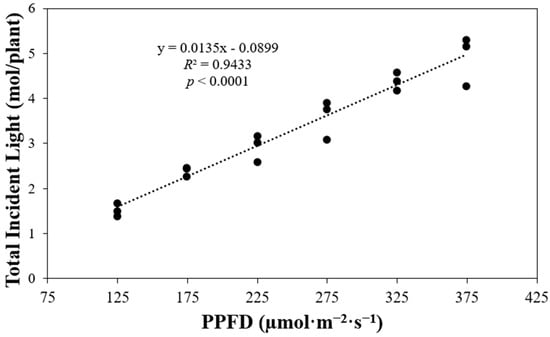
Figure 2.
Calculated total incident light received by plants of ‘Rex’ lettuce (Lactuca sativa) growing under different photosynthetic photon flux densities (PPFDs) from germination to harvest.
3.3. Dry Weight in Relation to Total Incident Light
The final total shoot dry weight per plant had a positive correlation with the total incident light received by plants throughout their entire life cycle in this study from germination to harvest (p < 0.0001) (Figure 3). As the total incident light increased from approximately 1.5 mol to values approaching 5 mol, the final total shoot dry weight increased by approximately 2.6 times.
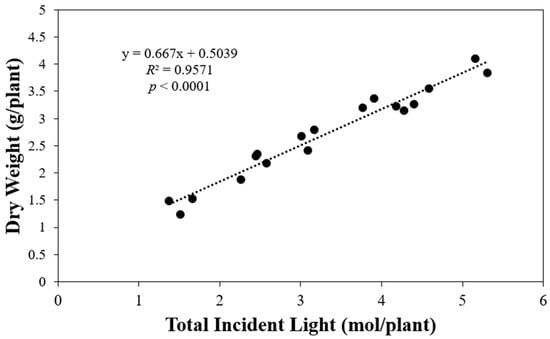
Figure 3.
Final shoot dry weight of ‘Rex’ lettuce (Lactuca sativa) per plant in response to increasing total incident light received by a plant from germination to harvest.
3.4. Light Use Efficiency
In this study, light use efficiency (LUE) was calculated as the ratio of total dry shoot biomass to total incident light. LUE demonstrated a negative correlation with PPFD levels (p = 0.0002) (Figure 4). Plants growing under high PPFD levels exhibited lower LUE values. Specifically, LUE decreased by around 0.9 times with each increase in the PPFD level tested in this study.
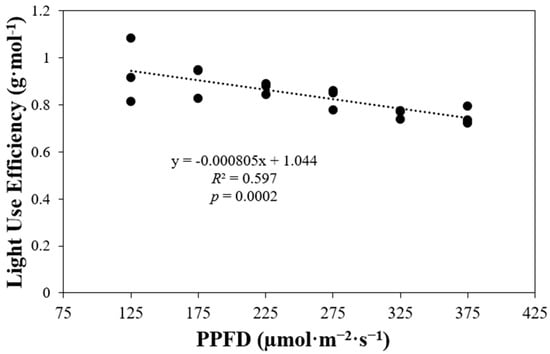
Figure 4.
Plant light use efficiency of ‘Rex’ lettuce (Lactuca sativa) in response to increasing different photosynthetic photon flux densities (PPFDs).
3.5. Photochemical Efficiency or Quantum Yield of Photosystem II
The photochemical efficiency or quantum yield of photosystem II (ΦPSII) was indirectly correlated with PPFD levels (p = 0.0005). The higher the PPFD value, the lower the ΦPSII observed in plants (Figure 5). Specifically, the ΦPSII of plants growing under a PPFD of 125 µmol·m−2·s−1 was 1.1 times higher than the ΦPSII of plants growing under a PPFD of 375 µmol·m−2·s−1.
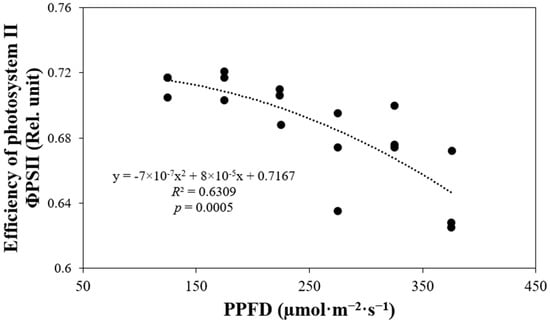
Figure 5.
Photochemical efficiency or quantum yield of photosystem II (ΦPSII) of ‘Rex’ lettuce (Lactuca sativa) in response to increasing photosynthetic photon flux densities (PPFDs).
3.6. Photosynthesis and Electron Transport Rate
Net photosynthesis and electron transport rate exhibited a significant positive correlation with photosynthetic photon flux density (p < 0.0001) (Figure 6). As the PPFD levels increased, both net photosynthesis and electron transport rates also increased. Specifically, the electron transport rate increased by 2.7 times when comparing plants grown under a PPFD of 125 µmol·m−2·s−1 to those grown under a PPFD of 375 µmol·m−2·s−1. Similarly, for the same intervals of light levels, net photosynthesis increased by 3.4 times.
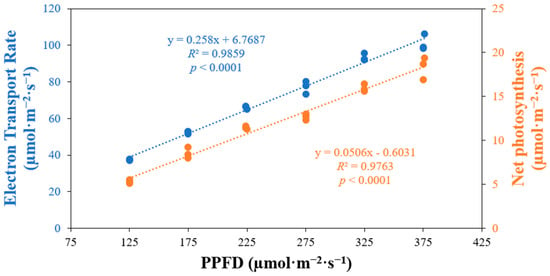
Figure 6.
Net photosynthesis and electron transport rate of ‘Rex’ lettuce (Lactuca sativa) in response to increasing photosynthetic photon flux densities (PPFDs).
We found a positive correlation between electron transport rate and net photosynthesis (p < 0.0001) (Figure 7). Increased electron transport rate corresponded to higher net photosynthesis values. Specifically, when the electron transport rate increased from approximately 40 to 100 µmol·m−2·s−1, net photosynthesis grew nearly 3.4 times.
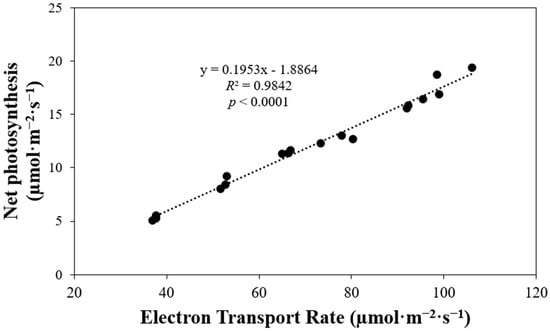
Figure 7.
Net photosynthesis of ‘Rex’ lettuce (Lactuca sativa) in response to increasing electron transport rate.
3.7. Transpiration
Plant transpiration did not exhibit a linear correlation with varying light levels (p = 0.031) (Figure 8). The transpiration rate of plants exposed to a PPFD of 175 µmol·m−2·s−1 was 1.2 times higher than that of plants grown under a PPFD of 125 µmol·m−2·s−1. However, transpiration rates remained similar across the treatments, ranging from a PPFD of 175 to 375 µmol·m−2·s−1.
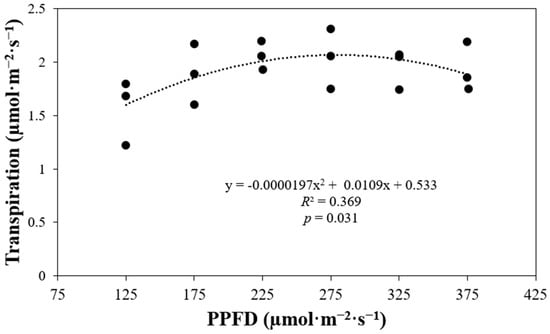
Figure 8.
Plant transpiration of ‘Rex’ lettuce (Lactuca sativa) in response to increasing photosynthetic photon flux densities (PPFDs).
3.8. Water Use Efficiency
WUE displayed a significant positive correlation with the various light levels under which plants were grown (p < 0.0001) (Figure 9). Plants cultivated under higher PPFD values exhibited greater WUE. For each incremental increase of 50 µmol·m−2·s−1 in PPFD, WUE values increased by factors of 1.3, 1.2, 1.1, 1.3, and 1.6, respectively.
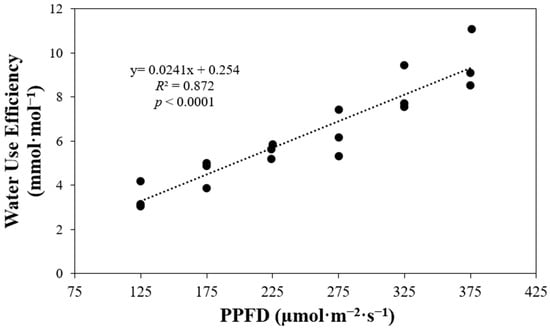
Figure 9.
Plant water use efficiency of ‘Rex’ lettuce (Lactuca sativa) in response to increasing photosynthetic photon flux densities (PPFDs).
3.9. Plant Growth Rate
To compare plant growth rates, we calculated the number of days it would take for plants to achieve various coverage percentages on a reference area. The number of days was estimated from the sigmoidal curves fitted to the projected canopy size (PCS) data (Figure 10).
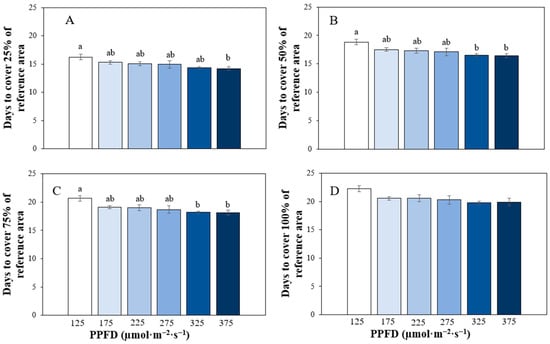
Figure 10.
Number of days plants of ‘Rex’ lettuce (Lactuca sativa) growing under different photosynthetic photon flux densities (PPFDs) needed to cover 25% (A), 50% (B), 75% (C) and 100% (D) of a reference area (0.15 m2). Bars represent means ± standard error (n = 3), and different letters denote significant differences in means at α = 0.05.
Plants cultivated under different PPFDs required varying durations to cover specific percentages of the reference area. For instance, to cover 25% of the reference area, plants grown under PPFDs of 125, 175, 225, 275, 325, and 375 µmol·m−2·s−1 took approximately 16.22, 15.3, 15.05, 14.95, 14.35, and 14.2 days, respectively. The number of days needed to reach this coverage was only significantly different (F5,12 = 03.1, p = 0.05) between plants grown under 125 and 375 µmol·m−2·s−1 (p = 0.041) (Figure 10A).
Similarly, for achieving 50% coverage, plants under 125, 175, 225, 275, 325, and 375 µmol·m−2·s−1 required an average of 18.83, 17.52, 17.3, 17.1, 16.55, and 16.39 days, respectively. The number of days needed to cover 50% of the reference area was significantly (F5,12 = 3.94, p = 0.023) different only between plants under 125 and 325 µmol·m−2·s−1 (p = 0.03) and 375 µmol·m−2·s−1 (p = 0.019) (Figure 10B).
Moreover, to achieve 75% coverage, plants under 125, 175, 225, 275, 325, and 375 µmol·m−2·s−1 took approximately 20.65, 19.1, 18.97, 18.7, 18.2, and 18.09 days, respectively. Again, the number of days required to reach this coverage was significantly different (F5,12 = 3.78, p = 0.027) only between plants under 125 and 325 µmol·m−2·s−1 (p = 0.031) and 375 µmol·m−2·s−1 (p = 0.023) (Figure 10C).
Finally, to cover 100% of the reference area, plants under 125, 175, 225, 275, 325, and 375 µmol·m−2·s−1 needed approximately 22.24, 20.54, 20.59, 20.27, 19.83, and 19.89 days, respectively. No significant differences were observed between treatments when covering the entire reference area (100% coverage) (Figure 10D).
3.10. Tipburn
We took top-view pictures of trays of plants growing under different light levels before they were harvested. We observed that some plants growing under 325 and 375 µmol·m−2·s−1 presented tipburn on their leaves.
4. Discussion
4.1. Dry Weight, Total Incident Light, and Plant Growth Rate
The dry weight or biomass accumulation increased as the PPFD levels in our treatments increased (Figure 1). This relationship has been reported before in green cultivars of Portulaca oleracea [17], lettuce ‘Green Salad Bowl’ and mizuna (Brassica rapa var. japonica) [16], in lettuce ‘Rebelina’ and basil (Ocimum basilicum cv. ‘Superbo’) [14], and in lettuce ‘Rex’ and ‘Rouxai’ [18]. Photosynthesis rises with increasing PPFDs until reaching a saturation point, beyond which further increases in PPFDs do not increase leaf photosynthesis [19]. Then, the amount of light that reaches the plants is closely associated with plant growth [20]. This aligns with the findings of our study, where plants grown under 375 µmol·m−2·s−1 exhibited greater biomass accumulation and consequently higher levels of photosynthesis compared to those under 125 µmol·m−2·s−1. Additionally, plants grown under 375 µmol·m−2·s−1 intercepted more light throughout the crop cycle (Figure 2), indicating greater potential for plant growth. In fact, we observed a strong correlation between the final biomass produced by plants and the amount of light they intercepted throughout the entire crop cycle (Figure 3). This relationship has been reported before for sweet basil [21]. They argue that a greater amount of available light for plants was linked to increased light interception and, consequently, higher biomass production. Furthermore, Anthurium (Anthurium andreanum) ‘Pink Champion’ and ‘Royal Champion’ and lettuce [22] exhibited greater biomass accumulation when the intercepted light was higher [23].
Plant growth is not only reflected in final biomass accumulation. In this study, we assessed plant growth rate by utilizing the PCS of plants and measuring the time taken for it to cover various percentages of a reference area. Since plants with larger a PCS intercept more light [24], more photosynthesis can take place and produce more biomass [20], which, at the same time, is translated into more leaf surface. This correspondence is shown in our study since plants growing under 375 µmol·m−2·s−1 took less amount of time to cover a reference area at different levels (25% to 75% coverage) in comparison to plants growing under 125 µmol·m−2·s−1. Plants under 375 µmol·m−2·s−1 received higher light intensities, increasing biomass production. Consequently, these plants intercepted larger amounts of light and, as a result, exhibited faster growth. However, when we calculated the number of days that plants needed to cover 100% of the reference area, significant differences were absent due to canopy overlap. However, the trend of plants requiring less time to achieve the same area under higher PPFDs was consistent.
4.2. Light Use Efficiency
Light Use Efficiency (LUE) is a physiological measure of the efficiency with which plants convert incident light into biomass [16,25]. In our study, plants grown under a high PPFD (375 µmol·m−2·s−1) exhibited less efficient conversion of light into biomass compared to those grown under 125 µmol·m−2·s−1. It is not simple to compare LUE values in lettuce with other studies done on lettuce before [14,15]. They calculated their LUE depending on their cultivation area, and LUE results were affected by the plant density in their studies. In our study, we calculated LUE with light values reaching the canopy of our plants. However, similar results were reported on lettuce ‘Green Salad Bowl’ that had a reduction of LUE for plants growing at a PPFD higher than 350 µmol·m−2·s−1 and mizuna that showed a decrease in LUE for plants growing at a PPFD higher than 200 µmol·m−2·s−1. Their reduction in LUE with increasing PPFDs was explained as a consequence of a decrease in ΦPSII with a rise in PPFD levels. Similar results were obtained in Lemna gibba [26]. On the contrary, a different response has been seen in the relationship between LUE and PPFDs or light levels on lettuce ‘Rebelina’ and basil ‘Superbo’ [14]. They found an increase in LUE between plants growing under around 5 mol·m−2·d−1 (from 100 µmol·m−2·s−1) and 15 mol·m−2·d−1 (250 µmol·m−2·s−1). The only reduction of LUE for both species was found for plants growing under 17 mol·m−2·d−1 (250 µmol·m−2·s−1) compared to the ones growing under 15 mol·m−2·d−1.
LUE is reduced when the incident energy from light cannot be transferred into the photochemical process. For plants growing under high light levels, more PSIIs are closed, impeding them from accepting more excitation energy [27]. When fewer reaction centers are open in photosystem II (PSII), the incident energy has to be dissipated [28] and is not used for photosynthesis-reducing LUE. Additionally, the accumulation of excess excitation energy at high light conditions could lead to photoinhibition due to damage to reaction centers, which would reduce photosynthetic efficiency [29].
4.3. Efficiency of Photosystem II
In this study, ΦPSII decreased when the PPFD levels increased. A decrease in ΦPSII is associated with a higher dissipation of energy from absorbed light in the form of heat (non-photochemical quenching) as a consequence of PSII reaction center closure or due to photoinhibition [30]. In the presence of high light, the PSII reaction centers close because the main electron acceptor cannot transfer the absorbed electrons to be transported through the electron transport chain [30]. The electron acceptor QA in PSII cannot accept more electrons if it has not transferred its current electron to QB. Energy must be dissipated, which lowers ΦPSII [31].
This reduction in ΦPSII with increasing PPFD has been observed in lettuce ‘Green Salad Bowl’ and mizuna growing under different lighting treatments from 50 to 425 µmol·m−2·s−1 [16]. Additionally, ΦPSII was measured at different light levels (from 0 to 1600 µmol·m−2·s−1) for Phragmites australis and Spartina alterniflora plant growth under different waterlogging and salinity levels showing similar results [32].
4.4. Electron Transport Rate and Photosynthesis
The electron transport rate (ETR) directly assesses the light-dependent reactions in photosynthesis, responding to variations in different light levels. ETR plays a pivotal role in driving photosynthesis and, consequently, influences crop growth [33]. This relationship between ETR and photosynthesis was seen in our study. We observed that higher ETR values were positively correlated to higher photosynthesis responses (Figure 7). Additionally, both ETR and photosynthesis in our study increased when the PPFD values of our treatments increased (Figure 6). The increased ETR and the previously mentioned reduction in ΦPSII in response to higher PPFDs indicate a trade-off between photochemistry efficiency and electron transport. With higher PPFDs, more PSII reaction centers are closed, enhancing the protective mechanism against high light levels [27]. Higher ETRs as the response to higher light levels have been reported in lettuce ‘Green Towers’ [27], moss (Hennediella heimii) [34], and Launaea sarmentosa until 1000 µmol·m−2·s−1 [35].
As mentioned, net photosynthesis also increased when plants grew with higher PPFD levels. The available PPFD primarily influences photosynthesis. Leaf photosynthetic rate rises linearly with increasing PPFDs, followed by a quadratic trend until the light saturation point is reached. Beyond this point, further increases in the PPFD do not lead to additional photosynthesis [18]. The photosynthetic response to our treatments did not display the quadratic trend described; rather, it remained linear. This suggests that the lighting treatments in our study were not sufficient to reach or approach a light saturation point. Even so, similar results have been reported previously in lettuce ‘Romaine’ [36,37] and ‘Cos’ [38], sweet pepper (Capsicum annuum L.) [39], ‘Cos’ lettuce and Zizania latifolia [40] and dwarf tomato (Solanum lycopersicum L.) ‘Micro-Tom’ [41].
4.5. Transpiration and Water Use Efficiency
In our study, plants grew under different light levels depending on the treatment. We observed that transpiration rates were higher for plants growing under 225 µmol·m−2·s−1 compared to those under 125 µmol·m−2·s−1. For the remaining treatments, transpiration did not show significant increases. Nonetheless, an overall increasing trend was noted (Figure 9). In comparison, Gavhane et al. [42] reported in increase an increase in transpiration when plants were subjected to PPFDs from around 400 to 1200 µmol·m−2·s−1 in plants of lettuce ‘Glendana’ growing in greenhouse conditions with extra supplemental light and no CO2 enrichment. Similarly, Albornoz et al. [43] observed an increase in transpiration with increasing PPFDs (from 400 to 2000 µmol·m−2·s−1) regardless of the nutrient solution treatments. However, their plants were grown under the same lighting conditions (greenhouse conditions) with no CO2 enrichment, and the physiological measurements were made under different lighting levels provided by the portable photosynthesis system they used.
Transpiration is linked to blue light and its receptors, phototropins 1 and 2. Upon receiving blue light, these receptors trigger a movement of H+ out and K+ into guard cells, resulting in stomatal opening. More stomata opening will produce more transpiration, and at the same time, this would facilitate CO2 fixation, increasing photosynthetic rates [44]. Also, at high light levels or intense radiative heat, transpiration helps to cool off the leaf [45]. Furthermore, plants grown and developed under low light intensities have exhibited lower stomatal conductance compared to those grown under high light intensities [46]. This increase in stomatal conductance may be associated with differing transpiration rates. Finally, stomatal conductance is decreased at elevated CO2 concentrations [45], which also would have a role in the slow rise in transpiration with increasing PPFD in our study.
WUE represents the relationship between carbon biomass production and transpiration. At a leaf level, this could be calculated as the ratio of the assimilation rate and transpiration rate [47]. This is how WUE is calculated using the equipment used in this study. We observed a linear increase in WUE with rising PPFDs (Figure 10). This relationship was consistent with the linear increase in assimilation or photosynthesis observed in our study, and transpiration showed a comparatively lower rate of increase. This means that photosynthesis increased at a higher rate than transpiration; in other words, plants growing under higher PPFDs had higher photosynthesis while losing less water through transpiration compared to plants growing under lower PPFDs.
Similarly, increasing WUEs with high PPFDs was found to increase lettuce ‘Rebelina’ and basil ‘Superbo’ for plans growing under different PPFDs (from 100 to 300 µmol·m−2·s−1), producing DLIs from 5.8 to 17.3 mol·m−2·d−1 [14]. Also, this relationship was found in other species such as grain sorghum (Sorghum bicolor (L.) Moench) [48] and black pine (Pinus nigra Arn.) for plants tested until approximately 500 µmol·m−2·s−1 [49] and lettuce ‘partavousi’ [50].
4.6. Tipburn
Tipburn is manifested as necrosis at the edges of young, fast-developing leaves and is produced by a low calcium content on young and developing tissues with low transpiration rates [51]. In plants, calcium moves mostly through the xylem following a transpiration flow [52], which explains the incidence of this physiological disorder in said tissues with low transpiration. Tipburn presence has been reported in lettuce when growing under high light intensities. Sago [53] reported a direct relationship between the number of leaves exhibiting tipburn and the light levels under which the plants were growing (150, 200, 250, and 300 µmol·m−2·s−1). We found similar results in our study. Before harvesting plants, we took top-view pictures of plants growing under different light levels to document the appearance of tipburn. We observed tipburn for plants growing under 325 and 375 µmol·m−2·s−1. Our plants grew faster when light levels were higher (Figure 10), which explains why plants growing under 325 and 375 µmol·m−2·s−1 showed more tipburn incidence.
5. Conclusions
There is a tradeoff between fast growth (high PPFD) and high LUE (low PPFD) since higher PPFDs result in low LUEs and high WUEs. Additionally, we observed that plants growing under high PPFD levels grow faster, which may have some economic implications. First of all, to achieve high PPFD levels, a higher energy input is required. On the other hand, if plants grow faster, they will occupy the growing space for a shorter period, thus allowing us to increase the number of crop cycles we can produce in a certain time. Additionally, at higher PPFD levels, the WUE is higher, and transpiration increases but at low rates. This suggests that the humidity to be removed from the growing space for plants exposed to high PPFD levels may not differ significantly from those under low PPFD levels. Therefore, growing plants under high PPFD levels prompts consideration of a potential tradeoff between the energy consumption for lighting and dehumidification.
This depends on whether the savings from reduced dehumidification outweigh the energy needed to sustain high PPFD levels. Additionally, it would be useful to test the same physiological parameters at the whole plant level to determine if these results can be generalized to the entire plant. If so, calculations should be made for the energy requirements to dehumidify a specific space and compare it to the energy needed to achieve specific PPFD levels. Furthermore, the issue of tipburn incidence at high PPFD levels must be fixed. Research could be conducted on developing cultivars that are less susceptible to tipburn, as well as on growing conditions that might help reduce its incidence specifically for controlled environments. Finally, lighting decisions cannot be made solely based on biomass production, LUE, or WUE (different physiological and economic factors should be considered jointly).
Supplementary Materials
The following supporting information can be downloaded at: https://zenodo.org/doi/10.5281/zenodo.13225912, Figure S1: The electromagnetic spectrum emitted by light-emitting diodes (LED) fixtures (SPYDRx Plus with PhysioSpec indoor spectrum; Fluence Bioengineering, Austin, TX, USA), and https://zenodo.org/doi/10.5281/zenodo.13350622, Figure S2: Diagram of a metal rack with three shelves divided vertically to conform six growing spaces in the walk-in growth chamber. Each growing space had a different light level to end up with six different treatments in the rack (one per growing space). Three of these racks were placed inside the walk-in growth chamber, completing 18 growing spaces in total.
Author Contributions
Conceptualization, A.M.M.-G. and M.W.v.I.; methodology, A.M.M.-G. and M.W.v.I.; validation, A.M.M.-G. and M.W.v.I.; formal analysis, A.M.M.-G. and M.W.v.I.; investigation, A.M.M.-G. and M.W.v.I.; resources: M.W.v.I. and R.S.F.; data curation, A.M.M.-G.; writing—original draft preparation, A.M.M.-G. and R.S.F.; writing—review and editing, A.M.M.-G. and R.S.F.; visualization, A.M.M.-G., M.W.v.I. and R.S.F.; supervision, M.W.v.I. and R.S.F.; project administration, M.W.v.I. and R.S.F.; funding acquisition, M.W.v.I. All authors have read and agreed to the published version of the manuscript.
Funding
This study was funded by the U.S. Department of Agriculture–National Institute of Food and Agriculture–Specialty Crop Research Initiative Award No. 2018-51181-28365 (Project “LAMP: Lighting Approaches to Maximize Profits”), the Department of Horticulture, the College of Agricultural and Environmental Sciences, and the Office of the Senior Vice President for Academic Affairs and Provost.
Data Availability Statement
Dataset available on request from the authors.
Acknowledgments
We thank Marc van Iersel for his important role in obtaining the grant under which this study was conducted and for guiding this research through all its stages. We also thank Lynne Seymour and all the members of the Horticultural Physiology and Controlled Environment Agriculture Laboratories at the University of Georgia for their technical support.
Conflicts of Interest
The authors declare no conflicts of interest. The funders had no role in the design of the study, in the collection, analyses, or interpretation of data, in the writing of the manuscript, or in the decision to publish the results.
References
- Horrigan, L.; Lawrence, R.S.; Walker, P. How sustainable agriculture can address the environmental and human health harms of industrial agriculture. Environ. Health Perspect. 2022, 110, 445–456. [Google Scholar] [CrossRef] [PubMed]
- Sankhla, M.; Kumari, M.; Sharma, K.; Kushwah, R.; Kumar, R. Water contamination through pesticide & their toxic effect on human health. Int. J. Res. Appl. Sci. Eng. Technol. 2018, 6, 967–970. [Google Scholar] [CrossRef]
- Lindstrom, M.J.; Lobb, D.; Schumacher, T. Tillage erosion: An overview. Ann. Dryland Res. 2001, 40, 345–358. [Google Scholar]
- Nawaz, M.F.; Bourrié, G.; Trolard, F. Soil compaction impact and modelling. A review. Agron. Sustain. Dev. 2013, 33, 291–309. [Google Scholar] [CrossRef]
- Alam, A. Soil degradation: A challenge to sustainable agriculture. Int. J. Sci. Res. Agric. Sci. 2014, 1, 50–55. [Google Scholar] [CrossRef]
- Wakeland, W.; Cholette, S.; Venkat, K. Food transportation issues and reducing carbon footprint. In Green Technologies in Food Production and Processing; Boye, J., Arcand, Y., Eds.; Springer: Boston, MA, USA, 2012; pp. 211–236. [Google Scholar] [CrossRef]
- Onwude, D.I.; Chen, G.; Eke-emezie, N.; Kabutey, A.; Khaled, A.Y.; Sturm, B. Recent Advances in reducing food losses in the supply chain of fresh agricultural produce. Processes 2021, 8, 1431. [Google Scholar] [CrossRef]
- Ragaveena, S.; Shirly Edward, A.; Surendran, U. Smart controlled environment agriculture methods: A holistic review. Rev. Environ. Sci. Biotechnol. 2021, 20, 887–913. [Google Scholar] [CrossRef]
- Benke, K.; Tomkins, B. Future food-production systems: Vertical farming and controlled-environment agriculture. Sustain. Sci. Pract. Policy 2017, 13, 13–26. [Google Scholar] [CrossRef]
- Zhang, Z.; Rod, M.; Hosseinian, F. A comprehensive review on sustainable industrial vertical farming using film farming technology. Sustain. Agric. Res. 2021, 526, 2021–2496. [Google Scholar] [CrossRef]
- Kozai, T.; Niu, G.; Takagaki, M. Plant Factory: An Indoor Vertical Farming System for Efficient Quality Food Production, 1st ed.; Academic Press: Cambridge, MA, USA, 2016; ISBN 978-0-12-801775-3. [Google Scholar] [CrossRef]
- Zeidler, C.; Schubert, D.; Vrakking, V. Feasibility Study: Vertical Farm EDEN; German Aerospace Center, Institute of Space Systems: Bremen, Germany, 2013. [Google Scholar]
- van Iersel, M.W. Optimizing LED lighting in controlled environment agriculture. In Light Emitting Diodes for Agriculture: Smart Lighting; Dutta Gupta, S., Ed.; Springer: Singapore, 2017; pp. 59–80. [Google Scholar] [CrossRef]
- Pennisi, G.; Pistillo, A.; Orsini, F.; Cellini, A.; Spinelli, F.; Nicola, S.; Fernandez, J.A.; Crepaldi, A.; Gianquinto, G.; Marcelis, L.F. Optimal light intensity for sustainable water and energy use in indoor cultivation of lettuce and basil under red and blue LEDs. Sci. Hortic. 2020, 272, 109508. [Google Scholar] [CrossRef]
- Zou, J.; Zhang, Y.; Zhang, Y.; Bian, Z.; Fanourakis, D.; Yang, Q.; Li, T. Morphological and physiological properties of indoor cultivated lettuce in response to additional far-red light. Sci. Hortic. 2019, 257, 108725. [Google Scholar] [CrossRef]
- Jayalath, T.C.; van Iersel, M.W. Canopy size and light use efficiency explain growth differences between lettuce and mizuna in vertical farms. Plants 2021, 10, 704. [Google Scholar] [CrossRef] [PubMed]
- Kudirka, G.; Viršilė, A.; Laužikė, K.; Sutulienė, R.; Samuolienė, G. Photosynthetic photon flux density effects on Portulaca olearacea in controlled-environment agriculture. Plants 2023, 12, 3622. [Google Scholar] [CrossRef] [PubMed]
- Kelly, N.; Choe, D.; Meng, Q.; Runkle, E.S. Promotion of lettuce growth under an increasing daily light integral depends on the combination of the photosynthetic photon flux density and photoperiod. Sci. Hortic. 2020, 272, 109565. [Google Scholar] [CrossRef]
- Tarr, S.T.; Valle de Souza, S.; Lopez, R.G. Influence of day and night temperature and radiation intensity on growth, quality, and economics of indoor Green Butterhead and Red Oakleaf lettuce production. Sustainability 2023, 15, 829. [Google Scholar] [CrossRef]
- Klassen, S.P.; Ritchie, G.L.; Frantz, J.M.; Pinnock, D.R.; Bugbee, B. Real-time imaging of ground cover: Relationships with radiation capture, canopy photosynthesis, and daily growth rate. In Digital Imaging and Spectral Techniques: Applications to Precision Agriculture and Crop Physiology; American Society of Agronomy: Minneapolis, MN, USA, 2003; pp. 3–14. [Google Scholar]
- Solbach, J.A.; Fricke, A.; Stützel, H. Seasonal efficiency of supplemental LED lighting on growth and photomorphogenesis of sweet basil. Front. Plant Sci. 2021, 12, 609975. [Google Scholar] [CrossRef]
- Jin, W.; Formiga Lopez, D.; Heuvelink, E.; Marcelis, L.F. Light use efficiency of lettuce cultivation in vertical farms compared with greenhouse and field. Food Energy Secur. 2023, 12, e391. [Google Scholar] [CrossRef]
- Li, T.; Kromdijk, J.; Heuvelink, E.; Van Noort, F.R.; Kaiser, E.; Marcelis, L.F. Effects of diffuse light on radiation use efficiency of two Anthurium cultivars depend on the response of stomatal conductance to dynamic light intensity. Front. Plant Sci. 2016, 7, 167966. [Google Scholar] [CrossRef]
- Weaver, G.; van Iersel, M.W. Longer photoperiods with adaptive lighting control can improve the growth of greenhouse-grown ‘Little Gem’lettuce (Lactuca sativa). HortScience 2020, 55, 573–580. [Google Scholar] [CrossRef]
- Medlyn, B.E. Physiological basis of the light use efficiency model. Tree Physiol. 1998, 18, 167–176. [Google Scholar] [CrossRef]
- Stewart, J.J.; Adams, W.W., III; Escobar, C.M.; López-Pozo, M.; Demmig-Adams, B. Growth and essential carotenoid micronutrients in Lemna gibba as a function of growth light intensity. Front. Plant Sci. 2020, 11, 480. [Google Scholar] [CrossRef]
- Elkins, C.; van Iersel, M.W. Longer photoperiods with the same daily light integral increase daily electron transport through photosystem II in lettuce. Plants 2020, 9, 1172. [Google Scholar] [CrossRef]
- Ruban, A.V. Quantifying the efficiency of photoprotection. Philos. Trans. R. Soc. Lond. B Biol. Sci. 2017, 372, 20160393. [Google Scholar] [CrossRef] [PubMed]
- Ruban, A.V. Plants in light. Commun. Integr. Biol. 2009, 2, 50–55. [Google Scholar] [CrossRef]
- van Iersel, M.W.; Weaver, G.; Martin, M.T.; Ferrarezi, R.S.; Mattos, E.; Haidekker, M. A Chlorophyll fluorescence-based biofeedback system to control photosynthetic lighting in controlled environment agriculture. J. Am. Soc. Hortic. Sci. 2016, 141, 169–176. [Google Scholar] [CrossRef]
- Maxwell, K.; Johnson, G.N. Chlorophyll fluorescence: A practical guide. J. Exp. Bot. 2000, 51, 659–668. [Google Scholar] [CrossRef] [PubMed]
- Li, S.H.; Ge, Z.M.; Xie, L.N.; Chen, W.; Yuan, L.; Wang, D.Q.; Li, X.Z.; Zhang, L.Q. Ecophysiological response of native and exotic salt marsh vegetation to waterlogging and salinity: Implications for the effects of sea-level rise. Sci. Rep. 2018, 8, 2441. [Google Scholar] [CrossRef]
- Watson, R.T.; Boudreau, M.C.; van Iersel, M.W. Simulation of greenhouse energy use: An application of energy informatics. Energy Inf. 2018, 1, 1. [Google Scholar] [CrossRef]
- Pannewitz, S.; Green, T.G.A.; Scheidegger, C.; Schlensog, M.; Schroeter, B. Activity pattern of the moss Hennediella heimii (Hedw.) Zand. in the Dry Valleys, Southern Victoria Land, Antarctica during the mid-austral summer. Polar Biol. 2003, 26, 545–551. [Google Scholar] [CrossRef]
- Guidi, L.; Degl’Innocenti, E.; Fambrini, M.; Pugliesi, C.; Soldatini, G.F. Gas exchange analysis and chlorophyll fluorescence in cotyledons of the xan1 sunflower mutant with defects in light energy utilization. Environ. Exp. Bot. 2006, 56, 182–189. [Google Scholar] [CrossRef]
- Zhou, J.; Wang, J.Z.; Hang, T.; Li, P.P. Photosynthetic characteristics and growth performance of lettuce (Lactuca sativa L.) under different light/dark cycles in mini plant factories. Photosynthetica 2020, 58, 740–747. [Google Scholar] [CrossRef]
- Zhou, J.; Li, P.; Wang, J. Effects of Light Intensity and Temperature on the Photosynthesis Characteristics and Yield of Lettuce. Horticulturae 2022, 8, 178. [Google Scholar] [CrossRef]
- Jishi, T.; Matsuda, R.; Fujiwara, K. Effects of photosynthetic photon flux density, frequency, duty ratio, and their interactions on net photosynthetic rate of cos lettuce leaves under pulsed light: Explanation based on photosynthetic-intermediate pool dynamics. Photosynth. Res. 2018, 136, 371–378. [Google Scholar] [CrossRef]
- Li, Y.; Xin, G.; Liu, C.; Shi, Q.; Yang, F.; Wei, M. Effects of red and blue light on leaf anatomy, CO2 assimilation and the photosynthetic electron transport capacity of sweet pepper (Capsicum annuum L.) seedlings. BMC Plant Biol. 2020, 20, 318. [Google Scholar] [CrossRef]
- Yan, N.; Xu, X.F.; Wang, Z.D.; Huang, J.Z.; Guo, D.P. Interactive effects of temperature and light intensity on photosynthesis and antioxidant enzyme activity in Zizania latifolia Turcz. plants. Photosynthetica 2013, 51, 127–138. [Google Scholar] [CrossRef]
- Ke, X.; Yoshida, H.; Hikosaka, S.; Goto, E. Optimization of photosynthetic photon flux density and light quality for increasing radiation-use efficiency in dwarf tomato under LED light at the vegetative growth stage. Plants 2022, 11, 121. [Google Scholar] [CrossRef]
- Gavhane, K.P.; Hasan, M.; Singh, D.K.; Kumar, S.N.; Sahoo, R.N.; Alam, W. Determination of optimal daily light integral (DLI) for indoor cultivation of iceberg lettuce in an indigenous vertical hydroponic system. Sci. Rep. 2023, 13, 10923. [Google Scholar] [CrossRef] [PubMed]
- Albornoz, F.; Lieth, J.H.; González-Fuentes, J.A. Effect of different day and night nutrient solution concentrations on growth, photosynthesis, and leaf NO3-content of aeroponically grown lettuce. Chil. J. Agric. Res. 2014, 74, 240–245. [Google Scholar] [CrossRef]
- Lanoue, J.; Leonardos, E.D.; Grodzinski, B. Artificial lighting technologies for agricultural production. In Comprehensive Biotechnology, 3rd ed.; Moo-Young, M., Ed.; Pergamon: Oxford, UK, 2019; Volume 4, pp. 818–832. ISBN 9780444640475. [Google Scholar]
- Matsuda, R. Effects of physical environment on photosynthesis, respiration, and transpiration. In LED Lighting for Urban Agriculture; Kozai, T., Fujiwara, K., Runkle, E., Eds.; Springer: Singapore, 2016. [Google Scholar] [CrossRef]
- Hanba, Y.T.; Kogami, H.; Terashima, I. The effect of growth irradiance on leaf anatomy and photosynthesis in Acer species differing in light demand. Plant Cell Environ. 2020, 25, 1021–1030. [Google Scholar] [CrossRef]
- Farquhar, G.D.; Ehleringer, J.R.; Hubick, K.T. Carbon isotope discrimination and photosynthesis. Annu. Rev. Plant Biol. 1989, 40, 503–537. [Google Scholar] [CrossRef]
- Bruns, A.H. Flag leaf photosynthesis and stomatal function of grain sorghum as influenced by changing photosynthetic photon flux densities. Int. J. Agron. 2016, 2016, 1363740. [Google Scholar] [CrossRef]
- Fkiri, S.; Rzigui, T.; Ghazghazi, H.; Khouja, L.M.; Khaldi, A.; Guibal, F.; Nasr, Z. Ecotype effects on photosynthesis performance using A/PFFD among Pinus nigra Arn. Not. Bot. Horti Agrobot. Cluj-Napoca 2023, 51, 12599. [Google Scholar] [CrossRef]
- Ghorbanzadeh, P.; Aliniaeifard, S.; Esmaeili, M.; Mashal, M.; Azadegan, B.; Seif, M. Dependency of growth, water use efficiency, chlorophyll fluorescence, and stomatal characteristics of lettuce plants to light intensity. J. Plant Growth Regul. 2021, 40, 2191–2207. [Google Scholar] [CrossRef]
- Lee, J.G.; Choi, C.S.; Jang, Y.A.; Jang, S.W.; Lee, S.G.; Um, Y.C. Effects of air temperature and air flow rate control on the tipburn occurrence of leaf lettuce in a closed-type plant factory system. Hortic. Environ. Biotechnol. 2013, 54, 303–310. [Google Scholar] [CrossRef]
- Clarkson, D.T. Calcium transport between tissues and its distribution in the plant. Plant Cell Environ. 1984, 7, 449–456. [Google Scholar] [CrossRef]
- Sago, Y. Effects of light intensity and growth rate on tipburn development and leaf calcium concentration in butterhead lettuce. HortScience 2016, 51, 1087–1091. [Google Scholar] [CrossRef]
Disclaimer/Publisher’s Note: The statements, opinions and data contained in all publications are solely those of the individual author(s) and contributor(s) and not of MDPI and/or the editor(s). MDPI and/or the editor(s) disclaim responsibility for any injury to people or property resulting from any ideas, methods, instructions or products referred to in the content. |
© 2024 by the authors. Licensee MDPI, Basel, Switzerland. This article is an open access article distributed under the terms and conditions of the Creative Commons Attribution (CC BY) license (https://creativecommons.org/licenses/by/4.0/).