Article

Transcriptome Analysis of Multiple Plant Parts in the Woody Oil Tree Camellia drupifera Loureiro

1
College of Horticulture and Landscape Architecture, Zhongkai University of Agriculture and Engineering, Guangzhou 510225, China
2
Faculty of Health and Life Sciences, INTI International University, Nilai 71800, Negeri Sembilan, Malaysia
3
Department of Botany, Guangzhou Institute of Forestry and Landscape Architecture, Guangzhou 510540, China
4
Faculty of Liberal Arts, Shinawatra University, Pathum Thani 12160, Thailand
5
Faculty of Nursing, Shinawatra University, Pathum Thani 12160, Thailand
*
Authors to whom correspondence should be addressed.
These authors have contributed equally to this work.
Horticulturae 2024, 10(9), 914; https://doi.org/10.3390/horticulturae10090914
Submission received: 16 July 2024 / Revised: 11 August 2024 / Accepted: 13 August 2024 / Published: 28 August 2024
(This article belongs to the Section Genetics, Genomics, Breeding, and Biotechnology (G2B2))

Abstract

:
Camellia drupifera is mainly used in forestry for its high-value industrial products; however, limited information is available on its transcriptome. This study aimed to construct a full-length transcriptome sequence based on the PacBio sequencing platform for various plant parts of C. drupifera, including flower buds, leaves, leaf buds, branches, the pericarp, and seed kernels. The transcriptomes were annotated with 23,207 genes, with 58 subgroups in the GO classification. The KEGG database revealed 10,407 genes involved in the metabolic pathway analysis, with 68,192 coding sequences, 3352 TF families, 48,541 SSRs, 1421 IncRNAs, and 2625 variable shears predicted. The transcriptomes of different parts were analyzed and compared. The majority of differentially expressed genes (DEGs) were found between the pericarp and seed kernels, followed by leaves and the pericarp with 5662 DEGs, and flower buds and leaf buds with 1616 DEGs. GO and KEGG enrichment analyses showed that KEGG differential genes were significant in microbial metabolism, carbon metabolism, and other functions. The data annotation and analysis of the full-length transcriptome and the comparative analysis between different plant parts provided a theoretical basis for studying gene function, metabolic pathway regulation, and gene expression analysis in KEGG.

1. Introduction

Camellia drupidera of Theaceae, also known as the oil-tea camellia, is a broad-leaved evergreen tree suitable for planting in hilly and mountainous areas [1]. In China, the Guangdong, Hainan, and Guangxi provinces are the main production areas, and it is also distributed in Southeast Asian countries [2]. It is one of the three major woody oil tree species in the world and the largest woody oil tree species in China [3]. As an edible oil, it can also increase high-density lipoprotein, lower serum triglycerides, and have better antioxidant stability, which can provide suitable nutritional value for people. Additionally, it serves as a valuable industrial raw material, extensively utilized in the production of soap, margarine, lubricants, and rust-prevention oils [4]. Its products have better anti-inflammatory and analgesic effects, as well as stronger antioxidant activity, making them a better candidate for treating inflammation and pain [5]. This indicates a broad range of applications and significant economic value. Most of the research is conducted using high-throughput RNA sequencing (RNA-Seq) by second-generation sequencing technology. This technology provides a molecular basis for various aspects such as breeding and resistance [6]. Due to the short read length of second-generation sequencing technology, sequenced fragments must be spliced to obtain transcripts, and the process of splicing can easily lead to splicing errors [7]. In contrast, third-generation sequencing technology, with its ultra-long read length (15 kb on average), can directly obtain complete full-length transcripts without the need for splicing [8,9].
The third-generation single-molecule real-time sequencing (SMRT) technology constructs cDNA libraries by extracting total RNA and purifying mixed mRNA [10]. The PacBio Sequel platform guided the preparation and sequencing of MRTbell libraries. The cDNA fragments were obtained using PCR with oligo dT as the primer and screened according to length (two sizes, <4000 bp and >4000 bp). After generating insertion fragment reads (ROIs) based on the raw reads, high-quality full-length concordant reads were obtained using clustering and calibration [11] techniques, and the transcripts were then obtained by removing redundancy [12]. Thus, full-length transcriptome sequencing (Iso-Seq) can obtain complete transcript sequences without assembly and identify multiple forms of selective splicing [13], lncRNA prediction, transcriptional regulon family delineation [14], and other related analyses. Several woody species, such as Cinnamomum cassia [15], Hibiscus hamabo [16], Canarium oleosum [17], Paulownia fortunei [18], Rhododendron simsii [19], and Cephalotaxus oliveri [20], have utilized it extensively.
Although many woody plants have used three-generation sequencing tools, current studies related to C. drupifera have concentrated on stress treatments [21], molecular mechanisms of flowering [22], woodland soil biology characteristics [23], genetic diversity [24], and reproduction patterns [25]. These studies have also applied the three-generation full-length transcriptome [26], albeit with a focus on specific tissues. In contrast, in this study, plant parts such as flower buds, leaves, leaf buds, branches, the pericarp, and seed kernels were mixed for full-length transcriptome sequencing, and they were analyzed simultaneously through the second-generation transcriptome for the comparison of different parts, which led to studies related to gene classification, functional annotation, protein function annotation, transcription factors (TFs), and variable shearing, and the information obtained could provide rich reference information on growth and development regulation, resistance, and germplasm identification.

2. Materials and Methods

Camellia drupifera for sequencing was harvested from the state-owned Xiaokeng Forestry Farm in Qujiang District, Shaoguan City, Guangdong Province (113°35′ E, 24°15′ N). It is located at the southern edge of Dayu Ling of the Nanling Mountain Range, belonging to a subtropical climate zone, with an average maximum temperature of 34.0 °C and an average minimum temperature of 10 °C. The plant samples were collected from a cultivar named B255, which was planted for six years. The samples collected are detailed as follows: the flower buds were unopened and 1.5 cm in diameter; the leaf buds were 0.25 cm in diameter and about 1.5 cm long; the semi-woody branches at the edge of the canopy had a diameter of 0.2–0.4 cm; the pericarp and seed kernels were cut from the uncracked, disease-free drupe at the canopy’s edge; and the samples were separately put into liquid nitrogen immediately. These samples were transferred to a refrigerator at −80 °C and then returned to the laboratory for total RNA extraction.
The total RNA library was constructed by mixing different parts with same amount of cDNA into one sample according to the PacBio Iso-Seq experimental protocol. Oligo (dT) was used to enrich mRNAs containing poly-A. The SMARTer PCR cDNA synthesis kit (TaKaRa Biologicals, Kusatsu, Shiga, Japan) was used for cDNA reverse transcription. Double-stranded cDNAs were synthesized using PCR amplification. The obtained PCR products were then purified, and SMRTbeII libraries were constructed. The complete SMRTbeII library was constructed by ligating primers and DNA polymerase together, and after the library was successfully constructed and tested for quality, it was then sequenced on the PacBio Sequel platform [12].
Using the process provided by the official PacBio package, polymerase reads smaller than 50 bp and with a mass less than 0.90 were filtered out to obtain compliant reads. The BAM files were then categorized into full-length (FL) and non-full-length non-nested (FLNC) based on pbclassify. This resulted in a circular consensus sequence (CCS). FL and FLNC transcripts were obtained by pair insertion fragment (ROI) to Poly(A) tail signal in reads and 5′ and 3′ cDNA. Consistent sequences were obtained using iterative error correction (ICE) and approximate clustering. We selected consensus data with a corrected accuracy of >0.99 for the subsequent analysis [27].
The programs PLEK [28], CNCI [29], CPC2 [30], and the Pfam database [31] were used to identify long non-coding RNAs (lncRNAs). The software program iTAK [32] was used to predict TFs. The TransDecoder software [33] was used to predict protein-coding sequences. The Astalavista [34] software was used to identify the variable splice types present. For the functional annotation, the reconstructed genes were compared with various protein databases using the software program BlastX, including NR (http://ftp.ncbi.nlm.nih.gov/blast/db/ (accessed on 12 August 2024)), gene ontology (GO, http://www.geneontology.org (accessed on 12 August 2024)), the Kyoto Encyclopedia of Genes and Genomes (KEGG, http://www.genome.jp/kegg/ (accessed on 12 August 2024)), and Swiss-Prot (https://www.expasy.org/ (accessed on 12 August 2024)), with E ≤ 1.0 × 10⁵. The MISA (https://webblast.ipk-gatersleben.de/misa/ (accessed on 12 August 2024)) program in Perl script was run to screen SSRs with two, three, four, five, and six nucleotide motifs with minimum repeat counts of 6, 5, 5, 5, and 5, respectively.
High-quality concordant sequences from each library were de-redundant using the software cd-hit-v4.6.7, screened to obtain relevant WRKY protein sequence files, and used in PlantTFDBv5.0 (http://planttfdb.gao-lab.org/prediction.php (accessed on 12 August 2024)) and (https://www.ebi.ac.uk/Tools/hmmer/search/phmmer (accessed on 12 August 2024)) in the prediction screening analysis, resulting in 46 WRKY protein sequences containing conserved structural domains [35,36]. To analyze the relevant physicochemical properties of the NAC protein, an online analysis was performed using the Expasy tool (https://web.expasy.org/protparam/ (accessed on 12 August 2024)). The DNAMAN (v 9.0.1.116) software was selected for sequence comparison; multiple alignment sequences were selected for multiple sequence comparison; a highlight homology level of ≥50% was set; and other parameters were set as default values. The TBtools software [37] mapped the phylogenetic relationships, conserved motifs, and gene structures of its NAC transcription factors. MEME (https://meme-suite.org/meme/tools/meme (accessed on 12 August 2024)) carried out the analysis of the conserved motifs of the NAC proteins [38,39].
An RNA-seq analysis was performed on the total RNA of eight samples (A, B, C, D, E1, E2, F1, and F2) using the full-length transcripts of C. drupifera as reference sequences. For each transcribed region, the expression abundance and variation were quantified using FPKM (transcribed fragments per kilobase per million mapping reads) values. An analysis of differentially expressed genes (DEGs) was performed using the Edger [40] software between pairs of plant parts, including flower buds and leaves, flower buds and leaf buds, flower buds and branches, flower buds and the pericarp, flower buds and seed kernels, leaves and leaf buds, leaves and branches, leaves and the pericarp, leaves and seed kernels, leaf buds and branches, leaf buds and the pericarp, leaf buds and seed kernels, branches and the pericarp, branches and seed kernels, and the pericarp and seed kernels. The false discovery rate (FDR) was less than 0.05, and the absolute fold change was less than 1. The GO and KEGG databases identified DEGs for annotation and used them in the downstream analysis.

3. Results

3.1. Full-Length Transcriptome Sequencing

Using the PacBioSequel sequencing platform, full-length transcriptome sequencing was performed on multiple plant parts using the PacBioSequel sequencing platform. A total of 48,000,902 subreads were obtained, the number of N50 was 1587 bp, and the average length was 1332 bp. After the screening of the downstream sequences, the CCSs in the reads were extracted, and information on the number and length of the CCSs was obtained. The number of CCS reads was 733,008, and the average length was 1640 bp. After screening the CCS reads containing 5′ primer, 3′ primer, and poly-A for classification, the number of full-length non-chimeric sequences (FLNCs) was 649,567, the average length of the sequences was 1431 bp, and the N50 length was 1691 bp. The ICE (isoform-level clustering algorithm) combined the full-length transcript sequences with the non-full-length sequences, iteratively clustered the similar sequences into clusters, and each cluster produced a consistent transcript. We obtained 72,253 high-quality full-length transcripts with an average sequence length of 1476 bp and an N50 length of 1735. The high-quality full-length transcripts were further de-redundant using the CD-HIT (v4.8.1) software to obtain 71,615 non-redundant high-quality full-length transcripts (corrected consensus) with an average sequence length of 1470 bp and an N50 length of 1727 bp (Table 1). The high depth of sequencing data (Figure 1) indicate that high-quality full-length transcript assemblies were obtained.

3.2. Functional Classification and Annotation

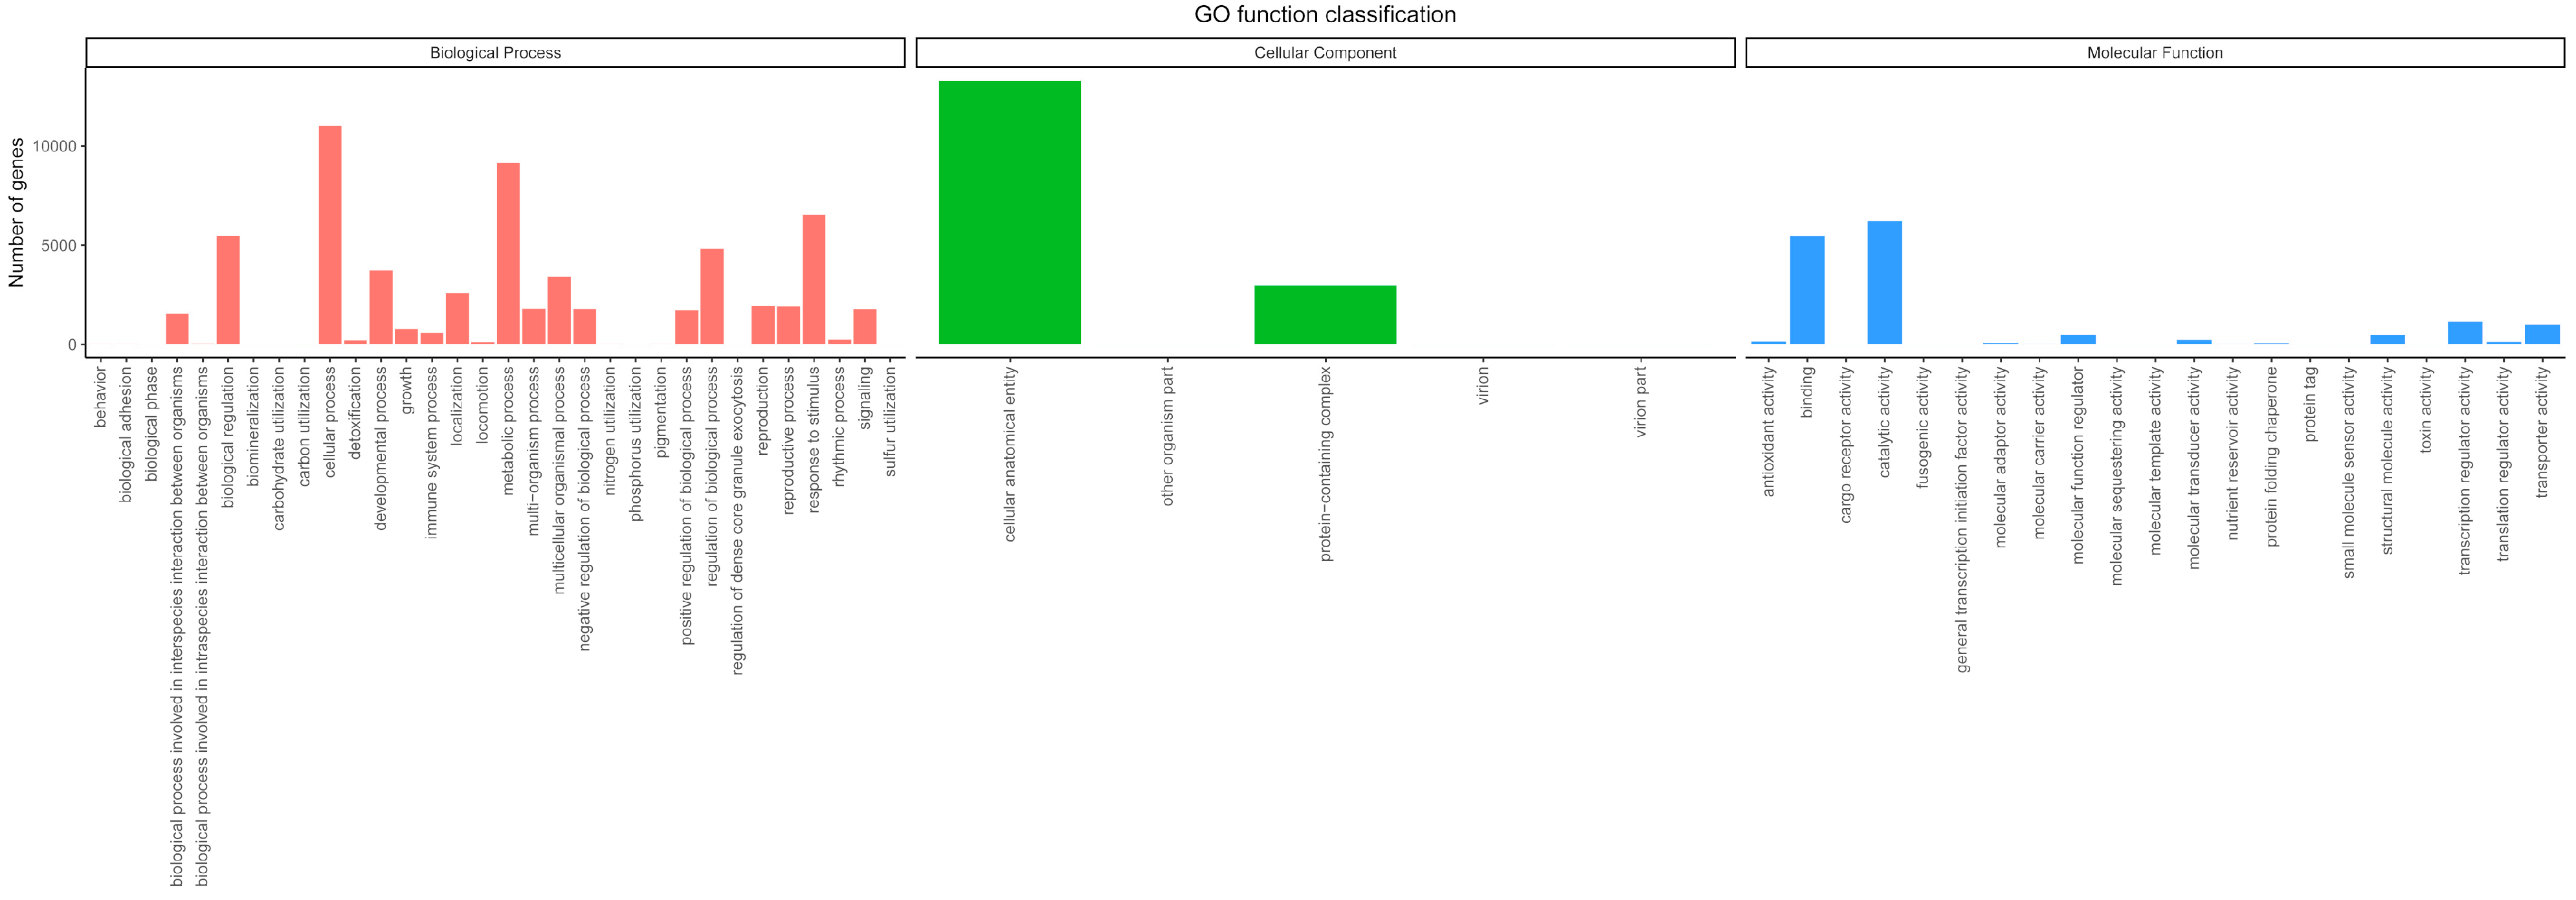
The filtered isoform sequence is obtained by classifying and correcting the original data reads. Protein databases, such as KEGG, GO, and COG/KOG, were used to obtain the protein with the highest sequence similarity to obtain the protein functional annotation information of the sequences using EggNOG (http://eggnog5.embl.de/#/app/home (accessed on 12 August 2024)). Of these, GO was matched to 14,952, KEGG to 10,407, and COG/KOG to 23,207, for a total of 23,207 gene-strip genes utilized to be annotated. For the GO classification, all 23,207 genes assigned to the three main categories were grouped into 58 subgroups (Figure 2). “Biological Process” has 32 subgroups, with “cellular process” being the highest, followed by “metabolic process” and “response to stimulus”. The “Cellular Component” category has five subcategories, mainly consisting of “cellular anatomical entity” and “protein-containing complex”. The “Cellular Component” category has five subcategories, mainly consisting of “cellular anatomical entity” and “protein-containing complex”. The “Molecular Function” category contains 21 subcategories rich in “catalytic activity”, “binding activity”, and “transcription regulator activity”. The metabolic pathway analysis, when compared with the KEGG database, revealed the involvement of 10,407 genes. In general, we annotated these genes into six major categories and 34 subcategories. The metabolic pathways with the highest number of genes were “signal transduction” (n = 1804) and “carbohydrate metabolism” (n = 1632), while “drug resistance/antimicrobial” and “signaling molecules, and interaction” had only one gene (Figure 3). The KOG database annotated a total of 23,207 gene clusters into 26 functional components (Figure 4), with the most annotated functional components being “posttranslational modification”, “protein turnover”, and “chaperones” (n = 2688, 11.5%), followed by “secondary metabolites biosynthesis, transport, and catabolism” (n = 182, 7.8%) and “carbohydrate transport and metabolism” (n = 1781, 7.6%).

3.3. SSR Analysis

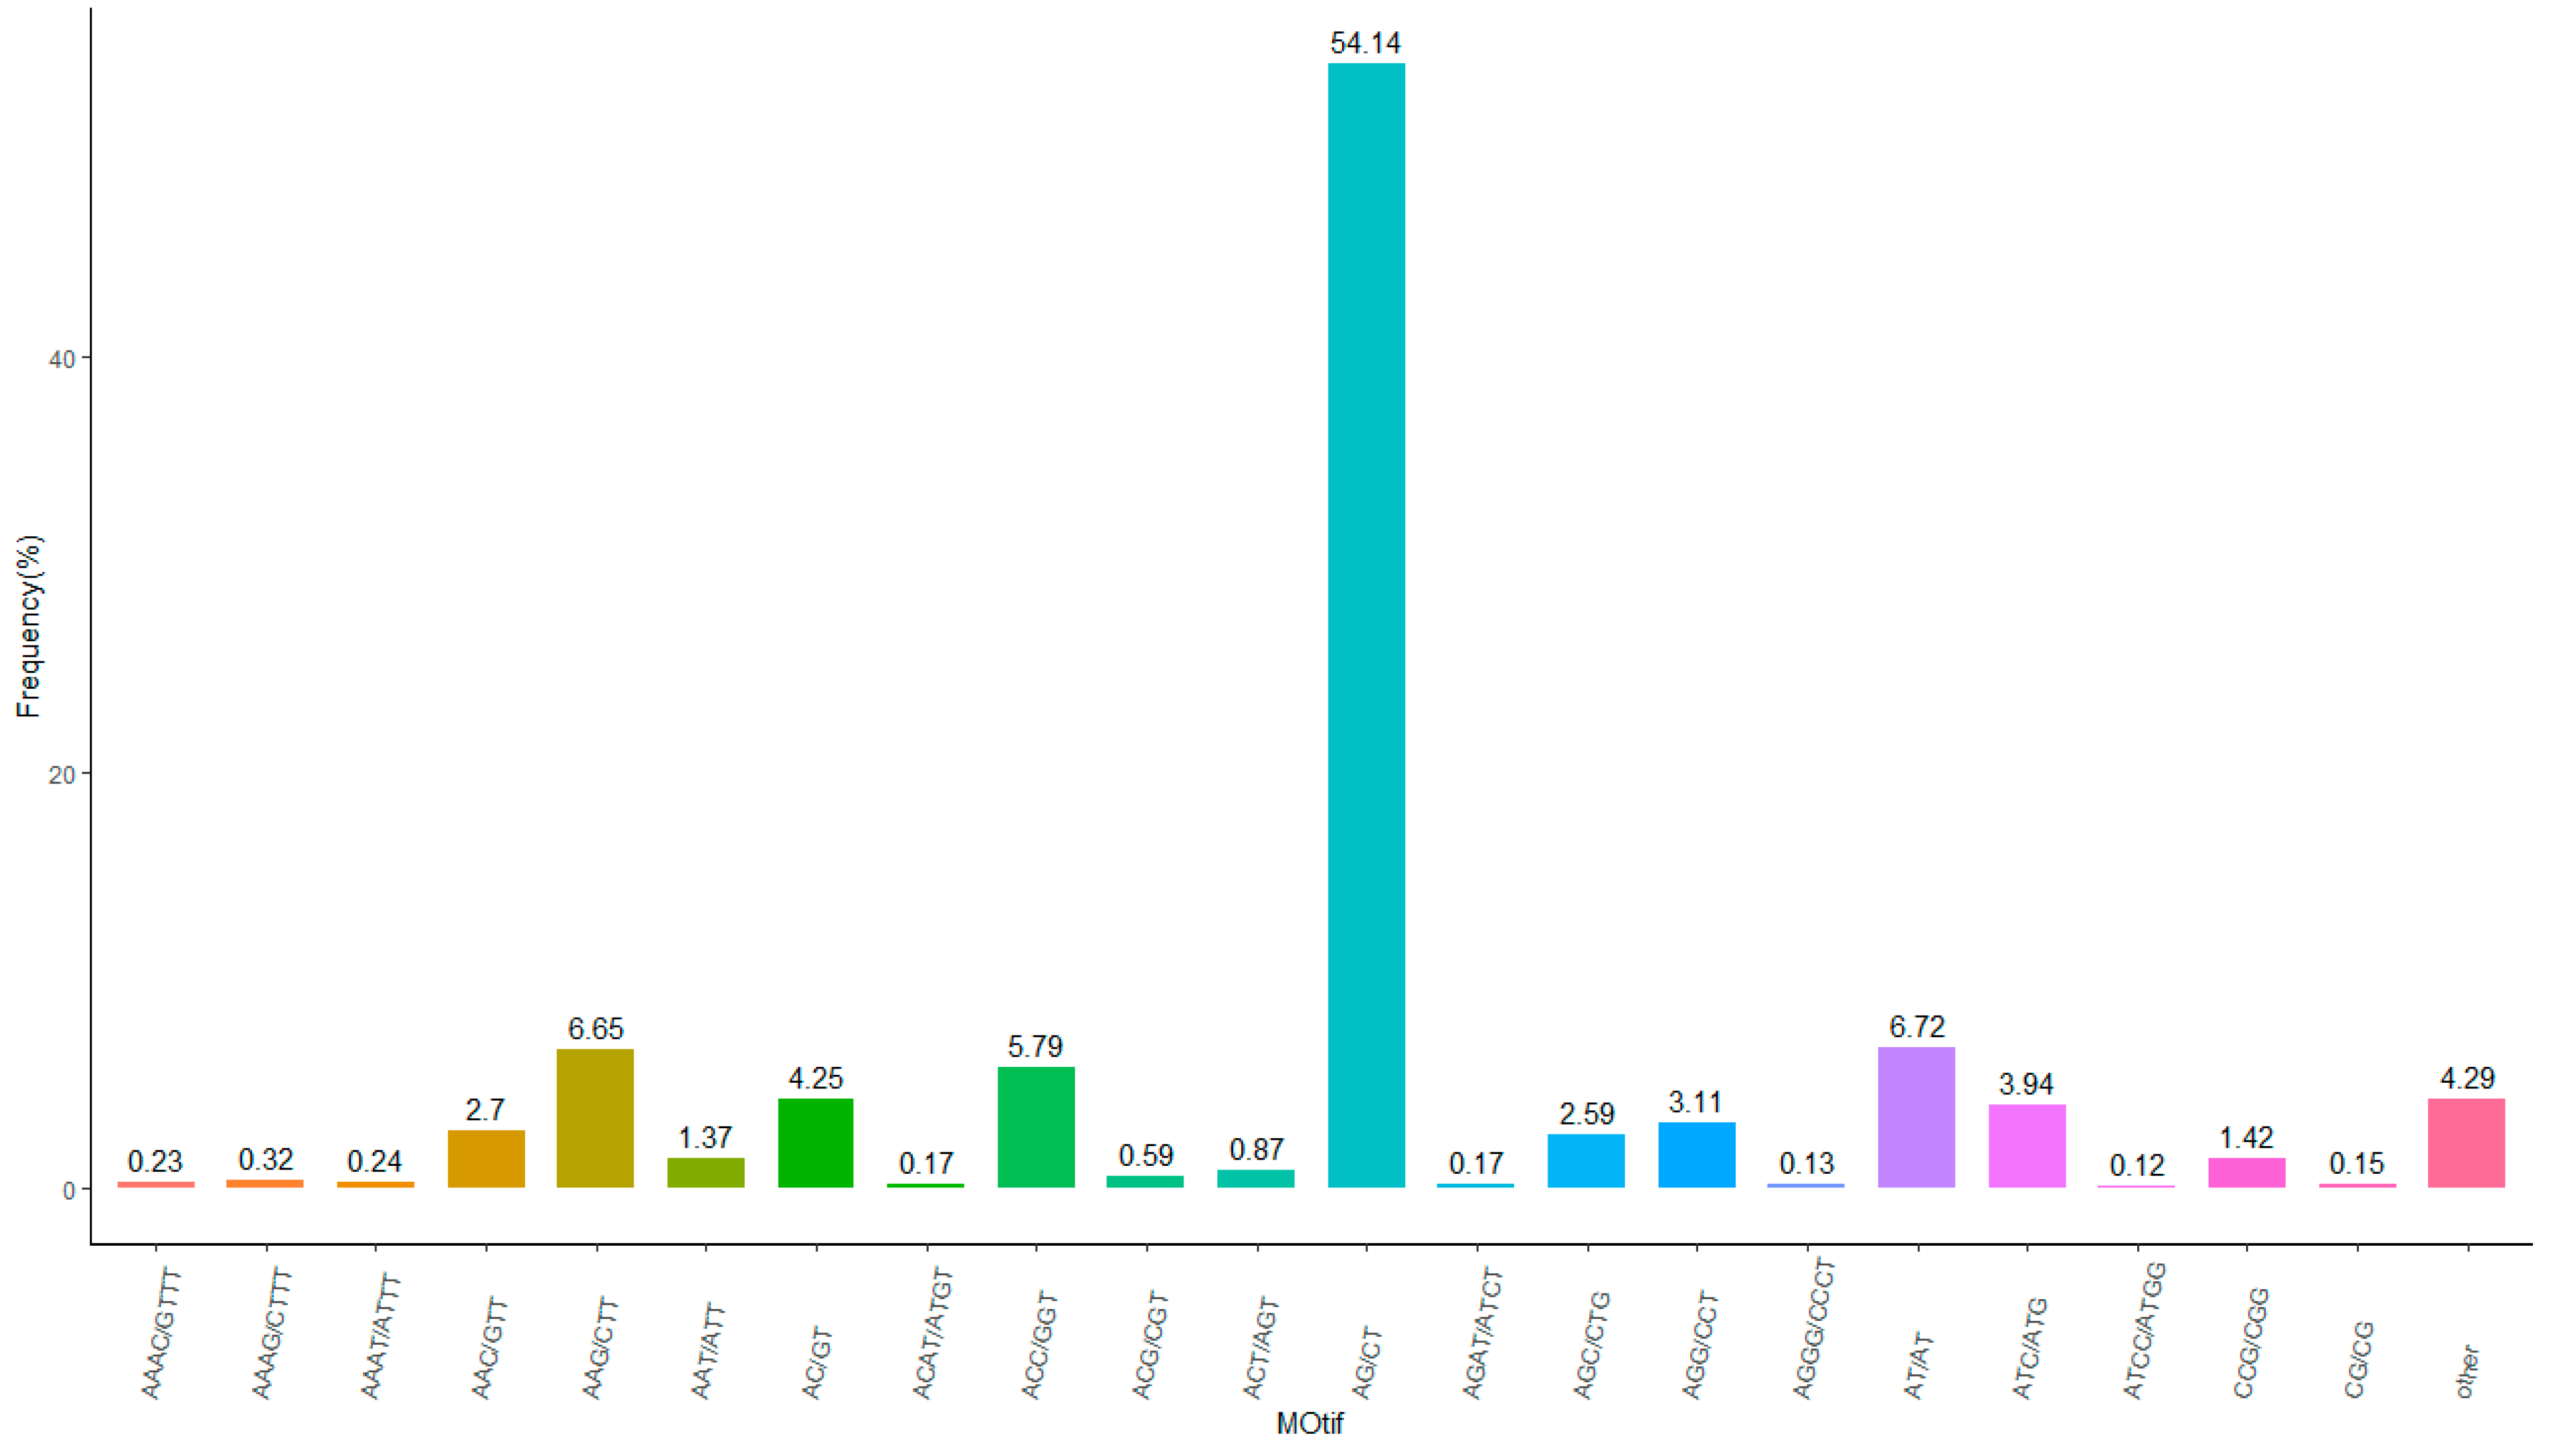
A total of 48,541 SSR sequences were found (Table 2), with 3686, 436, 214, and 9882 repeats in the units of A, C, T, and G, respectively, and the number of repeats ranged from five to 65. In general, the SSR sequences containing T repeats were the most numerous, accounting for 69.5% of all the mononucleotides repeat sequences, followed by SSR sequences containing A repeats, accounting for 25.9%, while C and G were only 3.0% and 1.5%, respectively. In terms of the number of SSR sequence repetitions, those with 5–15 repetitions accounted for the majority, reaching 73.9% of all the SSR sequences. Among the SSR sequences with 46 to 65 repeats, only the SSR sequences contained A repeat units. Dinucleotide repeat motifs (n = 15,790) were the most abundant at 32.5%, followed by trinucleotides (n = 7432; 15.3%), tetranucleotides (n = 370; 0.7%), and hexanucleotides (n = 725; 1.4%), while pentanucleotides (n = 256; 0.5%) were the least abundant (Figure 5). Among all the different shear types, AG/CT types accounted for 54.14% of the total. The high abundance in SSRs identified in the transcriptome data indicates that SSRs still have great potential to provide a useful resource for genetic breeding research.

3.4. IncRNA Prediction

The transcripts of lncRNAs were qualitatively analyzed using four computational approaches, i.e., CNCI, PLEK, CPC, and Pfam, and the transcripts predicted as lncRNAs by each of the softwares were calculated. LncRNAs are regulators with very important functions in biological processes, including plant growth, development, secondary metabolism, and abiotic stress responses [41,42]. A total of 1421 lncRNAs against four databases were identified (Figure 6), somewhat equivalent to the 1894 lncRNAs from other woody oilseed trees like walnut [43].

3.5. Protein-Coding Sequence Prediction

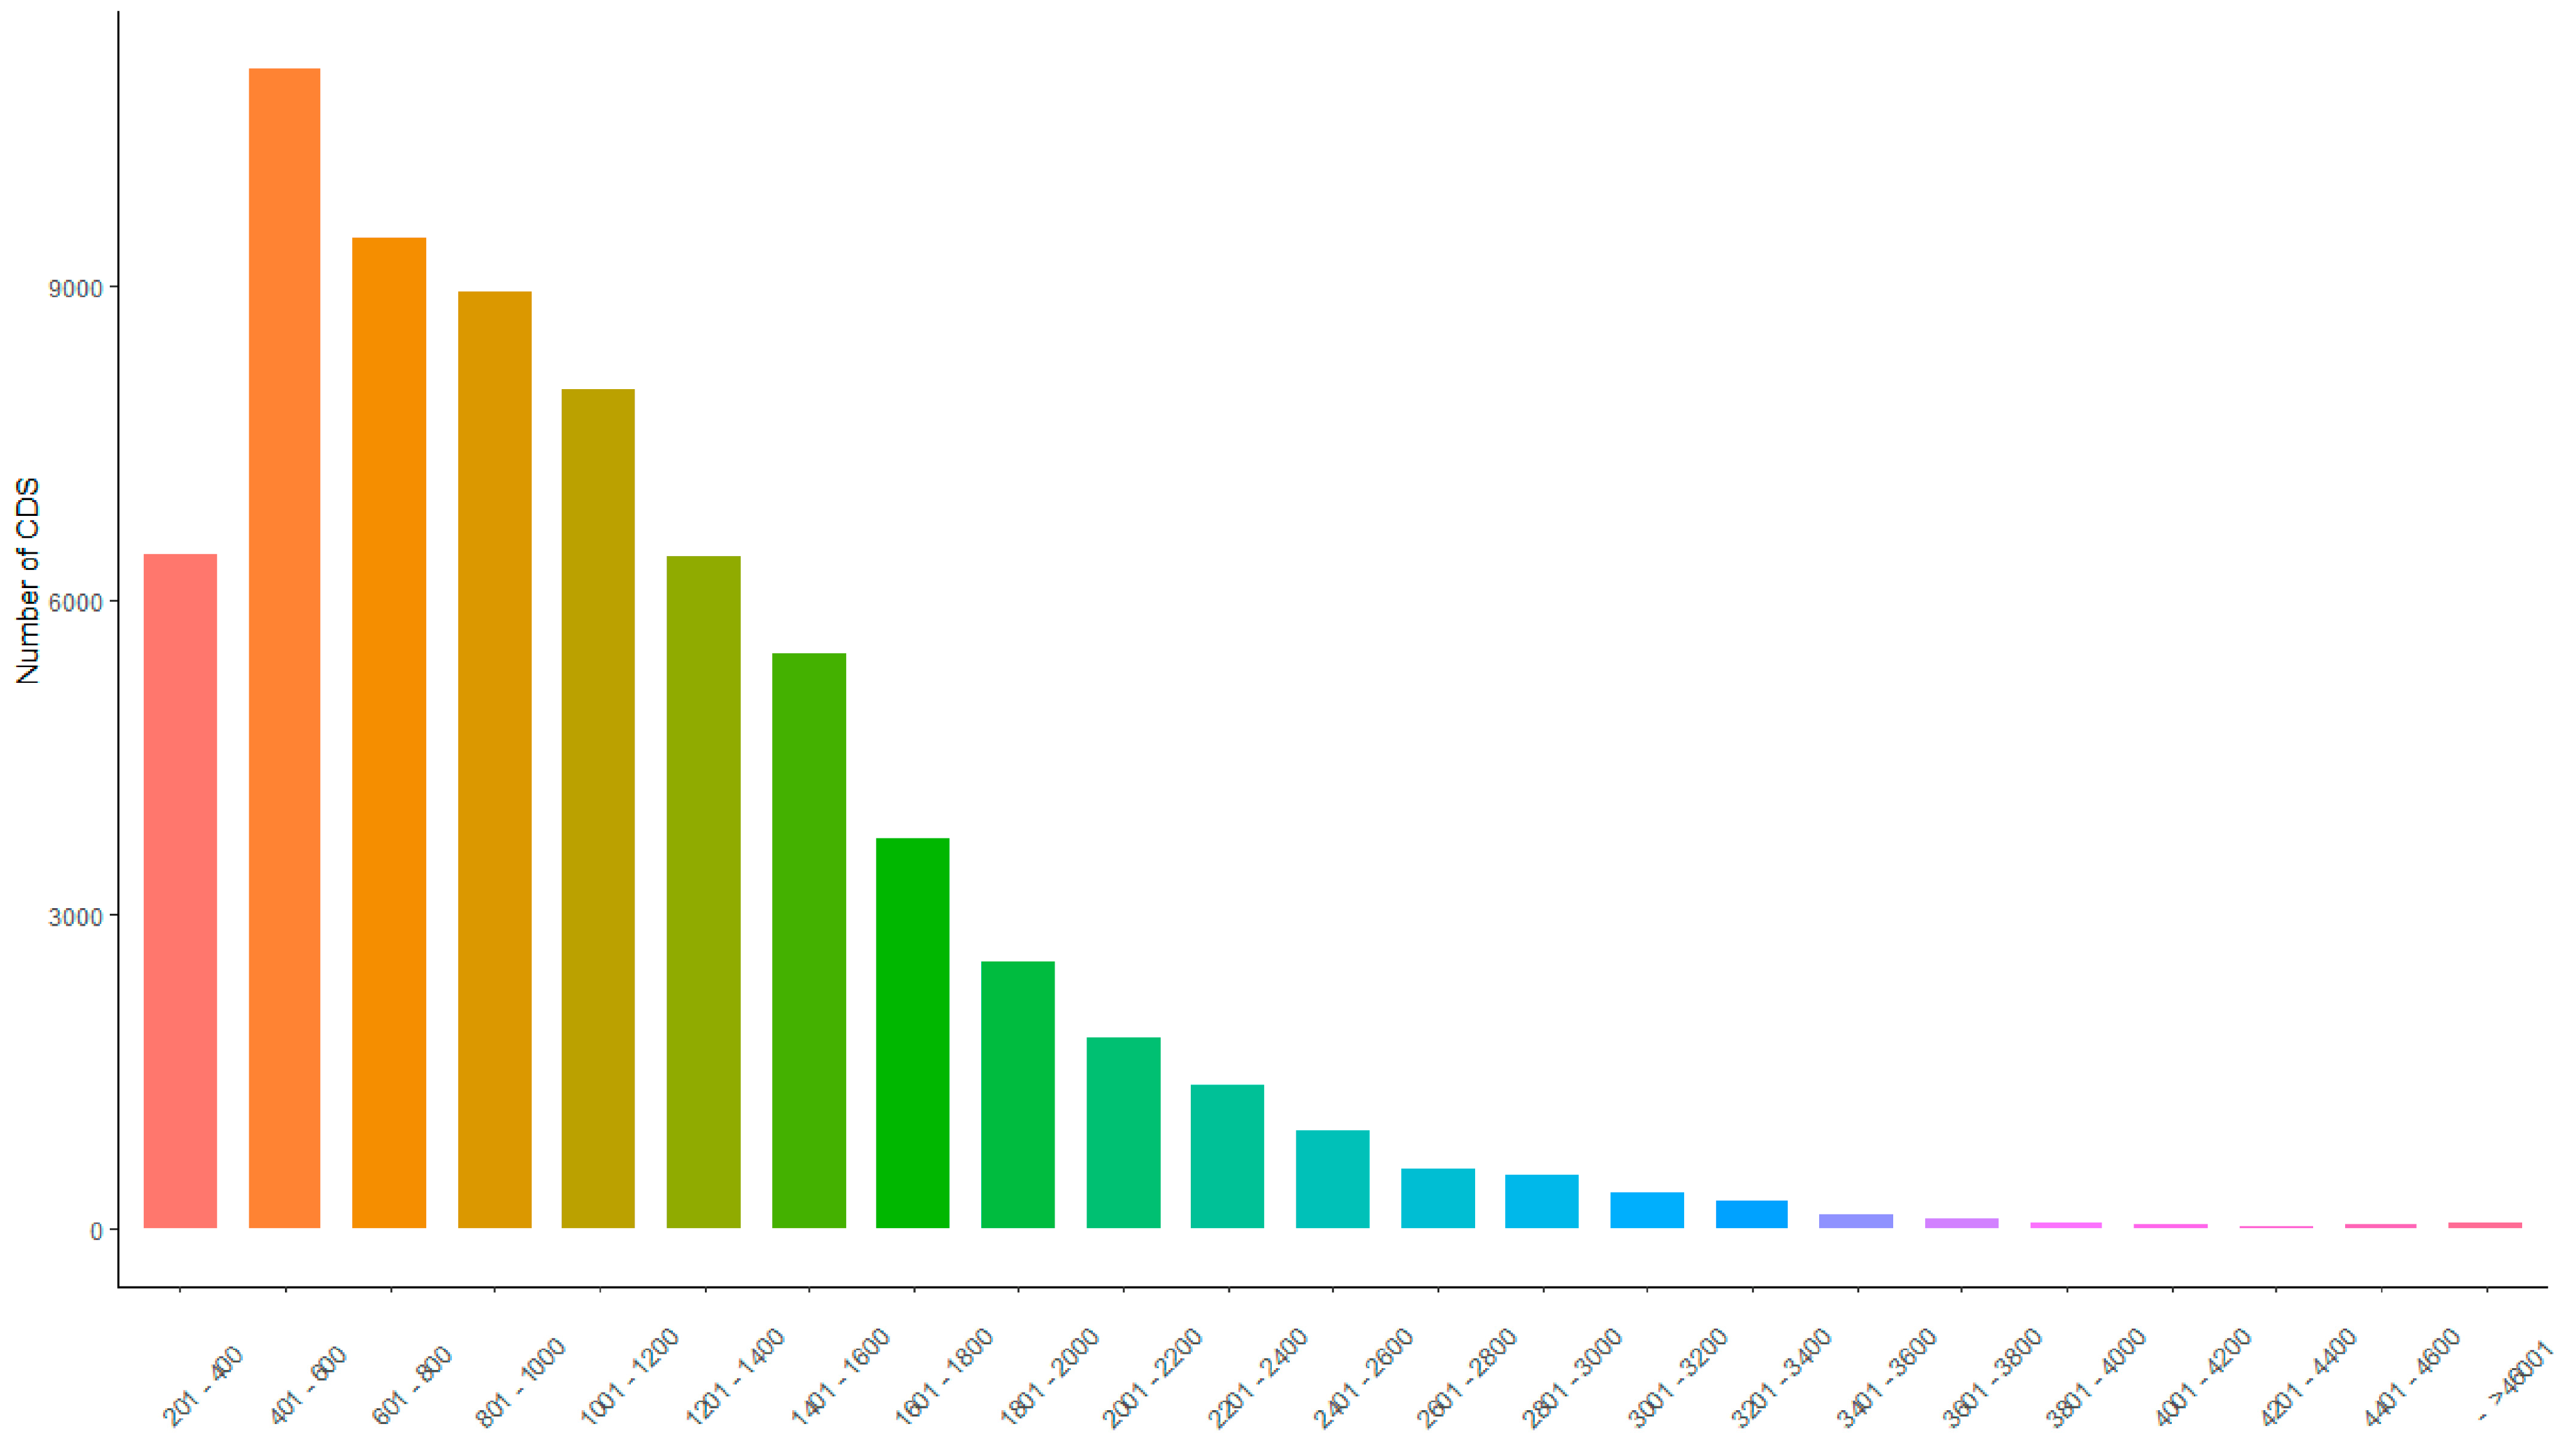
Coding sequences (CDSs) are sequences that encode protein products and correspond to the codons of proteins (Figure 7). The prediction of protein coding regions in full-length transcriptome sequencing results contributes to the gene structural analysis and forms the basis for the subsequent protein structure analysis. A total of 68,192 coding sequences were predicted, mainly concentrated between 401–600 bp (n = 11,079; 16.2%), followed by 601–800 bp (n = 9455; 13.9%), and thirdly 801–1000 bp (n = 8939; 13.1%). Then 1001–1200 bp (n = 8022; 11.8%) and 1201–1400 bp (n = 6431; 9.4%).

3.6. Transcription Factor and Transcription Regulator Analysis

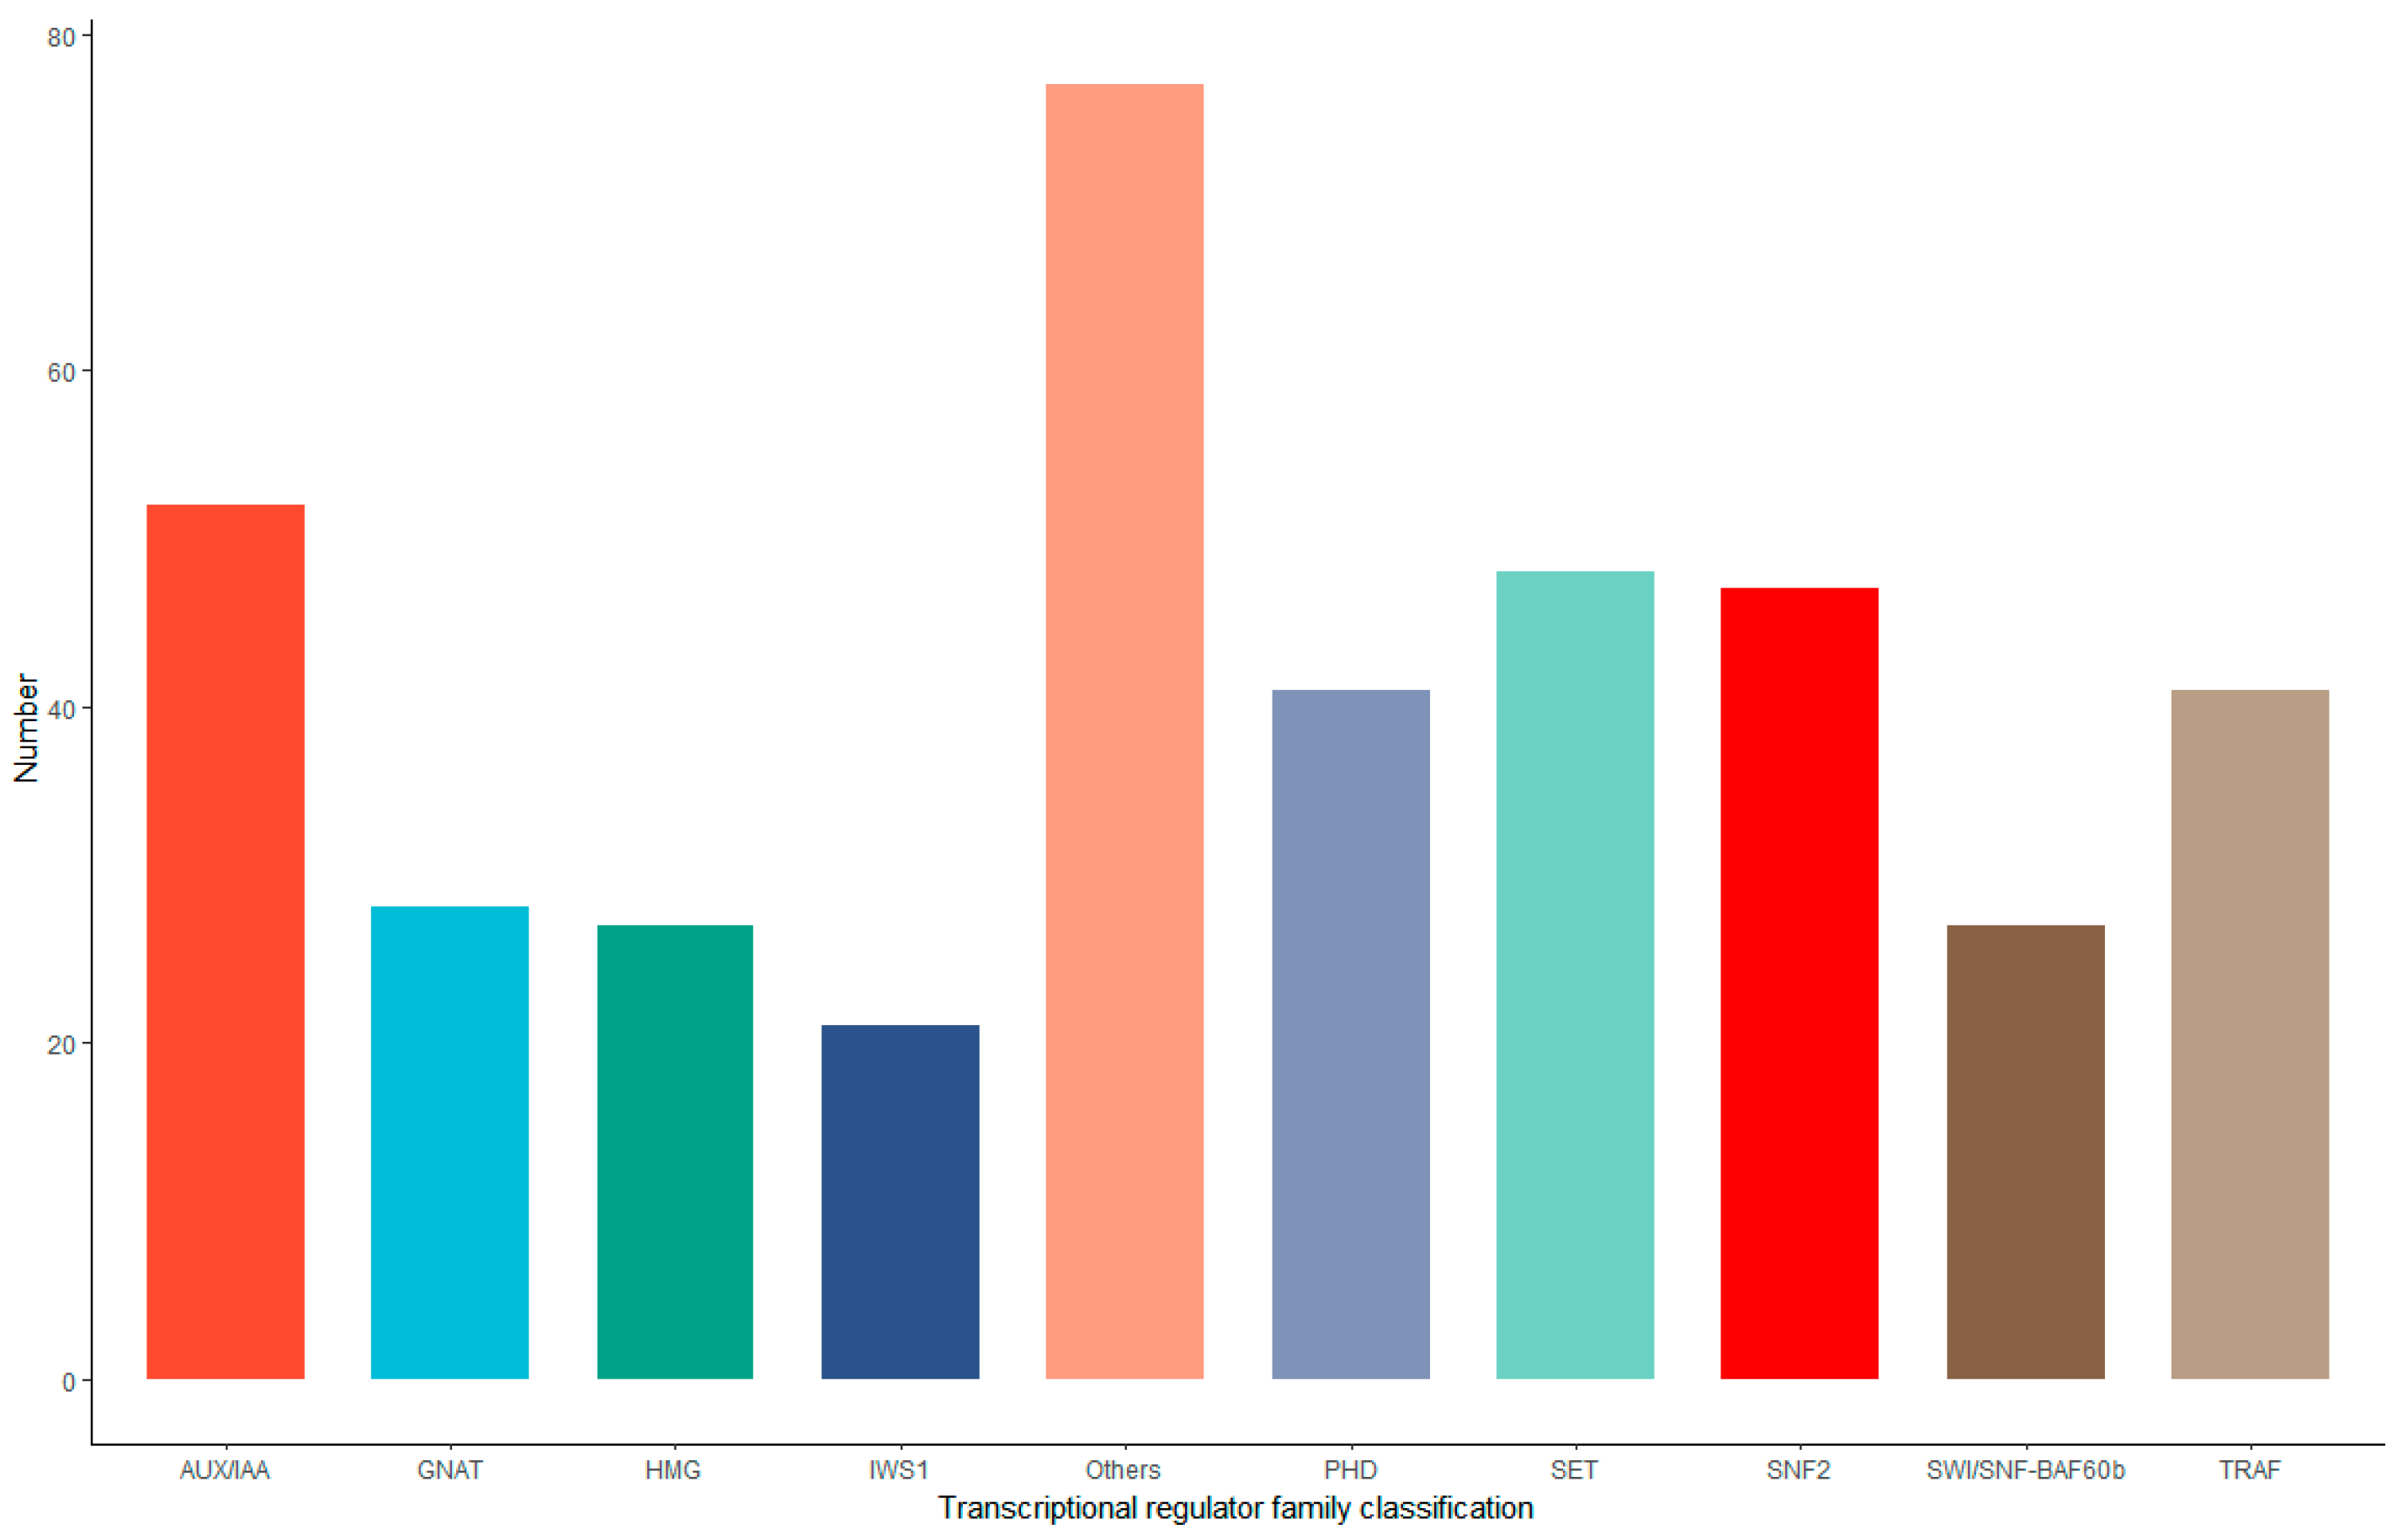
The sequences predicted a total of 3352 TFs and 67 TF families. The top 10 TF families included bHLH, C3H, AP2/ERF-ERF, C2H2, bZIP, GRAS, MYB-related, MYB, B3, and HB-HD-ZIP, of which the bHLH family was the most abundant (n = 121), followed by C3H (n = 119), and AP2/ERF-ERF (n = 104) (Figure 8). The HB-HD-ZI family was the least (n = 54). The AP2/ERF transcription factor family is a class of transcription factors that is widely present in plants. A total of 884 TRs were predicted, with 23 TR families and 77 other families, the most numerous being the AUX/IAA family (n = 52), followed by the family SET (n = 48), and the least numerous being WS1 (n = 21) (Figure 9).

3.7. Identification and Bioinformatics Analysis of WRKY Transcription Factor Families

SMRT technology, based on the third-generation sequencing technology PacBio [12], yielded a higher-quality transcriptome, while the Perl program obtained all the protein sequences. The TF database (plant TFdb) was utilized for the hmmscan comparison for the identification of its WRKY family members, and a total of 51 WRKY transcription factors were obtained (Table 1). According to the ExPASy website prediction, the amino acid length of its WRKY proteins ranged from 255 to 867 aa, and the average molecular weight was 61,498.31 Da, with CdWRKY28 having the highest number of amino acids and a molecular weight of 95,656.72 Da, and CdWRKY36 having the lowest number of amino acids and a molecular weight of 28,797.70 Da. The range of the isoelectric point was as follows: the isoelectric points varied from 5.53 to 10.45, with CdWRKY38 ranking as the first, while CdWRKY4 listing as the last. The fat coefficients of WRKY ranged from 51.05 to 103.32, with CdWRKY38 having the largest and CdWRKY21 having the smallest. Analyzing the total average hydrophobic index of the proteins, the total average hydrophobic index was negative, indicating that the WRKY proteins were all hydrophilic proteins (Table 3).
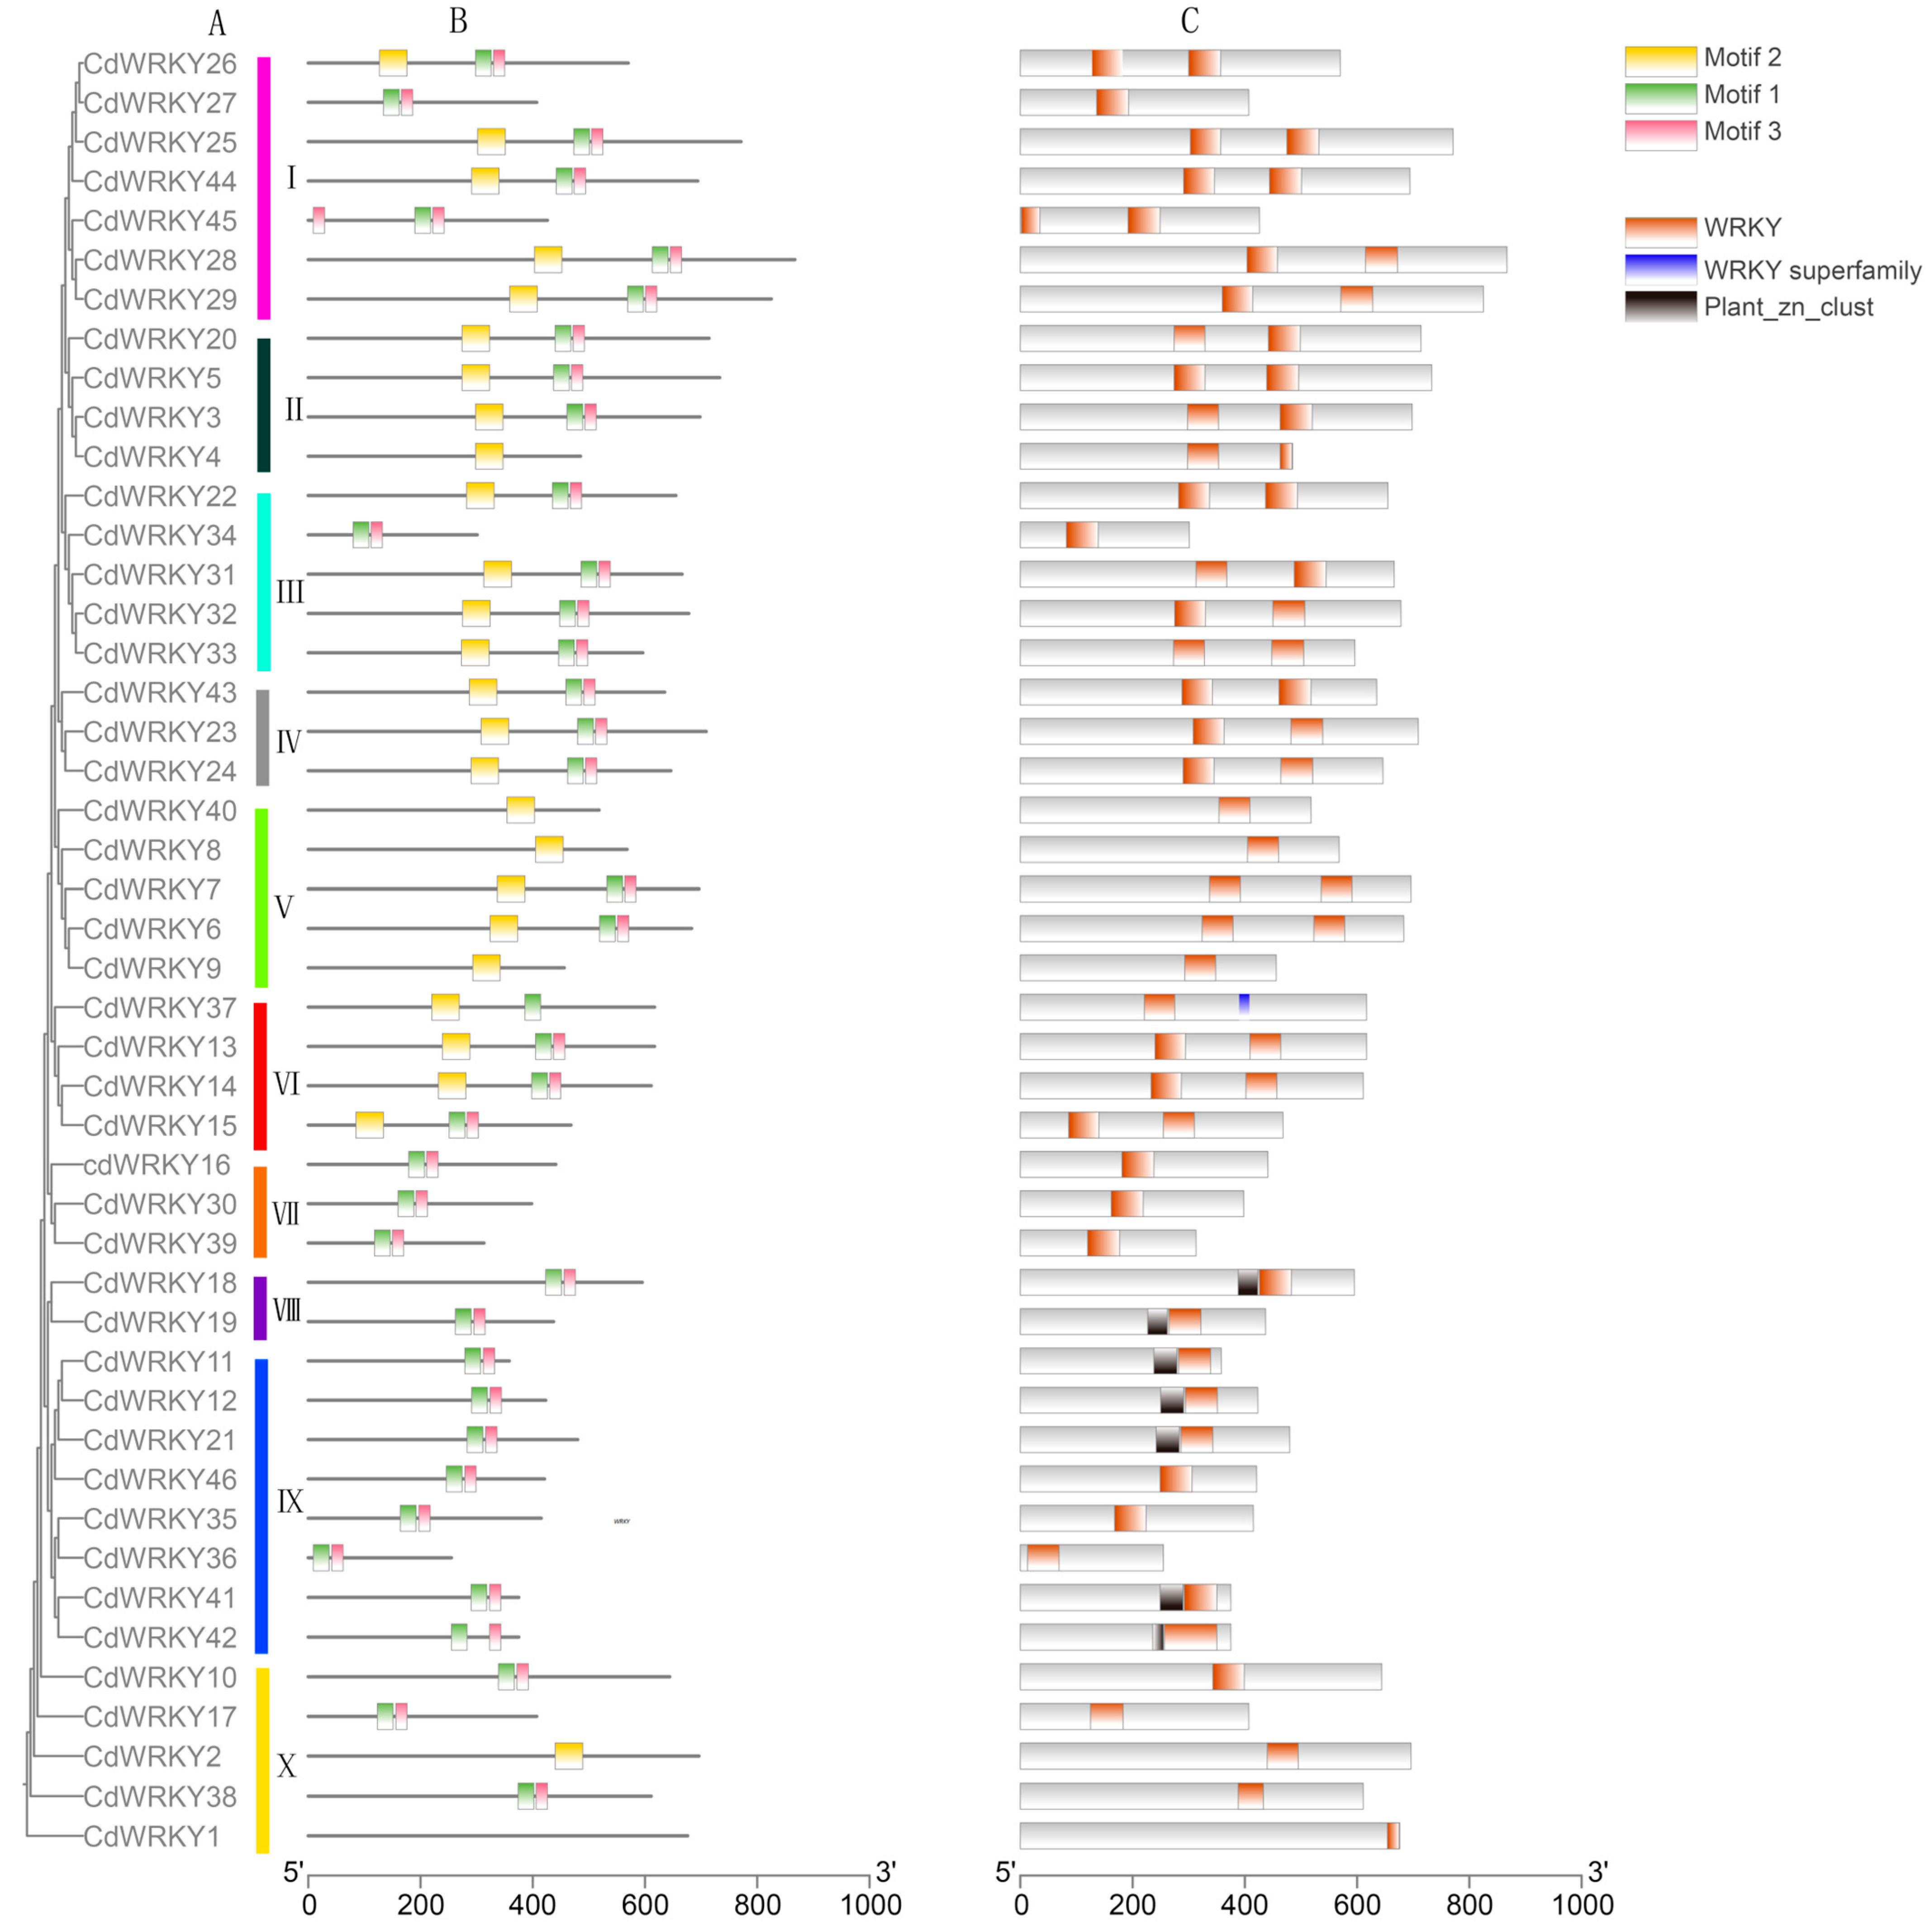
The DNAMAN (v 9.0.1.116) software and the MEGA (v 11.0.11) software were used for the sequence comparison and tree-building analysis (Figure 10A). The TBtools (v 2.112) software analyzed 46 CdWRKY proteins for conserved motifs and gene structures, leading to the classification of WRKY proteins into 10 subclades. Clades CdWRKY18 and CdWRKY19 had the fewest sequences compared with clade VIII, while clade IX proteins had the most sequences. CdWRKY18 and CdWRKY19 were in the fewest number of clades compared with the other subclade VIII, while subclade IX had the most protein sequences. The MEME (v 5.5.6) software revealed that the conserved structural domains of the WRKY proteins primarily comprised motif 1 and motif 3 (Figure 10B). Among them, none of subclades VII, VIII, and IX contained motif 2. A gene structure analysis revealed that all 46 WRKY proteins in C. drupifera had WRKY superfamily structural domains (Figure 10).

3.8. Alternative Splicing Analysis

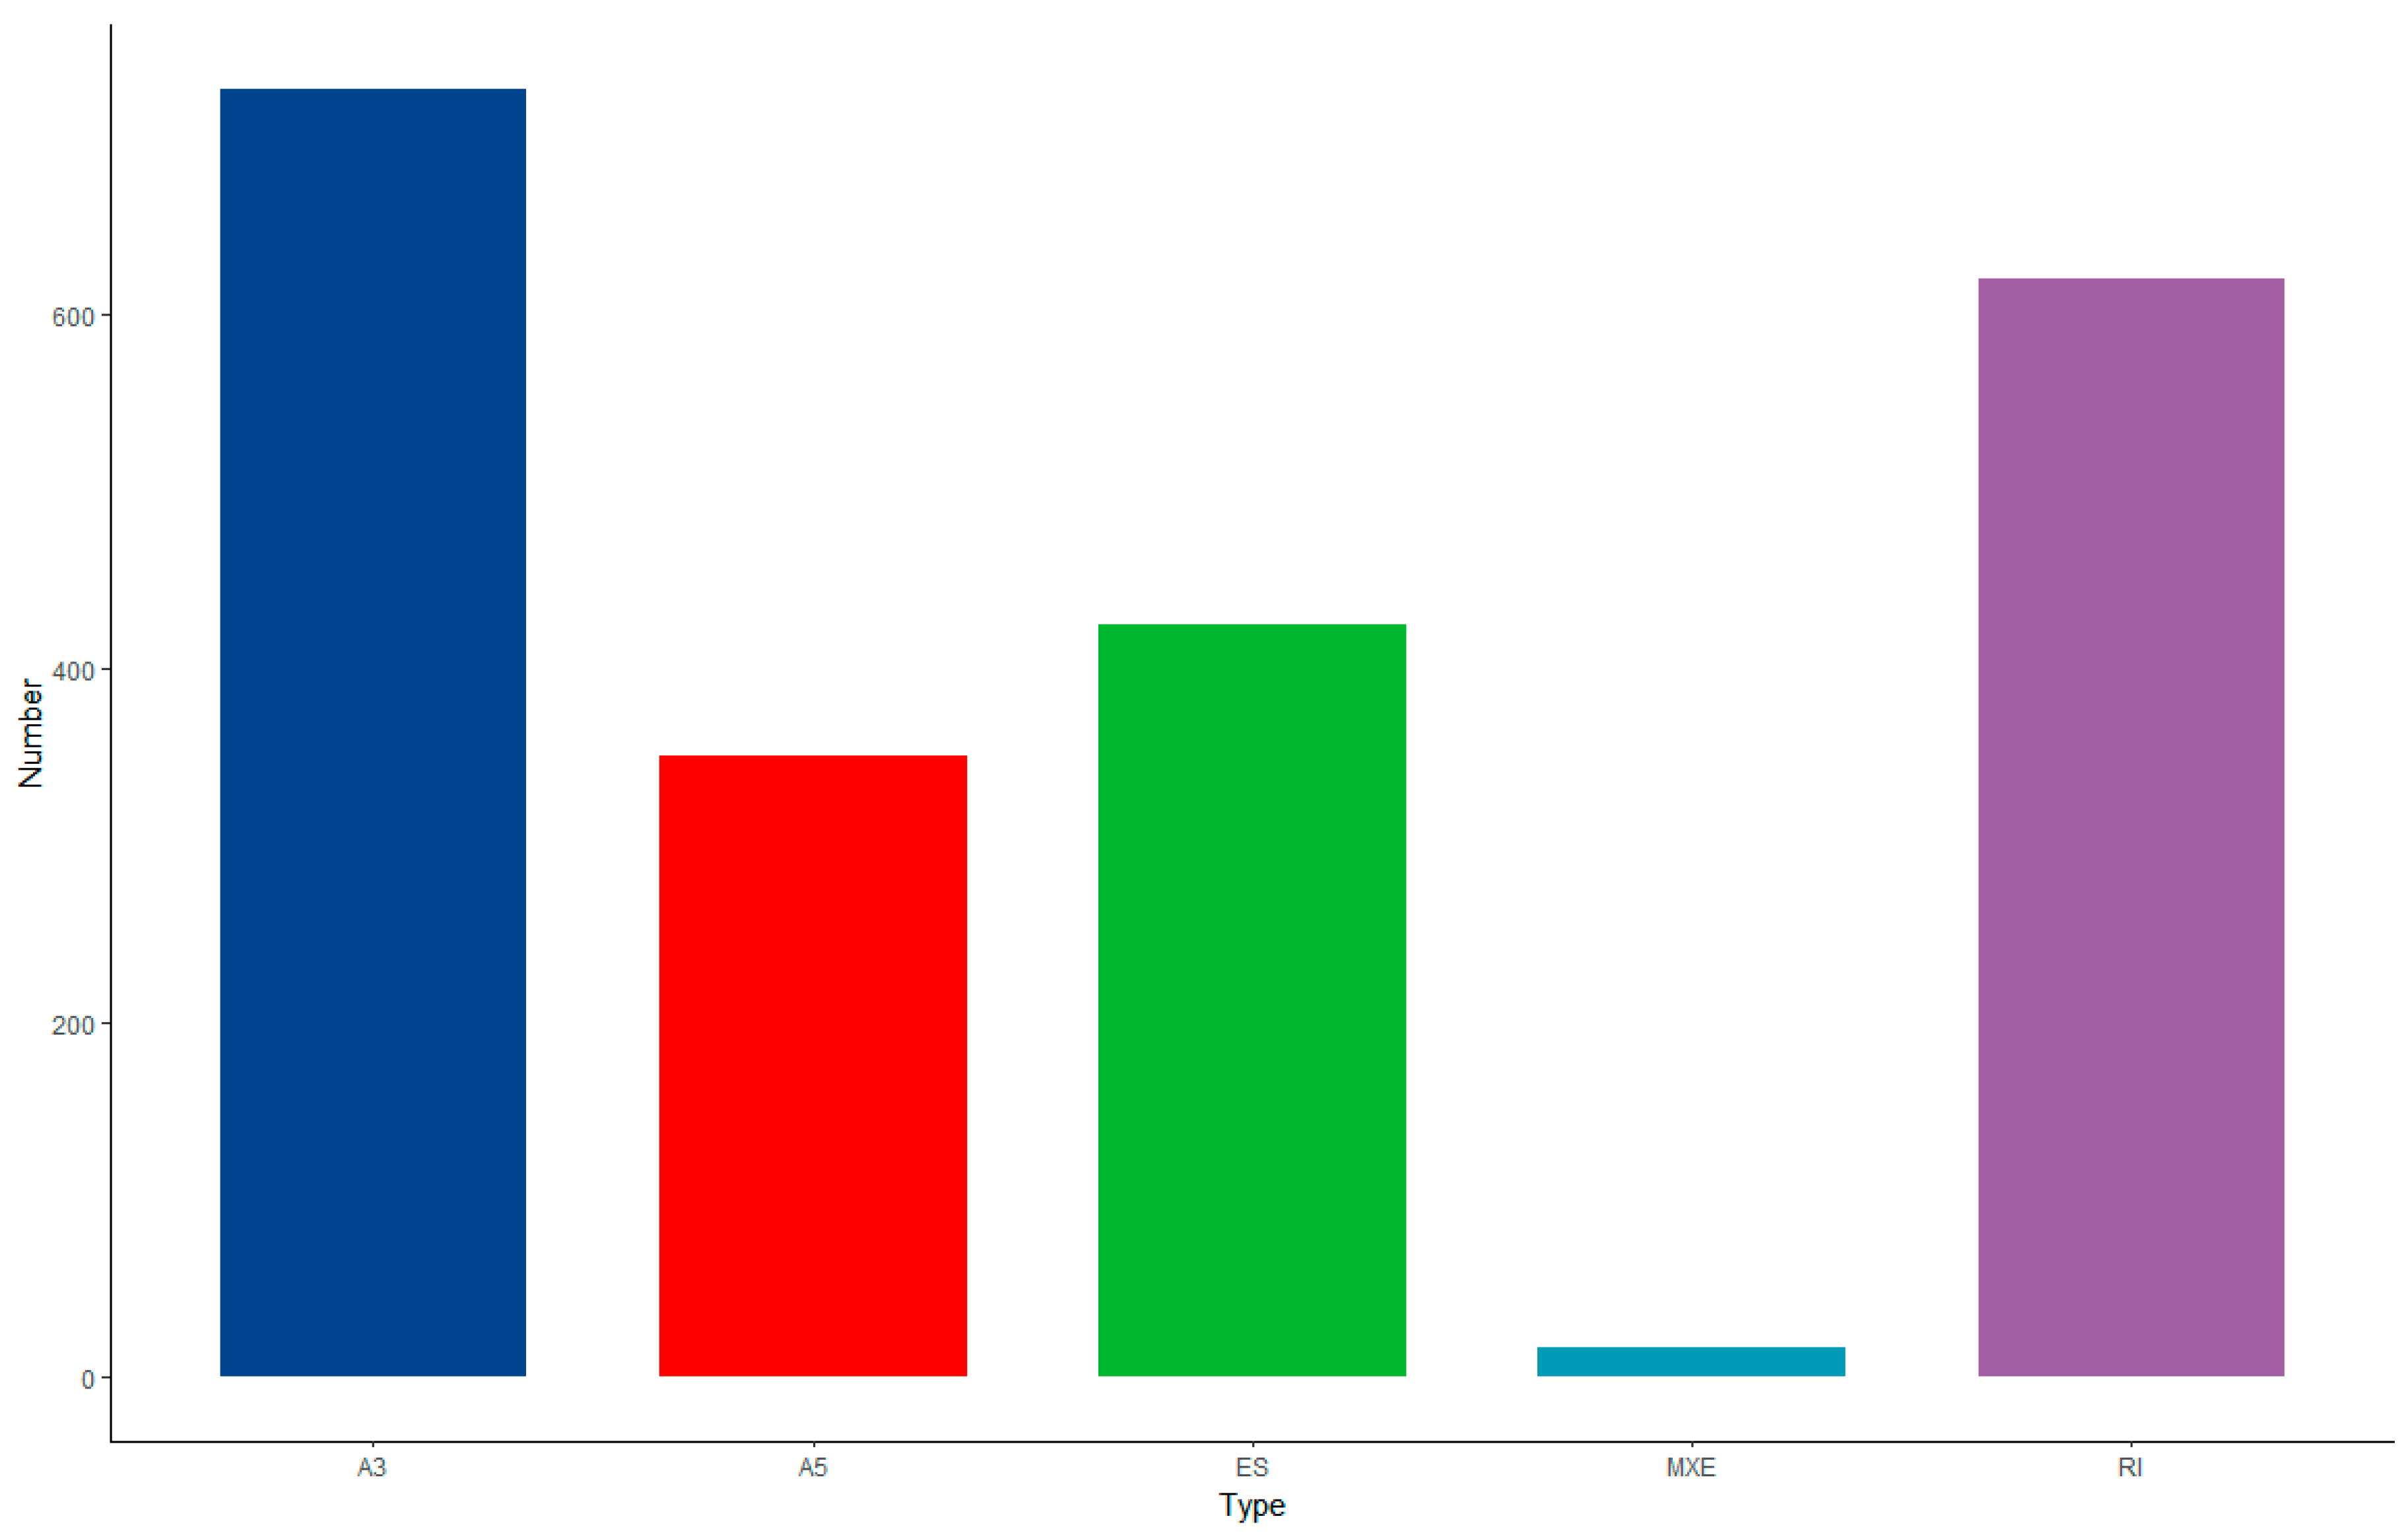
Five types of selective splicing were identified in the alternative splicing analysis. This study identified a total of 2625 variable shears. The highest number of variable shears of type A3 reached 728, followed by RI and ES with 621 and 425, respectively (Figure 11).

3.9. RNA-Seq Characteristics Analysis

To elucidate gene expression patterns, the transcriptomes of different plant parts were further analyzed using reference genomes. RNA-Seq was performed on eight samples of flower buds, leaves, leaf buds, branches, the pericarp, and seed kernels (A, B, C, D, E1, E2, F1, and F2). The eight samples had total bases of 5.61 G, 6.90 G, 6.55 G, 8.19 G, 7.02 G, 9.03 G, 8.98 G, 6.22 G, and the Q30 values were 94.00%, 92.85%, 93.93%, 93.12%, 92.24%, 97.39%, 93.36%, and 92.20%, respectively. The clean data for the eight samples were 5.46 G, 6.53 G, 6.40 G, 7.86 G, 6.67 G, 8.68 G, 8.69 G, and 6.00 G, and the values of Q30 were 94.76%, 94.38%, 94.60%, 94.25%, 93.64%, 94.84%, 94.36%, and 93.20%, respectively (Table 4).
The total gene degrees of the samples (A, B, C, D, E1, E2, F1, F1) were sequenced as 82.60%, 86.78%, 80.47%, 68.81%, 80.02%, 81.08%, 81.59%, and 80.27% with the reference genes [44], respectively.
We determined the expression levels of RNA-Seq using FPKM-normalized read counts to calculate the Pearson correlation coefficients (Figure 12). The figure shows that the highest correlation coefficient between the leaf bud and branch samples was 0.62, while the lowest correlation coefficient between the leaf and seed kernel samples was 0.01. The heat map of the leaves and seed kernels indicated a relatively large difference between the two.
The Edger (v3.30.3) software was used to identify DEGs between samples (FDR < 0.05 and Log 2 Fc > 1). There were 19,951 significant DEGs between the pericarp and the seed kernels, with 5234 upregulated genes and 4930 downregulated genes (Figure 13). There were only 1616 significant DEGs between the flower buds and the leaf buds, with 923 upregulated genes and 693 downregulated genes.

3.10. GO and KEGG Analysis of DEGs

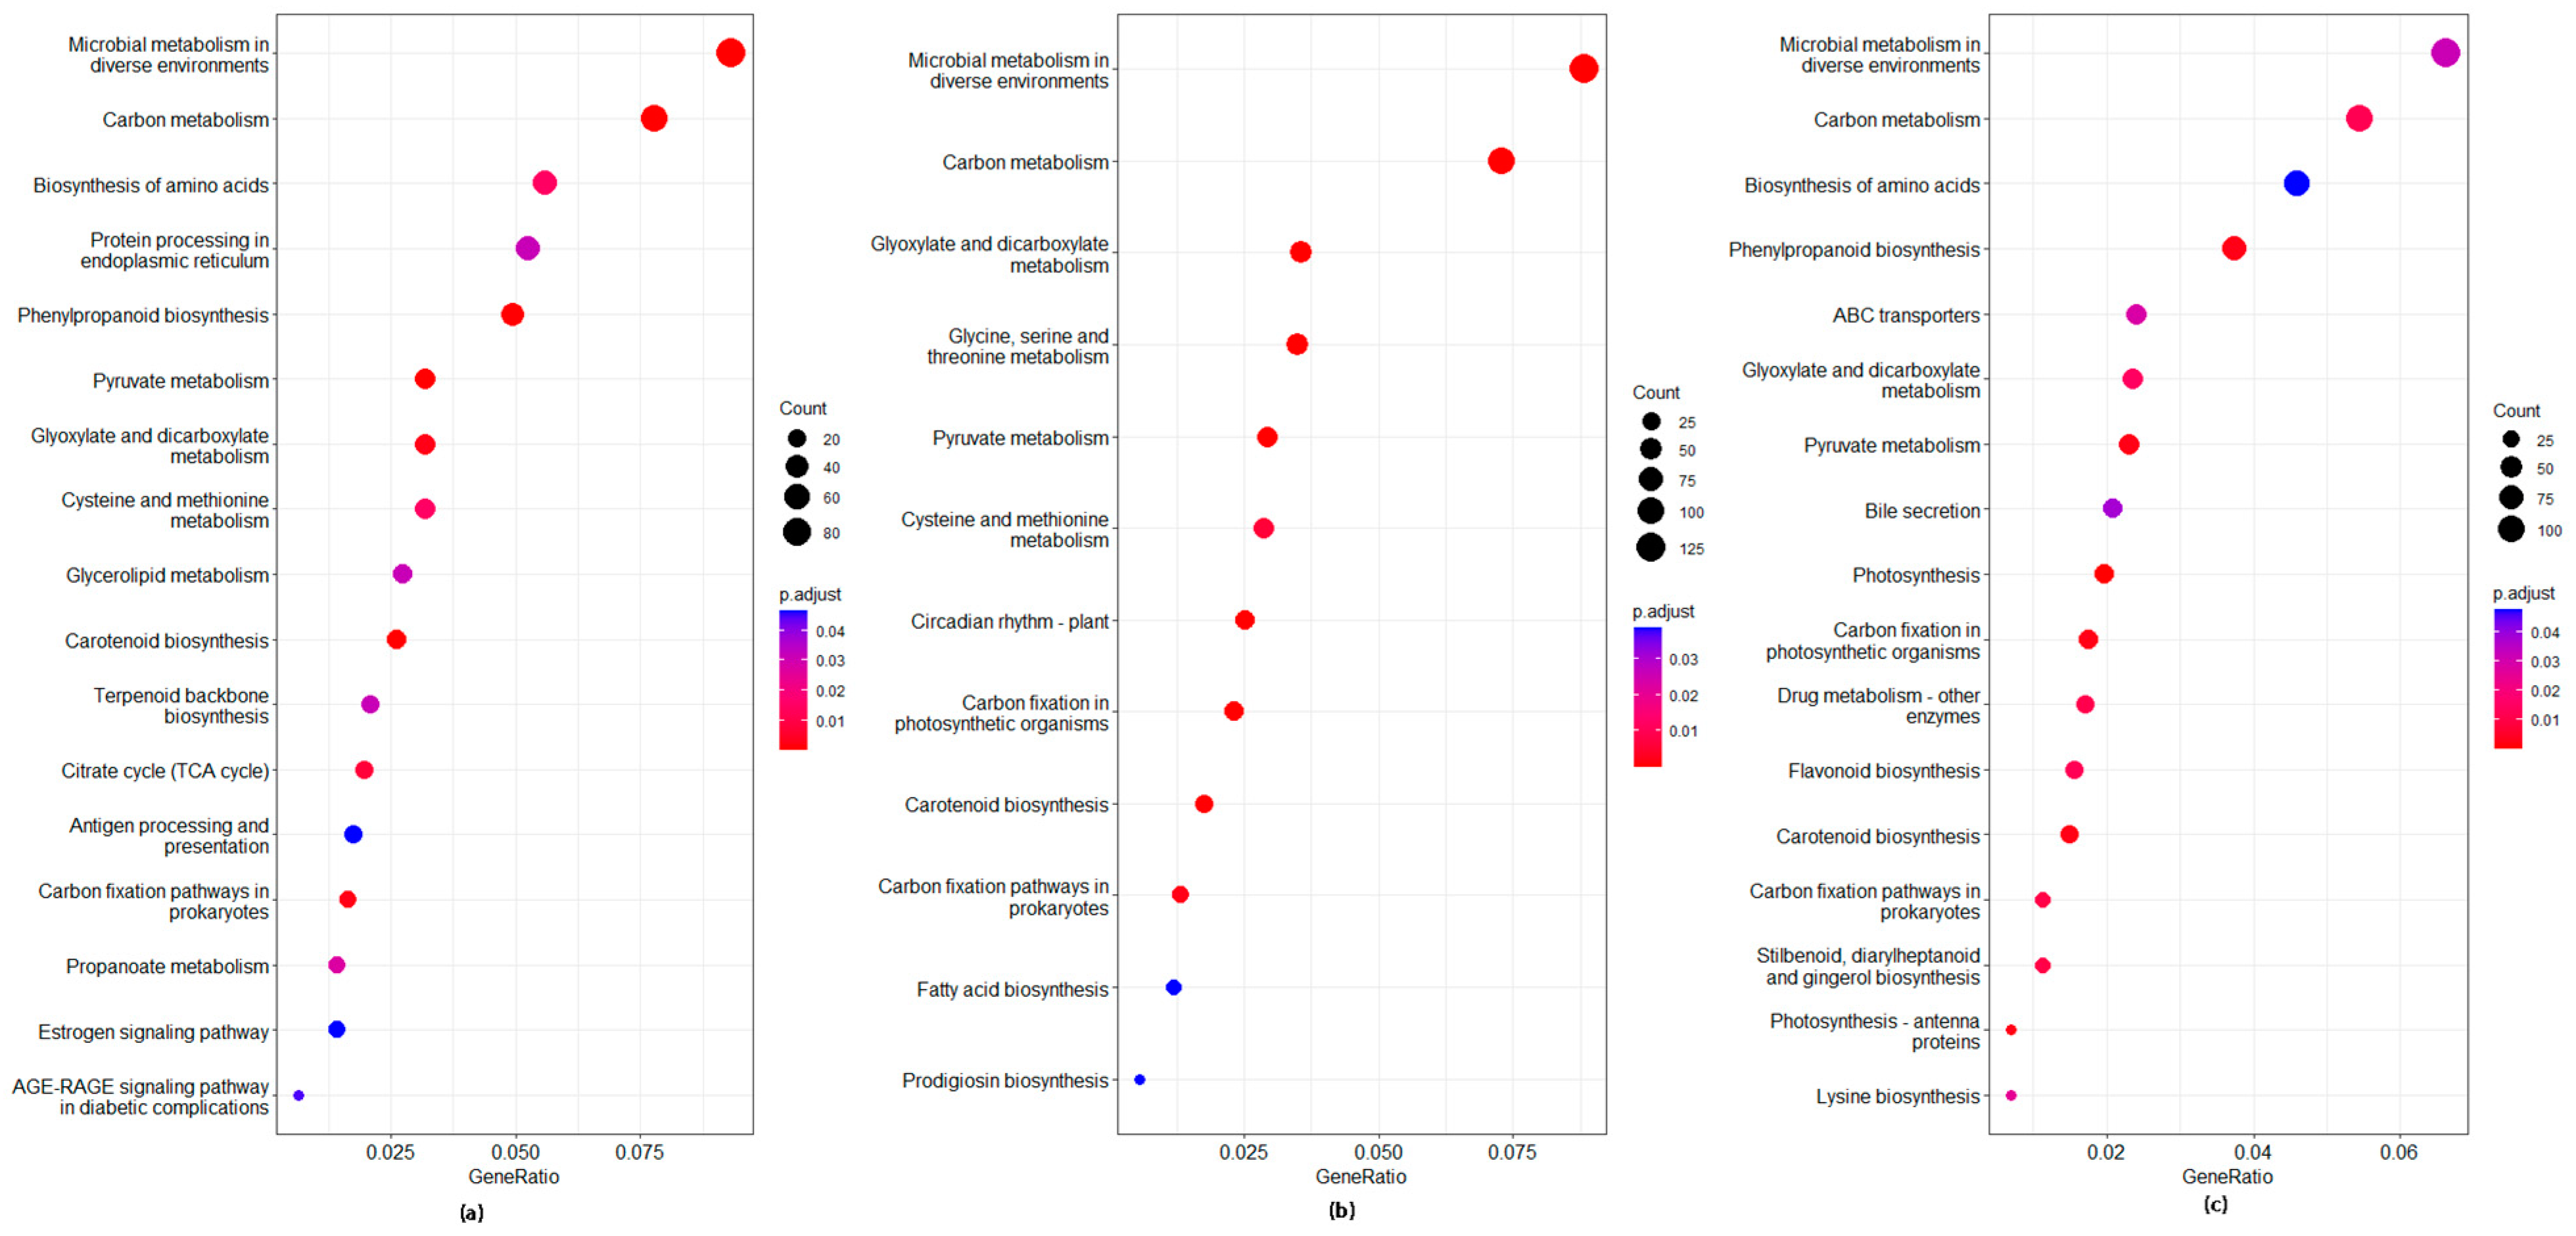
According to the correlation analysis, the differences between flower buds and seed kernels, leaves and seed kernels, and the pericarp and seed kernels were relatively large. In flower buds versus seed kernels, the 4216 DEG genes had 655 assignments to 18 KEGG pathways. The 7173 DEG genes in the leaf blades and seed kernels contained 715 genes, corresponding to 13 KEGG pathways. The 10,164 DEG genes from the pericarp and seed kernels had 978 assignments to 18 KEGG pathways. In diverse environments, microbial metabolism had the highest number of differential pathways among them, with proportions of 12.9%, 17.6%, and 12.6%, respectively. The next most frequent pathway was carbon metabolism in 10.8%, 14.5%, and 10.4%, respectively. In flower buds and seed kernels, which differ from the pericarp and seed kernels, the biosynthesis of amino acids ranked third, reaching 7.7% and 8.7%, respectively. Meanwhile, in the leaves and seed kernel species, glyoxylate and dicarboxylate metabolism reached 7.1% (Figure 14).
The top 20 GO enrichments were significantly presented (Figure 15). The biological process distributed 1470 genes in flower buds and seeds, of which 895 were upregulated and 575 were downregulated. The top three main distributions were related to the response to radiation (GO:0009314; n = 110; 10.26%), the organic acid metabolic process (GO:0006082; n = 109; 10.17%), and the response to light stimulus (GO:0009416; n = 107; 9.98%). Transmembrane transporter activity (GO:0022857; n = 112; 12.06%), ion transmembrane transporter activity (GO:0015075; n = 73; 7.86%), and inorganic molecular entity transmembrane transporter activity (GO:0015318; n = 71; 7.64%) primarily influenced molecular function, of which 182 were upregulated and 74 were downregulated. There was no enrichment of the cellular components in the top 20 (Figure 15a). In the cellular component, 1533 genes were distributed in leaves and seed kernels, with 1304 showing upregulation and 229 showing downregulation. The main distribution was in the plastid matrix (GO:0009532; n = 205; 10.78%), the chloroplast matrix (GO:0009570; n = 202; 10.63%), and the plastid envelope (GO:0009526; n = 202; 10.63%). Biological processes distributed 728 genes, with 494 showing upregulation and 234 showing downregulation. Most of these genes are involved in the response to radiation (GO:0009314; n = 154; 8.41%), the response to light stimulus (GO:0009416; n = 143; 7.81%), and the small molecule biosynthetic process (GO:0044283; n = 110; 6.01%). The distribution of 70 genes in “Molecular Function” showed 49 upregulated genes and 21 downregulated genes, mainly in active transmembrane transporter activity (GO:0022804; n = 70; 4.43%) (Figure 15b). The cellular component distributed 808 genes in the pericarp and seed kernels, of which 561 were upregulated and 247 were downregulated. These genes primarily function in the plastid envelope (GO:0009526; n = 179; 7.22%), the thylakoid (GO:0009579; n = 109; 4.40%), the chloroplast thylakoid (GO:0009534; n = 91; 3.67%), and the plastid thylakoid (GO:0009534; n = 91; 3.67%). In total, 1476 genes were distributed across the biological process, of which 877 were upregulated and 599 were downregulated. The primary genes are involved in responding to radiation (GO:0009314; n = 215; 8.69%), defending against other organisms (GO:0098542; n = 200; 8.08%), and reacting to light stimulation (GO:0009416; n = 196; 7.92%). “Molecular Function” distributed 205 genes, with 93 upregulated and 112 downregulated, primarily in oxidoreductase activity (GO:0016491; n = 205; 9.55%) (Figure 15c).
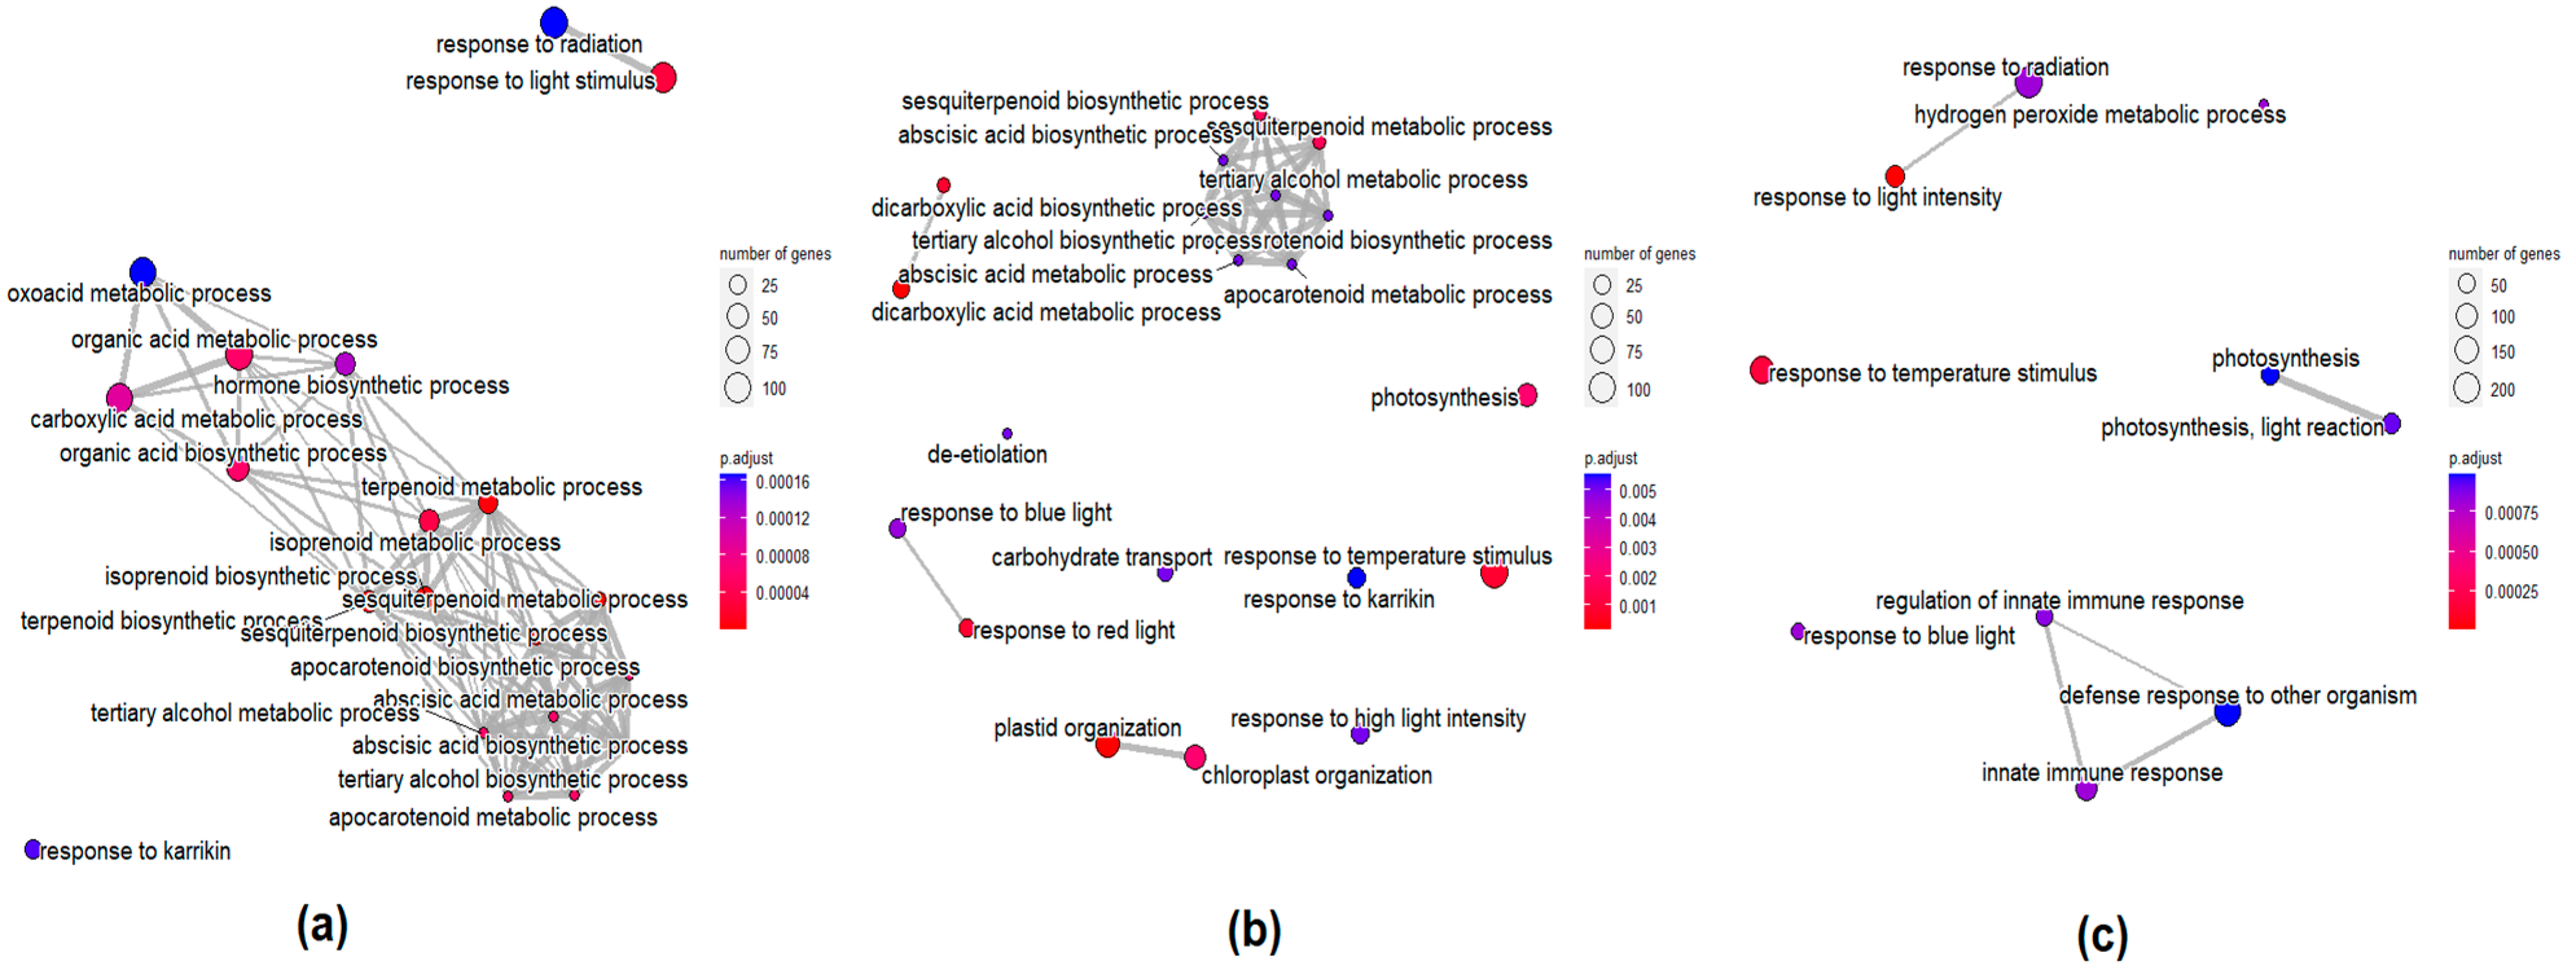
The organic acid metabolic process was more closely related to the flower bud and seed kernel pathways. In the enrichment association between the leaf blades and seed kernels, the tertiary alcohol metabolic process happened more often. In the enrichment association between the pericarp and seed kernels, immunity and defense processes happened more often (Figure 16).

4. Discussion

In this study, Camellia drupifera, one of the famous premium subtropical seed-oil tea tree species, exhibited an octoploid genome with high levels of heterozygosity and repetitive sequences [44,45,46]. When compared with the other closely related species, C. oleifera, C. drupifera has a higher biomass and fresh fruit yield, and its thicker peel makes it have a higher stress resistance in the southern China region. In southern China, it is a rare, high-quality seed-oil camellia species. In recent years, the development of third-generation sequencing technologies and bioinformatics has led to the development of genetic and genomic studies using combined sequencing and computers. Full-length transcriptome sequencing using third-generation technologies in transcriptome applications is currently one of the most efficient ways, especially in non-model organisms that lack de novo assembly [7,47] and are longer in length, thus allowing for errors in the second-generation assembly process [48]. The average length of the third-generation transcriptome data (1332 bp) was about 1-fold longer than the average length of the second-generation transcripts of C. oleifera, which facilitated our analysis of their transcript properties [49].
High-throughput sequencing technology can be effective in developing SSR markers for non-model plants without available genes [50]. There are already studies that show that AG/CT is the most common dinucleotide repeat sequence in both dicotyledons and monocotyledons [51]. This study also finds AG/CT repeat types to be 54.14% of all SSRs. The development of SSRs is also beneficial in variety identification and other genetic breeding research in C. drupifera. The lncRNAs identified 1421 in C. drupifera and more than 1204 high-precision lncRNAs in C. sinensis [52]. TFs play a crucial role in regulating gene expression in response to biotic and abiotic stresses. In this species, the bHLH transcription factors often function as dimers, such as CsbHLH116 and CsbHLH133. The flavonoid pathway is affected by C3H, which is an important enzyme. It is one of several enzymes controlled by lignin [53], and it can improve the pericarp’s defense function during fruit development. In comparison with the top three Carya illinoinensis transcription factors, both bHLH and C3H were found to be C3H, both of which contained 119 [24]. C3H is a key enzyme in flavonoid biosynthesis. The expression of C3H influences the accumulation of flavonoids and other physiological processes in the plant that affect the fruit quality [54]. These processes include flower color, stress tolerance, pericarp development, and flavonoid accumulation. The WRKY family has four more genes than we found in common C. oleifera. We hypothesized that this could be associated with its functions, including enhancing stress tolerance [24].
Alternative splicing (AS) is an important process that happens after transcription. It can create more than one type of mRNA from a single pre-mRNA molecule by shearing it in various ways [55]. This study may link AS to stress conditions. Different types of selective splicing alter specific functions, and in C. sinensis, this can induce a series of physiological processes, such as plant metabolism control and disease resistance [56]. Different gene splice isoforms alter the biochemical activities, interactions, and subcellular localization of proteins to modify these functions [57]. It suggests that multiple types of AS in our C. drupifera can improve fruit resistance.
The secondary transcriptome revealed significant differences between flower buds and seed kernels, leaves and seed kernels, and the pericarp and seed kernels. The pathway associations between the flower buds and seed kernels, which include isoprenoid metabolic processes, terpenoid metabolic processes, isoprenoid biosynthetic processes, organic acid metabolic processes, organic acid biosynthetic processes, oxoacid metabolic processes, carboxylic acid metabolic processes, and hormone biosynthetic processes, showed a relatively high correlation. We focused on the different pathways between the leaf and the seed kernel in several metabolic processes, including the abscisic acid (ABA) metabolic process, the apocarotenoid biosynthetic process, the tertiary alcohol metabolic process, the abscisic acid biosynthetic process, and the apocarotenoid metabolic process. Examples of these pathways include the tertiary alcohol biosynthetic process, the sesquiterpenoid biosynthetic process, and the sesquiterpenoid metabolic process. On the other hand, we can also focus on ABA synthesis in a single step. Research has demonstrated that ABA plays a crucial role in regulating fruit ripening [58]. It plays a significant role in fruit growth and development, and the presence of seed kernel ripening likely influences ripening and senescence [59]. Many studies have shown that the resistance of C. drupifera fruits to disease rises with the thickness of their pericarp, waxy layer, cuticle, and thin-walled tissue [60]. The focus lies on the differences between the pericarp and the seed kernels, particularly in terms of defense and immunity. As a result, studying the pericarp can improve fruit resistance.

5. Conclusions

This study conducted the first full-length transcriptome analysis on C. drupifera in Guangdong, China, sequenced using SMRT technology. Since the species used in this study is not a model species, the availability of useful information would hinder the complete presentation of its transcriptome. Therefore, it is a necessity to include more reference species to enrich the overall genomic information of this valuable species in future studies. However, overall, the full-length transcriptome sequences generated in this study could provide valuable genomic information on C. drupifera and thus contribute to the molecular breeding for resistance in this species.

Author Contributions

Conceptualization, B.L. (Boyong Liao) and S.Y.L.; methodology, H.S.; software, H.S.; validation, H.S., B.L. (Boyong Liao), and J.D.; formal analysis, H.S. and P.Z.; investigation, J.D and Y.S.; resources, B.L. (Boyong Liao) and Y.L.; data curation, H.S. and B.L. (Biting Liu); writing—original draft preparation, H.S. and B.L. (Boyong Liao); writing—review and editing, J.D., P.Z., F.C., T.S., S.Y.L., and Y.L.; visualization, S.H.; supervision, B.L. (Boyong Liao) and W.X.; project administration, B.L. (Boyong Liao); funding acquisition, B.L. (Boyong Liao), F.C., T.S., S.Y.L., and Y.L. All authors have read and agreed to the published version of the manuscript.

Funding

This research was funded by the Guangdong Forestry Science and Technology Innovation Project (2023KJCX006), the Key-Area Research and Development Program of Guangdong Province (2020B020215003), the Guangzhou Science and Technology Planning Project (202201011754), and the INTI International University Research Seeding Scheme (INTI-FHLS-02-16-2023).

Data Availability Statement

The original contributions presented in the study are included in the article, further inquiries can be directed to the corresponding author.

Acknowledgments

We thank the farm manager, Lv Yuzhou, of the Shaoguan Qujiang District state-owned Xiaokeng forest farm and their staff for the assistance provided in the field.

Conflicts of Interest

The authors declare no conflicts of interest.

References

  1. Li, Y. Physiological Response and Transcriptome of Camellia Oleifera to Drought. Master’s Thesis, Central South University of Forestry and Technology, Changsha, China, 2021. [Google Scholar]
  2. Chen, S. Research on promotion of Camellia oleifera planting technology. Guangdong Seric. 2022, 56, 66–68. [Google Scholar]
  3. Tan, X. Advances in the molecular breeding of Camellia oleifera. J. Cen. South Uni. For. Tec. 2023, 43, 1–24. [Google Scholar] [CrossRef]
  4. Gong, W.; Song, Q.; Ji, K.; Gong, S.; Wang, L.; Chen, L.; Zhang, J.; Yuan, D. Full-length transcriptome from Camellia oleifera seed provides insight into the transcript variants involved in oil biosynthesis. J. Agric. Food Chem. 2020, 68, 14670–14683. [Google Scholar] [CrossRef]
  5. Ye, Y.; Xing, H.; Chen, X. Anti-inflammatory and analgesic activities of the hydrolyzed sasanquasaponins from the defatted seeds of Camellia oleifera. Arch. Pharm. Res. 2013, 36, 941–951. [Google Scholar] [CrossRef] [PubMed]
  6. Shangguan, L.; Mu, Q.; Fang, X.; Zhang, K.; Jia, H.; Li, X.; Bao, Y.; Fang, J. RNA-sequencing reveals biological networks during table grapevine (‘Fujiminori’) fruit development. PLoS ONE 2017, 12, e0170571. [Google Scholar] [CrossRef] [PubMed]
  7. Byrne, A.; Cole, C.; Volden, R.; Vollmers, C. Realizing the potential of full-length transcriptome sequencing. Philos. Trans. R. Soc. B Biol. Sci. 2019, 374, 20190097. [Google Scholar] [CrossRef] [PubMed]
  8. Hestand, M.S.; Ameur, A. The versatility of SMRT sequencing. Genes 2019, 10, 24. [Google Scholar] [CrossRef]
  9. Deng, A.; Li, J.; Yao, Z.; Afriyie, G.; Chen, Z.; Guo, Y.; Luo, J.; Wang, Z. SMRT sequencing of the full-length transcriptome of the Coelomactra antiquata. Front. Genet. 2021, 12, 741243. [Google Scholar] [CrossRef]
  10. Yu, H.; Liu, M.; Yin, M.; Shan, T.; Peng, H.; Wang, J.; Chang, X.; Peng, D.; Zha, L.; Gui, S. transcriptome analysis identifies putative genes involved in triterpenoid biosynthesis in Platycodon grandiflorus. Planta 2021, 254, 34. [Google Scholar] [CrossRef]
  11. Chin, C.-S.; Alexander, D.H.; Marks, P.; Klammer, A.A.; Drake, J.; Heiner, C.; Clum, A.; Copeland, A.; Huddleston, J.; Eichler, E.E.; et al. Nonhybrid, finished microbial genome assemblies from long-read SMRT sequencing data. Nat. Methods 2013, 10, 563–569. [Google Scholar] [CrossRef]
  12. Rhoads, A.; Au, K.F. PacBio Sequencing and its applications. Genom. Proteom. Bioinform. 2015, 13, 278–289. [Google Scholar] [CrossRef]
  13. Liu, X.; Mei, W.; Soltis, P.S.; Soltis, D.E.; Barbazuk, W.B. Detecting alternatively spliced transcript isoforms from single-molecule long-read sequences without a reference genome. Mol. Ecol. Resour. 2017, 17, 1243–1256. [Google Scholar] [CrossRef]
  14. Bridges, M.C.; Daulagala, A.C.; Kourtidis, A. LNCcation: lncRNA localization and function. J. Cell Biol. 2021, 220, e202009045. [Google Scholar] [CrossRef]
  15. Qiu, F.; Wang, X.; Zheng, Y.; Wang, H.; Liu, X.; Su, X. Full-length transcriptome sequencing and different chemotype expression profile analysis of genes related to monoterpenoid biosynthesis in Cinnamomum porrectum. Int. J. Mol. Sci. 2019, 20, 6230. [Google Scholar] [CrossRef]
  16. Ni, L.; Wang, Z.; Liu, X.; Wu, S.; Hua, J.; Yin, Y.; Li, H.; Gu, C. transcriptome analysis of salt stress in Hibiscus hamabo Sieb. et Zucc based on Pacbio full-length transcriptome sequencing. Int. J. Mol. Sci. 2022, 23, 138. [Google Scholar] [CrossRef]
  17. Rao, G.; Zhang, J.; Liu, X.; Ying, L. Identification of putative genes for polyphenol biosynthesis in olive fruits and leaves using full-length transcriptome sequencing. Food Chem. 2019, 300, 125246. [Google Scholar]
  18. Feng, Y.; Zhao, Y.; Zhang, J.; Wang, B.; Yang, C.; Zhou, H.; Qiao, J. Full-length SMRT transcriptome sequencing and microsatellite characterization in Paulownia catalpifolia. Sci. Rep. 2021, 11, 8734. [Google Scholar] [CrossRef]
  19. Jia, X.; Tang, L.; Mei, X.; Liu, H.; Luo, H.; Deng, Y.; Su, J. Single-molecule long-read sequencing of the full-length transcriptome of Rhododendron lapponicum L. Sci. Rep. 2020, 10, 6755. [Google Scholar] [CrossRef] [PubMed]
  20. He, Z.; Su, Y.; Wang, T. Full-length transcriptome analysis of four different tissues of Cephalotaxus oliveri. Int. J. Mol. Sci. 2021, 22, E787. [Google Scholar] [CrossRef]
  21. Qu, X.; Zhou, J.; Masabni, J.; Yuan, J. Phosphorus relieves aluminum toxicity in oil tea seedlings by regulating the metabolic profiling in the roots. Plant Physiol. Biochem. 2020, 152, 12–22. [Google Scholar] [CrossRef] [PubMed]
  22. Guo, H.; Zhong, Q.; Tian, F.; Zhou, X.; Tan, X.; Luo, Z. Transcriptome analysis reveals putative induction of floral initiation by old leaves in tea-oil tree (Camellia oleifera ’Changlin53′). Int. J. Mol. Sci. 2022, 23, 13021. [Google Scholar] [CrossRef] [PubMed]
  23. Zhang, P.; Cui, Z.; Guo, M.; Xi, R. Characteristics of the soil microbial community in the forestland of Camellia oleifera. PeerJ 2020, 8, e9117. [Google Scholar] [CrossRef] [PubMed]
  24. Zhu, Y.; Liang, D.; Song, Z.; Tan, Y.; Guo, X.; Wang, D. Genetic diversity analysis and core germplasm collection construction of Camellia oleifera based on fruit phenotype and SSR data. Genes 2022, 13, 2351. [Google Scholar] [CrossRef]
  25. Long, W.; Huang, G.; Yao, X.; Lv, L.; Yu, C.; Wang, K. Untargeted metabolism approach reveals difference of varieties of bud and relation among characteristics of grafting seedlings in Camellia oleifera. Front. Plant Sci. 2022, 13, 1024353. [Google Scholar] [CrossRef] [PubMed]
  26. Hao, B.-Q.; Liao, H.-Z.; Xia, Y.-Y.; Wang, D.-X.; Ye, H. BSR and full-length transcriptome approaches identified candidate genes for high seed ratio in Camellia vietnamensis. Curr. Issues Mol. Biol. 2022, 45, 311–326. [Google Scholar] [CrossRef] [PubMed]
  27. Miao, B.-B.; Dong, W.; Gu, Y.-X.; Han, Z.-F.; Luo, X.; Ke, C.-H.; You, W.-W. OmicsSuite: A customized and pipelined suite for analysis and visualization of multi-omics big data. Hortic. Res. 2023, 10, uhad195. [Google Scholar] [CrossRef] [PubMed]
  28. Li, A.; Zhang, J.; Zhou, Z. PLEK: A tool for predicting long non-coding rnas and messenger RNAs based on an improved k-mer scheme. BMC Bioinform. 2014, 15, 311. [Google Scholar] [CrossRef]
  29. Sun, L.; Luo, H.; Bu, D.; Zhao, G.; Yu, K.; Zhang, C.; Liu, Y.; Chen, R.; Zhao, Y. Utilizing sequence intrinsic composition to classify protein-coding and long non-coding transcripts. Nucleic Acids Res. 2013, 41, e166. [Google Scholar] [CrossRef] [PubMed]
  30. Kong, L.; Zhang, Y.; Ye, Z.-Q.; Liu, X.-Q.; Zhao, S.-Q.; Wei, L.; Gao, G. CPC: Assess the protein-coding potential of transcripts using sequence features and support vector machine. Nucleic Acids Res. 2007, 35, W345–W349. [Google Scholar] [CrossRef]
  31. Punta, M.; Coggill, P.C.; Eberhardt, R.Y.; Mistry, J.; Tate, J.; Boursnell, C.; Pang, N.; Forslund, K.; Ceric, G.; Clements, J.; et al. The Pfam protein families database. Nucleic Acids Res. 2012, 40, D290–D301. [Google Scholar] [CrossRef]
  32. Zheng, Y.; Jiao, C.; Sun, H.; Rosli, H.G.; Pombo, M.A.; Zhang, P.; Banf, M.; Dai, X.; Martin, G.B.; Giovannoni, J.J.; et al. iTAK: A program for genome-wide prediction and classification of plant transcription factors, transcriptional regulators, and protein kinases. Mol. Plant 2016, 9, 1667–1670. [Google Scholar] [CrossRef] [PubMed]
  33. Castro, J.C.; Maddox, J.D.; Rodríguez, H.N.; Castro, C.G.; Imán-Correa, S.A.; Cobos, M.; Paredes, J.D.; Marapara, J.L.; Braga, J.; Adrianzén, P.M. Dataset of de novo assembly and functional annotation of the transcriptome during germination and initial growth of seedlings of Myrciaria dubia “Camu-Camu”. Data Brief 2020, 31, 105834. [Google Scholar] [CrossRef] [PubMed]
  34. Foissac, S.; Sammeth, M. ASTALAVISTA: Dynamic and flexible analysis of alternative splicing events in custom gene datasets. Nucleic Acids Res. 2007, 35, W297–W299. [Google Scholar] [CrossRef] [PubMed]
  35. Guo, A.-Y.; Chen, X.; Gao, G.; Zhang, H.; Zhu, Q.-H.; Liu, X.-C.; Zhong, Y.-F.; Gu, X.; He, K.; Luo, J. PlantTFDB: A comprehensive plant transcription factor database. Nucleic Acids Res. 2008, 36, D966–D969. [Google Scholar] [CrossRef] [PubMed]
  36. Potter, S.C.; Luciani, A.; Eddy, S.R.; Park, Y.; Lopez, R.; Finn, R.D. HMMER Web server: 2018 update. Nucleic Acids Res. 2018, 46, W200–W204. [Google Scholar] [CrossRef] [PubMed]
  37. Chen, C.; Chen, H.; Zhang, Y.; Thomas, H.R.; Frank, M.H.; He, Y.; Xia, R. TBtools: An integrative toolkit developed for interactive analyses of big biological data. Mol. Plant 2020, 13, 1194–1202. [Google Scholar] [CrossRef] [PubMed]
  38. Diao, P.; Chen, C.; Zhang, Y.; Meng, Q.; Lv, W.; Ma, N. The role of NAC transcription factor in plant cold response. Plant Signal. Behav. 2020, 15, 1785668. [Google Scholar] [CrossRef] [PubMed]
  39. Liao, G.; Duan, Y.; Wang, C.; Xu, M.; He, C.; Su, L.; Zheng, Y. Identification and bioinformatics analysis of Bhlh transcription factor family in Clerodendrum japonicum. Mol. Plant Breed. 2023, 1–17. [Google Scholar]
  40. Dai, Z.; Sheridan, J.M.; Gearing, L.J.; Moore, D.L.; Su, S.; Wormald, S.; Wilcox, S.; O’Connor, L.; Dickins, R.A.; Blewitt, M.E.; et al. EdgeR: A versatile tool for the analysis of shRNA-Seq and CRISPR-Cas9 genetic screens. F1000Res 2014, 3, 95. [Google Scholar] [CrossRef]
  41. Zhang, Z.; Xu, Y.; Chen, Y.; Li, Z.; Wang, X.; Chen, L.; Peng, S.; Ma, L.; Wang, R.; Li, M.; et al. Transcriptome sequencing and analysis of SSR characteristics of Camellia oleifera. J. South. For. Uni. 2018, 38, 63–68. [Google Scholar]
  42. Zhang, C.; Ren, H.; Yao, X.; Wang, K.; Chang, J. Full-length transcriptome analysis of pecan (Carya illinoinensis) kernels. G3-Genes Genom. Genet. 2021, 11, jkab182. [Google Scholar] [CrossRef] [PubMed]
  43. Zhang, H.; Liu, Z.; Hu, A.; Wu, H.; Zhu, J.; Wang, F.; Cao, P.; Yang, X.; Zhang, H. Full-length transcriptome analysis of the halophyte Nitraria sibirica Pall. Genes 2022, 13, 661. [Google Scholar] [CrossRef] [PubMed]
  44. Lin, P. The genome of oil-Camellia and population genomics analysis provide insights into seed oil domestication. Genom. Biol. 2022, 23, 14. [Google Scholar] [CrossRef] [PubMed]
  45. Zhang, K.; Liao, B.; Hang, R.; Luo, H.; Tu, P.; Wang, Y.; Dai, W.; Lu, Y.; Li, Y. Populations construction and genetic evaluation of hybrid F1 generation of Camellia gauchowensis Chang II. Non-Wood For. Res. 2023, 41, 91–105. [Google Scholar] [CrossRef]
  46. Wang, F.; Zhang, B.; Wen, D.; Liu, R.; Yao, X.; Chen, Z.; Mu, R.; Pei, H.; Liu, M.; Song, B.; et al. Chromosome-scale genome assembly of Camellia sinensis combined with multi-omics provides insights into its responses to infestation with green leafhoppers. Front. Plant Sci. 2022, 13, 1004387. [Google Scholar] [CrossRef] [PubMed]
  47. Wang, B.; Kumar, V.; Olson, A.; Ware, D. Reviving the transcriptome studies: An insight into the emergence of single-molecule transcriptome sequencing. Front. Genet. 2019, 10, 384. [Google Scholar] [CrossRef] [PubMed]
  48. Minio, A.; Massonnet, M.; Figueroa-Balderas, R.; Vondras, A.M.; Blanco-Ulate, B.; Cantu, D. Iso-seq allows genome-independent transcriptome profiling of grape berry development. G3-Genes Genom. Genet. 2019, 9, 755–767. [Google Scholar] [CrossRef] [PubMed]
  49. Wang, B.; Yan, H.; Wang, S.; Chen, Y.; Shang, J. Camellia oleifera “Hengchong 89” transcriptomes and gene expression of photosynthesis and lipid pathway. Non-Wood For. Res. 2022, 40, 31–39. [Google Scholar] [CrossRef]
  50. Ha, Y.J.; Sa, K.J.; Lee, J.K. Identifying SSR markers associated with seed characteristics in perilla (Perilla frutescens L.). Physiol. Mol. Biol. Plants 2021, 27, 93–105. [Google Scholar] [CrossRef]
  51. Jia, X.; Deng, Y.; Sun, X.; Liang, L.; Su, J. De novo assembly of the transcriptome of Neottopteris nidus using Illumina paired-end sequencing and development of EST-SSR markers. Mol. Breed. 2016, 36, 94. [Google Scholar] [CrossRef]
  52. Ma, D.; Fang, J.; Ding, Q.; Wei, L.; Li, Y.; Zhang, L.; Zhang, X. A survey of transcriptome complexity using full-length isoform sequencing in the tea plant Camellia sinensis. Mol. Genet. Genom. 2022, 297, 1243–1255. [Google Scholar] [CrossRef] [PubMed]
  53. Zhu, R.; Ji, X.; Zhang, Z.; Li, H.; Zhang, H.; Song, W. Bioinformatics analysis of Capsicum C3H transcription factor family. Mol. Plant Breed. 2020, 18, 1784–1791. [Google Scholar] [CrossRef]
  54. Bao, Y.; Nie, T.; Wang, D.; Chen, Q. Anthocyanin regulatory networks in Solanum tuberosum L. leaves elucidated via integrated metabolomics, transcriptomics, and StAN1 overexpression. BMC Plant Biol. 2022, 22, 228. [Google Scholar] [CrossRef] [PubMed]
  55. Szakonyi, D.; Duque, P. Alternative splicing as a regulator of early plant development. Front. Plant Sci. 2018, 9, 1174. [Google Scholar] [CrossRef] [PubMed]
  56. Ma, J.; Xiang, Y.; Xiong, Y.; Lin, Z.; Xue, Y.; Mao, M.; Sun, L.; Zhou, Y.; Li, X.; Huang, Z. SMRT sequencing analysis reveals the full-length transcripts and alternative splicing patterns in Ananas comosus var. bracteatus. PeerJ 2019, 7, e7062. [Google Scholar] [CrossRef] [PubMed]
  57. Qiao, D.; Yang, C.; Chen, J.; Guo, Y.; Li, S. Comprehensive identification of the full-length transcripts and alternative splicing related to the secondary metabolism pathways in the tea plant (Camellia sinensis). Sci. Rep. 2019, 9, 2709. [Google Scholar] [CrossRef] [PubMed]
  58. Wu, W.; Cao, S.-F.; Shi, L.-Y.; Chen, W.; Yin, X.-R.; Yang, Z.-F. Abscisic acid biosynthesis, metabolism and signaling in ripening fruit. Front. Plant Sci. 2023, 14, 1279031. [Google Scholar] [CrossRef] [PubMed]
  59. Zhang, M.; Yuan, B.; Leng, P. The role of ABA in triggering ethylene biosynthesis and ripening of tomato fruit. J. Exp. Bot. 2009, 60, 1579–1588. [Google Scholar] [CrossRef]
  60. Shen, Y.; Duan, W.; Hu, J.; Cui, N.; Cao, Z.; Shu, Q. Relationships between peel anatomy structure of Camellia oleifera and resistance to Colletotrichum gloeosporioides. Plant Prot. 2015, 41, 98–102. [Google Scholar]
Disclaimer/Publisher’s Note: The statements, opinions, and data contained in all publications are solely those of the individual author(s) and contributor(s) and not of MDPI and/or the editor(s). MDPI and/or the editor(s) disclaim responsibility for any injury to people or property resulting from any ideas, methods, instructions, or products referred to in the content.
Figure 1. Length statistics of high-quality full-length transcripts.
Horticulturae 10 00914 g001
Figure 2. Classification of gene function based on the GO database.
Horticulturae 10 00914 g002
Figure 3. Classification of gene functions based on the KEGG database.
Horticulturae 10 00914 g003
Figure 4. Classification of gene functions based on the KOG database.
Horticulturae 10 00914 g004
Figure 5. Statistics on the proportion of the type of nucleotide.
Horticulturae 10 00914 g005
Figure 6. Venn diagram showing the lncRNAs analyzed using the four softwares, i.e., CPC, CNCI, Pafm, and PLEK.
Horticulturae 10 00914 g006
Figure 7. Statistics of the length of the CDS.
Horticulturae 10 00914 g007
Figure 8. Number of transcription factor families.
Horticulturae 10 00914 g008
Figure 9. Number of transcriptional regulator families.
Horticulturae 10 00914 g009
Figure 10. Phylogenetic relationship, conserved motif, and gene structure of the WRKY gene family in C. drupifera. (A) is the phylogenetic tree; (B) is Motif analysis; (C) is domain analysis; (B) is the top legend, and (C) is the bottom legend.
Horticulturae 10 00914 g010
Figure 11. Number of variable shears based on their types.
Horticulturae 10 00914 g011
Figure 12. Heatmap of the sample correlation analysis.
Horticulturae 10 00914 g012
Figure 13. Volcano plot of peel vs. seed kernels.
Horticulturae 10 00914 g013
Figure 14. Difference in KEGG: (a) between flower buds and seed kernels; (b) between leaves and seed kernels; (c) between the pericarp and seed kernels.
Horticulturae 10 00914 g014
Figure 15. Differences in GO: (a) between flower buds and seed kernels; (b) between leaf and seed kernels; (c) between the pericarp and seed kernels.
Horticulturae 10 00914 g015
Figure 16. Differential pathway association diagram: (a) between flower buds and seed kernels; (b) leaf and seed kernels; (c) the pericarp and seed kernels.
Horticulturae 10 00914 g016
Table 1. Full-length transcriptome sequencing data statistics.
CategoryNumberN50 Length (bp)Mean Length (bp)
Subreads48,000,90215871332
CCS733,00819041640
FLNC649,56716911431
Cluster72,25317351476
Corrected consensus71,61517271470
Table 2. Number of mononucleotide repeats.
Repeat NumberACGTTotal
5–152776216132739310,517
16–258212128124333547
26–35687154130
36–451510117
46–5550005
56–6510001
Total3686436214988214,218
Table 3. Basic information on the transcription factor family of C. drupifera.
Gene NameGene IDNumber of Amino Acids (aa)Molecular Weight (Da)pIAliphatic IndexGRAVY
CdWRKY1transcript/12715-0F67677,558.859.1479.56−0.267
CdWRKY2transcript/12715-1F69680,332.999.7075.33−0.444
CdWRKY3transcript/13333-0F69878,409.608.8253.34−0.816
CdWRKY4transcript/32049-0F48553,980.178.5951.05−0.979
CdWRKY5transcript/10090-1F73381,630.758.6156.23−0.599
CdWRKY6transcript/13640-0F68376,683.258.7466.19−0.629
CdWRKY7transcript/12770-1F69678,325.128.8267.20−0.655
CdWRKY8transcript/22628-2F56863,432.056.7664.21−0.644
CdWRKY9transcript/35057-2F45650,736.297.7159.43−0.786
CdWRKY10transcript/16490-0F64471,338.507.8274.24−0.400
CdWRKY11transcript/47559-1F35839,265.849.3181.70−0.284
CdWRKY12transcript/40146-1F42346,659.149.0382.96−0.253
CdWRKY13transcript/18070-2F61768,544.645.5367.94−0.643
CdWRKY14transcript/19438-0F61167,895.135.7067.18−0.622
CdWRKY15transcript/33657-1F46852,261.539.0269.15−0.518
CdWRKY16transcript/36057-2F44150,114.739.0170.48−0.441
CdWRKY17transcript/39571-1F40746,644.365.5471.13−0.514
CdWRKY18transcript/21604-1F59567,947.459.6274.07−0.346
CdWRKY19transcript/38354-2F43750,029.919.8870.50−0.676
CdWRKY20transcript/12244-1F71480,637.608.6156.27−0.680
CdWRKY21transcript/31845-2F48053,644.379.5682.83−0.360
CdWRKY22transcript/15476-1F65574,111.369.2573.98−0.516
CdWRKY23transcript/11987-0F70979,137.666.2776.8−0.562
CdWRKY24transcript/14844-1F64671,250.546.2673.16−0.646
CdWRKY25transcript/9489-0F77185,095.237.4371.91−0.522
CdWRKY26transcript/22886-1F57062,944.157.7068.82−0.617
CdWRKY27transcript/37754-2F40745,222.698.2576.54−0.551
CdWRKY28transcript/6076-1F86795,656.726.8461.75−0.647
CdWRKY29transcript/7374-1F82590,366.896.8460.88−0.629
CdWRKY30transcript/41541-0F39844,614.595.8363.47−0.615
CdWRKY31transcript/14886-0F66673,648.137.0159.64−0.713
CdWRKY32transcript/13119-0F67875,034.938.4762.04−0.695
CdWRKY33transcript/18293-2F59665,716.908.8054.90−0.842
CdWRKY34transcript/53940-0F30133,767.118.7475.45−0.598
CdWRKY35transcript/39534-1F41546,453.207.9955.64−0.560
CdWRKY36transcript/59382-2F25528,797.706.9858.82−0.403
CdWRKY37transcript/17933-1F61768,401.176.0861.94−0.701
CdWRKY38transcript/17933-2F61169,898.0010.45103.32−0.118
CdWRKY39transcript/52505-0F31335,571.789.1775.91−0.422
CdWRKY40transcript/27301-2F51857,145.698.6674.92−0.423
CdWRKY41transcript/43765-2F37541,119.739.6669.7−0.503
CdWRKY42transcript/42177-0F37542,509.989.4687.87−0.107
CdWRKY43transcript/16548-1F63571,526.479.1675.06−0.601
CdWRKY44transcript/13308-2F69476,182.398.3469.48−0.596
CdWRKY45transcript/38850-1F42646,782.057.4355.19−0.821
CdWRKY46transcript/38829-1F42146,790.269.7870.17−0.570
Table 4. Summary of the RNA sequence data.
FASTNAMEBF_Total Bases (G)BF_Q20 Bases (%)BF_Q30 Bases (%)BF_GC Content (%)AF_total Bases (G)AF_Q20 Bases (%)AF_Q30 Bases (%)AF_GC Content (%)
A5.6197.6494.0045.265.4698.2594.7645.25
B6.9096.8392.8552.546.5398.1194.3851.90
C6.5597.6693.9345.076.4098.2094.6045.08
D8.1997.1393.1246.287.8698.0494.2546.03
E17.0296.6292.246.676.6797.7893.6446.34
E29.0397.3997.3946.168.6898.2694.8445.89
F18.9897.2393.3646.628.6998.0494.3646.57
F26.2296.7492.2047.086.0097.5693.2046.99
Disclaimer/Publisher’s Note: The statements, opinions and data contained in all publications are solely those of the individual author(s) and contributor(s) and not of MDPI and/or the editor(s). MDPI and/or the editor(s) disclaim responsibility for any injury to people or property resulting from any ideas, methods, instructions or products referred to in the content.