Article

Phenotypic and Biochemical Trait Improvement in Husk Tomatoes (Physalis sp.) through EMS-Induced Mutagenesis

by
Md Ashraful Islam
1,
Fabeeha Tarannum
1,
Afsana Hossain Dina
1,
Minhaz Ahmed
2,
Md Ahsanul Haque
3,
Sezai Ercişli
4,
Md Golam Rasul
1,
Duran Simsek
5 and
Mehfuz Hasan
1,*
1
Department of Genetics and Plant Breeding, Bangabandhu Sheikh Mujibur Rahman Agricultural University, Gazipur 1706, Bangladesh
2
Department of Agroforestry and Environment, Bangabandhu Sheikh Mujibur Rahman Agricultural University, Gazipur 1706, Bangladesh
3
Department of Entomology, Bangabandhu Sheikh Mujibur Rahman Agricultural University, Gazipur 1706, Bangladesh
4
Department of Horticulture, Faculty of Agriculture, Ataturk University, 25240 Erzurum, Turkey
5
Areo Seed Company, 07100 Antalya, Turkey
*
Author to whom correspondence should be addressed.
Horticulturae 2024, 10(9), 913; https://doi.org/10.3390/horticulturae10090913
Submission received: 30 July 2024 / Revised: 24 August 2024 / Accepted: 26 August 2024 / Published: 27 August 2024

Abstract

:
Husk tomatoes are used in salsa and traditional medicine to alleviate illnesses. Market demand requires husk tomato varieties with improved agronomic and physicochemical health benefits. Mutagen application alters plant genomes, creating new traits and genetic diversity. The efficacy of EMS (ethyl methanesulfonate) was examined for morphology, bioactive compounds, and phytochemical improvement. Three husk tomato genotypes representing Physalis philadelphica and Physalis ixocarpa underwent two hours of 1.4% EMS. In addition to yield and yield-related properties, total phenol, antioxidant activity, chlorophyll a and b levels in leaves and fruits, and phytochemical concentrations of Na, Mg, Ca, Mn, Fe, Cu, and K in fruits were measured. Genotype-dependent morphological changes were found. The mutants C1T6 (85 cm) and C1T7 (87.60 cm) were shorter than Control C1 (102 cm). The highest yield was 5.80 g for C1T5; Control C1 produced 3.08. The mutant C2T6 produced the most (5.99 g) compared to its control (2.85 g). Mutants had higher total phenol, antioxidant activity, and leaf/fruit chlorophyll. C1T2 had the highest antioxidant activity (1.19 ng/µL). C2T1 outperformed Control C2 at 1.54 ng/µL phenolic content. C3T2 had the highest Ca content (1822 µg/g), while Control C3 had 861.20 µg/g. Mutations altered phytochemical composition, which can be used to generate nutritionally superior husk tomato varieties. Additionally, scientists will be able to study mutants with advantageous morphological and biochemical traits, enabling extensive research. Furthermore, the mutants will serve as a genetic repository for the progression of breeding procedures.

1. Introduction

The Solanaceae family includes numerous vegetable crop species farmed primarily for food production, including a small number of Physalis species. Husk tomato of the Physalis species is a vegetable crop widely used in the food sector and has been the focus of research at a center of origin in Mexico and some other countries. Besides India, Australia, and South Africa, the United States also cultivates these plants [1]. Despite the widespread distribution of husk tomatoes, information is scarce regarding their cultivation. Mexico produced 824,977 tons of husk tomatoes in 2021 [2]. The fruit of husk tomatoes can exhibit various colors, such as green, yellow-green, or purple. It serves a purpose in the making of salads, soups, stews, and sauces. It is also used in traditional medicine due to its antioxidant activities [3,4].
To meet market demands, it is necessary to produce husk tomato cultivars with enhanced agronomic and physicochemical characteristics of the fruit. Developmental characteristics of husk tomatoes vary considerably, encompassing inflorescence structures, resistance to diseases, and bioactive compounds. As a result, geneticists and breeders have researched these traits to determine their genetic parameters [5]. They have researched this to facilitate selection processes that enhance genetic gains. Breeders have been focusing on improving morphological and biochemical characteristics. According to Peña-Lomelí et al. [6], the most significant genetic improvements in improving a husk tomato population through selection are anticipated in terms of yield per plant and number of fruits per plant. However, it is crucial to maintain a substantial fruit size. Ramírez-Cariño et al. [2] utilized several fertilizers to evaluate the characteristics of husk tomatoes. No substantial alterations were detected in the levels of potassium, phosphorus, magnesium, and manganese in the fruits. This finding implies that the improvement of specific characteristics in husk tomatoes can be achieved through selective breeding techniques, as relying just on agricultural management approaches is insufficient to guarantee high-quality yields. Shamsolshoara et al. [7] identified a correlation between ascorbic acid, phenolic compounds, flavonoids, and the antioxidant activity of husk tomato fruits. This finding has potential applications in crop improvement programs. When confronted with the need to address many traits in plant breeding, it is equally critical to assess the correlations between different important characteristics. The ease of adoption plays a crucial role in producing novel cultivars that agricultural systems adopt more readily.
There are several different methods that scientists are employing to develop plants that possess specific agronomic and biochemical characteristics, which include selection, hybridization, mutation, gene editing, high-throughput phenotyping, and marker-assisted selection [8]. Scientists have applied the process of mutagenesis to several types of crops to enhance the existing genetic variation and instill desirable characteristics. A chemical mutagen known as EMS (ethyl methanesulfonate) is frequently utilized to induce point mutations in the genomes of different plant species [9,10,11]. This process enables the production of new features and promotes genetic diversity. It is notable because it can cause plants to undergo significant genetic changes while simultaneously producing a small number of chromosomal abnormalities [10]. Numerous data indicate that the effects of EMS as a mutagen on the morphology, biochemistry, physiology, and anatomy of plants change depending on different factors, such as mutagen dose, treatment duration, temperature, etc. [12,13,14].
Researchers have dedicated significant effort to creating improved mutant variants of various agricultural species. This includes virus-resistant tomato [15] and pest-resistant eggplant and cabbage [10,16]. Induced mutations serve several important functions, one of which is enhancing agricultural plants’ nutritional content. Specific mutant genes can significantly enhance the nutritional content of commercial crop varieties [9,17].
Studies in different plant species have facilitated the generation of antioxidants utilized in dietary supplements, beauty products, and other sectors [18,19]. Such goods, produced from plants with established antioxidant qualities, have transformed the world of commerce. Nevertheless, there is still a significant amount of knowledge to be gained regarding the mineral composition and antioxidant characteristics of husk tomato mutants that have been generated using specific chemical mutagens. The potential implications of this information gap are very exciting, particularly if our goal is to uncover additional natural antioxidants that can boost the nutritional value of foods.
This study aimed to generate husk tomato mutants with improved antioxidant and mineral levels and desirable morphological characteristics.

2. Materials and Methods

2.1. Plant Material and Mutagenesis

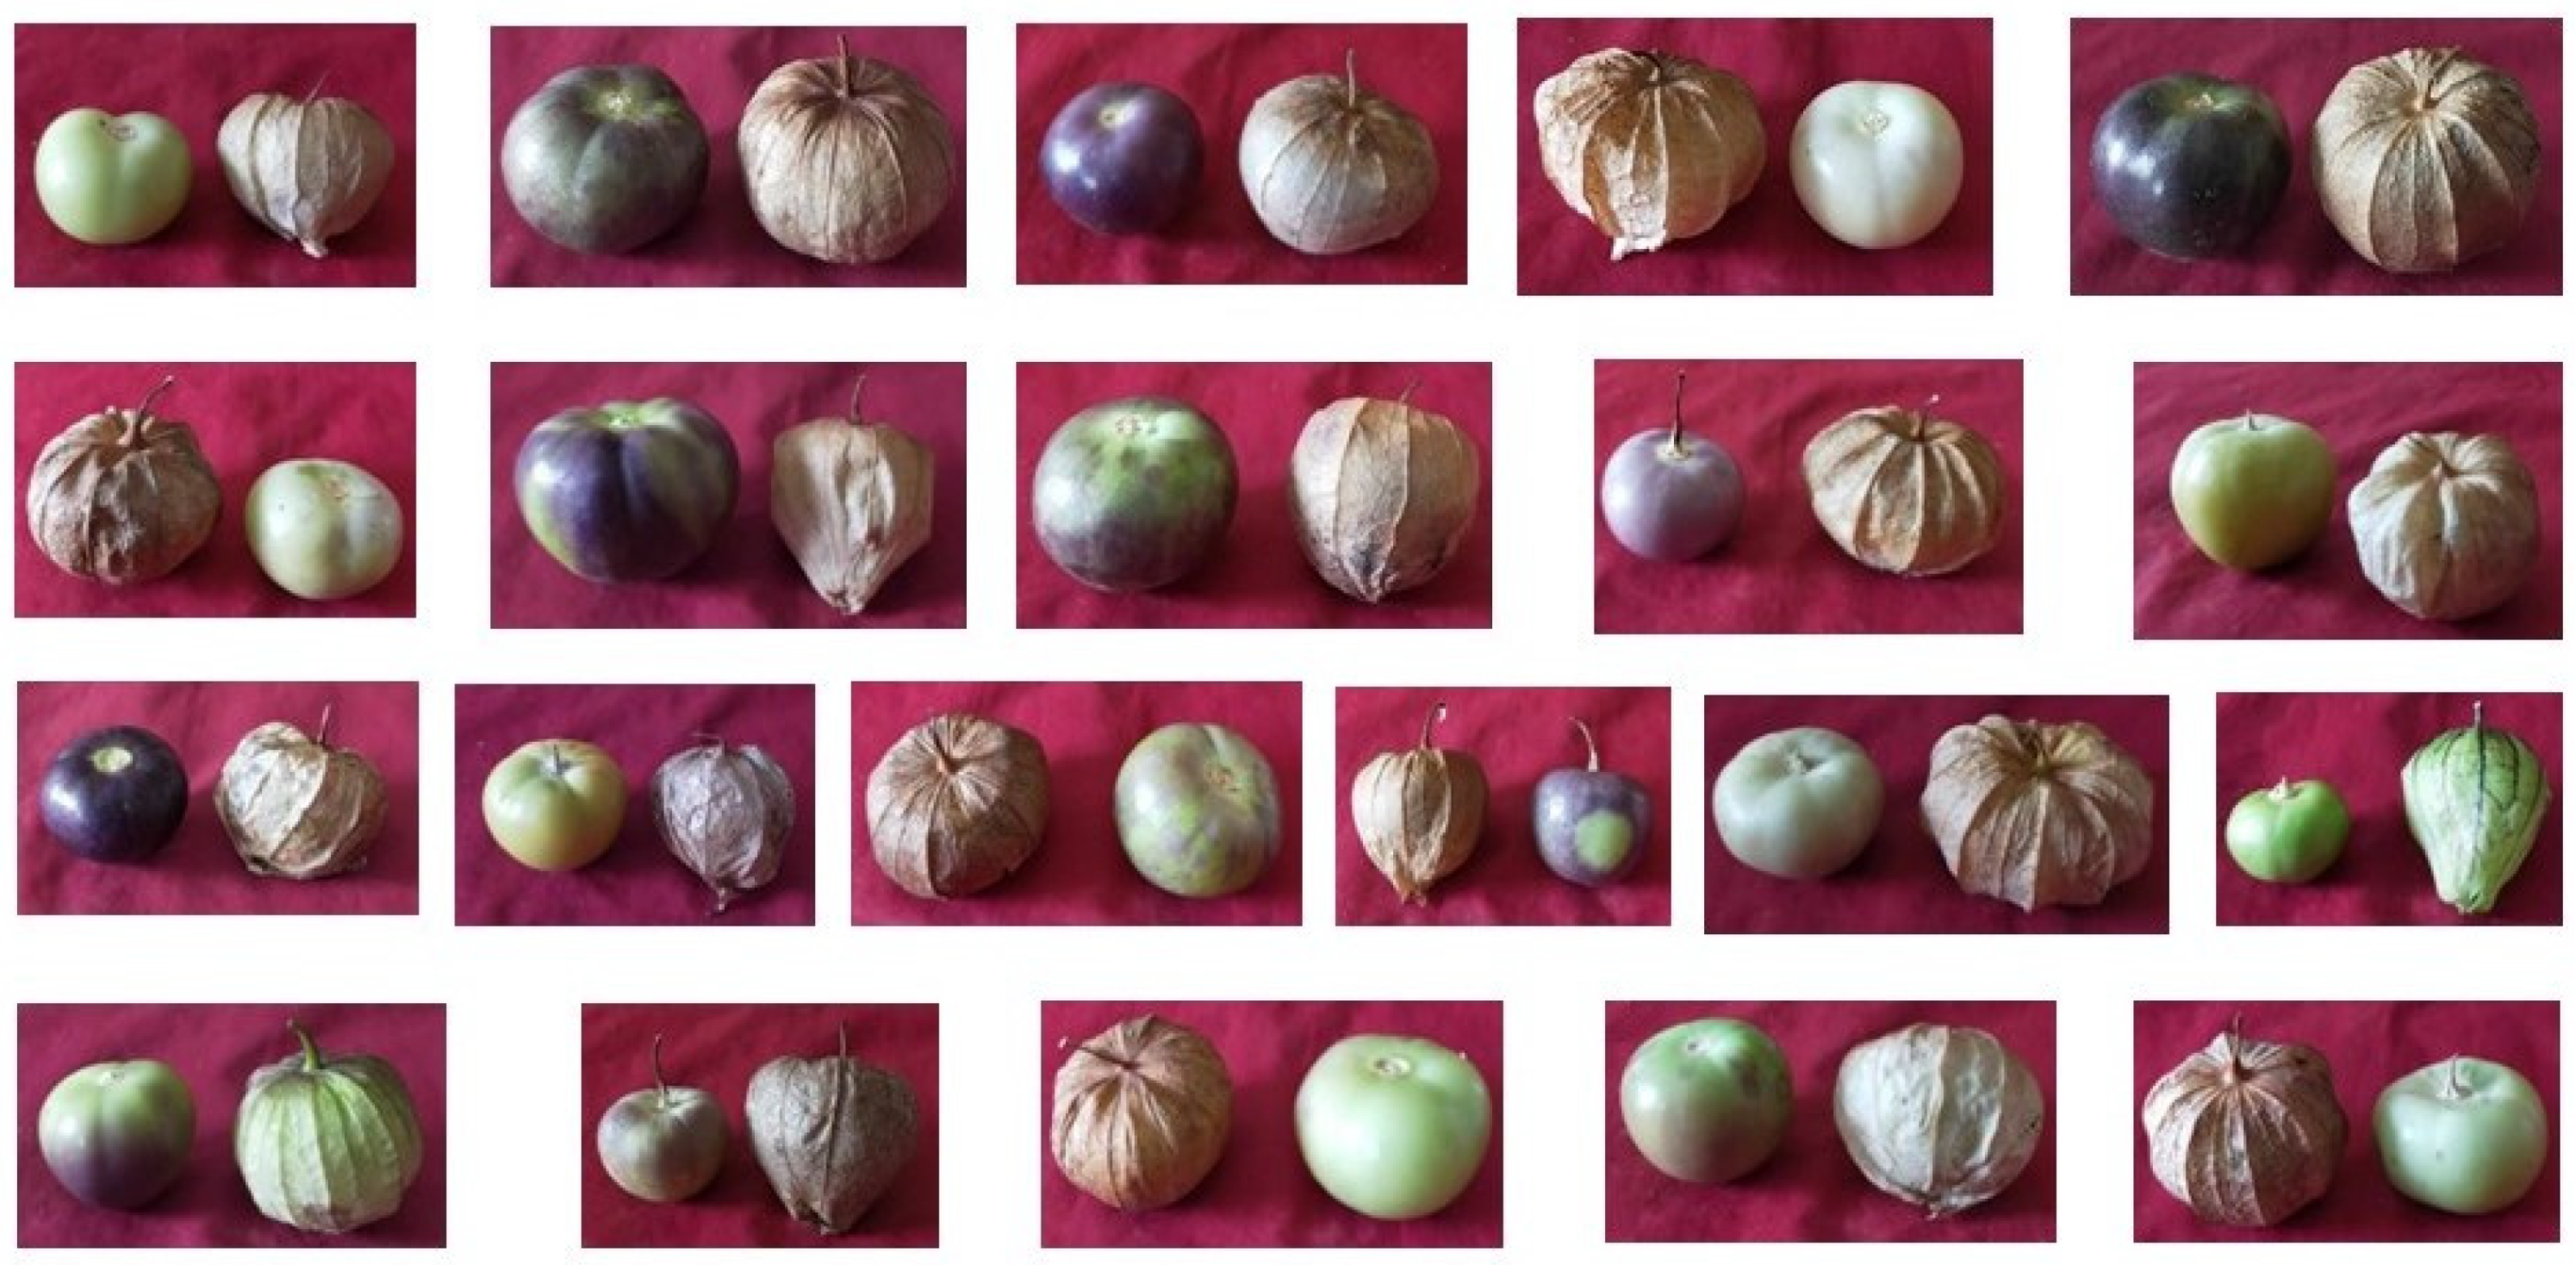
The experiment incorporated germplasm from three distinct genotypes of husk tomatoes. The germplasm was obtained from the Department of Genetics and Plant Breeding at Bangabandhu Sheikh Mujibur Rahman Agricultural University in Bangladesh. The genotypes’ colors were distinct (Figure 1). The experiment initiated the mutagenesis treatment using two different types of husk tomatoes, Physalis philadelphica and Physalis ixocarpa. Physalis philadelphica exhibits a green coloration, while Physalis ixocarpa displays a purple hue. Furthermore, the experiment introduced a hybrid color genotype combining the green and purple types. The C1 genotype was green, C2 was purple, and the C3 was purplish green. A total of seven mutants per genotype were randomly selected to assess their morphological and biochemical characteristics (Table 1). A sample of ten fruits per plant was selected at random to conduct morphological and biochemical analyses.
A five-minute washing procedure with soap and running water was performed on the seeds. While washing, any seeds that floated to the surface were discarded. The seeds were immersed in a solution with a concentration of 1.4% EMS (Sigma-Aldrich Chemie Ltd., Steinheim, Germany) for two hours. The experiment was conducted at a temperature of 25 °C with normal lighting conditions. After that, they were rinsed with distilled water. To help the seeds absorb any extra water, the seeds were spread out on a Petri dish covered with sterile filter paper for 30 min. Without delay, the seeds that had been treated with mutagens were transferred to small plastic pots and covered with soil. Two parts soil, one part leaf mulch, and one part cow dung made up the combination that went into the plastic pots. The soil was sterilized. After germination, the 21-day-old seedlings were sent to the field to study the impact of EMS treatment on their physical and chemical characteristics.

2.2. Morphological Attributes

Morphological data were collected for the following parameters: plant height, fruit diameter, fruit length, fruit weight, number of total branches, fruits per branch, total fruit, and yield. The plant height was measured 60 days after transplanting. The fruits were harvested as they reached their mature stage. Unripe husk tomato fruits are dark green, while they transform into a greenish or light greenish-yellow color when they mature. The husk of the fruit typically ruptures as it grows and reaches maturity. The fruit of both the green and purple husk tomatoes is considered ripe for harvesting when it entirely occupies the husk and can be easily detached from the plant when plucked. Identifiable and fully developed fruits were collected from the plants.

2.3. Biochemical Analysis

The fruits’ total phenol content and antioxidant activity, the leaf and fruit chlorophyll content, and Na, Mg, Ca, Mn, Fe, Cu, and K content of the fruits were measured as described by Islam et al. [10].

2.3.1. Measurement of Total Phenol

Various quantities of gallic acid (Sigma-Aldrich Chemie Ltd., Steinheim, Germany) were prepared, ranging from 0.0150 mg/mL to 0.175 mg/mL. After diluting, vials held either gallic acid standards or extracted samples. Every tube was filled with Folin–Ciocalteu solution (Sigma-Aldrich Chemie Ltd., Steinheim, Germany) and then stirred well. Following a quick stop, a nine percent Na2CO3 solution (Sigma-Aldrich Chemie Ltd., Steinheim, Germany) was added, and the mixture was brought to the ambient level. The measurement of absorbance was conducted at a wavelength of 765 nm after 2 h. The concentration of total phenolic compounds was measured by evaluating the optical density of the extracts with that of gallic acid reference solutions. Every single study underwent three assessments.

2.3.2. Measurement of Antioxidant Activity

The antioxidant capacity was measured using CuCl2 solution (Sigma-Aldrich Chemie Ltd., Steinheim, Germany), neocuproine alcoholic solution (Sigma-Aldrich Chemie Ltd., Steinheim, Germany), and NH4Ac buffer (Sigma-Aldrich Chemie Ltd., Steinheim, Germany). To make a total amount of 4.1 mL, 0.1 mL of extract from the husk tomato fruit sample was mixed with 1 mL of CuCl2 solution. A solution of CuCl2 was made by dissolving 0.2131 g of CuCl2·2H2O in distilled water and then diluting it to a volume of 125 mL. After thorough mixing, 1 mL of neocuproine alcoholic solution and NH4Ac buffer solution were combined. The remaining 1 mL was distilled water. A solution of ammonium acetate buffer was made by mixing 9.635 g of NH4Ac in distilled water and then diluting it to a volume of 125 mL. A fresh solution of neocuproine (Nc) was made by dissolving 0.0195 g of Nc in absolute ethanol and then mixing it to a volume of 12.5 mL with ethanol (Sigma-Aldrich Chemie Ltd., Steinheim, Germany). The absorbance at 450 nm was measured after thirty minutes, and the results were measured in comparison to the blank reagent.

2.3.3. Determination of Chlorophyll a and b

A fresh sample weighing 0.2 g was placed in a test tube, and the sample was combined with 10 mL of 80% acetone (Sigma-Aldrich Chemie Ltd., Steinheim, Germany). To recover chlorophyll from the acetone solution, the mixture was filtered using Whatman filter paper of the first grade. The homogenate was washed off with 5 mL of acetone two or three times. As a result of adding 80% acetone, the total volume was brought up to 25 mL. The quantity of chlorophylls a and b was determined by determining the absorbance at 663 and 645 nm during the measurement process.

2.3.4. Mineral Determination

The levels of Na, Mg, Ca, Mn, Fe, Cu, and K were quantified. For the husk tomato samples, 0.5 g of desiccated husk tomato controls and mutants were carefully poured into a processing unit. Then, 5 mL of a solution containing 65% HNO3 (Sigma-Aldrich Chemie Ltd., Steinheim, Germany) was introduced and allowed to sit instantaneously. Subsequently, the substance was subjected to heating at a temperature of 60 °C until the emission of dark fume ceased. Subsequently, a two mL aliquot of HClO4 (Sigma-Aldrich Chemie Ltd., Steinheim, Germany) was introduced to the samples at a temperature of 150 °C to reduce their size. The samples underwent filtration and subsequent dilution in a 50 mL vial to achieve the intended volume. The Atomic Absorption Spectrophotometer was utilized to quantify the concentration of minerals in each sample. AAS, Perkin Elmer, PinAAcleTM 900H, Waltham, MA, USA was used to measure the minerals.

2.4. Data Collection and Analysis

The field performance of the plants was evaluated for the mutants of husk tomato. Due to mutation, each plant in M1 generation was different. Each mutant plant serves as a representative of its corresponding Control. Thus, the yield and other parameters were calculated per plant.
A graphical depiction of the tested attributes, biplot, and ridgeline for morphological and biochemical attributes was generated using the computer language R.
A Principal Component Analysis (PCA) was carried out. The data set was initially standardized to ensure that each variable contributed equally to the analysis. The PCA was performed on standardized data, and the results were displayed as a biplot. The biplot was created using R’s biplot function, which shows both the scores and loadings of the principal components. The x-axis indicates the first principal component (PC1), while the y-axis represents the second principal component (PC2).
The ridgeline was generated using measurements from the Control and Treatment datasets. Ridgeline plots were created to show the distribution of the value variable in the control and treatment groups. The ggridges and ggplot2 packages in R were utilized for this purpose. The geom_density_ridges function was used to generate the plots, with value as the numeric variable and treatment as the categorical variable. The plots were customized to improve readability and visual appeal, with changes to transparency, scale, and color schemes.
A boxplot using morphological data was created in R by arranging all the morphological trait data sequentially for all the mutants. The boxplot for the control group displayed the mean data. A similar procedure was carried out for the biochemical traits.
Tukey’s significant test was also calculated by R. The data are represented visually using bar graphs, where the letters indicate the significant differences.

3. Results

Three unique husk tomato genotypes were treated with EMS to explore its effect on morphological and biochemical traits that can be used in plant breeding programs.

3.1. Morphological Changes

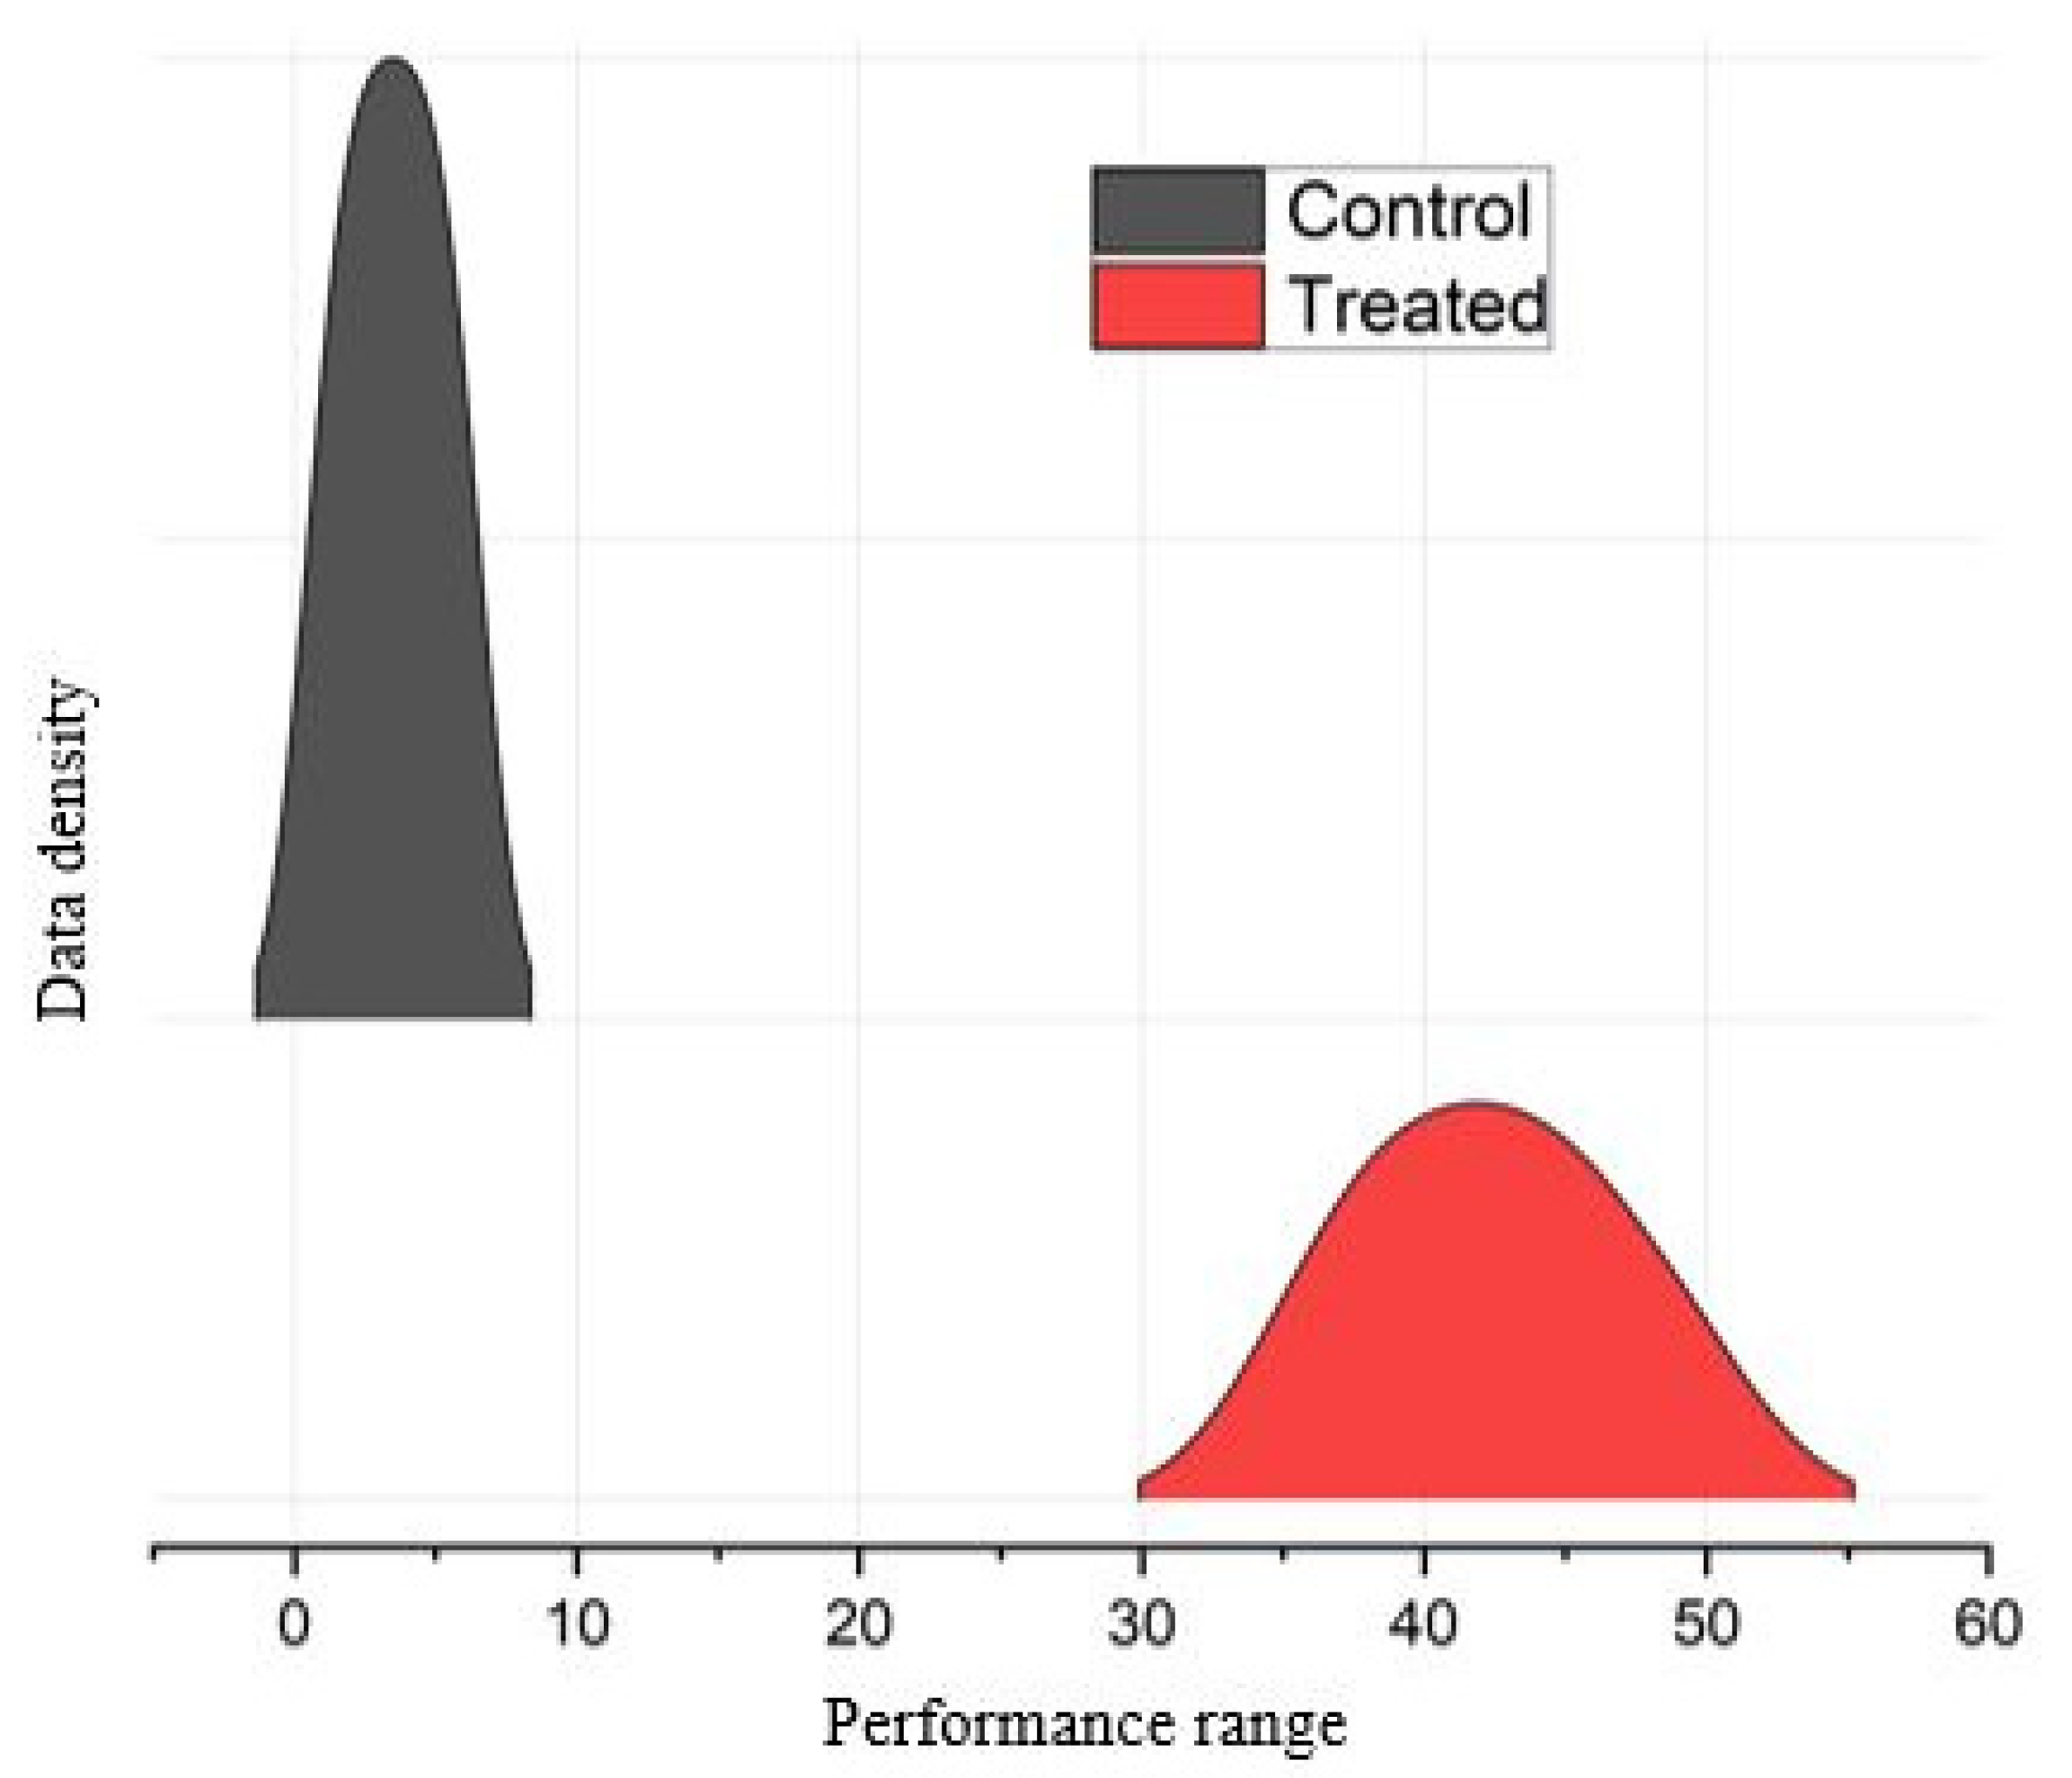
The genotypic trends depicted in Figure 2 are confined to interspersed density plots that serve as a valuable tool for visually representing developments in the distribution pattern of morphological features across duration. Figure 2 illustrates the general patterns observed in the Control and EMS-treated mutants from the combined data of all the morphological traits examined. The Control genotypes, which were not subjected to EMS treatment, had a normal bell-shaped distribution. By contrast, the mutants exhibited alterations in the curve. Their dissemination range exceeded that of the Control.
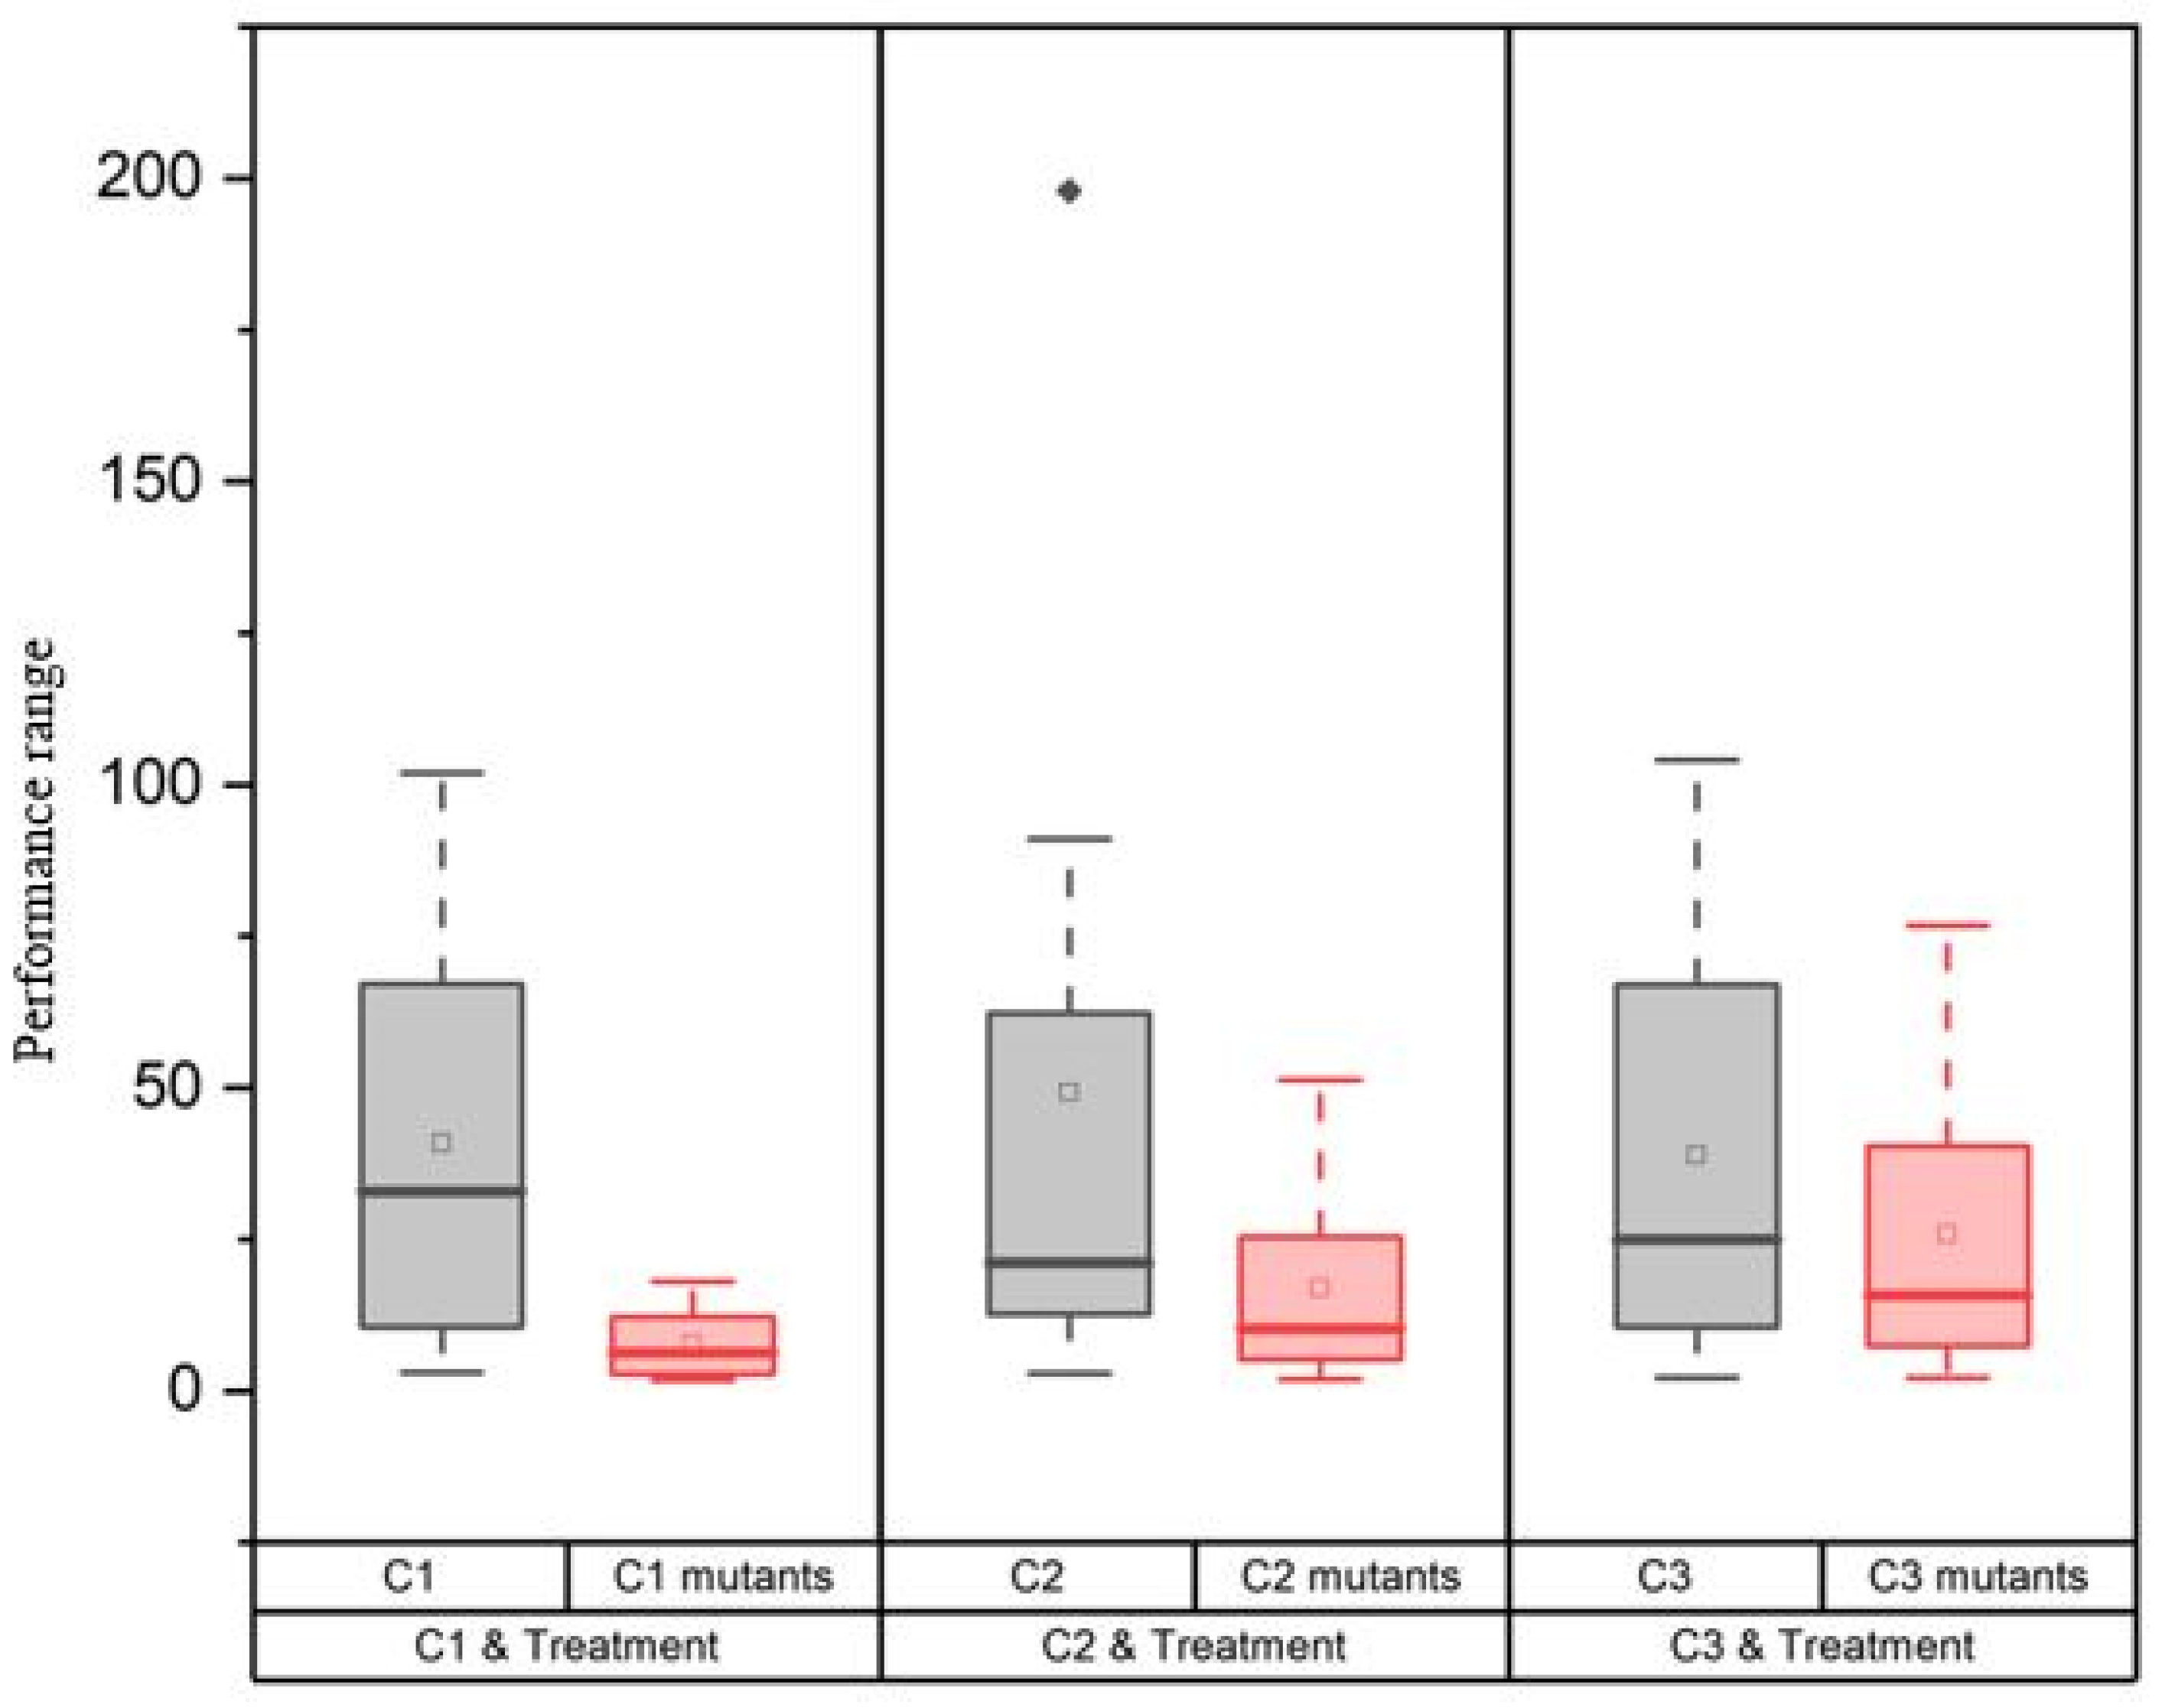
Boxplots were generated to illustrate the dispersion and centers of the plots’ data set (Figure 3). In all cases, the Control exhibited an increased data range. The data sets of the Control exhibit a higher degree of uniformity. The Control yielded the highest values. The mutants exhibited greater variability in their data sets. Both the Control and mutants exhibited a right-skewed distribution of data.
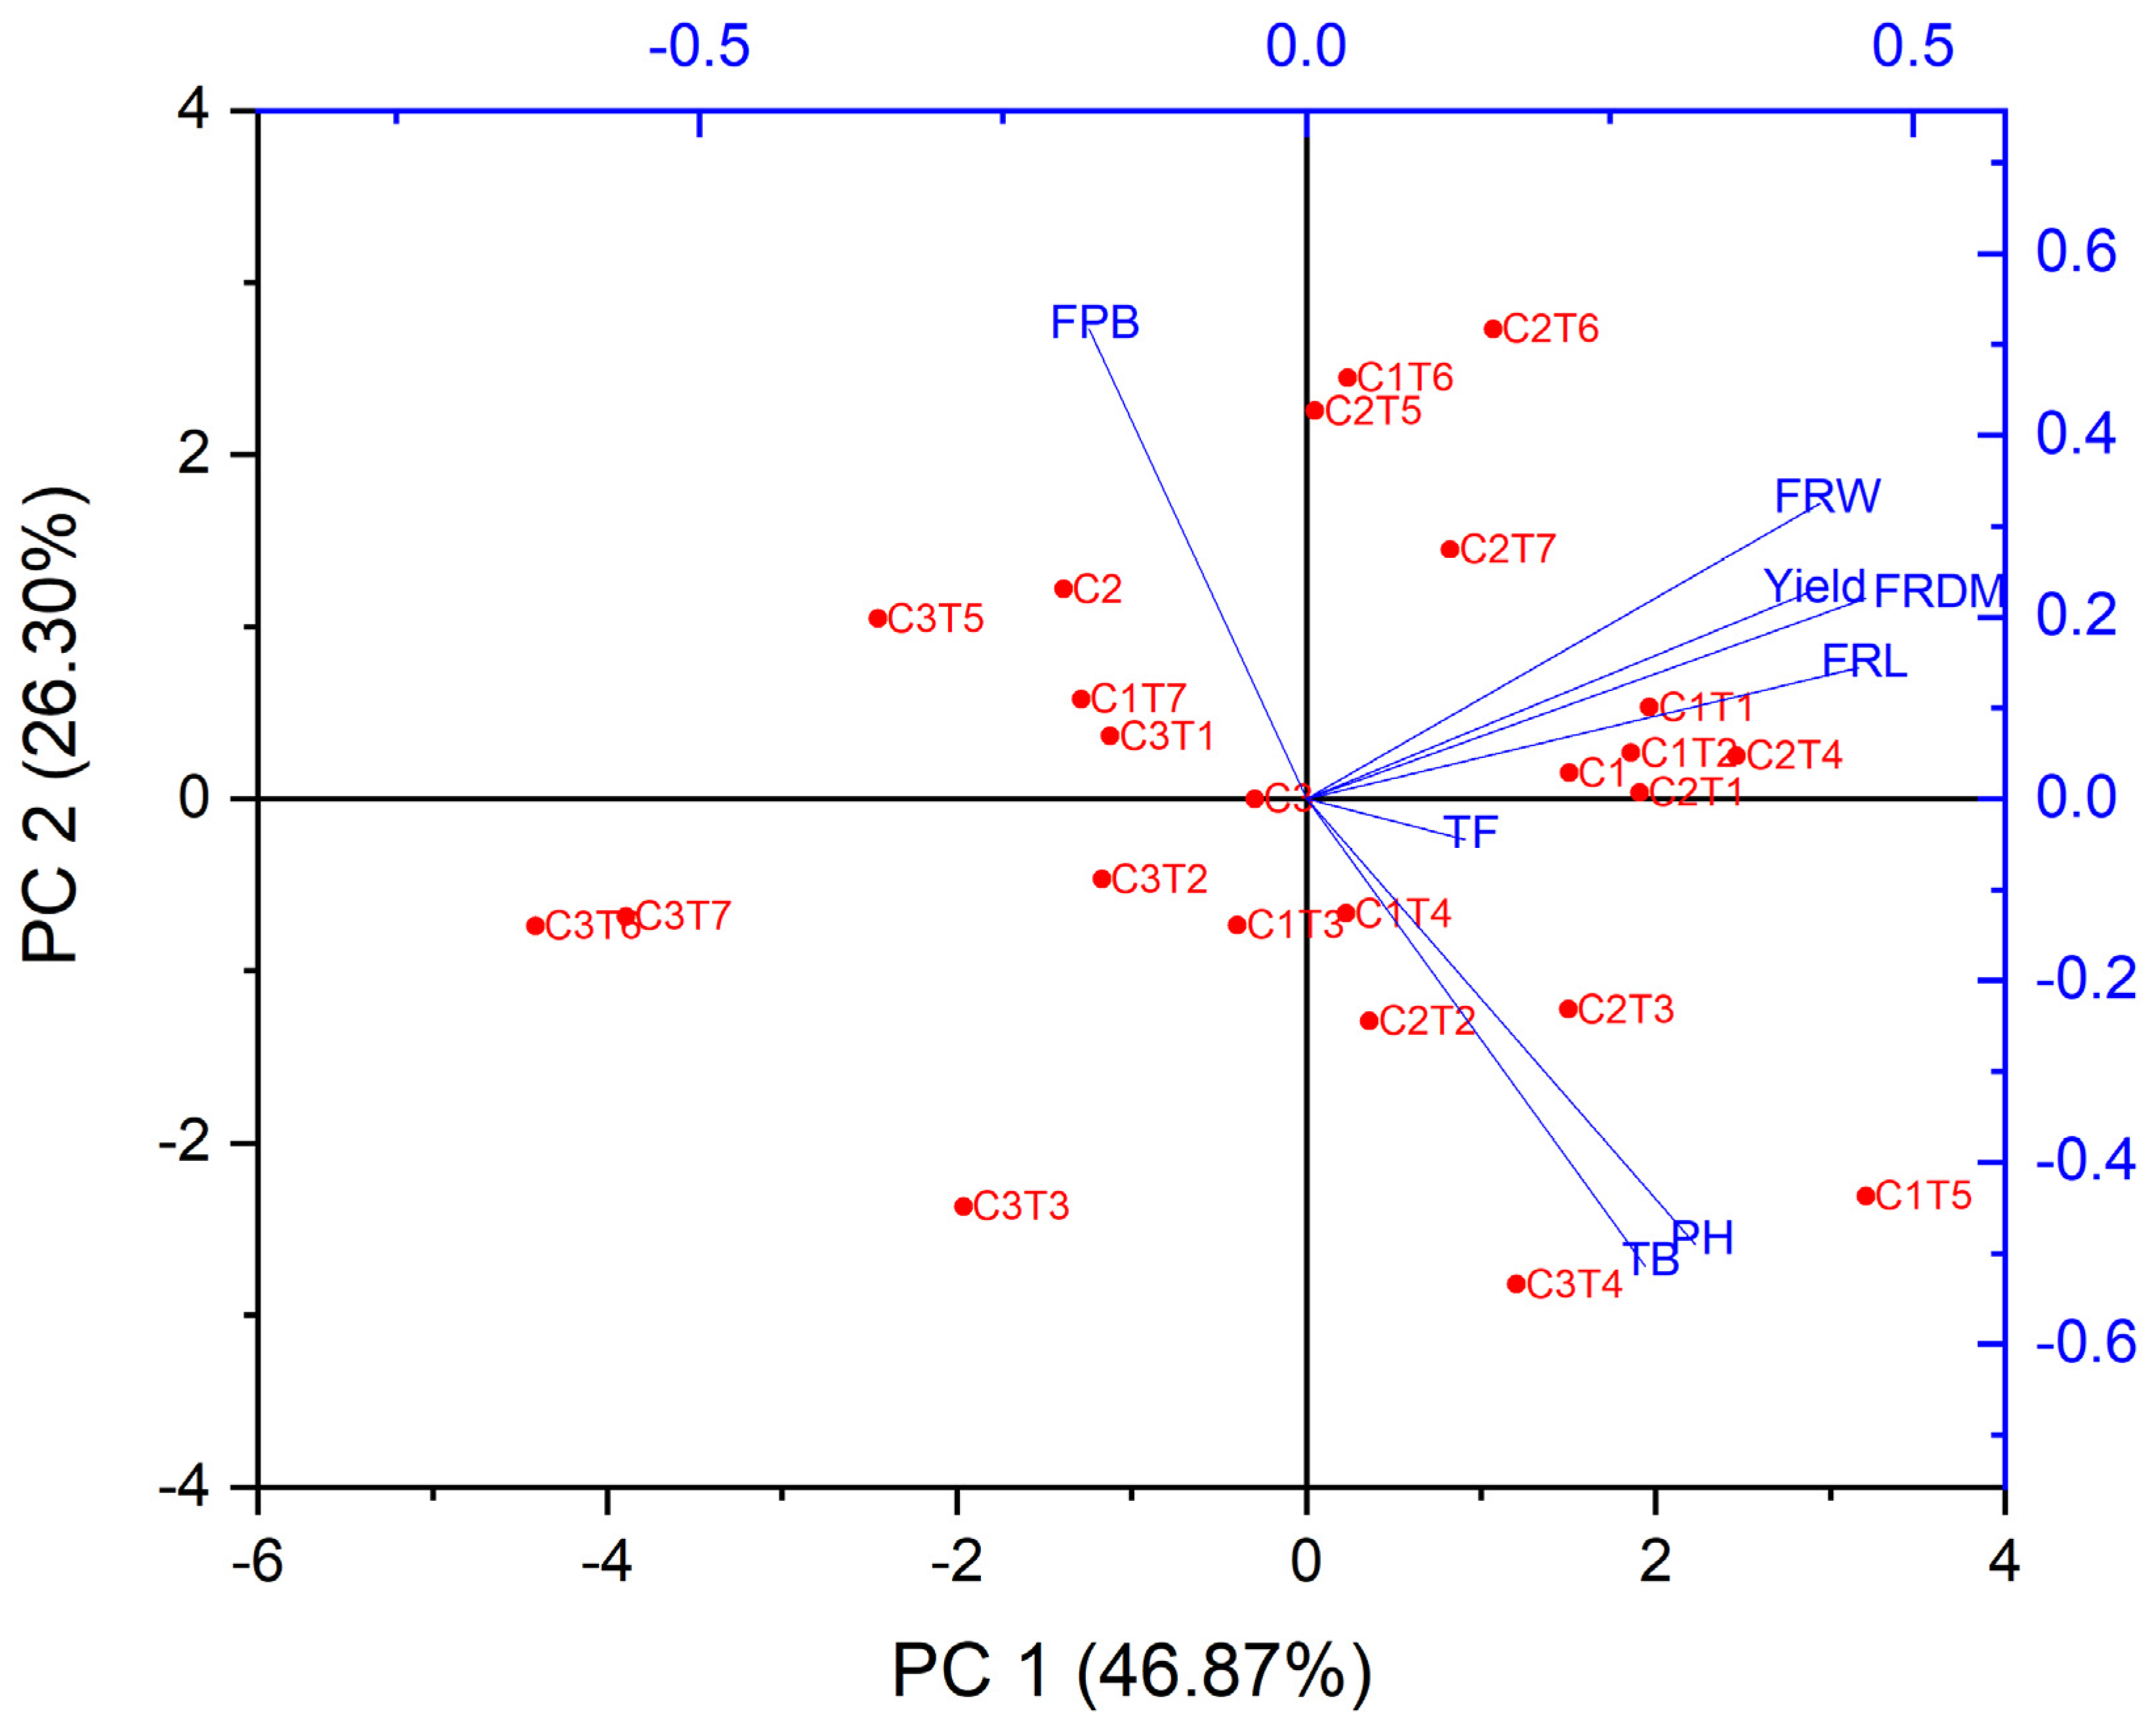
The performance of EMS treatment was assessed by measuring eight morphological traits: plant height, fruit diameter, fruit length, fruit weight, number of total branches, fruits per branch, total fruit, and yield. A GT biplot analysis was employed to visually represent the correlation between the morphological features and EMS treatment (Figure 4). A sharp angle between the two attributes signifies a favorable correlation. By contrast, an angle wider than 90 degrees shows a contrasting interaction [20]. When exploring the relationship between plant attributes, sharp angles between the number of fruits per branch and Control 2, Control 3, C1T7, and C3T1, as well as between fruit weight and C2T7, were found. C1T1 was correlated with fruit weight, diameter, length, and yield. C1, C1T2, C2T4, and C2T1 were similarly correlated with fruit length. The variables C3, C1T4, C2T2, C2T3, and C3T4 displayed a strong correlation with both plant height and the total number of branches.
A biplot visually displays the link across various attributes. There was a strong correlation between the weight, diameter, length, and yield of the fruit. There was a positive correlation between the height of the plant and the total number of branches. Conversely, there was a negative correlation between the number of fruits per branch and both plant height and the total number of branches.
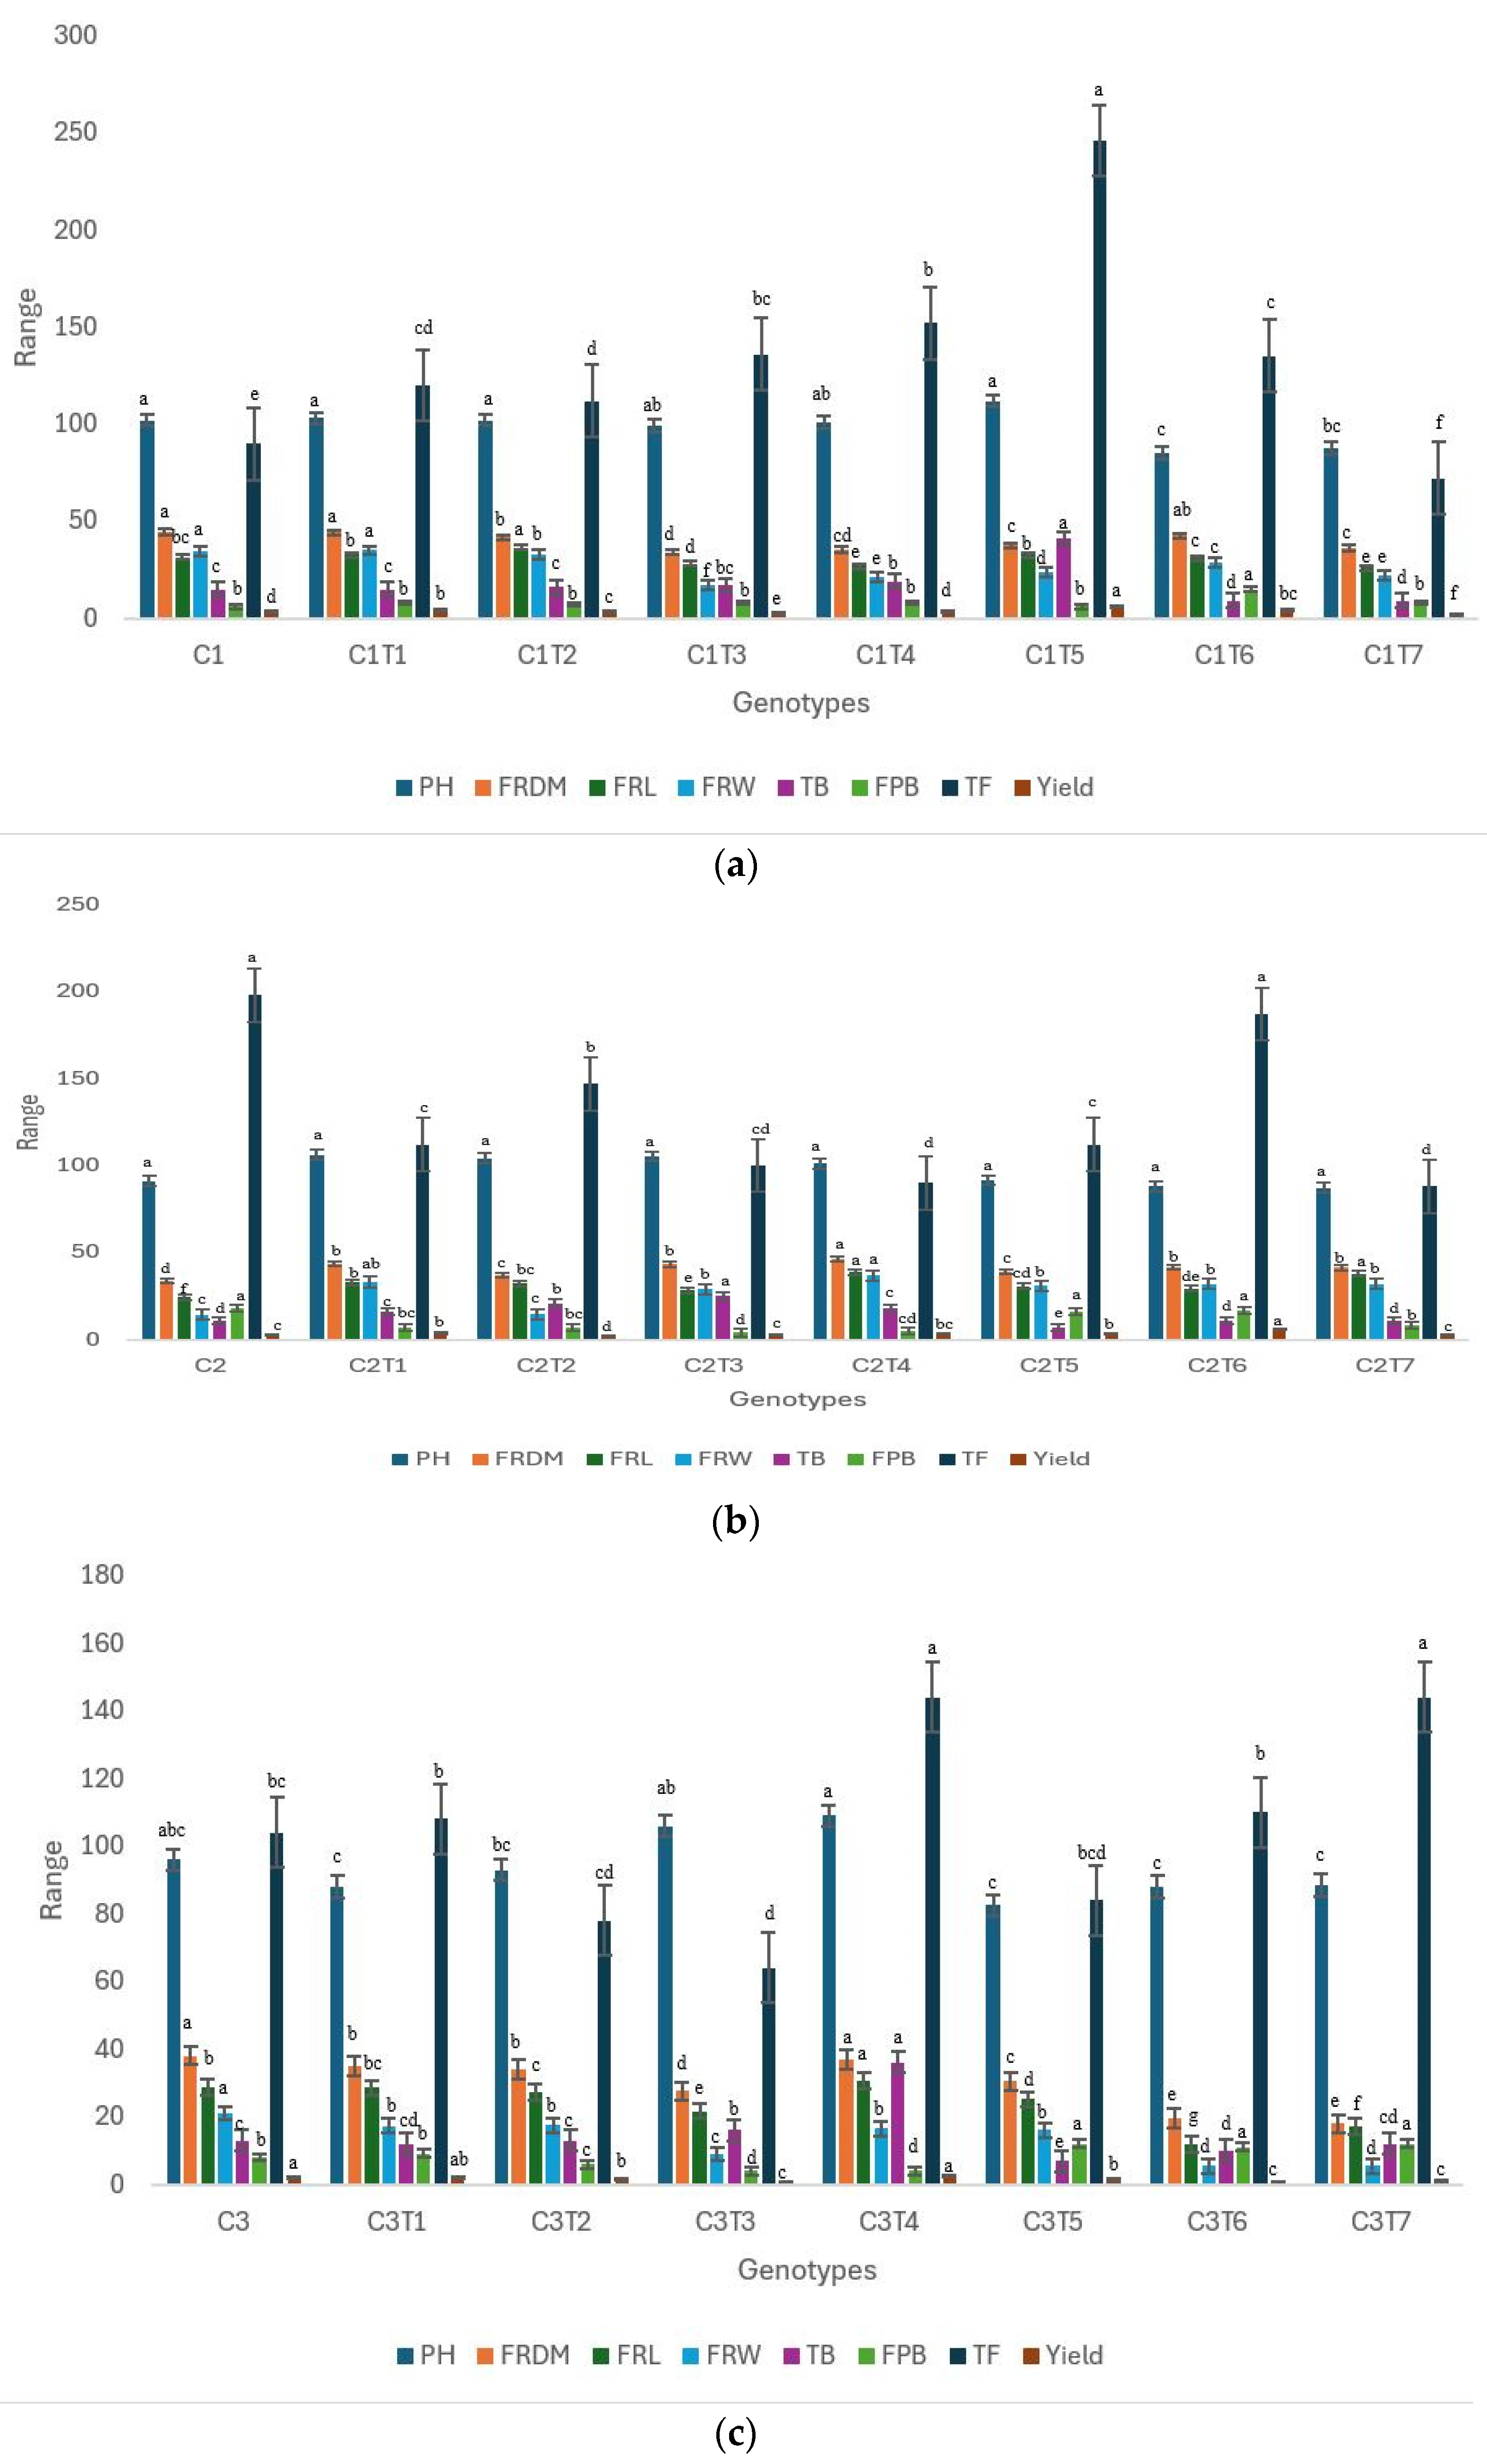
The performance of the husk tomato mutants was evaluated in comparison to their respective controls (Figure 5a–c and Table S1). The mutants exhibited substantial alterations in all the examined morphological characteristics. Distinct morphological variations were observed (Figure 6). Mutants C1T6 and C1T7 exhibited notable changes in comparison to their Control, C1 (Figure 5a, Table S1). Significant changes were observed in the fruit diameter, fruit length, fruit weight, number of total branches, total fruits, and yield. The Control C1 had a plant height measuring 102 cm. However, a few of the mutants, specifically C1T6 (85 cm) and C1T7 (87.60 cm), exhibited a reduced height. The performance of Control C1 was high in terms of fruit diameter (44.26 mm) and fruit weight (34.33 mm). C1T2 had a superior fruit length, measuring 36.37 mm. C1T5 had the highest total number of branches, with 41, while Control C1 had just 15. In C1T6, the number of fruits per branch reached a maximum of 15, whereas Control C1 had an average of merely six fruits. C1T5 yielded the highest yield of 5.80 g, while Control C1 yielded 3.08 g.
Control C2 showed no changes in plant height (Figure 5b, Table S1). The trait did not exhibit a response to the mutagen. Substantial variations were noted for the remaining characteristics. Control C2 had superior results in terms of plant height, fruits per branch, and number of total fruits. C2T4 exhibited the highest fruit diameter, measuring 46.04 mm. The Control C2 exhibited a mean fruit diameter of 33.79 mm. Control C2 had the shortest fruit length, measuring 24.43 mm, whereas C2T4 demonstrated the highest performance with a fruit length of 38.76 mm. This mutant exhibited the highest overall fruit weight, at 36.80 g. The Control C2 exhibited a total fruit weight of merely 14.44 g. The Control similarly exhibited the lowest total number of branches, with a count of 11. The branch count reached its peak in C2T3, with a total of 25 branches. The average yield for Control C2 was 2.85 g. The mutant C2T6 exhibited the highest yield, measuring 5.99 g.
There were notable differences between the mutants of C3 when they were compared to one other, Figure 5c, Table S1). Nevertheless, these alterations were not significant for plant height in comparison to the Control. Control C3 had superior performance in terms of fruit diameter, fruit weight, and yield. The mutants demonstrated an advantage in the remaining characteristics. The mutant C3T4 showed superior performance in terms of fruit length, measuring 30.67 mm, as well as in the number of total branches. In comparison, the Control C3 exhibited a fruit length of 28.80 mm. C3T4 had the maximum number of total branches 36. The Control C3 had a total of 13 branches. The mutant exhibited the highest total number of fruits, which amounted to 144, as well as the maximum yield (2.39 g). The Control C3 had a total of 104 fruits and produced a yield of 2.18 g.

3.2. Biochemical Changes

Biochemical studies were conducted to observe the variations in bioactive compounds resulting from EMS treatment.

3.2.1. Changes in Total Phenol, Antioxidant Activity, and Chlorophyll Content

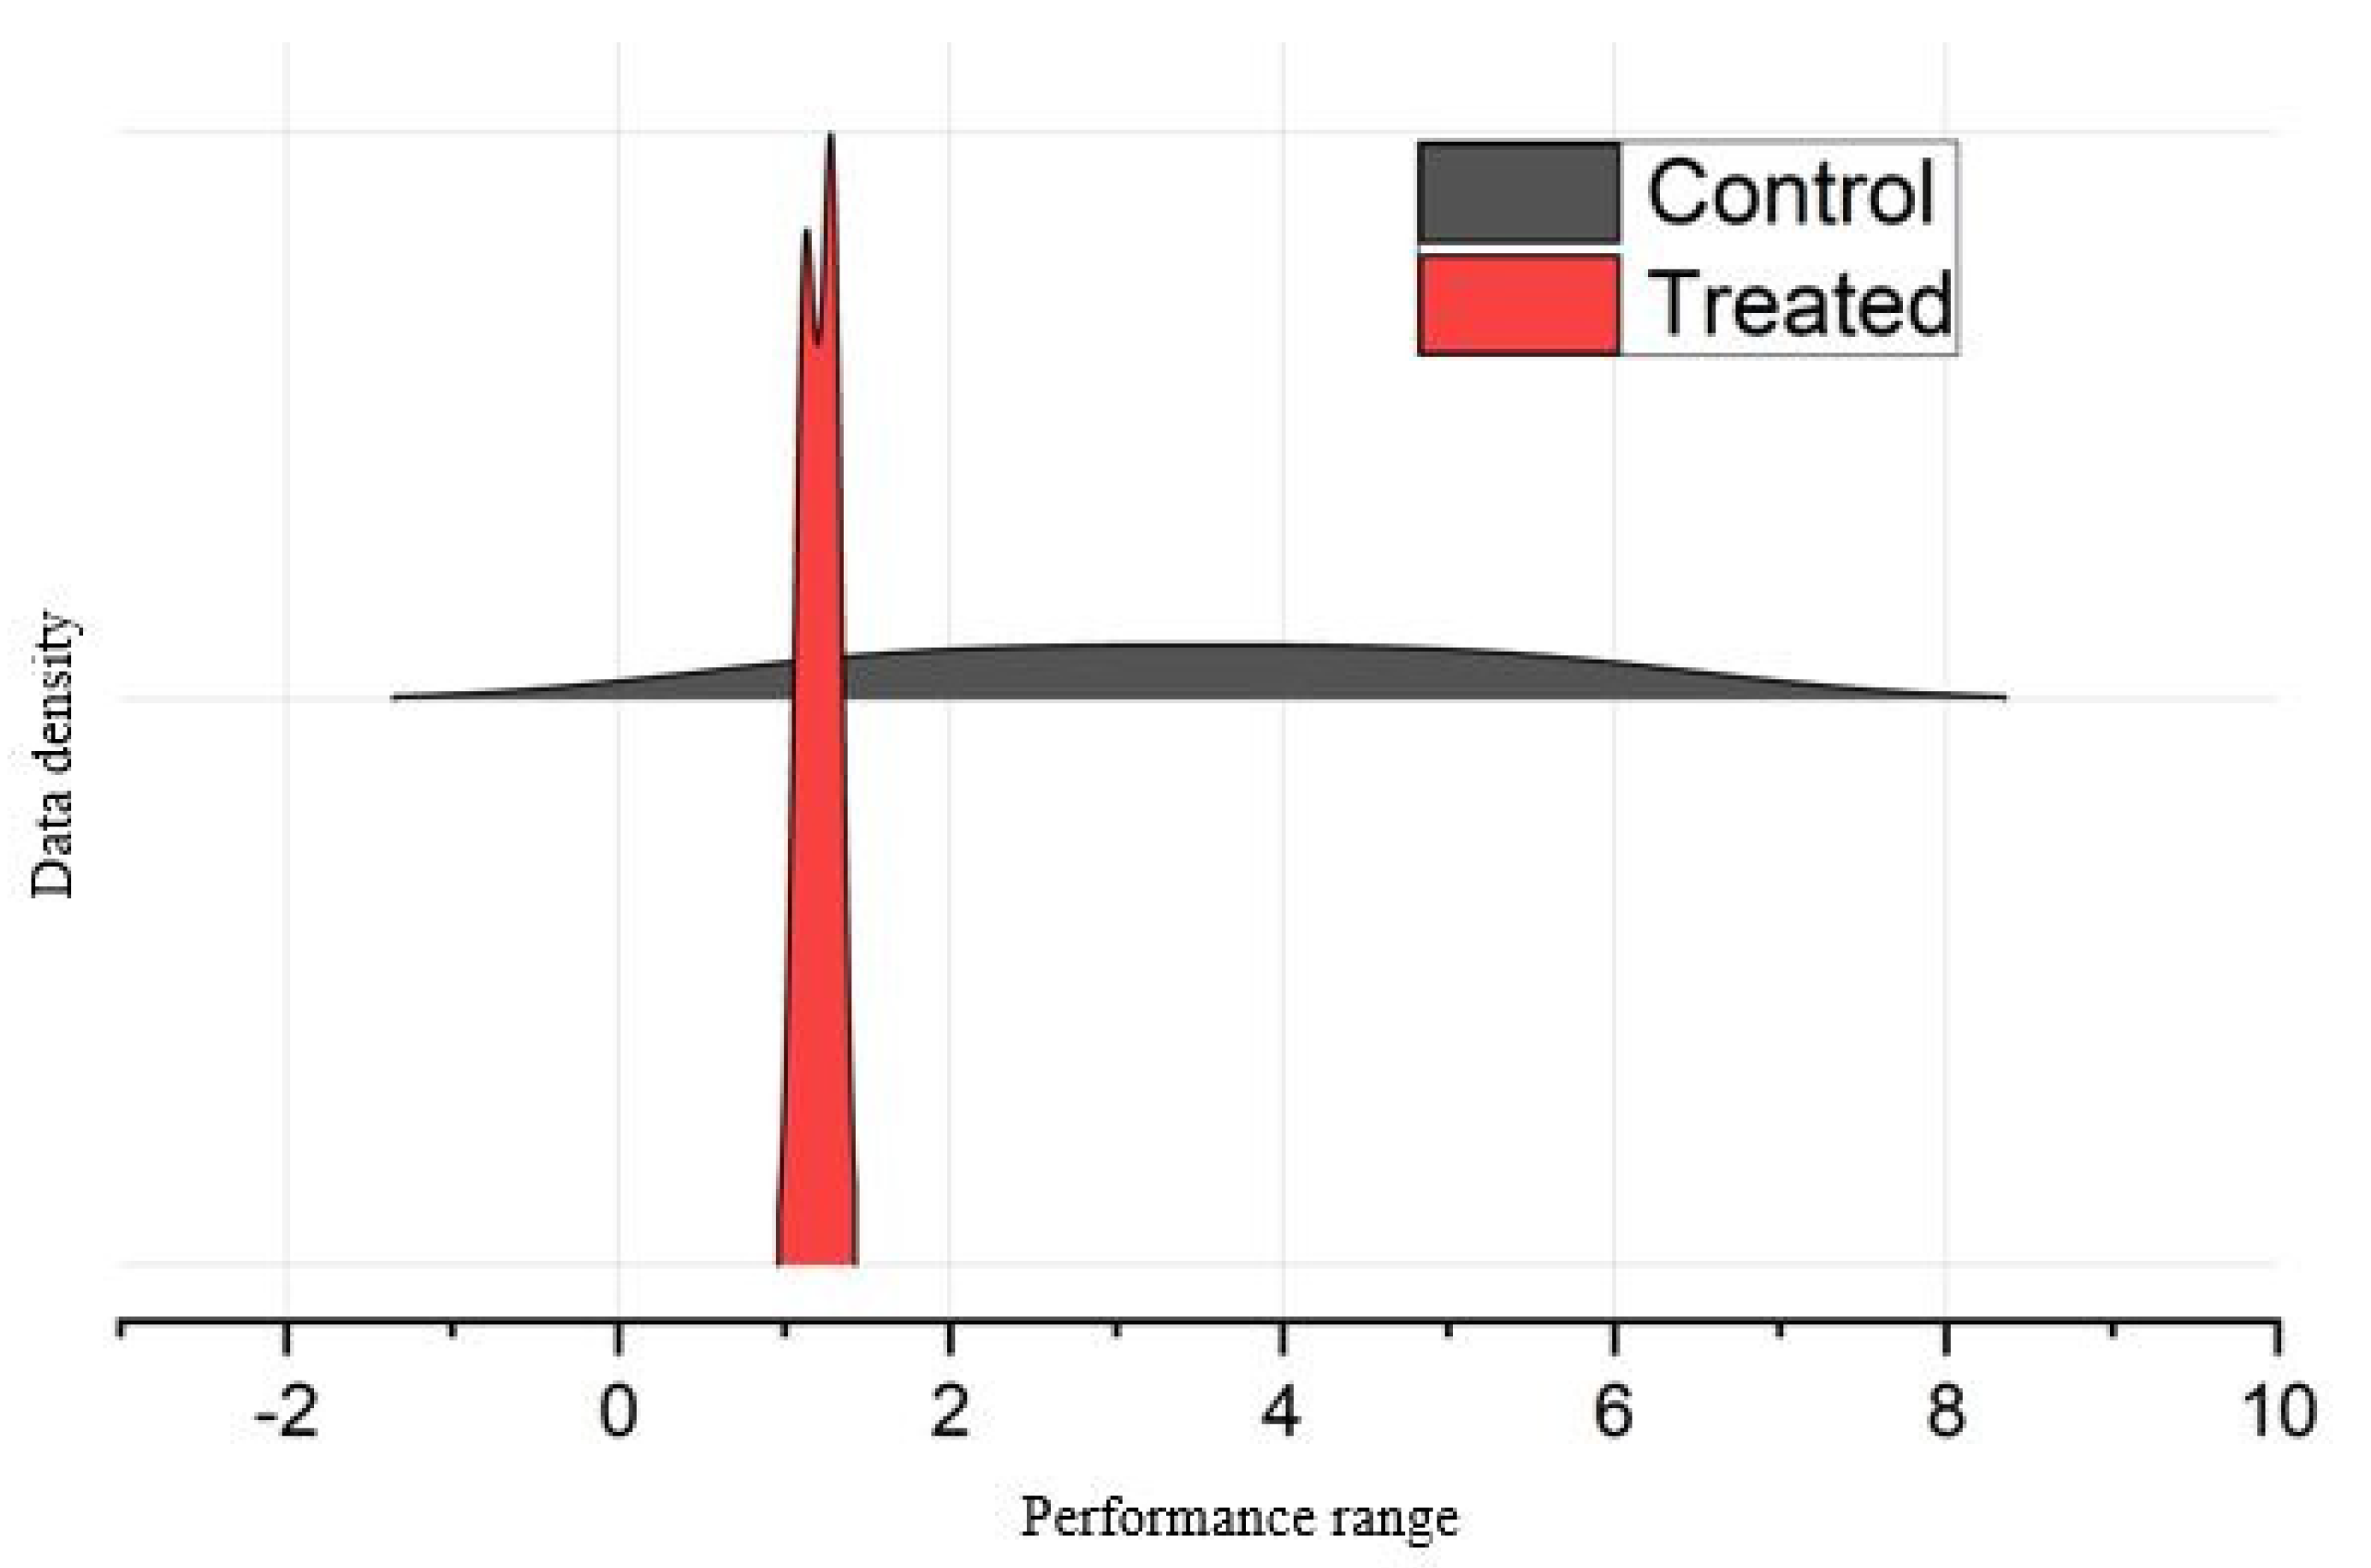
The genotypic trends on biochemical components are shown by a concentrated interspersed density plot (Figure 7), which is a valuable tool for displaying variations in dispersion over the intervening period. Figure 7 illustrates the general patterns observed in the Control and EMS-treated mutants from the combined data of all the biochemical traits examined. The Control genotypes, which were not subjected to EMS treatment, had a normal bell-shaped distribution. By contrast, the mutants exhibited alterations in the curve. In contrast to the morphological distribution pattern, the Control exhibited a greater range of distribution than the treatment in terms of biochemical characteristics.
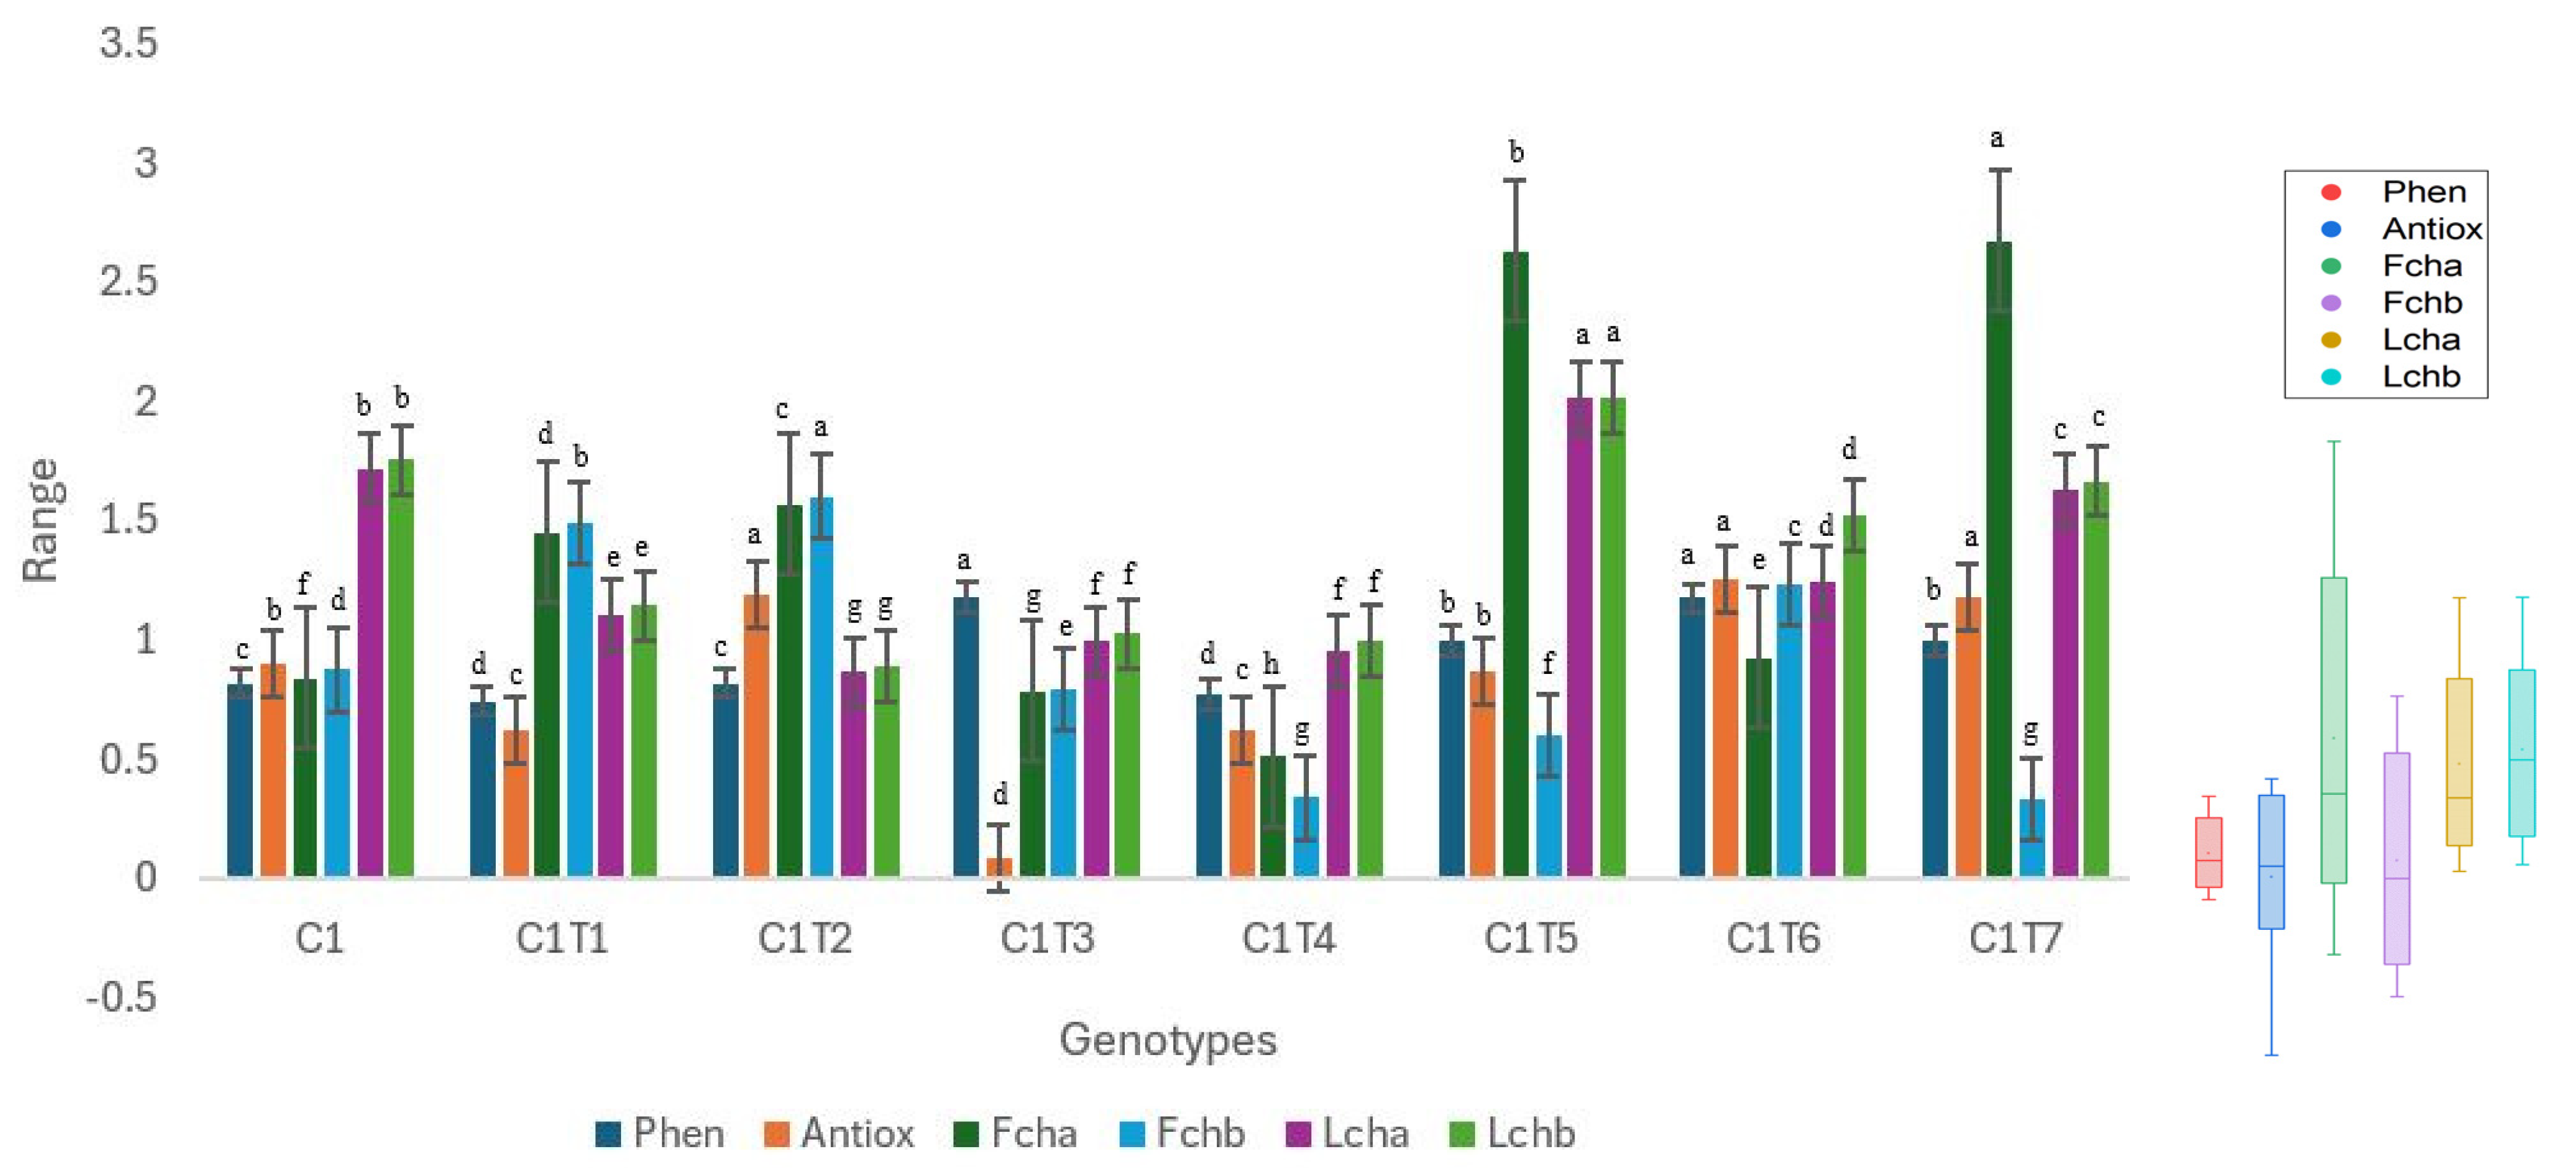
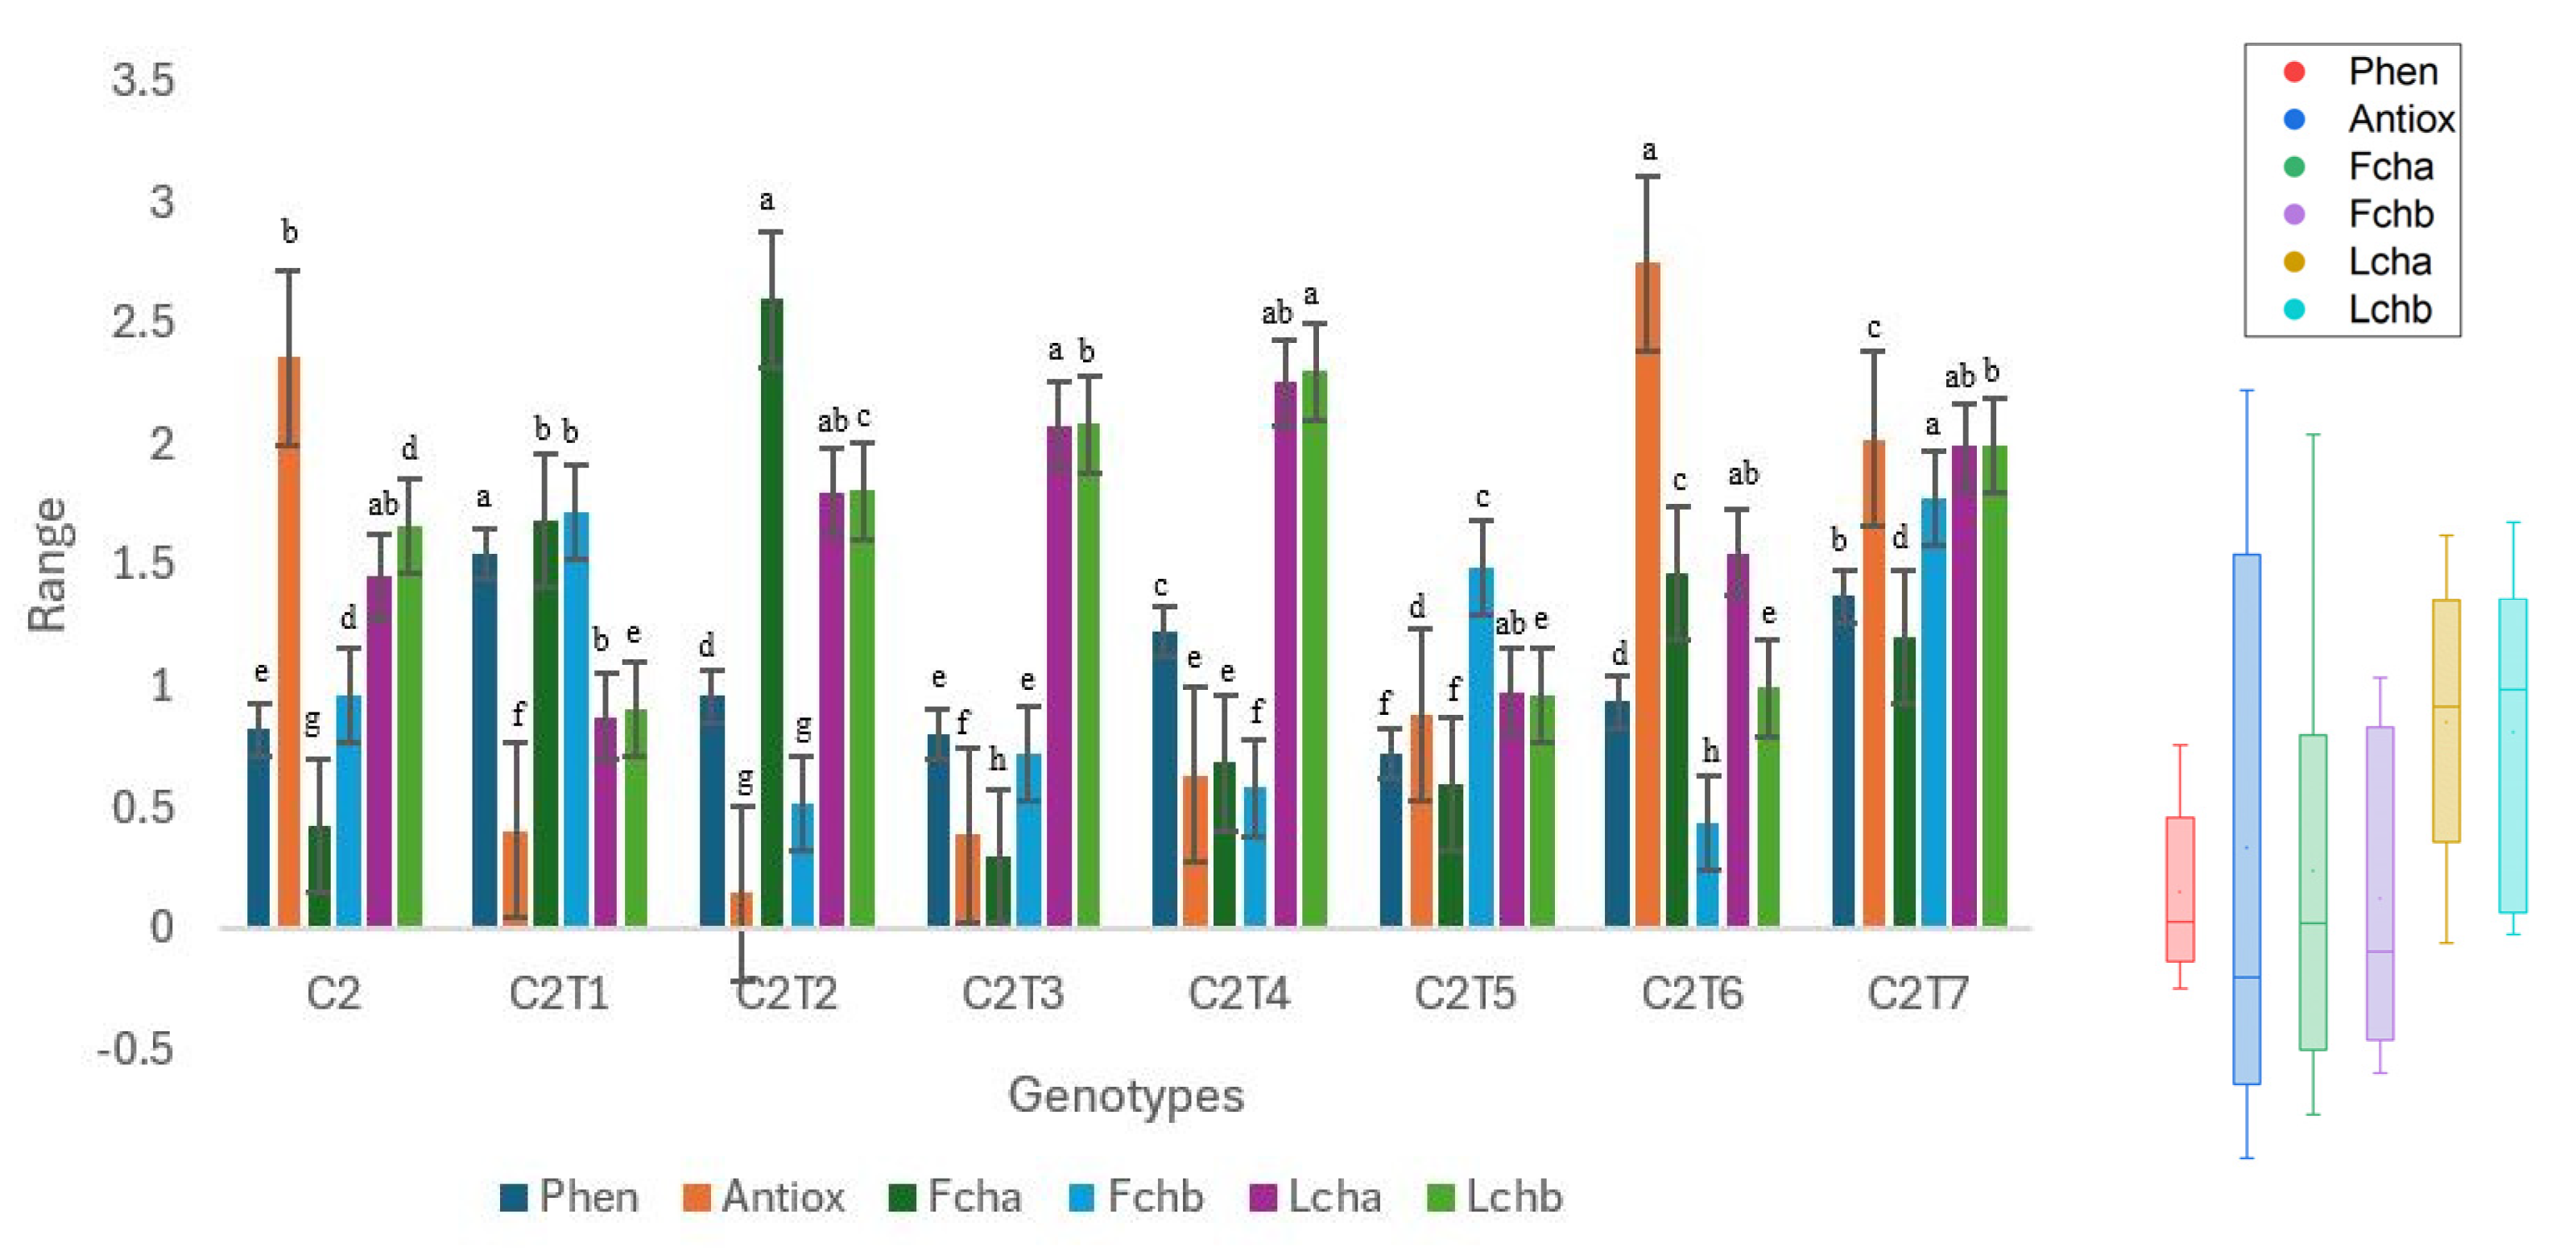
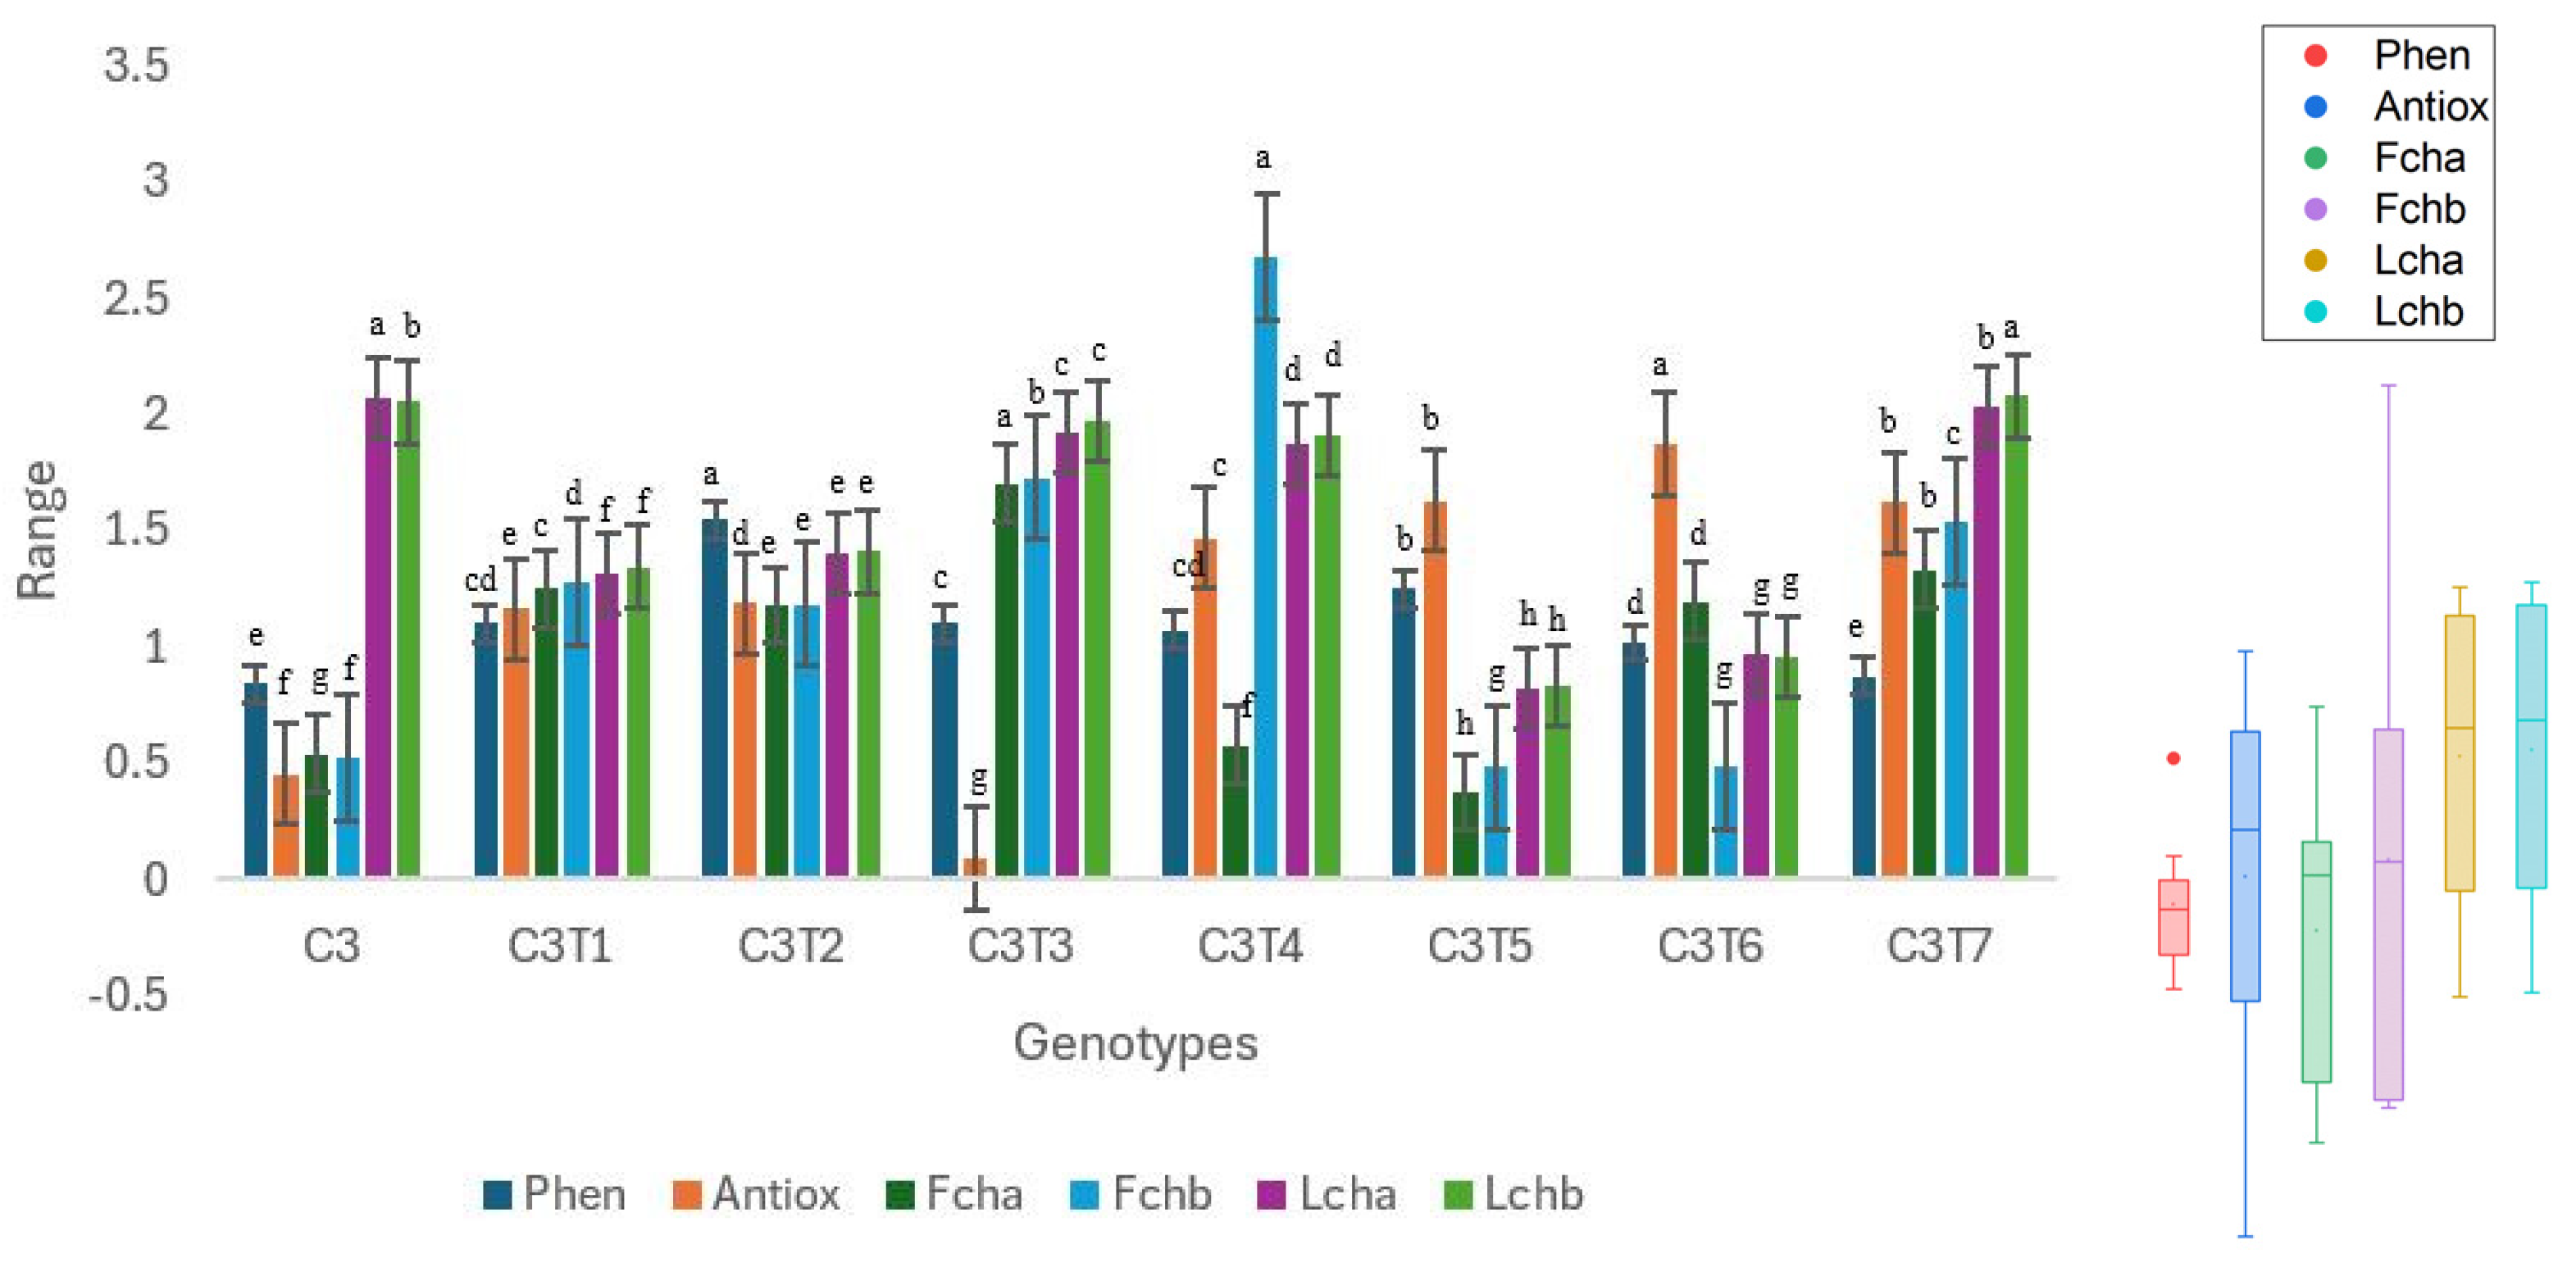
Individual performances of the mutants were assessed and compared to the respective controls (Figure 8, Figure 9 and Figure 10, Table S2).
The mutants exhibited significant changes in all the examined biochemical characteristics in comparison to Control C1 (Figure 8, Table S2). Significant alterations were noted in the characteristics of fruit chlorophyll a and b, as well as leaf chlorophyll a and b, with nearly all the mutants displaying noticeable modifications. Control C1 did not exhibit superior performance in any of the studied biochemical characteristics. C1T3 had the highest performance with a phenolic content of 1.18 ng/µL. The phenolic content of Control C1 was measured to be 0.82 ng/µL. C1T2 exhibited the highest antioxidant activity with a value of 1.19, whereas Control C1 had an antioxidant activity of 0.90 ng/µL. C1T7 had the highest concentration (2.67 mg/g) of chlorophyll in fruit, whereas Control C1 had a concentration of 0.84 mg/g of chlorophyll in fruit. The concentration of chlorophyll b in fruit was highest (1.60 mg/g) in C1T2. Control C1 exhibited a concentration of 0.87 mg/g. The concentrations of chlorophyll a and b in the leaves were highest in C1T5, measuring 2.01 and 2.01 mg/g, respectively. Control C1 exhibited leaf chlorophyll a and b concentrations of 1.72 and 1.75 mg/g, respectively.
There is a large variation in the median values of the boxplots. The median value of leaf chlorophyll b is comparatively higher than the other attributes. The antioxidant exhibits a lower median value in comparison to phenol.
The Interquartile Ranges (IQRs) of the boxplots differ. The phenol exhibits a comparatively smaller interquartile range. The antioxidant exhibits a greater interquartile range in comparison to phenol. The interquartile range of fruit chlorophyll is the longest.
C2 mutants exhibited significant alterations in all examined biochemical characteristics, apart from leaf chlorophyll a (Figure 9, Table S2). The Control exhibited suboptimal performance in all the traits. C2T1 had the highest performance with a phenolic concentration of 1.54 ng/µL, whereas Control C2 had a phenolic content of 0.82 ng/µL. The antioxidant capacity reached its peak at 2.75 ng/µL in C2T6. Control C2 had an antioxidant capacity of 2.36 ng/µL. Fruit chlorophyll a content was highest in C2T2, measuring 2.60 µmol/m2, whereas Control C2 had a chlorophyll a content of 0.42 mg/g. The concentration of chlorophyll b in fruit was highest in C2T7, measuring 1.77 mg/g. There were no notable variations seen in the levels of leaf chlorophyll a. C2T4 had the highest performance in terms of leaf chlorophyll b, with a value of 2.30 mg/g. Control C2 contained a concentration of 1.66 mg/g leaf chlorophyll b.
The medians of leaf chlorophyll a and b have considerably greater values in comparison to other characteristics. The dispersion of the data is depicted by the vertical dimension of each box. The antioxidants exhibited the largest interquartile range (IQR). Phenol seems to have a more limited range. The whisker length represents the data range, omitting any outliers. The whiskers of fruit chlorophyll a are longer, but the whiskers of leaf chlorophyll a and b are shorter.
Like Control C2, significant changes were observed for Control C3 and its mutants across all studied biochemical characteristics, excluding leaf chlorophyll a (Figure 10, Table S2). In contrast to C2, C3 had superior performance in Chlorophyll a (2.07 µmol/m2). For all other characteristics, mutants outperformed the Control C3. The phenolic levels were highest (1.54 ng/µL) in C3T2. The phenolic content of Control C3 was measured to be 0.84 ng/µL. C3T6 had the highest performance with an antioxidant capacity of 1.87 ng/µL. Control C3 had a value of 0.45 ng/µL. The amount of chlorophyll a in the fruit of C3T3 was the highest, at 1.70 mg/g. Control C3 exhibited a chlorophyll a content of 0.54 mg/g in its fruit. C3T4 exhibited the highest fruit chlorophyll b, at 2.68 mg/g. Control C3 exhibited a chlorophyll b content of 0.52 mg/g in the fruit.
The medians of leaf chlorophyll a and b have considerably greater values in comparison to other characteristics. The interquartile range of fruit chlorophyll b was the largest. Phenol seems to have a more limited range. Fruit chlorophyll b and antioxidants possess elongated whiskers, but phenol possesses shorter whiskers.
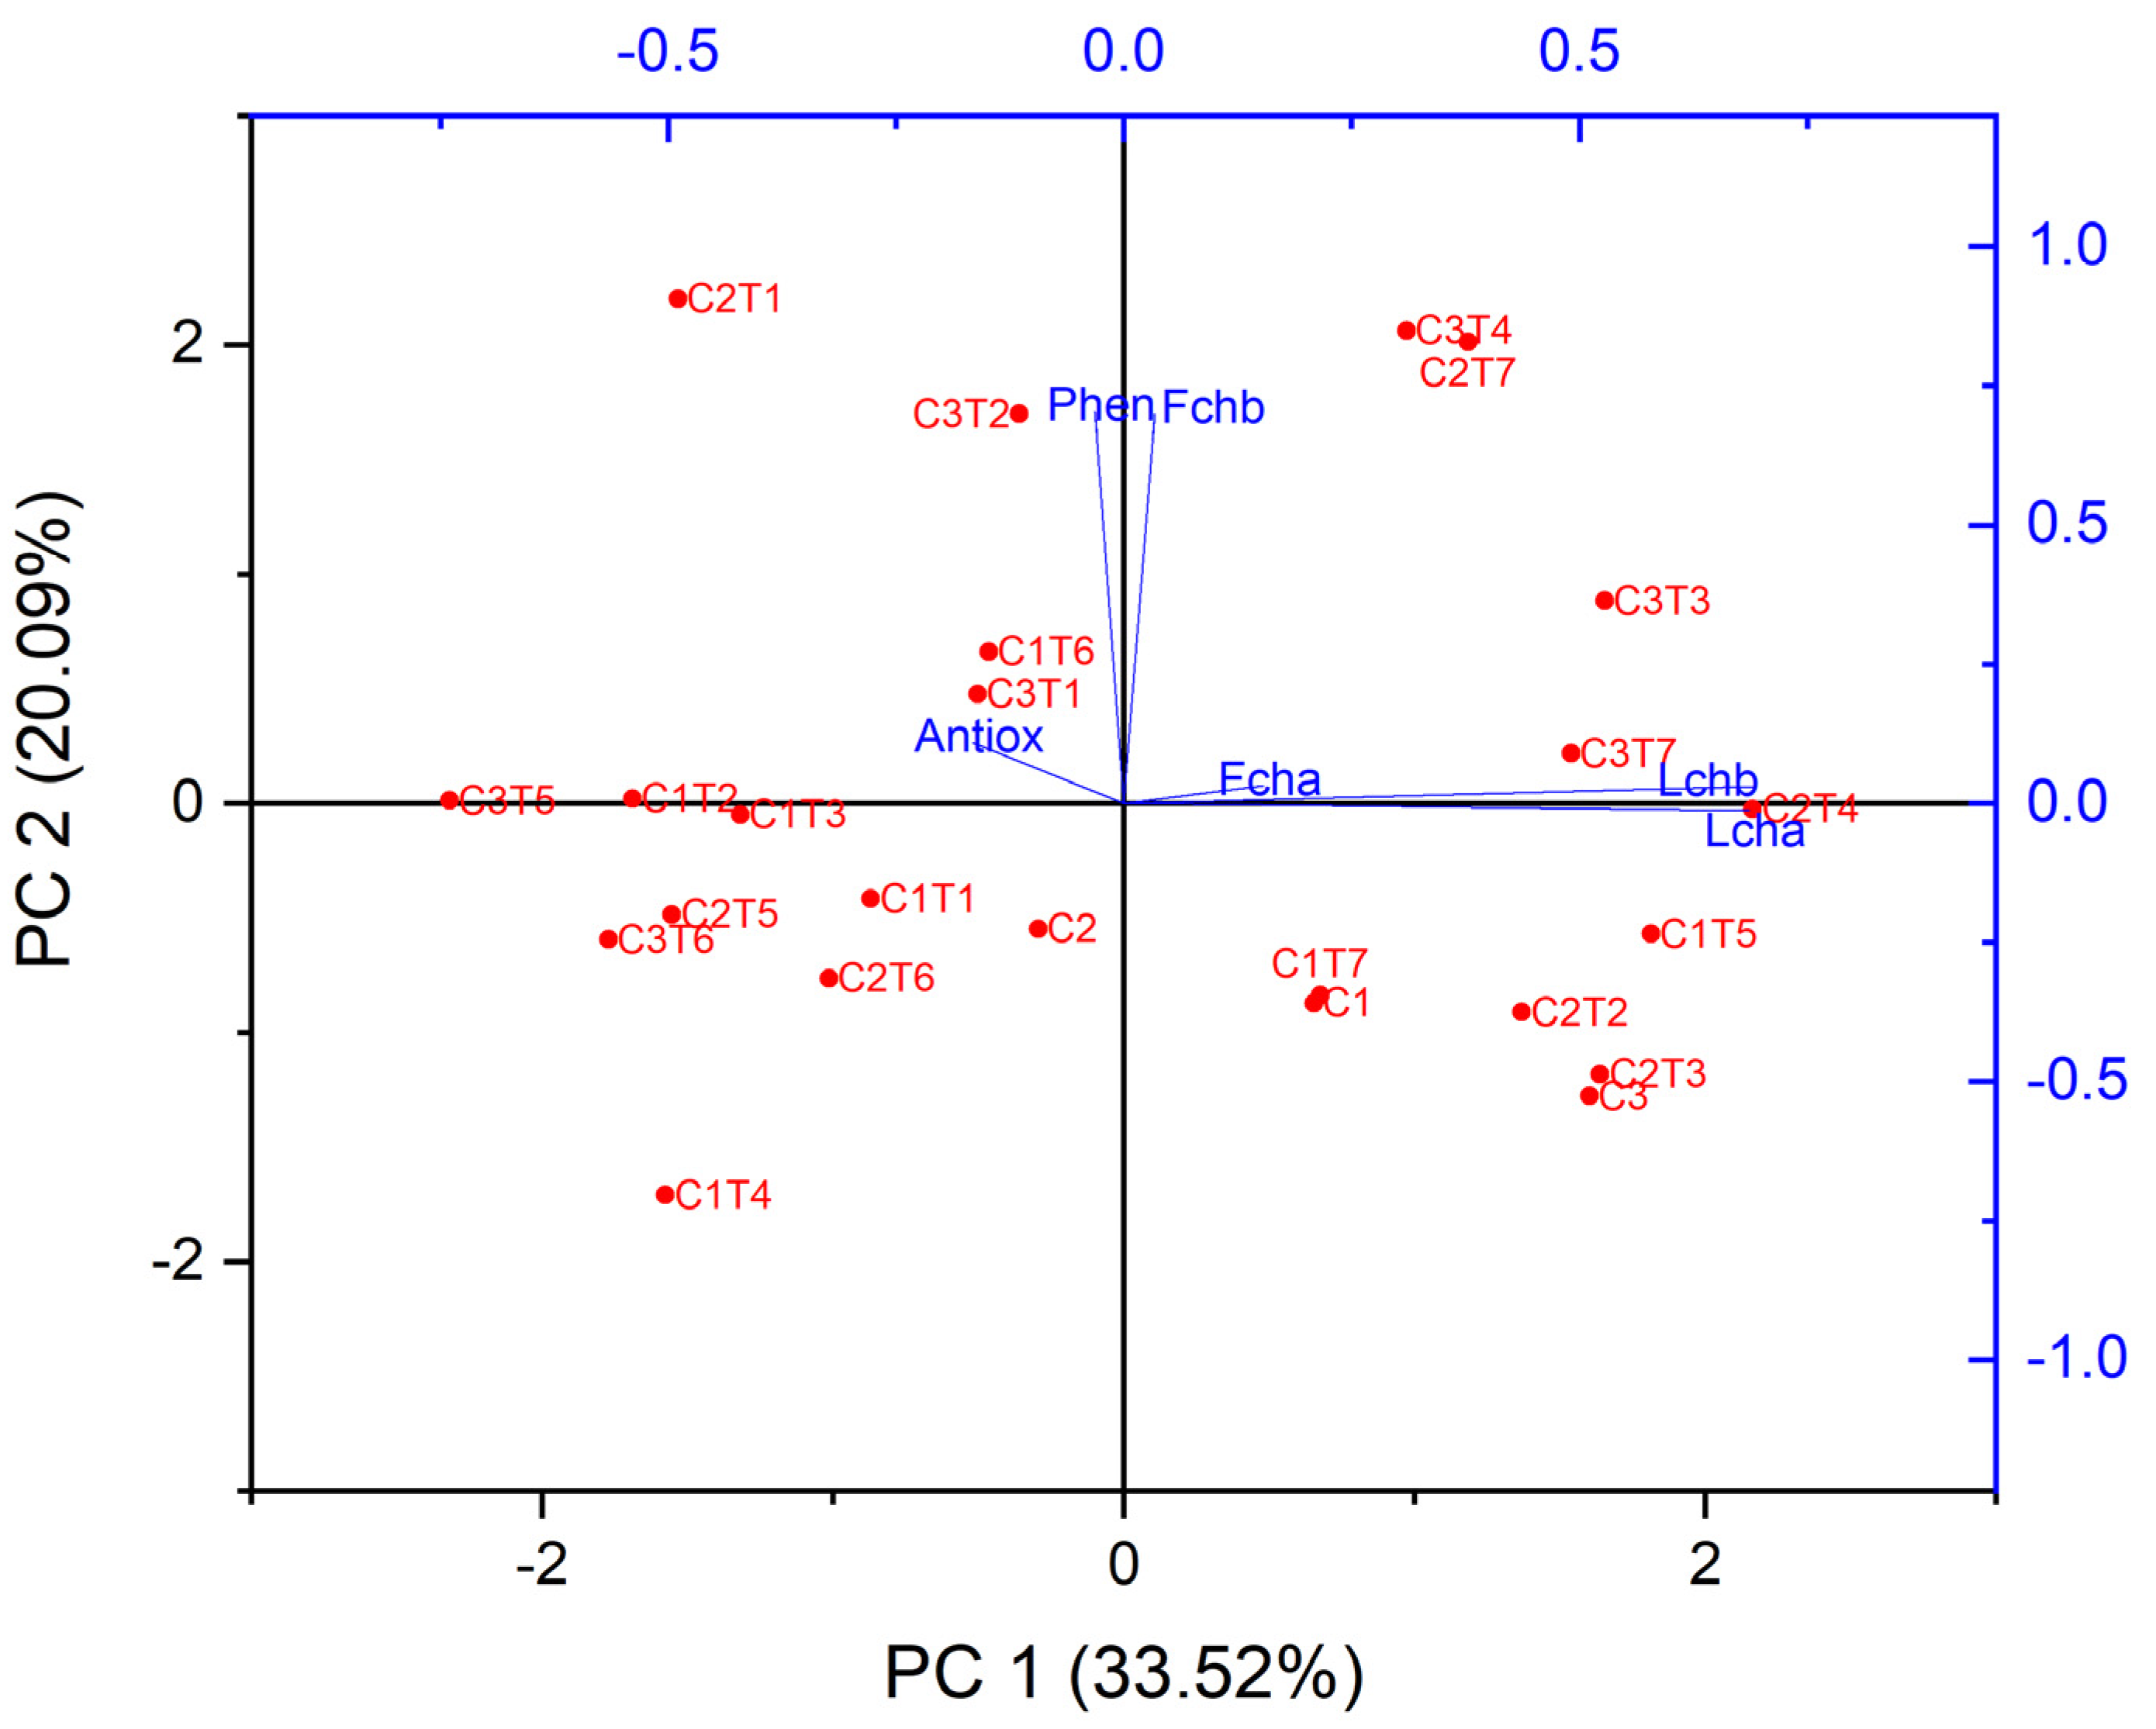
The performance of EMS treatment was evaluated by measuring six biochemical attributes, specifically antioxidant activity, phenol content, fruit chlorophyll a and b levels, and leaf chlorophyll a and b levels. Figure 11 presents the application of GT biplot analysis to visually represent the relationship between the biochemical attributes and EMS treatment. Significant correlations were noticed upon examining the relationship between several biochemical traits in plants. Specifically, there were acute angles identified between phenol fruit chlorophyll b and C3T2, antioxidants and C3T1 and C1T6, fruit chlorophyll a and C3T7, as well as leaf chlorophyll a and b and C2T4. C3T7 exhibited a sharp angle in relation to leaf chlorophyll b.
A biplot also illustrates the correlation between the characteristics. Phenol and chlorophyll b displayed a strong correlation. Antioxidant and phenol, fruit chlorophyll a and b, and leaf chlorophyll a and b were also positively associated.

3.2.2. Changes in Mineral Contents

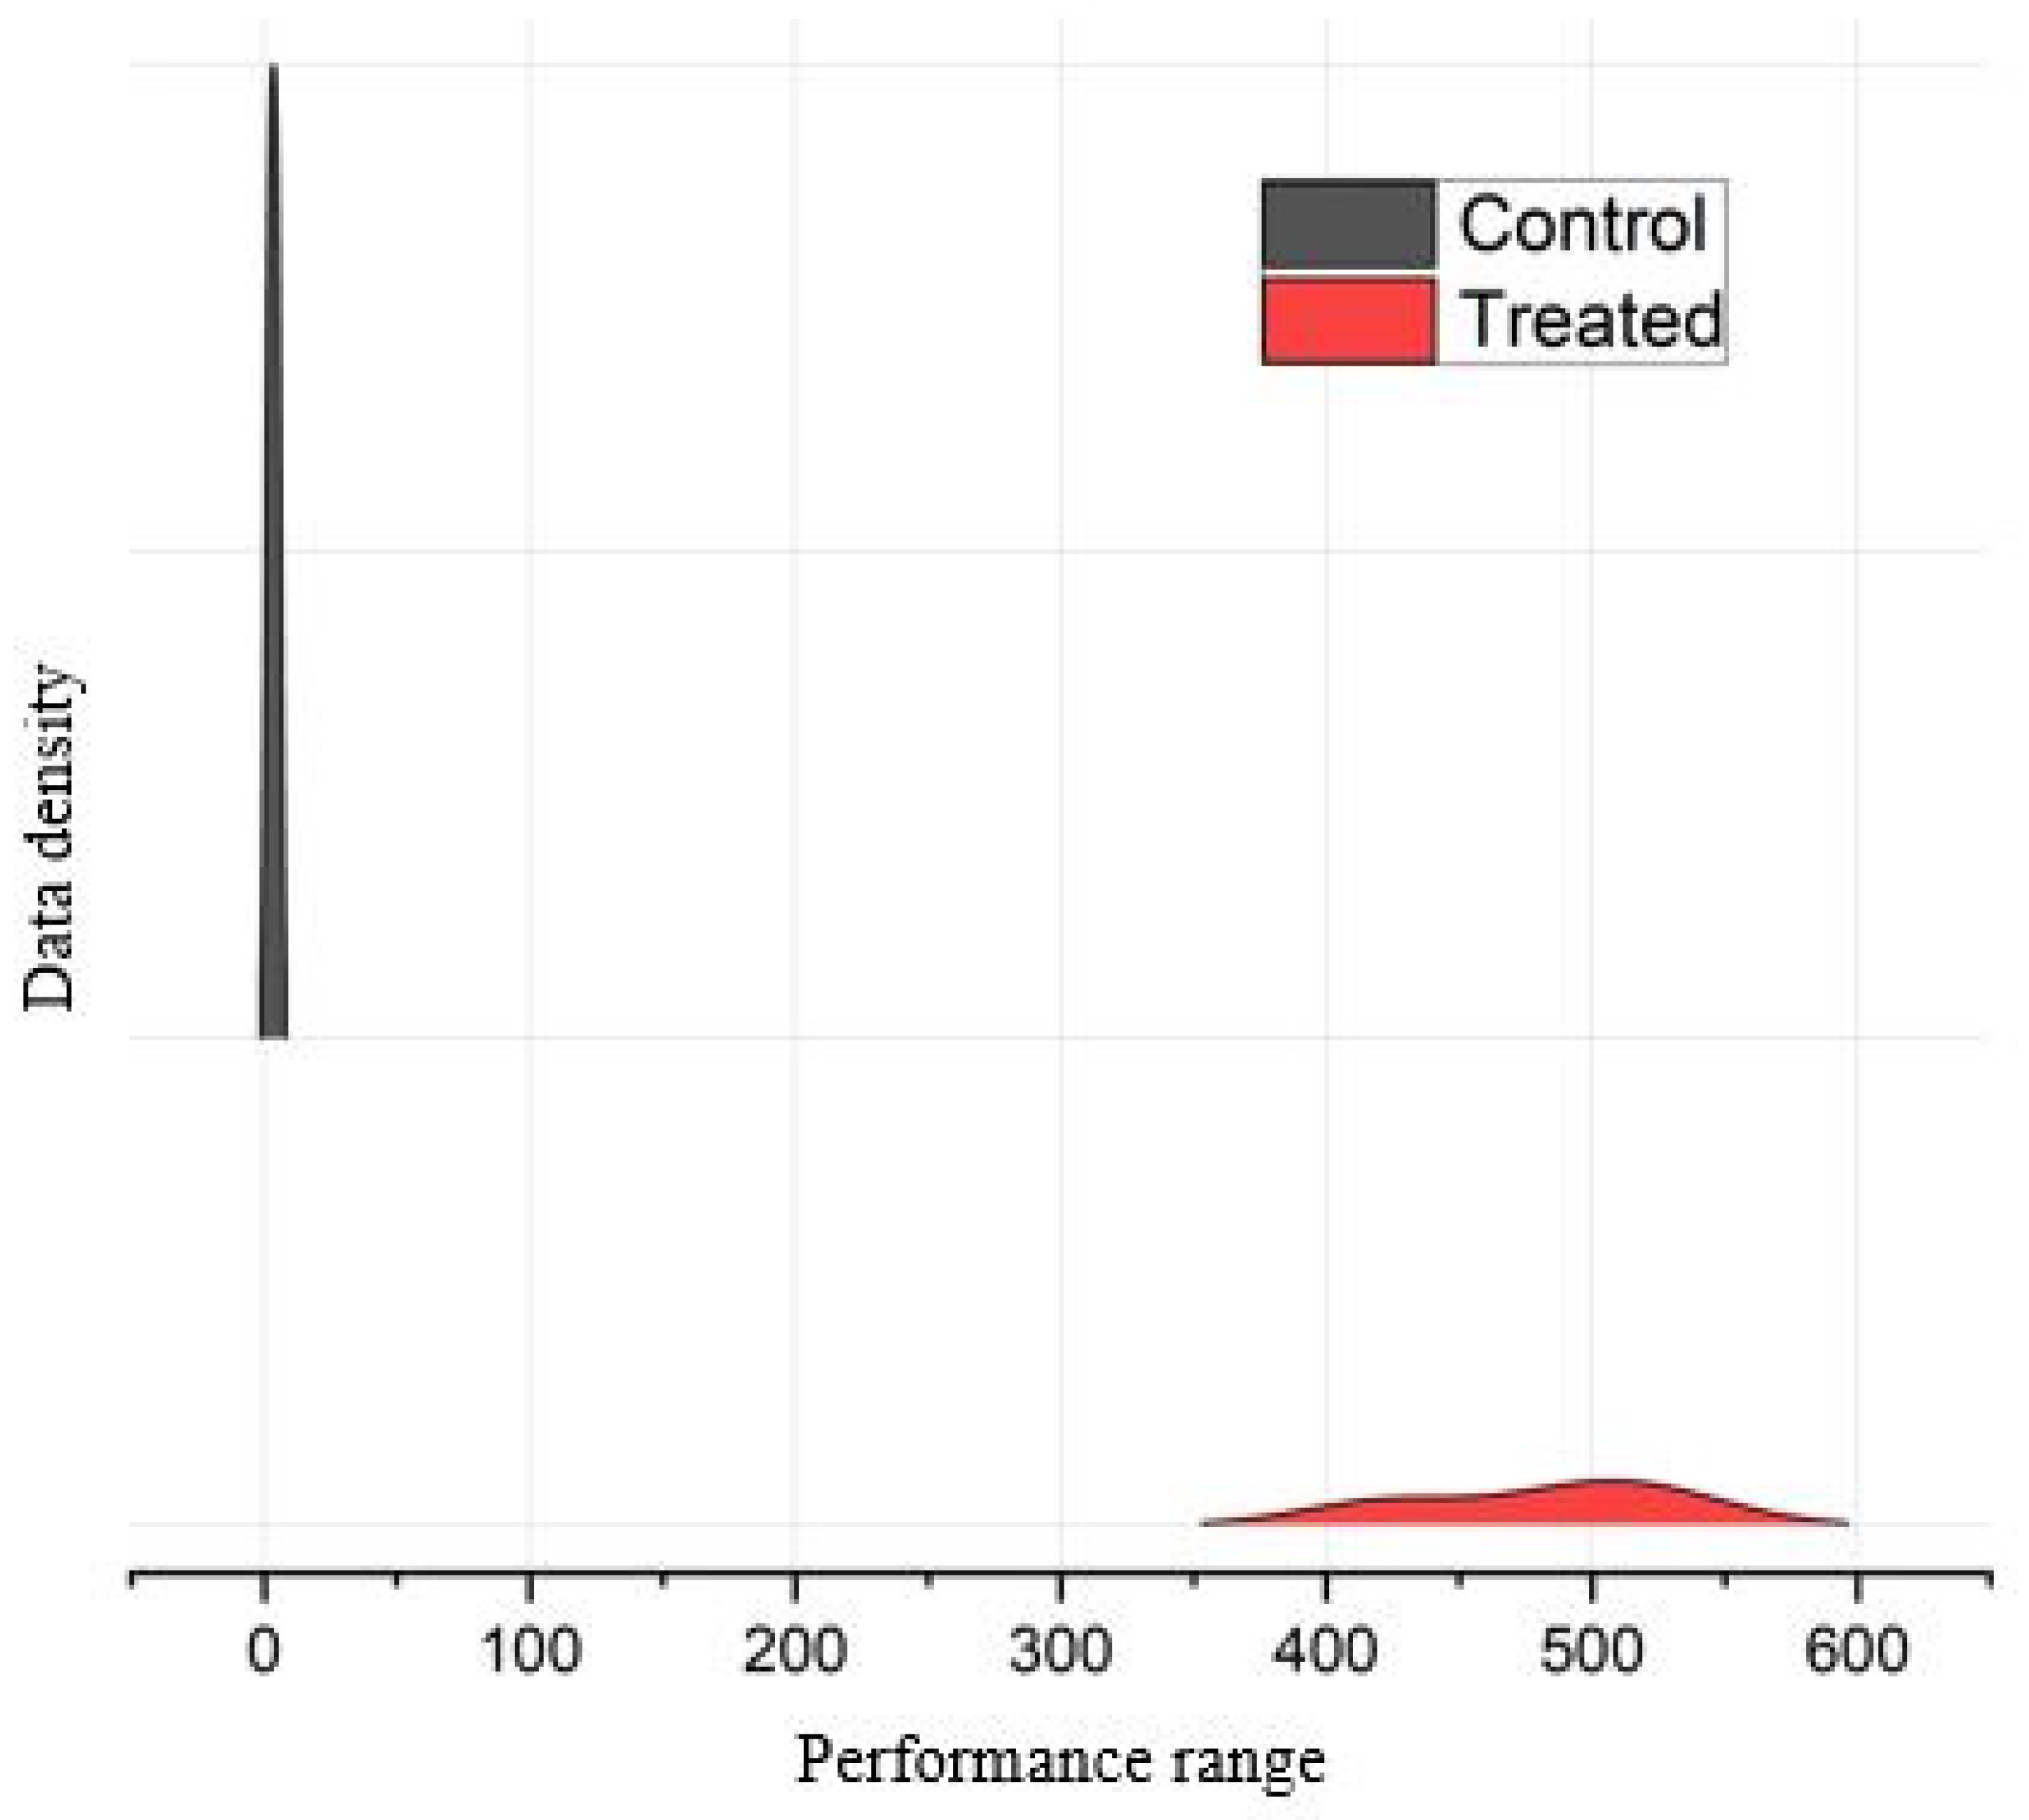
Figure 12 illustrates the general patterns observed in the Control and EMS-treated mutants from the combined data of all the mineral contents examined. The Control genotypes, which were not subjected to EMS treatment, exhibited a narrow-shaped curve. By contrast, the mutants exhibited alterations in the curve. They exhibited a broader dispersion range compared to the Control.
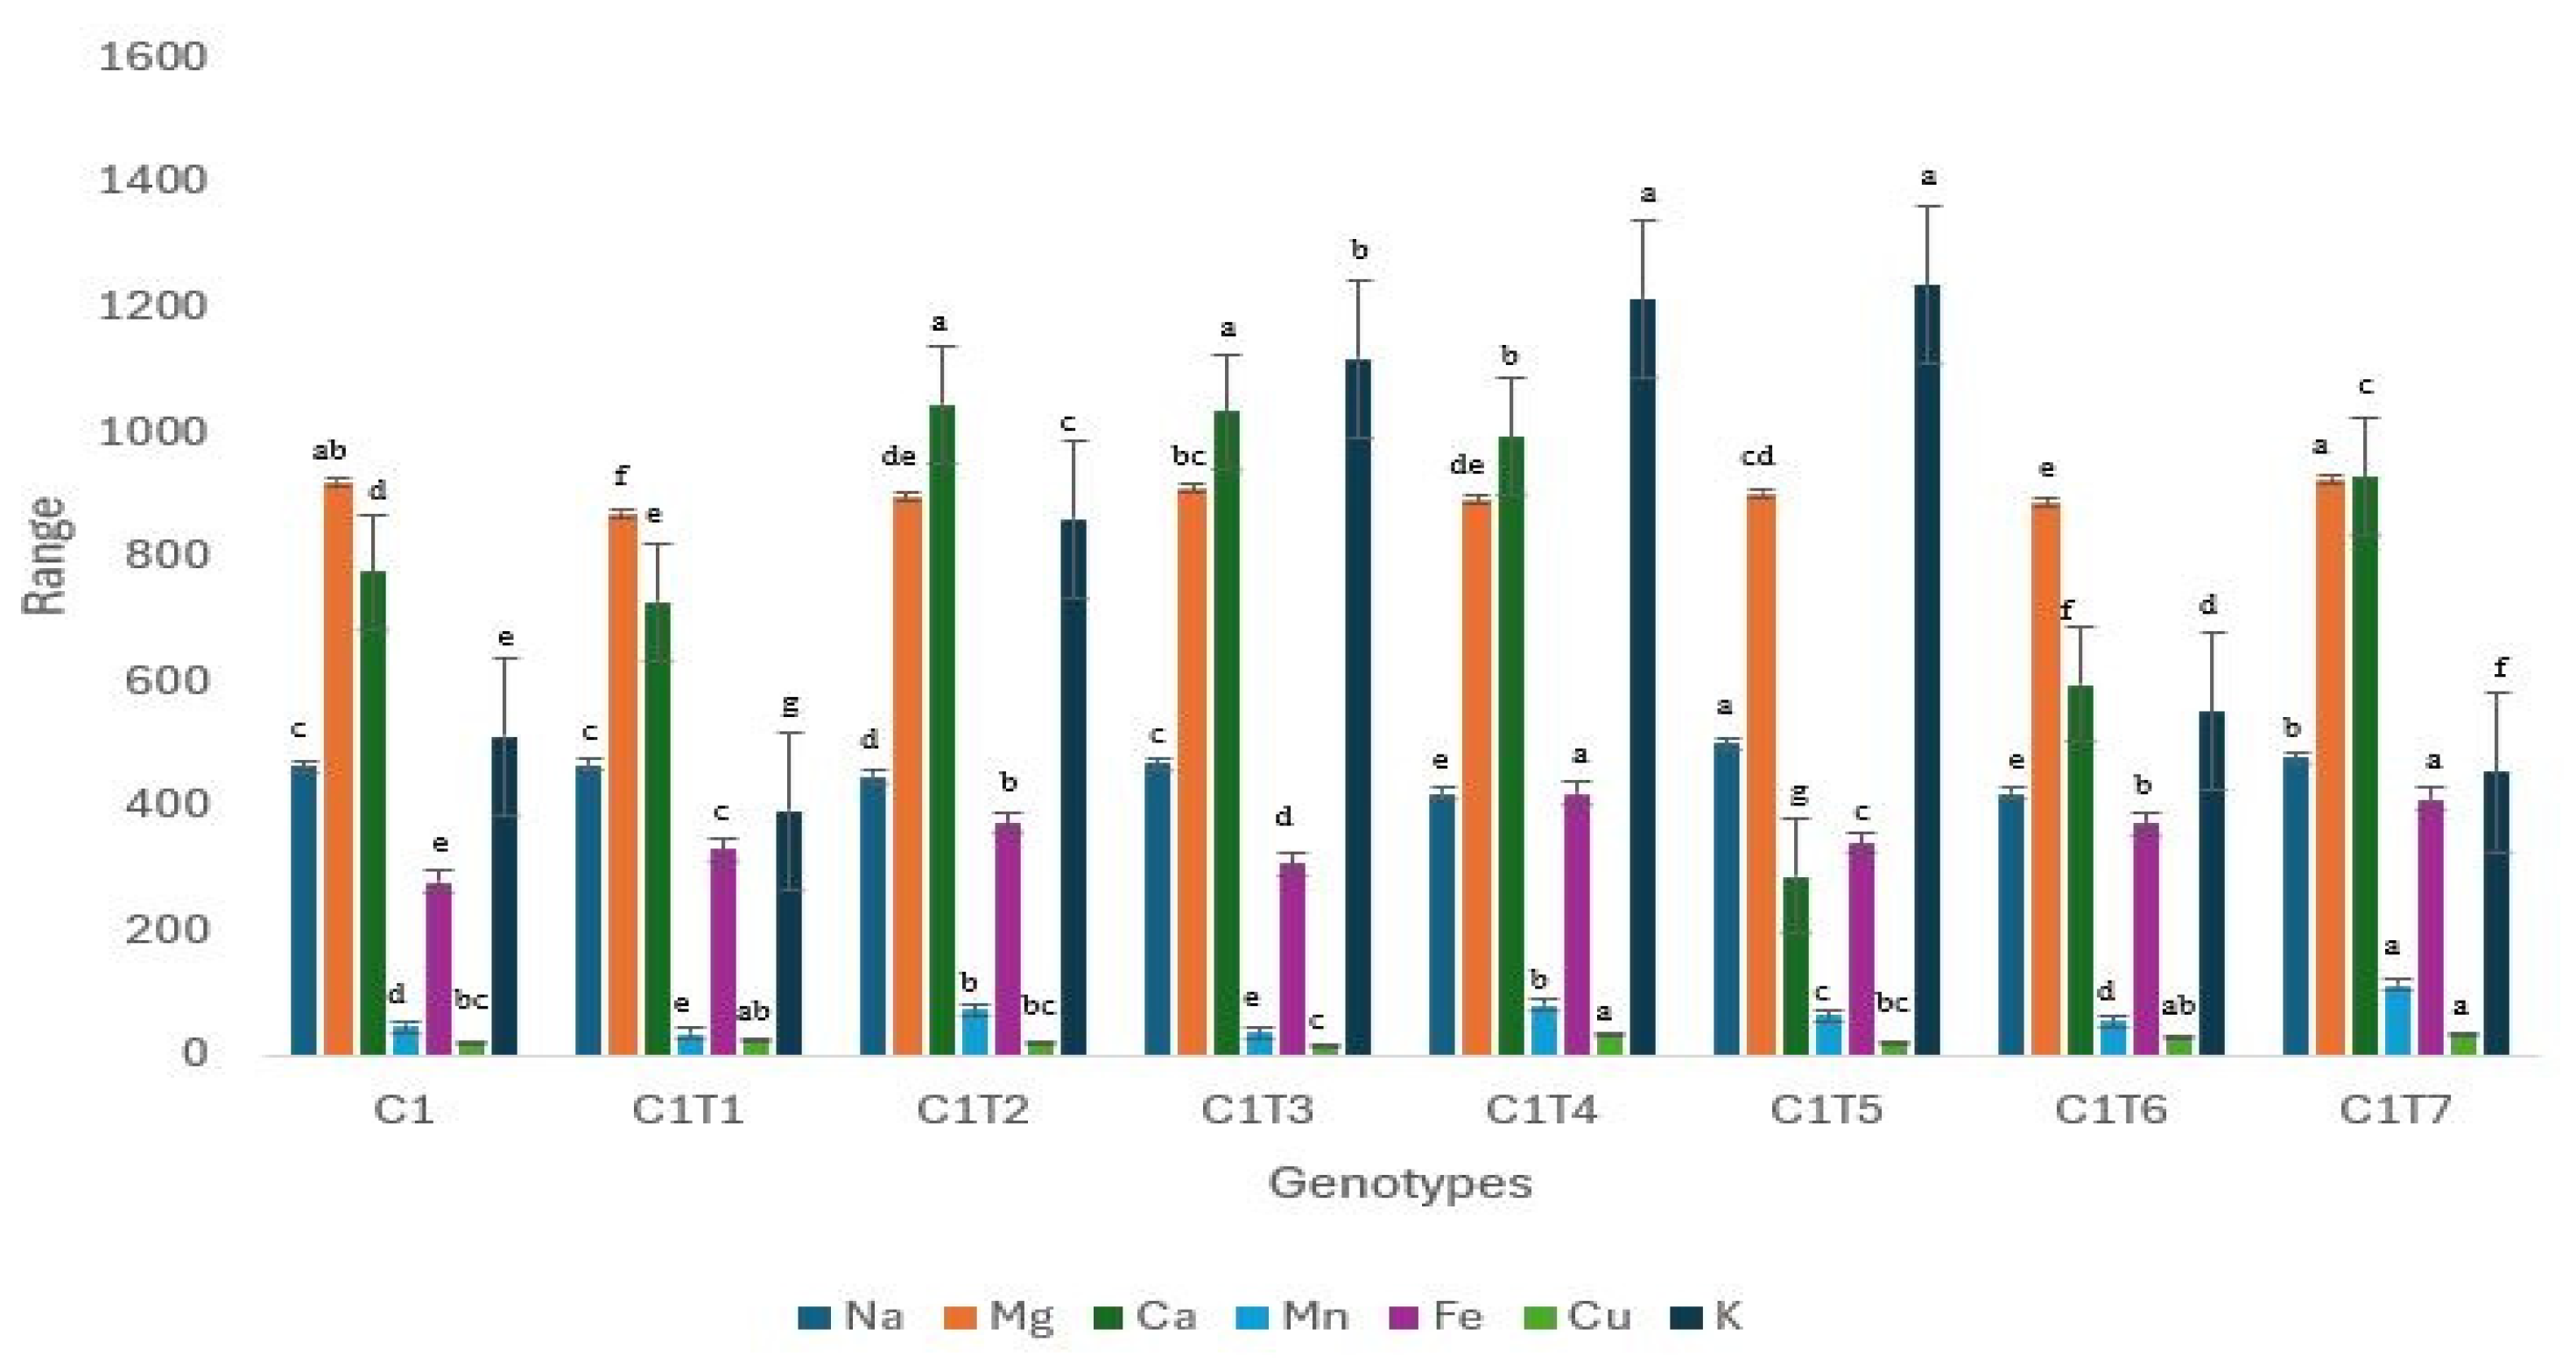
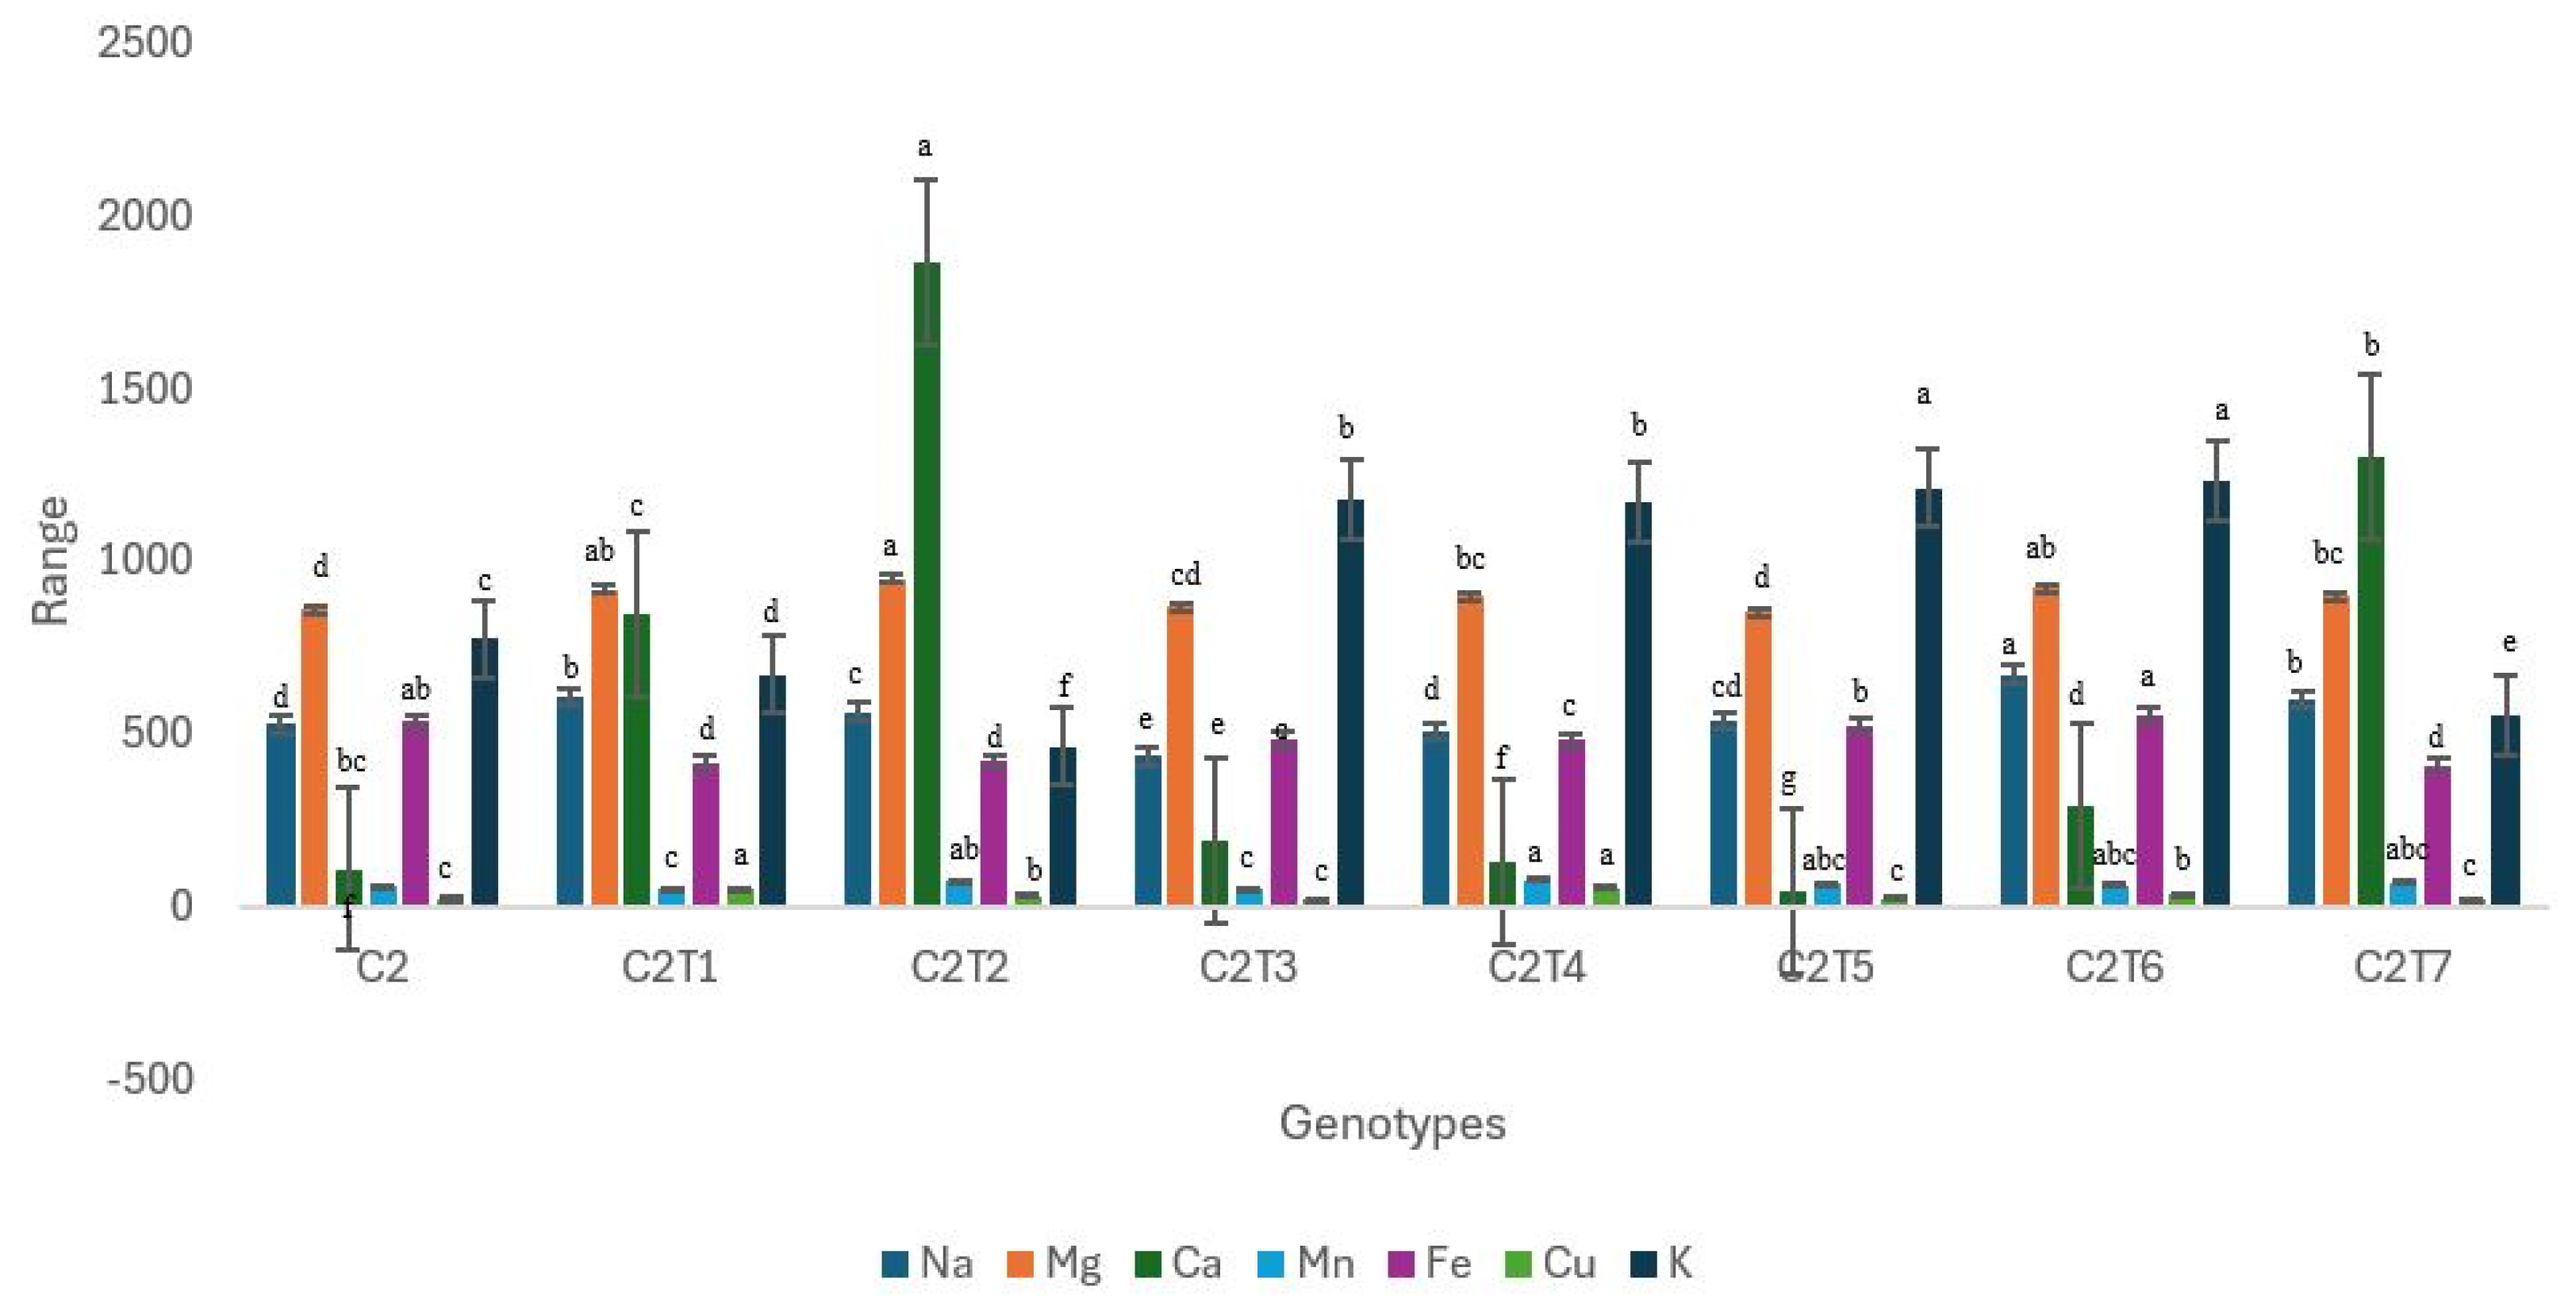
The mineral contents of the mutants were evaluated individually and compared to the corresponding controls (Figure 13, Table S3). The mineral compositions of seven elements, sodium (Na), magnesium (Mg), calcium (Ca), manganese (Mn), iron (Fe), copper (Cu), and potassium (K), were measured. The mutants exhibited significant changes in the mineral compositions examined, as compared to Control C1 (Figure 13, Table S3). Control C1 did not exhibit superior performance in any mineral content, except for Mg. The Control had the lowest levels of Fe concentrations. C1T5 exhibited the highest performance with a Na content of 501.80 µg/g. The concentration of Control C1 was 464.30 µg/g. The Ca concentration in C1T2 was the highest, measuring 1045 µg/g, whereas Control C1 had a Ca content of 776.40 µg/g. C1T7 had the highest Mn content, measuring 114.30 µg/g. Control C1 exhibited a Mg concentration of just 48.87 µg/g. C1T4 had the highest Fe level at 422.40 µg/g, whereas Control C1 had the lowest Fe content at 280.40 µg/g. The Cu content reached its peak at 34.25 µg/g in C1T7. Control C1 exhibited a concentration of 23.31 µg/g. C1T5 exhibited the highest K level, measuring 1237 µg/g. The Control C1 contained a K value of 513.90 µg/g.
C2 mutants exhibited significant alterations in all the examined minerals (Figure 14, Table S3). In contrast to Control C1, Control C2 demonstrated superior performance in terms of iron (Fe) content. The control did not exhibit superior performance in any other analyzed mineral compositions. Certain mutants exhibited a highly favorable alteration concerning particular minerals. The C2T6 mutant demonstrated superior performance, achieving a Na content of 674.80 µg/g. The concentration of Control C2 was 529.60 µg/g. The concentration of Mg in C2T2 was the highest, measuring 952.70 µg/g, while Control C2 had a Mg value of 860.60 µg/g. The Ca concentration in C2T2 was the highest, measuring 1867 µg/g, while Control C2 had a Ca level of 112 µg/g. The mutant C2T4 exhibited the highest concentration of Mn, measuring 81.11 µg/g. Control C2 displayed a Mn content of only 58.18 µg/g. The Fe level at C2T6 was the highest, measuring 555 µg/g. The concentration of Cu reached its maximum value at 51.10 µg/g in the mutant C2T1. Control C2 displayed a value of 22.83 µg/g. The K level of C2T6 was the highest, measuring 1233 µg/g. Control C2 had a K value of 776.50 µg/g.
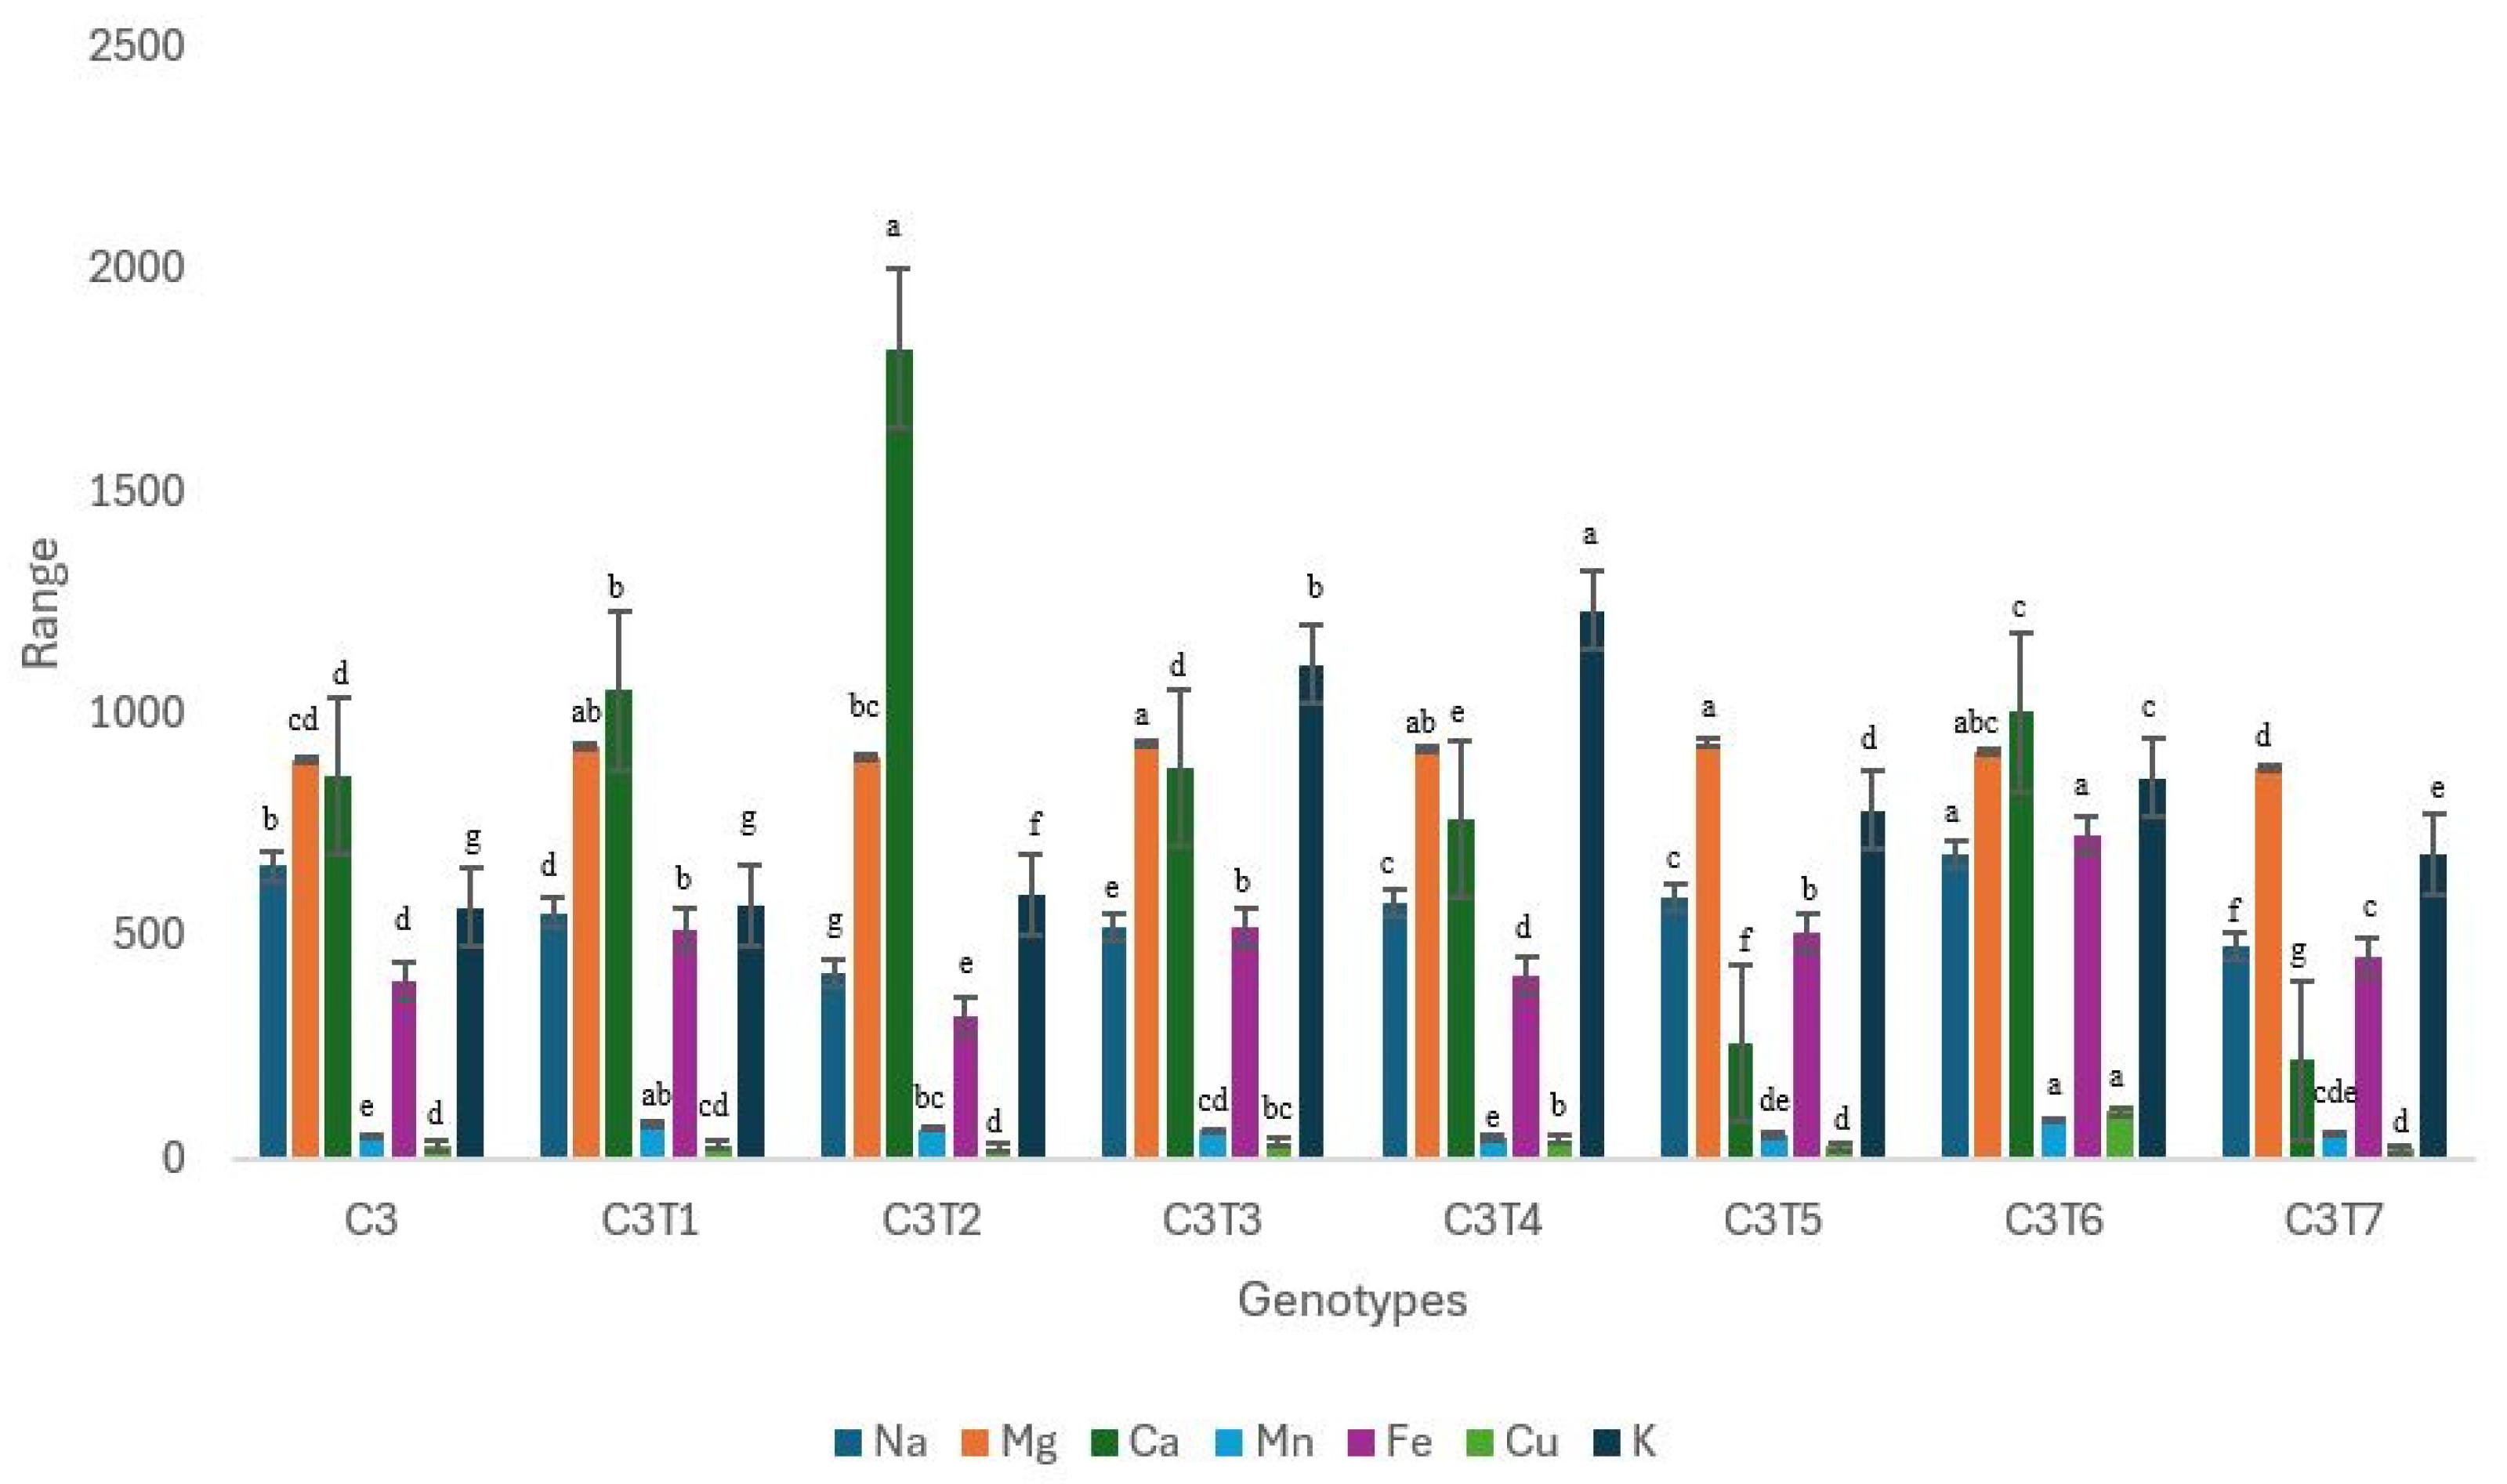
C3 mutants exhibited notable alterations in all the examined minerals (Figure 15, Table S3). In contrast to Control C1 or C2, Control C3 did not exhibit superior performance in any of the minerals examined. It had the lowest levels of manganese (Mn) and potassium (K) concentration. Additionally, certain mutants exhibited a highly favorable change concerning particular minerals. The C3T6 demonstrated superior performance, achieving a Na content of 684.30 µg/g. The concentration of Control C3 was 657.10 µg/g. The Mg concentration in C3T3 was 932.80 µg/g, which was the highest, while Control C3 had a Mg value of 895.90 µg/g. The Ca concentration in C3T2 was the highest, measuring 1822 µg/g, while Control C3 had a Ca content of 861.20 µg/g. The mutant C3T6 exhibited the highest concentration of Mn, measuring 85.81 µg/g. Control C3 displayed a Mn content of only 48.40 µg/g. The Fe level in C3T6 was the highest, at 727.60 µg/g. Control C3 had a Fe content of only 397.70 µg/g. The concentration of Cu reached its maximum value at 104.50 µg/g in C3T6. Control C3 displayed a value of 27.67 µg/g. C3T4 displayed the highest concentration of K, measuring 1233 µg/g. Control C3 had a K value of 564.40 µg/g.

4. Discussion

Mutagenesis is a potent and efficient technique for generating genetic diversity, extensively employed for enhancing the traits of plants. Mutation breeding offers the primary benefit of enhancing specific traits in a variety without altering the underlying genetic makeup. To obtain optimal outcomes in mutagenesis, it is necessary to assess the favorable morphological and biochemical changes in the mutants. In this study, the data recorded on the induced mutagenesis by chemical mutagen EMS in husk tomatoes showed a wide range of variability at the morphological and biochemical levels.

4.1. Effect of EMS on Morphological Traits

Morphological changes were assessed and compared with their respective Controls. A ridge plot was used for the comparison. It displays multiple distributions side by side, emphasizing their shape and overlap. A ridge plot is particularly useful when the distribution of a continuous variable across different groups or conditions is compared. It is very useful in depicting the genetic variations in traits [21,22]. The EMS treatment showed a change in the distribution pattern. The EMS treatment distribution is shifted toward higher values compared to the Control. The treatment group has greater variability. The ridge plot suggests that the treatment affected the measured traits. The shift in the treatment distribution indicates a potential positive impact [23,24].
Overall morphological performances were compared with boxplots. Boxplots provide a visual summary of data distribution, which is useful for comparing groups or conditions in an experiment [25,26,27]. Control C1 boxplot is taller, indicating broader variability. C1 mutants exhibit less variability and lower overall values. The C2 mutants seem to have lower values with less variability than Control C2. An outlier in the Control suggests at least one significantly different value. C3 mutant data have a lower median and narrower IQR, indicating less variability.
The boxplot comparison provides insights into differences or effects due to EMS treatment. EMS did not have many changes in the morphological attributes, but the changes offered can surely be utilized in plant breeding programs.
The GT biplot analysis was used to visualize the association between the morphological traits due to the EMS treatment. A biplot visually displays the link across various attributes. There was a strong correlation between the weight, diameter, length, and yield of the fruit. Therefore, an increase in one trait will increase the other in the studied husk tomato plants.
There was a positive correlation between the height of the plant and the total number of branches. Conversely, there was a negative correlation between the number of fruits per branch and both plant height and the total number of branches. The most significant variation was observed in the number of fruits per branch. Santos et al. [28] studied the correlation of different traits in Physalis species and found that greater fruit had lower production. Although Control C1 had superior performance in terms of fruit diameter and fruit weight, the mutants exhibited superior performance in the remaining studied traits. This shows the effectiveness of EMS treatment in husk tomato in Control C1.
Control C2 showed no changes in plant height. The trait did not exhibit a response to the mutagen. Significant variations were noted for the remaining characteristics. Control C2 had superior performance in terms of plant height, fruits per branch, and number of total fruits.
There were notable differences between the mutants of C3 when they were compared to one other. Nevertheless, these alterations were not significant in comparison to the Control. Control C3 had superior performance in terms of fruit diameter, fruit weight, and yield. The mutants exhibited superiority in the remaining traits.
The studies conducted by Trevisani et al. [29] and Antúnez-Ocampo et al. [30] provided changes in vegetation as well as the diameter and weight of husk tomato fruits. These findings are consistent with our observations. However, the genetic improvement they obtained was not enough to boost productivity or take advantage of heterosis in crossbreeding. To overcome challenges, the genetic variability in husk tomatoes can be improved by augmenting the occurrence of mutations. This can be achieved by modifying the dosage interaction or by expanding the population exposed to mutagens.
EMS treatment may not influence all the studied traits. Genotypic differences also influence the effectiveness of the mutagen in altering the trait efficiency [9,31,32,33]. While working with husk tomatoes, it is crucial to select the genotypes prone to EMS treatment. The studied genotypes did not respond to all the morphological traits, but some of the traits were improved by EMS treatment, which was visible when compared to their respective Controls.

4.2. Effect of EMS on Biochemical Traits

The husk tomato has gained significant attention due to consumer interest in unique foods, driven by a growing recognition of the health advantages associated with consuming a varied diet. This crop is rich in nutrients, particularly potassium, and has antioxidant properties that assist the immune system [1,34]. Therefore, it was very important to assess the biochemical attributes of the studied husk tomato genotypes and the effectiveness of EMS treatment in positively altering the bioactive compounds.
A ridge plot was used to compare the distributions of the Control and EMS-generated mutants for the biochemical traits. It highlighted differences between the Control and treated groups. The Control’s distribution is wider and flatter, indicating more variability within this group’s data points. By contrast, the treated group’s distribution is much narrower, suggesting that most data points for this group are concentrated around the central value. The narrowness of the treated distribution suggests that the treatment has led to a more consistent response. This could be positive if the treatment is desirable.
The total phenol content, antioxidant activity, leaf and fruit chlorophyll a and b, and mineral Na, Mg, Ca, Mn, Fe, Cu, and K content of the fruits were measured. The minerals Na, Mg, Ca, Mn, Fe, Cu, and K were assessed separately.
The mutants exhibited significant changes in all the examined biochemical characteristics in comparison to Control C1. Control C1 did not exhibit superior performance in any of the studied biochemical characteristics. Significant alterations were noted in the characteristics of fruit chlorophyll a and b, as well as leaf chlorophyll a and b, with nearly all the mutants displaying noticeable modifications. This signifies the effectiveness of the EMS treatment.
The changes were further observed in the boxplots. The six boxplots represent distinct trait distributions, with differences in their central tendencies (median values) and dispersions (IQRs). This analysis provides insights into the relative characteristics and variability of the different traits under consideration.
None of the Controls performed best in the studied bioactive compounds except for leaf chlorophyll a in Control C2 and C3. This is very significant, as phenol and antioxidant activities are very important for plants to survive in stressful environments. Stress is a common occurrence for plants since they are highly vulnerable to environmental challenges. This results in oxidative stress that produces more reactive oxygen species (ROS). These reactive oxygen species are essential to oxidative signaling because they trigger a fast and potent reaction that leads to plant sensitization and, ultimately, tolerance to a challenging atmosphere. However, reactive oxygen species affect the major cellular components. According to several studies [35,36,37,38], crops can control the amount of ROS through their antioxidant activities, which helps them avoid oxidative stress and nonetheless enables oxidative signaling. Consequently, administering EMS treatment to husk tomatoes can greatly enhance their defense mechanisms.
According to Rashwan et al. [39], husk tomatoes contained the predominant phenolic compound pyrogallol, followed by benzoic acid. The comprehensive examination of phenolic constituents in husk tomatoes will aid in the formulation of novel approaches for the development of husk tomato varieties.
Husk tomato is popular for making sauces, jams, and the popular salsa known as pico de gallo [40]. Therefore, it is important to know the nutrient contents of husk tomato genotypes. Seven phytochemicals, namely Na, Mg, Ca, Mn, Fe, Cu, and K, were measured, and the mutants were compared with their respective Controls.
Ridge plots are used to assess treatment effects on a single metric. The clear separation between groups emphasizes the significance of treatment. The Control group lacks variability, while the treated group displays spread. The treated group’s distribution is wider, reflecting different outcomes. The contrast between the two distributions highlights the effect of treatment [41,42].
The mutants exhibited significant changes in the mineral compositions examined. Controls did not exhibit superior performance in any mineral content except for Mg in C1 and Fe in C2. The Control had the lowest levels of Fe and K concentrations in C1. Control C2 performed the lowest except for Fe. Control C3 performed the least in Mg, Fe, and Cu. It was obvious that EMS treatment had a significant positive impact in improving the phytochemicals of husk tomatoes.
Hegazy et al. [43] analyzed the concentrations of Fe, Mg, Na, and Ca in husk tomato juice and determined them to be 1.76, 1.62, 7.43, and 12.14 mg/100 g, respectively. Compared to these results, the treated mutants in our experiments exhibited superior performance.
Rashwan et al. [39] conducted a comparison of the phenol content of intact persimmon and husk tomato fruits. The findings revealed that iron (Fe) was the most abundant trace element detected in persimmon and husk tomatoes. During our investigation, certain mutants exhibited superior performance compared to the Control in terms of Fe content.
The results of the experiment validated the effectiveness of EMS-induced mutagenesis as a viable technique for improving morphological and biochemical features in husk tomatoes. Furthermore, researchers will have access to mutants that contain beneficial morphological and biochemical characteristics, allowing for in-depth analysis. Additionally, they will serve as a genetic reservoir for the advancement and enhancement of breeding strategies.

5. Conclusions

The effects of EMS treatment on bioactive compounds and phytochemicals in husk tomatoes were prominent. Genotype-dependent morphological changes were identified. Positive changes were observed in mutants for phenols, antioxidant activity, and leaf and fruit chlorophyll contents. Changes in the phytochemicals in mutants were substantial, which can be used in developing nutrient-rich husk tomato varieties.

Supplementary Materials

The following supporting information can be downloaded at: https://www.mdpi.com/article/10.3390/horticulturae10090913/s1, Table S1: Morphological performance of control and mutants; Table S2: Performance of bioactive compounds in control and mutants; Table S3: Performance of control and mutants on mineral contents.

Author Contributions

Conceptualization, M.H., M.A.H. and M.A.; Methodology, M.H., M.A.H., M.A. and M.A.I.; Software and Validation, M.H., M.A.H. and M.A.; Formal analysis, M.H. and M.A.H.; Investigation, M.A.I., F.T. and A.H.D.; Resources, M.H.; Data curation, M.H., M.A.H. and M.A.; writing—original draft preparation, M.A.I., M.H., M.A.H. and M.A.; writing—review and editing, M.H., M.A.H. and M.A., S.E. and M.G.R.; Visualization, M.H.; Supervision, M.H., M.A.H. and M.A.; Project administration, M.H.; Funding acquisition, S.E. and D.S. All authors have read and agreed to the published version of the manuscript.

Funding

This research received no external funding.

Data Availability Statement

The data presented in this study are available on request from the corresponding author.

Conflicts of Interest

Author Duran Simsek was employed by the company Areo Seed Company. The remaining authors declare that the research was conducted in the absence of any commercial or financial relationships that could be construed as a potential conflict of interest.

References

  1. González-Pérez, J.E.; Guerrero-Beltrán, J.Á. Tomatillo or husk tomato (Physalis philadelphica and Physalis ixocarpa): A review. Sci. Hortic. 2021, 288, 110306. [Google Scholar] [CrossRef]
  2. Ramírez-Cariño, H.F.; Ochoa-Velasco, C.E.; Guerrero-Analco, J.A.; Monribot-Villanueva, J.L.; Calderón-García, C.; González-Terreros, E.; Escamirosa-Tinoco, C.; Morales, I.; Valadez-Blanco, R. Combined effect of the potassium dose and plant biofertilization by Acinetobacter calcoaceticus on the growth, mineral content, nutritional quality, antioxidant activity, and metabolomic features of tomatillo fruits (Physalis ixocarpa Brot.). Plants 2023, 12, 466. [Google Scholar] [CrossRef] [PubMed]
  3. Majkowska-Gadomska, J.; Mikulewicz, E.; Francke, A. Effects of plant covers and mulching on the biometric parameters, yield and nutritional value of tomatillos (Physalis ixocarpa Brot. Ex Hornem.). Agronomy 2021, 11, 1742. [Google Scholar] [CrossRef]
  4. González-Mendoza, D.; Grimaldo-Juárez, O.; Soto-Ortiz, R.; Escoboza-Garcia, F.; Hernández, J.F.S. Evaluation of total phenolics, anthocyanins and antioxidant capacity in purple tomatillo (Physalis ixocarpa) genotypes. Afr. J. Biotechnol. 2010, 9, 5173–5176. [Google Scholar]
  5. Robledo-Torres, V.; Ramírez-Godina, F.; Foroughbakhch-Pournavab, R.; Benavides-Mendoza, A.; Hernández-Guzmán, G.; Reyes-Valdés, M.H. Development of Physalis philadelphica (Physalis ixocarpa Brot.) autotetraploids and their chromosome and phenotypic characterization. Breed. Sci. 2011, 61, 288–293. [Google Scholar] [CrossRef]
  6. Peña-Lomelí, A.; Ríos-Hernández, N.E.; Santos-Moreno, O.; Magaña-Lira, N. Genetic parameters of the Gema population of husk tomato (Physalis ixocarpa Brot. ex Horm.). Rev. Chapingo Ser. Hort. 2020, 26, 83–94. [Google Scholar]
  7. Shamsolshoara, N.; Miri, S.M.; Badi, H.N. Arginine and Folic Acid Improve Metabolites Content of Tomatillo (Physalis philadelphica) Fruit. Russ. J. Plant Physiol. 2023, 70, 211. [Google Scholar] [CrossRef]
  8. Anand, A.; Subramanian, M.; Kar, D. Breeding techniques to dispense higher genetic gains. Front. Plant Sci. 2023, 13, 1076094. [Google Scholar] [CrossRef]
  9. Chen, L.; Duan, L.; Sun, M.; Yang, Z.; Li, H.; Hu, K.; Yang, H.; Liu, L. Current trends and insights on EMS mutagenesis application to studies on plant abiotic stress tolerance and development. Front. Plant Sci. 2023, 13, 1052569. [Google Scholar] [CrossRef]
  10. Islam, M.A.; Bin Mohi Uddin, M.M.; Rasul, M.G.; Haque Swapon, M.A.; Ahmed, M.; Hasan, M. In vitro screening and field performance of EMS-treated eggplants for the selection of shoot and fruit borer-resistant plants. Agronomy 2022, 12, 1832. [Google Scholar] [CrossRef]
  11. Türkoğlu, A.; Haliloğlu, K.; Tosun, M.; Bujak, H.; Eren, B.; Demirel, F.; Szulc, P.; Karagöz, H.; Selwet, M.; Özkan, G.; et al. Ethyl methanesulfonate (EMS) mutagen toxicity-induced DNA damage, cytosine methylation alteration, and iPBS-retrotransposon polymorphisms in wheat (Triticum aestivum L.). Agronomy 2023, 13, 1767. [Google Scholar] [CrossRef]
  12. Fonseca, R.; Capel, C.; Nieto-Canseco, R.; Ortiz-Atienza, A.; Bretones, S.; López-Fábregas, J.D.; Quevedo-Colmena, A.S.; Lebrón, R.; Barragán-Lozano, T.; Villalobos-Ramírez, V.; et al. A tomato EMS-mutagenized population provides new valuable resources for gene discovery and breeding of developmental traits. Plants 2022, 11, 2453. [Google Scholar] [CrossRef] [PubMed]
  13. Siddique, M.I.; Back, S.; Lee, J.H.; Jo, J.; Jang, S.; Han, K.; Venkatesh, J.; Kwon, J.K.; Jo, Y.D.; Kang, B.C. Development and characterization of an ethyl methane sulfonate (EMS) induced mutant population in Capsicum annuum L. Plants 2020, 9, 396. [Google Scholar] [CrossRef] [PubMed]
  14. Puripunyavanich, V.; Chanchula, N.; Maikaeo, L.; Limtiyayothin, M.; Orpong, P.; Tamman, A.; Piriyaphattarakit, A. Effects of Ethyl Methanesulfonate on Mutation Induction in Chrysanthemum spp. TiS 2023, 20, 6904. [Google Scholar] [CrossRef]
  15. Chaudhary, J.; Alisha, A.; Bhatt, V.; Chandanshive, S.; Kumar, N.; Mir, Z.; Kumar, A.; Yadav, S.K.; Shivaraj, S.M.; Sonah, H.; et al. Mutation breeding in tomato: Advances, applicability and challenges. Plants 2019, 8, 128. [Google Scholar] [CrossRef]
  16. Jabeen, A.; Mir, J.I.; Malik, G.; Yasmeen, S.; Ganie, S.A.; Rasool, R.; Hakeem, K.R. Biotechnological interventions of improvement in cabbage (Brassica oleracea var. capitata L.). Sci. Hortic. 2024, 329, 112966. [Google Scholar] [CrossRef]
  17. Subramaniam, R.; Kumar, V.S. Ethyl methanesulphonate (EMS)-mediated mutagenesis induces genetic and morphological variations in eggplant (Solanum melongena L.). Int. J. Plant Biol. 2023, 14, 714–728. [Google Scholar] [CrossRef]
  18. Benzie, I.F.; Choi, S.W. Antioxidants in food: Content, measurement, significance, action, cautions, caveats, and research needs. Adv. Food Nutr. Res. 2014, 71, 1–53. [Google Scholar]
  19. de Lima Cherubim, D.J.; Buzanello Martins, C.V.; Oliveira Fariña, L.; da Silva de Lucca, R.A. Polyphenols as natural antioxidants in cosmetics applications. J. Cosmet. Dermatol. 2020, 19, 33–37. [Google Scholar] [CrossRef]
  20. Yan, W.; Frégeau-Reid, J. Genotype by yield* trait (GYT) biplot: A novel approach for genotype selection based on multiple traits. Sci. Rep. 2018, 8, 8242. [Google Scholar] [CrossRef]
  21. Luo, S.; Wang, K.; Li, Z.; Li, H.; Shao, J.; Zhu, X. Salicylic acid enhances cadmium tolerance and reduces its shoot accumulation in Fagopyrum tataricum seedlings by promoting root cadmium retention and mitigating oxidative stress. Int. J. Mol. Sci. 2022, 23, 14746. [Google Scholar] [CrossRef] [PubMed]
  22. Wang, Y.; Fang, Y.; Ning, S.; Xia, L.; Zhan, J.; Yang, Z.; Cheng, C.; Lou, Q.; Li, J.; Chen, J. QTL mapping for ovary-and fruit-related traits in Cucumis sativus-c. hystrix introgression line IL. Genes 2023, 14, 1133. [Google Scholar] [CrossRef]
  23. Arashi, M.; Roozbeh, M.; Hamzah, N.A.; Gasparini, M. Ridge regression and its applications in genetic studies. PLoS ONE 2021, 16, e0245376. [Google Scholar] [CrossRef]
  24. Páez, A.; Boisjoly, G. Exploratory Data Analysis. In Discrete Choice Analysis with R; Springer International Publishing: Cham, Switzerland; Singapore, 2023; pp. 25–64. [Google Scholar]
  25. Cicevan, R.; Sestras, A.F.; Plazas, M.; Boscaiu, M.; Vilanova, S.; Gramazio, P.; Vicente, O.; Prohens, J.; Sestras, R.E. Biological traits and genetic relationships amongst cultivars of three species of tagetes (Asteraceae). Plants 2022, 11, 760. [Google Scholar] [CrossRef] [PubMed]
  26. Dostalíková, L.; Hlásná Čepková, P.; Janovská, D.; Svoboda, P.; Jágr, M.; Dvořáček, V.; Viehmannová, I. Nutritional evaluation of quinoa genetic resources growing in the climatic conditions of central Europe. Foods 2023, 12, 1440. [Google Scholar] [CrossRef]
  27. Vescio, R.; Abenavoli, M.R.; Araniti, F.; Musarella, C.M.; Sofo, A.; Laface, V.L.A.; Spampinato, G.; Sorgonà, A. The assessment and the within-plant variation of the morpho-physiological traits and vocs profile in endemic and rare salvia ceratophylloides ard (lamiaceae). Plants 2021, 10, 474. [Google Scholar] [CrossRef]
  28. Santos, K.S.D.; Passos, A.R.; Silva, L.C.C.; Silva, A.L.D.; Tanan, T.T. Genetic variability of Physalis ixocarpa and P. philadelphica from physicochemical fruit traits. Pesqui. Agropecu. Bras. 2022, 56, e01534. [Google Scholar] [CrossRef]
  29. Trevisani, N.; Schmit, R.; Beck, M.; Guidolin, A.F.; Coimbra, J.L.M. Selection of fisális populations for hybridization, based on fruit traits. Rev. Bras. Frutic. 2016, 38, e-568. [Google Scholar] [CrossRef]
  30. Antúnez-Ocampo, O.M.; Serafín, C.I.; Mendoza-Onofre, L.E.; Sandoval-Villa, M.; Santacruz-Varela, A.; De La Cruz-Torres, E.; Aureliano, P.L. Growth dynamics of morphological and reproductive traits of Physalis peruviana L. M1 plants obtained from seeds irradiated with gamma rays. Not. Bot. Horti. Agrobot. 2020, 48, 200–209. [Google Scholar] [CrossRef]
  31. Khan, M.H.; Tyagi, S.D. Studies on effectiveness and efficiency of gamma rays, EMS and their combination in soybean (Glycine max (L.) Merrill). J. Plant Breed. Crop Sci. 2010, 2, 55–58. [Google Scholar]
  32. Thakur, G.; Paul, S.; Kumar, A. Mutagenic effectiveness and efficiency of ethyl methane sulphonate (EMS) mutagen in linseed (Linum usitatissimum L.). J. Oilseeds Res. 2020, 37, 260–266. [Google Scholar]
  33. Wani, M.R.; Khan, S.; Kozgar, M.I. Induced chlorophyll mutations. I. Mutagenic effectiveness and efficiency of EMS, HZ and SA in mungbean. Front. Agric. China 2011, 5, 514–518. [Google Scholar] [CrossRef]
  34. Shenstone, E.; Lippman, Z.; Van Eck, J. A review of nutritional properties and health benefits of Physalis species. Plant Foods Hum. Nutr. 2020, 75, 316–325. [Google Scholar] [CrossRef]
  35. Dumanović, J.; Nepovimova, E.; Natić, M.; Kuča, K.; Jaćević, V. The significance of reactive oxygen species and antioxidant defense system in plants: A concise overview. Front. Plant Sci. 2021, 11, 552969. [Google Scholar] [CrossRef] [PubMed]
  36. Fujita, M.; Hasanuzzaman, M. Approaches to enhancing antioxidant defense in plants. Antioxidants 2022, 11, 925. [Google Scholar] [CrossRef]
  37. Hasanuzzaman, M.; Bhuyan, M.B.; Zulfiqar, F.; Raza, A.; Mohsin, S.M.; Mahmud, J.A.; Fujita, M.; Fotopoulos, V. Reactive oxygen species and antioxidant defense in plants under abiotic stress: Revisiting the crucial role of a universal defense regulator. Antioxidants 2020, 9, 681. [Google Scholar] [CrossRef]
  38. Ahanger, M.A.; Tomar, N.S.; Tittal, M.; Argal, S.; Agarwal, R. Plant growth under water/salt stress: ROS production; antioxidants and significance of added potassium under such conditions. Physiol. Mol. Biol. Plants 2017, 23, 731–744. [Google Scholar] [CrossRef] [PubMed]
  39. Rashwan, M.R.A.; Khalifa, A.H.; Abo Zeiad, F.K.; Mohamed, M.I.A. Nutrient and Phytochemical Compounds of Persimmon and Husk Tomato. Assiut J. Agric. Sci. 2017, 48, 102–112. [Google Scholar]
  40. Cagnato, C. Shedding light on the nightshades (solanaceae) used by the ancient Maya: A review of existing data, and new archeobotanical (macro-and microbotanical) evidence from archeological sites in Guatemala. Econ. Bot. 2018, 72, 180–195. [Google Scholar] [CrossRef]
  41. Leung, C.C.; Tarté, D.A.; Oliver, L.S.; Wang, Q.; Gendron, J.M. Systematic characterization of photoperiodic gene expression patterns reveals diverse seasonal transcriptional systems in Arabidopsis. PLoS Biol. 2023, 21, e3002283. [Google Scholar] [CrossRef]
  42. Schroeder, L.; Robles, V.; Jara-Arancio, P.; Lapadat, C.; Hobbie, S.E.; Arroyo, M.T.; Cavender-Bares, J. Drivers of plant diversity, community composition, functional traits, and soil processes along an alpine gradient in the central Chilean Andes. Ecol. Evol. 2024, 14, e10888. [Google Scholar] [CrossRef] [PubMed]
  43. Hegazy, E.M.; Ali, A.O.; El-Sayed, H.S.; Kassem, J.M. Quality properties of husk tomato juice and its impact in stirred probiotic yogurt. Asian Food Sci. J. 2019, 7, 1–10. [Google Scholar] [CrossRef]
Figure 1. Husk tomato Controls used in the experiment. From the left: C1—green, C2—purple, C3—purplish green.
Horticulturae 10 00913 g001
Figure 2. Distribution pattern of Control genotypes and EMS-treated mutants. The gray color shows the Control genotypes, while the red is assigned for the mutants.
Horticulturae 10 00913 g002
Figure 3. Boxplot for the comparison in overall morphological performances. The gray color signifies the Control, whilst the pink symbolizes the mutants of the respective Control. Here, C1, C2, and C3 are the Controls. The symbol on top of the C2 boxplot indicates an outlier.
Horticulturae 10 00913 g003
Figure 4. Biplot of morphological traits and mutants. The morphological traits are indicated in blue, whilst the EMS treatments are displayed in red. PH: plant height, FRDM: fruit diameter, FRL: fruit length, FRW: fruit weight, TB: number of total branches, FPB: fruits per branch, TF: total fruit.
Horticulturae 10 00913 g004
Figure 5. (a) Performance trends in Control C1 and mutants considering morphological parameters. (b) Performance trends in Control C2 and mutants considering morphological parameters. (c) Performance trends in Control C3 and mutants considering morphological parameters. Specific traits are designated with distinct colors. Separate letters imply a statistically significant distinction at the 5% significance level, according to Tukey’s HSD test. PH: plant height, FRDM: fruit diameter, FRL: fruit length, FRW: fruit weight, TB: number of total branches, FPB: fruits per branch, TF: total fruit.
Horticulturae 10 00913 g005
Figure 6. Morphological variations in EMS-treated mutants.
Horticulturae 10 00913 g006
Figure 7. Distribution pattern of Control genotypes and EMS-treated mutants for the biochemical traits. The gray color represents the Control genotypes, whereas the red is used for mutants.
Horticulturae 10 00913 g007
Figure 8. Performance trends in control C1 and mutants. Distinct colors symbolize particular biochemical characteristics, and their associated boxplots are displayed on the right side of the graph. Separate letters imply a statistically significant distinction at the 5% significance level, according to Tukey’s HSD test. Phen: Phenol, Antiox: Antioxidant, Fcha: Fruit chlorophyll a, Fchb: Fruit chlorophyll b, Lcha: Leaf chlorophyll a, Lchb: Leaf chlorophyll b.
Horticulturae 10 00913 g008
Figure 9. Performance trends in control C2 and mutants. Distinct colors symbolize particular biochemical characteristics, and their associated boxplots are displayed on the right side of the graph. Separate letters imply a statistically significant distinction at the 5% significance level, according to Tukey’s HSD test. Phen: Phenol, Antiox: Antioxidant, Fcha: Fruit chlorophyll a, Fchb: Fruit chlorophyll b, Lcha: Leaf chlorophyll a, Lchb: Leaf chlorophyll b.
Horticulturae 10 00913 g009
Figure 10. Performance trends in control C3 and mutants. Distinct colors are used to symbolize particular biochemical characteristics, and their related boxplots are displayed on the right side of the graph. The red dot on top of the phenol boxplot indicates an outlier. Separate letters imply a statistically significant distinction at the 5% significance level, according to Tukey’s HSD test. Phen: Phenol, Antiox: Antioxidant, Fcha: Fruit chlorophyll a, Fchb: Fruit chlorophyll b, Lcha: Leaf chlorophyll a, Lchb: Leaf chlorophyll b.
Horticulturae 10 00913 g010
Figure 11. Biplot of biochemical traits and mutants. The biochemical traits are indicated by the color blue, whilst the EMS treatments are represented by the color red. Antiox: Antioxidant, Phen: Phenol, Fcha: Fruit chlorophyll a, Fchb: Fruit chlorophyll b, Lcha: Leaf chlorophyll a, Lchb: Leaf chlorophyll b.
Horticulturae 10 00913 g011
Figure 12. Distribution pattern of Control genotypes and EMS-treated mutants for mineral contents. The gray color represents the Control genotypes, while the red is assigned for the mutants.
Horticulturae 10 00913 g012
Figure 13. Performance trends in Control C1 and mutants regarding the mineral contents. Each mineral is depicted in a distinct color. Separate letters imply a statistically significant distinction at the 5% significance level, according to Tukey’s HSD test.
Horticulturae 10 00913 g013
Figure 14. Performance trends in Control C2 and mutants regarding the mineral contents. Each mineral is represented with a unique color. Separate letters imply a statistically significant distinction at the 5% significance level, according to Tukey’s HSD test.
Horticulturae 10 00913 g014
Figure 15. Performance trends in Control C3 and mutants regarding the mineral contents. Each mineral is highlighted with a unique color. Separate letters imply a statistically significant distinction at the 5% significance level, according to Tukey’s HSD test.
Horticulturae 10 00913 g015
Table 1. Control and mutants used in the experiment. Here, C stands for Control, and T stands for treated mutants.
ControlMutants
C1C1T1Mutant of C1
C1T2
C1T3
C1T4
C1T5
C1T6
C1T7
C2C2T1Mutant of C2
C2T2
C2T3
C2T4
C2T5
C2T6
C2T7
C3C3T1Mutant of C3
C3T2
C3T3
C3T4
C3T5
C3T6
C3T7
Disclaimer/Publisher’s Note: The statements, opinions and data contained in all publications are solely those of the individual author(s) and contributor(s) and not of MDPI and/or the editor(s). MDPI and/or the editor(s) disclaim responsibility for any injury to people or property resulting from any ideas, methods, instructions or products referred to in the content.