Article

The Molecular Biology Analysis for the Growing and Development of Hydrangea macrophylla ‘Endless Summer’ under Different Light and Temperature Conditions

1
Beijing Key Laboratory of Ornamental Plants Germplasm Innovation & Molecular Breeding, China National, Engineering Research Center for Floriculture, College of Landscape Architecture, Beijing Forestry University, Beijing 100083, China
2
Beijing Flower Engineering Technology Research Center, Plant Institute, China National Botanical Garden North Garden, Beijing 100093, China
*
Authors to whom correspondence should be addressed.
These authors contributed equally to this work.
Horticulturae 2024, 10(6), 586; https://doi.org/10.3390/horticulturae10060586
Submission received: 1 April 2024 / Revised: 30 May 2024 / Accepted: 2 June 2024 / Published: 4 June 2024
(This article belongs to the Special Issue Tolerance and Response of Ornamental Plants to Abiotic Stress)

Abstract

:
Hydrangea macrophylla, a celebrated ornamental worldwide, thrives in semi-shaded growth environments in its natural habitat. This study utilizes Hydrangea macrophylla ‘Endless Summer’ as the experimental material to delve into its molecular mechanisms for adapting to semi-shaded conditions. Transcriptome analysis was conducted on leaves from four different natural light growth scenarios, showcasing phenotypic variations. From each sample, we obtained over 276,305,940 clean reads. Following de novo assembly and quantitative assessment, 88,575 unigenes were generated, with an average length of 976 bp. Gene ontology analysis of each control group elucidated the terms associated with the suitable environmental conditions for normal growth, development, and flowering, such as “reproductive bud system development” and “signal transduction”. The exploration of gene interactions and the identification of key genes with strong connectivity were achieved by constructing a protein–protein interaction (PPI) network. The results indicate that hydrangea grows vigorously and blooms steadily under semi-shaded conditions; the photosynthetic efficiency of hydrangea is stabilized through genes related to photosynthesis, such as PHYB, PSBR, FDC, etc. Hormone signal transduction genes like PIN3, LAX2, TIF6B, and EIN3 play important roles in responding to environmental stimulation and regulating growth and development, while genes such as SOC1, COL4/5/16, and AGL24 promote flowering. The expression of genes such as BGLUs and TPSs provides additional energy substances to support flowering.

1. Introduction

As a member of the Hydrangeaceae family, Hydrangea macrophylla is a shrub gaining prominence as the most promising ornamental flower species [1]. Due to its large inflorescences and captivating colors, various species and cultivars of H. macrophylla are applied as cut flowers and potted plants and in landscaping. Notably, the cultivation of blue varieties of H. macrophylla can be achieved through the modification of external conditions. For instance, changing soil pH or introducing exogenous Al3+ can result in a color change in certain infertile flowers of H. macrophylla [2]. To date, horticulturists have cultivated four categories of hydrangea, including Hydrangea macrophylla, Hydrangea arborescens, Hydrangea paniculata, and Hydrangea quercifolia.
H. macrophylla can be seamlessly integrated with other plants in environmental greening, significantly elevating the sense of hierarchy and affinity in landscape design. For instance, when strategically combined with trees during landscape configuration, it produces a positive impact. Trees provide shading, and when complemented by hydrangeas amidst green foliage, they contribute to the softening of the environment and the enhancement of the overall aesthetic appeal. Despite H. macrophylla’s robust adaptability and preference for semi-shaded environments, its flowering period from May to August coincides with intense sunlight. Direct exposure to sunlight may lead to leaf yellowing and burning, resulting in sunburn that adversely affects the ornamental appeal during the flowering season. Conversely, excessive shading impedes photosynthesis due to insufficient light, causing nutrient deficiencies and impacting flowering. Therefore, when cultivating H. macrophylla in open fields, it is advisable to plant them under sparse tree shade or along tree-lined paths. In cases of excessive sunlight, shading measures become necessary. Xu Hui et al. discovered that under 50% light conditions, hydrangea flowers exhibit optimal blooming, with larger inflorescences, flowers, and petals [3].
Light and temperature constantly change under natural conditions, profoundly affecting plant growth and development. Changes in the cultivating environment, especially local lighting and temperature conditions, exerted influences on plants, with plants responding by adjusting developmental programs to adapt to new conditions. Appropriate lighting and temperature promote flowering. Plants perceive light through photoreceptors, such as photosensitive pigment A-E (phyA-E); cryptochrome (CRY); photosensitizers (PHOT), light/oxygen/voltage (LOV), etc. [4]. Temperature sensing relies on a variety of diverse cellular mechanisms, including those encompassing photosensitive pigments activities under warm conditions, the induction of HSPs, and the physical changes in lipid membranes during heat stress. The currently identified photoreceptors appear to work in temperature reactions. For instance, in Arabidopsis (Arabidopsis thaliana), the photosensitive pigment B (phyB) signaling not only responds to light but also reacts to heat, exacerbating disruptions in phyB signaling. Additional temperature-sensing mechanisms recently uncovered in Arabidopsis involve early flowering 3 (ELF3) and the bHLH TF plant pigment interaction factor 7 (PIF7) [5]. These prove the existence of crosstalk between light and temperature reactions.
The strategies employed by plants in response to stress vary significantly among species. However, for most species, stress induces osmotic pressure and ion stress simultaneously at the plant and cellular levels. Heat stress exacerbates this by promoting the accumulation of reactive oxygen species (ROS), leading to damage in the photosynthetic apparatus, particularly PSII, and ultimately resulting in photoinhibition. The ROS serves as a signaling molecule, regulating numerous physiological processes. Excessive ROS accumulation can induce cytotoxic conditions, causing oxidative damage to lipids, proteins, and nucleic acids. In response, plants have evolved both non-enzymatic and enzymatic systems to prevent ROS-caused oxidative damage. Non-enzymatic antioxidants, such as carotenoids, tocopherols, glutathione (GSH), and ascorbic acid, act in conjunction with enzymatic systems comprising superoxide dismutase (SOD), catalase (CAT), ascorbic acid peroxidase (APX), and peroxiredoxin (Prxs). Changes in proteomics and gene expression levels are intricately linked to environmental adaptation for maintaining their normal growth [6]. TFs are likely key players in this process. Genes involved in various pathways have been identified, encompassing signaling, regulation of transcription (especially through abscisic acid-dependent or -independent pathways), production of reactive oxygen species and detoxification, membrane transport, and synthesis of osmoprotectors, such as proline [7].
While considerable attention has been devoted to hydrangea research, the understanding of the molecular mechanism of semi-shaded environment adaptation is still in its infancy. There is a noticeable lack of information to quantitatively assess its long-term resilience to light and temperature, as well as the molecular mechanisms facilitating its smooth growth and development under semi-shaded conditions. Preliminary phenotypic observations indicate that ‘Endless Summer’ tends to wilt during high noon temperatures in summer and does not bloom under forests with high canopy closure, which makes it an ideal subject for the study of the optimal growth of H. macrophylla under semi-shaded conditions. Unraveling the molecular basis of the growth and development of H. macrophylla under suitable conditions is pivotal for addressing the genetic improvement challenge in developing genotypes tolerant to light and temperature stress. Furthermore, identifying the genes involved in maintaining the hydrangea’s normal development and flowering is also a prerequisite for targeting these genes at the biotechnological level (such as through gene enrichment, etc.) to enhance their resistance to light and temperature stress.

2. Materials and Methods

2.1. Experimental Materials and Procedures

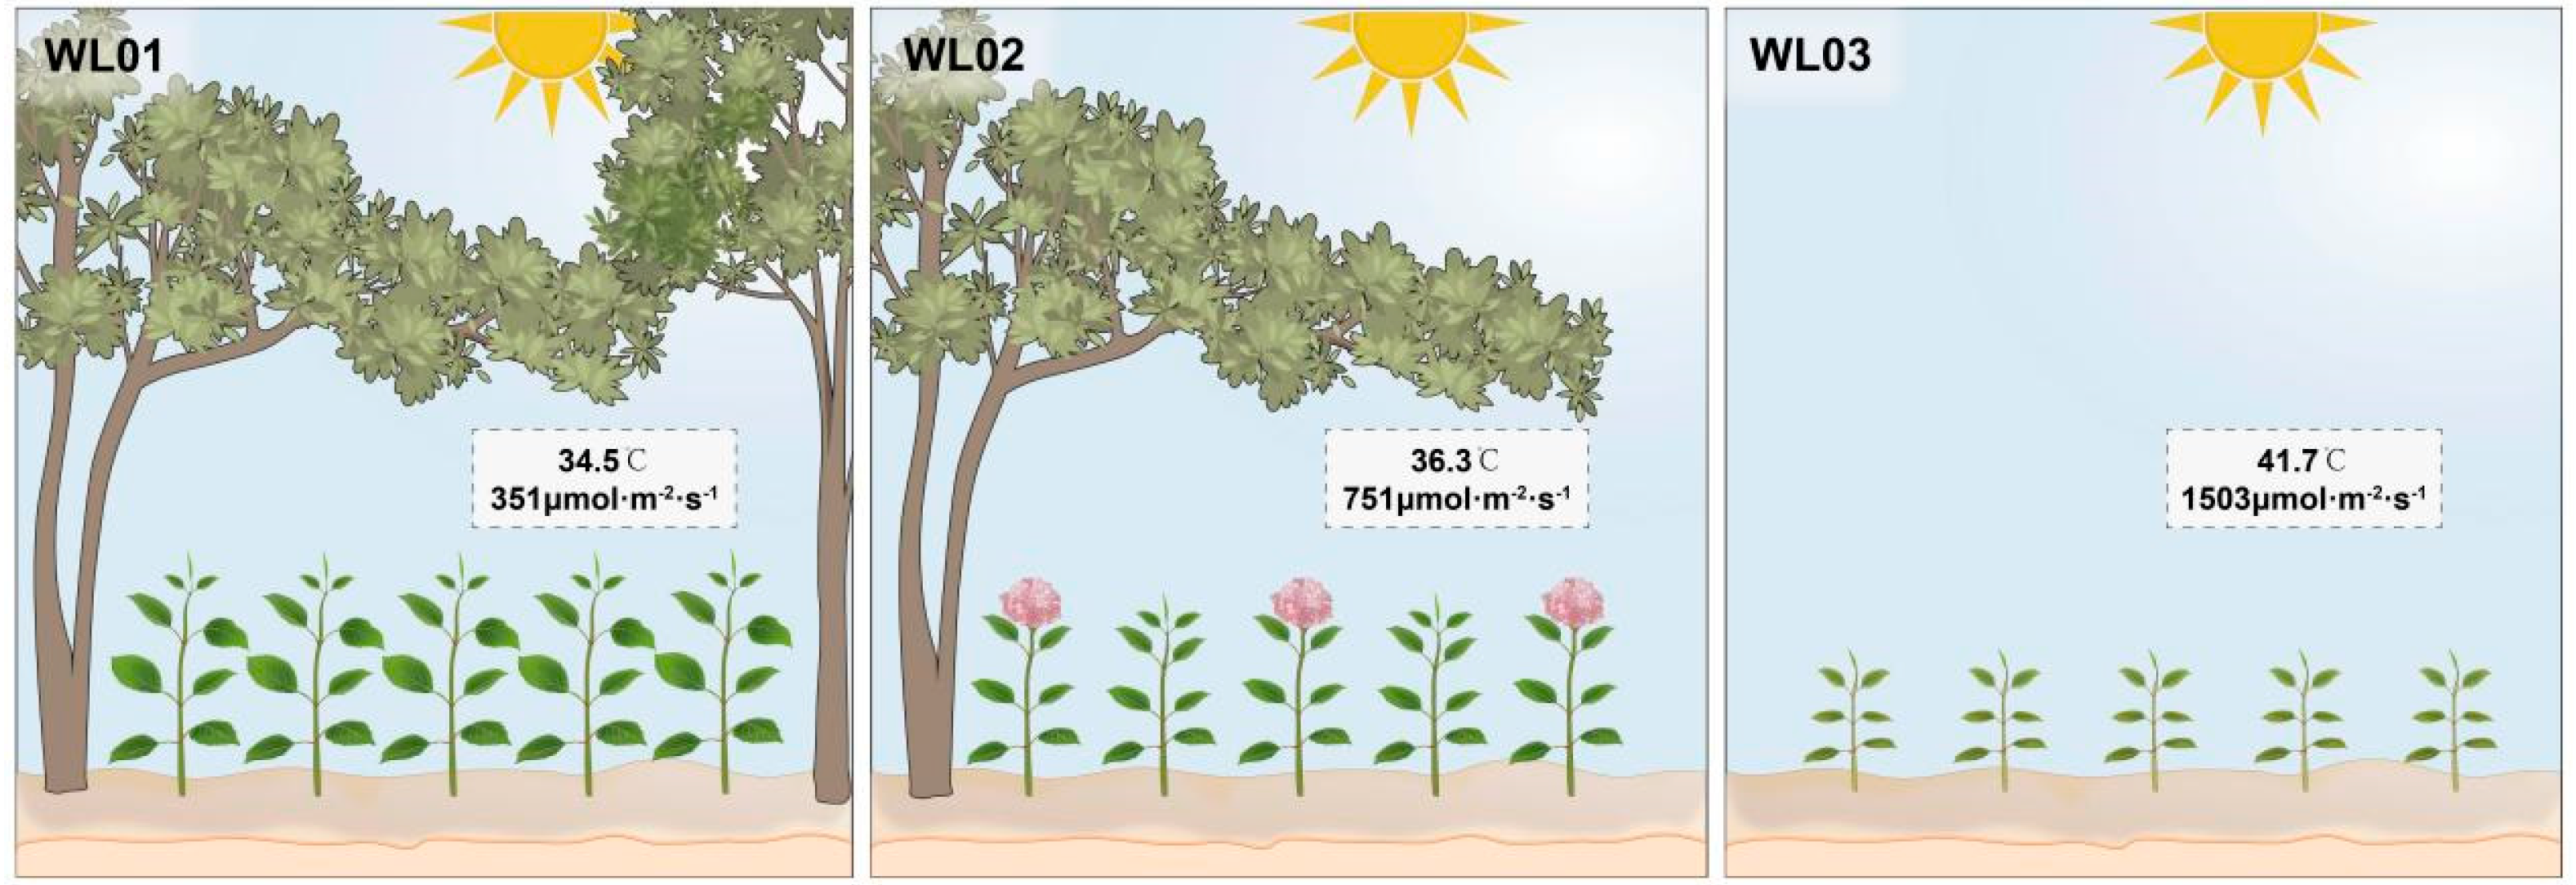
Two-year potted seedlings of H. macrophylla ‘Endless Summer’ propagated by cuttings were transplanted to an open field for growth in April, during which normal water and fertilizer management was carried out. After two months of growth, leaf samples were collected on 23 June 2022, at noon, under continuously sunny conditions. The maximum and minimum daily temperatures of the experimental site for the month are illustrated in Figure 1. Light intensity and leaf surface temperatures were measured using a CL-500A spectroradiometer (KM, JPN). For treatment WL01, the light intensity was recorded as 351 μmol∙m−2·s−1, with an average leaf surface temperature of 34.5 °C; for WL02, the light intensity was 751 μmol∙m−2·s−1 with an average temperature of 36.3 °C; and for WL03, it was 1503 μmol∙m−2·s−1 with a temperature of 41.7 °C. WL04 was taken after one week of recovery from WL03 to WL02, and the environmental conditions during sampling were the same as for WL02 (Figure 2). From each plant, 4 to 5 mature leaves were selected, previously chosen from the top. The leaves were promptly immersed in liquid nitrogen and preserved at −80 °C for subsequent analyses.

2.2. RNA Extraction, cDNA Library Construction, and Sequencing

Total RNA extraction was carried out using a Trizol reagent kit (Invitrogen, Carlsbad, CA, USA), following professional instructions. The extracted RNA quality was assessed using an Agilent 2100 Bioanalyzer (Agilent Technologies, Palo Alto, CA, USA) and verified through RNase-free agarose gel electrophoresis. Subsequently, eukaryotic mRNA was enriched utilizing Oligo(dT) beads. The enriched mRNA underwent fragmentation into short fragments using a corresponding buffer and was then reversely transcribed into cDNA using the NEBNext Ultra RNA Library Prep Kit for Illumina (NEB #7530, New England Biolabs, Ipswich, MA, USA). The purified double-stranded cDNA fragments underwent end repair, base addition, and ligation to Illumina sequencing adapters. The ligation reaction was purified using AMPure XP beads (1.0×) and subjected to polymerase chain reaction (PCR) amplification. The resulting cDNA library was sequenced using Illumina Novaseq6000 by Gene Denovo Biotechnology Co. (Guangzhou, China).

2.3. Data Quality Control and Sequence Alignment Analysis

For quality control of the raw reads obtained from the sequencing machine, the Fastp tool (version 0.18.0) was employed. Data with low quality, including adapters, unknown nucleotides(N) content exceeding 10%, and bases with a mass value Q ≤ 20 constituting more than 50% of the entire read were eliminated, resulting in the generation of clean reads [8]. Then, the clean reads were assembled using Trinity to construct a unique consensus sequences for a subsequent information analysis [9].

2.4. Gene Expression Quantification and Differential Gene Analysis

Initially, all unigene sequences were aligned against protein databases, specifically the NCBI Non-Redundant protein database, SwissProt protein database, KEGG pathway database, and KOG database, using blast x with an e-value threshold of less than 0.00001. After alignment, we obtained the highest similarity with a given unigene that contained functional annotation information [10]. Subsequently, all the gene expression levels in each sample were calculated to obtain the per kilobase per million mapped fragments (FPKM) value. EdgeR 4.0.2 software was employed for the analysis and normalization of read counts. p-value was computed based on the model, and multiple hypothesis testing correction was performed to derive the false discovery rate (FDR) value, indicating the error detection rate. Following the differential analysis results, genes with FDR < 0.05 and |log2FC| > 1 were chosen as notably differentially expressed candidates. GO and KEGG analyses were then conducted on these differentially expressed genes (DEGs). GO analysis provided all the GO terms significantly enriched in DEGs compared to genome background and filtered the DEGs corresponding to specific biological functions. Pathway-based KEGG pathway analysis was performed to gain further insights into the gene biological functions.

2.5. Trend Analysis of Gene Expression Levels

A heatmap was plotted by https://www.bioinformatics.com.cn (last accessed on 20 February 2024), an online platform for data analysis and visualization. Mfuzz algorithms were used to divide the transcriptome data into different clusters, and the cluster parameter was set to 5 based on the elbow inflection point value calculated by the default parameters. The networks were visualized using Cytoscape v3.9.1 [11].

2.6. Protein–Protein Interaction (PPI) Network Construction

Differential gene–protein interaction networks were analyzed utilizing interaction relationships within the STRING Protein Interaction Database. A subset of DEGs for the included species was extracted from the database, and an interaction network diagram was constructed using Cytoscape 3.9.1. For species not covered in the database, an initial step involved applying blast x alignment to the protein sequences of the reference species included in the STRING database from the target gene set [12]. Subsequently, an interaction network was constructed using protein interaction relationships of reference species identified through the alignment process.

2.7. Real-Time Quantitative PCR Verification

RNA extraction from various treated leaf samples was conducted using the Aidlab Easy Spin Plus RNA Extraction Kit. Extracted RNA integrity was verified through agarose gel electrophoresis, and the concentration was determined using the NanoDrop 2000 spectrophotometer. Reverse transcription of the RNA into cDNA was accomplished using the Aidlab PC54-TRUEscript RT kit (+gDNA Eraser). qRT-PCR primers were designed by Primer Premier 5.0 (Table S1), and the TAKARA TB Green® Premix Ex TaqTM II kit was employed for qRT-PCR detection. The reaction system comprised each upstream and downstream primer of 0.4 μL (10 μmol·L−1), cDNA of 1.0 μL, ddH2O of 3.2 μL, and SYBR Premix Ex Taq of 5.0 μL constituting a total volume of 20 μL. The thermal cycling program involved an initial denaturation at 95 °C for 30 s, followed by 38 cycles of denaturation at 95 °C for 5 s, annealing at 60 °C for 30 s, and extension at 72 °C. The 2−ΔΔCT method was employed to normalize the DEG expressions [13], with RPL34 serving as a reference gene [14]. Three biological replicates were performed.

3. Results

3.1. Growth Status Analysis

In treatment WL01, the growth of plants seemed to be regular. Compared to WL02, the leaves in WL01 exhibited a larger size while the degree of green color was similar to that in WL02, as illustrated in Figure 3. However, no flowering was observed. The leaves in WL02 were of intermediate size compared to WL01 and WL03 (Figure 3), and the plants maintained a similar height to those in WL01 but exhibited a flowering phenotype. Throughout the WL03 period, the leaves were smaller, prominently displaying yellowing and sunburn, as depicted in Figure 3, and the plants were notably shorter. WL04 had smaller yellow leaves but showed a recovery state compared to WL03.

3.2. Sequencing Data Assembly Results

In this study, transcriptome sequencing was conducted on four samples, yielding a total of 41.32 G of high-quality sequence reads. The GC content of the samples was above 45.07%, and the Q30 score was ≥92.14% (Table 1). A total of 151,939 transcript sequences (transcript number) and 54,935 non-redundant gene sequences (unigene number) were obtained with high assembly completeness. Post-assembly, the N50 length of the overlapping fragments was 1561 nt, with an average length of 1042 nt. Single-gene clusters within the length range of 300 to 500 nt constituted 36.1% of the assembly, totaling 19,834. The second-largest group, with lengths ranging from 500 to 1000 nt, accounted for 28.94% of the total. Sequences longer than 2000 nt constituted 13.33% of the total. The high-quality reads produced in this study were deposited in the NCBI SRA database (accession number: PRJNA1109561). To ensure the trustworthiness of the RNA-Seq data, we chose 12 differentially expressed genes (DEGs) for qRT-PCR analysis. The RT-qPCR findings revealed comparable expression patterns between the RNA-Seq and RT-qPCR data, thereby affirming the sequencing results’ precision and reliability (Figure S1).

3.3. Functional Annotation and Expression Analysis of Transcriptome Unigenes

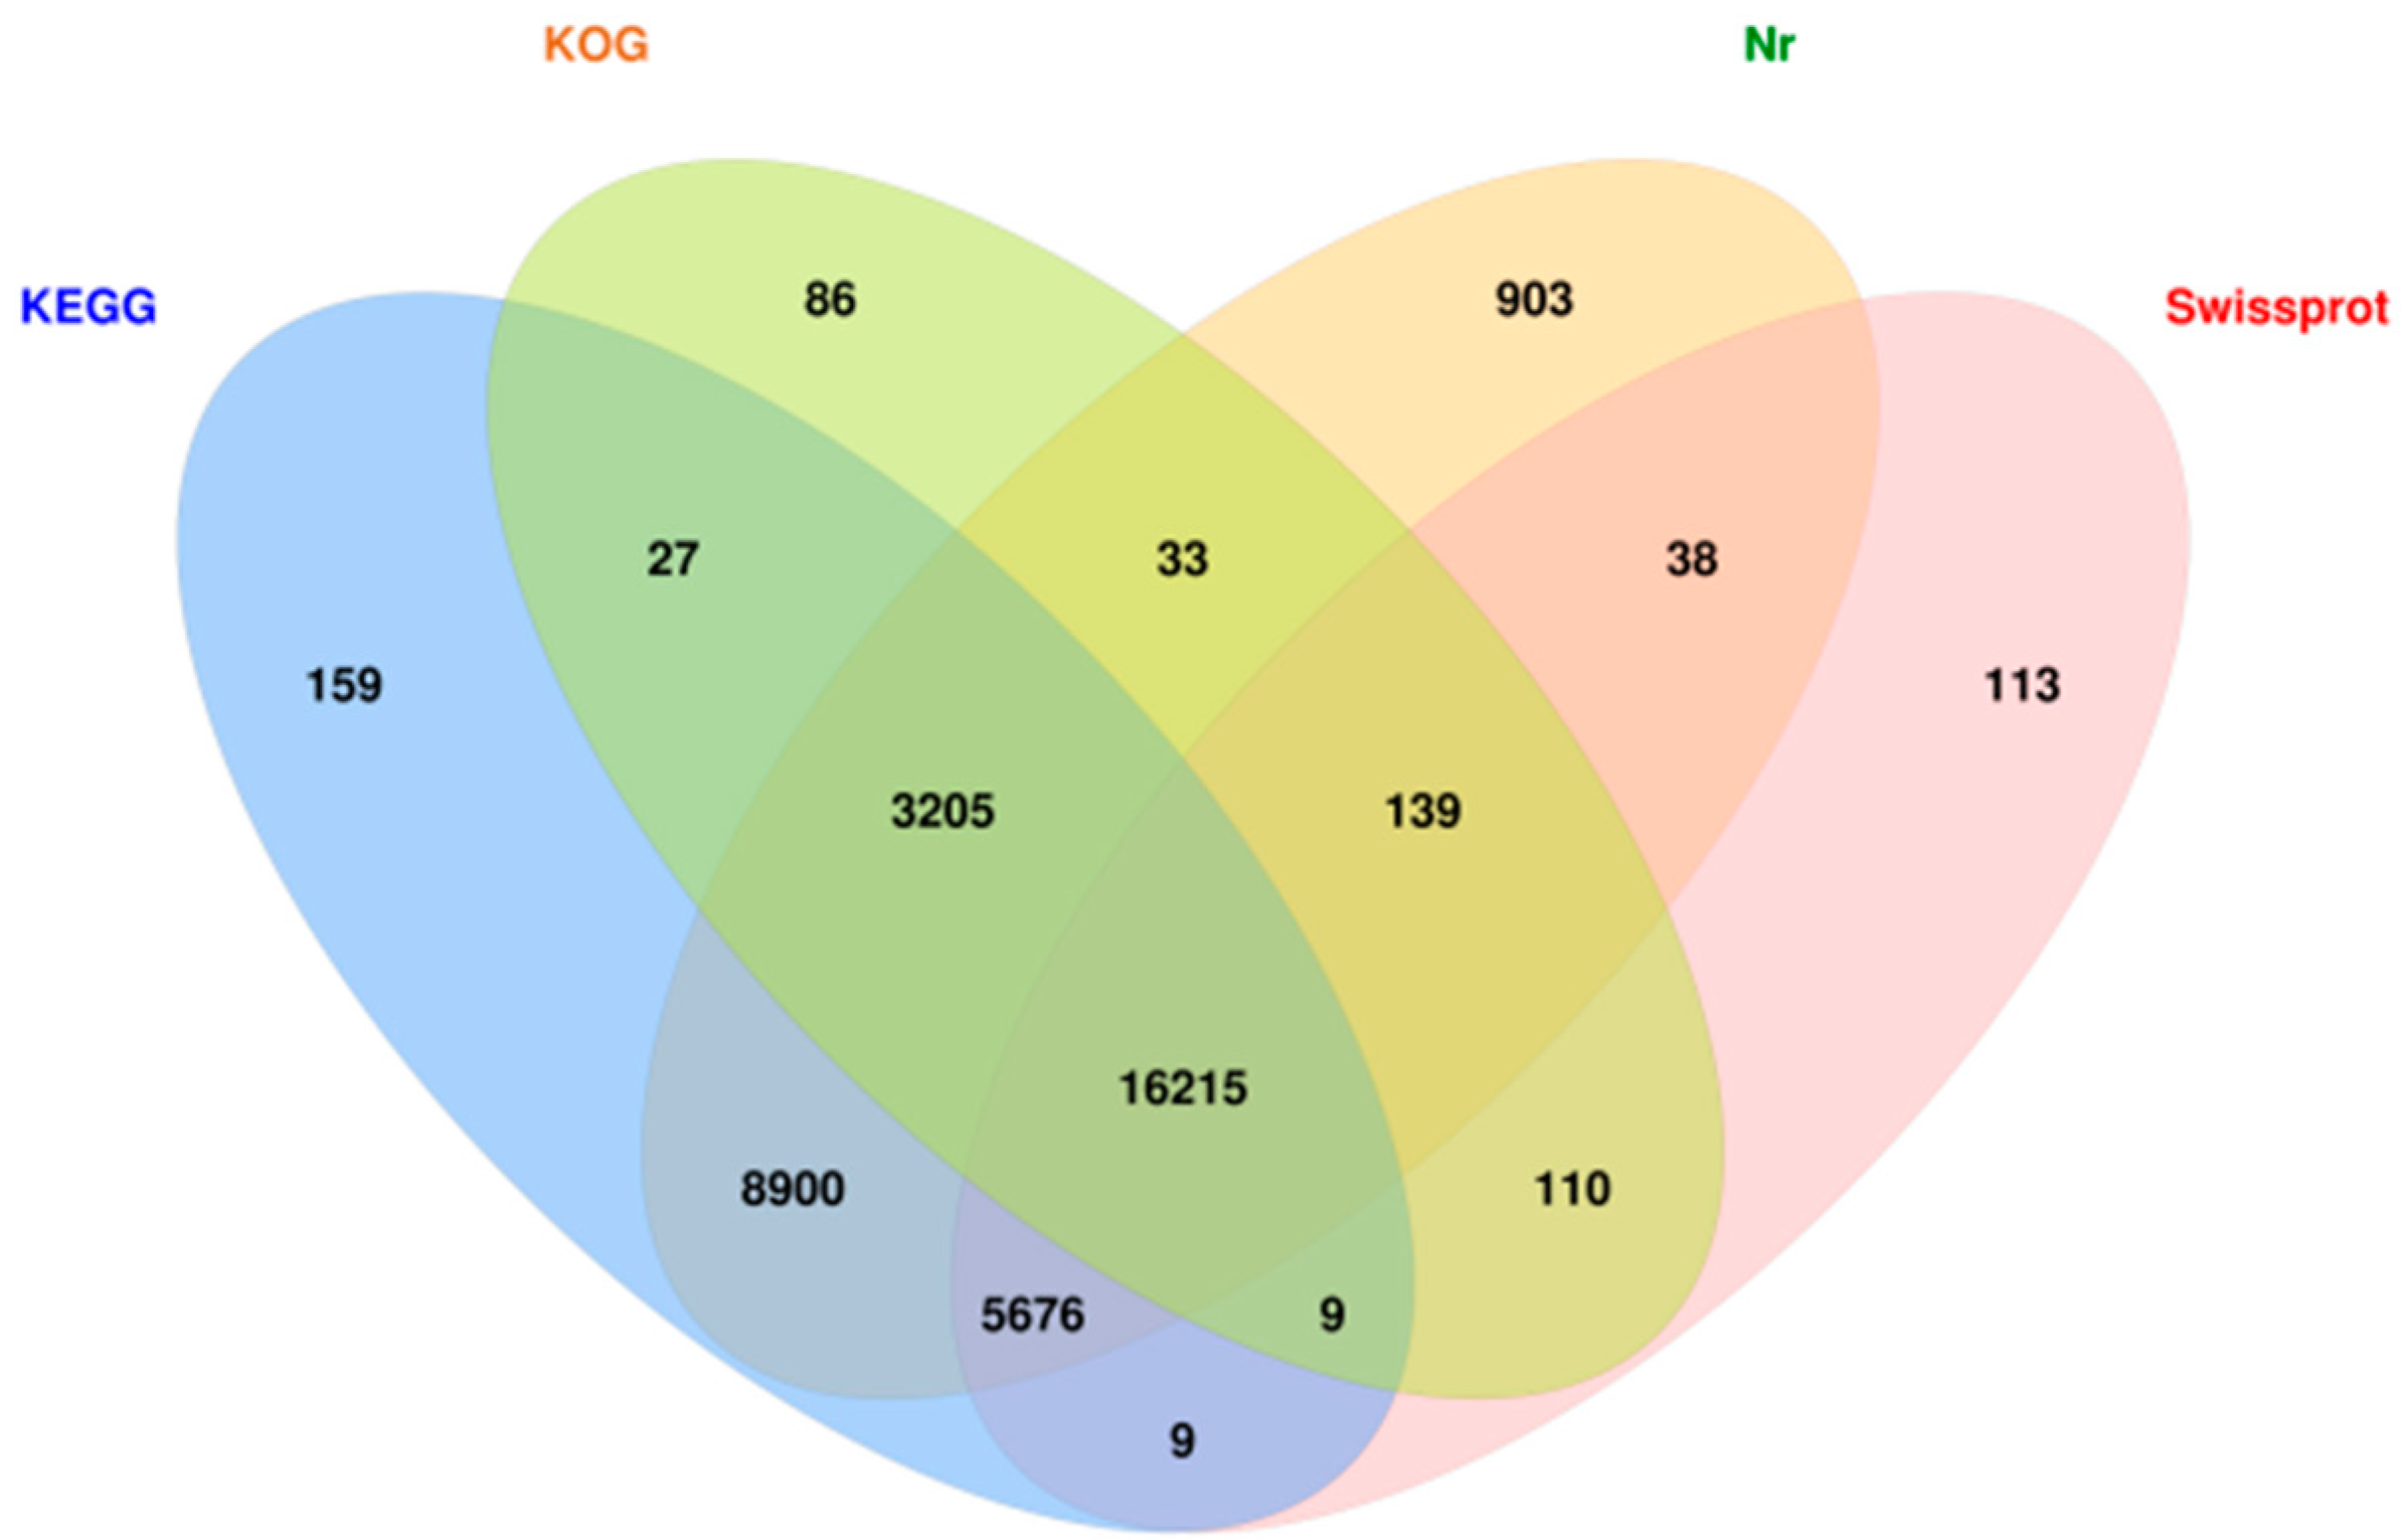
The unigene sequences underwent comparison against the NR, Swissprot, KOG, and KEGG databases for functional annotation (Figure 4). The annotation results are as follows: 27,947 genes (58.48%) were annotated in the NR database, 21,138 genes (44.23%) in the Swissprot database, 5583 genes (11.68%) in the KEGG database, and 15,970 genes (33.41%) in the KOG database (Figure 4). The reads were aligned to the unigene sequences, achieving an alignment rate ranging from 88.84% to 89.73%.

3.4. Gene Ontology Classification of Differentially Expressed Genes

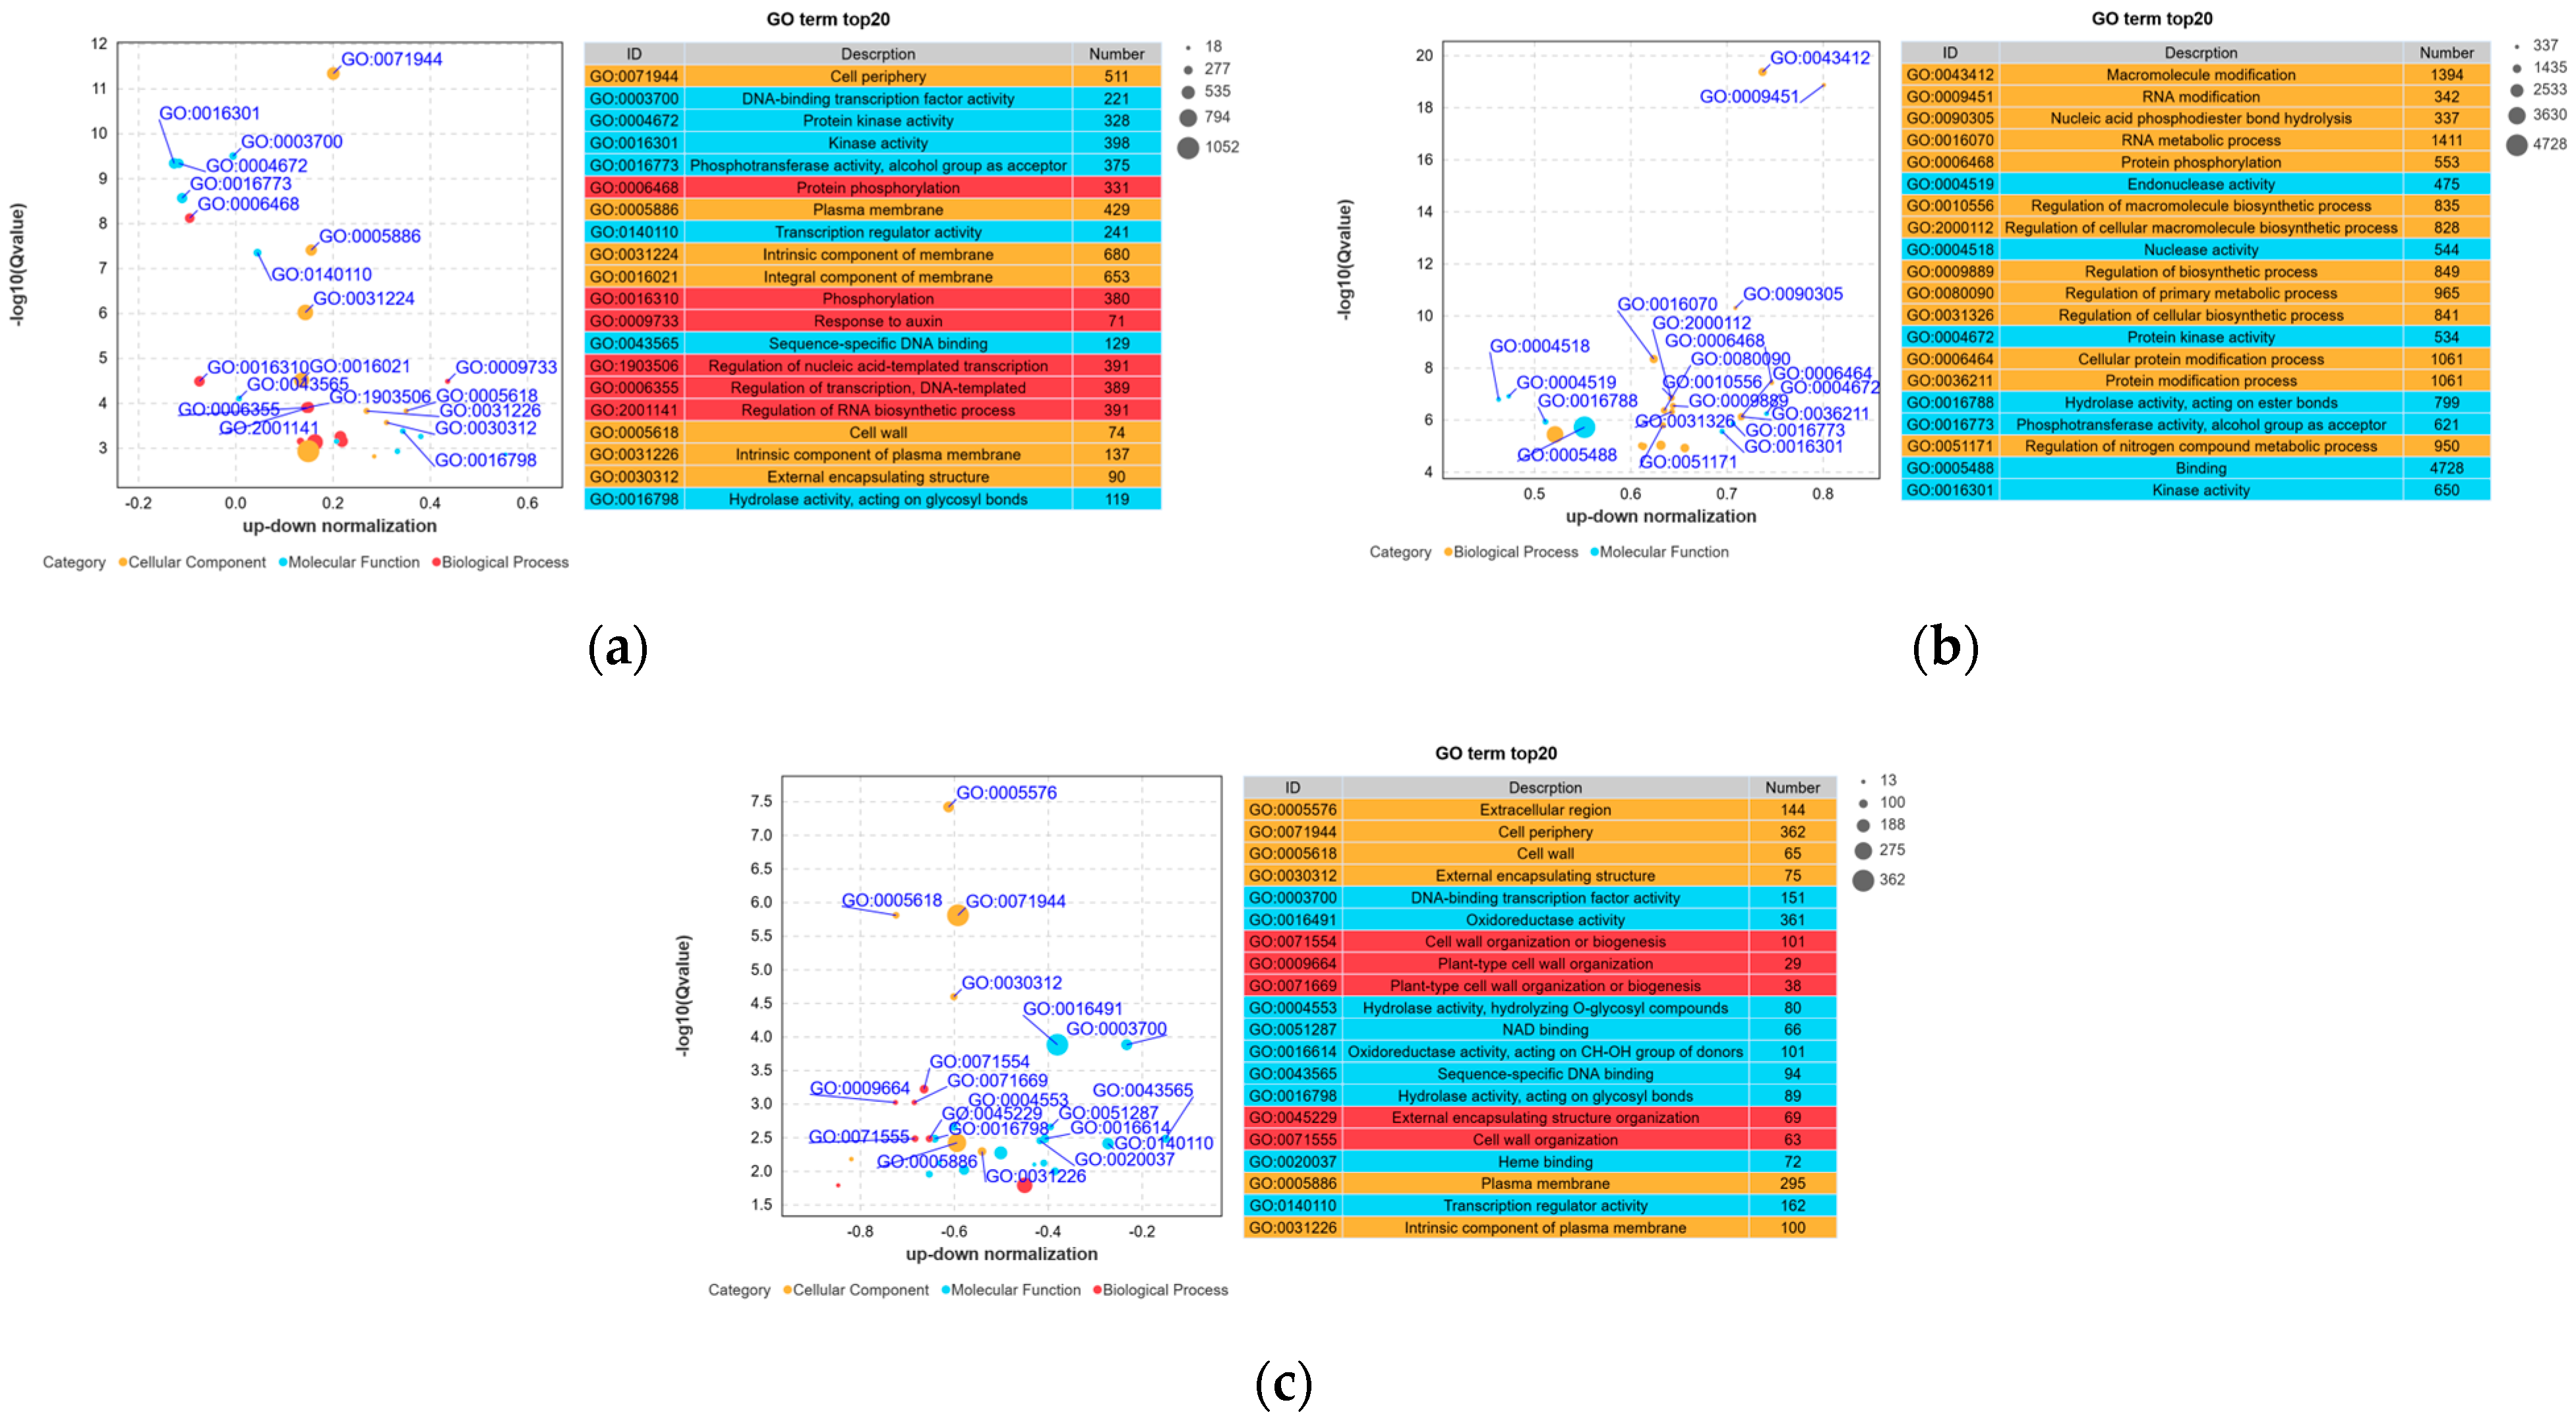
In WL02, compared to WL01 (Figure 5a), 4271 transcripts were significantly upregulated and 3893 transcripts were significantly downregulated. We firmly established DEGs in the significantly enriched GO terminology, dividing them into three primary categories: molecular functions, cellular components, and biological processes. In the biological process category, the most abundant groups were “Protein phosphorylation” (331 genes), “Phosphorylation” (380 genes), and “Response to auxin” (71 genes). Within the molecular function category, “DNA-binding TF activity” (221 genes), “Protein kinase activity” (328 genes), and “Kinase activity” (398 genes) were the most highly represented groups. Regarding cellular components, “Cell periphery” (511 genes), “Plasma membrane” (680 genes), and “Intrinsic component of membrane” (653 genes) were the most represented groups. In the WL03 vs. WL02 comparison (Figure 5b), “macromolecular modification” (1394 genes), “RNA modification” (342 genes), and “nuclear acid photosensitive bond hydrogenation” (337 genes) were three significantly enriched entries in the biological process module. Within the molecular function category module, “Endonuclease activity” (475 genes), “nuclease activity” (544 genes), and “protein kinase activity” (534 genes) were three significantly enriched entries. However, there were no cellular component-related entries in the top 20 significantly enriched entries. For WL02 vs. WL04 (Figure 5c), cell wall-related terms were significantly enriched.

3.5. DEGs Pathway Analysis

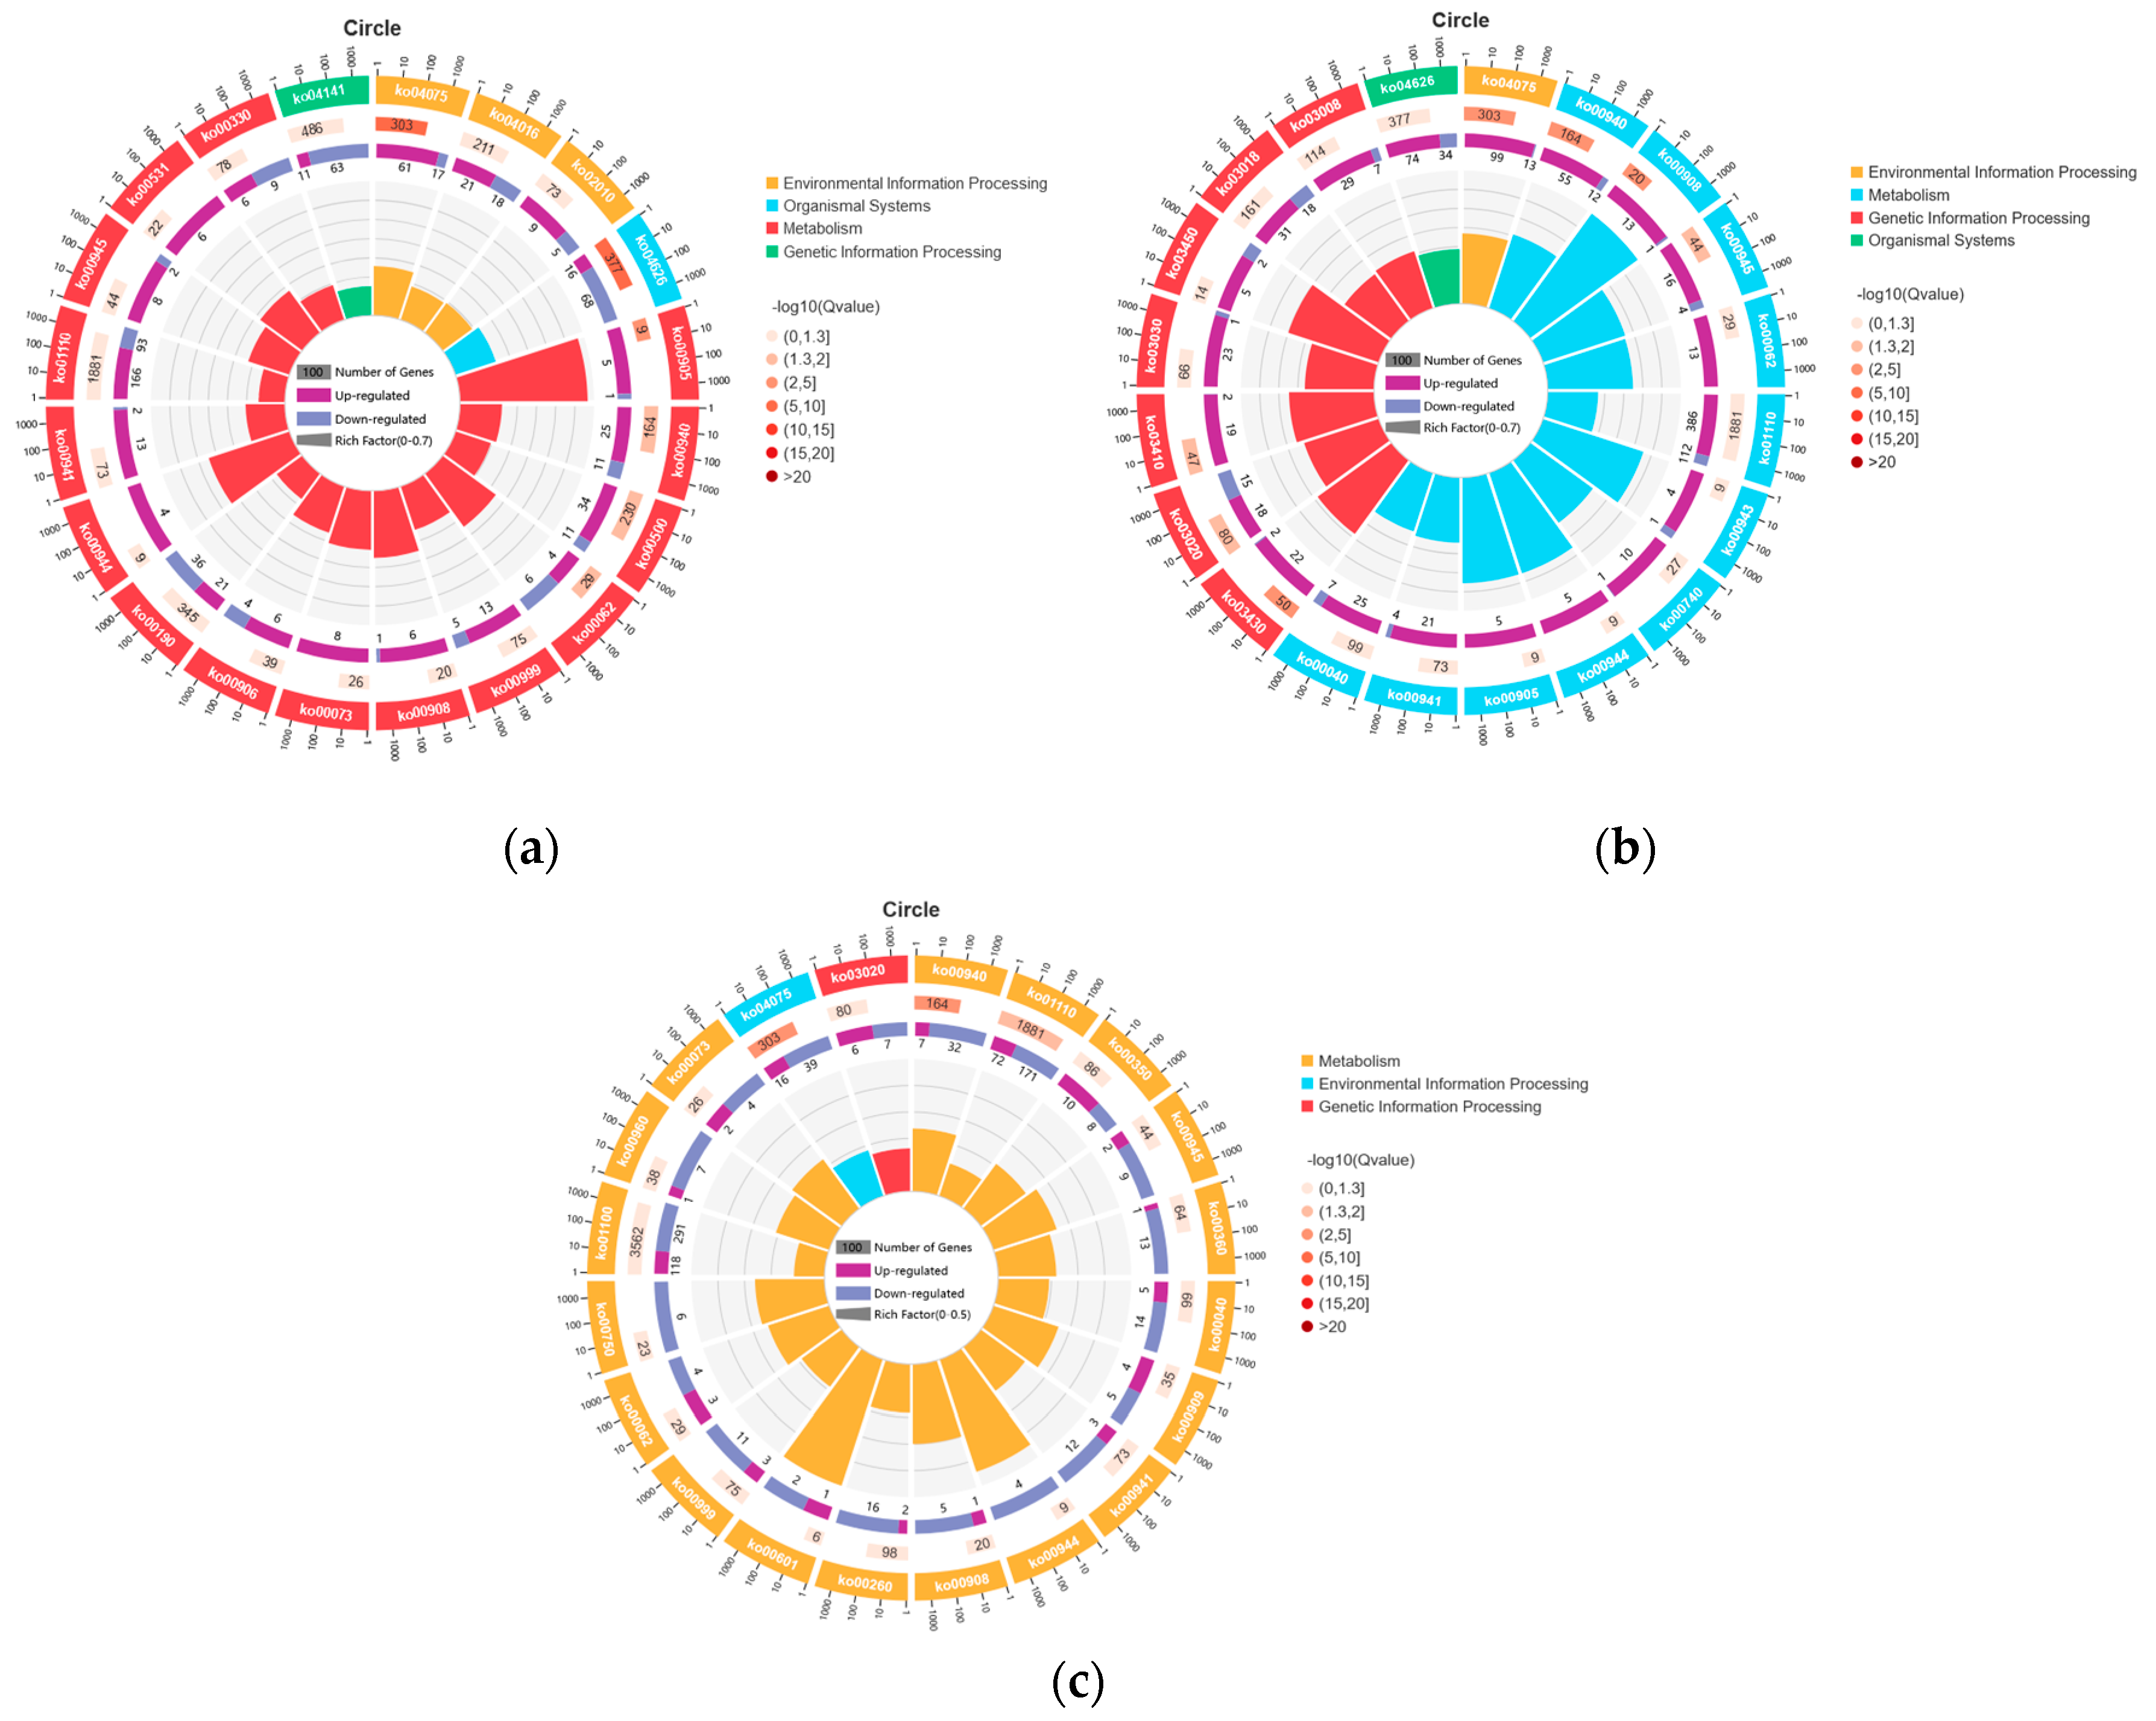
Pathway analysis using the KEGG database was employed to identify the DEG-relevant pathways. In WL01 vs. WL02 (Figure 6a), the KEGG results revealed enrichment in secondary metabolites biosynthesis with 259 DEGs, comprising 166 upregulated and 93 downregulated biomarkers. Plant hormone signal transduction exhibited enrichment with 78 genes, of which 61 were upregulated and 17 downregulated. Starch and sucrose metabolism illustrated enrichment with 45 genes, including 34 upregulated and 11 downregulated genes. Phenylpropanoid biosynthesis exhibited enrichment with 36 genes, of which 25 were upregulated and 11 downregulated. In WL03 vs. WL02 (Figure 6b), secondary metabolites biosynthesis demonstrated enrichment with 498 DEGs, consisting of 386 upregulated and 112 downregulated genes. Plant hormone signal transduction exhibited enrichment with 112 DEGs, including 99 upregulated and 13 downregulated genes. Plant–pathogen interaction showed enrichment with 108 genes, comprising 74 upregulated and 34 downregulated genes. Phenylpropanoid biosynthesis exhibited enrichment with 67 genes, including 55 upregulated and 12 downregulated genes. In WL02 vs. WL04 (Figure 6c), the metabolic pathway enriched up to 409 genes. Biosynthesis of secondary metabolites, plant hormone signal transduction, and phenylpropanoid biosynthesis were found to overlap in the three control groups, indicating that plant hormones and phenylpropanoid work crucially in the H. macrophylla process of adaptation to the environment. Additionally, starch and carbohydrates were identified as related to H. macrophylla flowering under semi-shaded conditions.

3.6. Trend Analysis of Gene Expression Levels

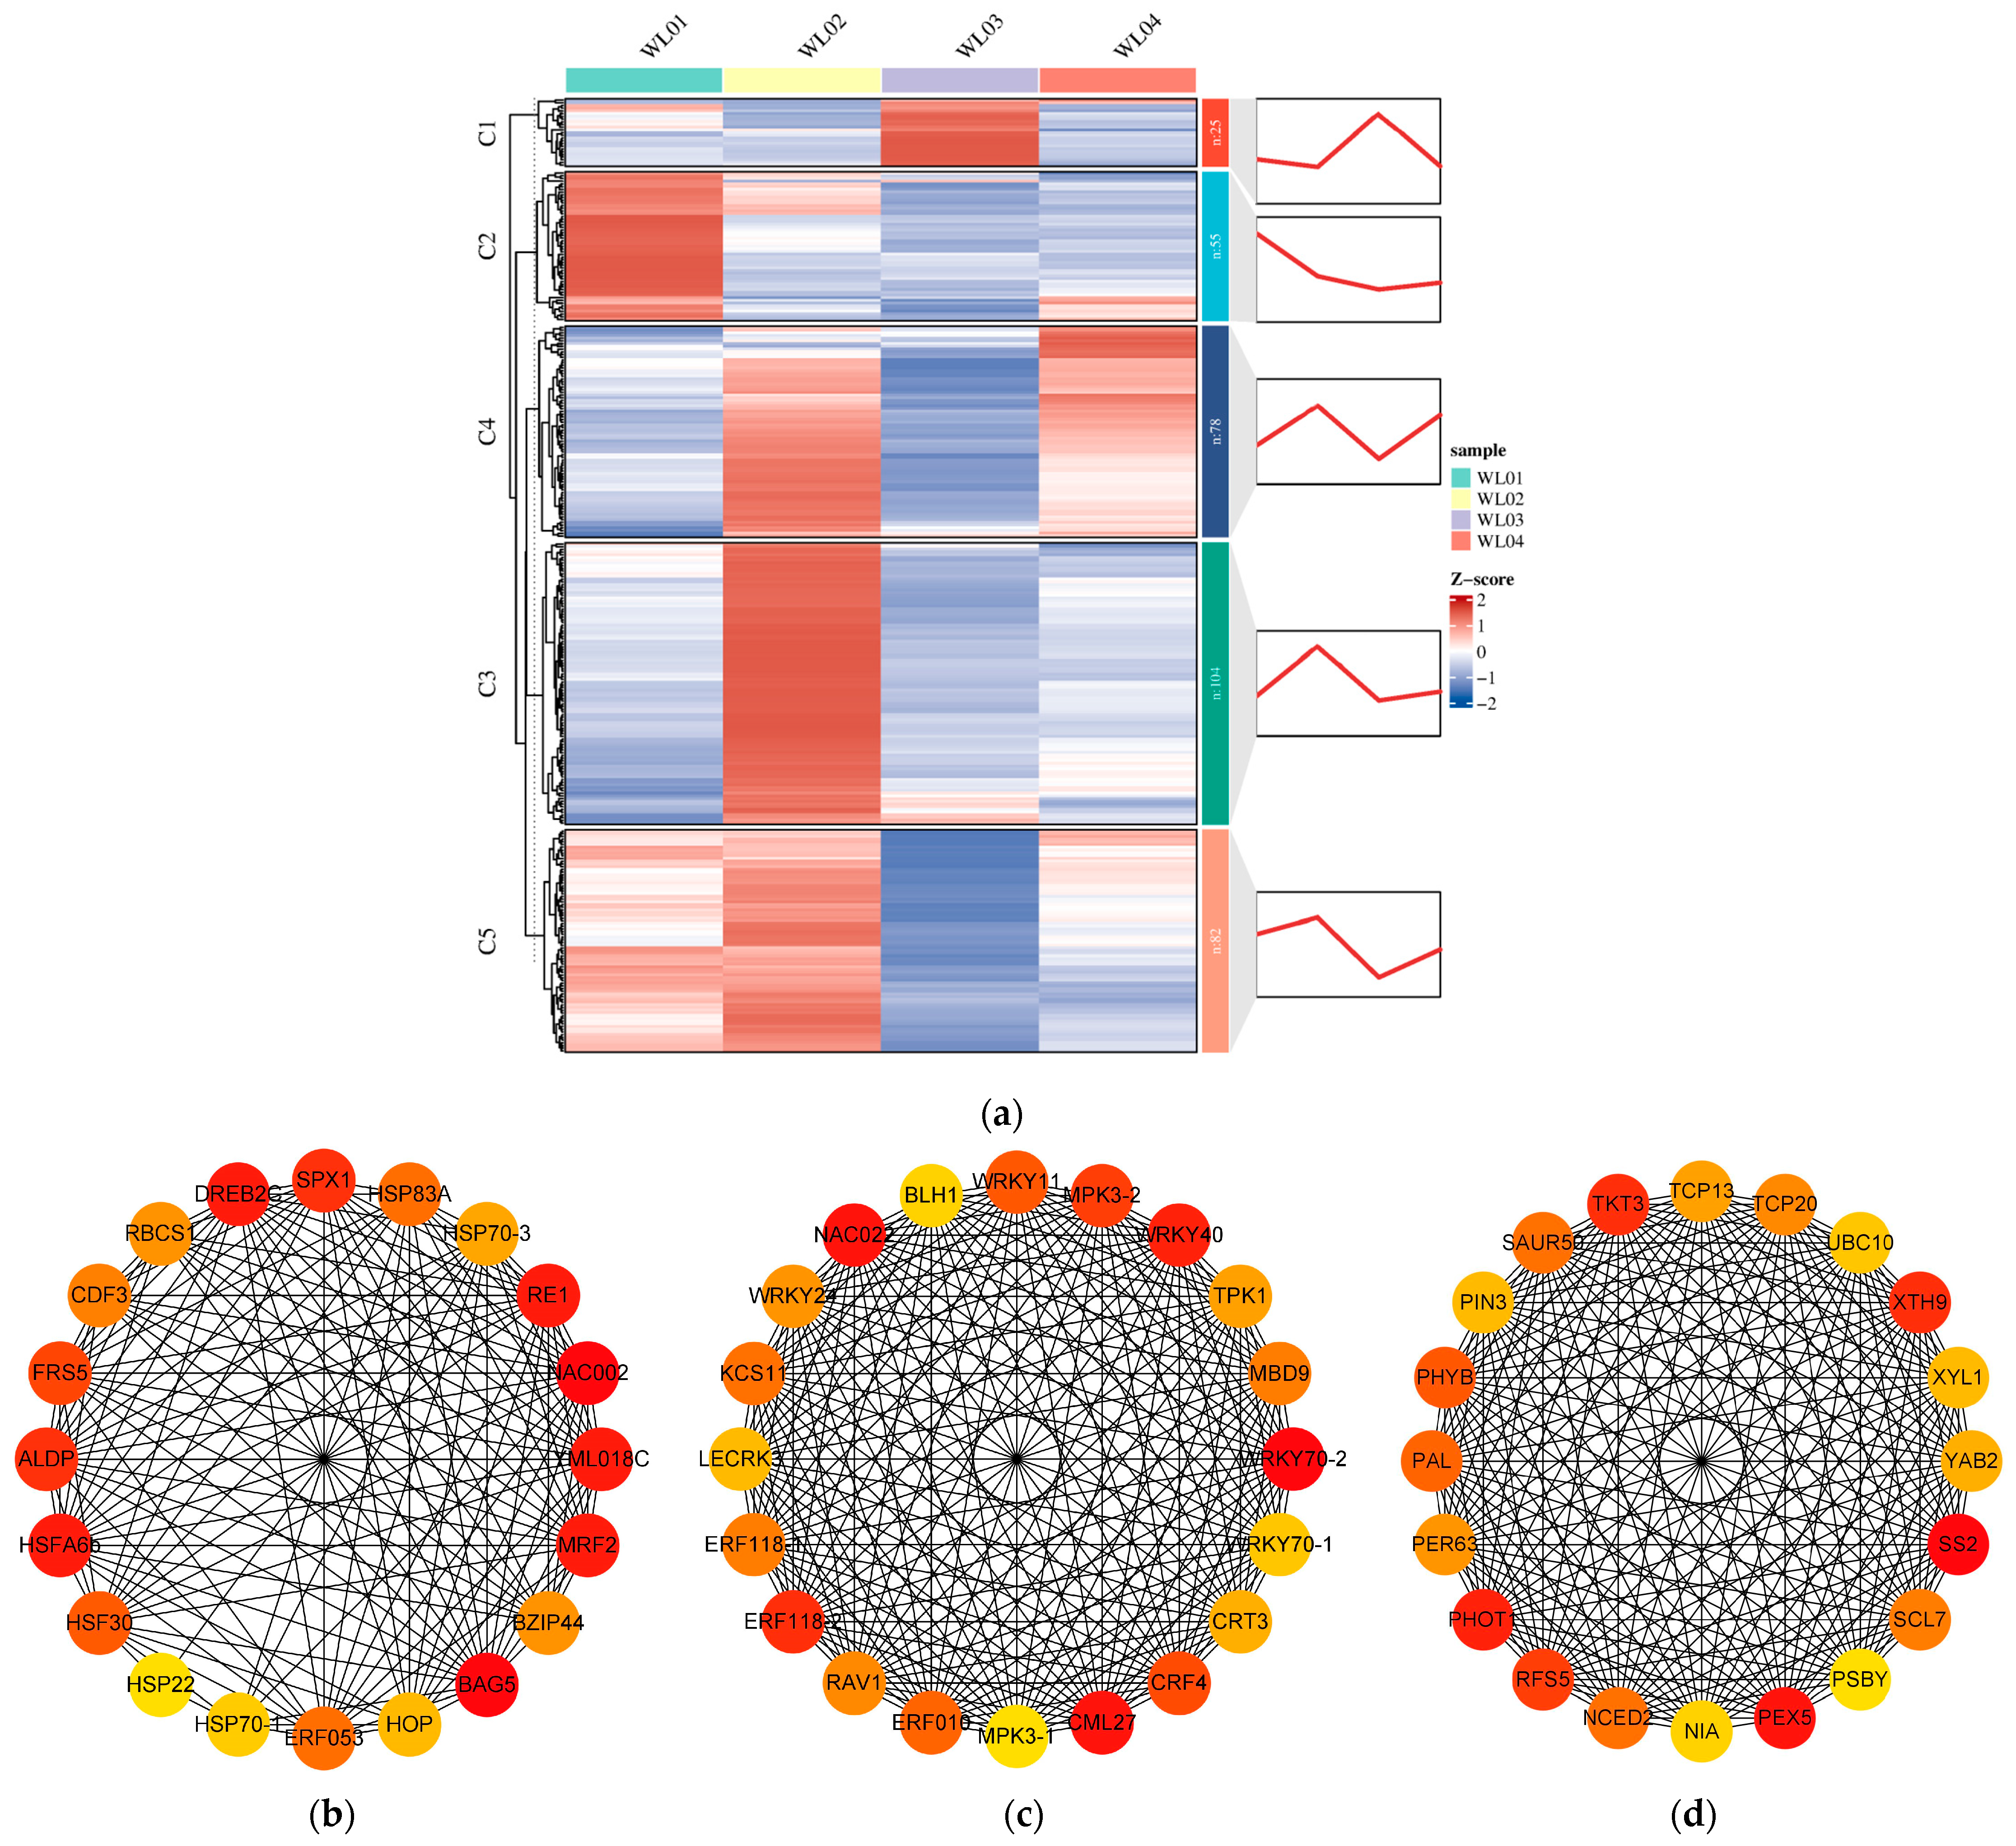
By combining the DEGs involved in the process of environmental adaptation in H. macrophylla with GO functional enrichment and other genes that exhibit significant differences or high expression, this study identified 344 DEGs that are crucial for the growth and development (Table S2). The functional annotation and previous research findings were used to select these genes. Based on pairwise correlations of gene expression, five modules were identified (marked with different colors in Figure 7a). The most obvious feature of cluster 1 is the high expression level in WL03. The top enriched GO terms for this module were “response to light intensity”, “response to reactive oxygen species”, and “response to high light intensity”. The top three enriched KEGG pathways were “Plant-pathogen interaction”, “Phenylpropanoid biosynthesis”, and “MAPK signaling pathway—plant”. The high expression of these genes may be related to high temperature and high light stress, but it is not conducive to plant growth. The expression levels of most genes in cluster 2 were highest in WL01. The top enriched GO terms were “DNA-binding transcription factor activity”, “transcription regulator activity”, and “sequence-specific DNA binding”, and the top KEGG pathways were “Plant-pathogen interaction”, “Phenylpropanoid biosynthesis”, and “MAPK signaling pathway—plant”. Cluster 3 was associated with the WL02. The expression profile of these DEGs peaked during the WL02 stage. The most abundant GO term indicated that the flavonoids and hormones, especially auxin, played a critical role in controlling the lowering and the good growth of plants. The expression level of cluster 4 was high in WL02 and WL04. The most representative GO terms and KEGG pathways were “response to hormone” and “Plant hormone signal transduction”, indicating that the hormone was closely associated with recovery from adversity and maintaining growth. In cluster 5, most of the DEGs maintained high expression levels throughout WL01 and WL02, but significantly decreased in WL03. The expression of these genes may be beneficial for the normal growth of plants (Figures S2 and S3).
The top 20 hub genes were identified by the cytohubba plug-in using the MCC algorithm in Cytoscape 3.9.1 software. In the top 20 hubba genes of cluster 1 (Figure 7b), several genes closely associated with heat tolerance were identified, including heat stress transcription factor (HSF30, HSFA6b), heat shock protein (HSP70-1, HSP70-3, HSP22, HSP83A, HOP), BAG family molecular chaperone regulator (BAG5), along with dehydration-responsive element-binding protein (DREB2C). Meanwhile, in the top 20 hubba genes of cluster 2 (Figure 7c), numerous transcription factors were found, including WRKY family members (WRKY70-1, WRKY70-2, WRKY40, WRKY24, WRKY11), ERF transcription factor family members (ERFR118-1, ERF118-2, ERF010, CRF4), NAC transcription factor family member (NAC022), and RAV transcription factor family member (RAV1). These transcription factors possess intricate functions, and their high expression may potentially impact the reproductive growth of Hydrangea macrophylla. In cluster 3 (Figure 7d), the hub genes have multiple functions, including TCP20, which promotes auxin synthesis [15], SAUR50, an auxin response gene [16]; auxin transporter PIN3 [17]; PHOTO1, a photoreceptor; SCL7, enhancing resistance to abiotic stress [18]; photosensitive signal transduction and photosynthesis-related PHYB, PSBY [19,20], ROS clear genes PEX5 [21], phenylpropane metabolism, PAL, PER63 [22,23]; and YAB2, which promotes plant growth [24]. The high expression of these genes promotes the growth and development of hydrangea.

3.7. PPI Analysis

Biological processes are orchestrated by a complex interplay of proteins and their interactions, often depicted as PPI networks [25]. These PPI networks are constructed using data derived from both wet-lab experiments and computational techniques, with repositories like DIP, STRING, and BioGRID serving as databases. STRING, for instance, amalgamates PPIs from diverse sources, including experimental and computational methods, assigning a comprehensive quality score to each interaction by integrating data from the literature and gene expression profiles [26]. The identification of key protein players and the elucidation of their interaction networks offer invaluable insights into the regulation of plant developmental processes and the intricate interactions between plants and their environment.
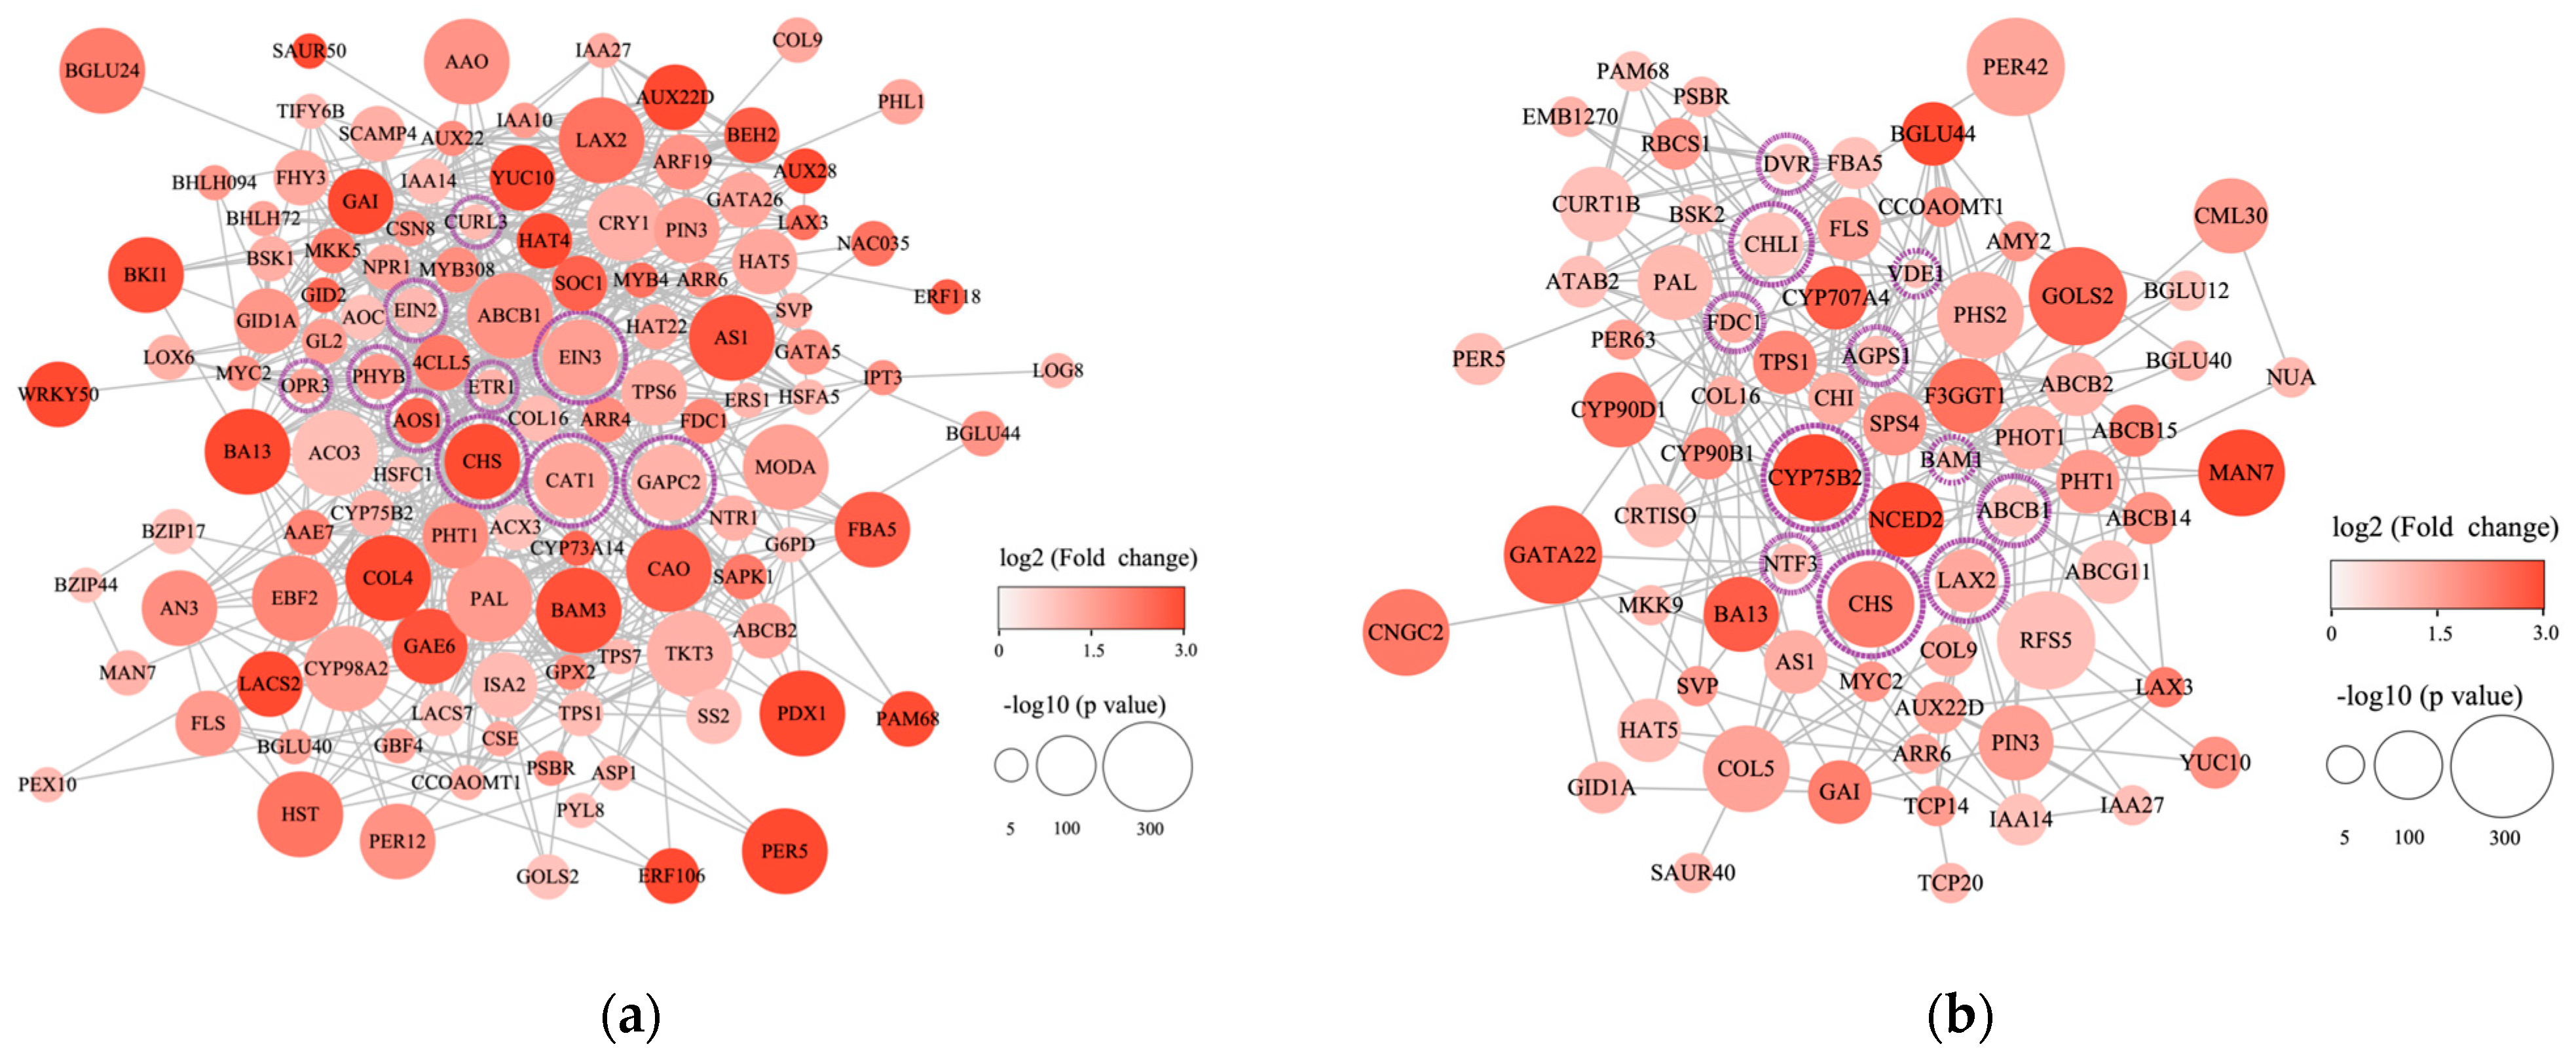
Utilizing the differentially expressed genes, 176 genes were chosen for the construction of a PPI network (Table S3). These genes were selected based on their involvement in pathways related to photoperiod, hormone signal transduction, environmental temperature, ROS, flavonoids, and sugar, which are all crucial for the adaptation, nutritional support, and reproductive growth of hydrangea. In the PPI network for WL01 vs. WL02 (Figure 8a), which encompasses 75 nodes and 289 edges, several genes associated with auxin and flavonoid biosynthesis exhibited high connectivity. The top 10 core genes, identified by the degree algorithm, were linked to various biological processes such as flavonoid biosynthesis (CHS, CYP75B2), porphyrin metabolism (DVR, CHLI), photosynthesis (VDE1, FDC1), starch and sucrose metabolism (AGPS1, BAM1), MAPK signaling (NTF3), and IAA signaling (LAX1, ABCB1).
In the PPI network for WL03 vs. WL02 (Figure 8b), which consists of 123 nodes and 703 edges, the 10 core genes are associated with biological processes, including flavonoid biosynthesis (CHS), ROS metabolism (CAT1), ethylene and jasmonic acid hormone signal transduction (EIN2, ETR1, EIN3, OPR3, CULR3, AOS1), and photosynthesis (PHYB, GAAPC2). The results of the PPI network analysis underscore the intricate connections of flavonoid biosynthesis, hormone signal transduction, and photosynthesis with the normal growth and development of hydrangea in semi-shaded environments. The PPI result files are shown in Tables S4 and S5.

4. Discussion

The normal growth and development of hydrangea under semi-shaded conditions were maintained through complex interactions. Through a comparative analysis of the transcriptome during the WL02 period, marked by robust growth under semi-shaded conditions, with the non-flowering WL01 period under full shade and the less thriving WL03 period under full sunlight, several genes were pinpointed for their pivotal role in the normal growth and flowering of hydrangea in semi-shaded environments.

4.1. Phenylpropanoid Metabolism in Response to Semi-Shaded Conditions

Phenylpropanoids are essential bioactive secondary metabolites in plants; they are synthesized from the vital amino acid phenylalanine through PAL enzymatic action (phenylalanine ammonia-lyase) within the shikimate pathway [27,28]. In this study, the phenylpropanoid biosynthesis pathway was found to notably enriched in pivotal KEGG pathways in both comparison pairs. Specifically, several key genes exhibited substantial upregulation in the WL02 group, including PAL (Phenylalanine ammonia lyase gene), CHI (Chalcone isomerase gene), F3′H (Flavanone 3′-hydroxylase gene), CCOAOMT (Caffeoyl-CoA O-methyltransferase gene), PER5 (peroxidase 5-like gene), and PER42 (peroxidase 42-like gene), exhibited substantial upregulation in WL02. Furthermore, phenylpropanoid metabolism and flavonoid biosynthesis biomarkers displayed more pronounced upregulation in WL03 vs. WL02, such as CHS (Chalcone synthase), CHS4 (coumaroyl triacetic acid synthase), CYP75B2 (flavonoid-3’-hydroxylase), and CYP98A2 (cytochrome P450 98A2) [29]. Previous research has demonstrated that flavonoid structural biomarker (e.g., CHS and DFR) overexpression upregulates flavonol glycosides and anthocyanins levels, preventing ROS accumulation, thus improving tolerance to salt stress in plants like rice (Oryza sativa), Brassica napus L. ‘Hanla’, [27] suggesting a crucial role for flavonoids in H. macrophylla’s adaptation to semi-shaded conditions.

4.2. Photosynthesis and Chlorophyll-Related Genes under Semi-Shaded Conditions

Shading induces reductions in light intensity and alters light quality by modifying the red-to-far-red light ratio. Conversely, high light intensity does not alter light quality but intensifies overall illumination. Noteworthy changes were identified in photosynthesis-related genes in both comparison pairs, featuring distinctive variations in specific genes. In WL01 vs. WL02, the genes associated with chlorophyll synthesis, including CHLI (Magnesium chelatase i2 gene), PSBR (Photosystem II 10 kDa polypeptide gene), and DVR (Divinyl reductase gene), displayed significant upregulation [30]. PAM68 (Photosynthesis-affected MUTANT68 gene), a photosystem II assembly factor facilitating chlorophyll molecule insertion into the CP47 polypeptide chain [31,32], exhibited an upregulation trend in both comparison pairs. In WL03 vs. WL02, alongside the upregulation of FDC1 and PSBR upregulation, the genes linked to carbon fixation in photosynthesis-related genes, such as FBA5 (Fructose-bisphosphate aldolase gene), GAPC2 (Glyceraldehyde-3-phosphate dehydrogenase gene), and MODA (NADP-dependent malic enzyme gene), were also upregulated. This supported the importance of photosynthesis in the hydrangea’s adaption to semi-shaded environments. Simultaneously, the activation of the response pathway mediated by SPX1/PHR1 may be related to lower photosynthetic efficiency, potentially influencing the photosynthesis of WL03, due to its high expression level in WL03 [33]. Prior research has indicated that carotenoids present in green leaves play a critical role in facilitating efficient photosynthesis, scavenging diverse reactive oxygen species and safeguarding chlorophyll from photooxidation [34]. In this study, the VDE, CYP707A, CRTISO, and NCED2 genes related to carotenoid biosynthesis were upregulated in WL01 vs. WL02. This upregulation is indicative of an enhancement in the light-harvesting molecules’ efficiency within H. macrophylla leaves under semi-shaded conditions, contributing to increased photosynthetic efficacy. Consequently, H. macrophylla may elevate gene expressions related to photosystem functionality as an adaptive mechanism for growth under semi-shaded conditions. Additionally, prior research has demonstrated that COL16 participates in chlorophyll accumulation in morning glory, where elevated phCOL16 expression correlates with increased chlorophyll levels in the corolla, positively regulating chlorophyll biosynthesis. This study shows that COL16′s expression level is significantly increased in WL02. This suggests that COL16 may also play an important role in the regulation of chlorophyll biosynthesis.

4.3. Carbohydrate Metabolism in Response to Semi-Shaded Conditions

Carbohydrates serve crucial functions in plant growth and development, with sugars serving multiple functions in flowering and stress resistance. They act as key floral signals initiating floral induction and participating in non-biological stress response mechanisms simultaneously [35]. BGLUs (Beta-glucosidase), hydrolytic enzyme class members, are involved in glycosidic substance hydrolysis and glycosidic bonds of oligosaccharides, releasing non-reducing glucose residues. This process is implicated in various biological phenomena [36], including stress response phytohormone activation and alpha-hydroxy nitriles release to protect against stresses. In Arabidopsis, AtBGLU10 has been identified to catalyze free ABA production, thereby enhancing the plant’s resistance to drought and salt stress. BGLU genes have also been found to regulate tolerance under dark stress in Stevia rebaudiana [37]. In our study, several BGLU family members, including BGLU20/40/44, were enriched in both comparative cohorts. These genes likely serve crucial functions in the normal growth and development of H. macrophylla under semi-shaded conditions. Beta-amylase (BAM) 1 and BAM3 belong to the gene family responsible for encoding beta-amylase in plants. These enzymes play a crucial role in plant starch metabolism and energy distribution, influencing key physiological processes such as seed germination and carbon metabolism in the source–sink balance [38]. Consequently, they contribute to plant growth and development modulations. In Arabidopsis, BAM1 is responsible for breaking down transitory starch to support proline biosynthesis under drought stress conditions [39]. Meanwhile, in citrus, BAM3 facilitates starch degradation, leading to soluble sugar content increase and improved resistance to abiotic stress [40]. BAM1 has a notable expression in the WL01 vs. WL02 comparison and BAM3 in the WL03 vs. WL02 comparison, which emphasizes their crucial roles in these specific conditions.

4.4. Key Transcription Factors for Normal Growth in Semi-Shade Conditions

TFs, or transcription factors, act as regulatory proteins positioned at the signal transduction pathway terminus [41]. They function as switches that control the expression of downstream stress response genes. TFs bind to cis-acting elements in the target genes’ promotors, thus orchestrating gene expression and sustaining the normal growth and hydrangea development under semi-shaded conditions. The findings suggest that several TF families, including AR2/ERF (75), bHLH (69), ERF (75), and NAC (56), likely play pivotal roles in governing gene expression through hormone signal transduction and ROS signal networks in semi-shaded environments.
The NAC (NAM, no apical meristem, ATAF, and CUC) family stands as one of the largest gene families among plant-specific TFs [42]. NAC TFs work crucially in various plant growth and developmental processes, demonstrating particular significance in bolstering plant resistance against a spectrum of abiotic stresses. NAC TFs displayed distinct variations between the two comparison groups: the majority experienced downregulation in WL01 vs. WL02, while an upregulation trend was observed in WL03 vs. WL02. This suggests noteworthy distinctions in the NAC TFs’ expression dynamics under different environmental conditions. Notably, both NAC002 and NAC014 exhibited significant downregulation in both control groups. Previous studies have demonstrated that LlNAC014 overexpression in Lilium longiflorum and Arabidopsis enhances heat tolerance but concurrently induces growth defects, aligning with the findings in our study. Although NAC014 can resist unsuitable environments, it inhibits plant growth, and the specific regulatory mechanism deserves further investigation [43].
BHLH TFs play a pivotal role in regulating various synthetic metabolism and signal transduction processes in plants, influencing crucial aspects of growth and development [44]. These processes include, but are not limited to, seed germination, photomorphogenesis, flowering, leaf senescence, and cell apoptosis. A significant portion of the bHLH TF family members exhibited upregulation in both comparison groups, with up to 95% of bHLH TFs showing upregulation in WL03 vs. WL02. The pronounced upregulation across expression levels underscores its pivotal role. Notably, BHLH79, BHLH51, FAMA, and GL3 displayed significant upregulation in both comparison groups. Previous studies have associated BHLH51 and GL3 with anthocyanin accumulation, while FAMA has been implicated in stomatal development [45,46,47]. Furthermore, CabHLH79 has been identified as a CaNAC035 upstream regulator, contributing to cold stress modulation in pepper [48]. These findings underscore the intricate and crucial role of BHLH TFs in the hydrangea’s adaptation to semi-shaded environments.
Among the identified flowering-related TFs in this investigation, SOC1, characterized as a MADS box TF, serves as an integrator of diverse flowering signals originating from photoperiod, temperature, hormones, and age-related cues [49]. CONSTANS (CO), functioning as a floral activator, is involved in activating SOC1. Additionally, the SOC1 gene contributes to the developmental process modulation in nutritional organs like leaves and stems in Arabidopsis [50]. CO gene family members, strategically positioned between biological clock and flowering integrators, exhibit diverse effects on the induction of plant flowering [51]. COL3 overexpression in Arabidopsis has been linked to delayed flowering [52], while RcCO/RcCOL4 expression suppression results in delayed flowering in roses under both short and long photoperiods [53]. Additionally, AtCOL4 expression is robustly induced by ABA, salt, and osmotic stress. AtCOL4 plays a pivotal role in regulating plant resistance to abiotic stress, as mutations in atcol4 lead to increased sensitivity to ABA and salt stress during seed germination and cotyledon greening. This underscores AtCOL4′s crucial regulatory function in plant responses to abiotic stress conditions [54]. SiCOL5 has been identified as a positive flowering time modulator [55]. Genes such as AGL24, SOC1, COL4, COL5, and COL9 presently exhibit heightened expression levels in WL02, indicating their significant roles in promoting hydrangea flowering in semi-shaded environments through intricate interactions. In cluster 1, WRKY70 highlights its central role. Research indicates that GATA5 and WRKY70 emerge as crucial candidate genes for soybean pod abscission under shaded conditions [56]. The transcription levels of the flowering time integration gene FT and the floral meristem identity genes APETALA1 (AP1) and LEAFY (LFY) were lower in WRKY7-OE compared to WT [57]. Overexpression of the BLH1-like gene MdBLH14 in Arabidopsis leads to significant dwarfing and delayed flowering phenotypes by inhibiting the accumulation of active GA [58]. The PHYTOCHROME A SIGNAL TRANSDUCTION 1 (PAT1) subfamily is a branch of the GRAS family, and PAT1 inhibits phyA signal transduction, while participating in the shade avoidance response [59,60]. The interaction between PAT1 and CONSTANS-LIKE 13 (COL13) negatively regulates flowering [61]. Given their high expression during the WL01 phase, WRKY70, WRKY7, BLH1, and PAT1 may exert inhibitory effects on the reproductive growth of hydrangea in shaded environments. Overexpression of DREB2C in Arabidopsis delays flowering by activating FLOWERING LOCUS C (FLC) [62], while FAR1 negatively regulates flowering time by regulating the transcription of multiple genes [63]. The high expression of DREB2C and FRS5/FAR1 in WL03 suggests their potential impact on the reproductive growth of hydrangea under full light conditions.

4.5. Plant Hormone and Signal Transduction Play Significant Roles in Hydrangea’s Adaptation to Semi-Shaded Conditions

Plant hormones are essential signaling molecules that play a crucial role in governing various aspects of plant growth, development, and responses to environmental stimuli. They act at multiple levels to mediate the intricate processes that enable plants to respond and adapt to their surroundings [64].
Ethylene is a pivotal plant hormone that governs various physiological processes, including seed germination, root formation, flower differentiation, leaf senescence, and fruit development. Additionally, it functions crucially in responding to abiotic stress. Among plant hormones, the ethylene signaling pathway is well studied. The final step of ethylene biosynthesis is catalyzed by 1-aminocyclopropane-1-carboxylate oxidase 1 (ACO) [65]. In WL02, high ACO expression facilitates ethylene synthesis. Ethylene perception in Arabidopsis involves five genes, including ETR1 and ERS1 [66]. The binding of ethylene to its receptor proteins renders the negative regulator CTR1 inactive, leading to EIN2 expression activation [67]. EIN2, the ethylene signaling pathway’s central component, positively regulates ethylene signal transduction. Upon activation, EIN2 promotes EIN3/EIL1 nuclear accumulation; these are crucial nuclear TFs in the ethylene pathway. EIN3 participates in flower opening, aging [68], and stress resistance modulations [69,70]. It also activates key enzyme gene expressions involved in secondary metabolite biosynthesis [71]. In loquat and kiwifruit, EIN3/EIL genes are involved in the fruit cold stress response [72,73]. Notably, EIN3 significantly regulates numerous photosynthesis-related functional gene expressions, enhancing the light adaptation ability of seedlings after emergence [74]. In WL03 vs. WL02, the high ETR1, ERS1, EIN2 expressions and EIN3 underscore the critical role of ethylene signal transduction in maintaining the hydrangea’s normal growth.
GAs are pivotal plant growth hormones that are crucial for stem elongation, seed germination, leaf expansion, and flower development [75]. GAI, a DELLA family member, inhibits downstream GA response genes but also plays a positive role in abiotic stress tolerance. DELLA proteins accumulate under high light conditions, enhancing plant survival in salt stress [76]. GAI negatively regulates flowering by inhibiting GA signal transduction and interfering with CO protein transcription [77]. However, GA counters this by activating the signaling pathway through GID1 receptor binding, leading to DELLA protein degradation [78]. GAI and GID1A showed an increasing trend in this research, prompting further investigation into their impact on the experimental treatments within a dynamic regulatory network. Understanding their roles in semi-shaded environments could unveil valuable insights into hydrangea adaptation mechanisms.
Jasmonates (JAs), crucial oxygenated lipid derivatives (oxylipins), serve as essential plant hormones for growth and environmental adaptation. Genes involved in JA biosynthesis (LOX6, AOS1, OPR3, AOC) were upregulated in WL02. The MYC-type bHLH TF family, which is pivotal in the jasmonate response pathway, works crucially in regulating plant resistance to adverse conditions [79]. MYC2 exhibits both positive and negative regulatory effects as a key member. It can inhibit CAT2 expression and act as a negative proline biosynthesis regulator, affecting ROS levels and reducing plant resistance to abiotic stress [80,81]. Simultaneously, MYC2 induces flowering-related gene expressions, like LFY and FT, promoting female flower development [82]. MYC2 also engages in crosstalk with other hormones, physically interacting with EIN3 and antagonistically regulating wounding-responsive gene expression [83,84]. MYC2 displayed an increasing trend in both comparison groups, suggesting its potential benefits for flowering but not for stress resistance. JA’s complex effects on hydrangea growth and development in semi-shaded environments involve intricate interactions, including both positive and negative feedback loops.
Auxin, which is a pivotal player in plant growth, development, and environmental adaptation, exerts its influence through various genes. The YUC gene family, which is integral to auxin synthesis and plant development, and the PIN-FORMED (PIN) family, comprising key auxin efflux carriers, the AUXIN1/LIKE-AUX1 (AUX/LAX) proteins, serve as prominent auxin influx carriers and are crucial components [85]. This study identified upregulations of auxin synthesis-related gene YUC10 and auxin transport-related genes PIN3, LAX2, LAX3, and ABCB1 in WL02. The elevated auxin-responsive protein genes IAA27, IAA14, and small auxin upregulated RNA gene (SAUR40) expressions further underscores auxin’s importance in this context. These findings suggest that auxin plays a regulatory role in hydrangea growth processes, with potential implications for its adaptation to semi-shaded environments. Moreover, the intricate crosstalk between auxin and other hormones emerges as a critical factor in shaping plant responses.
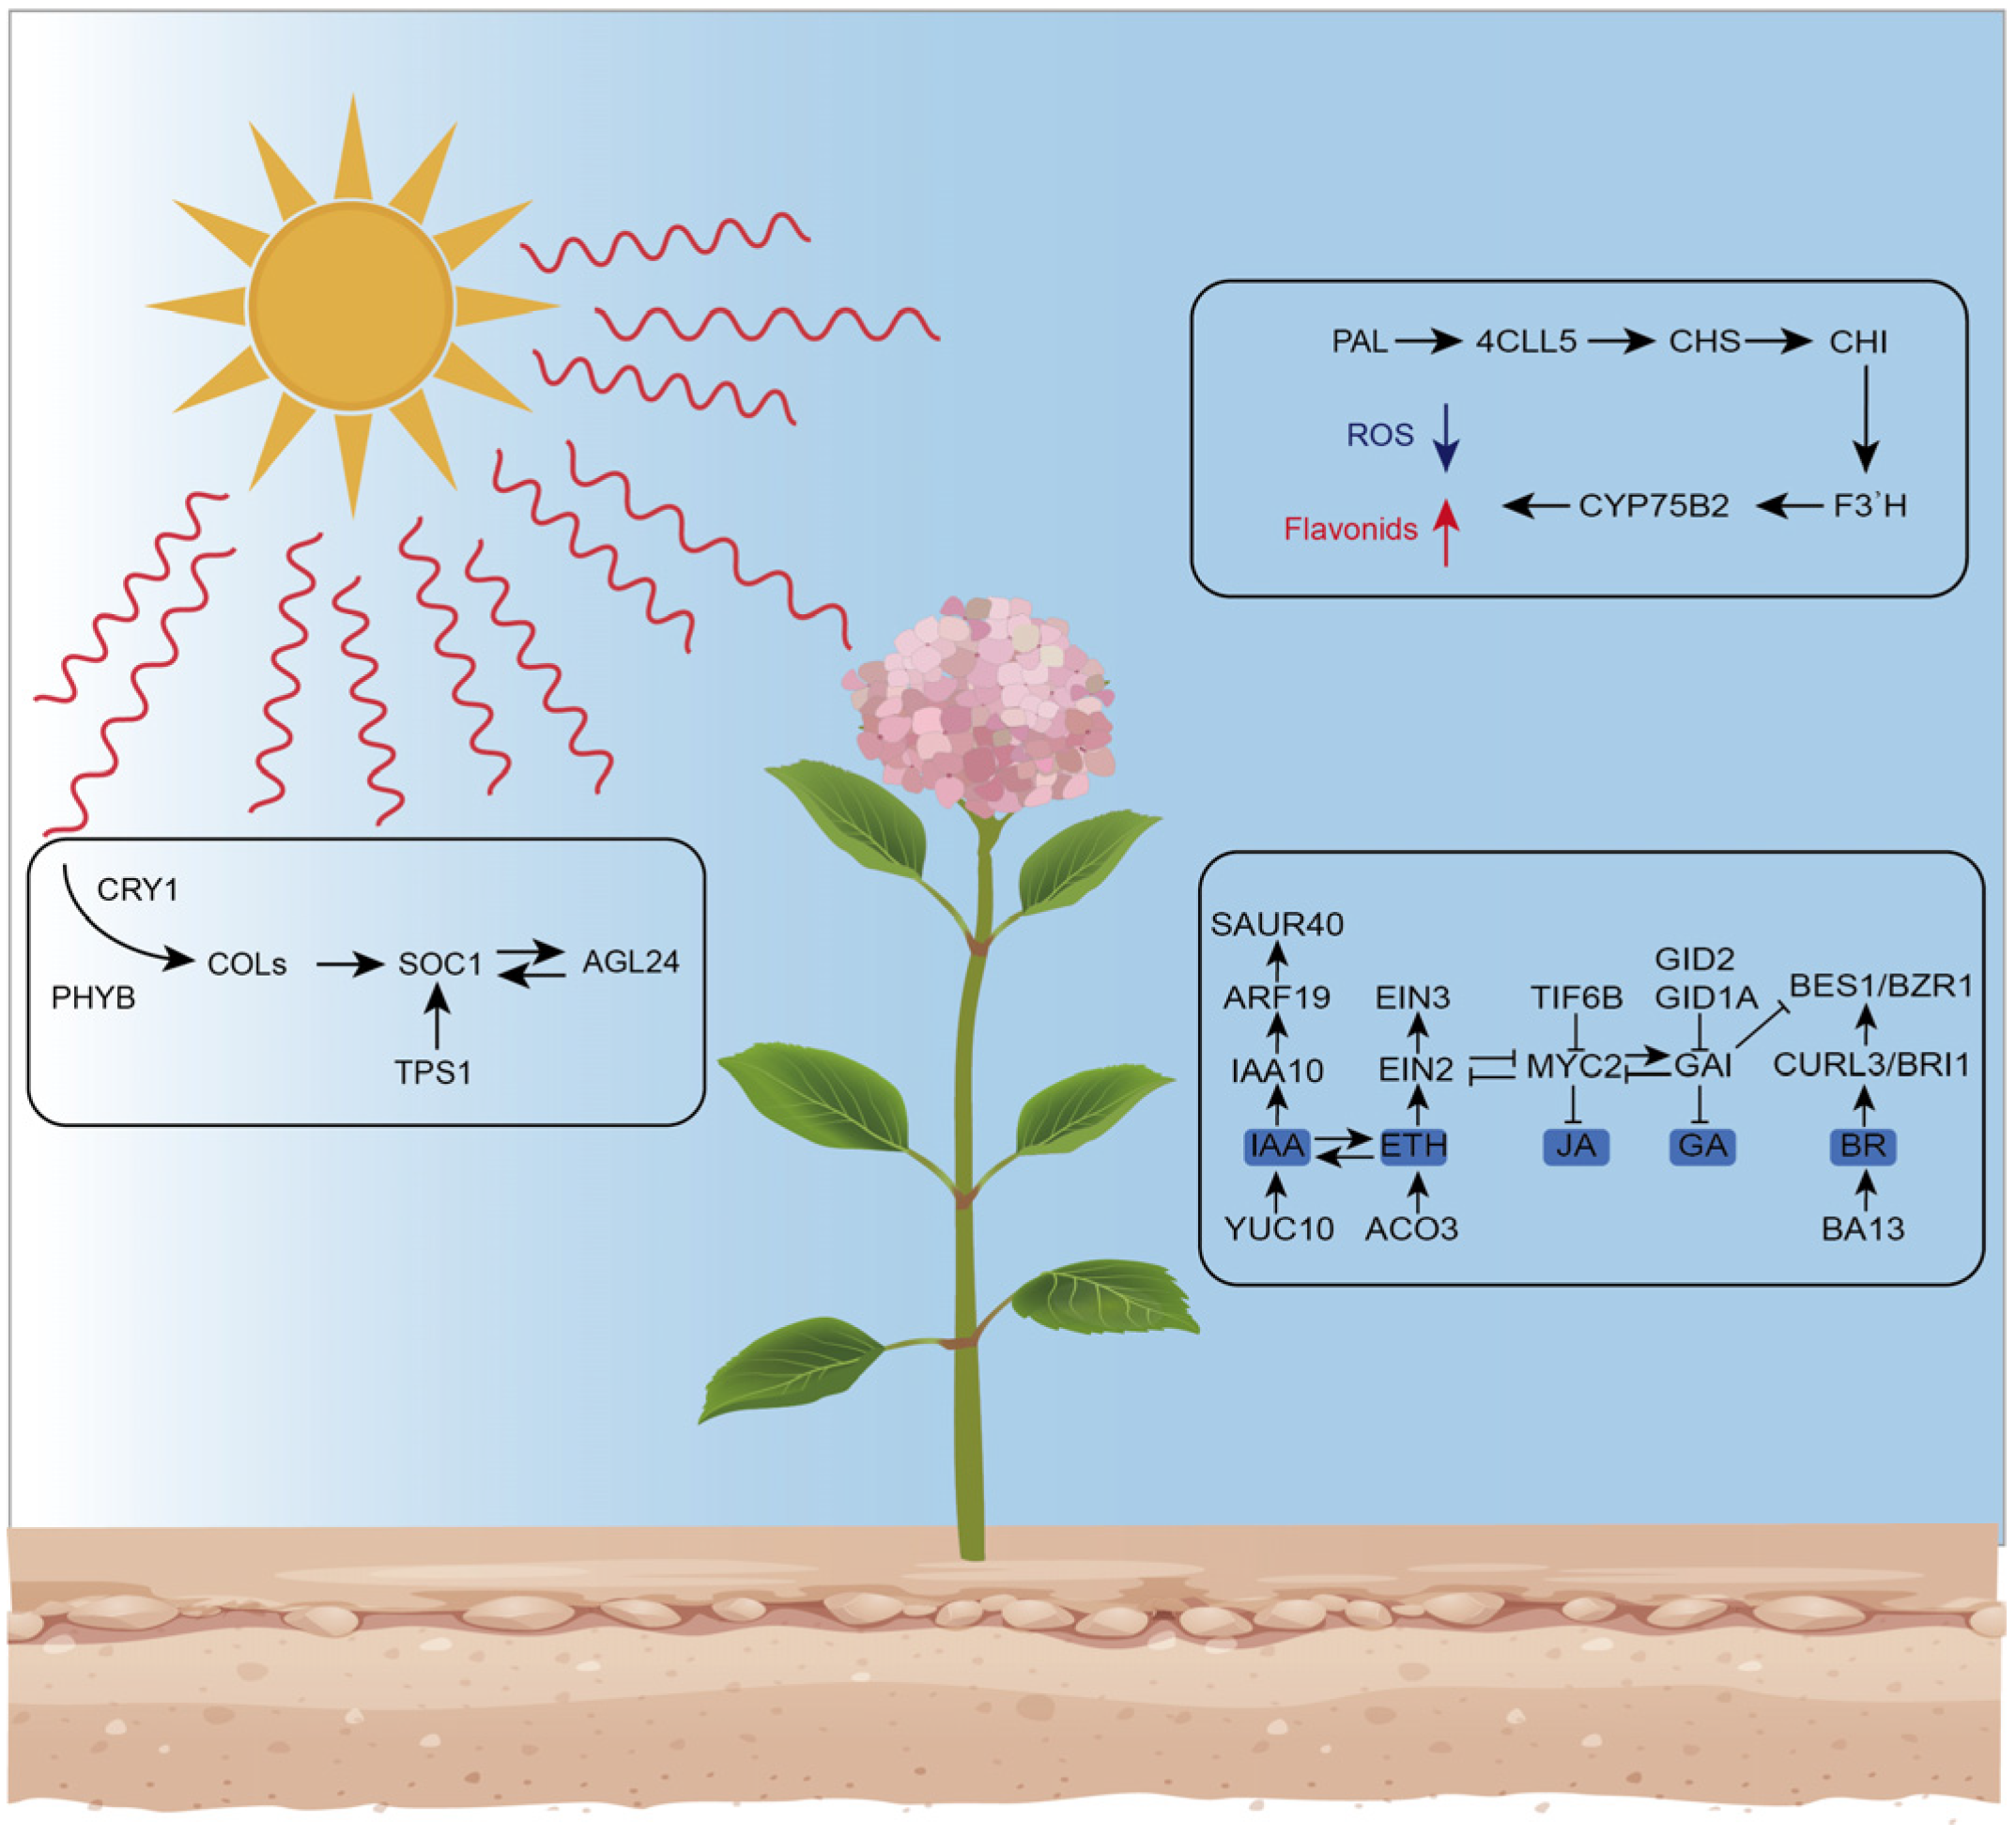
In conclusion, this study proposes a gene regulatory network model elucidating the mechanisms underlying the hydrangea’s normal growth and development in semi-shaded conditions (Figure 9). The model begins with environmental signal reception by photoreceptors PHYB and CRY1, which subsequently transmit these signals downstream. COLs (COL4/5/16) are then regulated by PHYB and CRY1, positively influencing SOC1 expression and, consequently, flowering. Genes involved in sucrose and starch metabolism, including BGLUs and TPSs, also contribute to SOC1 expression. EIN3 positively modulates hydrangea growth and development by inhibiting MYC2 expression. IAA, facilitated by the transport protein genes ABCB1, PIN3, LAX2, and LAX3, moves within cells to suppress GAI expression, promoting the gibberellin pathway and supporting normal plant growth. BR (CURL3/BR11, BES1/BZR1) and JA (LOX6, AOS1, OPR3, AOC, TIF6B) also regulate growth through their respective biosynthesis, metabolism, and signal transduction genes. Flavonoids contribute positively to these processes. WRKY70, BLH1, GATA5, PAT1, and other genes may exert inhibitory effects on the reproductive growth of hydrangea in a full shading environment, while NAC014, DREB2C, SPX1, FRS5/FAR1 and other genes may induce leaf senescence, reduce photosynthetic efficiency, and inhibit flowering and cause other adverse growth behaviors of hydrangea in a full light environment. However, it is crucial to note that the plant’s regulatory network in response to the natural environment is intricate and speculative. While this study postulates the functions and interrelationships of genes, further experimental exploration is necessary to validate and enhance our understanding, considering the potential disparities between mRNA and protein levels and enzyme activity.

Supplementary Materials

The following supporting information can be downloaded at: https://www.mdpi.com/article/10.3390/horticulturae10060586/s1.

Author Contributions

Z.L., T.L. and Y.L. conceptualized and designed the experiment; Z.L. and T.L. performed the laboratory experiments and statistical analysis; Z.L., T.L. and Y.L. wrote and revised the manuscript; T.L and Y.L. funding acquisition and supervision. All authors have read and agreed to the published version of the manuscript.

Funding

This work was supported by the Project supported by China National Botanical Garden North Garden (grant No. BZ202405), Beijing Municipal Park Management Center (grant No. 2019-ZX-13), and the China National Natural Science Foundation (grant No. 31872138).

Data Availability Statement

Data are contained within the article.

Conflicts of Interest

The authors declare no conflicts of interest.

References

  1. Peng, J.; Dong, X.; Xue, C.; Liu, Z.; Cao, F. Exploring the molecular mechanism of blue flower color formation in Hydrangea macrophylla cv. “Forever Summer”. Front. Plant Sci. 2021, 12, 585665. [Google Scholar] [CrossRef]
  2. Rahmati, R.; Hamid, R.; Ghorbanzadeh, Z.; Jacob, F.; Azadi, P.; Zeinalabedini, M.; Farsad, L.K.; Kazemi, M.; Ebrahimi, M.A.; Shahinnia, F.; et al. Comparative transcriptome analysis unveils the molecular mechanism underlying sepal colour changes under acidic pH substratum in Hydrangea macrophylla. Int. J. Mol. Sci. 2022, 23, 15428. [Google Scholar] [CrossRef]
  3. Xu, H.; Liu, C.; Zhong, H.D. The effect of different light intensities on the blooming of Hygrangea macrophylla. Nothern Hortic. 2014, 1, 81–82. [Google Scholar]
  4. Li, X.; Liang, T.; Liu, H. How plants coordinate their development in response to light and temperature signals. Plant Cell 2021, 34, 955–966. [Google Scholar] [CrossRef]
  5. Chen, Z.L.; Galli, M.; Gallavotti, A. Mechanisms of temperature-regulated growth and thermotolerance in crop species. Curr. Opin. Plant Biol. 2022, 65, 102134. [Google Scholar] [CrossRef]
  6. Gururani, M.A.; Venkatesh, J.; Tran, L.S.P. Regulation of photosynthesis during abiotic stress-induced photoinhibition. Mol. Plant 2015, 8, 1304–1320. [Google Scholar] [CrossRef]
  7. Saibo, N.J.M.; Lourenco, T.; Oliveira, M.M. Transcription factors and regulation of photosynthetic and related metabolism under environmental stresses. Ann. Bot. 2009, 103, 609–623. [Google Scholar] [CrossRef]
  8. Chen, S.F.; Zhou, Y.Q.; Chen, Y.R.; Gu, J. Fastp: An ultra-fast all-in-one FASTQ preprocessor. Bioinformatics 2018, 34, i884–i890. [Google Scholar] [CrossRef]
  9. Langmead, B.; Salzberg, S.L. Fast gapped-read alignment with Bowtie 2. Nat. Methods 2012, 9, 357–359. [Google Scholar] [CrossRef]
  10. Pertea, M.; Pertea, G.M.; Antonescu, C.M.; Chang, T.C.; Mendell, J.T.; Salzberg, S.L. String Tie enables improved reconstruction of a transcriptome from RNA-seq reads. Nat. Biotechnol. 2015, 33, 290–295. [Google Scholar] [CrossRef]
  11. Tang, D.D.; Chen, M.J.; Huang, X.H.; Zhang, G.C.; Zeng, L.; Zhang, G.S.; Wu, S.J.; Wang, Y.W. SR plot: A free online platform for data visualization and graphing. PLoS ONE 2023, 18, e0294236. [Google Scholar] [CrossRef]
  12. Szklarczyk, D.; Franceschini, A.; Wyder, S.; Forslund, K.; Heller, D.; Huerta-Cepas, J.; Simonovic, M.; Roth, A.; Santos, A.; Tsafou, K.P.; et al. STRING v10: Protein-protein interaction networks, integrated over the tree of life. Nucleic Acids Res. 2015, 43, D447–D452. [Google Scholar] [CrossRef]
  13. Livak, K.J.; Schmittgen, T.D. Analysis of relative gene expression data using real-time quantitative PCR and the 2(-delta delta C(T)) method. Methods 2001, 25, 402–408. [Google Scholar] [CrossRef]
  14. Liu, Y.; Lyu, T.; Lyu, Y. Study on the flower induction mechanism of Hydrangea macrophylla. Int. J. Mol. Sci. 2023, 24, 7691. [Google Scholar] [CrossRef]
  15. Krouk, G.; Lacombe, B.; Bielach, A.; Perrine-Walker, F.; Malinska, K.; Mounier, E.; Hoyerova, K.; Tillard, P.; Leon, S.; Ljung, K.; et al. Nitrate-regulated auxin transport by NRT1.1 defines a mechanism for nutrient sensing in plants. Dev. Cell. 2010, 18, 927–937. [Google Scholar] [CrossRef]
  16. Bao, Y.; Chen, C.; Fu, L.; Chen, Y.Q. Comparative transcriptome analysis of Rosa chinensis ‘Old Blush’ provides insights into the crucial factors and signaling pathways in salt stress response. Agron. J. 2021, 113, 3031–3050. [Google Scholar] [CrossRef]
  17. Su, N.N.; Zhu, A.Q.; Tao, X.; Ding, Z.J.; Chang, S.H.; Ye, F.; Zhang, Y.; Zhao, C.; Chen, Q.; Wang, J.Q.; et al. Structures and mechanisms of the Arabidopsis auxin transporter PIN3. Nature 2022, 610, 616–621. [Google Scholar] [CrossRef]
  18. Ma, H.S.; Liang, D.; Shuai, P.; Xia, X.L.; Yin, W.L. The salt- and drought-inducible poplar GRAS protein SCL7 confers salt and drought tolerance in Arabidopsis thaliana. J. Exp. Bot. 2010, 61, 4011–4019. [Google Scholar] [CrossRef]
  19. Yuan, L.; Zheng, Y.; Nie, L.; Zhang, L.; Wu, Y.; Zhu, S.; Hou, J.; Shan, G.L.; Liu, T.K.; Chen, G.; et al. Transcriptional profiling reveals changes in gene regulation and signaling transduction pathways during temperature stress in wucai (Brassica campestris L.). BMC Genom. 2021, 22, 687. [Google Scholar] [CrossRef]
  20. Jeon, J.; Rahman, M.M.; Yang, H.W.; Kim, J.; Gam, H.J.; Song, J.Y.; Jeong, S.W.; Kim, J.I.; Choi, M.G.; Shin, D.H.; et al. Modulation of warm temperature-sensitive growth using a phytochrome B dark reversion variant, phyB[G515E], in Arabidopsis and rice. J. Adv. Res. 2023; in press. [Google Scholar] [CrossRef]
  21. Khan, B.R.; Zolman, B.K. 5 Mutants that differentially disrupt pts1 and pts2 peroxisomal matrix protein import in Arabidopsis. Plant Physiol. 2010, 154, 1602–1615. [Google Scholar] [CrossRef]
  22. Jie, H.D.; He, P.L.; Zhao, L.; Ma, Y.S.; Jie, Y.C. Molecular mechanisms regulating phenylpropanoid metabolism in exogenously-sprayed ethylene forage ramie based on transcriptomic and metabolomic analyses. Plants 2023, 12, 3899. [Google Scholar] [CrossRef]
  23. Dong, C.J.; Cao, N.; Zhang, Z.G.; Shang, Q.M. Phenylalanine ammonia-lyase gene families in cucurbit species: Structure, evolution, and expression. J. Integr. Agr. 2016, 15, 1239–1255. [Google Scholar] [CrossRef]
  24. Wang, Q.Q.; Li, Y.Y.; Chen, J.T.; Zhu, M.J.; Liu, X.D.; Zhou, Z.; Zhang, D.Y.; Liu, Z.J.; Lan, S.R. Genome-wide identification of YABBY genes in three Cymbidium species and expression patterns in C. ensifolium (Orchidaceae). Front. Plant Sci. 2022, 13, 995734. [Google Scholar] [CrossRef]
  25. Wimalagunasekara, S.S.; Weeraman, J.W.J.K.; Tirimanne, S.; Fernando, P.C. Protein-protein interaction (PPI) network analysis reveals important hub proteins and sub-network modules for root development in rice (Oryza sativa). J. Genet. Eng. Biotechn. 2023, 21, 69. [Google Scholar] [CrossRef]
  26. Struk, S.; Jacobs, A.; Martín-Fontecha, E.S.; Gevaert, K.; Cubas, P.; Goormachtig, S. Exploring the protein-protein interaction landscape in plants. Plant Cell Environ. 2019, 42, 387–409. [Google Scholar] [CrossRef]
  27. Dong, N.Q.; Lin, H.X. Contribution of phenylpropanoid metabolism to plant development and plant-environment interactions. J. Integr. Plant Biol. 2021, 63, 180–209. [Google Scholar] [CrossRef]
  28. Rahim, M.A.; Zhang, X.B.; Busatto, N. Editorial: Phenylpropanoid biosynthesis in plants. Front. Plant Sci. 2023, 14, 1230664. [Google Scholar] [CrossRef]
  29. Jiang, N.; Doseff, A.I.; Grotewold, E. Flavones: From biosynthesis to health benefits. Plants 2016, 5, 27. [Google Scholar] [CrossRef]
  30. Wang, P.R.; Wan, C.M.; Xu, Z.J.; Wang, P.Y.; Wang, W.M.; Sun, C.H.; Ma, X.Z.; Xiao, Y.H.; Zhu, J.Q.; Gao, X.L.; et al. One divinyl reductase reduces the 8-vinyl groups in various intermediates of chlorophyll biosynthesis in a given higher plant species, but the isozyme differs between species. Plant Physiol. 2013, 161, 521–534. [Google Scholar] [CrossRef]
  31. Bucinská, L.; Kiss, É.; Koník, P.; Knoppová, J.; Komenda, J.; Sobotka, R. The ribosome-bound protein Pam68 promotes insertion of chlorophyll into the CP47 subunit of photosystem II. Plant Physiol. 2018, 176, 2931–2942. [Google Scholar] [CrossRef]
  32. Armbruster, U.; Rühle, T.; Kreller, R.; Strotbek, C.; Zühlke, J.; Tadini, L.; Blunder, T.; Hertle, A.P.; Qi, Y.F.; Rengstl, B.; et al. The PHOTOSYNTHESIS AFFECTED MUTANT68-LIKE protein Evolved from a PSII assembly factor to mediate assembly of the chloroplast NAD(P)H dehydrogenase complex in Arabidopsis. Plant Cell 2013, 25, 3926–3943. [Google Scholar] [CrossRef]
  33. Van Rooijen, R.; Harbinson, J.; Aarts, M.G.M. Photosynthetic response to increased irradiance correlates to variation in transcriptional response of lipid-remodeling and heat-shock genes. Plant Direct 2018, 2, e00069. [Google Scholar] [CrossRef]
  34. An, J.; Wei, X.; Huo, H. Transcriptome analysis reveals the accelerated expression of genes related to photosynthesis and chlorophyll biosynthesis contribution to shade-tolerant in Phoebe bournei. BMC Plant Biol. 2022, 22, 268. [Google Scholar] [CrossRef]
  35. Bolouri Moghaddam, M.R.; Van den Ende, W. Sugars, the clock and transition to flowering. Front. Plant Sci. 2013, 4, 22. [Google Scholar] [CrossRef]
  36. Wei, J.; Chen, Q.; Lin, J.; Chen, F.; Chen, R.; Liu, H.; Chu, P.; Lu, Z.; Li, S.; Yu, G. Genome-wide identification and expression analysis of tomato glycoside hydrolase family 1 β-glucosidase genes in response to abiotic stresses. Biotechnol. Biotechnol. Equip. 2022, 36, 268–280. [Google Scholar] [CrossRef]
  37. Yang, Y.; Zhang, T.; Xu, X.; Sun, Y.; Zhang, Y.; Hou, M.; Huang, S.; Yuan, H.; Tong, H. Identification of GH1 gene family fgt members in Stevia rebaudiana and their expression when grown in darkness. Mol. Biol. Rep. 2020, 47, 8739–8746. [Google Scholar] [CrossRef]
  38. Ma, Y.; Han, Y.; Feng, X.; Gao, H.; Cao, B.; Song, L. Genome-wide identification of BAM (β-amylase) gene family in jujube (Ziziphus jujuba Mill.) and expression in response to abiotic stress. BMC Genom. 2022, 23, 438. [Google Scholar] [CrossRef]
  39. Zanella, M.; Borghi, G.L.; Pirone, C.; Thalmann, M.; Pazmino, D.; Costa, A.; Santelia, D.; Trost, P.; Sparla, F. β-amylase 1 (BAM1) degrades transitory starch to sustain proline biosynthesis during drought stress. J. Exp. Bot. 2016, 67, 1819–1826. [Google Scholar] [CrossRef]
  40. Zhang, Y.; Zhu, J.; Khan, M.; Wang, Y.; Xiao, W.; Fang, T.; Qu, J.; Xiao, P.; Li, C.L.; Liu, J.H. Transcription factors ABF4 and ABR1 synergistically regulate amylase-mediated starch catabolism in drought tolerance. Plant Physiol. 2023, 191, 591–609. [Google Scholar] [CrossRef]
  41. Erpen, L.; Devi, H.S.; Grosser, J.W.; Dutt, M. Potential use of the DREB/ERF, MYB, NAC and WRKY transcription factors to improve abiotic and biotic stress in transgenic plants. Plant Cell Tiss. Org. 2018, 132, 1–25. [Google Scholar] [CrossRef]
  42. Adem, M.; Gadissa, F.; Zhao, K.; Beyene, D. Transcriptome-wide identification and expression analysis of the NAC gene family in lowland bamboo [Oxytenanthera abyssinica (A.Rich) Munro] under abiotic stresses. Plant Sci. Today 2023, 10, 250–259. [Google Scholar] [CrossRef]
  43. Wu, Z.; Li, T.; Xiang, J.; Teng, R.D.; Zhang, D.H.; Teng, N.J. A lily membrane-associated NAC transcription factor LlNAC014 is involved in thermotolerance via activation of the DREB2-HSFA3 module. J. Exp. Bot. 2023, 74, 945–963. [Google Scholar] [CrossRef] [PubMed]
  44. Wang, K.N.; Liu, H.Y.; Mei, Q.L.; Yang, J.; Ma, F.W.; Mao, K. Characteristics of bHLH transcription factors and their roles in the abiotic stress responses of horticultural crops. Sci. Hortic. 2023, 310, 111710. [Google Scholar] [CrossRef]
  45. Ohashi-Ito, K.; Bergmann, D.C. Arabidopsis FAMA controls the final proliferation/differentiation switch during stomatal development. Plant Cell 2006, 18, 2493–2505. [Google Scholar] [CrossRef] [PubMed]
  46. Nemie-Feyissa, D.; Heidari, B.; Blaise, M.; Lillo, C. Analysis of interactions between heterologously produced bHLH and MYB proteins that regulate anthocyanin biosynthesis: Quantitative interaction kinetics by microscale thermophoresis. Phytochemistry 2015, 111, 21–26. [Google Scholar] [CrossRef] [PubMed]
  47. Ning, G.X.; Li, W.F.; Chu, M.Y.; Ma, Z.H.; Wang, P.; Mao, J.; Chen, B.H. MdbHLH51 plays a positive role in anthocyanin accumulation in ‘Red Delicious’ apples. Trees 2022, 36, 1687–1695. [Google Scholar] [CrossRef]
  48. Wang, Z.Y.; Zhang, Y.M.; Hu, H.F.; Chen, L.; Zhang, H.F.; Chen, R.G. CabHLH79 acts upstream of to CaNAC035 regulate cold stress in Pepper. Int. J. Mol. Sci. 2022, 23, 2537. [Google Scholar] [CrossRef] [PubMed]
  49. Lee, J.; Lee, I. Regulation and function of SOC1, a flowering pathway integrator. J. Exp. Bot. 2010, 61, 2247–2254. [Google Scholar] [CrossRef] [PubMed]
  50. Wang, S.; Beruto, M.; Xue, J.; Zhu, F.; Liu, C.; Yan, Y.; Zhang, X. Molecular cloning and potential function prediction of homologous SOC1 genes in tree peony. Plant Cell Rep. 2015, 34, 1459–1471. [Google Scholar] [CrossRef]
  51. Suárez-López, P.; Wheatley, K.; Robson, F.; Onouchi, H.; Valverde, F.; Coupland, G. CONSTANS mediates between the circadian clock and the control of flowering in Arabidopsis. Nature 2001, 410, 1116–1120. [Google Scholar] [CrossRef]
  52. Datta, S.; Hettiarachchi, G.H.C.M.; Holm, D.M. Arabidopsis CONSTANS-LIKE is a positive regulator of red light signaling and root growth. Plant Cell 2006, 18, 70–84. [Google Scholar] [CrossRef] [PubMed]
  53. Lu, J.; Sun, J.J.; Jiang, A.Q.; Bai, M.J.; Fan, C.G.; Liu, J.Y.; Ning, G.G.; Wang, C.Q. Alternate expression of Constans-Like 4 in short days and CONSTANS in long days facilitates day-neutral response in Rosa chinensis. J. Exp. Bot. 2020, 71, 4057–4068. [Google Scholar] [CrossRef] [PubMed]
  54. Min, J.H.; Chung, J.S.; Lee, K.H.; Kim, C.S. The CONSTANS-like 4 transcription factor, AtCOL4, positively regulates abiotic stress tolerance through an abscisic acid-dependent manner in Arabidopsis. J. Integr. Plant Biol. 2015, 57, 313–324. [Google Scholar] [CrossRef] [PubMed]
  55. Li, F.F.; Niu, J.H.; Yu, X.; Kong, Q.H.; Wang, R.F.; Qin, L.; Chen, E.Y.; Yang, Y.B.; Liu, Z.Y.; Lang, L.N.; et al. Isolation and identification of SiCOL5, which is involved in photoperiod response, based on the quantitative trait locus mapping of. Front. Plant Sci. 2022, 13, 969604. [Google Scholar] [CrossRef] [PubMed]
  56. Sun, H.X.; He, D.X.; Wang, N.; Yao, X.D.; Xie, F.T. Transcriptome and metabolome jointly revealed the regulation and pathway of flower and pod abscission caused by shading in soybean (Glycine max L.). Agronomy 2024, 14, 106. [Google Scholar] [CrossRef]
  57. Chen, W.; Hao, W.J.; Xu, Y.X.; Zheng, C.; Ni, D.J.; Yao, M.Z.; Chen, L. Isolation and characterization of CsWRKY7, a subgroup IId WRKY transcription factor from camellia sinensis, linked to development in Arabidopsis. Int. J. Mol. Sci. 2019, 20, 2815. [Google Scholar] [CrossRef]
  58. Jia, P.; Sharif, R.; Li, Y.M.; Sun, T.B.; Li, S.K.; Zhang, X.M.; Dong, Q.L.; Luan, H.A.; Guo, S.P.; Ren, X.L.; et al. The BELL1-like homeobox gene MdBLH14 from apple controls flowering and plant height via repression of MdGA20ox3. Int. J. Biol. Macromol. 2023, 242, 124790. [Google Scholar] [CrossRef] [PubMed]
  59. Cai, H.; Xuan, L.; Xu, L.-A.; Huang, M.-R.; Xu, M. Identification and characterization of nine PAT1 branch genes in poplar. Plant Growth Regul. 2017, 81, 355–364. [Google Scholar] [CrossRef]
  60. Bolle, C.; Koncz, C.; Chua, N.H. PAT1, a new member of the GRAS family, is involved in phytochrome A signal transduction. Genes Dev. 2000, 14, 1269–1278. [Google Scholar] [CrossRef]
  61. Muntha, S.T.; Zhang, L.L.; Zhou, Y.F.; Zhao, X.; Hu, Z.Y.; Yang, J.H.; Zhang, M.F. Phytochrome a signal transduction 1 and CONSTANS-LIKE 13 coordinately orchestrate shoot branching and flowering in leafy Brassica juncea. Plant Biotechnol. J. 2019, 17, 1333–1343. [Google Scholar] [CrossRef] [PubMed]
  62. Song, C.; Baek, J.; Choe, U.; Lim, C.O. Overexpression of DREB2C delays flowering in arabidopsis thaliana via the activation of FLC. J. Plant Biol. 2022, 65, 133–143. [Google Scholar] [CrossRef]
  63. Lin, R.C.; Wang, H.Y. Arabidopsis FHY3/FAR1 gene family and distinct roles of its members in light control of arabidopsis development. Plant Physiol. 2004, 136, 4010–4022. [Google Scholar] [CrossRef] [PubMed]
  64. Paik, I.; Huq, E. Plant photoreceptors: Multi-functional sensory proteins and their signaling networks. Semin. Cell Dev. Biol. 2019, 92, 114–121. [Google Scholar] [CrossRef] [PubMed]
  65. Amor, M.B.; Guis, M.; Latché, A.; Bouzayen, M.; Pech, J.C.; Roustan, J.P. Expression of an antisense 1-aminocyclopropane-1-carboxylate oxidase gene stimulates shoot regeneration in Cucumis melo. Plant Cell Rep. 1998, 17, 586–589. [Google Scholar] [CrossRef] [PubMed]
  66. Hall, A.E.; Findell, J.L.; Schaller, G.E.; Sisler, E.C.; Bleecker, A.B. Ethylene perception by the ERS1 protein in Arabidopsis. Plant Physiol. 2000, 123, 1449–1458. [Google Scholar] [CrossRef] [PubMed]
  67. Catala, R.; Lopez-Cobollo, R.; Mar Castellano, M.; Angosto, T.; Alonso, J.M.; Ecker, J.R.; Salinas, J. The Arabidopsis 14-3-3 protein RARE COLD INDUCIBLE 1A links low-temperature response and ethylene biosynthesis to regulate freezing tolerance and cold acclimation. Plant Cell 2014, 26, 3326–3342. [Google Scholar] [CrossRef]
  68. Jensen, L.; Hegelund, J.N.; Olsen, A.; Lutken, H.; Muller, R. A natural frameshift mutation in Campanula EIL2 correlates with ethylene insensitivity in flowers. BMC Plant Biol. 2016, 16, 117. [Google Scholar] [CrossRef]
  69. Liu, C.; Li, J.; Zhu, P.; Yu, J.; Hou, J.; Wang, C.; Long, D.; Yu, M.; Zhao, A. Mulberry EIL3 confers salt and drought tolerances and modulates ethylene biosynthetic gene expression. PeerJ 2019, 7, e6391. [Google Scholar] [CrossRef]
  70. Dolgikh, V.A.; Pukhovaya, E.M.; Zemlyanskaya, E.V. Shaping ethylene response: The role of EIN3/EIL1 transcription factors. Front. Plant Sci. 2019, 10, 1030. [Google Scholar] [CrossRef]
  71. Nieuwenhuizen, N.J.; Chen, X.; Wang, M.Y.; Matich, A.J.; Perez, R.L.; Allan, A.C.; Green, S.A.; Atkinson, R.G. Natural ariation in monoterpene synthesis in kiwifruit: Transcriptional regulation of eerpene synthases by NAC and ETHYLENE-INSENSITIVE3-like transcription factors. Plant Physiol. 2015, 167, 1243–1258. [Google Scholar] [CrossRef] [PubMed]
  72. Yin, X.R.; Allan, A.C.; Chen, K.S.; Ferguson, I.B. Kiwifruit EIL and ERF genes involved in regulating fruit ripening. Plant Physiol. 2010, 153, 1280–1292. [Google Scholar] [CrossRef] [PubMed]
  73. Wang, P.; Zhang, B.; Li, X.; Xu, C.; Yin, X.; Shan, L.; Ferguson, I.; Chen, K. Ethylene signal transduction elements involved in chilling injury in non-climacteric loquat fruit. J. Exp. Bot. 2010, 61, 179–190. [Google Scholar] [CrossRef] [PubMed]
  74. Liu, X.Q.; Liu, R.L.; Li, Y.; Shen, X.; Zhong, S.W.; Shi, H. EIN3 and PIF3 form an interdependent module that represses chloroplast development in buried seedlings. Plant Cell 2017, 29, 3051–3067. [Google Scholar] [CrossRef] [PubMed]
  75. Fu, X.; Sudhakar, D.; Peng, J.; Richards, D.E.; Christou, P.; Harberd, N.P. Expression of Arabidopsis GAI in transgenic rice represses multiple gibberellin responses. Plant Cell 2001, 13, 1791–1802. [Google Scholar] [CrossRef] [PubMed]
  76. Arain, S.; Meer, M.; Sajjad, M.; Yasmin, H. Light contributes to salt resistance through GAI protein regulation in Arabidopsis thaliana. Plant Physiol. Bioch. 2021, 159, 1–11. [Google Scholar] [CrossRef]
  77. Wang, H.P.; Pan, J.J.; Li, Y.; Lou, D.J.; Hu, Y.R.; Yu, D.Q. The DELLA-CONSTANS transcription factor cascade integrates gibberellic acid and photoperiod signaling to regulate flowering. Plant Physiol. 2016, 172, 479–488. [Google Scholar] [CrossRef] [PubMed]
  78. Fukazawa, J.; Ohashi, Y.; Takahashi, R.; Nakai, K.; Takahashi, Y. DELLA degradation by gibberellin promotes flowering via GAF1-TPR-dependent repression of floral repressors in Arabidopsis. Plant Cell 2021, 33, 2258–2272. [Google Scholar] [CrossRef]
  79. Ogawa, S.; Miyamoto, K.; Nemoto, K.; Sawasaki, T.; Yamane, H.; Nojiri, H.; Okada, K. OsMYC2, an essential factor for JA-inductive sakuranetin production in rice, interacts with MYC2-like proteins that enhance its transactivation ability. Sci. Rep. 2017, 7, 40175. [Google Scholar] [CrossRef]
  80. Verma, D.; Jalmi, S.K.; Bhagat, P.K.; Verma, N.; Sinha, A.K. A bHLH transcription factor, MYC2, imparts salt intolerance by regulating proline biosynthesis in Arabidopsis. FEBS J. 2020, 287, 2560–2576. [Google Scholar] [CrossRef]
  81. Song, R.F.; Li, T.T.; Liu, W.C. Jasmonic acid impairs arabidopsis seedling salt stress tolerance through MYC2-mediated repression of expression. Front. Plant Sci. 2021, 12, 730228. [Google Scholar] [CrossRef] [PubMed]
  82. Cheng, H.; Zha, S.X.; Luo, Y.Y.; Li, L.; Wang, S.Y.; Wu, S.; Cheng, S.Y.; Li, L.L. JAZ1-3 and MYC2-1 synergistically regulate the transformation from completely mixed flower buds to female flower buds in Castanea mollisima. Int. J. Mol. Sci. 2022, 23, 6452. [Google Scholar] [CrossRef] [PubMed]
  83. Zheng, Y.Y.; Lan, Y.H.; Shi, T.L.; Zhu, Z.Q. Diverse contributions of MYC2 and EIN3 in the regulation of Arabidopsis jasmonate-responsive gene expression. Plant Direct 2017, 1, e00015. [Google Scholar] [CrossRef] [PubMed]
  84. Chini, A.; Fonseca, S.; Fernández, G.; Adie, B.; Chico, J.M.; Lorenzo, O.; García-Casado, G.; López-Vidriero, I.; Lozano, F.M.; Ponce, M.R.; et al. The JAZ family of repressors is the missing link in jasmonate signalling. Nature 2007, 448, 666–671. [Google Scholar] [CrossRef]
  85. Swarup, R.; Péret, B. AUX/LAX family of auxin influx carriers—An overview. Front. Plant Sci. 2012, 3, 225. [Google Scholar] [CrossRef]
Figure 1. Monthly temperature variations up to the day of sampling, https://data.cma.cn (last accessed on 20 November 2023).
Horticulturae 10 00586 g001
Figure 2. Experimental processing simulation diagram. The values inside the white square represent the average leaf surface temperature and light intensity during sampling.
Horticulturae 10 00586 g002
Figure 3. Leaf phenotypes under four shading conditions, as observed under macrography. Scale bars: 2 cm.
Horticulturae 10 00586 g003
Figure 4. Four major databases annotated Venn diagrams.
Horticulturae 10 00586 g004
Figure 5. Bubble diagram of the top 20 biological process terms enriched in GO. (a) WL01 vs. WL02. (b) WL03 vs. WL02. (c) WL02 vs. WL04.
Horticulturae 10 00586 g005
Figure 6. Bubble diagram of the top 20 pathways enriched in KEGG. (a) WL01 vs. WL02. (b) WL03 vs. WL02. (c) WL02 vs. WL04. The graphical representation commences with the outermost circle denoting the pathway IDs, where different colors serve to distinguish between various KEGG_A_classes. The second circle illustrates the count of genes from the background gene set that are enriched within each pathway ID, employing a color scheme that represents differing −log10(Qvalue), as elucidated in the legend. The third circle highlights the number of genes from the target gene set that have been enriched in the pathways, utilizing distinct colors to differentiate between upregulated and downregulated genes. The fourth circle presents the gene ratio, computed as the quotient of the number of genes enriched in the pathway from the target gene set divided by the equivalent count from the background gene set for that particular pathway.
Horticulturae 10 00586 g006
Figure 7. Identification of gene clusters using DEGs. (a) A heatmap of candidate DEGs’ expression trend during natural stress treatment. (b) The top 20 genes calculated in cluster 1 using the cytohubba plug-in Cytoscape. The node colors correspond to connectivity values. (c) The top 20 genes in cluster 2. (d) The top 20 genes in cluster 3.
Horticulturae 10 00586 g007
Figure 8. Protein–protein interaction network of differentially expressed genes. (a) WL01 vs. WL02 network, (b) WL03 vs. WL02 network. The genes circled in purple are the top ten genes calculated using the degree algorithm.
Horticulturae 10 00586 g008
Figure 9. The hypothetical model of gene regulatory network for growth under semi-shaded environments in Hydrangea macrophylla. The black arrows indicate promotion, the T-shaped arrows indicate inhibition, the blue arrow indicates decrease and the red arrow indicates increase.
Horticulturae 10 00586 g009
Table 1. Statistics of sequencing data quality.
SampleRaw ReadsRaw BasesClean ReadsClean BasesQ20Q30GC
WL0177.23 M11.58 G76.77 M11.48 G97.56%93.33%45.14%
WL0263.58 M9.54 G63.14 M9.44 G97.20%92.46%45.07%
WL0371.22 M10.68 G70.77 M10.58 G97.47%93.15%45.27%
WL0466.07 M9.91 G65.61 M98.17 G97.05%92.14%45.14%
Disclaimer/Publisher’s Note: The statements, opinions and data contained in all publications are solely those of the individual author(s) and contributor(s) and not of MDPI and/or the editor(s). MDPI and/or the editor(s) disclaim responsibility for any injury to people or property resulting from any ideas, methods, instructions or products referred to in the content.