Article

Effect of Temperature on Photosynthetic Pigment Degradation during Freeze–Thaw Process of Postharvest of Celery Leaves

1
State Key Laboratory of Crop Genetics & Germplasm Enhancement and Utilization, Ministry of Agriculture and Rural Affairs Key Laboratory of Biology and Germplasm Enhancement of Horticultural Crops in East China, College of Horticulture, Nanjing Agricultural University, Nanjing 210095, China
2
Suqian Facility Horticulture Research Institute, Nanjing Agricultural University, Suqian 223800, China
3
College of Horticulture, Sichuan Agricultural University, Chengdu 611130, China
4
Institute of Horticulture, Guizhou Academy of Agricultural Sciences, Guiyang 550006, China
*
Author to whom correspondence should be addressed.
Horticulturae 2024, 10(3), 267; https://doi.org/10.3390/horticulturae10030267
Submission received: 14 February 2024 / Revised: 4 March 2024 / Accepted: 6 March 2024 / Published: 11 March 2024
(This article belongs to the Section Postharvest Biology, Quality, Safety, and Technology)

Abstract

:
Celery (Apium graveolens L.) is a kind of green leaf vegetable with a large consumption demand in the food industry. It is a commonly used material in quick-frozen food stuffing such as dumplings and steamed stuffed. Fresh celery leaf blades and petioles are rich in photosynthetic pigments including chlorophyll and carotenoid, their contents are closely related to the quality of celery and its products. In order to explore the effects of freezing and thawing temperature and thawing time on the degradation of photosynthetic pigments in celery leaf blades and petioles, the changes in photosynthetic pigments during thawing storage were measured under different freezing and thawing temperatures. The results showed that lower freezing and thawing temperatures were beneficial to the preservation of photosynthetic pigments in celery leaf blades and petioles, and the loss of photosynthetic pigments enhanced with the increase in thawing temperature and thawing time. Under the cold storage condition of −80 °C, the loss rate of pigment substances can be reduced by nearly 20% compared with that of −18 °C, and −80 °C and 4 °C could be the best temperature combination of freezing and thawing. The content and degradation rate of photosynthetic pigments in celery leaf blades were higher than that in petioles during thawing, with a total chlorophyll loss rate reaching 35% during 6 to 12 h after thawing. The increase in temperature difference between freezing and thawing could aggravate the damage to the cell structure and the degradation of the pigment, as chlorophyll is more sensitive to temperature changes, and the degradation rate is significantly higher than that of carotenoids. From the perspective of delaying the degradation of photosynthetic pigments, the results of this study will provide potential references for the reasonable configuration of freezing and thawing temperatures in the process of storage and transportation of celery products.

1. Introduction

Celery (Apium graveolens L.) is the vegetable crop of Apium in the Apiaceae family, which originated from the Mediterranean coastal area [1,2,3]. Celery is rich in nutrition with a unique flavor, and the leaves are rich in chlorophyll, carotenoids, ascorbic acid, and flavonoids, and is a typical vegetable crop with dual use as medicine and food [4,5,6]. In the Chinese diet, celery is often mixed with other ingredients as a filling to bring dishes a fresh taste and green color. In Western food, celery is often used as raw salad food to balance nutrition and refresh the palate [7]. Color is an intuitive index for evaluating the freshness of celery, which is one of the key factors for consumers to evaluate the quality of celery products [8]. Chlorophyll and carotenoids are the main photosynthetic pigments in celery and other leafy vegetables, and their content and proportion affect the color of vegetable products and the related appearance, nutritional quality, and shelf life [9]. In the process of storage and thawing of fresh celery, it is easy to degrade pigment substances due to improper control of freezing and thawing temperature and time, affecting both the appearance quality and nutritional quality of celery [10,11,12].
The petioles and leaf blades are the main edible parts of celery, which are rich in various photosynthetic pigments, and their content is positively correlated with the quality of celery and its products [13]. As the main photosynthetic pigments in celery, chlorophyll mainly exists in celery leaves in the form of chlorophyll a and chlorophyll b, and the content of chlorophyll a is about two to three times that of chlorophyll b; carotenoids are mainly accumulated in celery leaves in the form of lutein and β-carotene, and the content of lutein is about 1.5 times that of carotene [14,15,16]. Chlorophyll can be divided into chlorophyll a and chlorophyll b, and the basic structure is a magnesium porphyrin ring and chlorophyll alcohol [17]. Under high temperature, light, and sufficient oxygen, the central magnesium element of chlorophyll can be replaced by other more active metal ions to form olive green pheophytin. Many chlorophyll-degrading enzymes, such as phytoesterase, and acidic substances in plant cells can oxidize damaged chlorophyll to phytol, which is relatively stable in chemical properties and could be deeper oxidized and finally transformed into brown pyrophytin [17,18]. Carotenoids are another pigment in plants involved in photosynthesis, and there is a degree of the form and proportion of carotenoids in celery with different leaf colors. [19,20,21]. The chemical properties of lutein are more stable at room temperature, while β-carotene is more sensitive to temperature and light and is more likely to be lost during postharvest storage of vegetables [22,23].
Celery is an important leaf vegetable crop, and the main organs of the product are fresh leaf blades and petioles for processing. Its rich photosynthetic pigments are easily destroyed during processing and storage. After harvesting, the expression level of genes (AgPPH and AgPAO) regulates the synthesis of enzymes related to chlorophyll degradation in celery leaves, increasing rapidly, leading to chlorophyll degradation and leaf yellowing [24]. In spinach (Spinacia oleracea L.) quick-frozen products, frying at 160 °C for 1 min or unsuitable storage temperature (60 °C for 12 h) can cause the destruction of chlorophyll and carotenoid structures [25]. Therefore, it is very important to keep green and fresh after harvest [26,27]. In production, the storage cost of frozen vegetable food is often inversely proportional to the storage temperature and the storage time. How to maintain the color of fresh vegetables by setting reasonable storage and thawing transport temperature is one of the important problems facing the fresh food industry [28]. Low-temperature impregnation technology can use liquid refrigerant and powerful refrigeration and insulation systems to control the storage temperature at −40 °C and below, which is more common in the preservation of high commodity value ingredients and germplasm resources storage, and other fields due to the high cost of refrigeration [29]. The liquid nitrogen spray freezing method, as a cold storage method for frozen vegetable products, can rapidly reduce the central temperature of the product to about −18 °C, supplemented by post-harvest pre-crushing, vacuum deoxidation, and other treatments, and can effectively delay the loss of pigments and other nutrients in frozen leafy vegetable [30,31]. The shelf life of quick-frozen vegetable products on the market (frozen and stored below −18 °C) is generally more than 3 months and still meets food standards, but the obvious color change in leafy vegetables before the date still affects the appearance and quality [32]. In the process of quick-frozen leaf vegetable products, pigment substances have secondary losses due to freezing–thawing and light. The use of low-temperature special cold chain transportation equipment will increase the cost of leafy vegetable products [33]. How to reduce storage and transportation costs while maintaining the quality of celery has become one of the important issues in the postharvest treatment of quick-frozen celery products [34].
In order to explore the relationship between the degradation of photosynthetic pigments and freezing/thawing temperature and time in celery, the contents of chlorophyll (including chlorophyll a and chlorophyll b) and total carotenoids of leaf blades and petioles in celery were measured under different temperatures of freezing/thawing and light treatments. Then, the change trends of photosynthetic pigment contents under different treatments were compared and analyzed. The results provided some potential references for the postharvest processing of celery products.

2. Materials and Methods

2.1. Plant Materials and Growth Conditions

Celery “Ningqin 1” is the experimental material that was planted for 65 days after sowing under suitable conditions in the artificial climate growing room (area: 7.0 m × 2.5 m) of Apiaceae Vegetable Crop Laboratory, State Key Laboratory of Crop Genetics & Germplasm Enhancement and Utilization, Nanjing Agricultural University. During the growth period, the celery was planted at 25 °C 16 h at daytime, and 18 °C 8 h at night, with relative humidity of 60% to 70%, and diurnal light intensity of 300 μmol/m2/s. The organic substrate, vermiculite, and perlite (Xingnong Company, Nanjing, China) were mixed at a volume ratio of 2:2:1. The water and fertilizer supplement was carried out regularly to ensure the normal growth of celery. Three biological replicates were set up for each sampling.

2.2. Grouping Design and Treatment

Two freezing storage temperatures of −80 °C (simulate the ultra-low freezing temperature cold storage) and −18 °C (simulate the general refrigerator freezing temperature), two thawing temperatures of 4 °C (simulate the general refrigerators refrigeration temperature) and 25 °C (simulated normal room storage temperature) were designed and treated. The chlorophyll and carotenoids of the celery plant samples were extracted and determined at 0, 3, 6, 12, and 24 h after the thawing began. The samples of each group were taken from 3 celery plants. Two-factor orthogonal design method was used in this study, and the grouping design and treatment plan are shown in Table 1.

2.3. Celery Sample Collection and Freezing Storage Extraction

The celery plants with normal growth conditions and no diseases and pests were collected. Celery leaf blades and petioles were separated after washing, pre-broken into 2 to 3 mm square pieces to simulate the broken state of celery stuffing, and the celery samples of each treatment group were quickly immersed in liquid nitrogen and frozen for 30 s to simulate the quick-freezing process of frozen food. Then, the celery leaf blades and petioles of each group were divided into two equal parts and stored in freezers of −18 °C and −80 °C (limited by the actual operation of the refrigerator, the freezing temperature may have an error of ± 2 °C) ultra-low temperature refrigerator (Thermo Company, Waltham, MA, USA). Then for a period of 30 days, respectively, the obvious color differences were present in celery frozen products under different frozen temperatures.

2.4. Extraction and Determination of Photosynthetic Pigment Content

Take out the sample to be measured from the refrigerator, and quickly and accurately weigh 0.2 g of frozen celery leaf blades and petioles sample into the corresponding test tubes, respectively. Then, the group of test tubes was added with 95% ethanol 10 mL solution and stored in a dark place for 24 h away from light for pigment extraction. After the pigment was extracted, the supernatant containing the pigment was transferred to a 50 mL volume bottle. With the 95% ethanol used as blank control, the light absorption value of the extract was detected using Spectramax enzyme spectrometer at the wavelength of 665 nm, 649 nm, and 470 nm, respectively (denoted as OD665, OD649, and OD470). The extraction methods of chlorophylls and carotenoids are the same, only the determination of light absorption value and the calculation formulas of content are different [35,36]. Photosynthetic pigment absorption content was determined using Spectramax (Molecular Devices, San Jose, CA, USA). Three parallel controls were set up in each treatment group. The photosynthetic pigment content was calculated according to the relationship between the pigment content and absorbance as follows:
Ca (mg/L) = 13.95OD665 − 6.88OD649
Cb (mg/L) = 24.96OD649 − 7.32OD665
C (mg/L) = Ca + Cb
Cc (mg/L) = (1000OD470 − 2.05Ca − 114.8Cb)/245
Pigment content (mg/g) = C × V/M
In the table, Ca, Cb, C, and Cc, respectively, represent the concentrations of chlorophyll a, chlorophyll b, total chlorophyll, and total carotenoids in the extraction solution, and the relative pigment content is calculated based on the wet weight of celery frozen product.

2.5. Data Analysis

The organ’s three biological replicates were set for the determination of photosynthetic pigment content. In order to understand the significant changes in photosynthetic pigment content in celery leaves with the extension of thawing time, Duncan’s method was used to analyze the significance of difference between the experimental data of different periods. In order to understand the differential effects of different temperature treatments, thawing time, and leaf position on photosynthetic pigment degradation of celery, we select the “PCs with eigenvalues greater than 1.0” as the method of principal component analysis. Difference significance analysis is helpful to understand whether the absorbance content of pigment substances changes significantly with different test treatments, and principal component analysis can reduce the number of characteristic variables through dimensionality reduction analysis, so as to determine the one or two most representative characteristic components at this level. The significant differences in data and the principal component analysis between different treatments were analyzed using SPSS 22.0 software (IBM, Armonk, NY, USA), the significance of differences were marked with different small letters (p < 0.05). The GraphPad Prism 9.4 software (San Diego, CA, USA) was used to make the difference significance analysis bar chart and the principal component analysis charts of analysis results.

3. Results

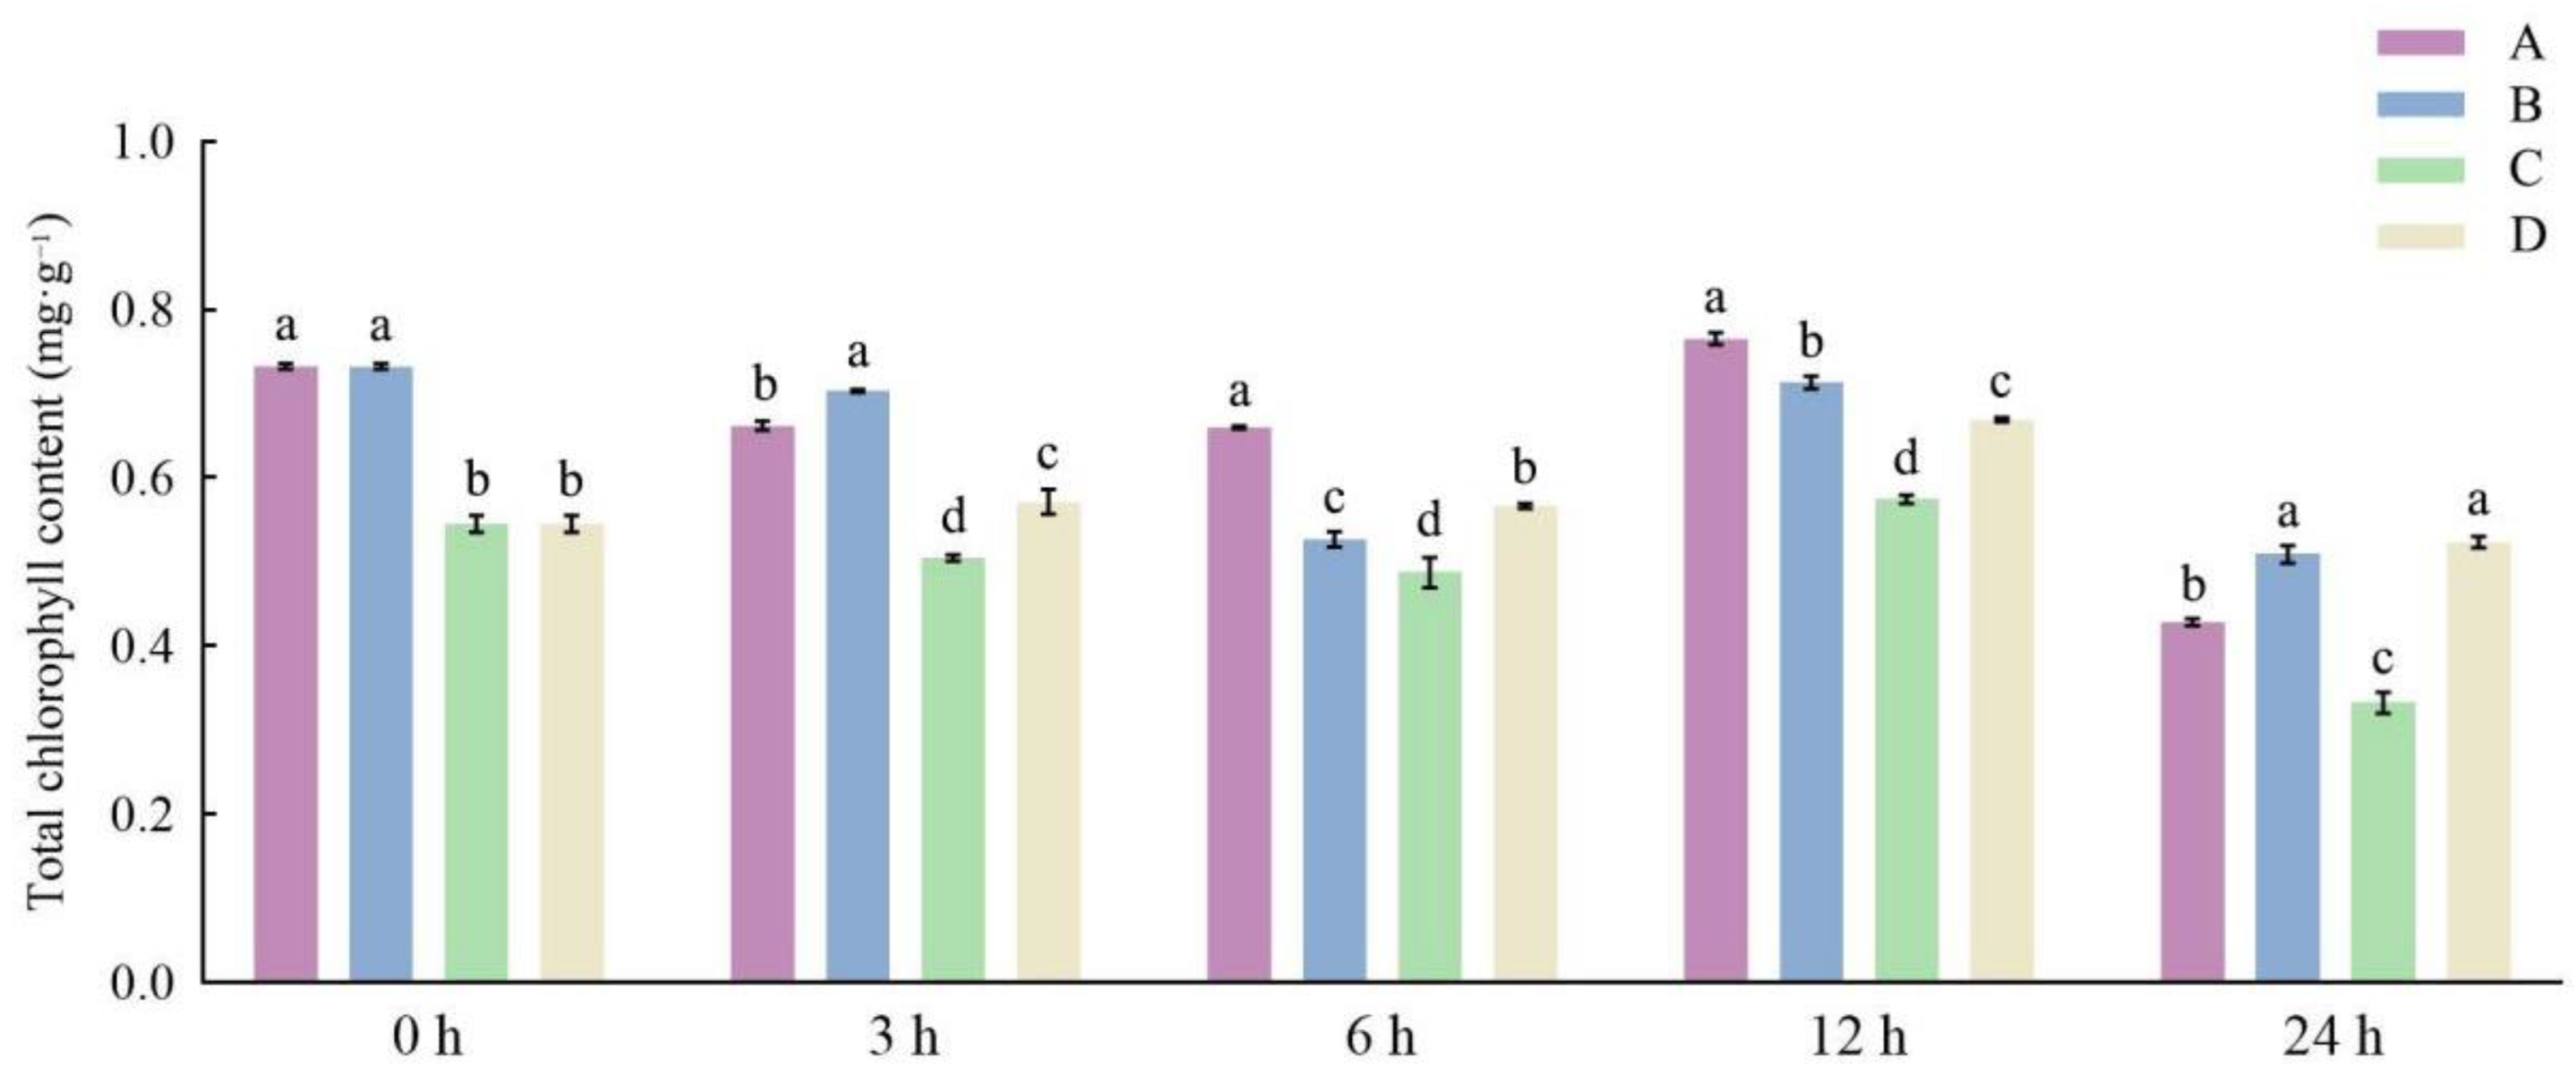
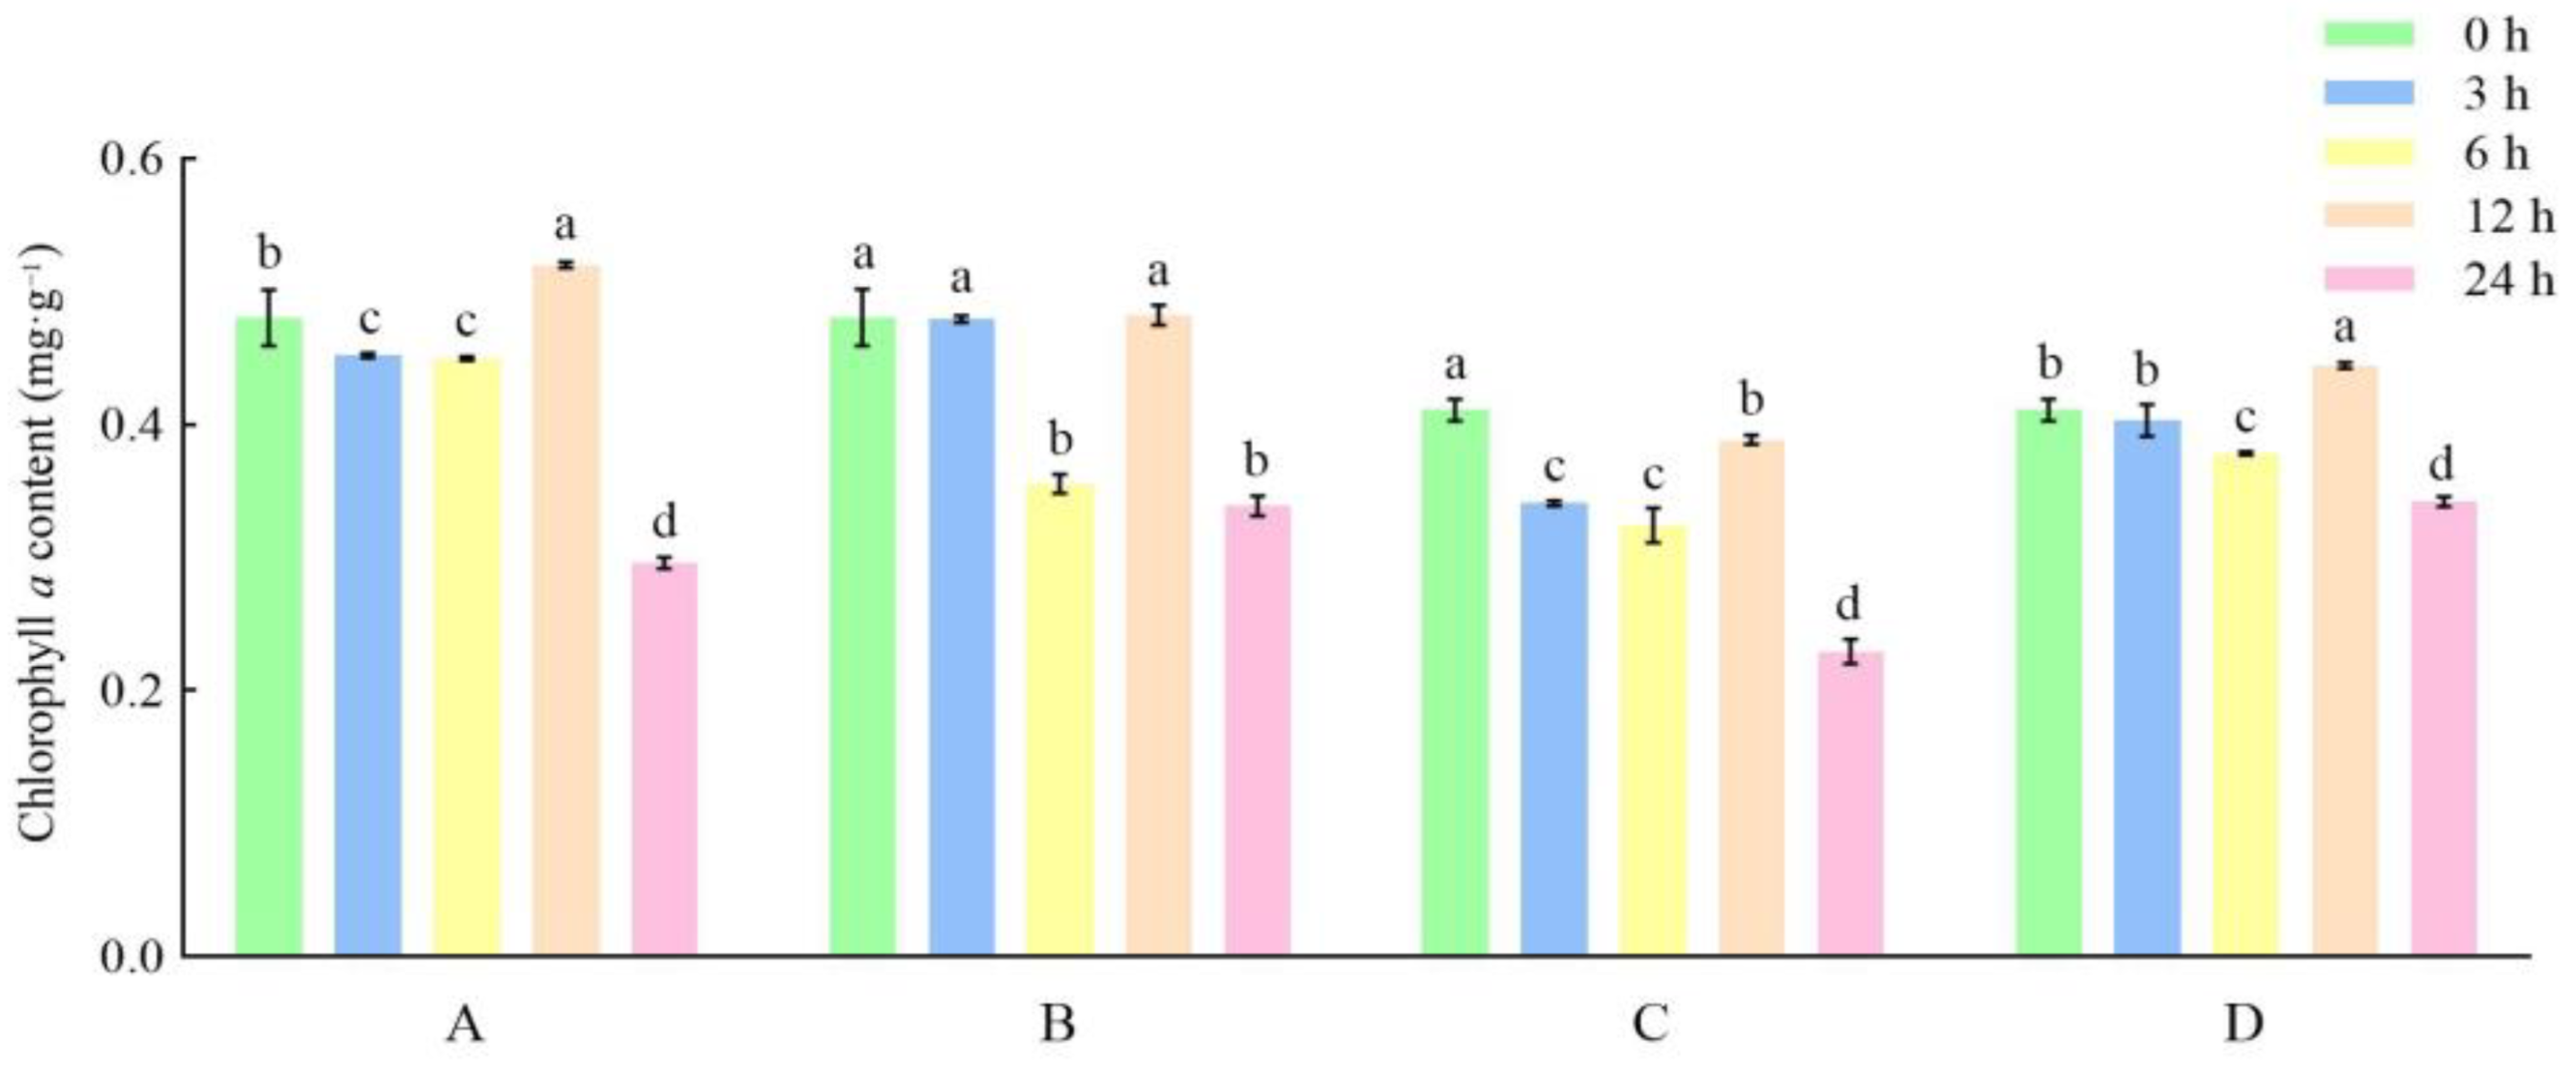
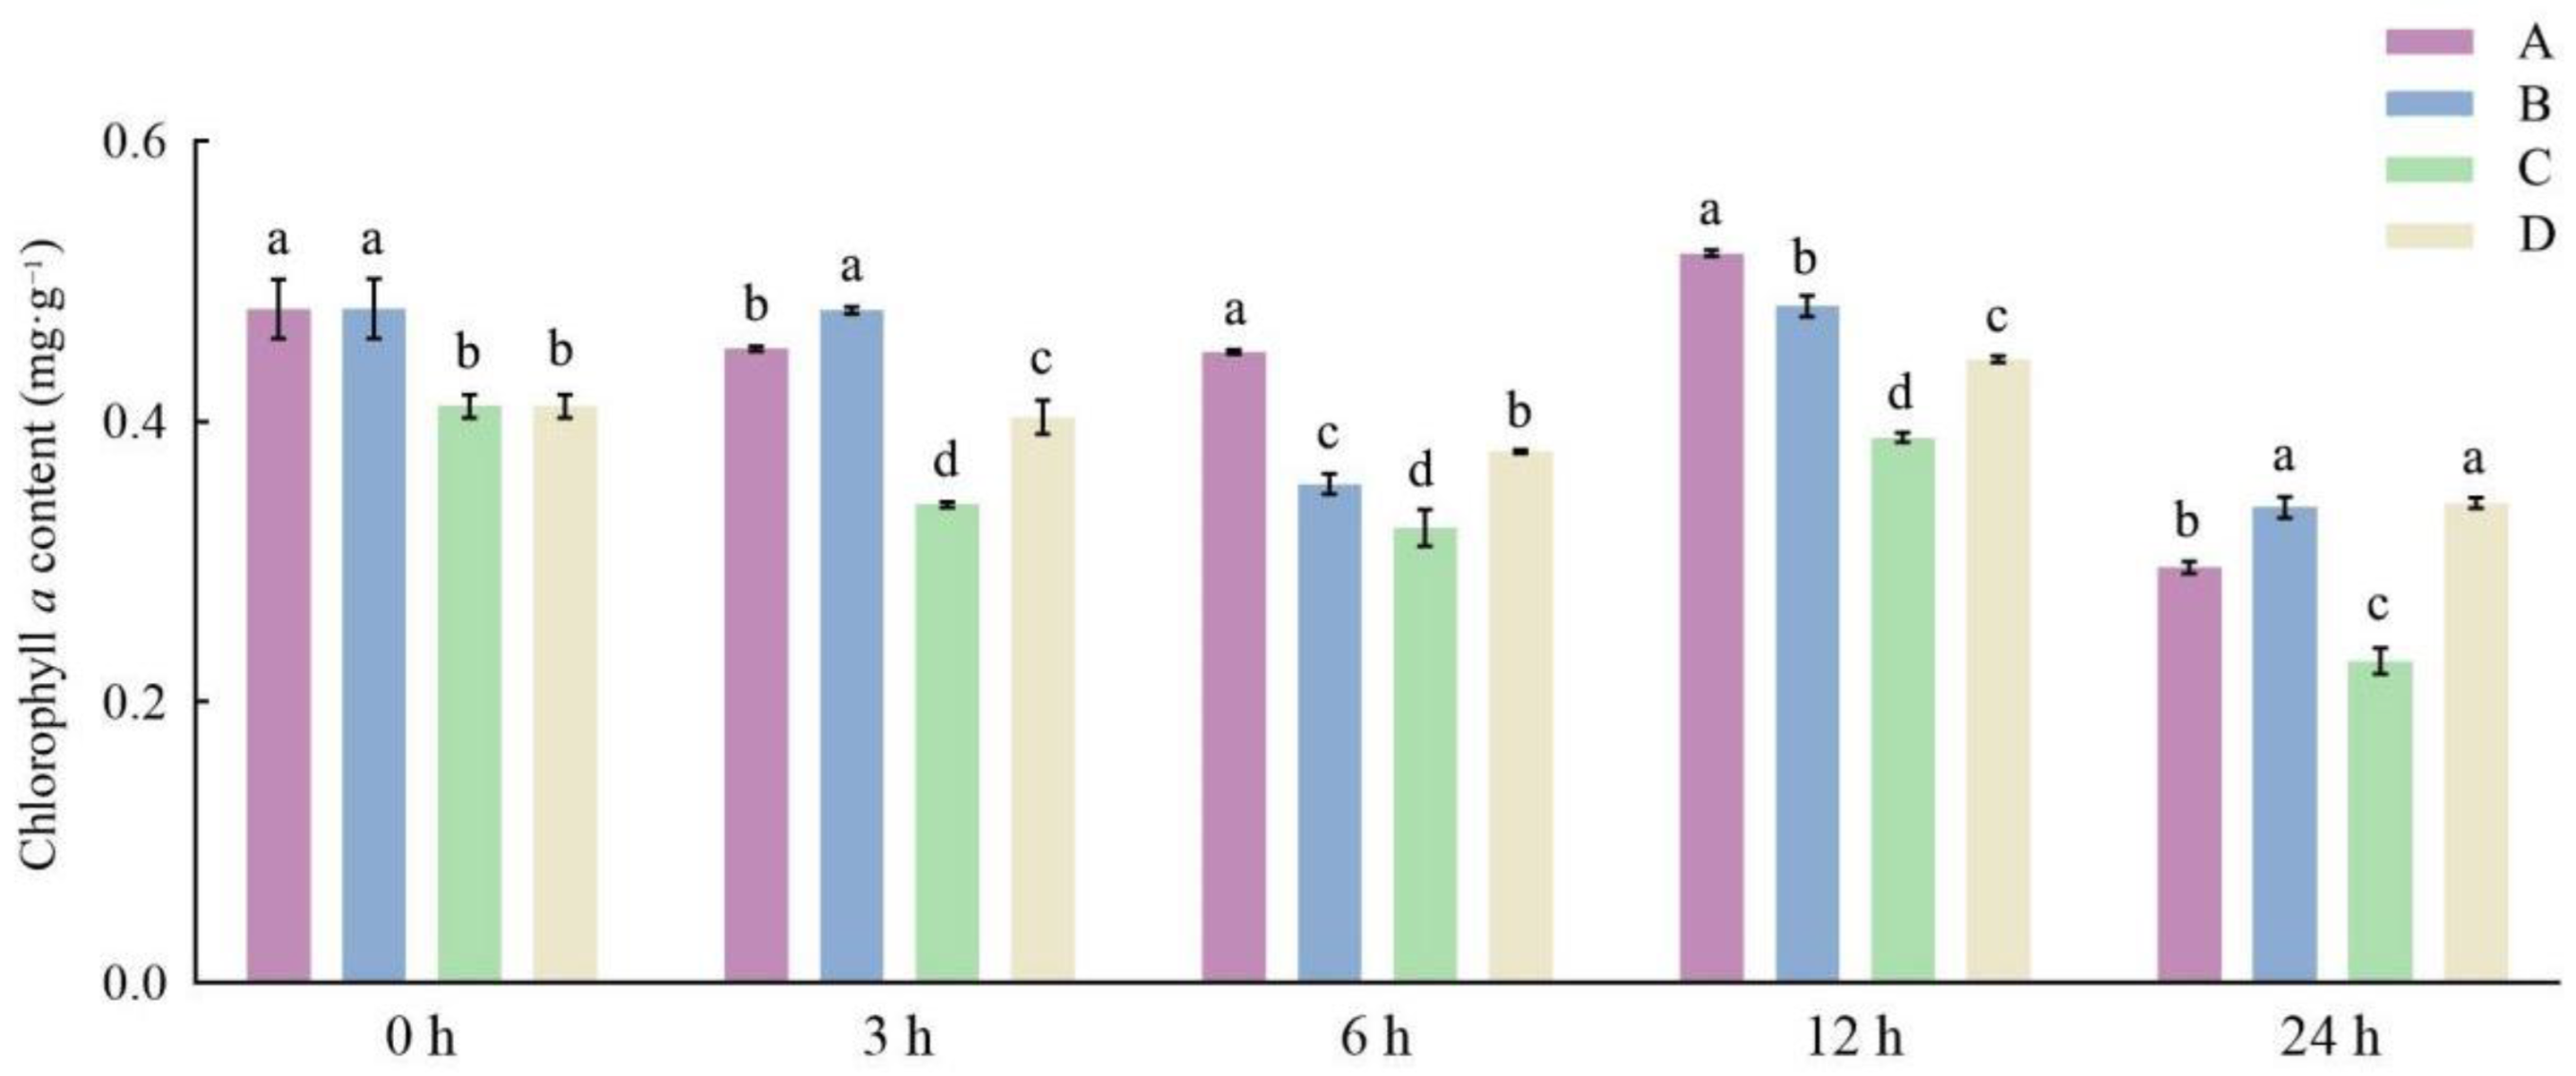
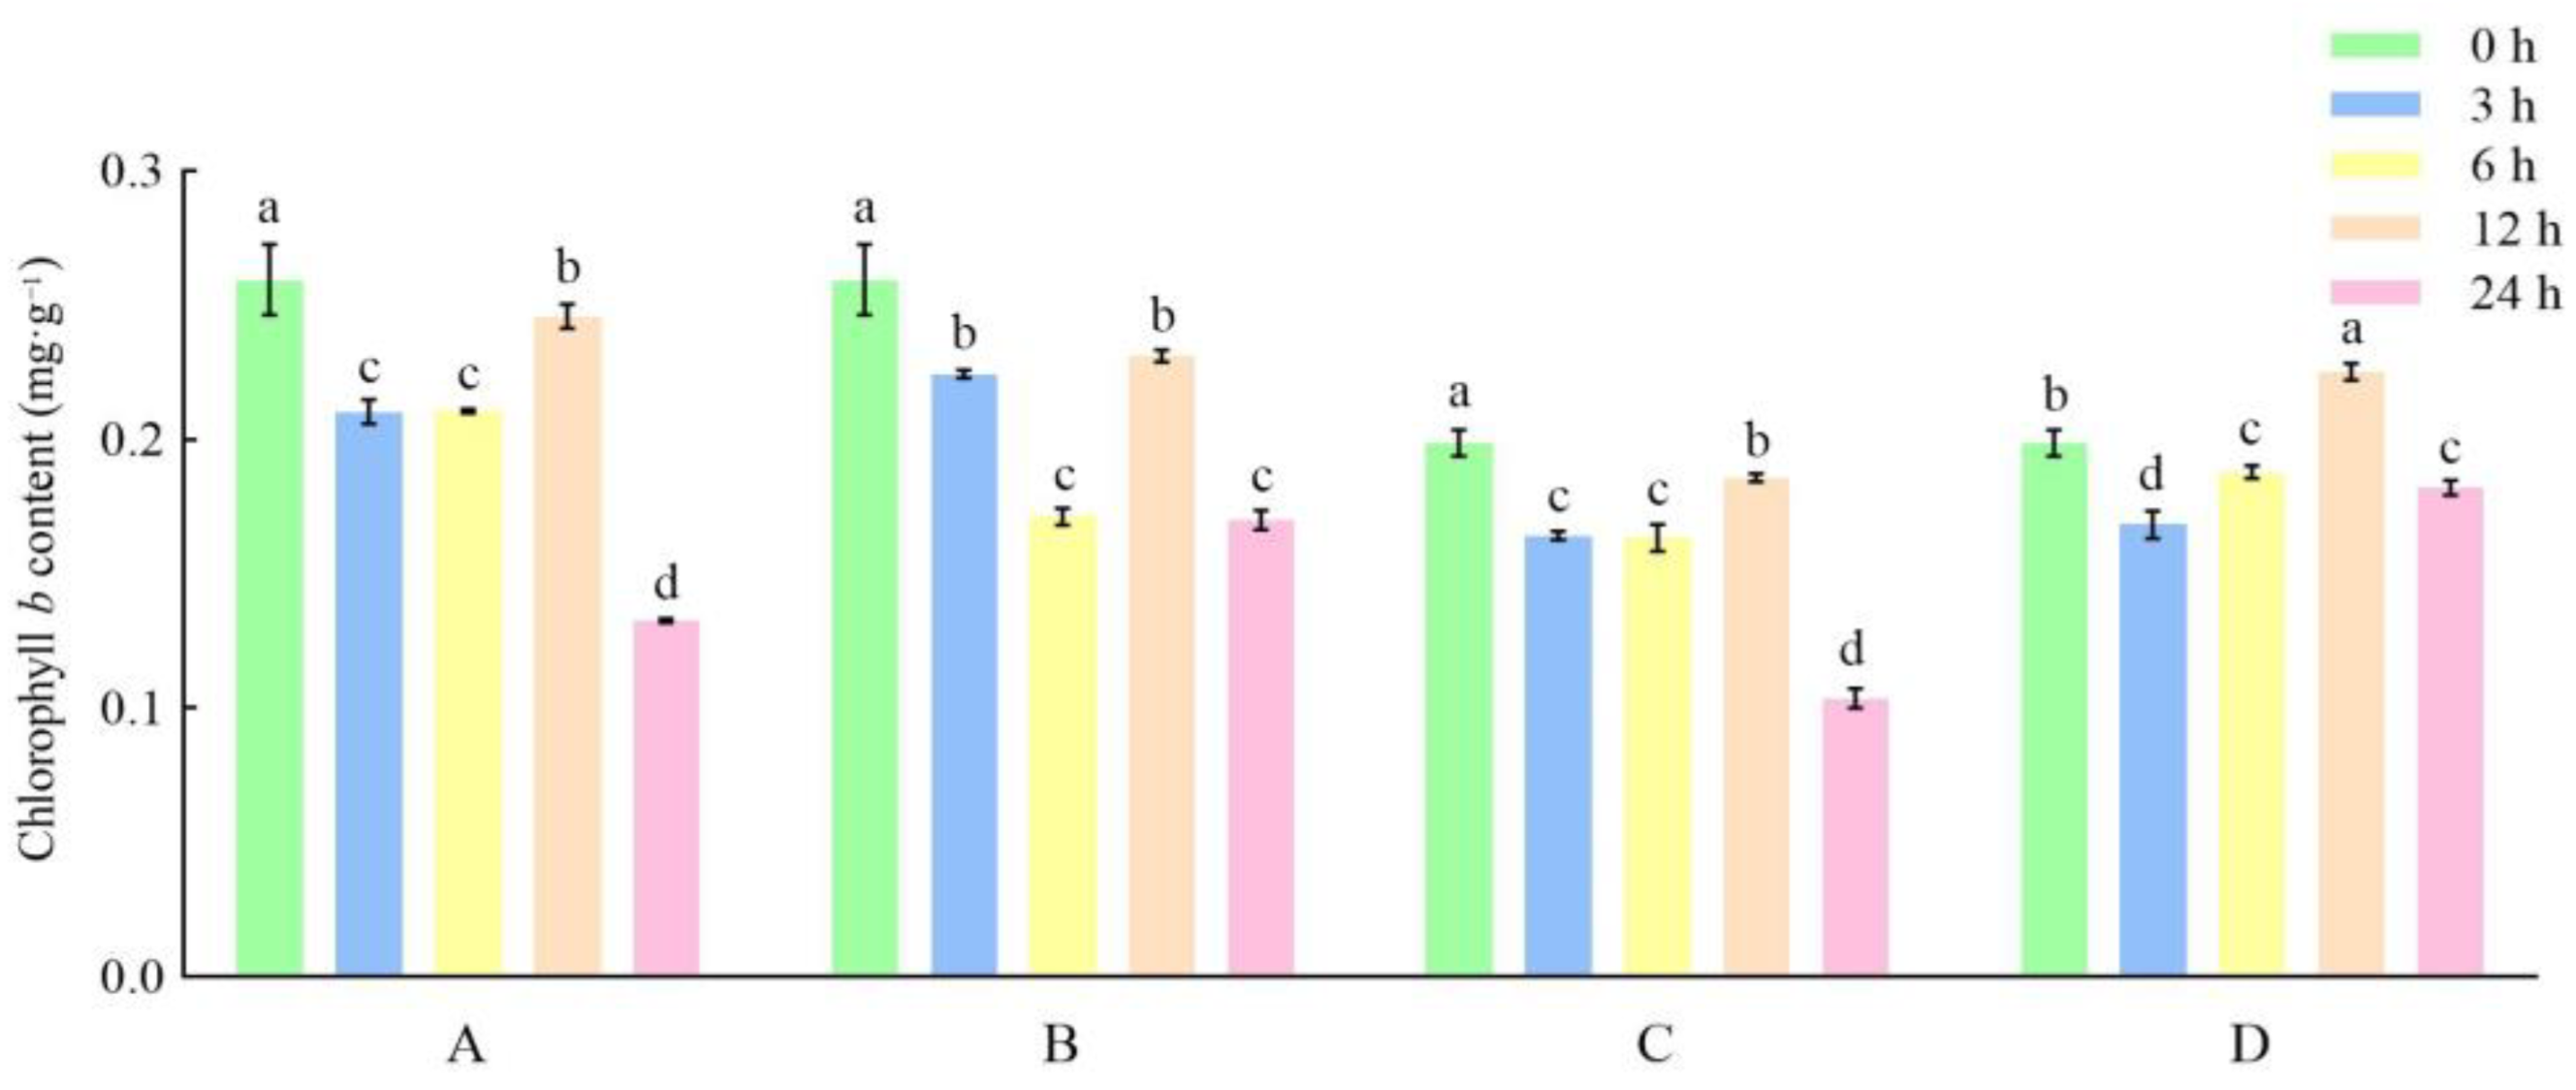
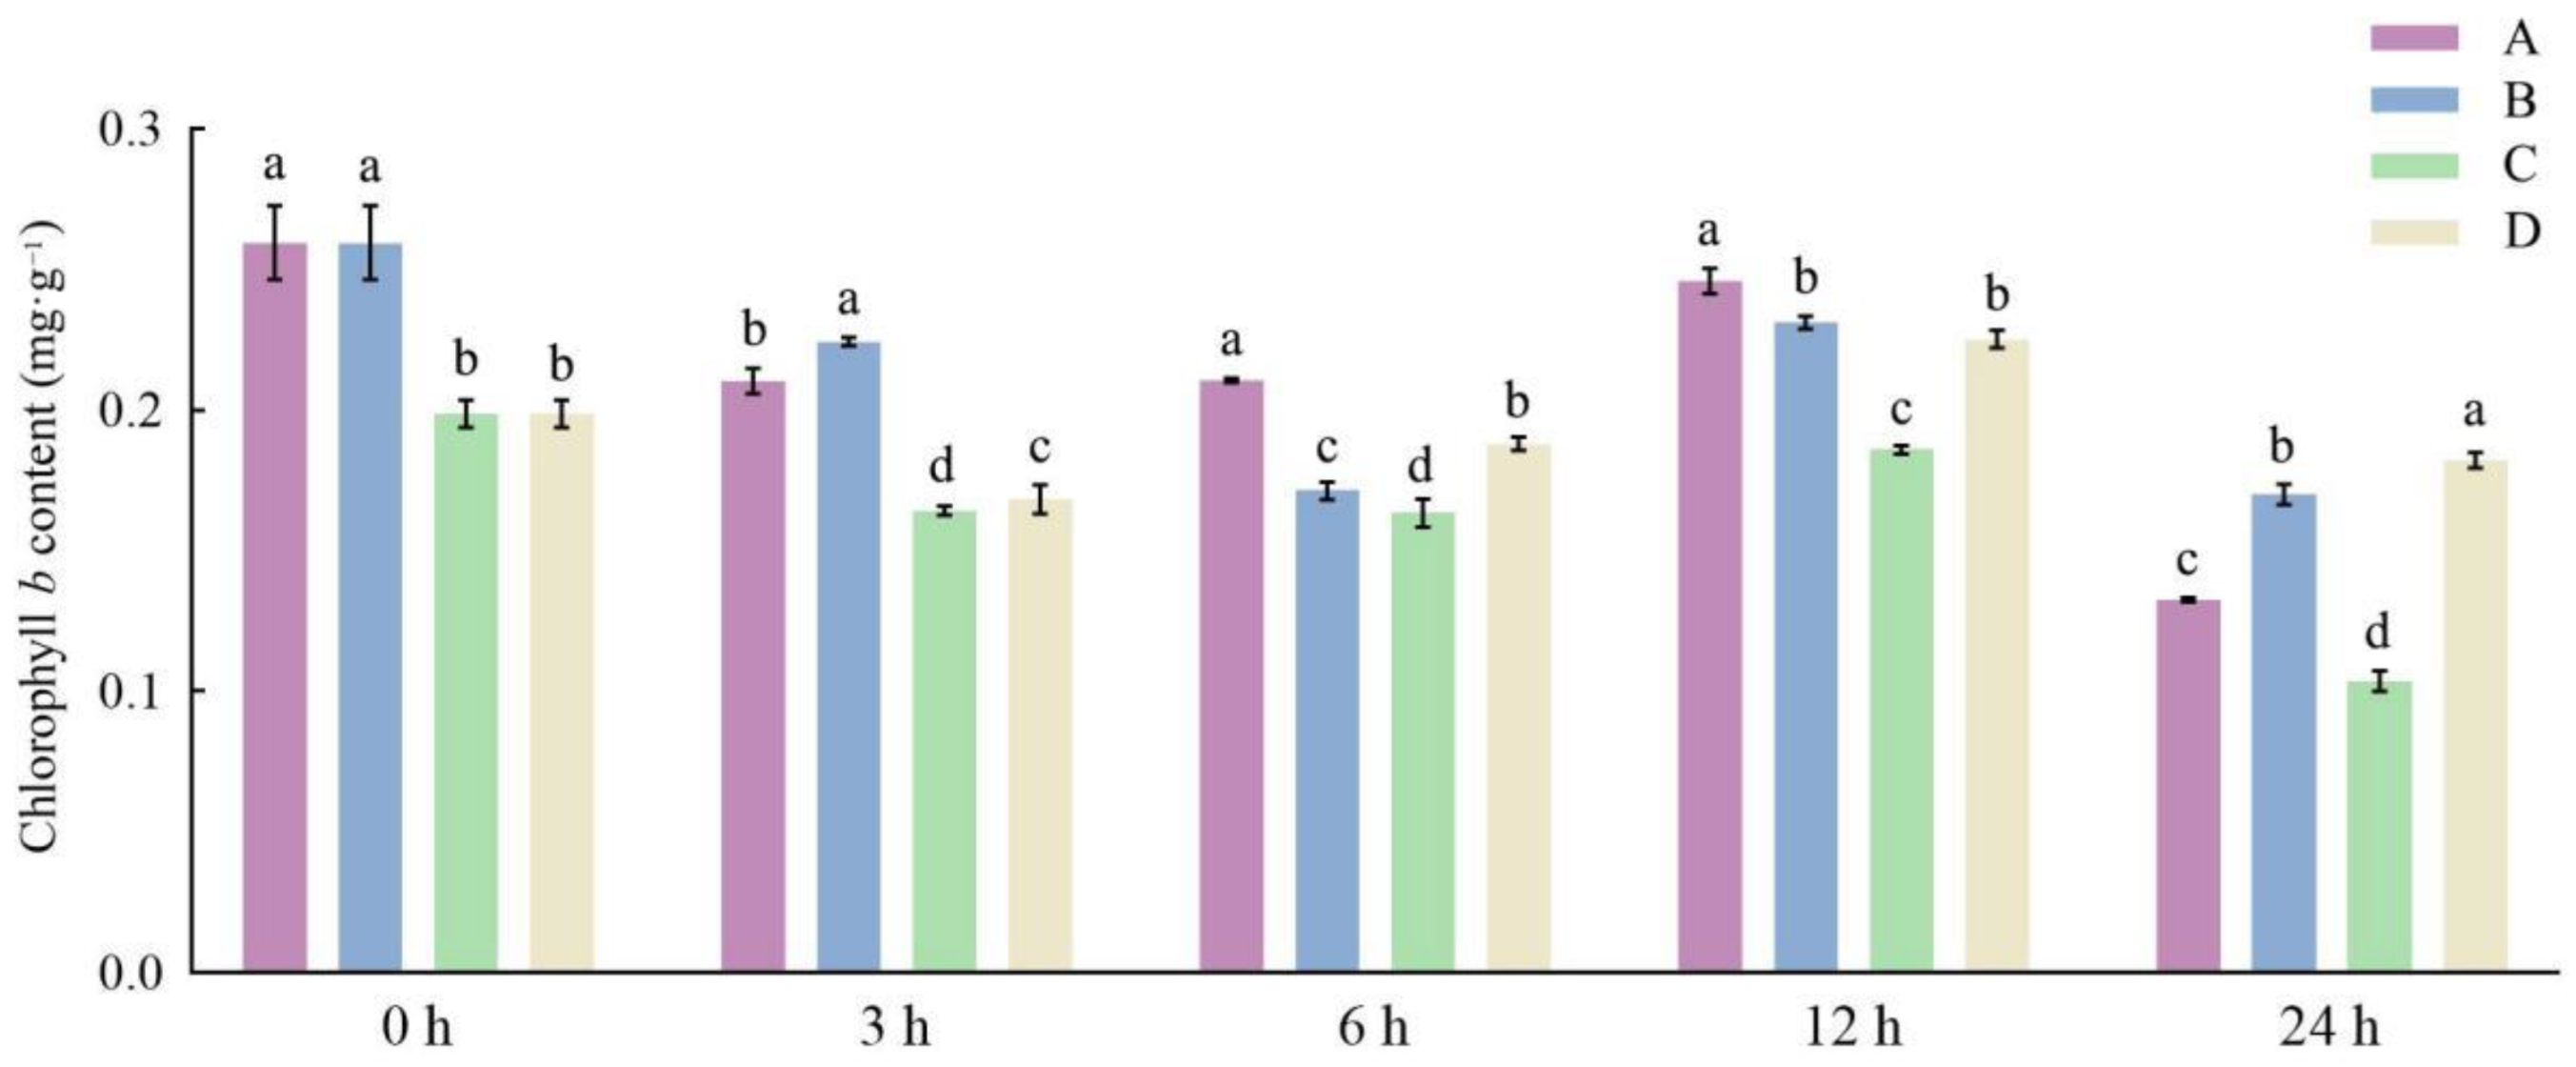
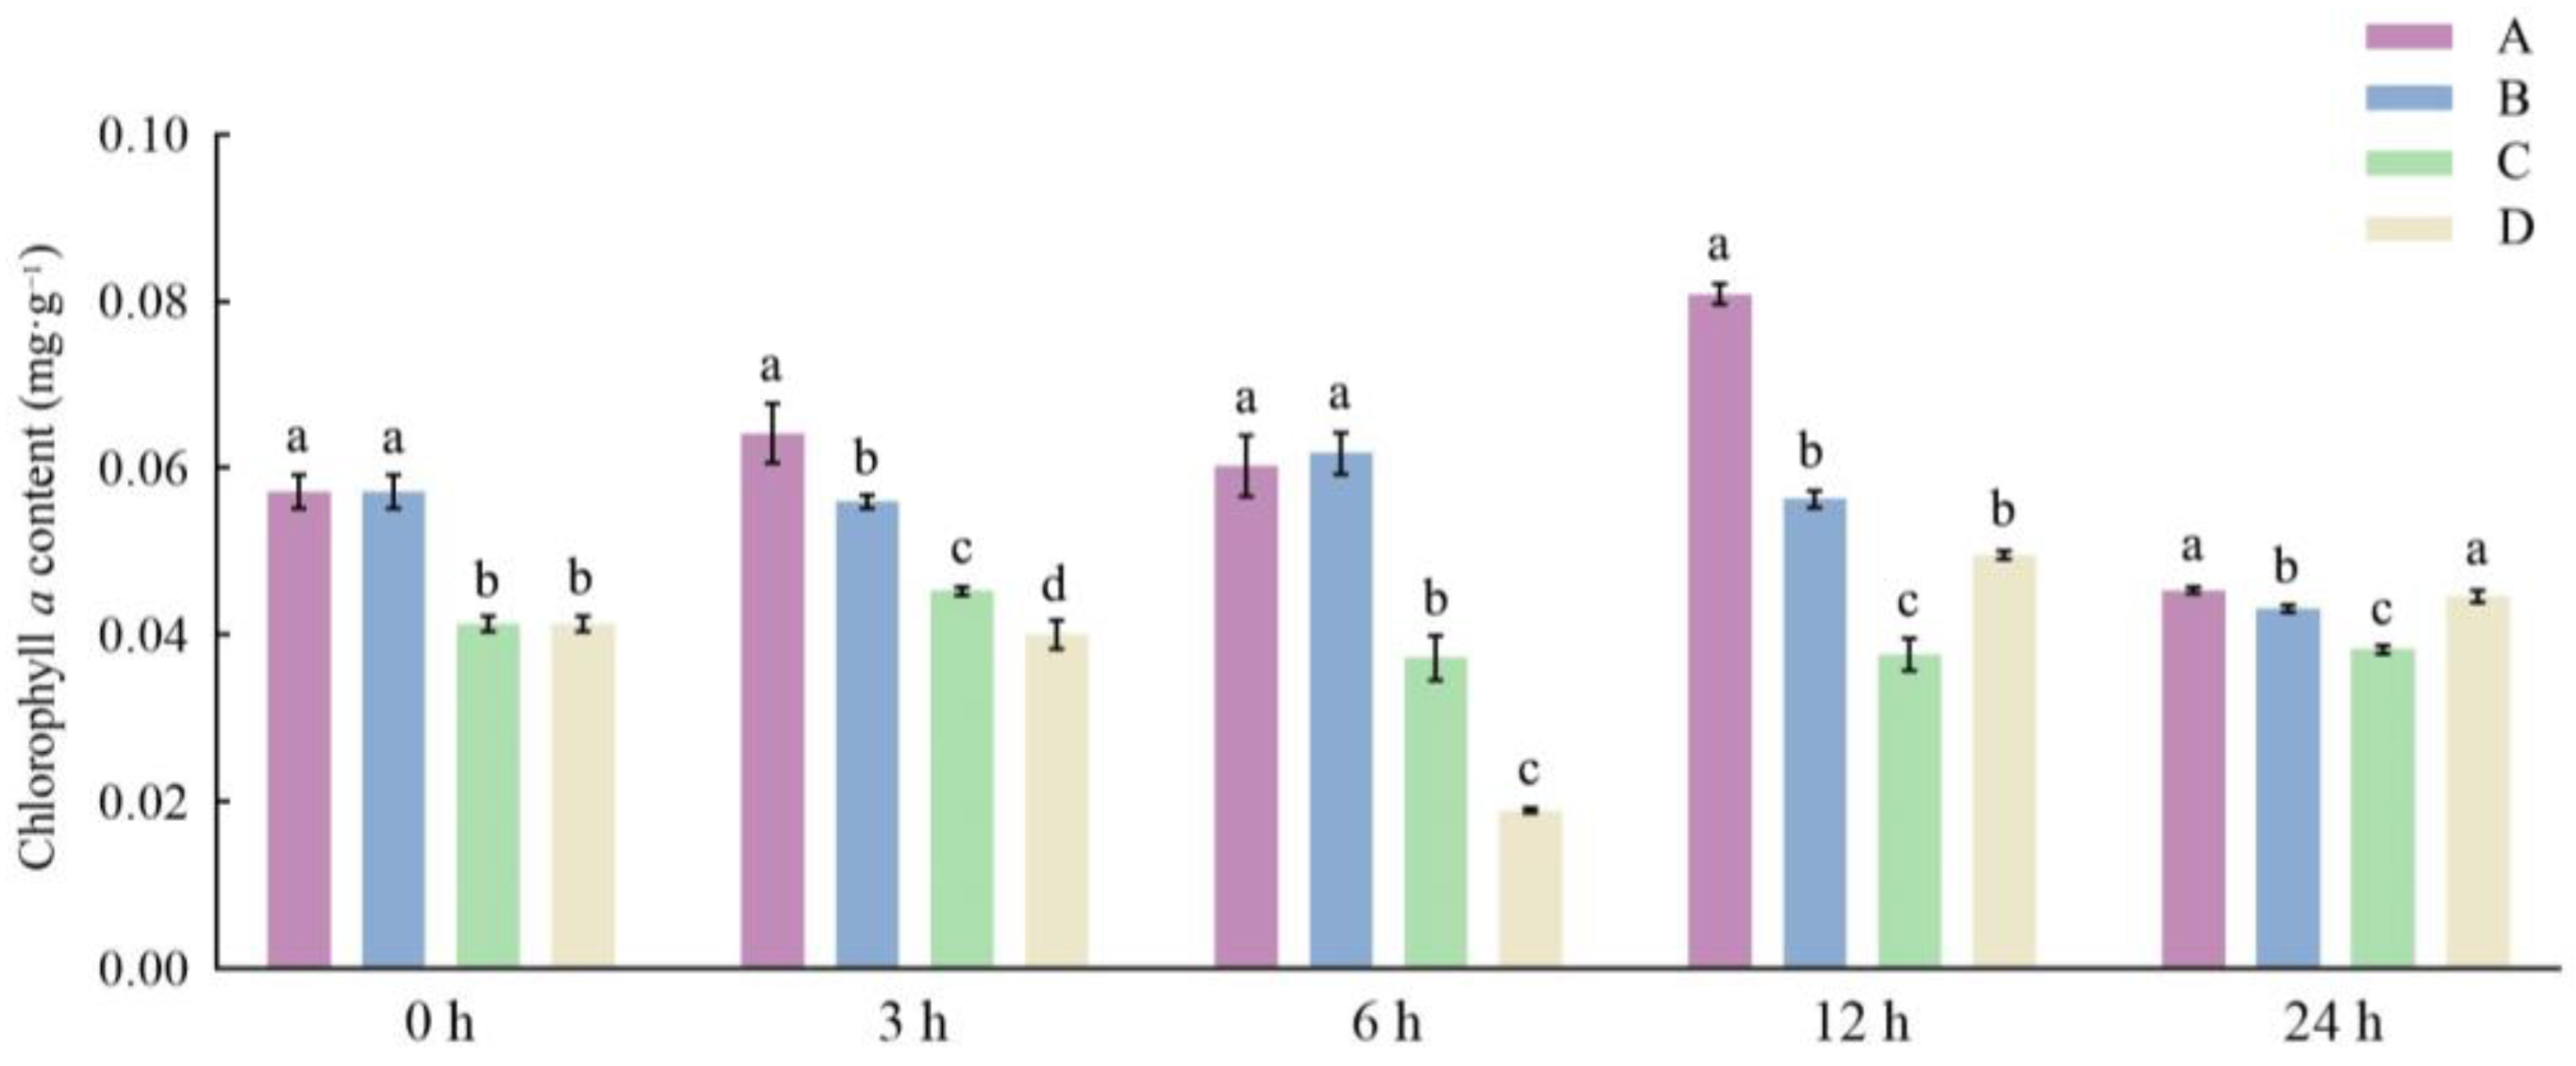
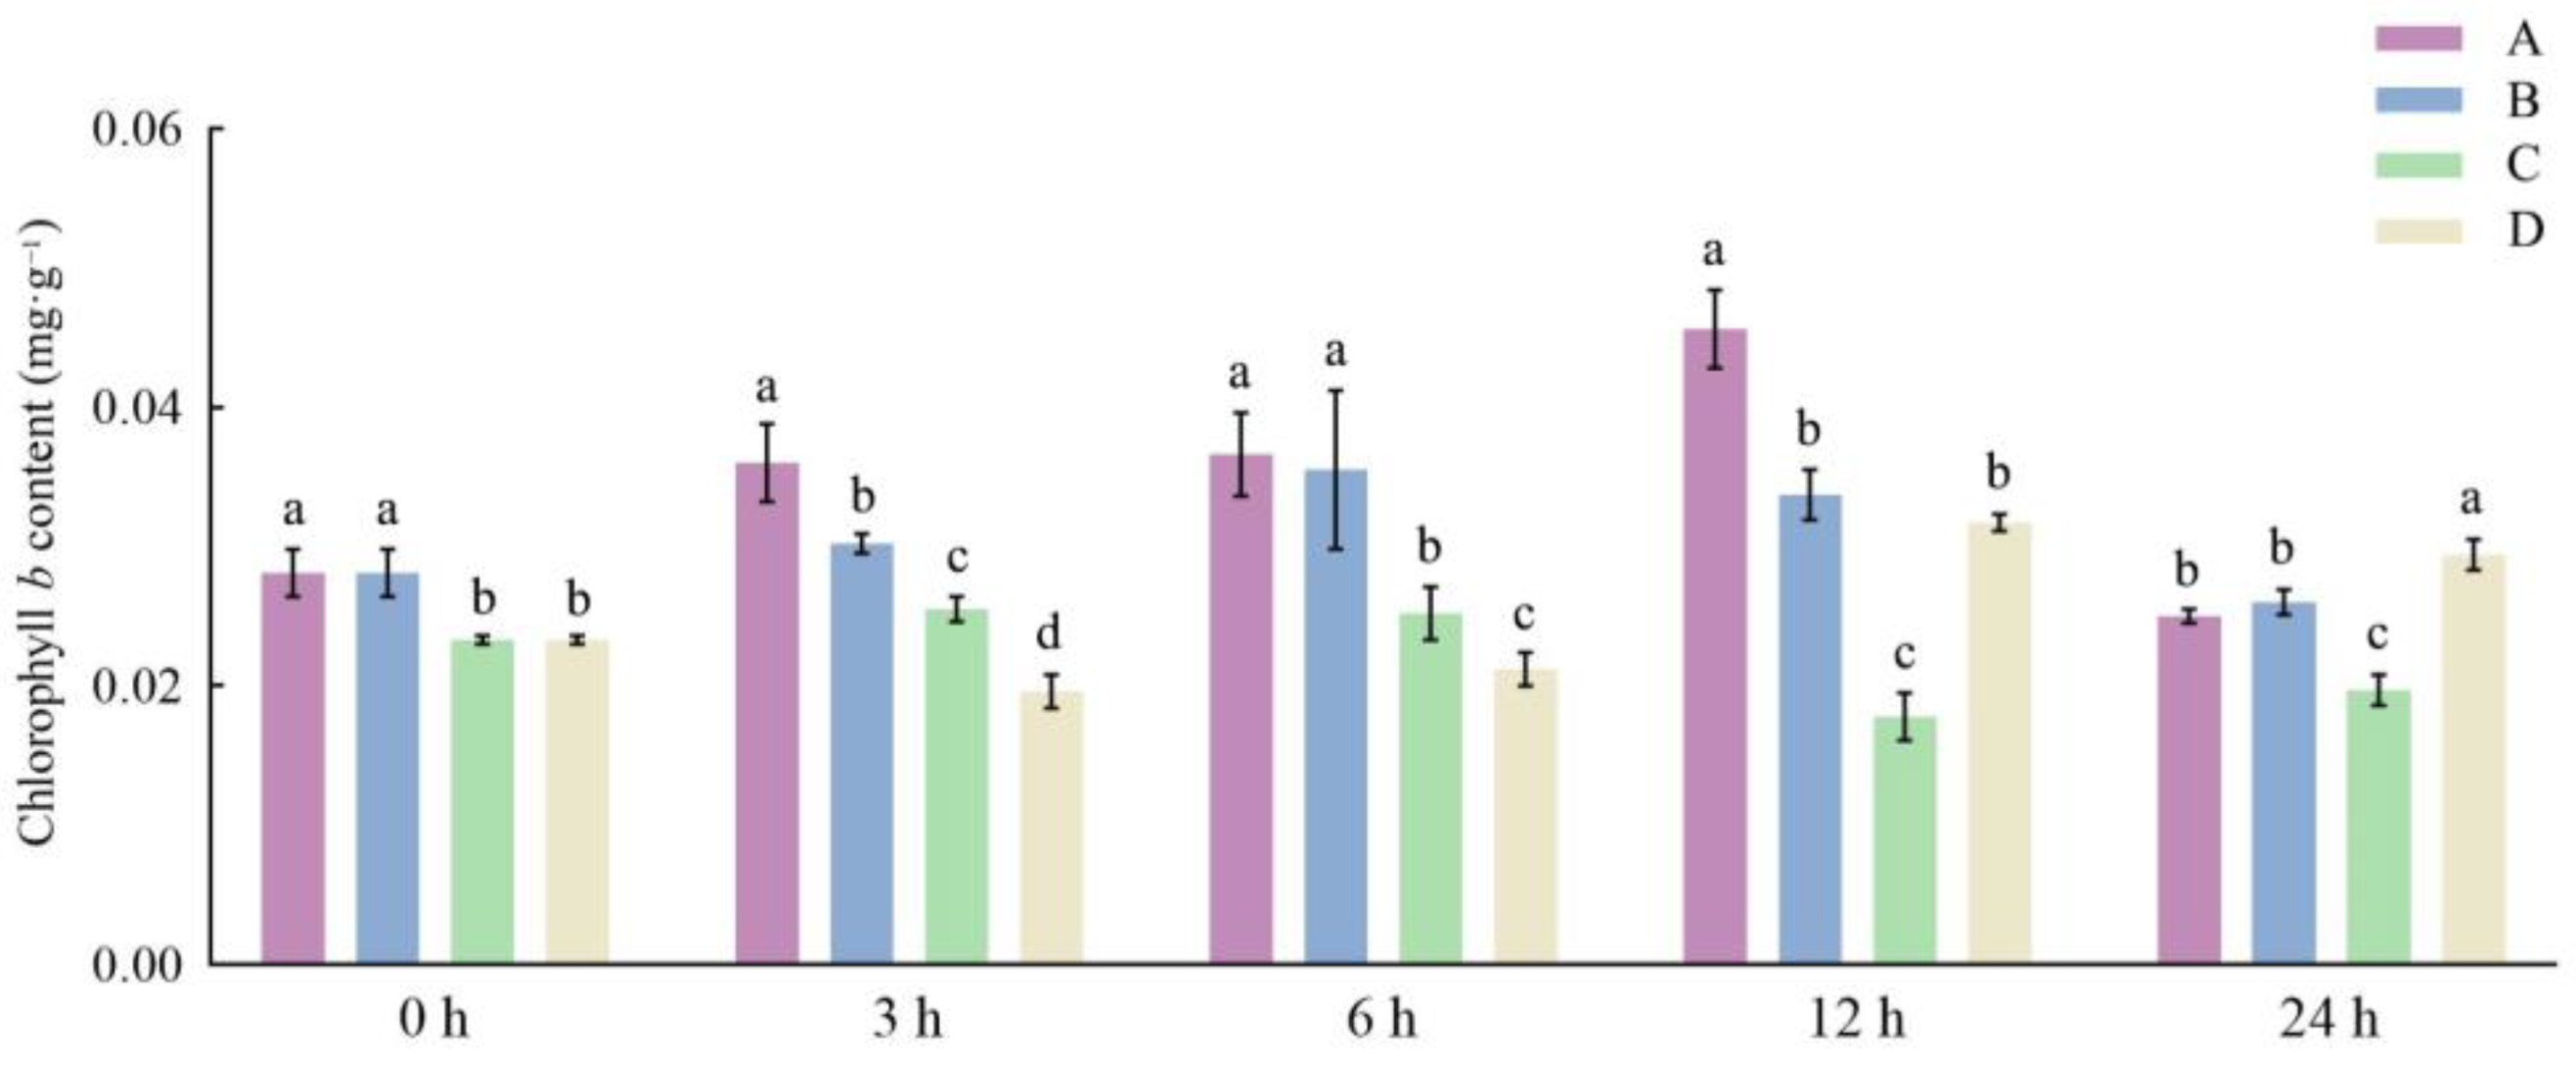
3.1. Effects of Different Storage and Thawing Temperatures on Chlorophyll Content of Celery Leaf Blades during Thawing

During the 0 to 6 h of thawing treatment, the total chlorophyll content of the two groups frozen and stored at −80 °C was higher than that of the two groups frozen and stored at −18 °C (Figure 1 and Figure 2). During the 6 to 12 h of thawing treatment, the total chlorophyll content of each group showed an increase. Among the two experimental groups frozen and stored at −80 °C, the slope of the thawing group at 25 °C was nearly four times higher than that of the treatment group at 4 °C, which showed the most obvious abnormal increase in total chlorophyll content in each group. In the two experimental groups frozen at −18 °C, the absolute slope was similar between the groups thawing at 25 °C and 4 °C. After 24 h thawing, the total chlorophyll content of all groups decreased significantly, while the total remaining chlorophyll content of the groups −80 °C and 25 °C and −18 °C and 25 °C was more than 0.5 mg/g. The remaining content of chlorophyll in freezing at −18 °C and 4 °C group was the least, only 0.14 mg/g (Figure 1 and Figure 2).
From the perspective of total degradation rate, the maximum total loss of chlorophyll was present in the group of −18 °C and 4 °C, in which the total degradation rate of chlorophyll reached 45.4%. The minimum total loss of chlorophyll is the group of −18 °C and 25 °C, in which the total loss of chlorophyll is only 14.1% (Figure 1 and Figure 2). The changing trend of chlorophyll a and chlorophyll b contents in each treatment group was basically the same as the changing trend of total chlorophyll content in thawing time (Figure 3, Figure 4, Figure 5 and Figure 6). The composition ratio of various types of chlorophyll in leaf blades, chlorophyll a content/chlorophyll b content (Chl a/Chl b) in leaf blades was approximately 2:1 before thawing, with the similar ratio content change trend of chlorophyll during all thawing process. After 24 h of degradation, the contents of both kinds of chlorophyll decreased significantly, but their relative proportions did not change significantly (Figure 3, Figure 4, Figure 5 and Figure 6). It could be seen that in the thawing process of celery leaf blades, all kinds of chlorophyll are degraded evenly, and their content change trend is similar. The lower the temperature during storage and thawing, the lower the relative loss of chlorophyll (Figure 1, Figure 2, Figure 3, Figure 4, Figure 5 and Figure 6).

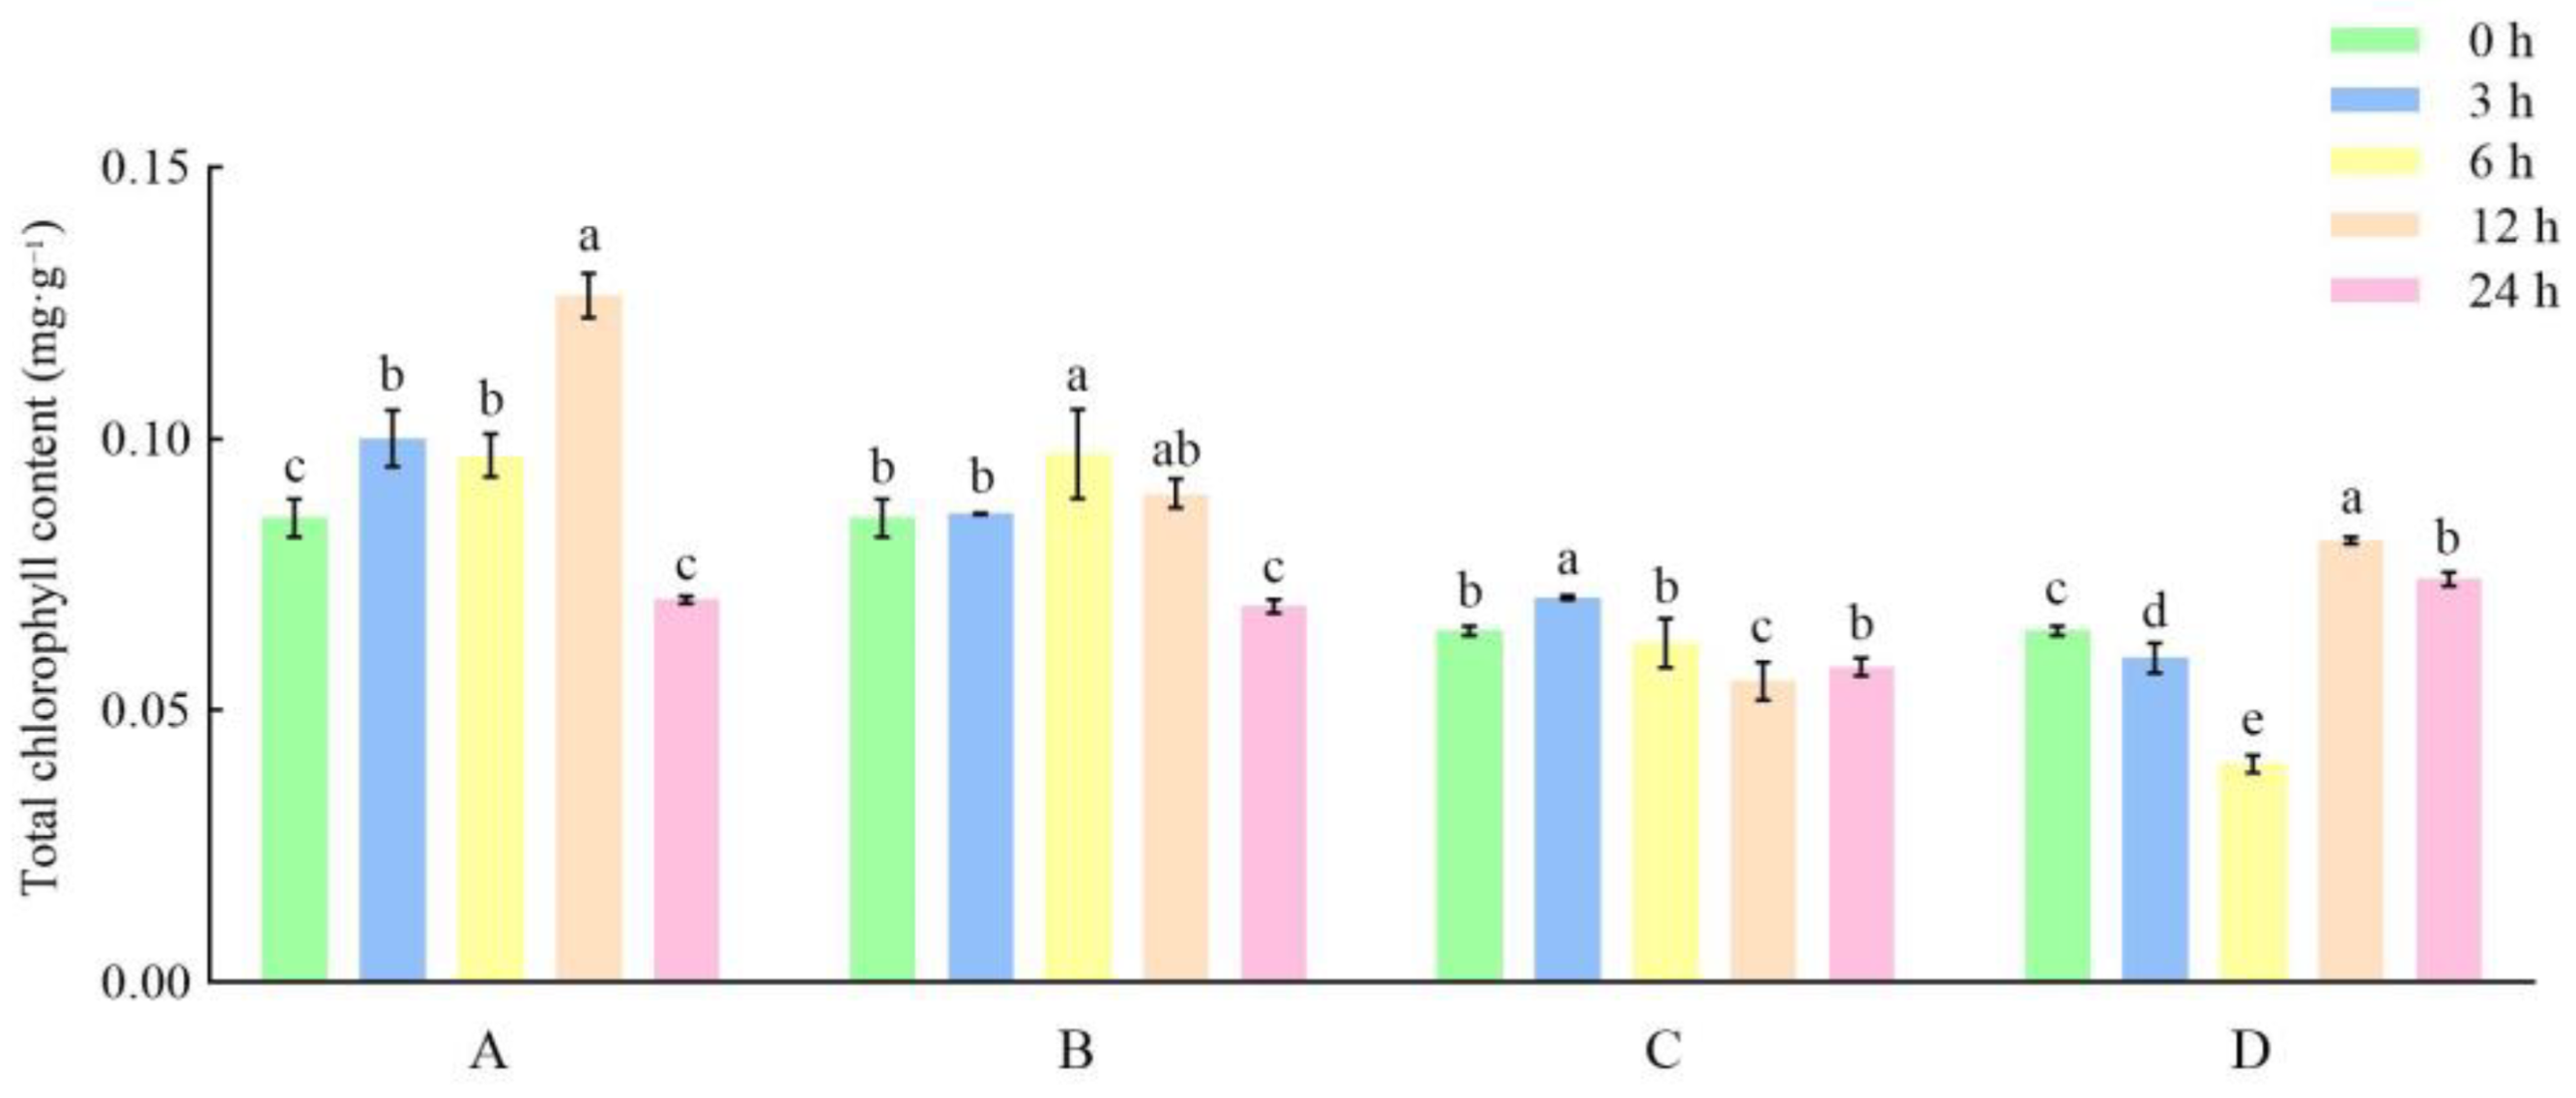
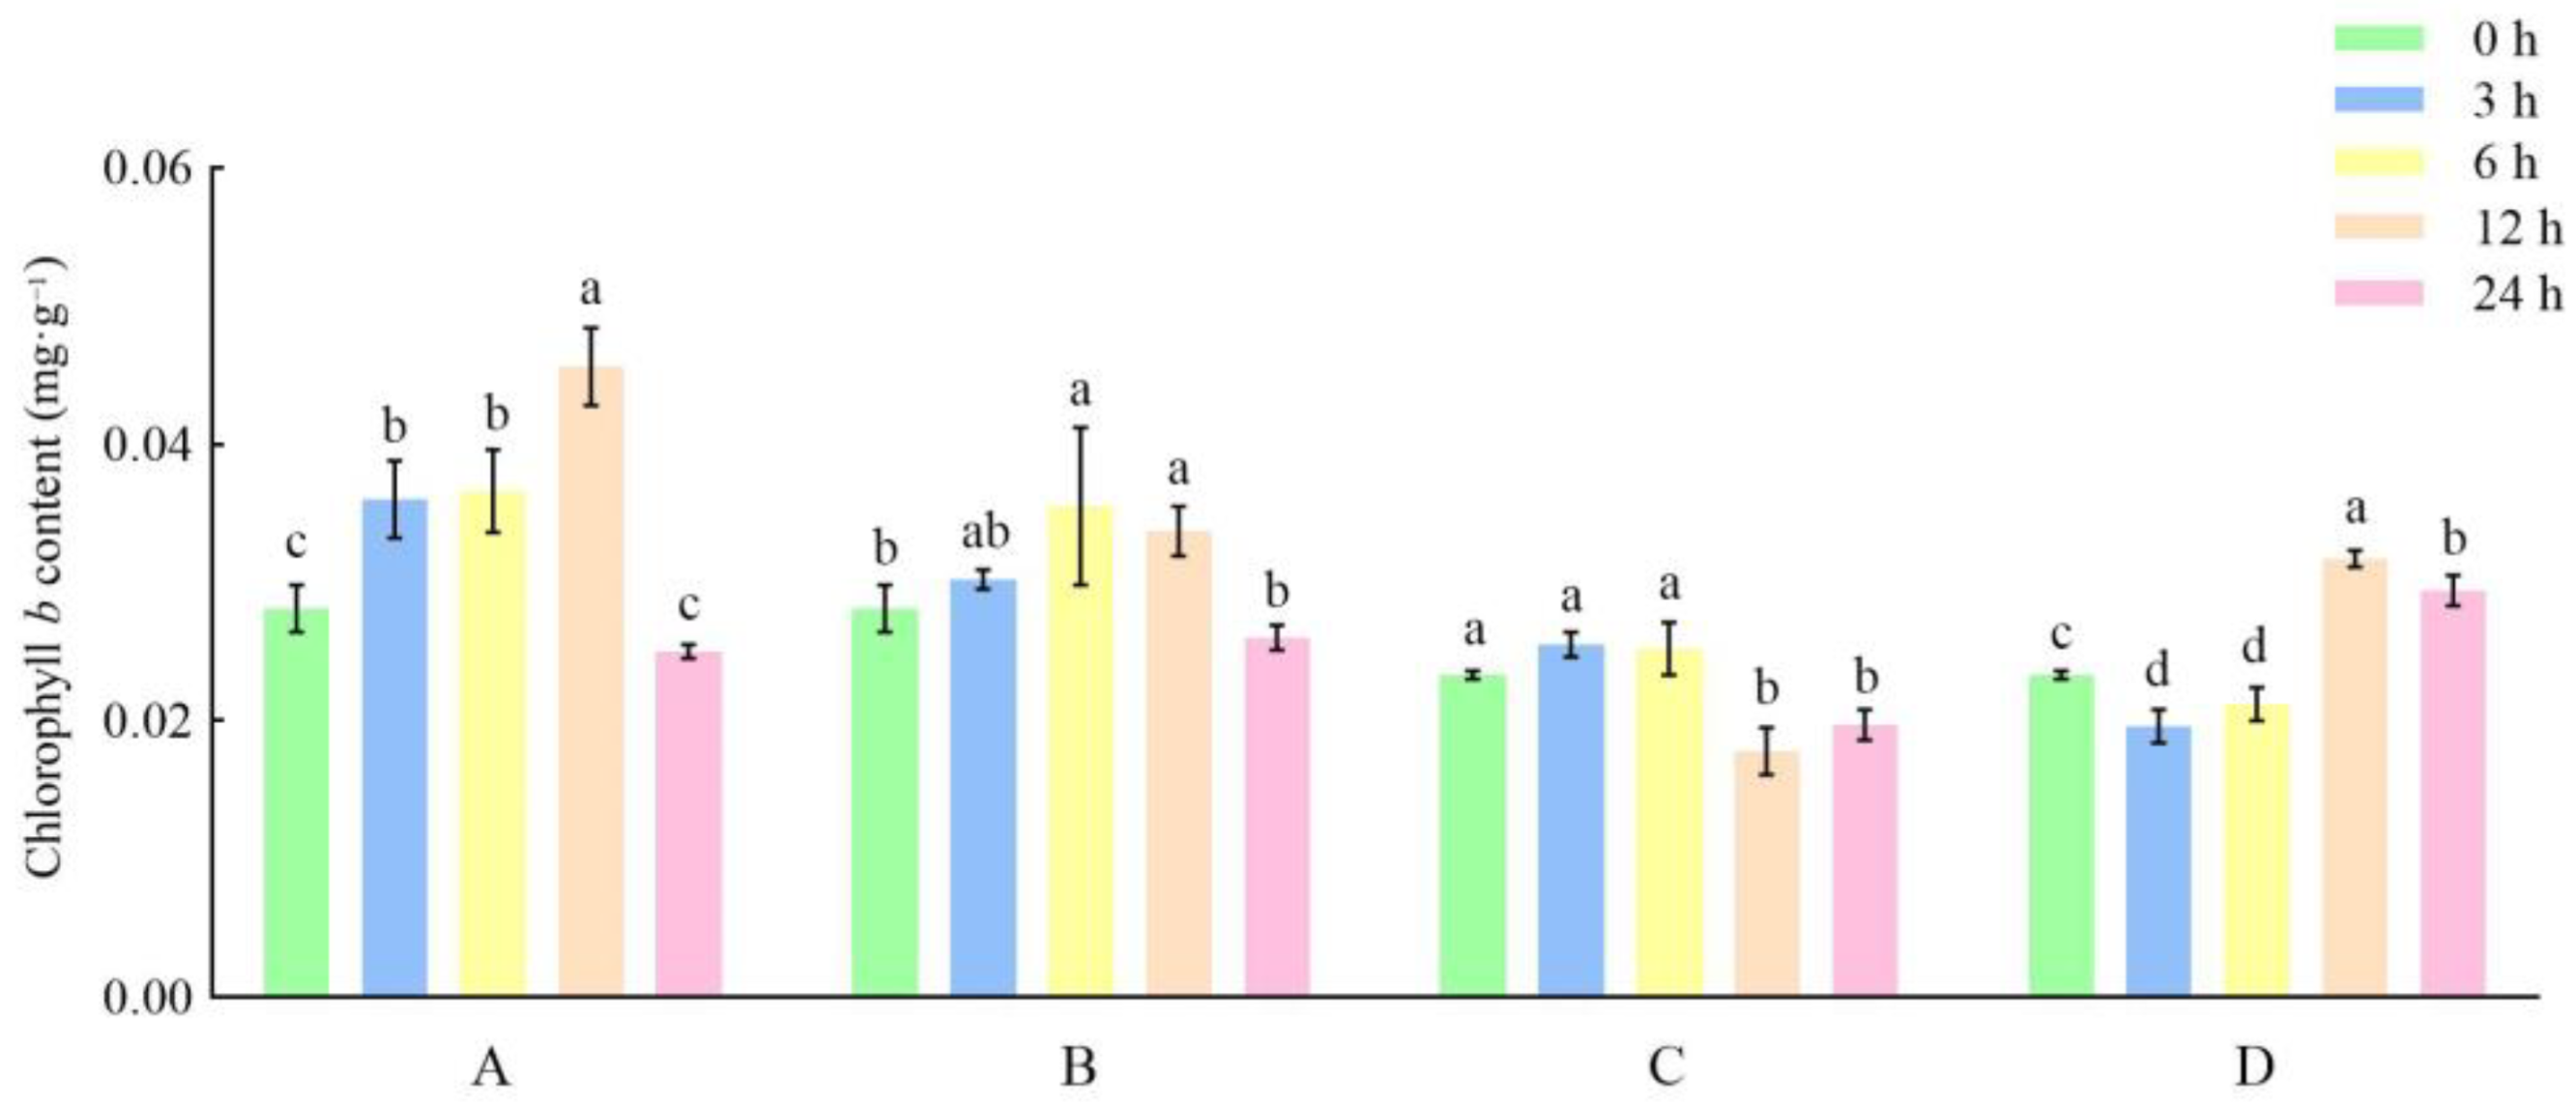
3.2. Effects of Different Storage and Thawing Temperatures on Chlorophyll Content of Celery Petioles during Thawing

Before thawing, the total chlorophyll content of petioles in the freezing storage group at −80 °C was 0.085 mg·g−1, while that in the freezing storage group at −18 °C was 0.065 mg/g, which was 23.5% lower than that in the freezing storage group at −80 °C. From 0 to 3 h after thawing treatment, except for no obvious decrease in the total chlorophyll absorption content of the −18 °C and 25 °C group, the total chlorophyll content in each other group showed a slightly increasing trend with the maximum increase in the total chlorophyll content of the −80 °C and 4 °C group. During the 3 to 6 h of thawing treatment, except for the total chlorophyll content in the group of −18 °C and 25 °C showing an increase, the total chlorophyll content of the other groups began to decline in the group of −18 °C and 25 °C (Figure 7). The total chlorophyll content of the two groups frozen and stored at −80 °C was similar and significantly higher than that of the two groups frozen and stored at −18 °C, and the total chlorophyll content of the two groups thawed at 4 °C was higher than that of the two groups thawed at 25 °C (Figure 8). During the 6 to 12 h of thawing, the total chlorophyll content of the −18 °C and 4 °C group decreased while the second stage total chlorophyll oxidation peak in the other groups had reached. The total degradation rate of chlorophyll in the group of −18 °C and 25 °C was three times that of the group of −18 °C and 4 °C. After 24 h thawing, the peak value is reached at the group of −18 °C and 4 °C, and the final total content of chlorophyll in the other three groups was about 0.07 mg/g (Figure 7).
In the petioles of celery, the group of −18 °C and 4 °C was the proper green preservation, whose maximum total chlorophyll loss rate was 10.2%, in which the degradation speed and progress slowed down significantly compared with other groups. The degradation progress and total chlorophyll loss rate of the −18 °C and 25 °C groups were faster than those of other groups. The maximum loss rate reached 37.9%, which was nearly four times that of the group of −18 °C and 4 °C. The reduction in total chlorophyll was similar between the two groups frozen at −80 °C, but the degradation progress of the 25 °C thawing group was significantly more advanced than that of the 4 °C group (Figure 7 and Figure 8).
In each treatment group, the changing trend of chlorophyll a and chlorophyll b contents in celery petiole was basically the same as that of total chlorophyll content in thawing time (Figure 8, Figure 9, Figure 10, Figure 11 and Figure 12). The content ratio of Chl a/Chl b in petioles of celery was approximately 2:1 before thawing, which changed to nearly 3:2 after 24 h thawing. The degradation ratio of chlorophyll a was greater than that of the chlorophyll b of the petioles. It can be seen that the anti-decomposition stability of chlorophyll b is better than that of chlorophyll a in the petiole of celery. The contribution rate to total chlorophyll gradually increases in the late thawing period (Figure 8, Figure 9, Figure 10, Figure 11 and Figure 12).

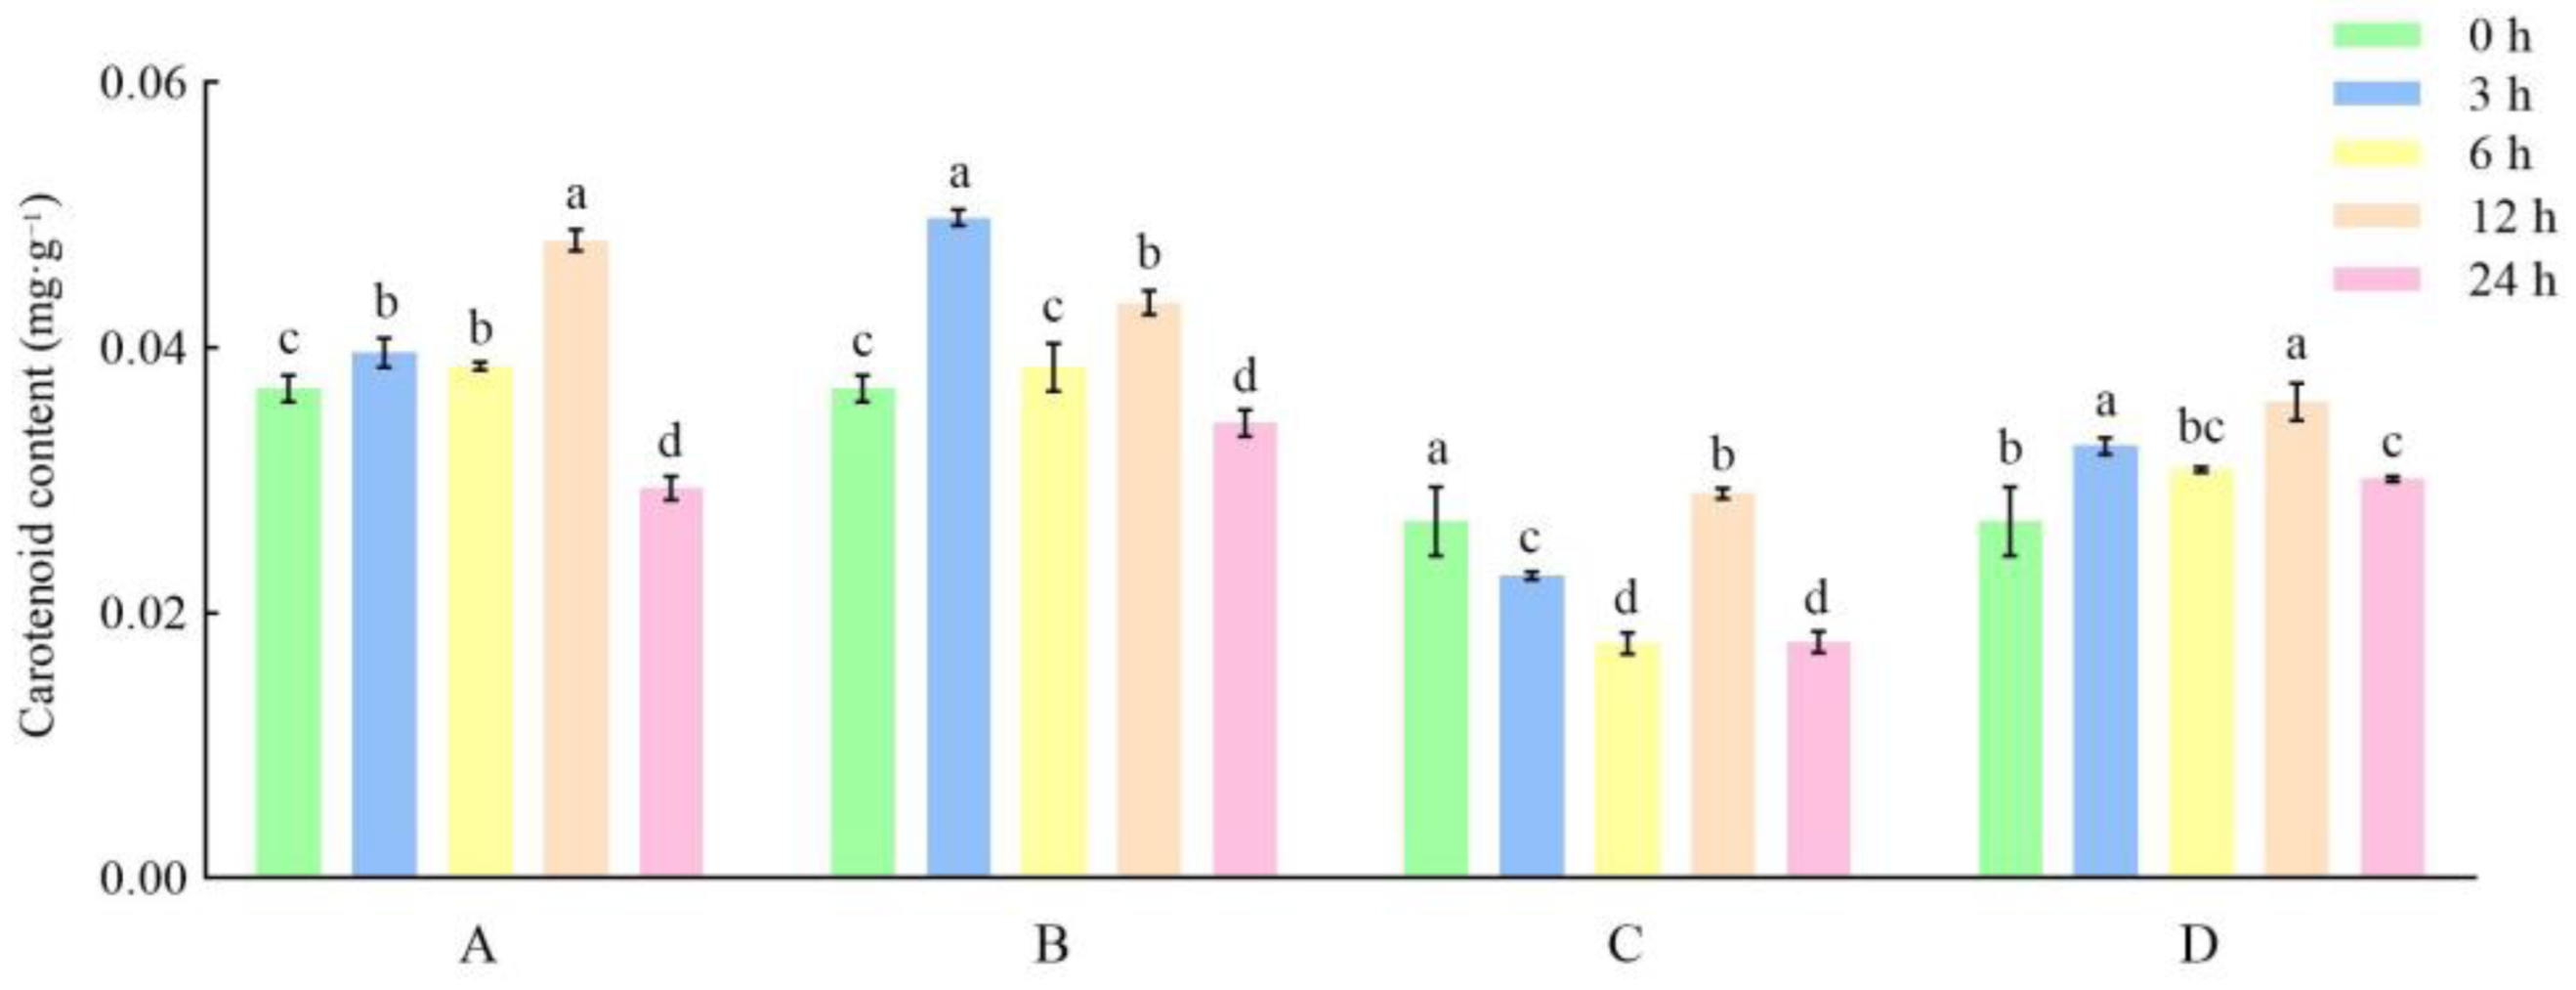
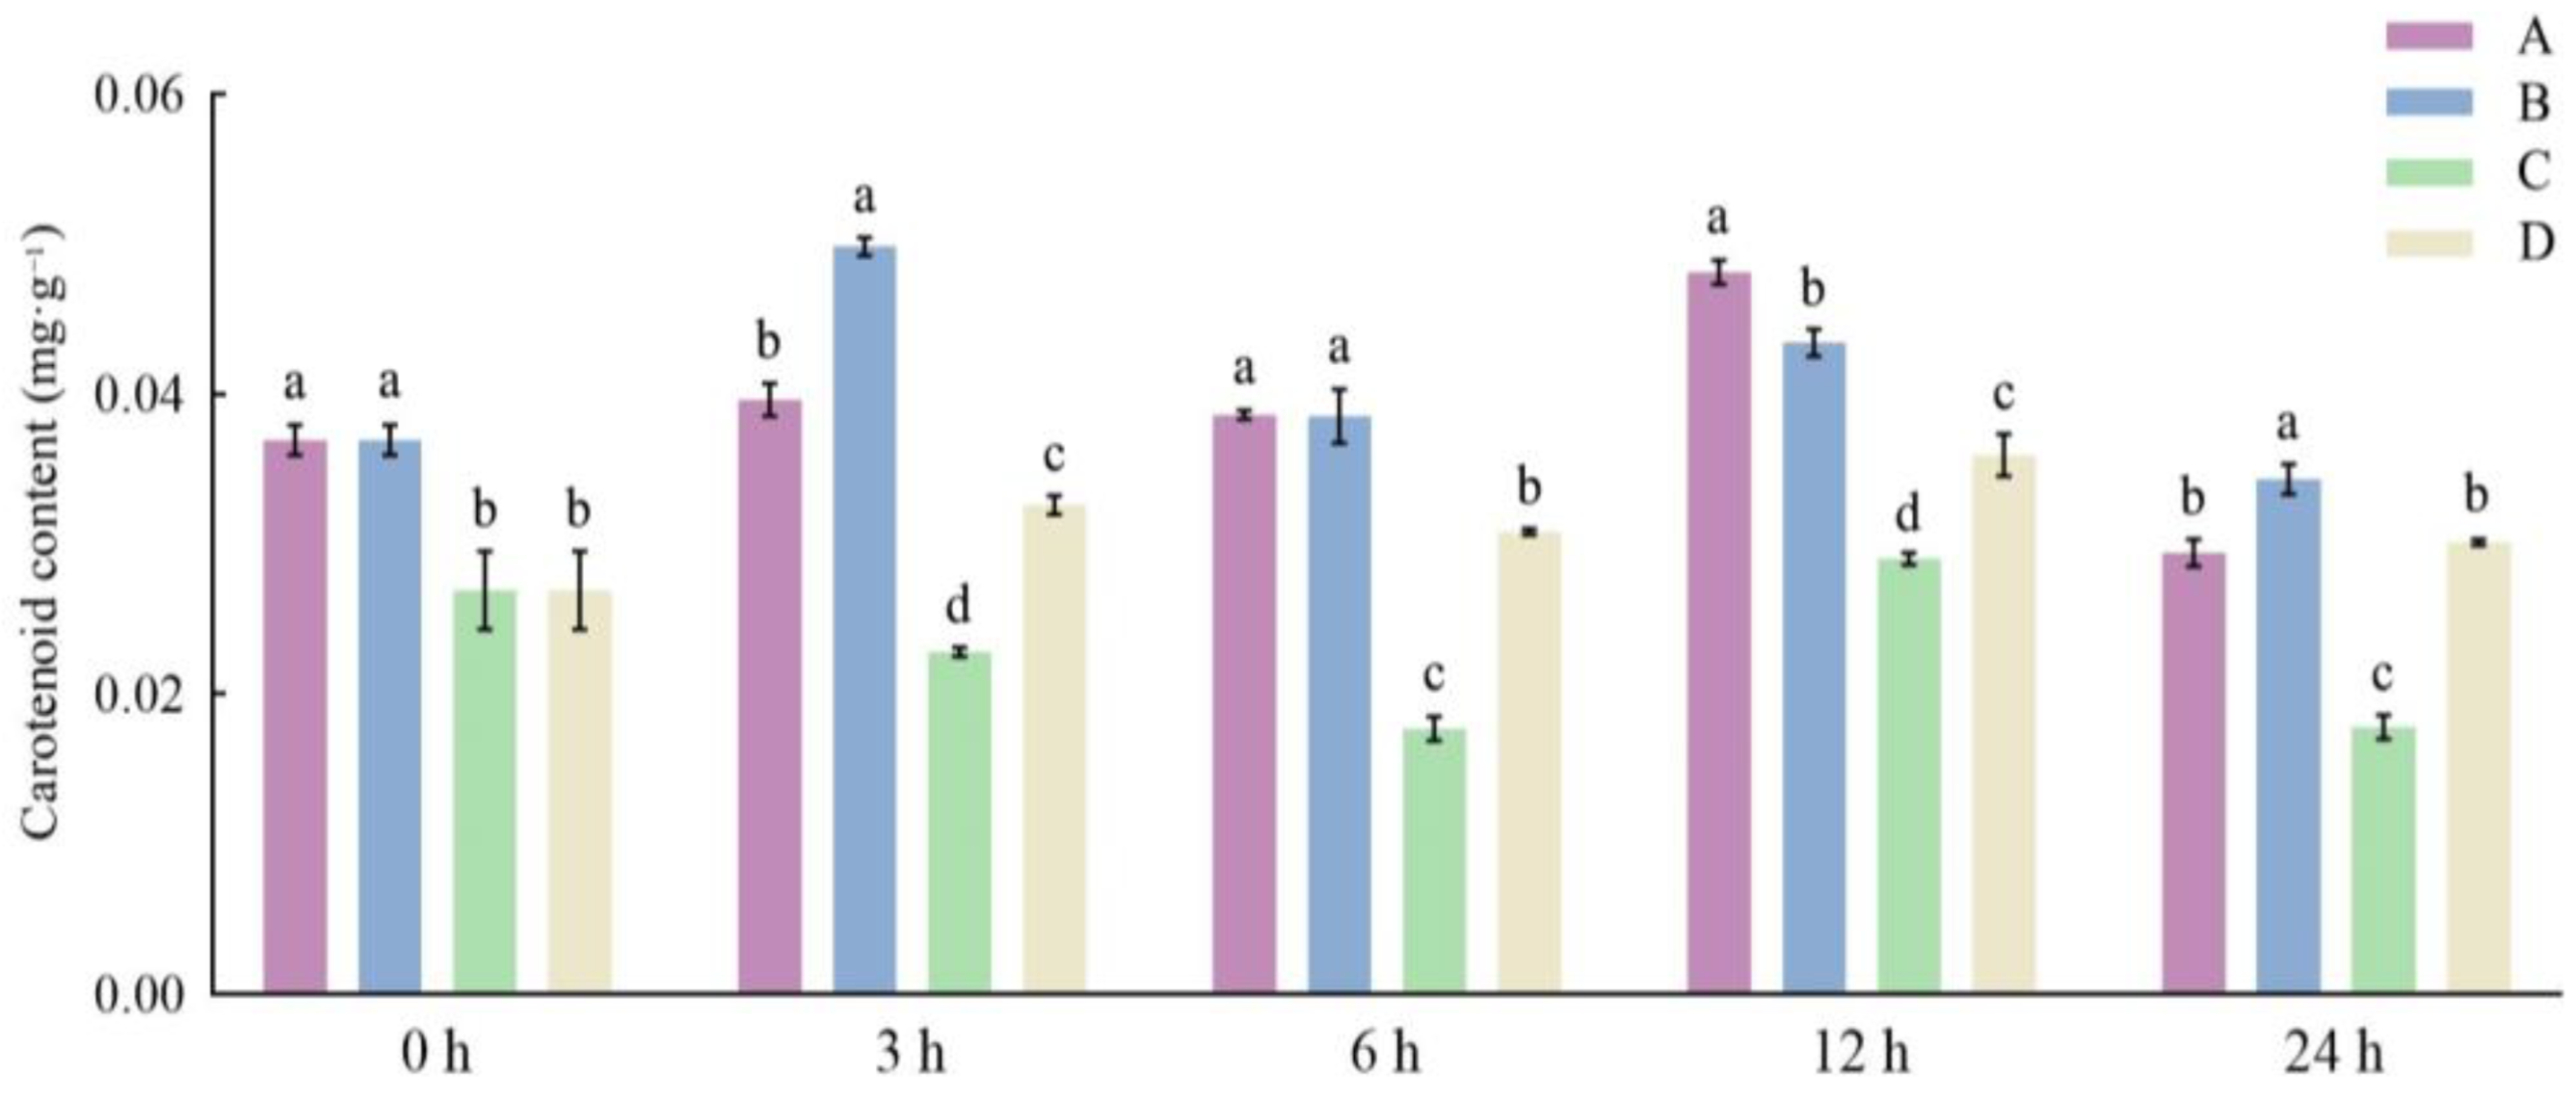
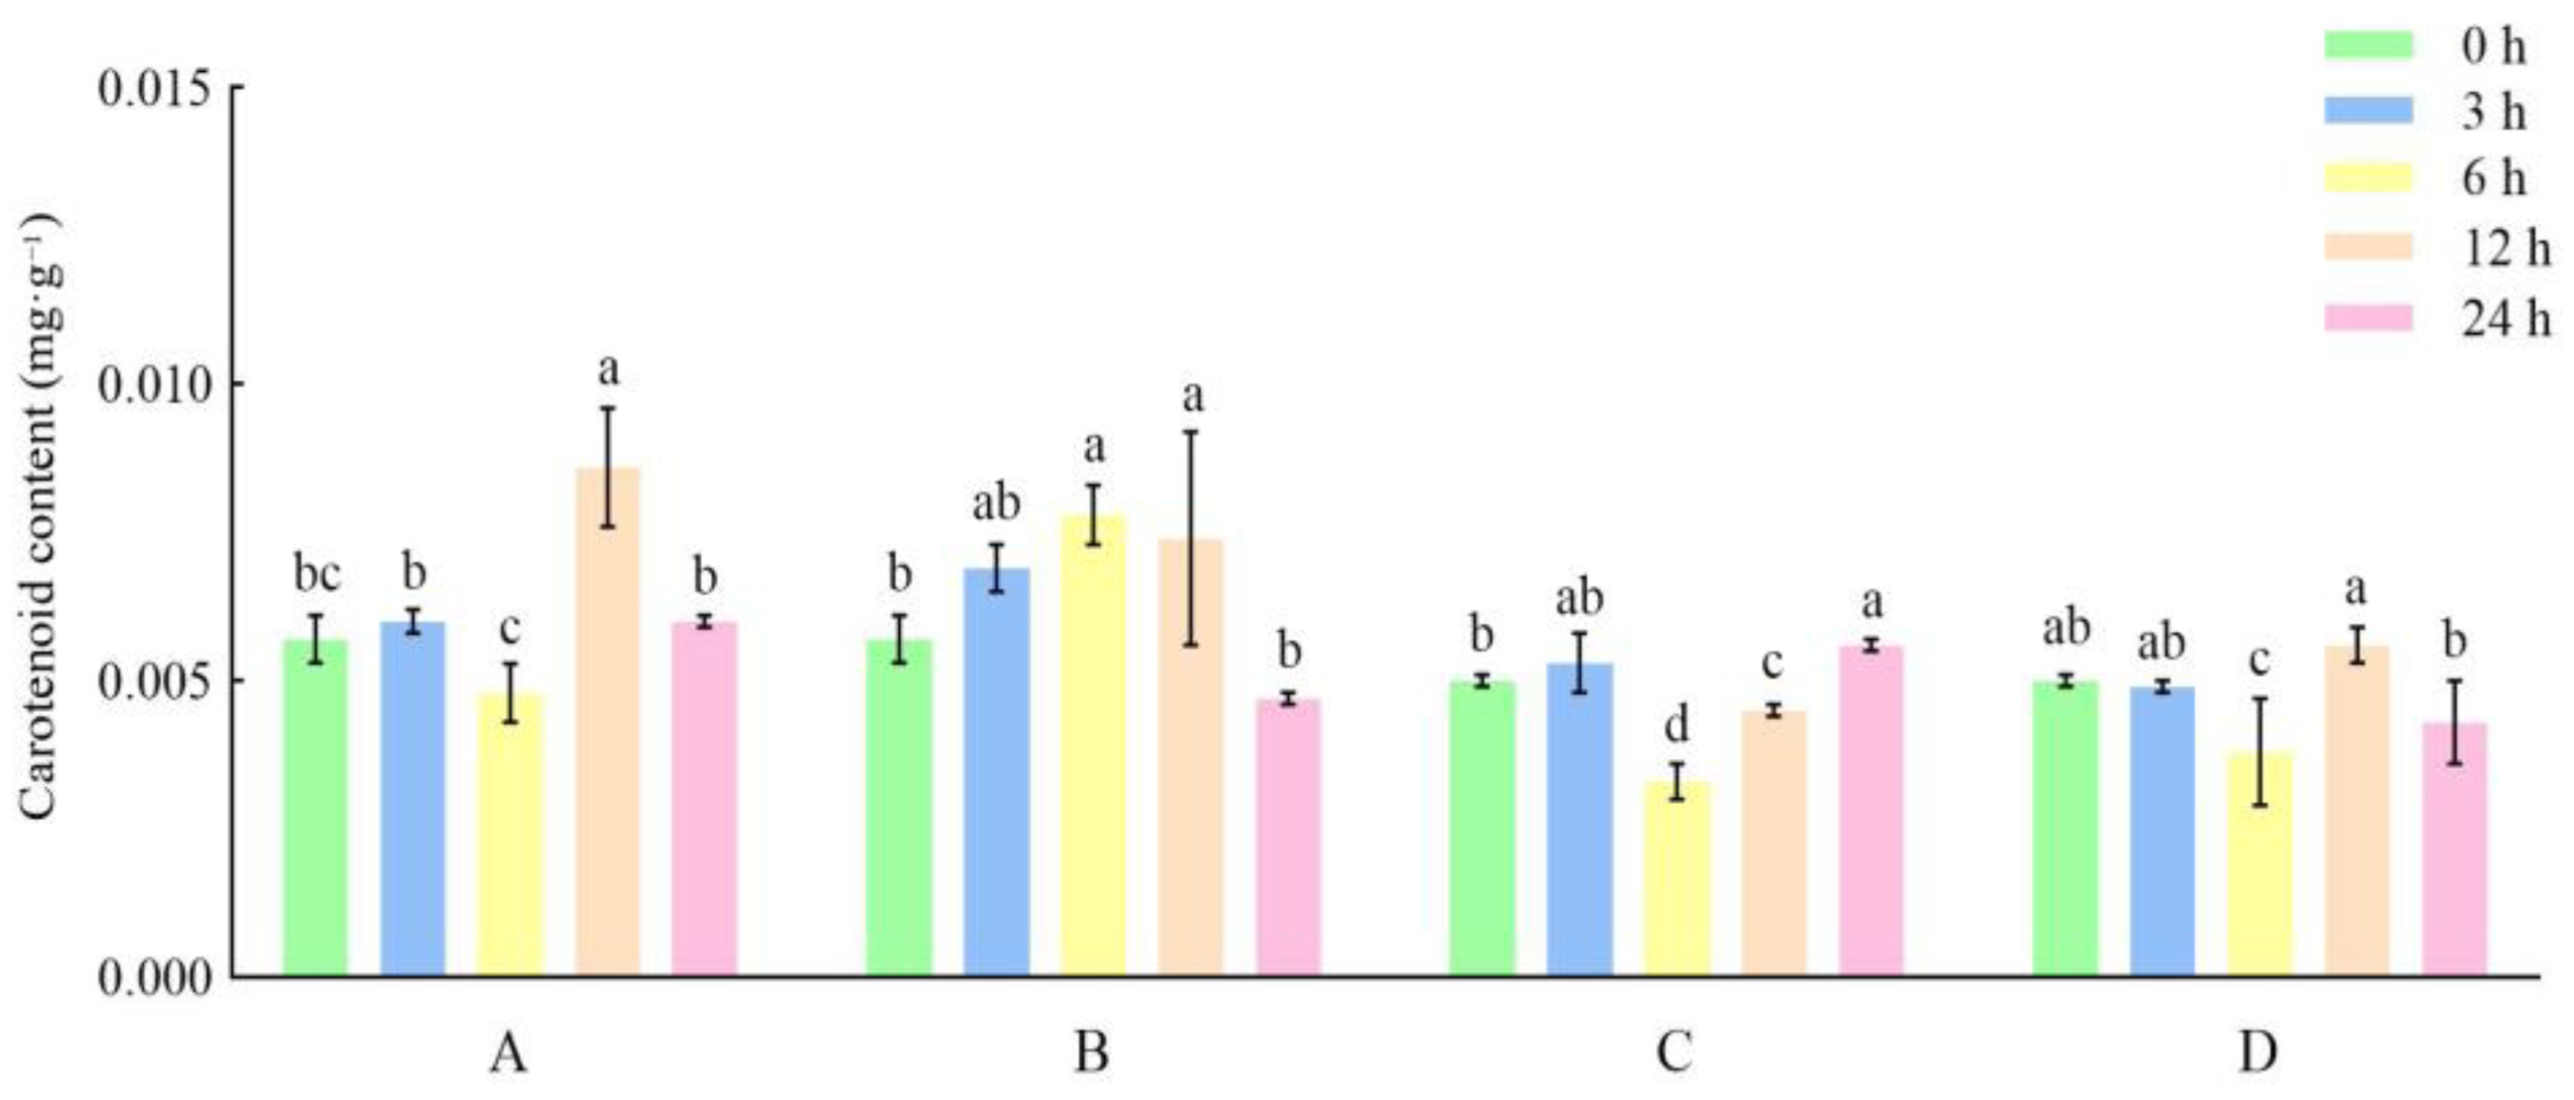
3.3. Effects of Different Storage and Thawing Temperatures on Carotenoid Content of Celery during Thawing

In the petioles of celery, before thawing, the total carotenoid content in the freezing group at −80 °C was 0.0057 mg/g, and that in the freezing group at −18 °C was 0.0050 mg·g−1, with a small difference between the two groups (Figure 13 and Figure 14). From the beginning of thawing to 24 h, the total light absorption content of all groups had no obvious change within ±15% of the initial light absorption content (Figure 13, Figure 14, Figure 15 and Figure 16). In the leaf blades of celery, compared with the beginning and end light absorption content of carotenoids in all groups, there was no significant change in the beginning and end light absorption content of carotenoids in the other groups except for the significant increase in the group of −18 °C and 4 °C (Figure 15 and Figure 16). The degradation of carotenoids in leaf blades was significantly greater than that in petioles. The larger the temperature difference between freezing storage temperature and thawing temperature, the more significant the change in the light absorption content of carotenoids. The thawing at 4 °C group of carotenoids has a degradation rate that is higher than 25 °C. During the 0 to 12 h of thawing, the light absorption content of carotenoids in leaves and petioles showed a similar trend, and the freezing group at −80 °C was higher than that at −18 °C. After 24 h of thawing, the light absorption content of two 25 °C thawing groups in leaves was higher than the two 4 °C thawing groups, and the opposite was true in petiole (Figure 14, Figure 15 and Figure 16).

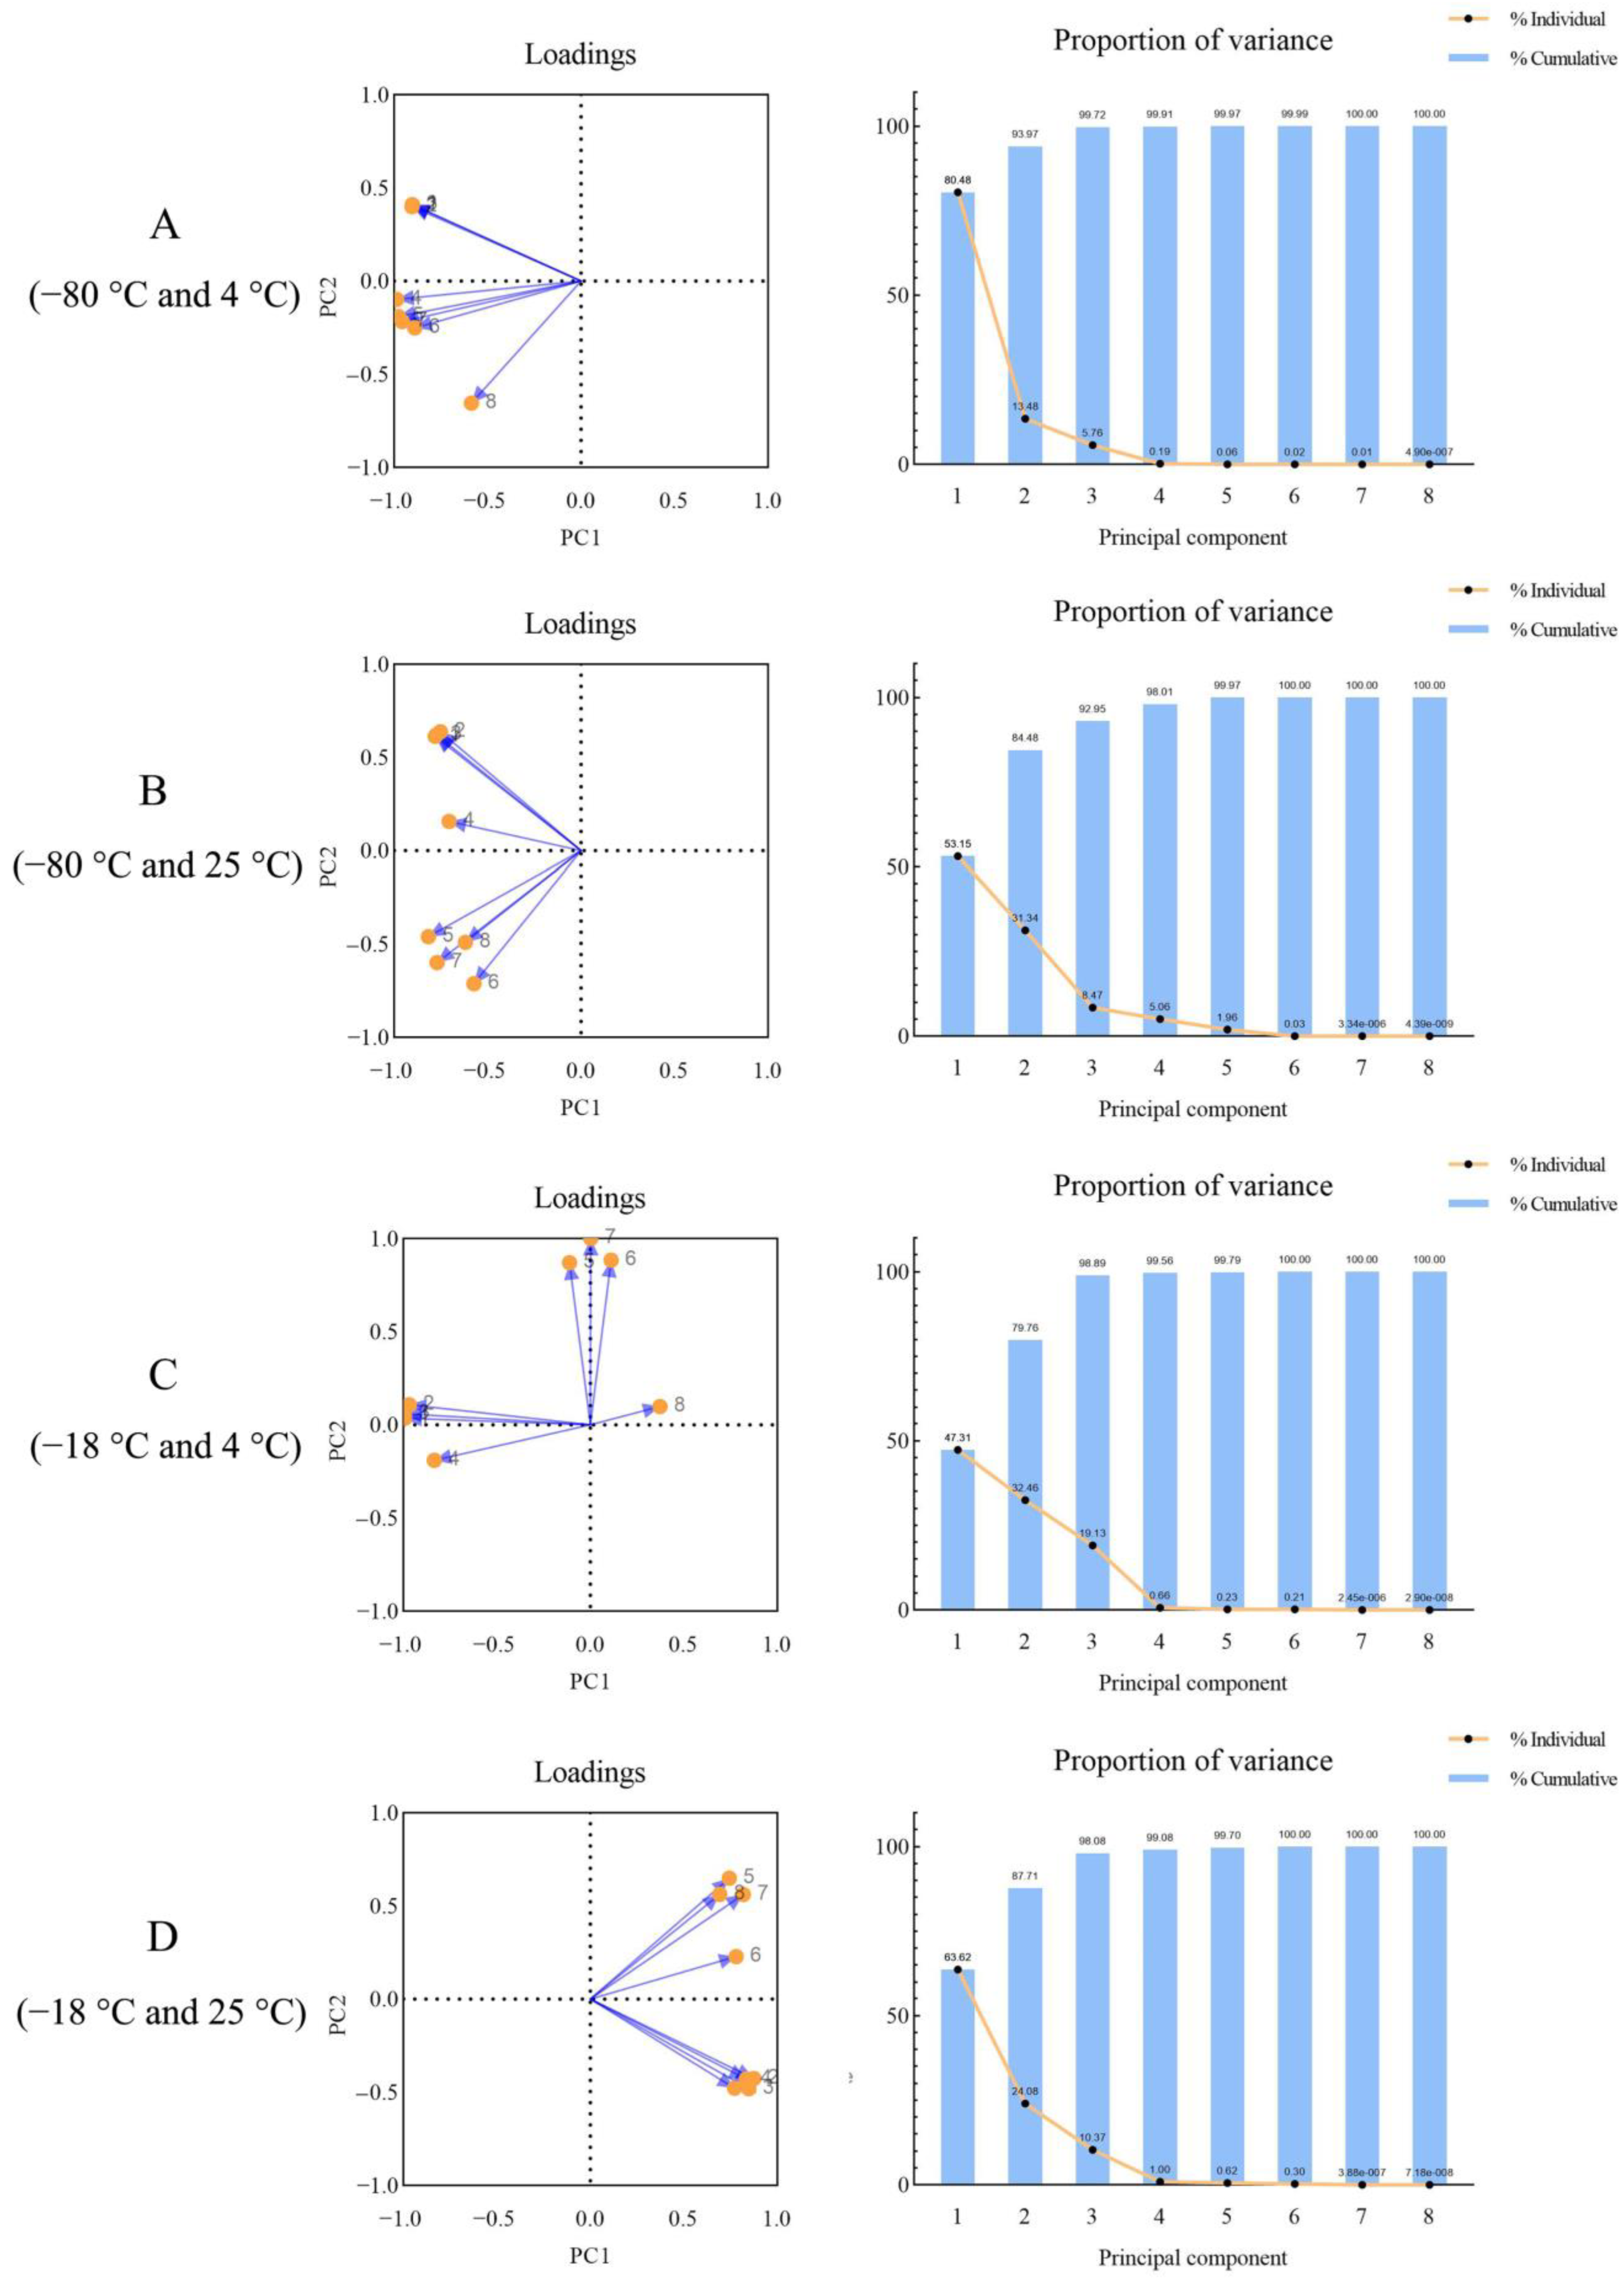
3.4. Principal Component Analysis of Celery Pigment Degradation with Different Treatment Temperature during Thawing

According to the results of the principal component analysis of celery pigment degradation with different treatment temperatures during thawing (Figure 17), components with eigenvalues > 1 were selected to obtain two or three principal components responding to celery chlorophyll degradation. For the group of −80 °C and 4 °C, the cumulative contribution rate of the first two feature eigenvalues reaches 93.97%. The contribution rate of the first principal component is 80.48%. The main photosynthetic pigment indexes were the total carotenoids of leaf blades (−0.99), the chlorophyll a content of petioles (−0.98), and the total chlorophyll of petioles (−0.96), which mainly reflected the pigment degradation in petioles of celery, and the three were positively correlated. The contribution rate of the second principal component is 13.48%. The main photosynthetic pigment indexes were the total chlorophyll (0.41), chlorophyll a (0.41), and chlorophyll b (0.40) of leaf blades, the three were positively correlated, but negatively correlated with the others, which mainly reflected the degradation of chlorophyll in leaf blades.
For the group of −80 °C and 25 °C, the cumulative contribution rate of the first two feature eigenvalues reaches 84.48%. The contribution rate of the first principal component is 53.15%. The main photosynthetic pigment indexes were the chlorophyll a content of petioles (−0.82), the chlorophyll a content of leaf blades (−0.78), and the total chlorophyll of leaf blades (−0.77), which mainly reflected the chlorophyll a degradation in celery, and the three were positively correlated. The contribution rate of the second principal component is 31.34%. The main photosynthetic pigment indexes were the chlorophyll b content (−0.71) of petioles, the content of chlorophyll b (0.64), and total chlorophyll (0.62) of leaf blades, which mainly reflected the chlorophyll b degradation in celery, which negatively correlated with the leaf blades and petioles of celery.
For the group of −18 °C and 4 °C, the cumulative contribution rate of the first two feature eigenvalues reaches 79.76%. The contribution rate of the first principal component is 47.31%. The main photosynthetic pigment indexes were the content of total chlorophyll (−1.00), chlorophyll a (−0.99), and chlorophyll b (−0.97) of leaf blades, which mainly reflected the chlorophyll degradation of leaf blades, and the three were positively correlated. The contribution rate of the second principal component is 32.46%. The main photosynthetic pigment indexes were the content of total chlorophyll (1.00), chlorophyll b (0.88), and chlorophyll a (0.87) of petioles, the three were positively correlated, which mainly reflected the chlorophyll degradation in celery petioles.
For the group of −18 °C and 25 °C, the cumulative contribution rate of the first two feature eigenvalues reaches 87.71%. The contribution rate of the first principal component is 63.62%. The main photosynthetic pigment indexes were the content of chlorophyll b (0.87) and total chlorophyll (0.84) of leaf blades, and the total chlorophyll content (0.83) of petioles, which mainly reflected the chlorophyll degradation of leaf blades, and the three were positively correlated. The contribution rate of the second principal component is 24.08%. The main photosynthetic pigment indexes were the total carotenoid content (0.67) of petioles, the content of chlorophyll a (0.65) of leaf blades, and total chlorophyll (0.55) of petioles, which reflected the pigment degradation in petioles.

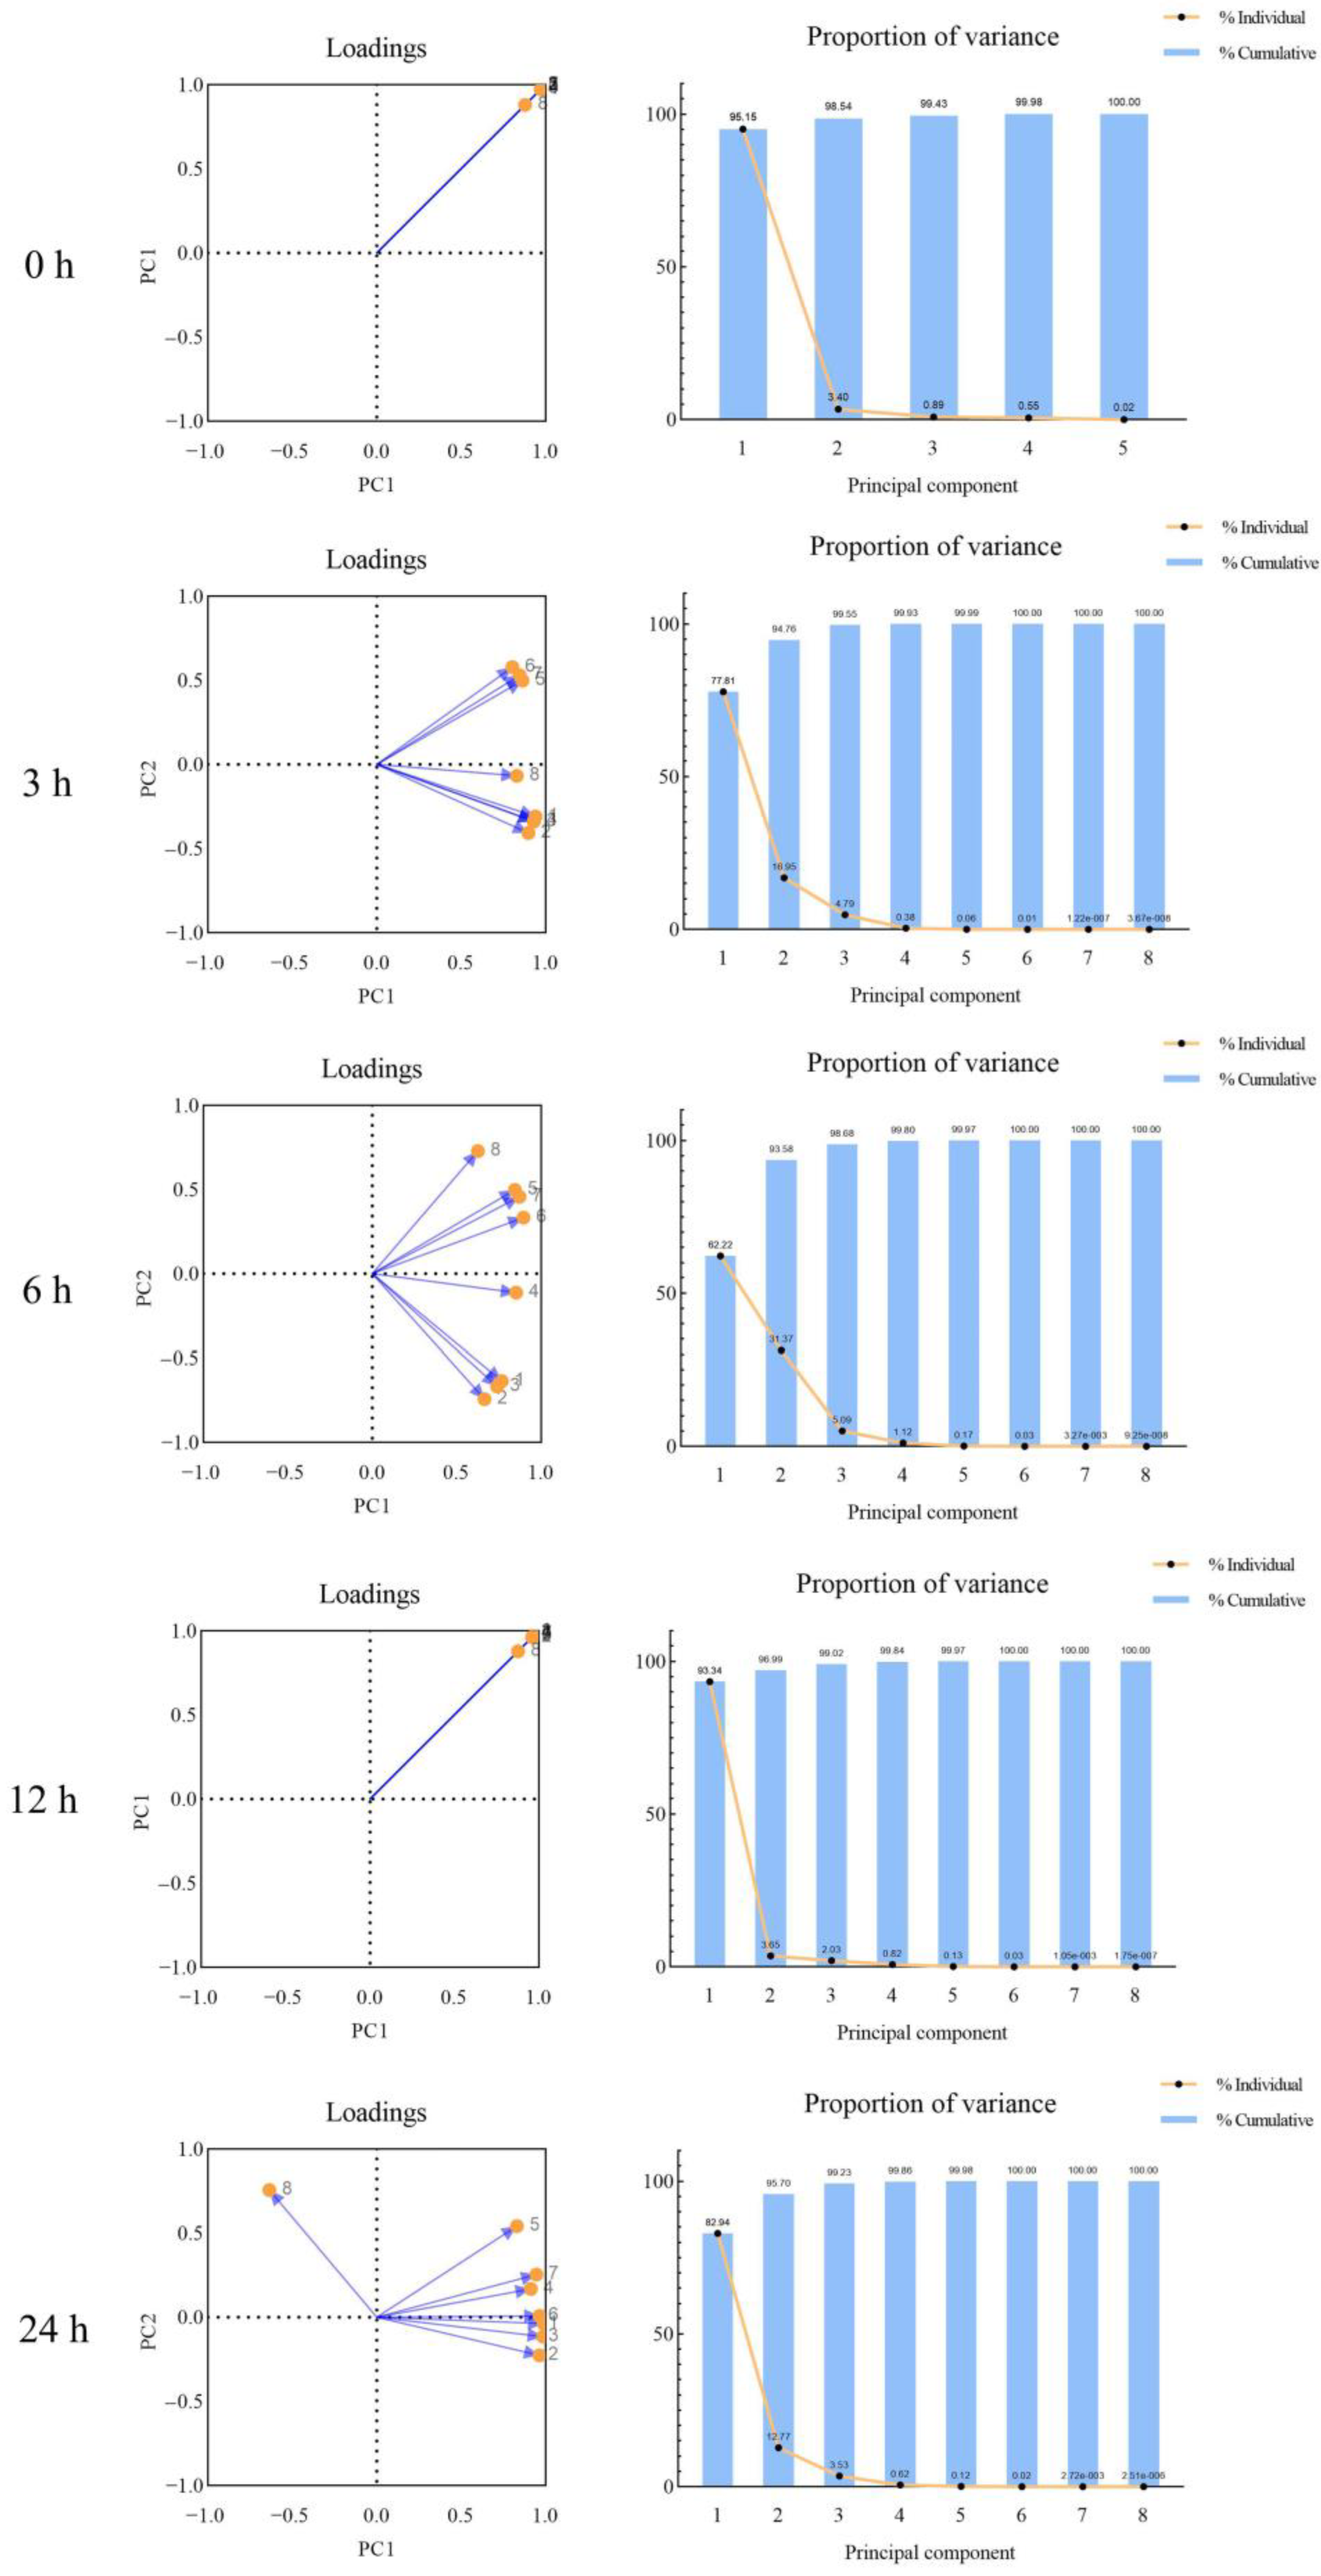
3.5. Principal Component Analysis of Celery Pigment Degradation with Different Thawing Time during Thawing

According to the results of the principal component analysis of celery pigment degradation with different thawing times during thawing (Figure 18), components with eigenvalues > 1 were selected to obtain one or two principal components responding to celery chlorophyll degradation. At 0 h, the only first principal component with the contribution rate of eigenvalues reaches 95.15%. The main photosynthetic pigment indexes were the chlorophyll a content of petioles (0.99) and leaf blades (0.99), and the total chlorophyll content of leaf blades (0.99), which mainly reflected the chlorophyll degradation in celery, and the three were positively correlated.
At 3 h, the cumulative contribution rate of the first two feature eigenvalues reaches 94.76%. The contribution rate of the first principal component is 77.81%. The main photosynthetic pigment indexes were the content of chlorophyll a (0.94), total carotenoids (0.93), and total chlorophyll (0.93) of leaf blades, which mainly reflected the pigment degradation in celery leaf blades. The contribution rate of the second principal component is 16.95%. The main photosynthetic pigment indexes were the content of chlorophyll b content (0.58), total chlorophyll (0.53), and chlorophyll a (0.50) of petioles, which mainly reflected the pigment degradation in celery petioles.
For 6 h, the cumulative contribution rate of the first two feature eigenvalues reaches 93.58%. The contribution rate of the first principal component is 62.22%. The main photosynthetic pigment indexes were the content of chlorophyll b (0.90), total chlorophyll (0.88), and chlorophyll a (0.86) of petioles, which mainly reflected the chlorophyll degradation of petioles. The contribution rate of the second principal component is 31.37%. The main photosynthetic pigment indexes were the total carotenoid content (−0.76) of petioles, the chlorophyll b (−0.74), and the total chlorophyll content (−0.67) of leaf blades, the latter two are positively correlated with the former and negatively correlated with the former.
For 12 h, the only first principal component with the contribution rate of eigenvalues reached 93.34%. The main photosynthetic pigment indexes were the content of chlorophyll a (0.99), total chlorophyll (0.99), and total carotenoids (0.98) of leaf blades, which mainly reflected the pigment degradation in celery leaf blades, and the three were positively correlated.
To 24 h, the cumulative contribution rate of the first two feature eigenvalues reaches 95.70%. The contribution rate of the first principal component is 82.94%. The main photosynthetic pigment indexes were the content of chlorophyll a (0.99) and total chlorophyll (0.98) in leaf blades, and the chlorophyll b content of petioles (0.97) of petioles, which mainly reflected the chlorophyll degradation of celery. The contribution rate of the second principal component is 12.77%. The main photosynthetic pigment indexes were the total carotenoid content (0.76), the chlorophyll a (0.54), and the total chlorophyll content (0.25) of petioles, which mainly reflected the pigment degradation in celery petioles.

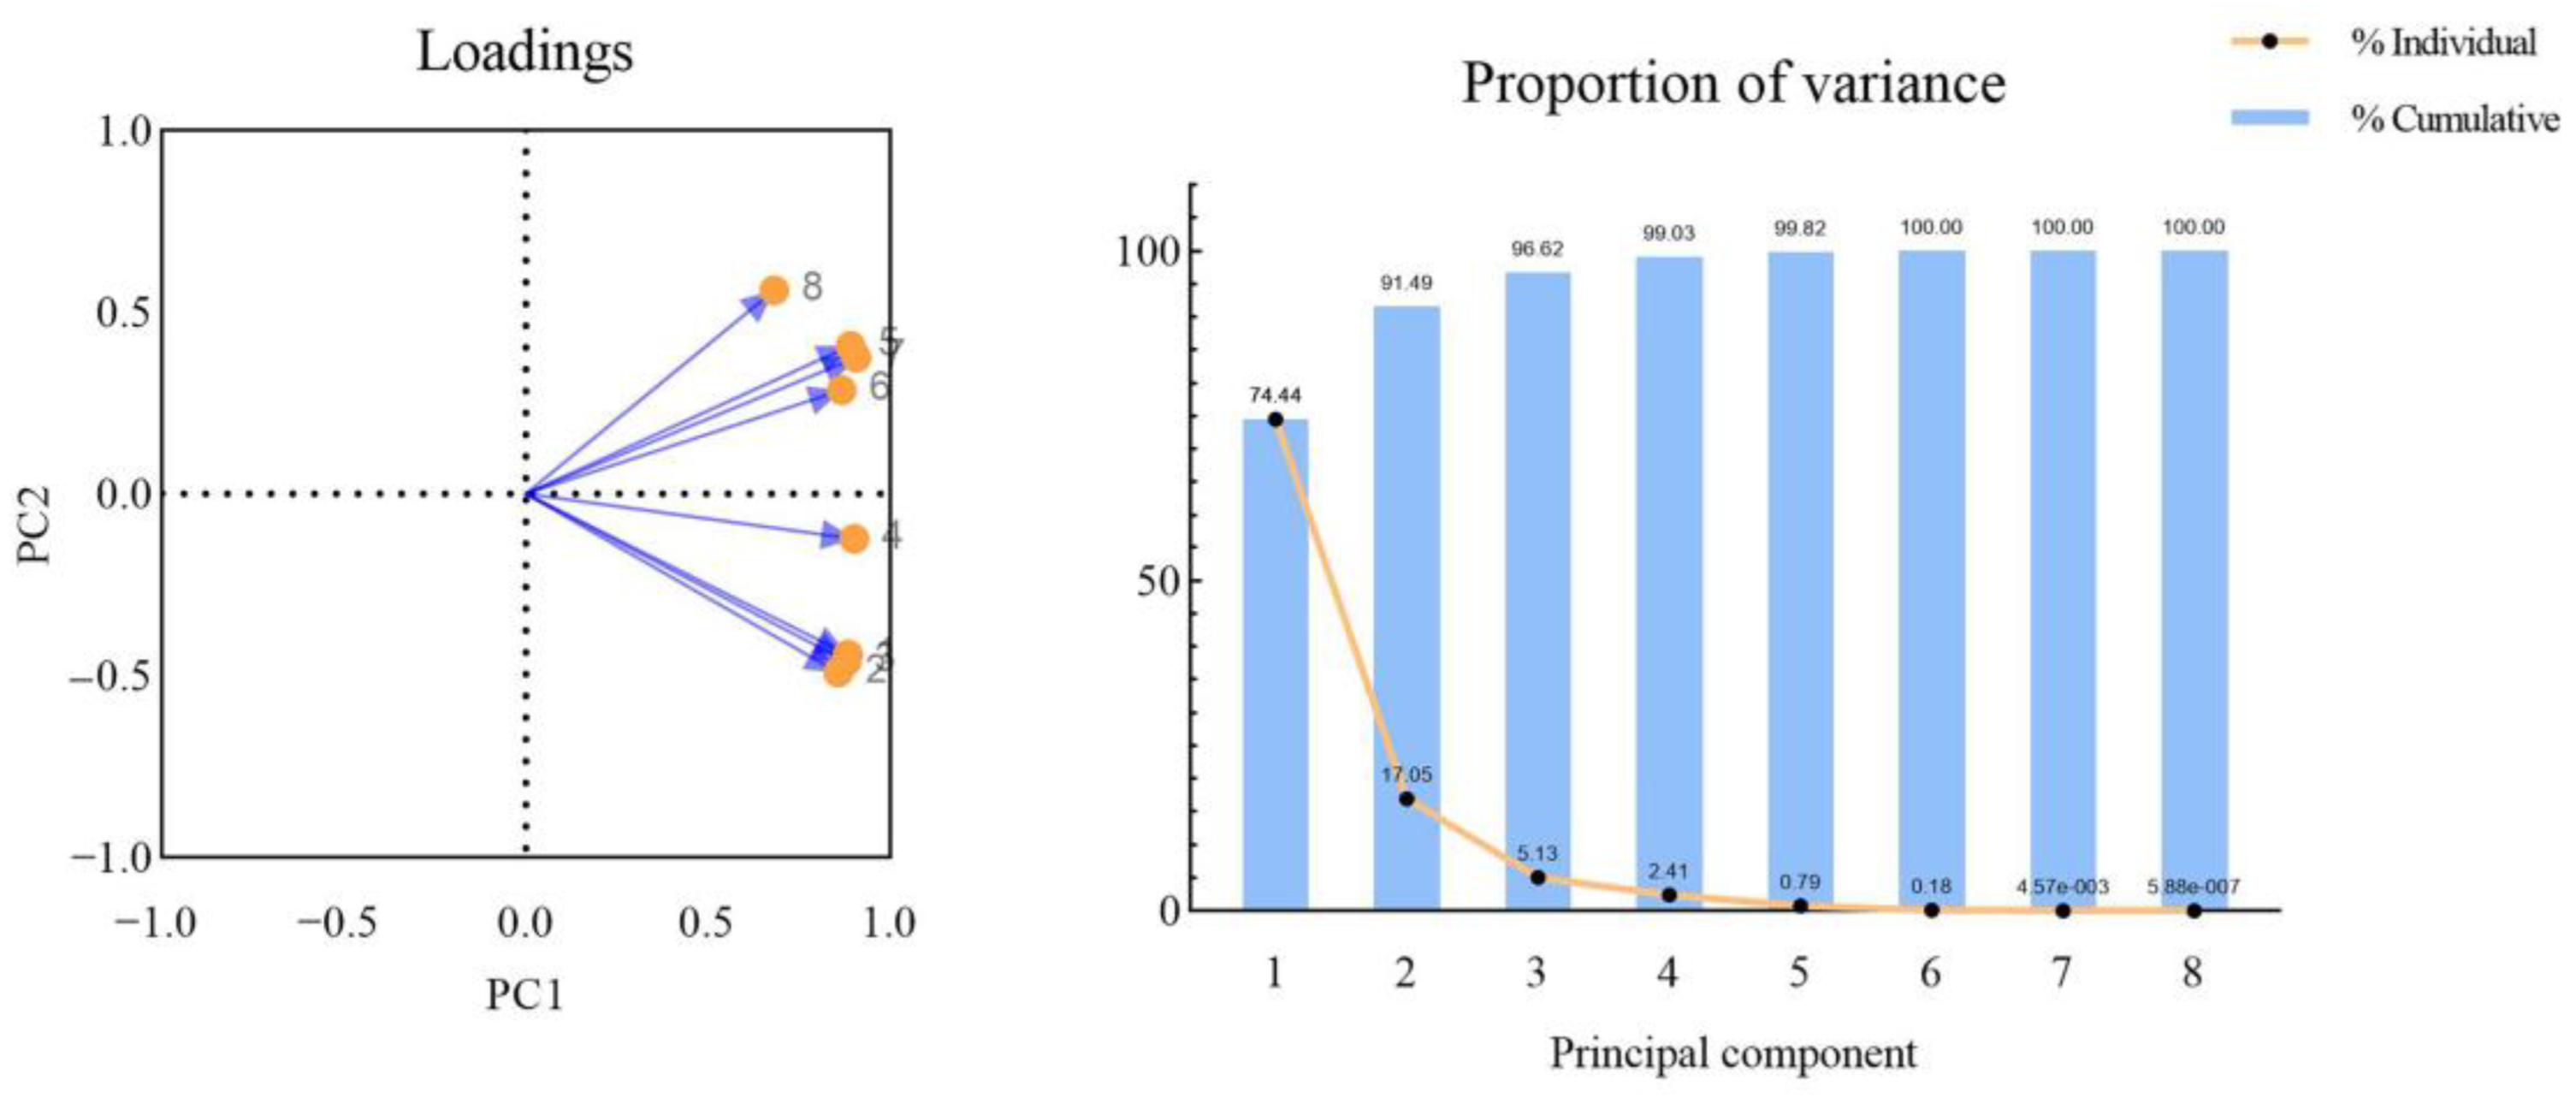
3.6. Principal Component Analysis of Celery Pigment Degradation of Different Leaves Parts during Thawing

According to the results of the principal component analysis of celery pigment degradation of different leaf parts during thawing (Figure 19), components with eigenvalues > 1 were selected to obtain two principal components responding to celery chlorophyll degradation. The cumulative contribution rate of the first two feature eigenvalues reaches 91.49%. The contribution rate of the first principal component is 74.44%. The main photosynthetic pigment indexes were the total chlorophyll content of petioles (0.91), the chlorophyll a content of petioles (0.90), and the total carotenoid of leaves blades (0.89), which mainly reflected the degradation of photosynthetic pigments in petioles of celery, and the three were positively correlated. The contribution rate of the second principal component is 17.05%. The main photosynthetic pigment indexes were the total carotenoid of petioles (0.64), the chlorophyll b content of leaf blades (−0.45), and the total chlorophyll content of leaf blades (−0.45), which mainly reflected the degradation of chlorophyll in leaf blades and the degradation of carotenoids in petioles, and the pigment content was negatively correlated between leaf blades and petioles of celery.

4. Discussion

4.1. Relationship between Actual Photosynthetic Pigment Content and Light Absorption Content

In this study, the content of photosynthetic pigments in each treatment group showed different trends and changes. Photosynthetic pigments in harvested celery products will continue to be degraded and oxidized, and their content will not increase [26]. In the process of chlorophyll oxidative degradation, the chlorophyll central magnesium element is replaced by other ions and converted into the primary degradation product (pheophytin or phytophytin). This kind of substance has an absorption peak at 534 nm wavelength, which partially coincides with the specific absorption wavelength range of chlorophyll that may lead to the increase in the absorption content of the sample instead of decreasing, and the decrease in the absorption content of the sample can only be achieved after further oxidation to form pyrophytin [37,38]. The increase in pigment content means the formation of primary degradation products of chlorophyll, and the absolute rise is positively correlated with the degradation rate of chlorophyll [39]. Ding and her colleagues demonstrated that the increase in light absorption content during the degradation of carotenoids may also be related to the partial coincidence of the absorption peaks of degradation products. Carotenoids contain a variety of monomers, among which β-carotene and lutein are the most abundant in celery [21]. Among them, β-carotene is easily degraded in the natural environment, and the generated volatile degradation products, such as β-damarone, geranylacetone, and β-ionone, have absorption peaks in the range of 450 to 480 nm, which could affect the light absorption content of total carotenoids at 470 nm [40]. In addition, the stability difference between carotenoid monomers is large, which is also one of the reasons for the fluctuation of its light absorption content [41]. The above results provided a possible internal cause for the abnormal increase in photosynthetic pigment absorption content found in the experiment and the reliable basis for the regular fluctuation and large amplitude of chlorophyll absorption content fluctuation larger than that of carotenoids, which was found in this experiment.

4.2. Relationship between Temperature and Photosynthetic Pigment Degradation

Temperature regulation is one of the factors that have the greatest influence on the postharvest quality of leaf vegetable products. Temperature affects the photosynthetic pigment content of leaf vegetable products by regulating the physiological state of plant cells, and the content and activity of metabolic enzymes [42,43]. Cold storage temperature can inhibit the activity of degrading enzymes in plant cells, reduce their physiological and metabolic activities, and maintain long-term stability [44]. The pre-cooling of liquid nitrogen (−196 °C) can rapidly reduce the central temperature of fresh products, inhibit the activity of enzymes related to pigment degradation and the growth and reproduction of microorganisms, and benefit from maintaining the color and nutrition of products [45]. In leafy vegetables, such as cabbage (Brassica oleracea) and lettuce (Lactuca sativa), lower storage temperature can inhibit plant respiration, transpiration, and peroxide accumulation, and extending freshness, green preservation, and shelf life [46,47]. Reasonable control of environmental factors, such as light intensity, air oxygen content, and humidity, optimization of packaging materials, adjustment of frozen particle diameter, exogenous application of plant growth regulators, and other processing methods, can effectively slow down the postharvest green loss of vegetable products [48,49]. Adopting suitable storage and thawing temperature and shortening logistics time is a cost-effective method for the preservation of leaf vegetable products [50].
The relationship between the activity of photosynthetic pigment-degrading enzymes and temperature in plant cells is an important internal factor affecting pigment degradation. In different tissues of plants, the content and activity of chlorophyll degrading enzymes are often positively correlated with the chlorophyll content [51]. At room temperature, the activity of the pheophyllin enzyme is higher than that of cold storage, which can promote chlorophyll degradation speedily [52]. Carotenoid lyase is sensitive to temperature, and drastic freeze–thaw changes can destroy its structure and inactivate it. Carotenoids are relatively stable at room temperature, thawing at room temperature is conducive to the retention of carotenoids [20]. Under the condition of low-temperature storage at 4 °C, the upregulation of carotene lyase activity can lead to the degradation of carotenoids in sweet pepper (Capsicum annuum L.), and it is unsuitable for long-term storage in cold storage [53]. In this study, we also found that the thawing temperature suitable for carotenoid preservation is often higher than that of chlorophyll, which may be due to the different sensitivity of temperature between these two kinds of photosynthetic pigment-degrading enzymes.

4.3. Relationship between Thawing Time and Photosynthetic Pigment Degradation

In addition to the temperature of storage and thawing, storage time also has a great influence on the quality of leaf vegetable products after harvest [54]. Under normal circumstances, a relatively suitable storage and thawing temperature can effectively delay the dehydration and spoilage of fresh vegetables and extend their shelf life [55]. Chlorophyll and carotenoids, as pigment substances with high content in plant leaves, are easy to be gradually oxidized to relatively stable deenzymatic chlorophyll, β-damarone and other substances during storage, resulting in the leaf color gradually changing from green to yellowish brown and gradually losing commercial value, content, and stability are strongly correlated with the shelf life of vegetable products [36,40]. Taking spinach as an example, leaf vegetable crops such as spinach (Spinacia oleracea) with fresh leaves as product organs have a rich content of chlorophyll and other photosynthetic pigments in leaves, rapid evaporation of water, and relatively short shelf life [56,57,58]. Relatively, with the same conventional cold storage conditions, carrot (Daucus carota), onion (Allium cepa), and other vegetable products with roots and stems as commercial organs can be stored for a long time because they contain almost no chlorophyll and have low evaporation without an obvious change in color [59,60]. After 24 h of thawing, the contents of various photosynthetic pigments in celery leaf blades and petioles decreased, especially the chlorophyll content in celery leaf blades. It was found in this study that photosynthetic pigments in celery leaves were degraded continuously with the extension of freezing and thawing time, and the degradation peak of leaf blades occurred at 6 to 12 h of thawing, faster than 12 to 24 h of petioles.

4.4. Relationship between Plant Parts and Photosynthetic Pigment Degradation

In addition to the differences in temperature sensitivity of different photosynthetic pigments and their degrading enzymes, the structural and biochemical differences in different parts of celery are also important factors leading to the differences in the degradation of pigment substances in celery leaf blades and petioles. The leaf is the main organ of plant photosynthesis, and its organelles are rich in photosynthetic pigments, organic acids, pigment-degrading enzymes, and other substances. When the cell structure is damaged, the increase in gene expression level related to the synthesis of degrading enzymes and the exosmosis of acidic substances can directly or indirectly destroy the cell structure and accelerate the oxidative degradation of photosynthetic pigments [46,61]. The cells of celery leaf blades contained a lot of organelles and acidic substances. The cell structure is destroyed, and the enzymatic hydrolysis and oxidation of photosynthetic pigments can be carried out simultaneously, which may be an important reason for the rapid degradation of chlorophyll in celery leaf blades [24]. The density of chloroplasts and other organelles in celery petiole cells is relatively low, the content of cellulose in the cell wall is high, and the resistance to external forces is strong. This may act to block air and inhibit pigment oxidation [62,63]. Combined with the complex changes in the pigment content of celery, it was speculated that the enzymatic hydrolysis and oxidation stages of photosynthetic pigments were caused by the differences in the tissue structure and cell physiology and biochemistry of celery leaf blades and petioles. This may be the potential reason for the obvious difference in resistance to pigment degradation between celery leaf blades and petioles. According to the experimental results, we speculated that the differences in tissue structure, water content, and metabolic activity between leaf blades and petioles of celery might be one of the important reasons for the obvious differences in storage and transportation resistance between them.

5. Conclusions

From the perspective of exploring how to rationally regulate the storage and thawing temperature of quick-frozen celery products, this study determined the content changes in photosynthetic pigments in celery leaf blades and petioles under different temperature treatment conditions during the thawing process and conducted significant analysis and principal component analysis on the test data of different treatment combinations, different thawing periods and different leaf parts. The difference selectivity analysis results showed that the loss of photosynthetic pigments increased with the extension of thawing time, and the lower freezing–thawing temperature difference was conducive to the preservation of photosynthetic pigments. The principal component analysis showed that chlorophylls were more sensitive to the thawing time, and the freezing and thawing temperature than carotenoids, with their light absorption content changing significantly. The speed of photosynthetic pigment degradation in leaf blades was faster than that in petioles. The above experimental results will provide a reference for the reasonable setting of temperature in the storage and thawing process of quick-frozen celery products, and the exploration of the internal causes of storage resistance of different kinds of photosynthetic pigments and different parts of celery leaves can also be used as the follow-up research direction.

Author Contributions

Conceptualization, A.-S.X. and C.C.; methodology, C.C., Y.-H.L., P.-Z.L. and Y.-P.L.; validation, C.C., L.-X.W., M.-Y.L., G.-F.T., Y.-H.L., P.-Z.L., Y.-P.L., H.L., J.Z. and J.-P.T.; formal analysis, C.C.; resources, A.-S.X.; writing—original draft preparation, C.C.; writing—review and editing, A.-S.X.; visualization, C.C.; supervision, A.-S.X.; project administration, C.C.; funding acquisition, A.-S.X. All authors have read and agreed to the published version of the manuscript.

Funding

The research was supported by the Key Research and Development Program of Jiangsu (BE2022386), Jiangsu Seed Industry Revitalization Project [JBGS (2021)068], Coordinated Extension of Major Agricultural Technologies Program of Jiangsu (2022-ZYXT-01-3), Suqian Science and Technology Program (L202302), Priority Academic Program Development of Jiangsu Higher Education Institutions Project (PAPD).

Institutional Review Board Statement

Not applicable.

Informed Consent Statement

Not applicable.

Data Availability Statement

Data are contained within the article. Additional data can be obtained by contacting the corresponding author of the article.

Conflicts of Interest

The authors declare no conflicts of interest

References

  1. Maruyama, T.; Abbaskhan, A.; Choudhary, M.I.; Tsuda, Y.; Goda, Y.; Farille, M.; Reduron, J.P. Botanical origin of Indian celery seed (fruit). J. Nat. Med. 2009, 63, 248–253. [Google Scholar] [CrossRef]
  2. Li, J.W.; Feng, K.; Xu, Z.S.; Xiong, A.S. Transcriptome profiling of β-carotene biosynthesis genes and β-carotene accumulation in leaf blades and petioles of celery cv. Jinnanshiqin. Acta Biochim. Biophys. Sin. 2018, 51, 116–119. [Google Scholar] [CrossRef] [PubMed]
  3. Li, M.Y.; Feng, K.; Hou, X.L.; Jiang, Q.; Xu, Z.S.; Wang, G.L.; Liu, J.X.; Wang, F.; Xiong, A.S. The genome sequence of celery (Apium graveolens L.), an important leaf vegetable crop rich in apigenin in the Apiaceae family. Hortic. Res. 2020, 7, 223–253. [Google Scholar] [CrossRef]
  4. Li, M.Y.; Hou, X.L.; Wang, F.; Tan, G.F.; Xu, Z.S.; Xiong, A.S. Advances in the research of celery, an important Apiaceae vegetable crop. Crit. Rev. Biotechnol. 2018, 38, 172–183. [Google Scholar] [CrossRef]
  5. Wang, X.J.; Luo, Q.; Li, T.; Meng, P.H.; Pu, Y.T.; Liu, J.X.; Zhang, J.; Liu, H.; Tan, G.F.; Xiong, A.S. Origin, evolution, breeding, and omics of Apiaceae: A family of vegetables and medicinal plants. Hortic. Res. 2022, 9, uhac076. [Google Scholar] [CrossRef]
  6. Li, M.Y.; Li, J.; Xie, F.J.; Zhou, J.; Sun, Y.; Luo, Y.; Zhang, Y.; Chen, Q.; Wang, Y.; Lin, Y.X.; et al. Combined evaluation of agronomic and quality traits to explore heat germplasm in celery (Apium graveolens L.). Sci. Hortic. 2023, 317, 112039. [Google Scholar] [CrossRef]
  7. Ma, P.H.; Pong, L.; Yu, N.; Li, A.; Liu, P.; Wang, Q.; Sheng, J.P. Image-based nutrient estimation for Chinese dishes using deep learning. Food Res. 2021, 147, 110437. [Google Scholar] [CrossRef] [PubMed]
  8. Li, M.Y.; Wang, F.; Jiang, Q.; Ma, J.; Xiong, A.S. Identification of SSRs and differentially expressed genes in two cultivars of celery (Apium graveolens L.) by deep transcriptome sequencing. Hortic. Res. 2014, 1, 10. [Google Scholar] [CrossRef] [PubMed]
  9. Wu, C.H.; Cao, S.F.; Xie, K.Q.; Chi, Z.Y.; Wang, J.; Wang, H.f.; Wei, Y.Y.; Shao, X.F.; Zhang, C.D.; Xu, F.; et al. Melatonin delays yellowing of broccoli during storage by regulating chlorophyll catabolism and maintaining chloroplast ultrastructure. Postharvest Biol. Technol. 2021, 172, 111378. [Google Scholar] [CrossRef]
  10. Ilic, Z.S.; Sunic, L.J.; Milenkovic, L. Extended harvest time improves the shelf life of celeriac (Apium graveolens var. rapaceum) through postharvest treatment and storage conditions. Acta Hortic. 2016, 1142, 269–275. [Google Scholar]
  11. Jia, M.; Zhu, S.Q.; Wang, Y.H.; Liu, J.X.; Tan, S.S.; Liu, H.; Shu, S.; Tao, J.P.; Xiong, A.S. Morphological characteristics, anatomical structure, and dynamic change of ascorbic acid under different storage conditions of celery. Protoplasma 2023, 260, 21–33. [Google Scholar] [CrossRef]
  12. Li, M.Y.; Wang, Y.; Wei, X.H.; Wang, Z.; Wang, C.; Du, X.M.; Lin, Y.X.; Zhang, Y.T.; Wang, Y.; He, W.; et al. Effects of pretreatment and freezing storage on the bioactive components and antioxidant activity of two kinds of celery after postharvest. Food Chem. X 2023, 18, 100655. [Google Scholar] [CrossRef] [PubMed]
  13. Liu, J.X.; Li, T.; Wang, H.; Liu, Y.H.; Feng, K.; Duan, A.Q.; Liu, H.; Shu, S.; Xiong, A.S. CRISPR/Cas9-mediated precise targeted mutagenesis of phytoene desaturase in celery. Hortic. Res. 2022, 9, uhac162. [Google Scholar] [CrossRef] [PubMed]
  14. Huang, T.; Liu, H.; Tao, J.P.; Zhang, J.Q.; Zhao, T.M.; Hou, X.L.; Xiong, A.S.; You, X. Low light intensity elongates period and defers peak time of photosynthesis: A computational approach to circadian-clock-controlled photosynthesis in tomato. Hortic. Res. 2023, 10, uhad077. [Google Scholar] [CrossRef] [PubMed]
  15. Huang, W.; Ma, Y.H.; Huang, Y.; Li, Y.; Wang, G.L.; Jiang, Q.; Wang, F.; Xiong, A.S. Comparative proteomic analysis provides novel insights into chlorophyll biosynthesis in celery under temperature stress. Physiol. Plant 2017, 161, 468–485. [Google Scholar] [CrossRef] [PubMed]
  16. Ding, X.; Jia, L.L.; Xing, G.M.; Tao, J.P.; Sun, S.; Tan, G.F.; Li, S.; Liu, J.X.; Duan, A.Q.; Wang, H.; et al. The accumulation of lutein and β-carotene and transcript profiling of genes related to carotenoids biosynthesis in yellow celery. Mol Biotechnol. 2021, 63, 638–649. [Google Scholar] [CrossRef] [PubMed]
  17. Lv, J.Y.; Zhang, Y.Z.; Tang, W.J.; Chen, J.X.; Ge, Y.H.; Li, J.R. Concentration-dependent impacts of exogenous methyl jasmonate (MeJA) on chlorophyll degradation of apple fruit during ripening. Postharvest Biol. Technol. 2023, 203, 112398. [Google Scholar] [CrossRef]
  18. Sharafi, E.; Dehestani, A.; Farmani, J.; Parizi, A.P. Bioinformatics evaluation of plant chlorophyllase, the key enzyme in chlorophyll degradation. Appl. Food Biotechnol. 2017, 4, 167–178. [Google Scholar]
  19. Yin, L.; Liu, J.X.; Tao, J.P.; Xing, G.M.; Tan, G.F.; Li, S.; Duan, A.Q.; Ding, X.; Xu, Z.S.; Xiong, A.S. The gene encoding lycopene epsilon cyclase of celery enhanced lutein and β-carotene contents and confers increased salt tolerance in Arabidopsis. Plant Physiol. Biochem. 2020, 157, 339–347. [Google Scholar] [CrossRef]
  20. Raffo, A.; Sinesio, F.; Moneta, E.; Nardo, N.; Peparaio, M.; Paoletti, F. Internal quality of fresh and cold stored celery petioles described by sensory profile, chemical and instrumental measurements. Eur. Food Res. Technol. 2006, 222, 590–599. [Google Scholar] [CrossRef]
  21. Ding, X.; Liu, J.X.; Li, T.; Duan, A.Q.; Yin, L.; Wang, H.; Jia, L.L.; Liu, Y.H.; Liu, H.; Tao, J.P.; et al. AgZDS, a gene encoding ζ-carotene desaturase, increases lutein and β-carotene contents in transgenic Arabidopsis and celery. Plant Sci. 2021, 312, 111043. [Google Scholar] [CrossRef]
  22. Kręcisz, M.; Kolniak-Ostek, J.; Łyczko, J.; Stępień, B. Evaluation of bioactive compounds, volatile compounds, drying process kinetics and selected physical properties of vacuum impregnation celery dried by different methods. Food Chem. 2023, 413, 135490. [Google Scholar] [CrossRef]
  23. Lee, S.M.; Lee, J.Y.; Cho, Y.J.; Kim, M.S.; Kim, Y.S. Determination of volatiles and carotenoid degradation compounds in red pepper fermented by Lactobacillus parabuchneri. J. Food Sci. 2018, 83, 2083–2091. [Google Scholar] [CrossRef]
  24. Zhu, Z.P.; Yu, J.X.; Qiao, X.H.; Yu, Z.F.; Xiong, A.S.; Sun, M. Hydrogen sulfide delays yellowing and softening, inhibits nutrient loss in postharvest celery. Sci. Hortic. 2023, 315, 111991. [Google Scholar] [CrossRef]
  25. Kim, M.; Lee, J.; Choe, E. Pigment changes in fried dough containing spinach powder during storage in the dark. J. Food Sci. 2003, 68, 1923–1927. [Google Scholar] [CrossRef]
  26. Chen, N.X.; Li, J.B.; Meng, C.L.; Fan, S.X. Research progress in preservation of postharvest leafy vegetables. Adv. Mater. Res. 2013, 2512, 749. [Google Scholar] [CrossRef]
  27. Sun, M.; Yang, T.; Qiao, X.H.; Zhao, P.; Zhu, Z.P.; Wang, G.L.; Xu, L.L.; Xiong, A.S. Nitric oxide regulates the lignification and carotenoid biosynthesis of postharvest carrot (Daucus carota L.). Postharvest Biol. Technol. 2024, 207, 112593. [Google Scholar] [CrossRef]
  28. Chen, Q.; Li, J.L.; Yang, H.; Qian, J.Q. A dynamic shelf-life prediction method considering actual uncertainty: Application to fresh fruits in long-term cold storage. J. Food Eng. 2023, 349, 111471. [Google Scholar] [CrossRef]
  29. Xu, Y.X.; Chen, X.N.; Xu, L.; Du, B. The research on modified atmosphere packaging preservation of fresh-cut iceberg lettuce. Adv. Gr. Commun. Packag. Technol. Mater. 2016, 369, 549–559. [Google Scholar]
  30. Guyer, L.; Salinger, K.; Krugel, U.; Hortensteiner, S. Catalytic and structural properties of pheophytinase, the phytol esterase involved in chlorophyll breakdown. J. Exp. Bot. 2018, 69, 879–889. [Google Scholar] [CrossRef] [PubMed]
  31. Wu, P.W.; Xin, F.Y.; Xu, H.J.L.; Chu, Y.Y.; Du, Y.L.; Tian, H.Q.; Zhu, B.Z. Chitosan inhibits postharvest berry abscission of ‘Kyoho’ table grapes by affecting the structure of abscission zone, cell wall degrading enzymes and SO2 permeation. Postharvest Biol. Technol. 2021, 176, 111507. [Google Scholar] [CrossRef]
  32. Saba, A.; Moneta, E.; Peparaio, M.; Sinesio, F.; Vassallo, M.; PaolettiSaba, F. Towards a multi-dimensional concept of vegetable freshness from the consumer’s perspective. Food Qual. Pref. 2018, 66, 1–12. [Google Scholar] [CrossRef]
  33. Ningrum, A.; Minh, N.N.; Schreiner, M. Carotenoids and norisoprenoids as carotenoid degradation products in pandan leaves (Pandanus amaryllifolius Roxb.). Int. J. Food Prop. 2015, 18, 1905–1914. [Google Scholar] [CrossRef]
  34. Behzadi, A.; Holmberg, S.; Duwig, C.; Haghighat, F.; Ooka, R.; Sadrizadeh, S. Smart design and control of thermal energy storage in low temperature heating and high-temperature cooling systems: A comprehensive review. Renew. Sustain. Energy Rev. 2022, 166, 116625. [Google Scholar] [CrossRef]
  35. Biehler, E.; Mayer, F.; Hoffmann, L.; Krause, E.; Bohn, T. Comparison of 3 spectrophotometric methods for carotenoid determination in frequently consumed fruits and vegetables. J. Food Sci. 2010, 75, 55–61. [Google Scholar] [CrossRef] [PubMed]
  36. Dermesonluoglu, E.; Katsaros, G.; Tsevdou, M.; Giannakourou, M.; Taoukis, P. Kinetic study of quality indices and shelf life modelling of frozen spinach under dynamic conditions of the cold chain. J. Food Eng. 2015, 148, 13–23. [Google Scholar] [CrossRef]
  37. Luo, S.; Luo, T.; Peng, P.; Li, Y.P.; Li, X.G. Disturbance of chlorophyll biosynthesis at Mg branch affects the chloroplast ROS homeostasis and Ca2+ signaling in Pisum sativum. Plant Cell 2016, 127, 729–737. [Google Scholar] [CrossRef]
  38. Shimoda, Y.; Ito, S.; Tanaka, A. Arabidopsis STAY-GREEN, Mendel’s green cotyledon gene, encodes magnesium—Dechelatase. Plant Cell 2016, 28, 2147–2160. [Google Scholar] [CrossRef] [PubMed]
  39. Ndiaye, N.D.; Dhuique-Mayer, C.; Cisse, M.; Dornier, M. Identification and thermal degradation kinetics of chlorophyll pigments and ascorbic acid from ditax nectar (Detarium senegalense J.F. Gmel). J. Agric. Food Chem. 2011, 59, 12018–12027. [Google Scholar] [CrossRef]
  40. Jang, W.; Lee, C.; Suh, H.J.; Lee, J. β-Carotene and β-apo-8′-carotenal contents in processed foods in Korea. Food Sci. Biotechnol. 2023, 32, 1501–1513. [Google Scholar] [CrossRef]
  41. Mehmood, A.; Zeb, A. Effects of different cooking techniques on the carotenoids composition, phenolic contents, and antioxidant activity of spinach leaves. J. Food Meas. Charact. 2023, 17, 4760–4774. [Google Scholar] [CrossRef]
  42. Su, S.Q.; Zhou, Y.M.; Qin, J.G.; Yao, W.Z.; Ma, Z.H. Optimization of the Method for Chlorophyll Extraction in Aquatic Plants. J. Freshw. Ecol. 2010, 25, 531–538. [Google Scholar] [CrossRef]
  43. Bashir, T.; Haq, S.A.U.; Masoom, S.; Ibdah, M.; Husaini, A.M. Quality trait improvement in horticultural crops: OMICS and modern biotechnological approaches. Mol. Biol. Rep. 2023, 50, 87298742. [Google Scholar] [CrossRef] [PubMed]
  44. Boroda, A.V.; Aizdaicher, N.A.; Odintsova, N.A. The influence of ultra-low temperatures on marine microalgal cells. J. Appl. Phycol. 2014, 26, 387–397. [Google Scholar] [CrossRef]
  45. Yao, J.H.; Chen, W.J.; Fan, K. Novel efficient physical technologies for enhancing freeze drying of fruits and vegetables: A review. Foods 2023, 12, 4321. [Google Scholar] [CrossRef] [PubMed]
  46. Funamoto, Y.; Yamauchi, N.; Masayoshi, S. Involvement of peroxidase in chlorophyll degradation in stored broccoli (Brassica oleracea L.) and inhibition of the activity by heat treatment. Postharvest Biol. Technol. 2003, 28, 39–46. [Google Scholar] [CrossRef]
  47. Pathare, P.B.; Rahman, M.S. Nondestructive Quality Assessment Techniques for Fresh Fruits and Vegetables; Springer: Singapore, 2022; pp. 163–188. [Google Scholar]
  48. Hasan, M.U.; Singh, Z.; Shah, H.M.S.; Kaur, J.; Woodward, A.; Afrifa-Yamoah, E.; Malik, A.U. Oxalic acid: A blooming organic acid for postharvest quality preservation of fresh fruit and vegetables. Postharvest Biol. Technol. 2023, 206, 112574. [Google Scholar] [CrossRef]
  49. Cai, J.H.; Luo, F.; Zhao, Y.B.; Zhou, Q.; Wei, B.D.; Zhou, J.; Ji, S.J. 24-Epibrassinolide treatment regulates broccoli yellowing during shelf life. Postharvest Biol. Technol. 2019, 154, 87–95. [Google Scholar] [CrossRef]
  50. Brown, W.; Ryser, E.; Gorman, L.; Steinmaus, S.; Vorst, K. Transit temperatures experienced by fresh-cut leafy greens during cross-country shipment. Food Control 2016, 61, 146–155. [Google Scholar] [CrossRef]
  51. Zhang, J.; Yu, G.H.; Wen, W.W.; Ma, X.Q.; Xu, B.; Huang, B.R. Functional characterization and hormonal regulation of the pheophytinase gene LpPPH controlling leaf senescence in perennial ryegrass. J. Exp. Bot. 2016, 67, 935–945. [Google Scholar] [CrossRef]
  52. Büchert, A.M.; Civello, P.M.; Gustavo, A. Chlorophyllase versus pheophytinase as candidates for chlorophyll dephytilation during senescence of broccoli. J. Plant Physiol. 2010, 168, 337–343. [Google Scholar] [CrossRef]
  53. Cuadra-Crespo, P.; Amor, F.M. Effects of postharvest treatments on fruit quality of sweet pepper at low temperature. J. Sci. Food Agric. 2010, 90, 2716–2722. [Google Scholar] [CrossRef]
  54. Dhemre, K.J.; Shete, B.M.; Kotecha, M.P. Performance of packaging on shelf life and quality of fenugreek at different storage conditions in kharif season. Adv. Res. 2017, 10, 35266. [Google Scholar] [CrossRef]
  55. Marie, L.G.; Luca, V.; Valentina, G.; Lazazzara, V.; Zanella, A.; Robatscher, P.; Scampicchio, M.; Oberhuber, M. Chlorophyll breakdown during fruit ripening: Qualitative analysis of phyllobilins in the peel of apples (Malus domestica Borkh.) cv. ‘Gala’ during different shelf life stages. Food Res. Int. 2022, 162, 112061. [Google Scholar]
  56. Wang, N.; Kong, X.M.; Luo, M.L.; Sun, Y.Y.; Liu, Z.Y.; Feng, H.; Ji, S.J. SGR mutation in pak choi prolongs its shelf life by retarding chlorophyll degradation and maintaining membrane function. Postharvest Biol. Technol. 2022, 191, 112011. [Google Scholar] [CrossRef]
  57. Shi, J.Y.; Gao, L.P.; Zuo, J.H.; Wang, Q.; Fan, L.L. Exogenous sodium nitroprusside treatment of broccoli florets extends shelf life, enhances antioxidant enzyme activity, and inhibits chlorophyll-degradation. Postharvest Biol. Technol. 2016, 116, 98–104. [Google Scholar] [CrossRef]
  58. Lee, D.S.; Robertson, G. Interactive influence of decision criteria, packaging film, storage temperature and humidity on shelf life of packaged dried vegetables. Food Packag. Shelf Life 2021, 28, 100674. [Google Scholar] [CrossRef]
  59. Lara, A.; Dalene, B.D.; Magdalena, M.; Marieta, V.D.R.; Elizabeth, J. Impact of steam treatment on shelf-life stability of a xanthone-rich green herbal tea (Cyclopia maculata Andrews Kies)—Identifying quality changes during storage. J. Sci Food Agric. 2019, 99, 1334–1341. [Google Scholar]
  60. Nduwumuremyi, A.; Melis, R.; Shanahan, P.; Asiimwe, T. Introgression of antioxidant activity into cassava (Manihot esculenta C.): An effective technique for extending fresh storage roots shelf life. Plant Breed. 2016, 135, 1–8. [Google Scholar] [CrossRef]
  61. Lara, I.; García, P.; Vendrell, M. Modifications in cell wall composition after cold storage of calcium-treated strawberry (Fragaria × ananassa Duch.) fruit. Postharvest Biol. Technol. 2004, 34, 331–339. [Google Scholar] [CrossRef]
  62. Li, T.; Bai, D.Q.; Tian, L.; Li, P.; Liu, Y.H.; Jiang, Y. Effects of stimulators on lutein and chlorophyll biosyntheses in the green alga chlorella pyrenoidosa under heterotrophic conditions. Adv. Appl. Biotechnol. 2015, 1, 28–30. [Google Scholar]
  63. Wu, X.F.; Zhang, M.; Adhikari, B.; Sun, J.C. Recent advances for rapid freezing and thawing methods of foods. Crit. Rev. Food Sci. Nutr. 2017, 57, 3620–3631. [Google Scholar] [CrossRef] [PubMed]
Figure 1. Effects of different storage and thawing temperatures on total chlorophyll content of celery leaf blades during thawing. The A, B, C, and D of the horizontal axis are the treatment groups of −80 °C and 4 °C, −80 °C and 25 °C, −18 °C and 4 °C and −18 °C and 25 °C. The error lines are three independently repeated standard errors for each group, with different letters above the error lines indicating statistically significant differences (p < 0.05).
Horticulturae 10 00267 g001
Figure 2. Changes in total chlorophyll content of celery leaf blades in each treatment group with different storage and thawing temperatures during thawing. The A, B, C, and D of the drawing note are the treatment groups of −80 °C and 4 °C, −80 °C and 25 °C, −18 °C and 4 °C and −18 °C and 25 °C. The error lines are three independently repeated standard errors for each group, with different letters above the error lines indicating statistically significant differences (p < 0.05).
Horticulturae 10 00267 g002
Figure 3. Effects of different storage and thawing temperatures on chlorophyll a content of celery leaf blades during thawing. The A, B, C, and D of the horizontal axis are the treatment groups of −80 °C and 4 °C, −80 °C and 25 °C, −18 °C and 4 °C, and −18 °C and 25 °C. The error lines are three independently repeated standard errors for each group, with different letters above the error lines indicating statistically significant differences (p < 0.05).
Horticulturae 10 00267 g003
Figure 4. Changes in chlorophyll a content of celery leaf blades in each treatment group with different storage and thawing temperatures during thawing. The A, B, C, and D of the drawing note are the treatment groups of −80 °C and 4 °C, −80 °C and 25 °C, −18 °C and 4 °C, and −18 °C and 25 °C. The error lines are three independently repeated standard errors for each group, with different letters above the error lines indicating statistically significant differences (p < 0.05).
Horticulturae 10 00267 g004
Figure 5. Effects of different storage and thawing temperatures on chlorophyll b content of celery leaf blades during thawing. The A, B, C, and D of the horizontal axis are the treatment groups of −80 °C and 4 °C, −80 °C and 25 °C, −18 °C and 4 °C, and −18 °C and 25 °C. The error lines are three independently repeated standard errors for each group, with different letters above the error lines indicating statistically significant differences (p < 0.05).
Horticulturae 10 00267 g005
Figure 6. Changes in chlorophyll b content of celery leaf blades in each treatment group with different storage and thawing temperatures during thawing. The A, B, C, and D of the drawing note are the treatment groups of −80 °C and 4 °C, −80 °C and 25 °C, −18 °C and 4 °C, and −18 °C and 25 °C. The error lines are three independently repeated standard errors for each group, with different letters above the error lines indicating statistically significant differences (p < 0.05).
Horticulturae 10 00267 g006
Figure 7. Effects of different storage and thawing temperatures on total chlorophyll content of celery petioles during thawing. The A, B, C, and D of the horizontal axis are the treatment groups of −80 °C and 4 °C, −80 °C and 25 °C, −18 °C and 4 °C, and −18 °C and 25 °C. The error lines are three independently repeated standard errors for each group, with different letters above the error lines indicating statistically significant differences (p < 0.05).
Horticulturae 10 00267 g007
Figure 8. Changes in total chlorophyll content of celery petioles in each treatment group with different storage and thawing temperatures during thawing. The A, B, C, and D of the drawing note are the treatment groups of −80 °C and 4 °C, −80 °C and 25 °C, −18 °C and 4 °C, and −18 °C and 25 °C. The error lines are three independently repeated standard errors for each group, with different letters above the error lines indicating statistically significant differences (p < 0.05).
Horticulturae 10 00267 g008
Figure 9. Effects of different storage and thawing temperatures on chlorophyll a content of celery petioles during thawing. The A, B, C, and D of the horizontal axis are the treatment groups of −80 °C and 4 °C, −80 °C and 25 °C, −18 °C and 4 °C and −18 °C and 25 °C. The error lines are three independently repeated standard errors for each group, with different letters above the error lines indicating statistically significant differences (p < 0.05).
Horticulturae 10 00267 g009
Figure 10. Changes in chlorophyll a content of celery petioles in each treatment group with different storage and thawing temperatures during thawing. The A, B, C, and D of the drawing note are the treatment groups of −80 °C and 4 °C, −80 °C and 25 °C, −18 °C and 4 °C and −18 °C and 25 °C. The error lines are three independently repeated standard errors for each group, with different letters above the error lines indicating statistically significant differences (p < 0.05).
Horticulturae 10 00267 g010
Figure 11. Effects of different storage and thawing temperatures on chlorophyll b content of celery petioles during thawing. The A, B, C, and D of the horizontal axis are the treatment groups of −80 °C and 4 °C, −80 °C and 25 °C, −18 °C and 4 °C, and −18 °C and 25 °C. The error lines are three independently repeated standard errors for each group, with different letters above the error lines indicating statistically significant differences (p < 0.05).
Horticulturae 10 00267 g011
Figure 12. Changes in chlorophyll b content of celery petioles in each treatment group with different storage and thawing temperatures during thawing. The A, B, C, and D of the drawing note are the treatment groups of −80 °C and 4 °C, −80 °C and 25 °C, −18 °C and 4 °C, and −18 °C and 25 °C. The error lines are three independently repeated standard errors for each group, with different letters above the error lines indicating statistically significant differences (p < 0.05).
Horticulturae 10 00267 g012
Figure 13. Effects of different freezing and thawing temperatures on total carotenoid content of celery leaf blades during thawing. The A, B, C, and D of the horizontal axis are the treatment groups of −80 °C and 4 °C, −80 °C and 25 °C, −18 °C and 4 °C, and −18 °C and 25 °C. The error lines are three independently repeated standard errors for each group, with different letters above the error lines indicating statistically significant differences (p < 0.05).
Horticulturae 10 00267 g013
Figure 14. Changes in total carotenoid content of celery leaf blades in each treatment group with different storage and thawing temperatures during thawing. The A, B, C, and D of the drawing note are the treatment groups of −80 °C and 4 °C, −80 °C and 25 °C, −18 °C and 4 °C, and −18 °C and 25 °C. The error lines are three independently repeated standard errors for each group, with different letters above the error lines indicating statistically significant differences (p < 0.05).
Horticulturae 10 00267 g014
Figure 15. Effects of different freezing and thawing temperatures on total carotenoid content of celery petioles during thawing. The A, B, C, and D of the horizontal axis are the treatment groups of −80 °C and 4 °C, −80 °C and 25 °C, −18 °C and 4 °C, and −18 °C and 25 °C. The error lines are three independently repeated standard errors for each group, with different letters above the error lines indicating statistically significant differences (p < 0.05).
Horticulturae 10 00267 g015
Figure 16. Effects of different storage and thawing temperatures on total carotenoid content of celery petioles during thawing. The A, B, C, and D of the horizontal axis are the treatment groups of −80 °C and 4 °C, −80 °C and 25 °C, −18 °C and 4 °C and −18 °C and 25 °C. The error lines are three independently repeated standard errors for each group, with different letters above the error lines indicating statistically significant differences (p < 0.05).
Horticulturae 10 00267 g016
Figure 17. Principal component analysis of celery pigment degradation with different treatment temperatures during thawing. In figures “loadings” on the left, “1” represents the chlorophyll a content of leaf blades, “2” represents the chlorophyll b content of leaf blades, “3” represents the total chlorophyll content of leaf blades, “4” represents the carotenoids content of leaf blades, “5” represents the chlorophyll a content of petioles, “6” represents the chlorophyll b content of petioles, “7” represents the total chlorophyll content of petioles, and “8” represents the carotenoids content of petioles. The arrows and points indicate the value and the degree of dispersion of dependent variables in each principal component respectively.
Horticulturae 10 00267 g017
Figure 18. Principal component analysis of celery pigment degradation with different thawing times during thawing. In figures loadings on the left, “1” represents the chlorophyll a content of leaf blades, “2” represents the chlorophyll b content of leaf blades, “3” represents the total chlorophyll content of leaf blades, “4” represents the carotenoids content of leaf blades, “5” represents the chlorophyll a content of petioles, “6” represents the chlorophyll b content of petioles, “7” represents the total chlorophyll content of petioles, and “8” represents the carotenoids content of petioles. The arrows and points indicate the value and the degree of dispersion of dependent variables in each principal component respectively.
Horticulturae 10 00267 g018
Figure 19. Principal component analysis of celery pigment degradation of different leaf parts during thawing. In figures loadings on the left, “1” represents the chlorophyll a content of leaf blades, “2” represents the chlorophyll b content of leaf blades, “3” represents the total chlorophyll content of leaf blades, “4” represents the carotenoids content of leaf blades, “5” represents the chlorophyll a content of petioles, “6” represents the chlorophyll b content of petioles, “7” represents the total chlorophyll content of petioles, and “8” represents the carotenoids content of petioles. The arrows and points indicate the value and the degree of dispersion of dependent variables in each principal component respectively.
Horticulturae 10 00267 g019
Table 1. Grouping design and treatment plan.
Freezing
Temperature
Thawing
Temperature
Measure Time and Group
0 h3 h6 h12 h24 h
−80 °C4 °CA1A2A3A4A5
25 °CB1B2B3B4B5
−18 °C4 °CC1C2C3C4C5
25 °CD1D2D3D4D5
The following text expresses the treatment in the form of “Freezing temperature and thawing temperature”, such as group A is represented as “−80 °C and 4 °C”, group B is represented as “−80 °C and 25 °C”, group C is represented as “−18 °C and 4 °C”, and group D is represented as “−18 °C and 25 °C”.
Disclaimer/Publisher’s Note: The statements, opinions and data contained in all publications are solely those of the individual author(s) and contributor(s) and not of MDPI and/or the editor(s). MDPI and/or the editor(s) disclaim responsibility for any injury to people or property resulting from any ideas, methods, instructions or products referred to in the content.

