Abstract
Ridging cultivation and root restriction cultivation are beneficial due to their improvement of the soil permeability in the root zone of grapevine, and they are widely used in southern China, Japan, and other countries. However, with the intensification of global warming, when using ridging or root restriction cultivation, the soil temperature in the root zone can often reach 30 °C or even more than 35 °C during the summer, which is not conducive to the growth of grapevines. The aim of this study was to explore the effects of high root zone temperatures on the photosynthetic fluorescence characteristics of grapevine leaves, root respiration, and degree of lignification of roots and shoots, as well as to provide a theoretical foundation for the management of grapevine production and cultivation. One-year-old potted ‘Kyoho’ was used as the study material. Three root temperature treatments were implemented for 15 days (9:00–16:00): 25 °C (CK), 30 °C (T1), and 35 °C (T2). The results showed that the malondialdehyde and H2O2 levels in leaves increased, while the chlorophyll content decreased. The oxygen-evolving complex was inactivated, and PSII donor and acceptor sides were blocked, thus reducing the photosynthetic gas exchange capacity at high root zone temperatures. The grapevine root activity and root/shoot ratio decreased. Simultaneously, the lignin content in the roots and shoots increased. In addition, there was a significant increase in the expression of key genes (PAL, C4H, 4CL, F5H, COMT, CCR, and CAD) in the root lignin synthesis pathway. Heightened root zone temperatures increased cyanide-resistant respiration in roots and heat release in the PPP pathway to alleviate stress damage. Therefore, it is recommended to use grass, mulching, and other cultivation management methods to maintain root zone temperatures below 30 °C in order to ensure the normal growth of grapevines and promote a high and stable yield.
1. Introduction
Temperature is one of the most important factors affecting the growth, development, yield, and quality of grapevines, and it determines changes in phenology. As a thermophilic fruit tree with economic value, a grapevine’s phenological period starts from bleeding. When the soil temperature reaches 8–10 °C at a depth of 5 cm, the roots begin a series of activities to absorb water and nutrients from the soil, thus affecting the phenological period of the aboveground leaves. Appropriately increasing the soil temperature in the root zone in early spring can break the ecological inhibitory dormancy of grapevine and relieve its dormancy in advance. When new shoots rapidly enter the long-term flowering and fruiting period, the suitable root zone temperature is 21–24 °C [1]. However, most parts of China are in subtropical and temperate monsoon climate zones, and high root zone temperatures are a common phenomenon in the hot summers. Especially under the conditions of plastic film mulching, root restriction cultivation, and greenhouses, root zone temperatures often exceed 30 °C and even 35 °C on extremely hot days [2,3]. Walker (1969) showed that a relative temperature difference of 1 °C could cause a significant chain reaction in plant growth and nutrient uptake [4]. The Fo (initial fluorescence value), Fm (maximum fluorescence value), and ΔF/Fm′ (actual quantum efficiency) values of Chinese cabbage were significantly reduced after 7 days of high-temperature treatment of the root zone at 35 °C [5]. The actual photochemical efficiency (ΦPS), electron transport rate (ETR), and photochemical quenching coefficient (qP) of maize under high-temperature stress (36 °C) in the root zone were also significantly reduced [6]. A study on high root zone temperatures in grapevines for a short term (3 h) showed that the photochemical efficiency Y(II) and quantum yield of electron transport (φEo) of photosystem II in grape leaves decreased, and the variable fluorescence (Vj) of the J point and the quantum yield Y(NPQ) of non-regulated energy dissipation significantly increased [7]. An uncomfortably high temperature in the root zone has a negative impact on the normal physiological function of the root system and can even cause damage to its physiological structure such that it loses activity. Ding et al. [8] found that too high of a root zone temperature would reduce the absorption of ions by the roots; in particular, when it reached about 30–35 °C, the roots were shortened and thickened. The root weight, number, total surface area, and absorption area were significantly lower than those of the control, and the accumulation and transportation of mineral elements were seriously hindered. When the root zone temperature exceeded 35 °C, the dry weight, fresh weight, and leaf number of Jinxing melon seedlings sharply decreased, and the content of phosphorus, manganese, and zinc in the aboveground part also sharply decreased. When the root temperature exceeded 40 °C, the roots became short and brown, the growth stopped [9], and the change in root status was quickly transmitted to the aboveground part through biochemical signals, such as hormones, resulting in the destruction of the overall growth balance of the plant. Tomato [10], lettuce [11], flue-cured tobacco [9], and other plants are weakened; the plant height, stem diameter, dry weight, and fresh weight of the aboveground part are significantly reduced, and the chlorophyll content in their leaves is also significantly reduced. The content of soluble protein, proline, MDA (malonaldehyde), and superoxide anion radical (O2−) is significantly increased due to insufficient nutrition (carbon–nitrogen ratio imbalance). This is not conducive to the development of inflorescence and causes late flowering and fruit setting, affecting the total sugar and phenol content of the fruit [12,13].
The root system of ridge-cultured grapevine is mainly distributed in the 0–30 cm soil layer. Although the use of cultivation facilities can quickly reduce the temperature through indoor and outdoor ventilation, air micro-spraying, shading nets, and other measures, the cooling speed is slow and the duration is long due to the high specific heat capacity of the soil [14]. In addition, soil thermal conductivity is related to the soil type [15]. Wang et al. [16] suggested that the higher the sand content, the greater the thermal conductivity of the soil while considering the same water content. Among the cultivation methods that can reduce the ground temperature, mulching and irrigation are effective. Mulching can limit the heat exchange between the soil and the external environment, thus playing a role in cooling [17]. Generally, in orchards, where the soil layer is above 20 cm, the temperature of covered soil is 3–5 °C higher than that in soil that is not covered. In the environment of high temperatures in summer, the soil temperature of inter-row grass cover was reduced by 10.7 °C compared with the control, and the rhizospheric soil temperature was also reduced by 2.5 °C [18]. At present, the common covering materials include agricultural floor cloth, carpet, black film, reflective film, organic materials, and other materials. The most common organic materials include broken branches, hay, straw, shells, plant residues, and so on. Therefore, in recent years, this has gradually attracted the attention of researchers and has become a widely implemented orchard soil management method in developed countries.
Previous studies focused on root zone temperature using short-term artificial climate chambers or hydroponic conditions. However, there is a gap in long-term systematic research on the effects of root temperature on both the aboveground and underground growth of fruit tree seedlings. It is necessary to study the influence of climate change on the phenological period of grapes, find the key cultivation techniques, make full use of the advantages of climate resources, reduce or avoid the adverse effects of climate change on the development of the grape industry, and achieve high yield and high quality of grapes through appropriate cultivation measures so as to promote farmers’ income and the sustainable development of agriculture. This study primarily explored the impacts of prolonged high root zone temperatures on the growth potential, photosynthetic fluorescence, new shoot/root lignification, reactive oxygen species, antioxidants, root activity, and respiration of grapevines. Therefore, it provides a theoretical foundation for measures for regulating the root temperature in the cultivation and management of grapevines.
2. Material and Methods
2.1. Test Materials and Treatment
The experiment was carried out in a solar greenhouse (covered with PO film) at the Horticultural Experimental Station of Shandong Agricultural University while utilizing one-year-old ‘Kyoho’ grapevine (Vitis vinifera L. × V. labrusca L. ‘Kyoho’) as the test material. The cultivation substrate involved a mixture of vermiculite, peat, cow dung, and earthworm soil at a ratio of 1:1:1:1, and each grapevine was planted in a basin (22 cm in diameter and 23 cm in height). A test was performed when the plant had 8–10 complete leaves. To heat the roots, an electric heating plate and wire were used, and insulated cotton and sandy soil were used for heat preservation. Three gradients were set on the thermostat—CK at 25 °C, T1 at 30 °C, and T2 at 35 °C—and maintained for 15 days (20 April 2022–29 April 2022). The root temperature treatment was imposed from 9:00 to 16:00, with no treatment at night. Throughout the experiment, the light intensity, air temperature, and moisture were suitable for each treatment; the light intensity was 800–1000 μmol·m−2·s−1, the temperature was 15–25 °C, and the air humidity was 50–60%. The soil water-holding capacity was maintained at about 60%; the amount of irrigation remained uniform and was administered every three days (18:00). Nine biological replicates were established, and a temperature monitor (LUGE, L92-1, Hangzhou, China) was used to track the rhizospheric soil temperature 5 cm below the surface in real time. The daily average temperature of the rhizosphere from 9:00 to 16:00 is shown in the following Figure 1.
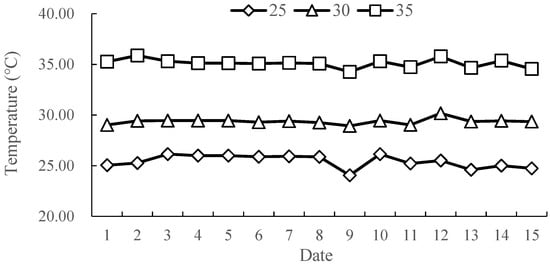
Figure 1.
The daily average temperature of the rhizosphere from 9:00 to 16:00.
2.2. Measurement Indexes and Methods
2.2.1. Determination of the Plant Growth Potential and Lignin Content
The shoot growth length was measured with a tape measure (accurate to 0.1 cm). The transverse and longitudinal diameters and the pith ratio of the 4th stem node were measured with vernier calipers (accurate to 0.01 mm). The stem firmness of the 4th stem node was measured by using the cutting test method with a TA.XT Universal Testing Machine and a Texture Analyzer (Stable Micro Systems, Godalming, UK). An extended technology tool (type A/ECB, lot number 12611) was used for the cutting test, and the cutting speed was set to 1.0 mm/s. The transverse cut depth was 3.0 mm, and the trigger pressure was 5.0 g [19].
The cleaned seedlings were dried in an oven at 105 °C to a constant weight, and the root–shoot ratio was calculated [20]. This was repeated 6 times for each treatment. Finally, the roots and the 4th stem node were crushed, ground into a powder, and sieved through 60 meshes, and the total lignin content was determined by using the acetyl bromide method with reference to Yin et al. [21].
2.2.2. Determination of the Kinetic Curves of Fast Chlorophyll Fluorescence
Using a continuous excitation fluorometer (Handy PEA, Hansatech, Norfolk, UK) from 9:30 to 11:00, the kinetic curve of rapid chlorophyll fluorescence induction (OJIP curve) was determined with a red light of 3000 μmol·m−2·s−1 for fully dark-adapted grapevine leaves. The following parameters were obtained directly from the OJIP curve [22]: Fo: 20–50 μs, minimum fluorescence; Fk: K point (300 μs) fluorescence; Fj: J point fluorescence at 2 ms; Fi: I point (30 ms) fluorescence; Fm: P point (0.3–2 s) fluorescence.
After the JIP-text analysis, the relative fluorescence curve was obtained with the equation Vt = (Ft − Fo)/(Fm − Fo), and the following parameters were obtained [22,23]: the maximum photochemical efficiency of PSII (Fv/Fm), the quantum ratio for heat dissipation (φDo), the relative variable fluorescence value of the K point (VK), the relative variable fluorescence value of the J point (Vj), the light energy absorbed per unit area (ABS/CSm), the light energy captured per unit area (TRo/CSm), the quantum yield of electron transfer per unit area (ETo/CSm), the quantum yield of heat dissipation per unit area (DIo/CSm), the light energy absorbed per unit reaction center (ABS/RC), the energy captured per unit reaction center (TRo/RC), the energy for electron transfer per unit reaction center (ETo/RC), and the quantum yield for the heat dissipation per unit reaction center (DIo/RC).
2.2.3. Determination of Photosynthetic Gas Exchange Parameters
The net photosynthetic rate (Pn), intercellular CO2 concentration (Ci), stomatal conductance (Gs), and transpiration rate (E) of the leaves were measured with a CIRAS-3 portable photosynthetic system analyzer (PPSystems, Amesbury, MA, USA) from 9:30 to 11:00. The internal light intensity was set to 1200 μmol·m−2·s−1, the temperature was 27 ± 2 °C, and the external CO2 concentration was 390 μmol·m−2·s−1.
2.2.4. Determination of Chlorophyll, Malondialdehyde, and Hydrogen Peroxide Content in Grapevine Leaves
The chlorophyll content was determined by using the ethanol extraction method; fresh plant leaves (0.2 g) were washed, dried, chopped, and placed in a 25 mL glass test tube; 10 mL of 95% ethanol was added, and extraction was carried out for 24 h without light. After 24 h, the volume was fixed to the 25 mL scale line; a comparison was performed at the wavelengths of 649 nm, 665 nm, and 470 nm, and the chlorophyll content in the sample was calculated.
The malondialdehyde (MDA) content was determined with the thiobarbituric acid colorimetric method. The leaves were wiped clean, accurately weighed to 0.5 g, cut into pieces, and placed in a mortar; then, 2 mL of 10% TCA (trichloroacetic acid) was added. The sample was ground into a homogenate, and 3 mL of TCA was continuously added as a grinding fluid. This was placed in a centrifuge tube and centrifuged at 4000 r/min for 10 min. Then 2 mL of the supernatant in the centrifuge tube was moved to a blank test tube, and 2 mL of 0.6% TBA (thiobarbituric acid) was added. The test tube was treated in a water bath at 100 °C for 15 min. After 15 min, the test tube was taken out and cooled. The absorbance at 600 nm, 532 nm, and 450 nm was measured, and the MDA content was calculated.
The H2O2 content was determined with the titanium sulfate colorimetric method [24]. First, a 0.5 g sample was taken, and 2 mL of pre-cooled acetone was added. After fully grinding and homogenizing, the sample was centrifuged at 10,000 r/min for 10 min; 1 mL of supernatant was taken, and 5% titanium sulfate and concentrated ammonia were added. After centrifugation at 5000 r/min for 10 min, the precipitate was dissolved in 5 mL of 2 mol/L sulfuric acid, and the absorbance was determined at 415 nm. Each treatment was repeated three times.
2.2.5. Determination of Antioxidant Enzymes and Proline Content in Grapevine Leaves
The superoxide dismutase (SOD) content was determined through spectrophotometry (WST-8 method) using a Suzhou Keming Biotechnology Limited Kit with catalase (CAT) and peroxidase (POD). The proline content was determined with the ninhydrin colorimetric method [24]; 0.5 g of roots were weighed, 5 mL of 3% sulfosalicylic acid solution was added, extraction was carried out in a boiling water bath for 10 min, and the resulting sample was filtered into a clean tube after cooling. Then, 2 mL of filtrate was mixed with 5 mL of 2.5% acidic ninhydrin color solution, and the mixture was heated in a boiling water bath for 40 min. After cooling, 4 mL of toluene was added and centrifuged at 3000 r/min for 5 min. Toluene was used as a blank, and the absorption value of the upper liquid at 520 nm was measured with an ultraviolet spectrophotometer.
2.2.6. Determination of the Root Respiratory Pathway
The oxygen evolution rate of the basic biochemical pathway was measured at various treatment temperatures using an Oxytherm oxygen electrode (Hansatech, Norfolk, UK). The temperature of the reaction chamber was automatically controlled with the temperature control device of the Oxytherm oxygen electrode. The respiration rate and respiratory pathway of the leaves were calculated by measuring the changes in oxygen concentration in the solution. The diameter of the new white roots was about 1.5 mm, and the length was 2–3 cm. During the determination, an amount of about 0.1 g was quickly weighed, and the root was cut into about 2 mm root segments with a double-sided knife. The root segments were placed in a reaction cup, and 2 mL of the reaction solution was accurately added (the temperature of the reaction solution was consistent with the treatment temperature). A cover was added, and the measurement program was started. Each sample was measured for 5–10 min, and the measurements were repeated 3 times. The specific respiratory inhibitor method was used to measure the respiratory pathways, and 10 mmol/L sodium fluoride (NaF) was used to measure the glycolysis (EMP) respiratory pathway. In addition, 10 mmol/L sodium phosphate (Na3PO4) was used to determine the respiratory pathway of pentose phosphate (PPP), the tricarboxylic acid cycle (TCA) pathway was determined with 50 mmol/L malonic acid, and 10 mmol/L salicylhydroxamic acid (SHAM) was used to determine the cyanide-resistant respiratory (AOX) pathway. An amount of 0.05 was used for each inhibitor [25]. Each experiment was repeated three times.
2.2.7. Determination of Grapevine Root Activity
The root activity of the grapevines was determined by using the triphenyltetrazolium chloride (TTC) method [24]. First, 10 mL of 4 g/L TTC solution and 10 mL of phosphate buffer (pH 7.0) were added to 0.5 g of roots, and the reaction was terminated by adding sulfuric acid after incubation in the dark at 37 °C for 4 h. The appropriate amount of 95% ethanol was added to extract tricresyl brown, and the absorbance of the sample extract was determined at a wavelength of 485 nm. The root activity was expressed as the TTC reduction intensity per unit mass of fresh root, and each treatment was repeated three times.
2.2.8. Determination of Lignin-Related Gene Expression
Nine genes involved in lignin biosynthesis were selected to verify the results of RNA-seq qRT-PCR. The primers used in qRT-PCR are shown in Table 1. TB Green Premix Ex Taq II (TliRNaseH Plus, Takara, Beijing, China) was used for qRT-PCR. The following reaction conditions were used: pre-denaturation at 95 °C for 10 min, denaturation at 94 °C for 15 s, annealing at 55 °C for 15 s, extension at 65 °C for 10 s, and 45 cycles (denaturation→extension), with at least 3 replicates per treatment.

Table 1.
The primers needed for the experiment.
2.3. Data Analysis
All treatments were subjected to at least 3 independent biological replications. Origin 2021 (Origin Lab Corp., Northampton, MA, USA) was used for data plotting (mean ± standard deviation), SPSS 24.0 (IBM Corp., Armonk, NY, USA) was used for one-way ANOVA and multiple comparisons, and Duncan’s test was used for the analysis of significant differences (p < 0.05) among the treatments.
3. Results
3.1. Effects of High Root Zone Temperatures on Grapevines’ Growth Potential
Table 2 illustrates that there was a significant increase in stem firmness due to the elevated root zone temperatures. Specifically, the stem firmness in treatments T1 and T2 exhibited significant increases of 47.48% and 81.28%, respectively, compared to that in CK. Concurrently, the pith ratios of T1 and T2 increased by 33.33% and 43.75%, respectively, in comparison with that of CK. The high-temperature root zone treatment reduced the shoot growth length and root–shoot ratio. T2 showed a 30.93% reduction in the shoot growth length and a 14.13% decrease in the root–shoot ratio in comparison with those of CK. No significant difference was observed between T1 and CK. The root temperature treatments had no significant effects on the vertical and horizontal branch diameters. The grapevine stems exhibited an increase in lignin content with increasing root zone temperature. Compared with CK, T1 and T2 showed significant increases of 25.72% and 55.33% in the stem lignin content, respectively.
Table 2.
Effects of different root zone temperature treatments on the shoot characteristics of ‘Kyoho’.
3.2. Effects of High-Root-Zone-Temperature Treatments on the Photosynthetic Performance of Grapevine Leaves
3.2.1. Effects of High-Root-Zone-Temperature Treatments on the Chlorophyll Content of Grapevine Leaves
As shown in Figure 2, compared with that in CK, the overall chlorophyll content in T1 and T2 decreased, and the chlorophyll content in T2 decreased more than that in T1. The content of chlorophyll a, chlorophyll b, chlorophyll (a + b), and carotenoids in T1 and T2 was significantly lower than that in CK, with the chlorophyll a content being 17.07% and 26.83% lower than that in CK, respectively. The chlorophyll b content decreased by 13.89% and 22.22%, and the chlorophyll (a + b) content decreased by 44.38% and 50.56% in T1 and T2, respectively. The carotenoid content also decreased by 12.63% and 20.97% compared with the control.
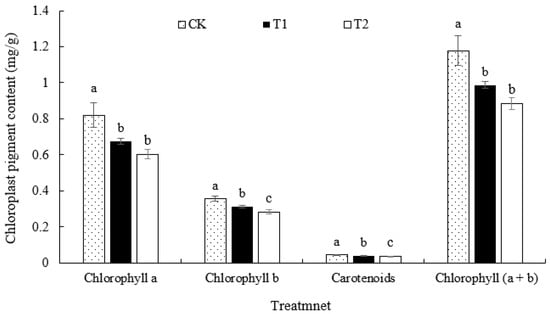
Figure 2.
Effects of different root zone temperature treatments on the chloroplast pigment content in ‘Kyoho’ grapevine leaves. Values are the means of three replicates, and error bars denote the standard deviation. Different lowercase letters indicate significant differences based on Duncan’s multiple-range test (p < 0.05).
3.2.2. Effects of the High-Root-Zone-Temperature Treatment on the Fluorescence Characteristics of Grapevine Leaves
The OJIP transient exhibited various changes with the different root zone temperature treatments. In the short-term treatment (Figure 3A), the fluorescence curve retained typical OJIP characteristics. The O-J phase experienced slight changes, while the fluorescence intensity of the I-P phase significantly decreased. Higher short-term root zone temperatures accentuated this decline, signifying a reduced capacity of the leaves to absorb light energy per unit area. The long-term root zone treatment (Figure 3B) altered the fluorescence curve, causing the typical OJIP characteristics to be lost. The K point (0.3 ms), J point (2 ms), and initial fluorescence values increased, and treatment T2 showed a greater increase than that of treatment T1, indicating severe damage to the oxygen evolution complex (OEC) during photosynthetic electron transport under prolonged high root zone temperatures.
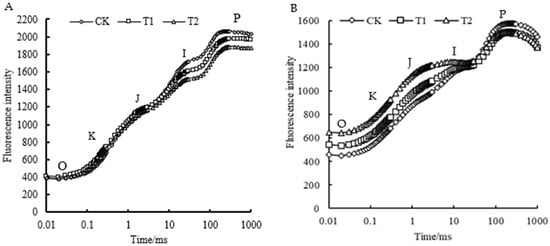
Figure 3.
Effects of different root zone temperature treatments on the rapid chlorophyll fluorescence induction curves of ‘Kyoho’ leaves. (A) Root zone temperature treatment for 3 days; (B) root zone temperature treatment for 15 d.
The JIP-text analysis yielded the parameters of the fluorescence kinetic curves. Figure 4 shows that Fv/Fm significantly decreased with the increase in root zone temperature, which was in contrast to the opposite trend in the φDo for heat dissipation from absorbed light energy. Vk reflected that there was damage to the oxygen evolution complex (OEC) on the donor side of PSII [29], and Vj indicated that there was damage on the PSII receptor side. Compared with CK, T1 and T2, respectively, showed increases of 21.74% and 30.43% in their Vk values and 24.39% and 80.49% in their Vj values. This suggested that the PSII receptor side suffered significantly more damage in the high-temperature treatment in the T2 root zone than the donor side did.
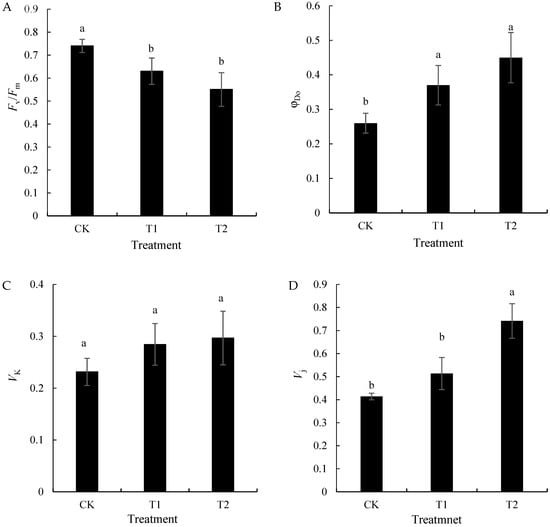
Figure 4.
Effects of different root zone temperature treatments on the Fv/Fm (A), φDo (B), Vk (C), and Vj (D) values of ‘Kyoho’ leaves. Values are the means of three replicates, and error bars denote the standard deviation. Different lowercase letters indicate significant differences based on Duncan’s multiple-range test (p < 0.05).
The parameters for PSII light absorption, transmission, and conversion are presented in Table 3. When focusing on the unit reaction center (RC, PSII), stress due to high root zone temperatures increased ABS/RC, TRo/RC, and DIo/RC. However, ETo/RC significantly decreased, and the values in treatments T1 and T2 decreased by 36.46% and 54.16%, respectively, compared with that in CK. ABS/CSm, TRo/CSm, and ETo/CS were significantly reduced in treatments T1 and T2. ETo/CSm decreased by 32.62% and 64.52%, respectively, compared with that in CK; DIo/CSm increased by 15.49% and 53.53%, respectively, compared with that in CK. The high-temperature root zone stress significantly affected the PSII reaction center’s light energy absorption, capture, and electron transfer performance.
Table 3.
Effects of different root zone temperature treatments on the fluorescence parameters of ‘Kyoho’ leaves.
3.2.3. Effects of the High-Root-Zone-Temperature Treatments on the Photosynthetic Gas Exchange Parameters of Grapevine Leaves
Table 4 illustrates the significant decline in Pn following the 15-day high-temperature stress treatment in the root zone. T1 and T2 exhibited reductions of 33.57% and 61.40%, respectively, in comparison with the values in CK. Ci displayed different changes, with that in T1 decreasing by 10.69% and that in T2 increasing by 20.33% compared with that in CK. The Gs and E values of treatment T1 were significantly lower than those in CK by 19.38% and 20.12%, while those in treatment T2 were significantly lower than those in CK by 45.95% and 39.64%.
Table 4.
Effects of different root zone temperature treatments on the photosynthetic gas exchange parameters of ‘Kyoho’ leaves.
3.3. Effects of High-Root-Zone-Temperature Treatments on the Production and Scavenging of Reactive Oxygen Species in Grapevine Leaves
The MDA serves as an indicator of the degree of membrane lipid peroxidation. In Table 5, it is evident that treatments T1 and T2 significantly damaged the leaf membrane lipid structures, with their content increasing by 11.54% and 22.62% compared with that in CK. High-temperature stress in the root zone also influenced the leaf H2O2 content. Compared with that in CK, the H2O2 levels in treatments T1 and T2 increased by 58.57% and 96.05%, respectively (Table 5), indicating that the antioxidant mechanism in the high-root-zone-temperature treatment was insufficient to eliminate excess H2O2, causing oxidative damage to the leaf cell membrane lipids. Table 5 illustrates that elevated root zone temperatures enhanced the antioxidant enzyme levels and osmoregulator proline content in grapevine leaves. Specifically, the SOD and CAT activity in treatment T2 increased by 64.85% and 152.49%, respectively, compared with that in CK, while T1 showed no significant differences from CK. The POD activity in treatments T2 and T1 spiked by 177.41% and 103.22%, respectively, in comparison with that in CK. The proline content in the leaves increased by 27.82% (T1) and 41.31% (T2) compared with that in CK.
Table 5.
Effects of different root zone temperature treatments on the production and scavenging of reactive oxygen species in ‘Kyoho’ grapevine leaves.
3.4. Effects of the High-Temperature Treatments in the Root Zone on the Respiration and Lignification of Grape Roots
3.4.1. Effects of the High-Root-Zone-Temperature Treatments on the Respiration Intensity of Grapevine Roots
The different root respiration measurements at different root zone temperatures (Figure 5) revealed increased respiratory intensity in various root types with increasing root zone temperatures, thereby showcasing significant differences. In treatment T1, the EMP, TCA, and PPP respiration rates were 71.42, 55.03, and 68.73 nmol·g−1·min−1, respectively—28.63%, 30.18%, and 14.99% higher than those in CK, respectively. However, treatment T2 showed higher rates: 109.04, 80.85, and 114.87 nmol·g−1·min−1, with the PPP pathway dominating. The AOX increased by 34.33% (T1) and 79.28% (T2) compared with that in CK.
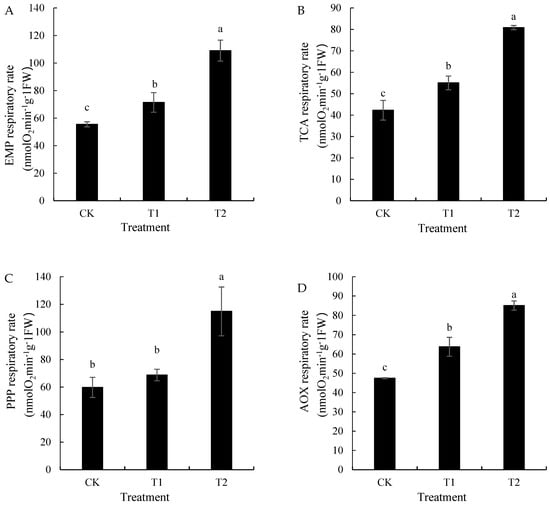
Figure 5.
Effects of different root zone temperature treatments on the respiration intensity of ‘Kyoho’ grapevine roots. Values are the mean of three replicates, and error bars denote the standard deviation. Different lowercase letters indicate significant differences based on Duncan’s multiple-range test (p < 0.05). (A): EMP respiratory rate, (B): TCA respiratory rate, (C): PPP respiratory rate, (D): AOX respiratory rate.
3.4.2. Effects of the High-Root-Zone-Temperature Treatments on the Root Activity, Lignin Content, and Expression of Lignin-Synthase-Related Genes of Grapevines
Decreases in activity of 16.34% and 19.79% were exhibited in treatments T1 and T2, respectively, compared with that in CK, after high-temperature stress in the root zone. The grapevine roots exhibited an increase in lignin content with the increase in the root zone temperature. Compared with CK, T1 and T2 showed significant increases of 34.58% and 68.70% in root lignin content, respectively (Figure 6).
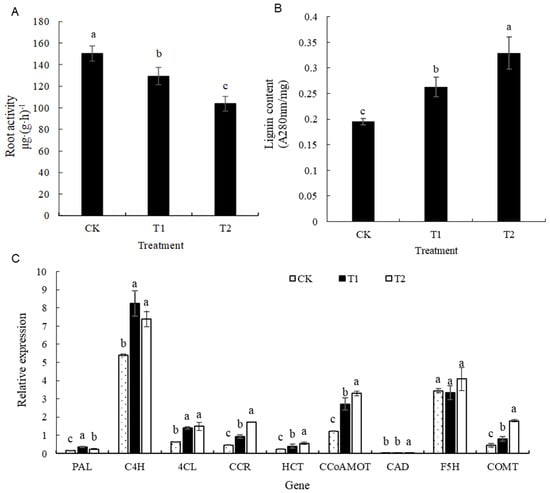
Figure 6.
Effects of different root zone temperature treatments on the root activity (A), lignin content (B), and expression of lignan-synthase-related genes of ‘Kyoho’ grapevine roots (C). Values are the mean of three replicates, and error bars denote the standard deviation. Different lowercase letters indicate significant differences based on Duncan’s multiple-range test (p < 0.05).
As depicted in Figure 6, the expression of nine key genes in the root lignin metabolic pathway revealed that there were higher levels of PAL and C4H in the T1 treatment, as these levels were 2.04 and 1.53 times higher than those of the control, respectively. Additionally, the increase in temperature led to elevations in the expression levels of 4CL, CCR, HCT, CCoAMOT, CAD, and COMT to 2.32, 3.67, 2.29, 2.68, 2.39, and 4.04 times those of the control in treatment T2, respectively. Thus, high temperatures activated the synthesis pathway of lignin.
4. Discussion
Temperature stress is one of the most common abiotic stresses from which plants suffer; photosynthesis is one of the most basic life activities of plants, and it is extremely sensitive to temperature changes [30]. When the root zone temperature exceeds a plant’s tolerance threshold, it inhibits the photosynthetic process and even causes damage [6]. PSII is the primary site of photoinhibition [31]. Studies have shown that compared with the appropriate root zone temperature, high root zone temperatures cause serious damage to the PSII reaction center in the leaves of maize seedlings and significantly reduce the electron transfer rate [6]. In this study, the degree of damage to each part of PSII was analyzed by using the kinetic curves of rapid chlorophyll fluorescence and JIP-text analysis [23]. Similar conclusions were also obtained. The φEo and ETo/CSm values significantly decreased, indicating that the electron transfer of PSII in the reaction center of treatments T1 and T2 was inhibited. The Vk and Vj values in treatment T2 significantly increased, indicating that the OEC of the PSII donor side was destroyed, and the electron transfer from QA to QB was significantly inhibited. This may have been the main reason for the decrease in photosynthetic efficiency and PSII electron transport performance in treatments T1 and T2. In addition, the values of ABS/CSm and TRo/CSm in treatment T2 significantly decreased, while those of φDo and DIo/CSm significantly increased, indicating that leaves could consume excess excitation energy by increasing the proportion of regulatory energy dissipation. However, with the increase in the root zone temperature, the absorption and capture of light energy and the energy used for PSII photochemical reactions in the leaves in treatments T1 and T2 became lower and lower, and the increase in heat dissipation was not enough to consume the excess excitation energy. The inhibition of PSII photochemical reactions was mainly attributed to the damage to the PSII reaction center and the receptor side. The content of photosynthetic pigments can directly reflect the photosynthetic capacity of a plant. Chlorophyll a mainly performs photochemical reactions. Chlorophyll b mainly undertakes the absorption and transmission of light energy. Carotenoids are mainly responsible for dissipating excess light energy and reducing the damage caused by strong light to chlorophyll [32]. The results showed that compared with CK, the contents of chlorophyll a, chlorophyll b, and carotenoids in treatments T1 and T2 significantly decreased, which also showed that the absorption and utilization of light energy in the two groups were seriously affected, and the light protection abilities of leaves also significantly decreased, which was in agreement the above results.
There are two possible cases of photodamage: photodamage originating from the receptor side and photodamage originating from the donor side. The former is mainly due to the obstruction of CO2 assimilation in dark reactions. The accumulation of reducing QA promotes the formation of a large amount of triplet P680. Triplet P680 can react with O2 to form a strong oxidant, singlet oxygen (1O2), and the histidine residue in the D1 protein is the site of 1O2 attack and damage. The latter is due to the fact that the electron transfer of the original electron donor is blocked, which prolongs the life of P680+, and P680+ causes oxidative damage to the D1 protein [30]. In this experiment, the Pn, Gs, and E values in treatments T1 and T2 significantly decreased, while the Ci value in treatment T2 significantly increased. It was speculated that the decrease in the photosynthetic rate in treatment T2 was caused by irreversible non-stomatal limitation, which reduced the activity of RuBP carboxylase/oxygenase in dark reactions, blocked CO2 assimilation, and inhibited the electron transfer on the acceptor side of PSII, resulting in serious photodamage to PSII [33]. The decrease in Ci in treatment T1 suggested that the decrease in the photosynthetic rate in that treatment was caused by the insufficient supply of CO2, the raw material of limited stomatal photosynthetic reactions [34].
Studies have shown that under abiotic stress, ROSs are mainly produced in chloroplasts, peroxisomes, mitochondria, and apoplasts [35]. The PSI and PSII reaction centers in plant chloroplast thylakoids are the main sites of ROS production. Excess light energy produced under high-temperature stress promoted the reduction of O2 into 1O2 through a large amount of triplet P680, which could be converted into H2O2 by Mn-SOD [36]. This may have been related to the increase in H2O2 content in leaves in treatments T1 and T2, and the damage of the membrane structure caused by ROS-mediated membrane lipid peroxidation led to an increase in MDA content. This was consistent with the changes in the physiological characteristics of tomatoes under salt stress [37]. High concentrations of ROSs can cause oxidative stress, causing protein denaturation, enzyme inactivation, nucleic acid damage, and lipid peroxidation, as well as the activation of signaling pathways [38], reverse inhibition of the synthesis of chlorophyll synthase, and enhancement of chlorophyll degradation, which is also one of the reasons for the decrease in the photosynthetic rate [39].
Studies have indicated that under environmental stress, plants exhibit a heat stress response, activating their antioxidant enzyme system to remove excessive ROSs and enhance their stress resistance [40,41]. This study revealed an elevation in the levels of the common antioxidant enzymes SOD, POD, and CAT in plants with increasing stress. Simultaneously, grapevines, when exposed to high temperatures in the root zone, stimulate proline production, thus maintaining stability in their osmotic potential and enhancing water absorption [42]. Additionally, roots are crucial in responding to medium and high temperatures by influencing plants’ anatomical structures. They regulate not only growth through lignin and lignan deposition but also the Kjeldahl zone in vascular tissue to adapt to adverse environments [43,44]. Lignin, which is crucial for cell wall support, prevents negative-pressure-induced wall collapse due to transpiration, ensuring effective substance transport [21,45,46]. In this study, the lignin content in the T1 and T2 grapevine root zones increased with stress, correlating with the increases in PAL, C4H, 4CL, CCR, HCT, CCoAMOT, CAD, and COMT expression due to high-temperature stress. Simultaneously, the stem firmness and pith ratio also significantly increased. This response mirrored Yin et al. [21] findings on lignification in rape stems and roots under high temperatures and drought. This suggested a heightened lignification response as feedback for high root zone temperatures. However, prolonged high root zone temperatures accelerate root aging, as lignification is even extended to the root tip [1].
Root temperature influences root respiration, a key factor limiting plant growth, with maintenance respiration consuming up to 40% of the total photosynthetic products [47]. Under normal growth conditions, plant roots primarily utilize the EMP-TCA pathway for respiration. However, environmental stress prompts a shift to the less productive PPP pathway, which is accompanied by an increase in the AOX pathway, and ATP is released as heat energy to stabilize the respiratory electron chain [48,49]. Our experiment yielded similar results, with less productive respiratory pathways consuming carbohydrates, converting them into heat. Elevated root zone temperatures significantly reduced fine root activity, impeding mineral nutrient absorption, inhibiting root growth, and resulting in a reduced root–shoot ratio. This directly correlated with the suppression of shoot growth, which was consistent with previous studies on cucumber and flowering Chinese cabbage [8,50,51].
5. Conclusions
Long-term high temperatures exceeding 30 °C in the root zone not only decreased chlorophyll content but also significantly increased the Vk and Vj values, while the values of ABS/CSm, TRo/CSm, and ETo/CSm significantly decreased and DIo/CSm increased, which affected the leaf photosynthetic rate and shoot growth. At the same time, the root activity and root–shoot ratio decreased, but the antioxidant content and lignin gene expression increased. Root respiration turned into the PPP pathway, which had less production capacity and cyanide-resistant respiration, and it released more heat to alleviate the stress damage. Therefore, we suggest that keeping root zone temperatures below 30 °C through inter-row grass and common organic matter coverage is crucial for the optimal health of plants.
Author Contributions
Formal analysis, Y.S., X.L. and Y.D.; Writing—original draft, Y.S. and X.L.; Writing—review & editing, Y.S. and X.L.; Software, Z.C.; Data curation, Z.C.; Resources, Z.G.; Supervision, Z.G. and Y.D.; Funding acquisition, Z.G. and Y.D. All authors have read and agreed to the published version of the manuscript.
Funding
This research was supported by the Key R&D plan of Shandong Province (2022LZGCQY018 and 2022TZXD0010), the China Agriculture Research System of MOF and MARA.
Data Availability Statement
The original contributions presented in the study are included in the article, further inquiries can be directed to the corresponding authors.
Conflicts of Interest
Author Zhiyi Cao was employed by the company Shen Shan Grape Technology Co. The remaining authors declare that the research was conducted in the absence of any commercial or financial relationships that could be construed as a potential conflict of interest.
References
- Song, M.L.; Wen, X.Z.; Li, Y.L. A review of the effects of rhizosphere high temperature on plant growth and metabolism. J. Ecol. 2010, 29, 2258–2264. [Google Scholar]
- Wang, H.; Li, Z.H.; Xu, L.C.; Wang, M.; Kang, H.; Yao, Y.X.; Du, Y.P.; Gao, Z. The effect of different air temperatures on the activity of PS Ⅱ in grape leaves and its recovery under root zone high temperature stress. Chin. Fruit Trees 2022, 23–28. [Google Scholar]
- Zou, H.; Wang, C.X.; Huang, D.F.; Wang, R.Z. Numerical study on the effect of optical properties of plastic film on root zone temperature of summer crops. Refrig. Technol. 2021, 41, 1–8. [Google Scholar]
- Walker, J.M. One-degree increments in soil temperatures affect maize seedling behavior. Soil Sci. Soc. Am. J. 1969, 33, 729–736. [Google Scholar] [CrossRef]
- Chen, L.Z.; Zhang, X.B.; Yang, X.F. The effect of rhizosphere high temperature on the root structure, photosynthesis, and chlorophyll fluorescence parameters of fast cabbage. Chin. Melon Veg. 2020, 33, 48–52. [Google Scholar]
- Xia, Z.Q.; Si, L.Y.; Jin, Y.; Fu, Y.F.; Wang, Q.; Lu, H.D. Effects of root zone temperature increase on physiological indexes and photosynthesis of different genotype maize seedlings. Russ. J. Plant Physiol. 2021, 68, 169–178. [Google Scholar] [CrossRef]
- Wang, H.; Wang, M.; Liang, T.; Yao, Y.X.; Du, Y.P.; Gao, Z. The effects of temperature and root zone temperature on the photosynthetic fluorescence characteristics of grape leaves. Acta Bot. Sin. 2022, 57, 209–216. [Google Scholar]
- Ding, X.; Jiang, Y.; He, L.; Zhou, Q.; Yu, J.; Hui, D.; Huang, D. Exogenous glutathione improves high root-zone temperature tolerance by modulating photosynthesis, antioxidant and osmolytes systems in cucumber seedlings. Sci. Rep. 2016, 6, 35424. [Google Scholar] [CrossRef]
- Qiu, Y.; Zhou, J.H.; Huang, S.L.; Li, Q.; Zhang, Y.; Lu, X.Y. The effect of the interaction between root temperature and nitrogen forms on the growth and potassium accumulation of flue-cured tobacco. Chin. J. Tob. 2015, 21, 88–92. [Google Scholar]
- Liu, B.Z.; Zhang, F.; Lei, L.; Meng, X.M.; Zang, M.X.; Dong, C.J.; Shang, Q.M. The effect of root zone temperature stress on the root growth and sucrose metabolism of tomato seedlings. Chin. Veg. J. 2023, 68–77. [Google Scholar]
- Li, R.R.; Zhu, Y.L.; Takayama, M.; Shi, S.H.; Yang, L.F. The effect of root zone temperature on the growth and mineral element content of hydroponic lettuce. Shanghai Agric. J. 2015, 31, 48–52. [Google Scholar]
- Han, Y.P.; Li, Y.L.; Lei, Z.H.; Zhao, D.; Jia, X.S. The effect of different root temperature treatments on the microstructure of tomato leaves. Agric. Sci. Technol. 2016, 17, 1834–1837+1841. [Google Scholar]
- Hmiz, D.J.; Ithbayyib, I.J. Effect of the root zone temperature and salt stress on plant growth, main branches and some other chemical characteristics of tomato fruit Solanum lycopersicum L. cv. memory. Basrah J. Agric. Sci. 2021, 34, 156–170. [Google Scholar] [CrossRef]
- Fu, G.H.; Liu, W.K. The diurnal variation characteristics of root zone temperature in ridge embedded substrate cultivation of sweet pepper in a solar greenhouse. Chin. J. Ecol. Agric. 2016, 24, 47–55. [Google Scholar]
- Peters-Lidard, C.D.; Blackburn, E.; Liang, X.; Wood, E.F. The Effect of Soil Thermal Conductivity Parameterization on Surface Energy Fluxes and Temperatures. J. Atmos. Sci. 1998, 55, 1209–1224. [Google Scholar] [CrossRef]
- Wang, S.; Wang, Q.J.; Fan, J.; Wang, W.H. Comparative analysis of soil thermal conductivity measurement and calculation models. J. Agric. Eng. 2012, 28, 78–84. [Google Scholar]
- Steenwerth, K.L.; Jackson, L.E.; Calderón, F.J.; Stromberg, M.R.; Scow, K.M. Soil microbial community composition and land use history in cultivated and grassland ecosystems of coastal california. Soil Biol. Biochem. 2003, 34, 1599–1611. [Google Scholar] [CrossRef]
- Liu, Y.; Gao, M.; Wu, W.; Tanveer, S.K.; Wen, X.; Liao, Y. The effects of conservation tillage practices on the soil water-holding capacity of a non-irrigated apple orchard in the Loess Plateau, China. Soil Tillage Res. 2013, 130, 7–12. [Google Scholar] [CrossRef]
- Huang, Y.; Wei, K.; Wang, L.Y.; Cheng, H.; He, W.; Zhou, J. A study on the changes in tenderness of tea tree new shoots and stems based on texture analyzer. Tea Sci. 2012, 32, 173–178. [Google Scholar]
- Chen, Q.J. The Effect of Red and Blue Light Quality on the Growth, Development, and Photosynthetic Characteristics of M9 Apple Rootstock Seedlings; Shandong Agricultural University: Tai’an, China, 2022. [Google Scholar]
- Yin, N.W.; Li, J.N.; Liu, X.; Lian, J.P.; Fu, C.; Li, W.; Jiang, J.Y.; Xve, Y.F.; Wang, J.; Chai, Y.R. The lignification response of rapeseed under high temperature and drought and its differences in stem and root. J. Crops 2017, 43, 1689–1695. [Google Scholar]
- Strasser, B.J. Donor side capacity of photosystem II probed by chlorophyll a fluorescence transients. Photosynth. Res. 1997, 52, 147–155. [Google Scholar] [CrossRef]
- Li, P.M.; Gao, H.Y.; Strasser Reto, J. Application of rapid chlorophyll fluorescence induction kinetics analysis in photosynthesis research. J. Plant Physiol. Mol. Biol. 2005, 559–566. [Google Scholar]
- Zhang, Z.L.; Zai, W.Q. Guide to Plant Physiology Experiments, 3rd ed.; Higher Education Press: Beijing, China, 2016. [Google Scholar]
- Sun, Y.J. The Response Mechanism of Grape Photosystem Ii and Photosynthetic Carbon Assimilation to High Temperature and Strong Light; Shandong Agricultural University: Tai’an, China, 2016. [Google Scholar]
- Guo, D.; Chen, F.; Inoue, K.; Blount, J.W.; Dixon, R.A. Downregulation of caffeic acid 3-O-methyltransferase and caffeoyl CoA 3-O-methyltransferase in transgenic alfalfa: Impacts on lignin structure and implications for the biosynthesis of G and S lignin. Plant Cell 2001, 13, 73–88. [Google Scholar] [CrossRef] [PubMed]
- Huntley, S.K.; Ellis, D.; Gilbert, M.; Chapple, C.; Mansfield, S.D. Significant increases in pulping efficiency in C4H-F5H-transformed poplars: Improved chemical savings and reduced environmental toxins. J. Agric. Food Chem. 2003, 51, 6178–6183. [Google Scholar] [CrossRef] [PubMed]
- Guo, Y.Y.; Xu, H.M.; Zhao, Y.Y.; Wu, H.Y.; Lin, J.X. Research progress on plant lignification process and its regulation. Chin. Sci. Life Sci. 2020, 50, 111–122. [Google Scholar]
- Jin, L.Q.; Che, X.K.; Zhang, Z.S.; Gao, H.Y. The relationship between the degree of injury on the donor and receptor sides of PSII in cucumber leaves under high temperature and strong light and the changes in rapid fluorescence parameter Wk. J. Plant Physiol. 2015, 51, 969–976. [Google Scholar]
- Xu, D.Q. Several issues in the study of plant light stress. Plant Physiol. Newsl. 2003, 493–495. [Google Scholar]
- Gerganova, M.; Popova, A.V.; Stanoeva, D.; Velitchkova, M. Tomato plants acclimate better to elevated temperature and high light than to treatment with each factor separately. Plant Physiol. Biochem. 2016, 104, 234–241. [Google Scholar] [CrossRef]
- Houborg, R.; Matthew, F.M.; Alessandro, C.; Anatoly, A.G. Leaf chlorophyll constraint on model simulated gross primary productivity in agricultural systems. Int. J. Appl. Earth Obs. Geoinf. 2015, 43, 160–176. [Google Scholar] [CrossRef]
- Liu, D.H.; Zhao, S.W.; Gao, R.F.; Zhang, Z.S.; Jiang, C.D.; Liu, Y.J. The response of plant photosynthesis to high temperature. Plant Res. 2002, 205–212. [Google Scholar]
- Wu, H.Y.; Shou, S.Y.; Zhu, Z.J.; Yang, X.T. The effects of high temperature stress on photosynthesis and chlorophyll fluores-cence in sweet pepper. J. Hortic. 2001, 517–521. [Google Scholar]
- Finkel, T. Signal transduction by reactive oxygen species. J. Cell Biol. 2011, 194, 7–15. [Google Scholar] [CrossRef]
- Huang, S.; Van Aken, O.; Schwarzländer, M.; Belt, K.; Millar, A.H. The Roles of Mitochondrial Reactive Oxygen Species in Cellular Signaling and Stress Response in Plants. Plant Physiol. 2016, 171, 1551–1559. [Google Scholar] [CrossRef] [PubMed]
- Pan, Y.Y.; Zhang, Y.; Shi, Y.; Li, S.; Li, X.F.; Hou, L.P. The effect of exogenous spermidine on the antioxidant system of tomato seedlings under osmotic salt stress. J. Northwest AF Univ. (Nat. Sci. Ed.) 2019, 47, 57–66. [Google Scholar]
- Zhu, H.; Bunn, H.F. Oxygen sensing and signaling: Impact on the regulation of physiologically important genes. Respir. Physiol. 1999, 115, 247. [Google Scholar] [CrossRef] [PubMed]
- Sun, J.; Jia, Y.X.; Guo, S.R. The effects of seawater stress on chloroplast reactive oxygen species and chlorophyll metabolism in spinach (Spinacia oleracea L.). J. Ecol. 2009, 29, 4361–4371. [Google Scholar]
- Zhang, Y.W.; Li, M.N.; Zhao, Y. The effect of rhizosphere high temperature on soluble protein and antioxidant enzyme activity in different tissues of alfalfa. West. For. Sci. 2019, 48, 66–71. [Google Scholar]
- Joshi, R.; Chinnusamy, V. Antioxidant Enzymes: Defense against High Temperature Stress. Oxidative Damage Plants 2014, 369–396. [Google Scholar]
- Feng, Y.L.; Jiang, S.M. Adaptation of Tomatoes to Leaf Water Stress Caused by High Root Temperature. J. Ecol. 2001, 747–751. [Google Scholar]
- Karlova, R.; Boer, D.; Hayes, S.; Testerink, C. Root plasticity under abiotic stress. Plant Physiol. 2021, 187, 1057–1070. [Google Scholar] [CrossRef]
- D E Lima, C.F.F.; Kleine-Vehn, J.; De Smet, I.; Feraru, E. Getting to the root of belowground high temperature re-sponses in plants. J. Exp. Bot. 2021, 72, 7404–7413. [Google Scholar]
- Escamilla-Treviño, L.L.; Shen, H.; Uppalapati, S.R.; Ray, T.; Tang, Y.; Hernandez, T.; Yin, Y.; Xu, Y.; Dixon, R.A. Switchgrass (Panicum virgatum) possesses a divergent family of cinnamoyl CoA reductases with distinct biochemical properties. New Phytol. 2010, 185, 143–155. [Google Scholar] [CrossRef] [PubMed]
- Weng, J.K.; Mo, H.; Chapple, C. Over-expression of F5H in COMT-deficient Arabidopsis leads to enrichment of an unu-sual lignin and disruption of pollen wall formation. Plant J. 2010, 64, 898–911. [Google Scholar] [CrossRef] [PubMed]
- Lynch, J.P. Root phenes that reduce the metabolic costs of soil exploration: Opportunities for 21st century agricul-ture. Plant Cell Environ. 2015, 38, 1775–1784. [Google Scholar] [CrossRef] [PubMed]
- Wang, S.S.; Du, G.D.; Lv, D.G. The effect of soil high-temperature treatment on the respiration metabolism and plant development of continuous cropping strawberry roots. J. Fruit Trees 2011, 28, 234–239. [Google Scholar]
- Xie, J.J. The Alternate Respiratory Pathway Maintains the Operation of Psii by Regulating Antioxidant Defense Levels under Environmental Stress; Northwest Normal University: Lanzhou, China, 2018. [Google Scholar]
- Chen, L.Z.; Zhang, X.B.; Yang, X.F. The effect of rhizosphere high temperature on the growth and photosynthetic physiology of Chinese cabbage. North. Hortic. 2020, 50–55. [Google Scholar]
- Du, Y.C.; Tachibana, S. Effect of supraoptimal root temperature on the growth, root respiration and sugar content of cucumber plants. Sci. Hortic. 1994, 58, 289–301. [Google Scholar] [CrossRef]
Disclaimer/Publisher’s Note: The statements, opinions and data contained in all publications are solely those of the individual author(s) and contributor(s) and not of MDPI and/or the editor(s). MDPI and/or the editor(s) disclaim responsibility for any injury to people or property resulting from any ideas, methods, instructions or products referred to in the content. |
© 2024 by the authors. Licensee MDPI, Basel, Switzerland. This article is an open access article distributed under the terms and conditions of the Creative Commons Attribution (CC BY) license (https://creativecommons.org/licenses/by/4.0/).