Article

Molecular Mechanisms of the Effects of Sodium Selenite on the Growth, Nutritional Quality, and Species of Organic Selenium in Dandelions

1
School of Modern Industry for Selenium Science and Engineering, Wuhan Polytechnic University, Wuhan 430048, China
2
Enshi Se-Run Material Engineering Technology Co., Ltd., Enshi 445000, China
*
Author to whom correspondence should be addressed.
Horticulturae 2024, 10(3), 209; https://doi.org/10.3390/horticulturae10030209
Submission received: 3 January 2024 / Revised: 18 February 2024 / Accepted: 20 February 2024 / Published: 22 February 2024

Abstract

:
Selenium (Se) is an essential trace element for the human body, and its dietary deficiency has been a widespread issue globally. Vegetables serve as a significant source of dietary Se intake, with organic Se derived from plants being safer than inorganic Se. In the present study, Taraxacum mongolicum plants were treated with various concentrations of Na2SeO3. The results showed that as the concentration of Na2SeO3 increased, the chlorophyll content of dandelion seedlings decreased at high concentrations, and the content of soluble sugars, soluble proteins, flavonoids, total phenols, and Vc all increased. The application of Na2SeO3 at concentrations ranging from 0 to 4 mg/L resulted in a reduction in plant malondialdehyde content and an enhancement in the activity of antioxidant enzymes. Following the Na2SeO3 treatment, five Se species were identified in the seedlings, Se4+, Se6+, selenocysteine, selenomethionine, and methylselenocysteine. Notably, selenomethionine emerged as the primary organic Se species in the shoots of dandelion. Transcriptome analysis revealed that ABC11b, PTR4, MOCOS, BAK1, and CNGC1 were involved in the absorption, transport, and storage of Se in dandelion, and C7317 was involved in the scavenging of reactive oxygen species. This study complements the understanding of the possible molecular mechanisms involved in the absorption and transformation of organic Se by plants, thereby providing a theoretical foundation for the biofortification of dandelion with Se in crops.

1. Introduction

Selenium (Se), a nonmetallic trace element belonging to the same group as sulfur (S) and sharing similar chemical properties, plays a crucial role in the antioxidant systems of mammals, essential for both animals and humans. Over 25 Se proteins have been identified in mammals, distributed across various tissues and cells, and they play a pivotal role in redox metabolism [1]. The World Health Organization recommends a daily intake of 55 μg/day of Se for healthy adults [2]. Se deficiency can lead to diseases such as Kashin–Beck disease, rheumatoid arthritis, and osteoporosis through oxidative stress and immune responses and may also affect the phenotype of gut microbiota, leading to thyroid dysfunction and cardiovascular disease [3,4]. The intake range of Se was very narrow, and excessive intake of Se can lead to endocrine disorders, hair loss, and anemia [5]. However, research has indicated that Se yeast can safely provide up to 800 µg/day without causing adverse effects on the human body. Organic Se is generally considered safer than inorganic forms [6]. Furthermore, the bioavailability of Se was significantly influenced by its chemical species. Specifically, the bioavailability of selenomethionine (SeMet), selenocysteine (SeCys), selenate, and selenite exhibited a gradual decrease in that order [7,8]. Vegetable crops are the main source of dietary Se intake for the human body, so planting Se-rich crops is of great significance for supplementing Se to the human body [9]. Se is mainly utilized by plants in the form of inorganic salts, such as selenite (SeIV) and selenate (SeVI), which are absorbed within the plant through sulfate transporters, and selenite enters the plant through active transport mediated by phosphate transporters [10,11]. Earlier studies in mustard showed that PHO1-H8 promoted the absorption of Na2SeO3 by mustard roots, while SULTR 3;3 and SULTR 4;1 promoted the transport of Se from the roots to shoots and chloroplasts. Further, Se in mustard was transformed into SeMet, SeCys, MeSeCys, and selenoprotein by the action of APS, APR, SEP1, and other genes and stored in plant leaves [12]. Plants possess the remarkable ability to convert inorganic Se into organic forms, which is crucial for the activity of the human immune and reproductive system, thyroid gland, and intracellular enzymes. Currently, Se biofortification in plants has been established as a pioneering method for producing Se-rich agricultural products [13].
T. mongolicum, a perennial herb belonging to the Compositae family, is renowned for its abundance of vitamins and minerals, as well as its heat-clearing, detoxifying, blood-activating, and blood-stasis-removing effects [14]. Key active constituents of T. mongolicum encompass flavonoids, sesquiterpenes, phenolic compounds, and coumarins [15]. Native to North America, Europe, and Asia, it thrives primarily in hillside grasslands of mid- to low-altitude regions. In China, it is widely cultivated as a wild relative vegetable and is highly prized by consumers [16]. Furthermore, dandelion polysaccharide, extracted from T. mongolicum, exhibits potent antitumor activity, and its absorption and transformation of inorganic Se differ significantly from that observed in mustard [17].
In the present study, seedlings of T. mongolicum were subjected to various concentrations of Na2SeO3. The impact of Na2SeO3 on dandelion growth was assessed by examining physiological indices and growth patterns. Furthermore, the mechanism underlying the absorption and transformation of Se in dandelion was elucidated by monitoring alterations in physiological markers and key nutritional components, along with a correlation analysis between transcriptome data and Se species. This comprehensive analysis revealed the intricate process of how dandelions convert Na2SeO3 into organic selenium, providing valuable insights for future research on Se biofortification in this plant species.

2. Materials and Methods

2.1. Plant Material Treatment

The dandelion employed in the experiment originated from Hebei, while Na2SeO3 served as the exogenous Se source for the preparation of the hydroponic nutrient solution. This Na2SeO3 was purchased from Hubei Jingcheng Chemical Co., Ltd. (Wuhan, China). Dandelion was placed in a tissue culture room maintained at a temperature of 22 °C and a relative humidity of 70%. It was cultured under controlled lighting conditions, receiving 14 h of illumination and 10 h of darkness, with a light intensity ranging from 300 to 380 μmol·(m−2·s−1).
The experiment commenced on 18 May 2023, adhering to the cultivation protocol outlined by Islam’s method for dandelion growth [18]. The dandelion seeds were evenly spread on the surface of the seedling tray gauze, and after ten days, the seedlings were moved to a hydroponic pot containing 5 L of 1/8 Hoglan nutrient solution. Five days later, the dandelion was cultured in 1/4 Hoagland nutrient solution. Five days later, the same growing dandelions were transferred to culture media treated with different concentrations of Na2SeO3 (0 mg/L, 2 mg/L, 4 mg/L, 8 mg/L, and 12 mg/L), with three pots for each treatment and 24 plants per pot (Figure S1). Dandelion seedlings with different treatments were harvested after 15 days of cultivation. After the dandelion was harvested, it was rinsed three times with ultrapure water to remove surface moisture. After that, it was divided into two parts: one part was used for physiological indicator determination, and the other part was used for subsequent transcriptome and metabolome determination (Table S1).

2.2. Determination of Growth Indicators

Ten dandelions with relatively consistent growth were selected for each treatment to measure their biomass and aboveground and underground length, and the average values were obtained as the average height (cm) and root length (cm) of dandelions under the same treatment concentration.
The determination of photosynthetic pigments was based on the method described by Lichtenthaler [19]. Chlorophyll and carotenoids were extracted with 95% ethanol, and OD470, OD649, and OD665 were measured using a UV spectrophotometer. Based on the recorded values, the photosynthetic pigments were calculated as Ca = 13.95A665−6.88A649, Cb = 24.96A649−7.32A665, Cx·c = (1000A470−2.05Ca−114.8Cb)/245, and Pc = (C × V × N)/(W × 1000). Ca, Cb, and Cx·c, respectively, represent the concentrations of chlorophyll a, chlorophyll b, and carotenoids (mg/L). A665, A649, and A470 represented the absorbance of the photosynthetic pigment extract at wavelengths of 665 nm, 649 nm, and 470 nm, respectively. C represented the concentration of photosynthetic pigments (mg/L), V was the volume of the extraction solution (mL), N was the dilution factor, and W was the fresh weight of the sample (g). The content of soluble sugars, soluble proteins, and anthocyanins was determined using the test kits (AKPL008M, AKPR015, AKPL021M) from Beijing Box Biotechnology Technology Co., Ltd. The content of flavonoids, total polyphenols, and vitamin C (Vc) was determined using the test kits (A142-1-1, A143-1-1, A009-1-1) from Nanjing Jiancheng Biotechnology Research Institute.

2.3. Determination of Antioxidant Indicators

The malondialdehyde (MDA) content, catalase (CAT) activity, and glutathione (GSH) activity were measured using the reagent kits (AKFA013M, AKAO003-2M, AKPR008M) from Beijing Box Biotechnology Technology Co., Ltd. The superoxide dismutase (SOD) and peroxidase (POD) activities were measured using the reagent kits (A001-2-2, A084-3-1) from Nanjing Jiancheng Biotechnology Research Institute. The calculation formula of MDA content (nmol/g) was CMDA = 6.45 × (A532 − A600) − 0.56 × A450, C was the concentration of MDA in the solution to be tested, and A532, A600, and A450 were the absorbance values of the solution to be tested at 532 nm, 600 nm, and 450 nm, respectively. The SOD activity unit was 50% of the inhibition of nitro-blue tetrazolium photochemical reduction as one enzyme activity unit (U). POD activity was calculated as one unit (U) of 0.01 change in A470 per minute. CAT activity decreased by 0.1 per minute at A240 as one enzyme activity unit (U). GSH standard solution (10 μg/mL) was used to make the standard curve, and the content of GSH was calculated according to the formula Y = 0.067 × A412 − 0.0005, R2 = 0.9943, where A412 was the absorbance value measured by the spectrophotometer at 412 nm after 20 min of sample reaction.

2.4. Determination of Total Se and Se Species

The total Se content in dandelions was determined by atomic fluorescence spectroscopy, with slight modifications referring to Matos-Reyes’s method [20]. A sample of 0.2 g was placed in a digestion tube, with 7 mL of HNO3 added and digested in a digestion apparatus. After digestion, the sample was placed in an acid-driving instrument at 120–140 °C to drive until the sample was about the size of a mung bean. The sample in the digestion tube was poured into a centrifuge tube and diluted to 10 mL with 10% HCl for testing. The calculation of total Se content in dandelions was displayed as K1 = (C × V × N)/(W × 1000), where C was the total Se mass concentration (μg/L), V was the total volume of the digestion solution to be tested (mL), N was the dilution factor, and W was the dry weight of the sample (g).
The content of five Se species in dandelion was determined by ICP-MS, with slight modifications referring to the method of Goenaga Infant [21]. Five Se standard compounds (SeCys2, SeMet, MeSeCys, Se4+, and Se6+) were purchased from the Chinese Academy of Metrology for drawing standard curves. A total of 0.1 g of the sample used for extracting Se species was hydrolyzed with protease K and protease E. The sample was sonicated at 37 °C for one hour and centrifuged at 10,000 rpm for 20 min. The supernatant was subjected to 0.22 μm filter membrane filtration. The calculation of Se species content in dandelions was displayed as K2 = (C × V × N)/(W × 1000), where C was the mass concentration of Se form (μg/L), V was the total volume of the digestion solution to be tested (mL), N was the dilution factor, and W was the dry weight of the sample (g).
Each of the above treatments included 3 biological replicates and 2 technical replicates.

2.5. Transcriptome Sequencing and Data Analysis

Total amounts and integrity of RNA were assessed using the RNA Nano 6000 Assay Kit of the Bioanalyzer 2100 system (Agilent Technologies, Santa Clara, CA, USA). (Refer to RNA quality inspection report for specific instruments).
After the library was qualified, the different libraries were pooled according to the effective concentration and the target amount of data off the machine, then sequenced by the Illumina NovaSeq 6000. The end reading of 150 bp pairing was generated. The basic principle of sequencing was to synthesize and sequence at the same time (Sequencing by Synthesis). Four fluorescently labeled dNTP, DNA polymerase, and splice primers were added to the sequenced flow cell and amplified. During the extension of the complementary chain within the sequence cluster, each fluorescently labeled dNTP emits its corresponding fluorescence. The sequencer captured these fluorescence signals and converted them into sequencing peaks via computer software. This process allowed for the sequence information from the target fragment to be analyzed.
Raw data (raw reads) in the Fastq format were first processed through in-house Perl scripts. At the same time, the Q20, Q30, and GC content of the clean data were calculated. All the downstream analyses were based on clean data with high quality.
After the clean reads were obtained, the Trinity software (v2.6.6) was used to assemble the clean reads for the reference sequence obtained after the continued analysis [22]. The gene alignment was calculated using feature counts, and then the FPKM value of each gene was calculated based on its length. Differential expression analysis of two conditions/groups (two biological replicates per condition) was performed using the DESeq2 R package (1.20.0). The resulting p-values were adjusted using Benjamini and Hochberg’s approach for controlling the false discovery rate. padj < 0.05 and |log2(foldchange)| > 1 was set as the threshold for significantly differential expression.
GOseq (1.10.0) and KOBAS (v2.0.12) software were used for GO function enrichment analysis and KEGG pathway enrichment analysis of differential gene sets. Enrichment analysis was based on the hypergeometric distribution principle. The differential gene sets referred to the gene set derived from significant difference analysis, which was then annotated to either the GO or KEGG database. Additionally, the background gene sets encompassed all genes analyzed with significant differences and annotated to the respective databases. The outcome of the enrichment analysis encompassed the enrichment of all differential gene sets, specifically the upregulated and downregulated differential gene sets, within each differential comparison combination.
Weighted gene co-expression network analysis (WGCNA) was performed utilizing the Metware online cloud platform (https://cloud.metware.cn/#/tools/tool-lis, accessed on 4 November 2023) to identify key regulatory genes involved in the selenoamino acid biosynthesis pathway in response to Na2SeO3 treatment. Pearson correlation analysis was conducted between the characteristic genes of each identified module and the abundance of Se species, leveraging the R package ggplot2 for visualization and statistical analysis.

2.6. Statistical Analysis

Excel 2021 (Microsoft, Raymond, WA, USA) and SPSS v24.0 (IBM, Armonk, NY, USA) were used for all data processing and analysis. Duncan’s test was used to compare data between treatment groups, with p < 0.05 indicating statistical significance. Three biological replicates were measured for each group of processed data. OmicStudio (https://www.omicstudio.cn/tool, accessed on 8 November 2023) was used for correlation analysis, with positive and negative correlation thresholds set at ≥0.5 and ≤−0.5, respectively (p < 0.05).

3. Results

3.1. The Effect of Na2SeO3 Hydroponics on the Height and Biomass of Dandelion

The biomass of seedlings treated with 2–12 mg/L Na2SeO3 decreased by 45.10%, 72.04%, 77.92%, and 87.29% compared to the control group, respectively (Figure 1a,b). Compared with the control group, the plant height decreased by 24.26%, 28.60%, 38.26%, and 44.77%, and the root length decreased by 32.01%, 40.20%, 42.10%, and 47.56%, respectively (Figure 1a,c).

3.2. The Effect of Na2SeO3 on the Total Se and Se Species Content of Dandelion

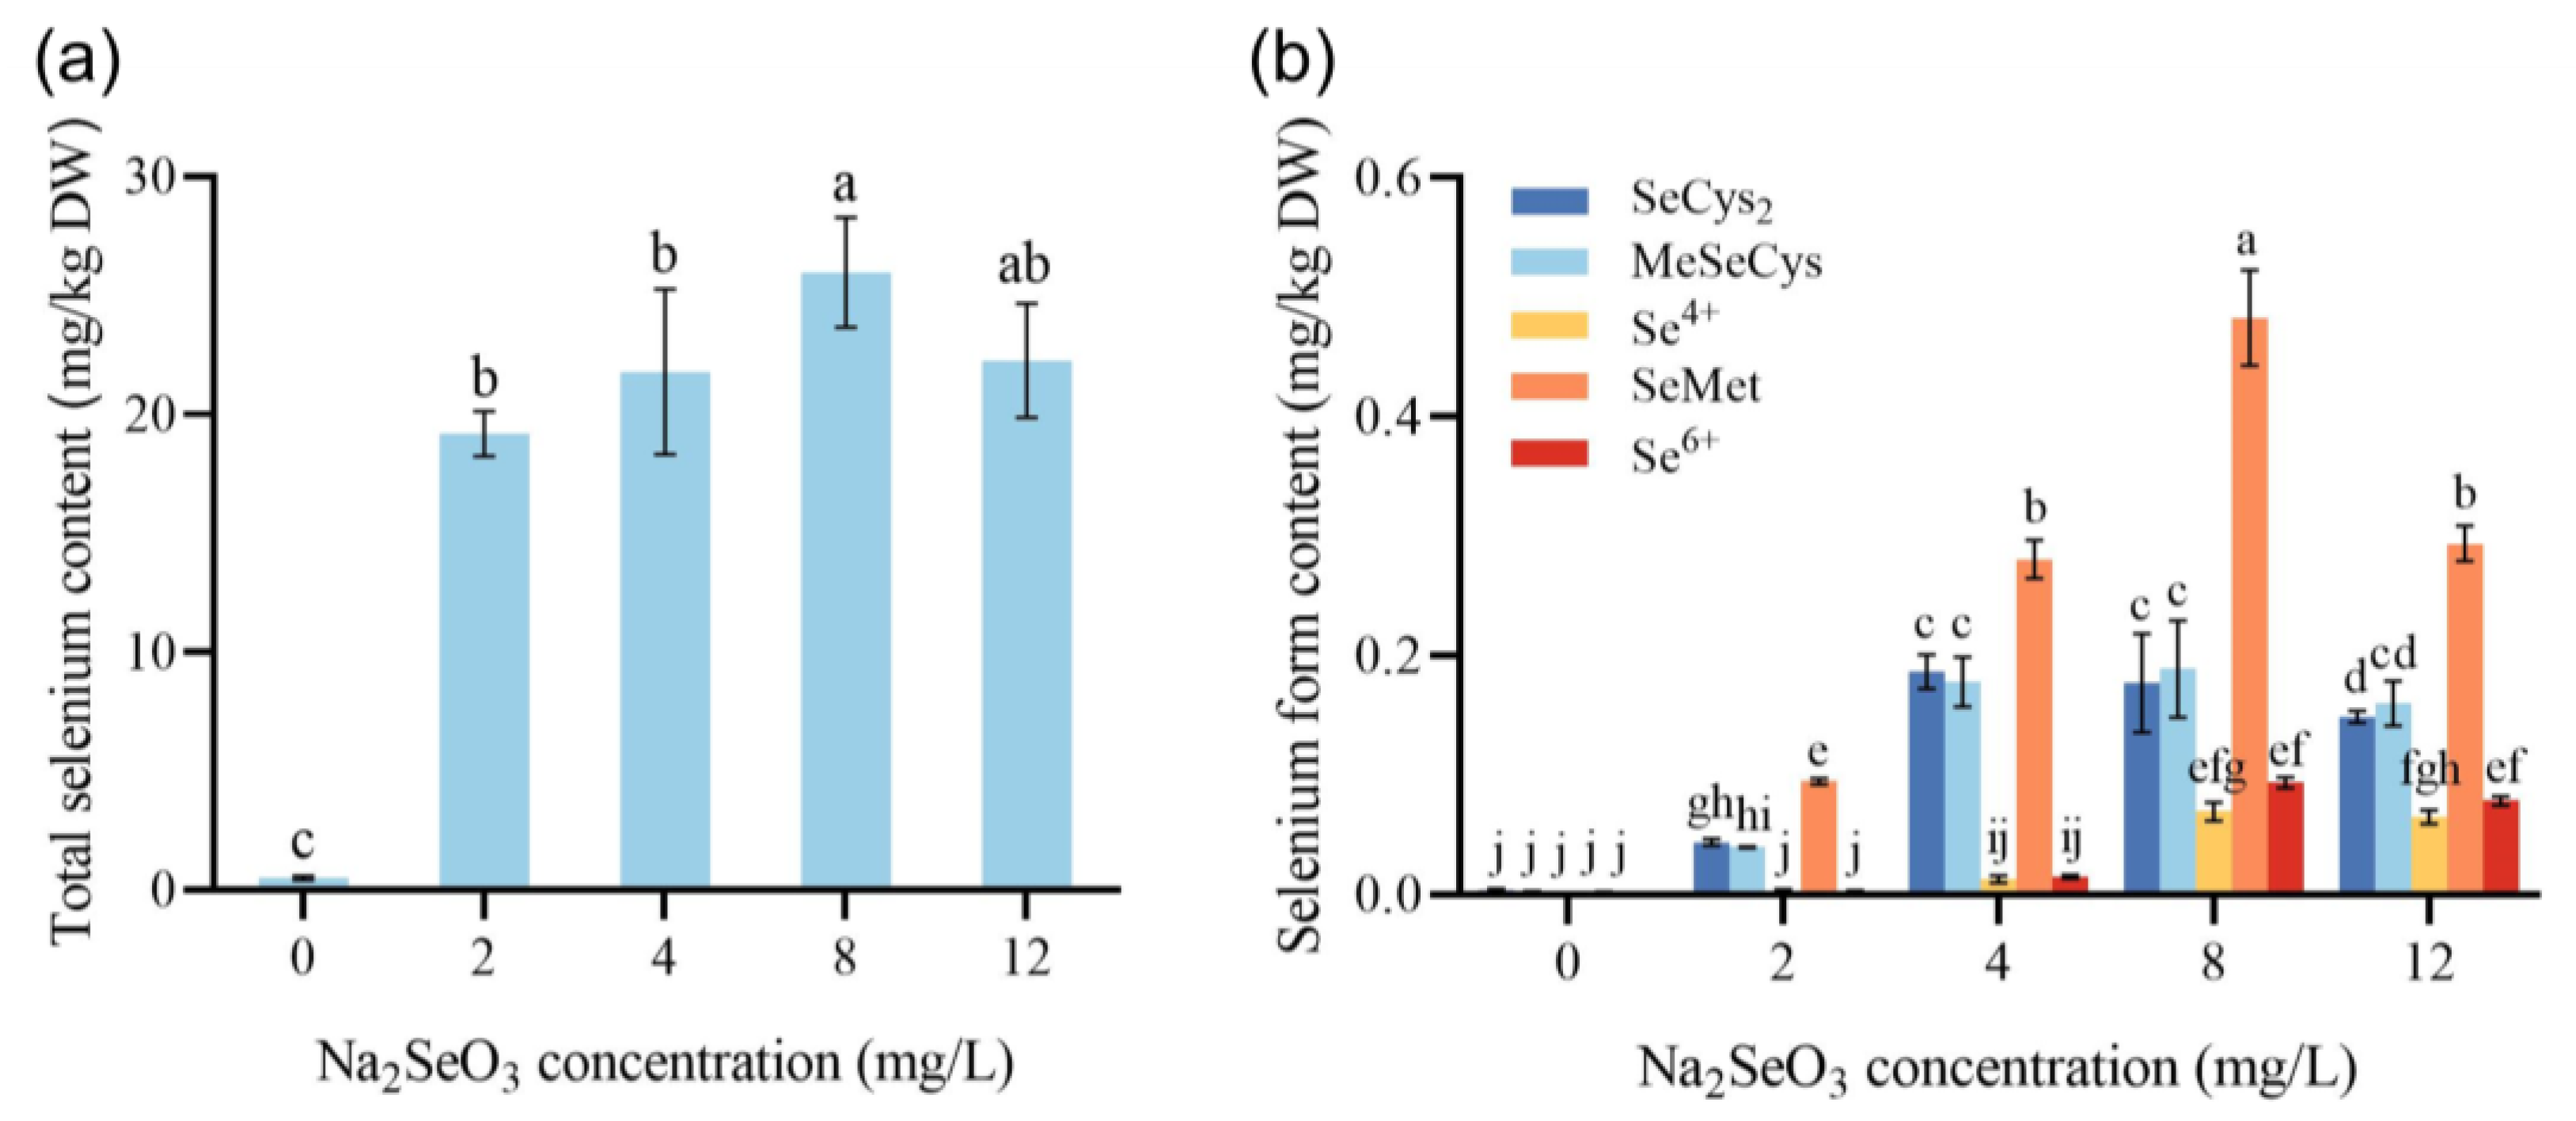
The highest total Se content was observed in the treatment group receiving a concentration of 8 mg/L Na2SeO3, reaching a value of 25.97 mg/kg. The total Se content after treatment with 2 mg/L, 4 mg/L, and 12 mg/L Na2SeO3 was 19.19 mg/kg, 21.78 mg/kg, and 22.27 mg/kg, respectively (Figure 2a).
Among all treatments, the highest content of five Se species was observed in the 8 mg/L Na2SeO3 treatment, with the highest proportion of selenomethionine (SeMet) content at 0.4827 mg/kg. The content of selenocysteine (SeCys2), methylselenocysteine (MeSeCys), Se (IV), and Se (VI) in the other four Se species is 0.1771 mg/kg, 0.1888 mg/kg, 0.0695 mg/kg, and 0.0937 mg/kg, respectively. After treatment with 2 mg/L Na2SeO3, the contents of SeCys2, MeSeCys, Se (IV), SeMet, and Se (VI) were 0.23%, 0.21%, 0.01%, 0.49%, and 0.01%, respectively. When treated with 4 mg/L Na2SeO3, the proportions of Se speciation were 0.86%, 0.82%, 0.06%, 1.29%, and 0.06%, respectively, while with 8 mg/L, the proportions were 0.68%, 0. 73%, 0. 27%, 1.86%, and 0.36%, respectively. When treated with 12 mg/L Na2SeO3, the proportions of Se speciation were 0.67%, 0.72%, 0.29%, 1.32%, and 0.35%, respectively (Table 1 and Figure 2b).

3.3. Effect of Na2SeO3 Treatment on Chlorophyll Content of Dandelion

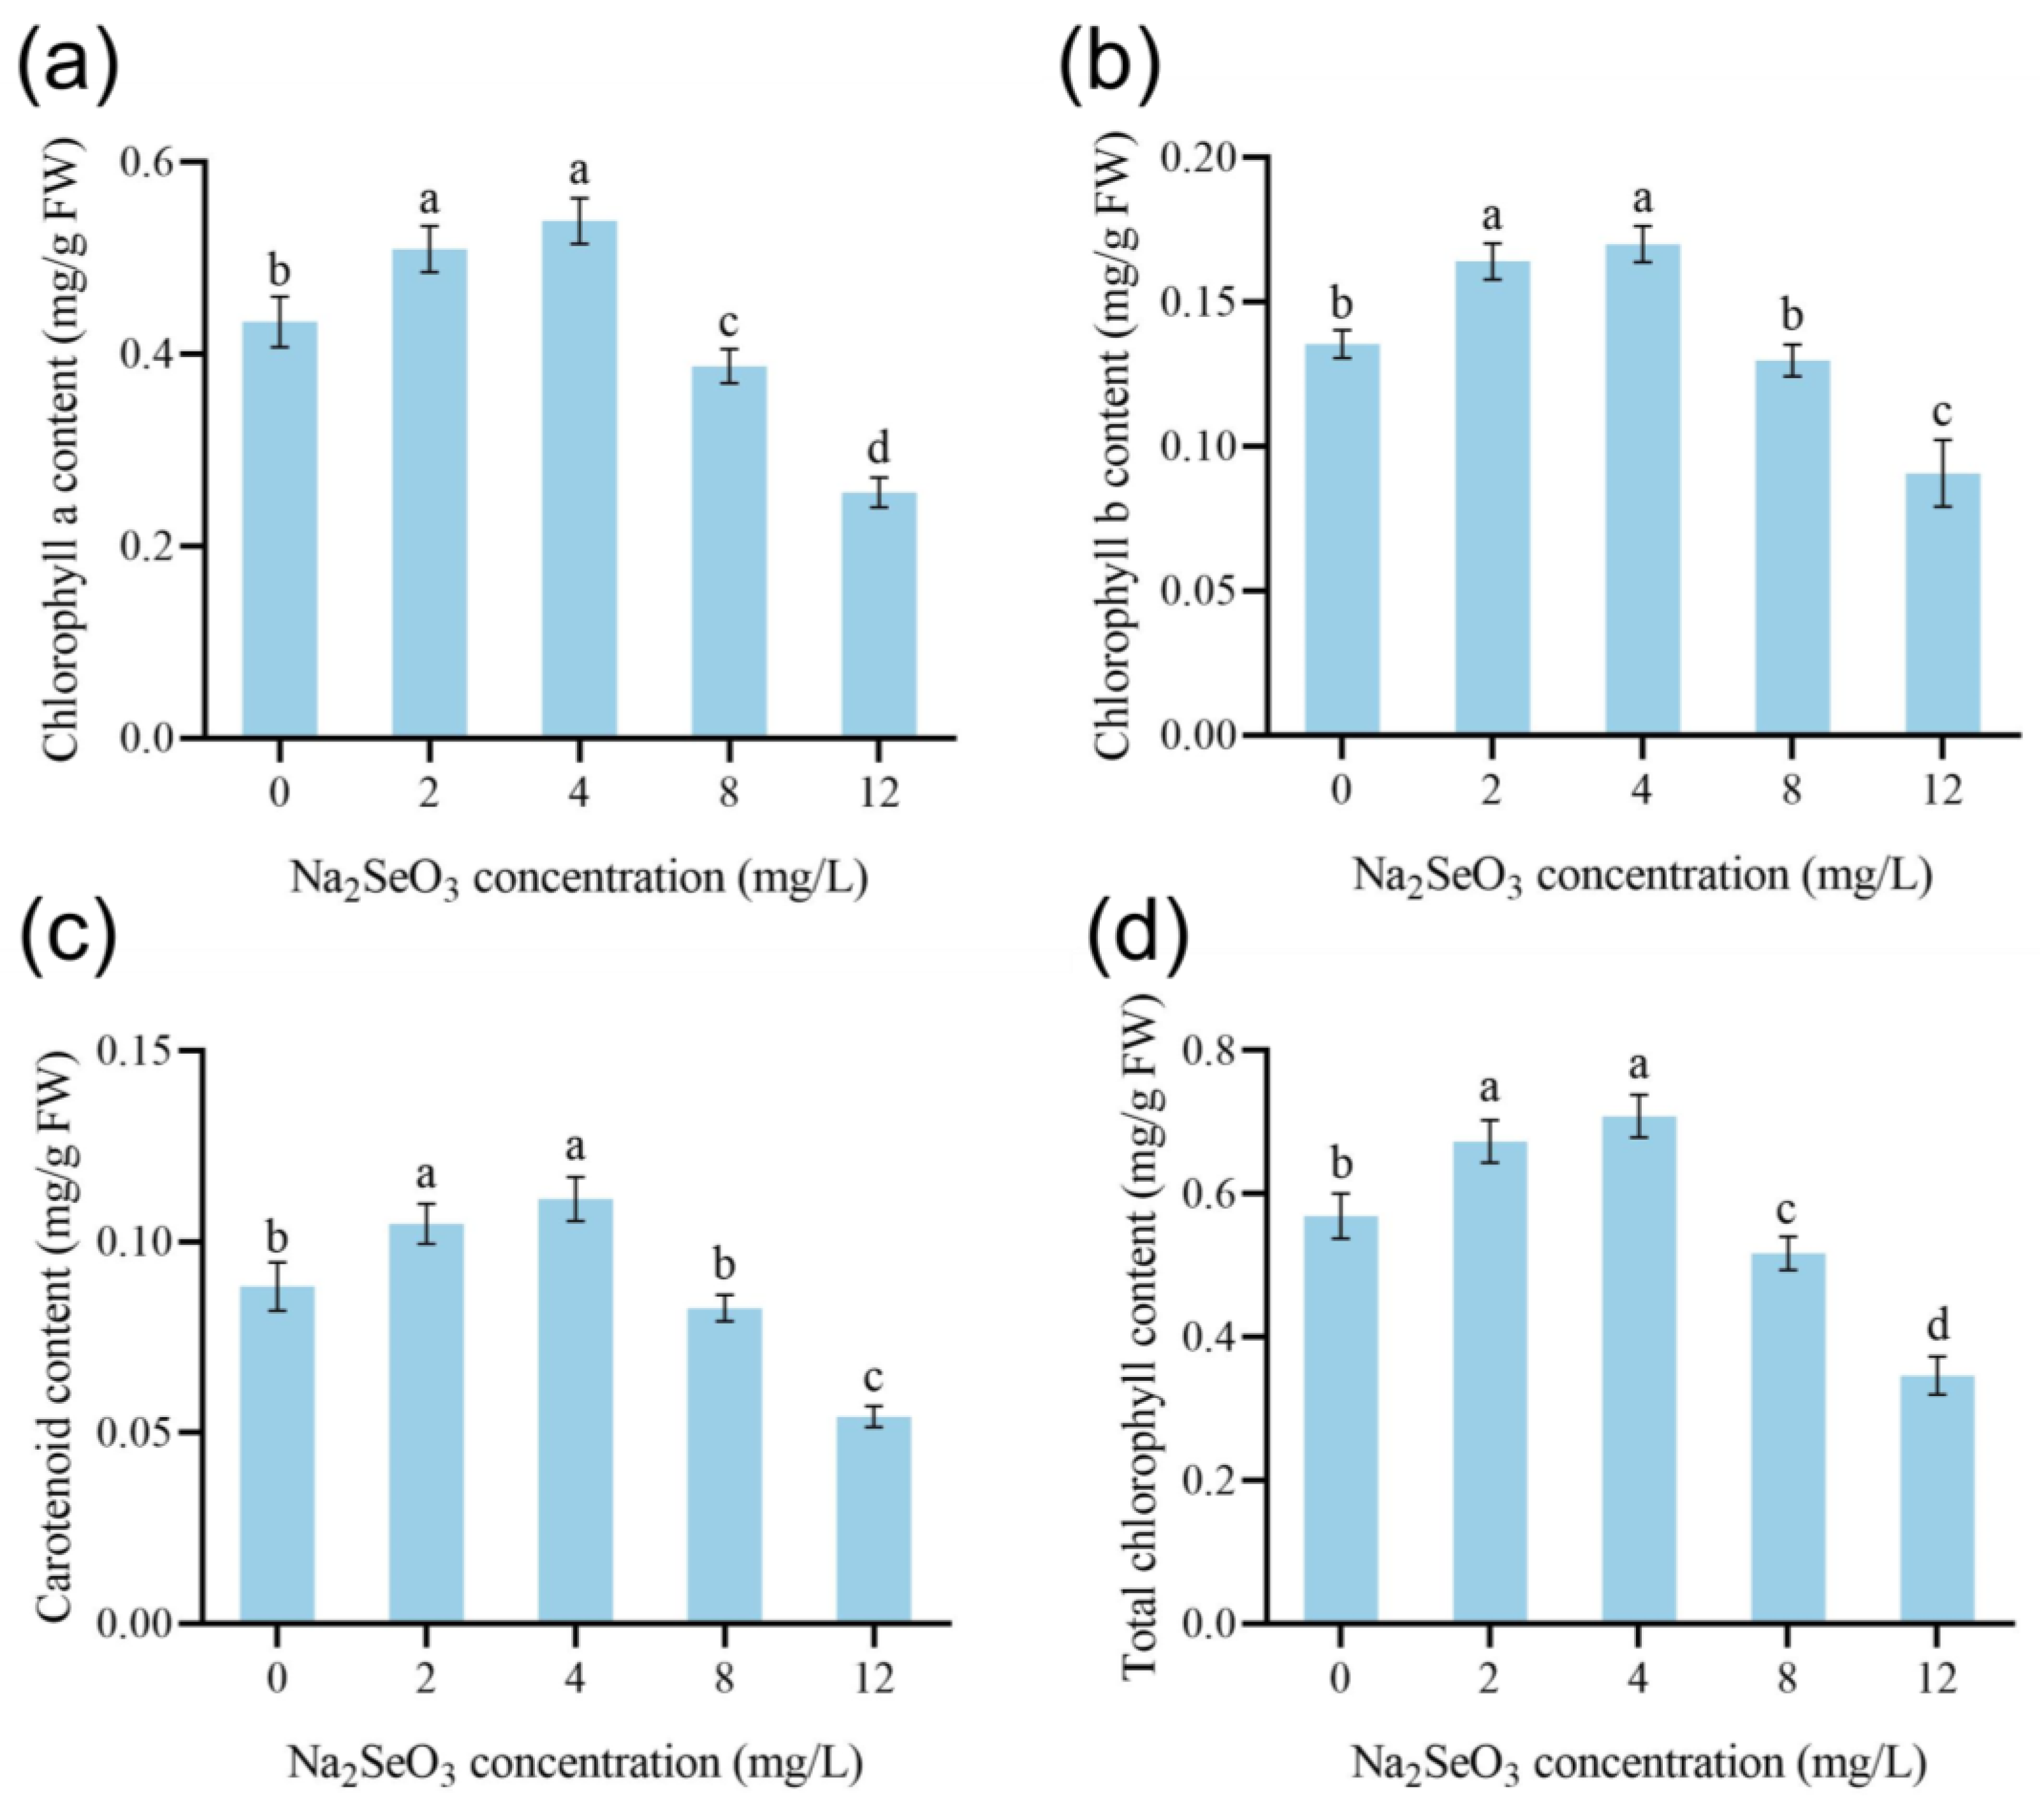
Upon treatment with 2 mg/L and 4 mg/L of Na2SeO3, the chlorophyll a content in dandelion increased by 17.44% and 24.22%, respectively, compared to the control group. However, at higher concentrations of 8 mg/L and 12 mg/L, the chlorophyll a content decreased by 10.65% and 41%, respectively (Figure 3a). Similarly, the chlorophyll b content in dandelion increased by 21.14% and 25.52% after treatment with 2 mg/L and 4 mg/L Na2SeO3, respectively. However, at 8 mg/L and 12 mg/L concentrations, the chlorophyll b content decreased by 4.18% and 33.06%, respectively (Figure 3b). Regarding carotenoid content, dandelion treated with 2 mg/L and 4 mg/L Na2SeO3 exhibited increases of 18.61% and 25.97%, respectively. However, at 8 mg/L and 12 mg/L concentrations, the carotenoid content decreased by 6.42% and 38.66%, respectively (Figure 3c). After treatment with 2 mg/L and 4 mg/L Na2SeO3, the total chlorophyll content in dandelion increased by 18.32% and 24.53%, respectively. After treatment with 8 mg/L and 12 mg/L, the total chlorophyll content decreased by 9.11% and 39.11%, respectively (Figure 3d).

3.4. The Effect of Na2SeO3 Treatment on the Nutritional Quality of Dandelion

Compared to the control, the soluble sugar content of dandelion exhibited a slight decrease of 3.18% upon treatment with 2 mg/L Na2SeO3. However, following exposure to 4 mg/L Na2SeO3, it increased by 96.80%. Notably, the sugar content increased by 2.18-fold and 2.33-fold upon treatment with 8 mg/L and 12 mg/L Na2SeO3, respectively (Figure 4a). The soluble protein content increased by 1.27%, 93.89%, and 76.85% after treatment with 2 mg/L, 4 mg/L, and 8 mg/L Na2SeO3, respectively. The highest increase in soluble protein content was observed after treatment with 12 mg/L Na2SeO3, which increased by 1.07 times compared to the control (Figure 4b). The anthocyanin content of dandelion decreased by 27.72% and 32.67% after treatment with 2 mg/L and 12 mg/L Na2SeO3, respectively, while the anthocyanin content increased by 5.94% and 9.90% after treatment with 4 mg/L and 8 mg/L Na2SeO3, respectively (Figure 4c). After treatment with 2 mg/L to 12 mg/L Na2SeO3, the flavonoid content increased by 0.5 times, 3.59 times, 5.53 times, and 9.82 times, respectively (Figure 4d). After treatment with 2 mg/L to 12 mg/L Na2SeO3, the Vc content increased by 53.46%, 85.16%, 91.67%, and 94.92%, respectively (Figure 4e). Compared with the control group, the total phenolic content of dandelion increased by 0.29 times, 2.08 times, 2.52 times, and 3.38 times after treatment with 2 mg/L to 12 mg/L Na2SeO3 (Figure 4f).

3.5. The Effect of Na2SeO3 Treatment on the MDA Content of Dandelion

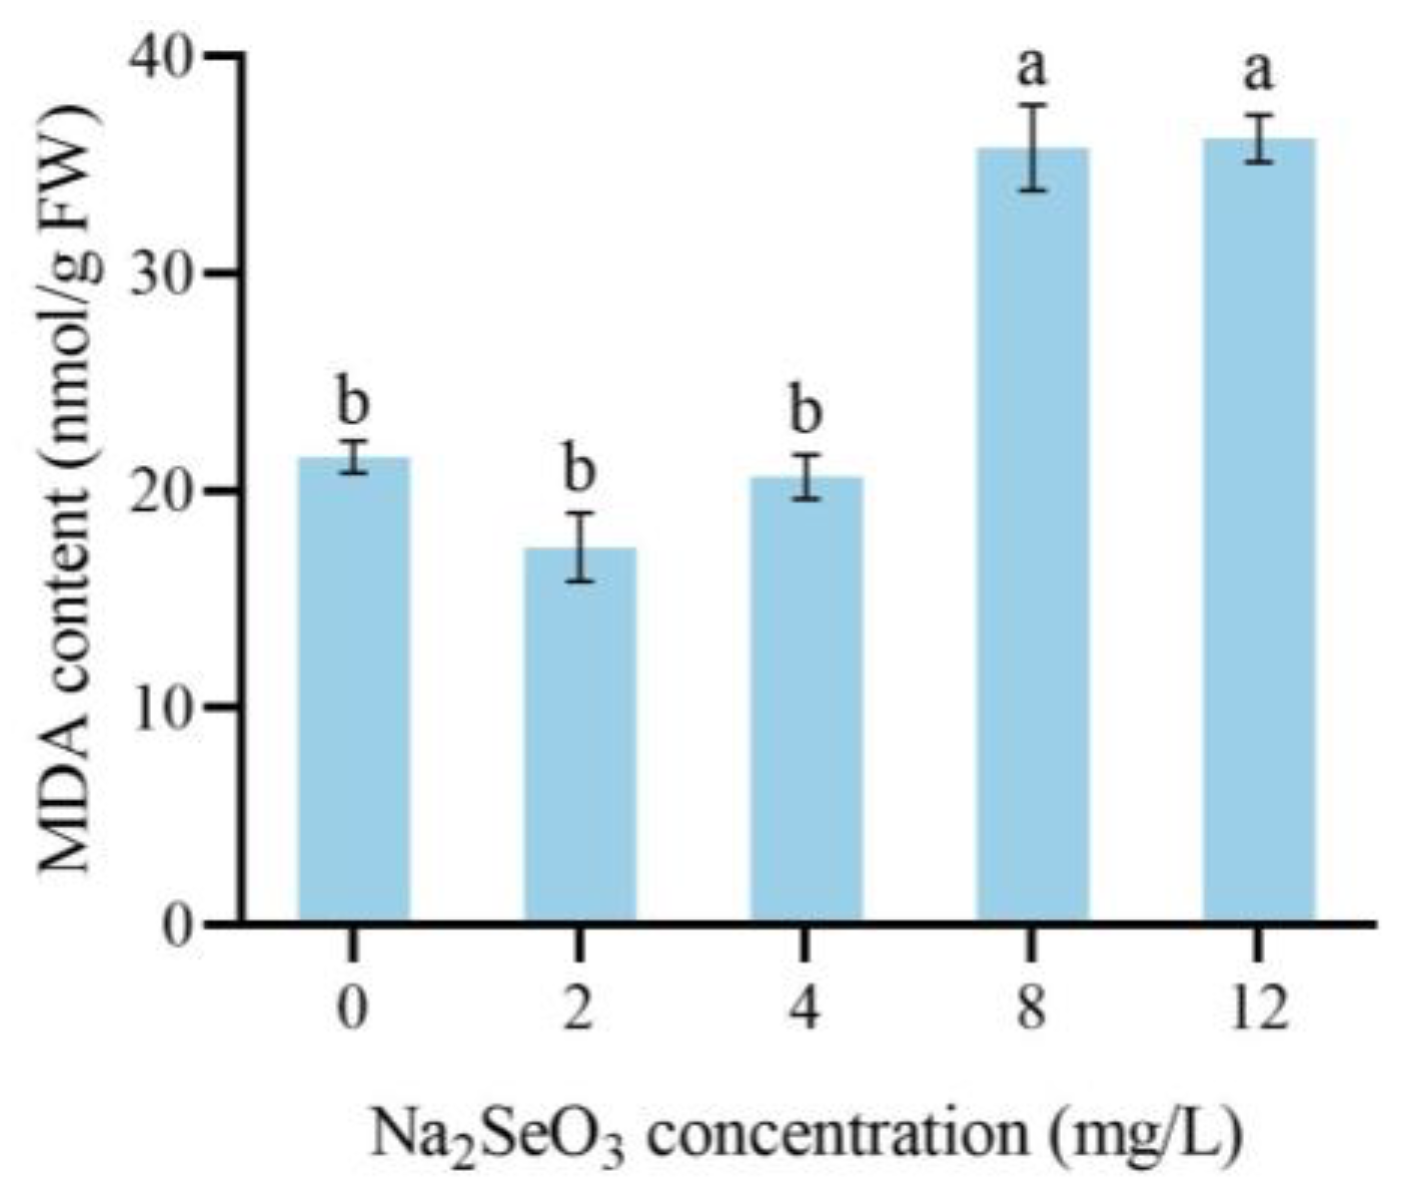
After exposure to 2 mg/L and 4 mg/L of Na2SeO3, the MDA content decreased by 19.27% and 4.21%, respectively. However, following treatment with 8 mg/L and 12 mg/L of Na2SeO3, the MDA content increased significantly by 66.04% and 68%, respectively (Figure 5).

3.6. The Effect of Na2SeO3 Treatment on the Stress Resistance of Dandelion

Na2SeO3 treatment can enhance the antioxidant enzyme system activity of dandelion. After treatment with 4 mg/L and 12 mg/L Na2SeO3, the GSH content of dandelion decreased by 15.59% and 6.76%, respectively. However, after treatment with 2 mg/L and 8 mg/L Na2SeO3, the GSH content increased but was not significant (Figure 6a). Following treatment with concentrations of Na2SeO3 ranging from 2mg/L to 12mg/L, the SOD activity of dandelion exhibited a significant elevation, increasing by 4.45-fold, 3.74-fold, 4.12-fold, and 3.11-fold, respectively (Figure 6b). Upon treatment with concentrations of Na2SeO3 ranging from 2 mg/L to 12 mg/L, the POD activity of dandelion exhibited an initial increase followed by a decrease. Overall, the POD activity was higher than the control group, with a specific increase of 39.10%, 62.28%, 77.51%, and 37.72%, respectively. Among them, the POD activity increased most significantly at a concentration of 8 mg/L Na2SeO3 (Figure 6c). After treatment with different concentrations of Na2SeO3, the CAT activity of dandelion did not significantly increase or decrease (Figure 6d).

3.7. Transcriptome Data Analysis of Dandelion Treated with Na2SeO3

The transcriptome data of dandelion with different treatments showed that the proportion of bases with a filtered mass of no less than 20 (Q20) ranged from 97% to 98%, and the proportion of bases with a filtered mass of no less than 30 (Q30) ranged from 92% to 93%. The sequencing error rates of the filtered data are all below 0.03%, with GC accounting for 44–45%. The Pearson correlation coefficient obtained from the sequencing of three biological repeated samples is above 0.8, and the correlation coefficients between repeated samples are higher than those between nonrepeated samples, indicating that the dandelion sample in this experiment has good repeatability (Figure S2). The overall quality of the sequencing data is good and can be used for further analysis (Table S2).

3.8. Analysis of Differentially Expressed Genes (DEGs)

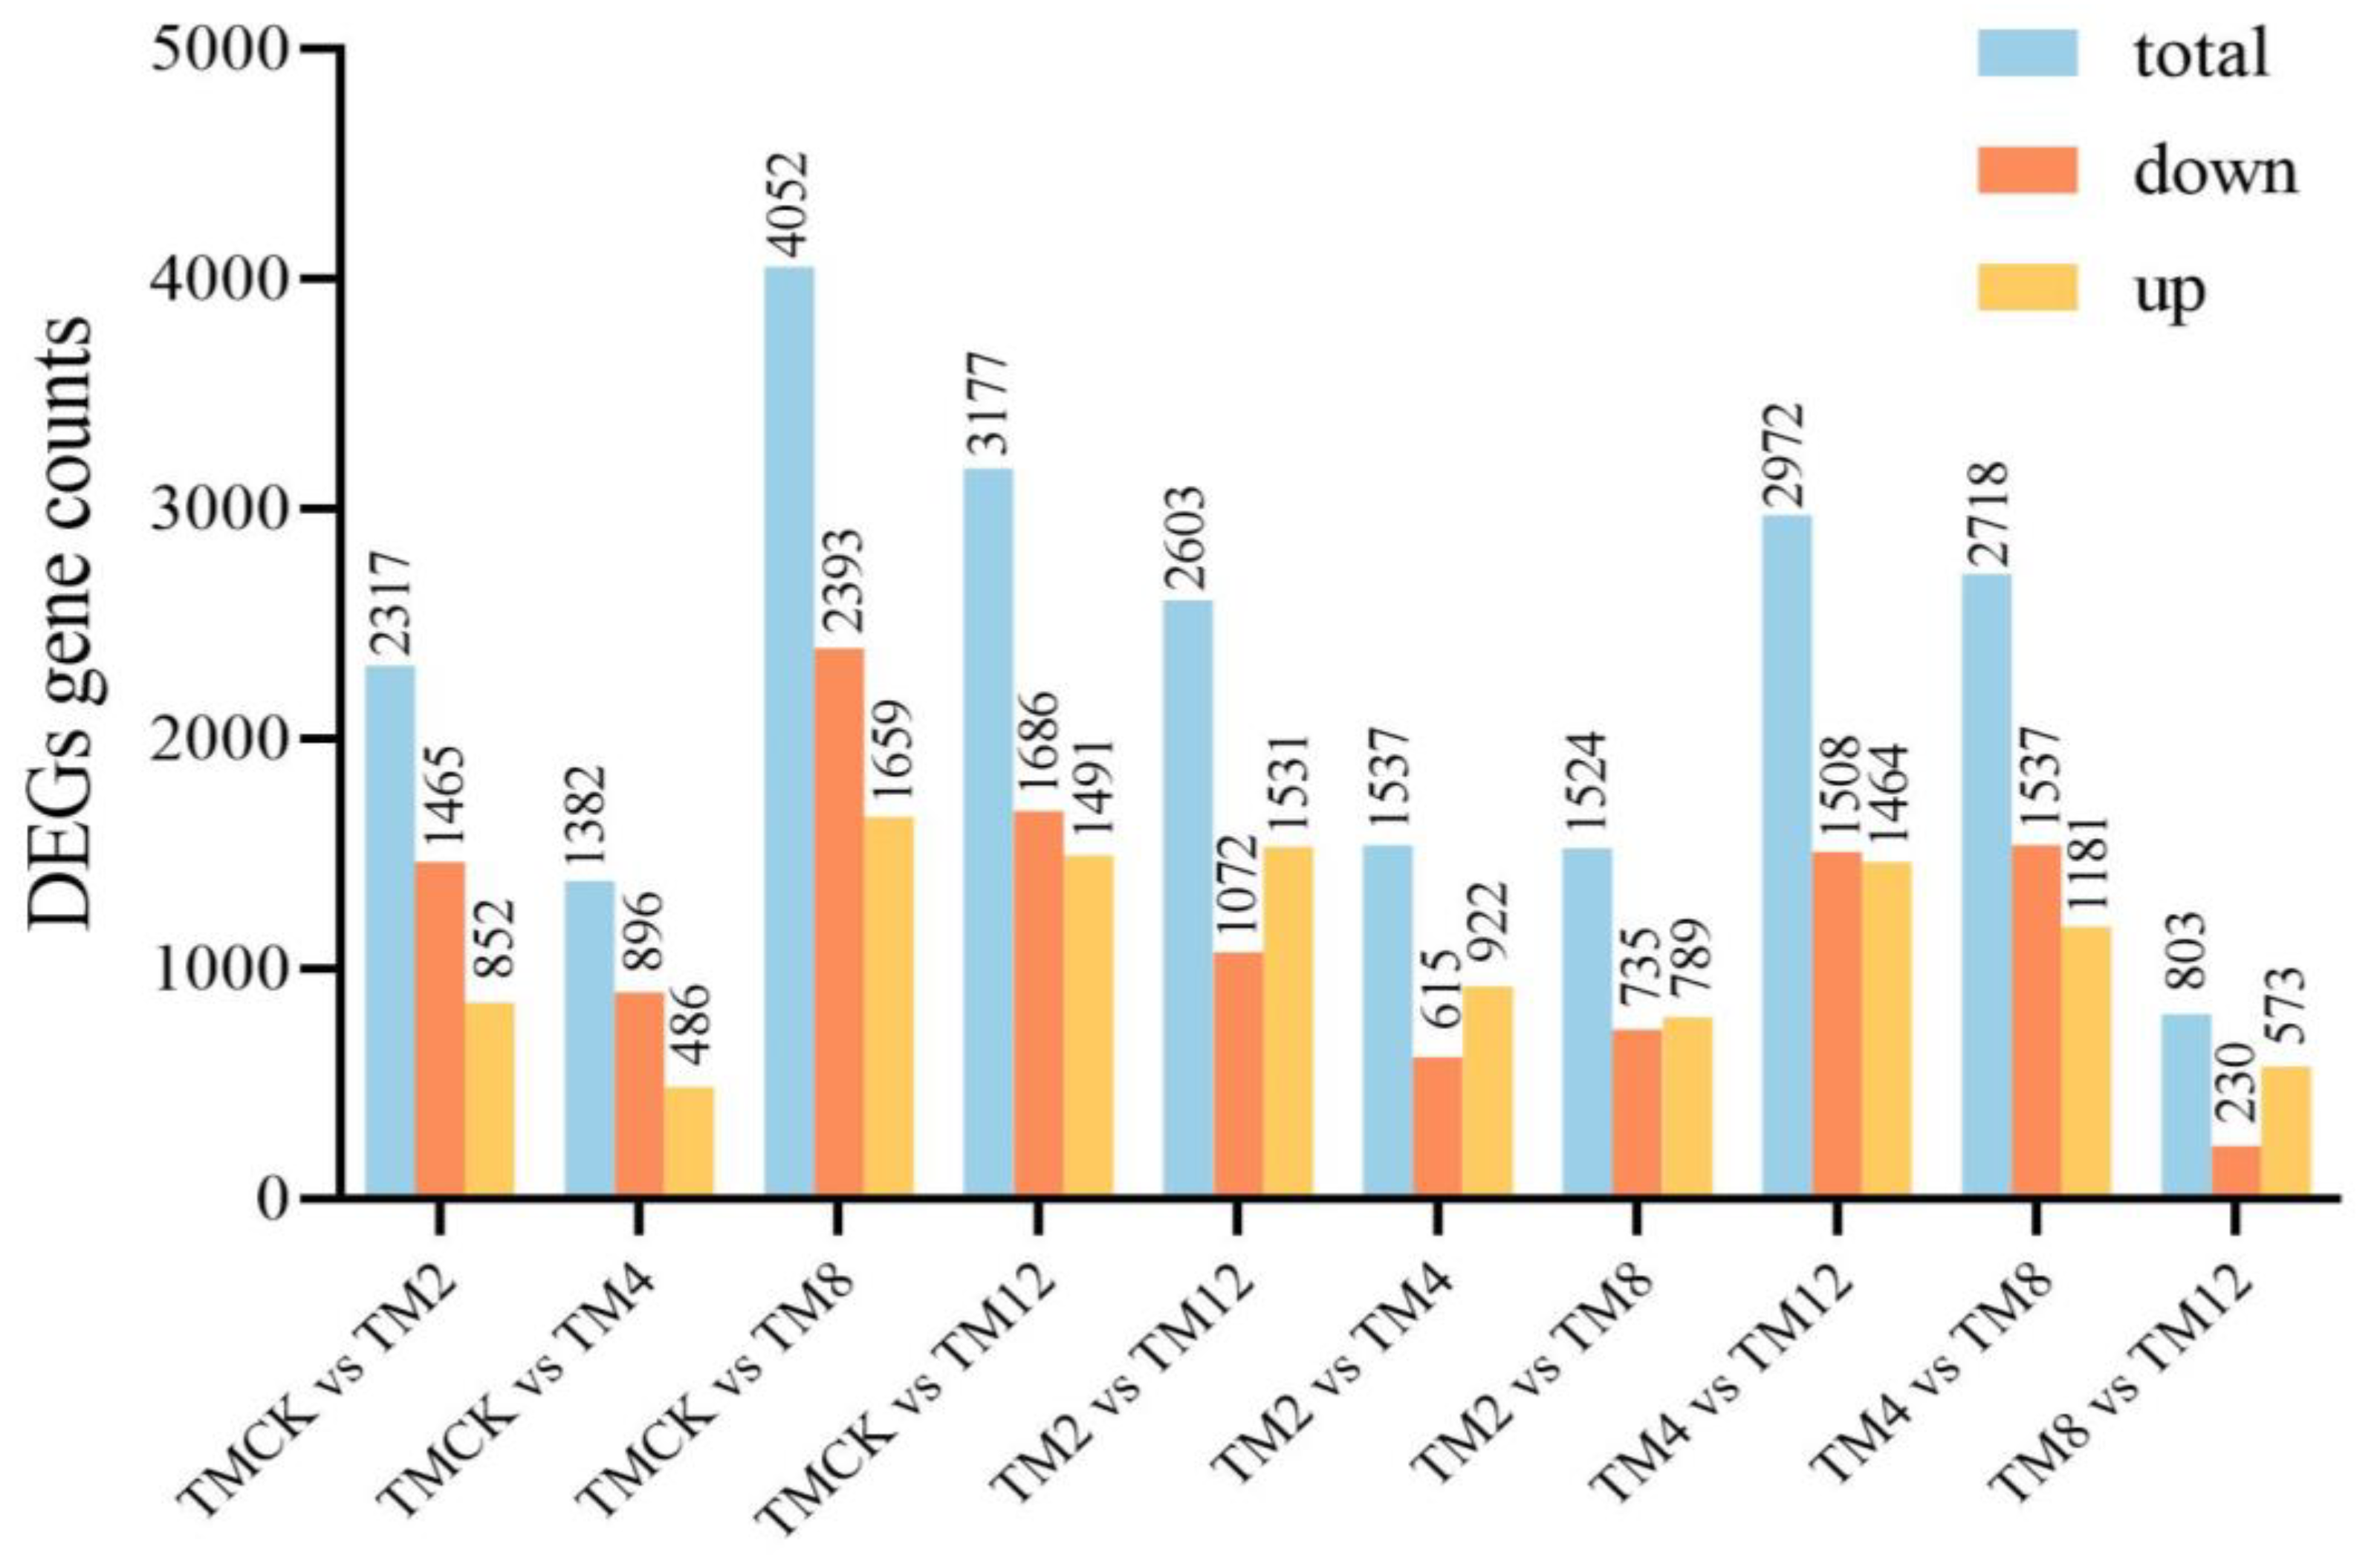
The screening criteria for DEGs between different Na2SeO3 treatment groups and control groups are defined as significance p-value ≤ 0.05, |log2 Fold Change | ≥ 1.0. A total of 10 DEG comparison groups were established based on the analysis results to identify DEGs between different treatments. Compared with the control group, the number of upregulated DEGs in the 2 mg/L to 12 mg/L Na2SeO3 treatment group was 852, 486, 1659, and 1491, and the number of downregulated genes was 1465, 896, 2393, and 1686, respectively (Figure 7).

3.9. Weighted Gene Co-Expression Network Analysis (WGCNA) Analysis of DEGs

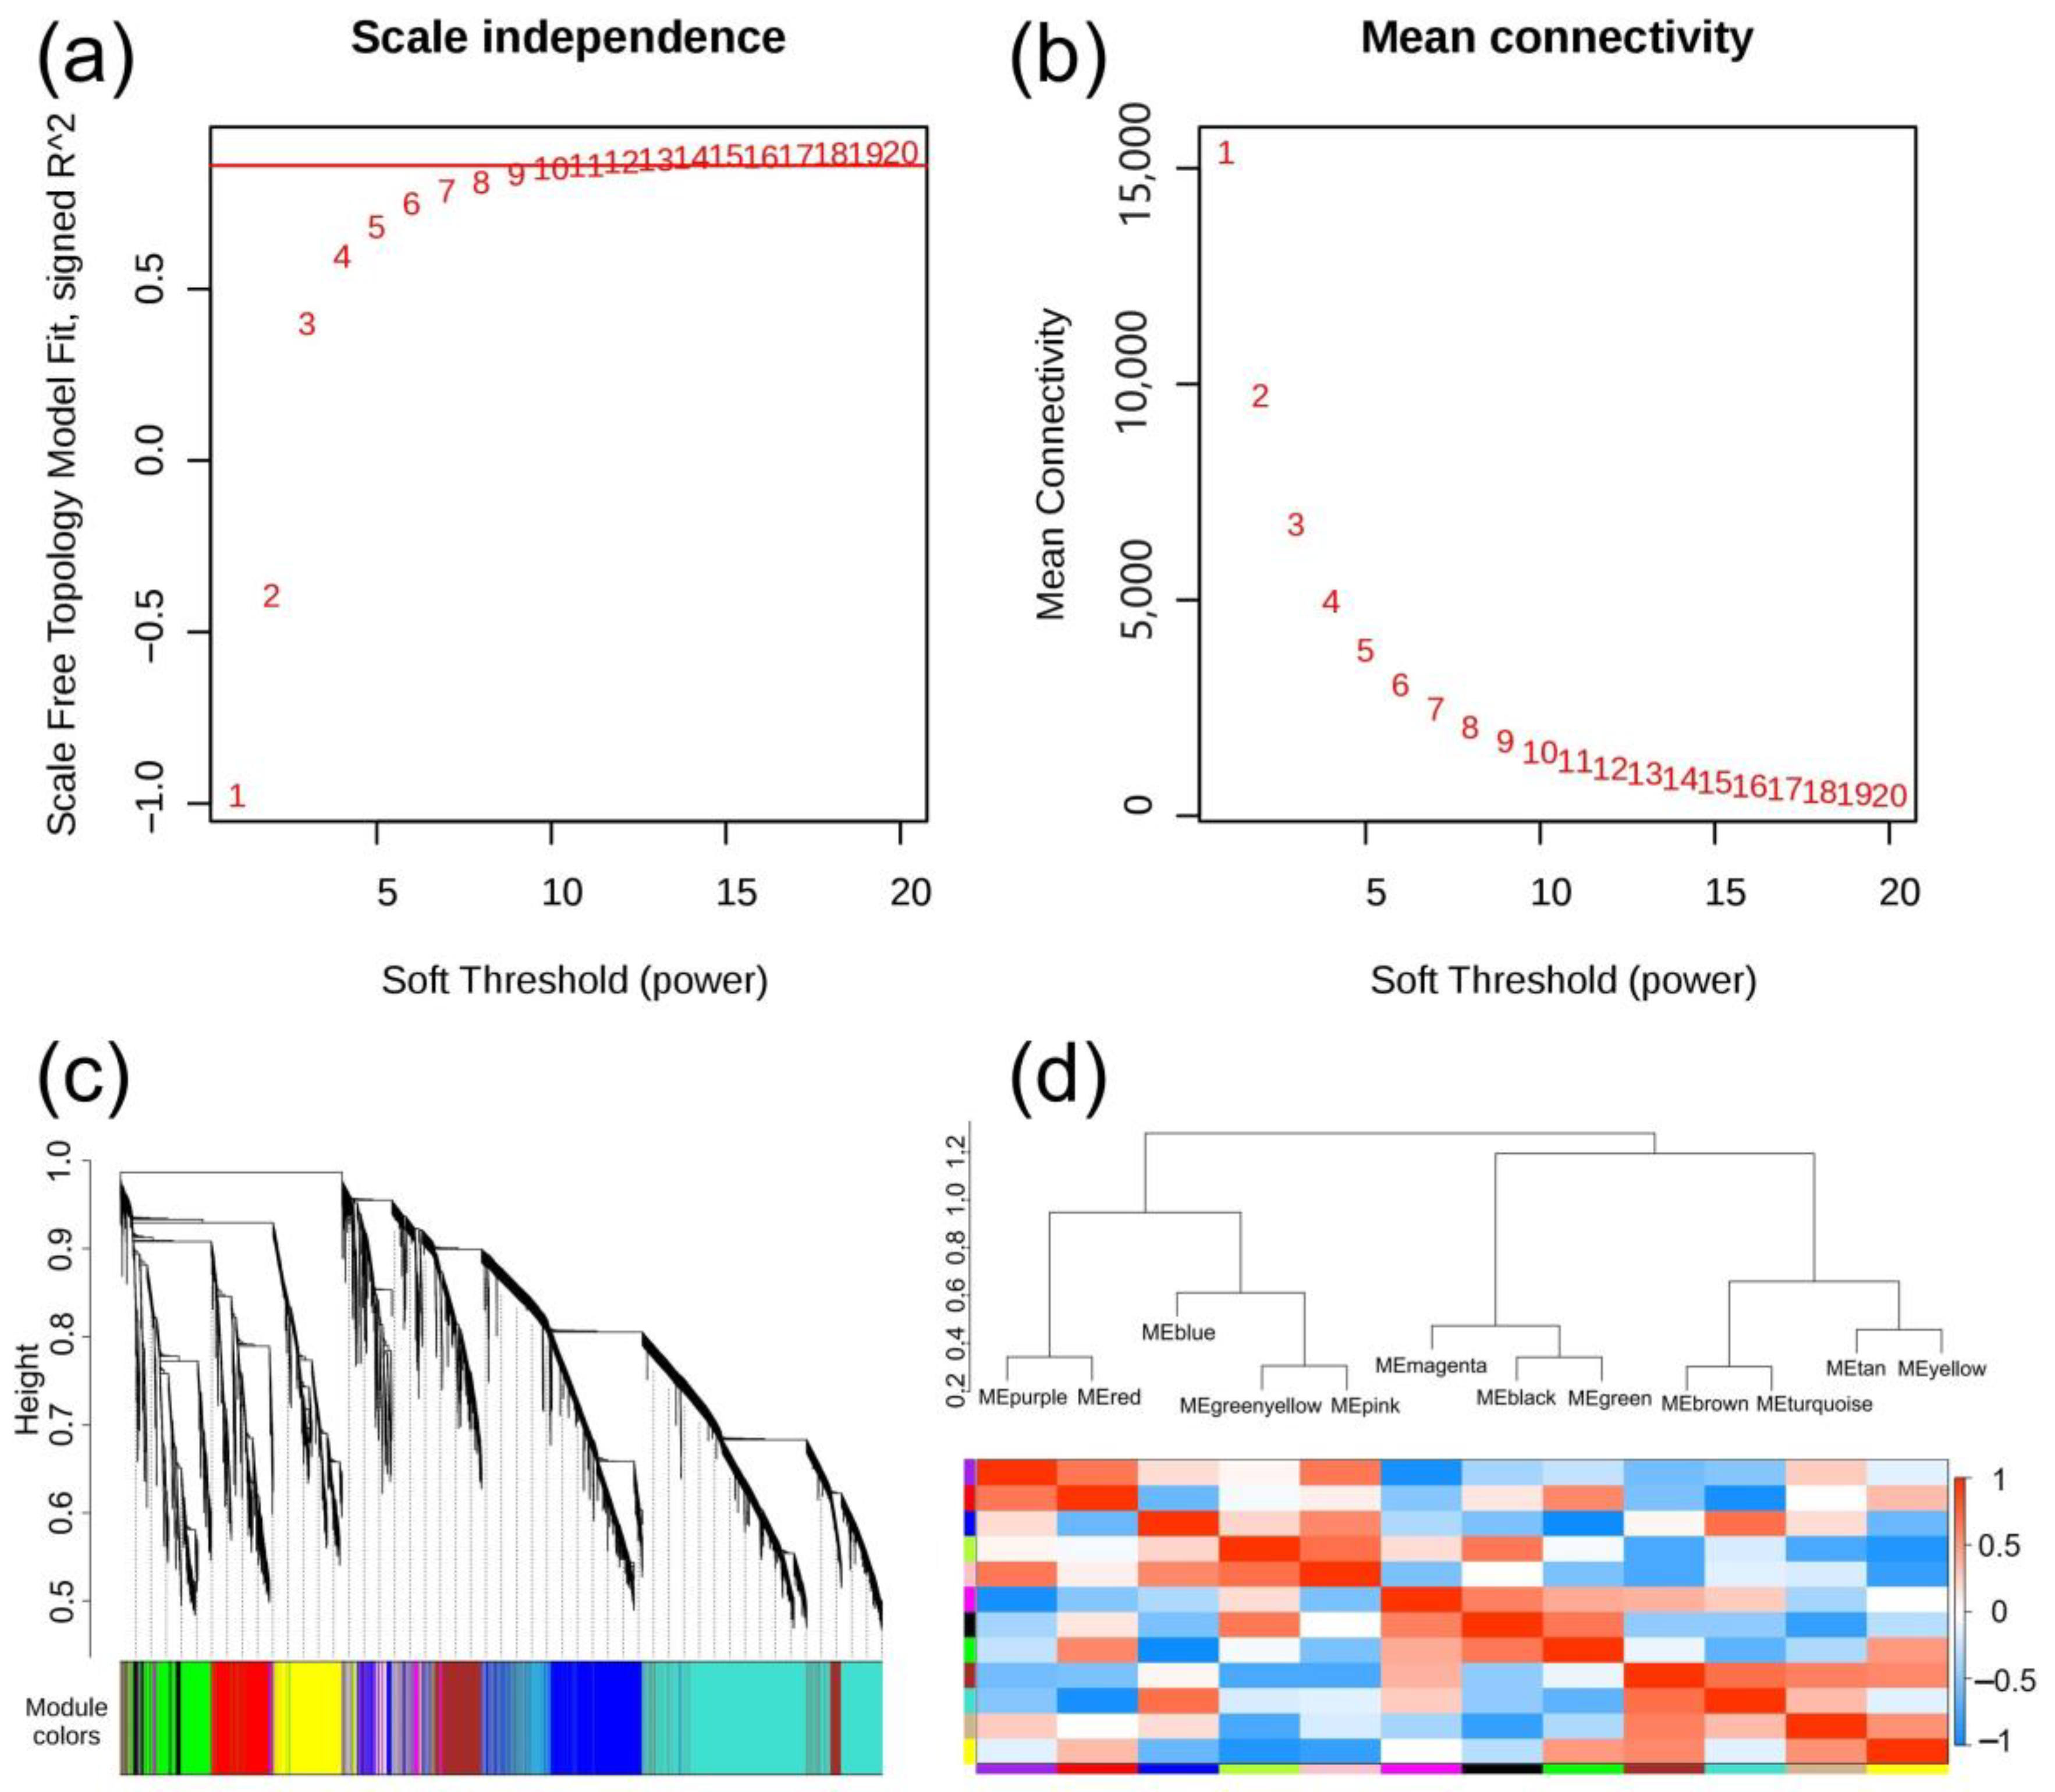
The co-expression module of DEGs in dandelion Se metabolism was constructed by the WGCNA algorithm. After filtering out low-expression genes, WGCNA analysis retained 28,321 genes for network construction. Figure 8a,b show the fitting indices and average connectivity under different soft thresholds. Finally, the WGCNA analysis adopted a scale-free network construction, with a fitting index of R2 = 0.9 and a weighting coefficient set β = 10. Modules with the same color represent groups with similar gene expression patterns (Figure 8c). The correlation heatmap between modules (Figure 8d) is also shown in two parts. The upper part clusters modules based on their feature values, while the horizontal and vertical coordinates in the lower part represent the correlation between different modules. The redder the color, the stronger the correlation between the corresponding modules; the bluer the color, the weaker the correlation between the corresponding modules.

3.10. Characteristic Analysis of Gene Expression Module

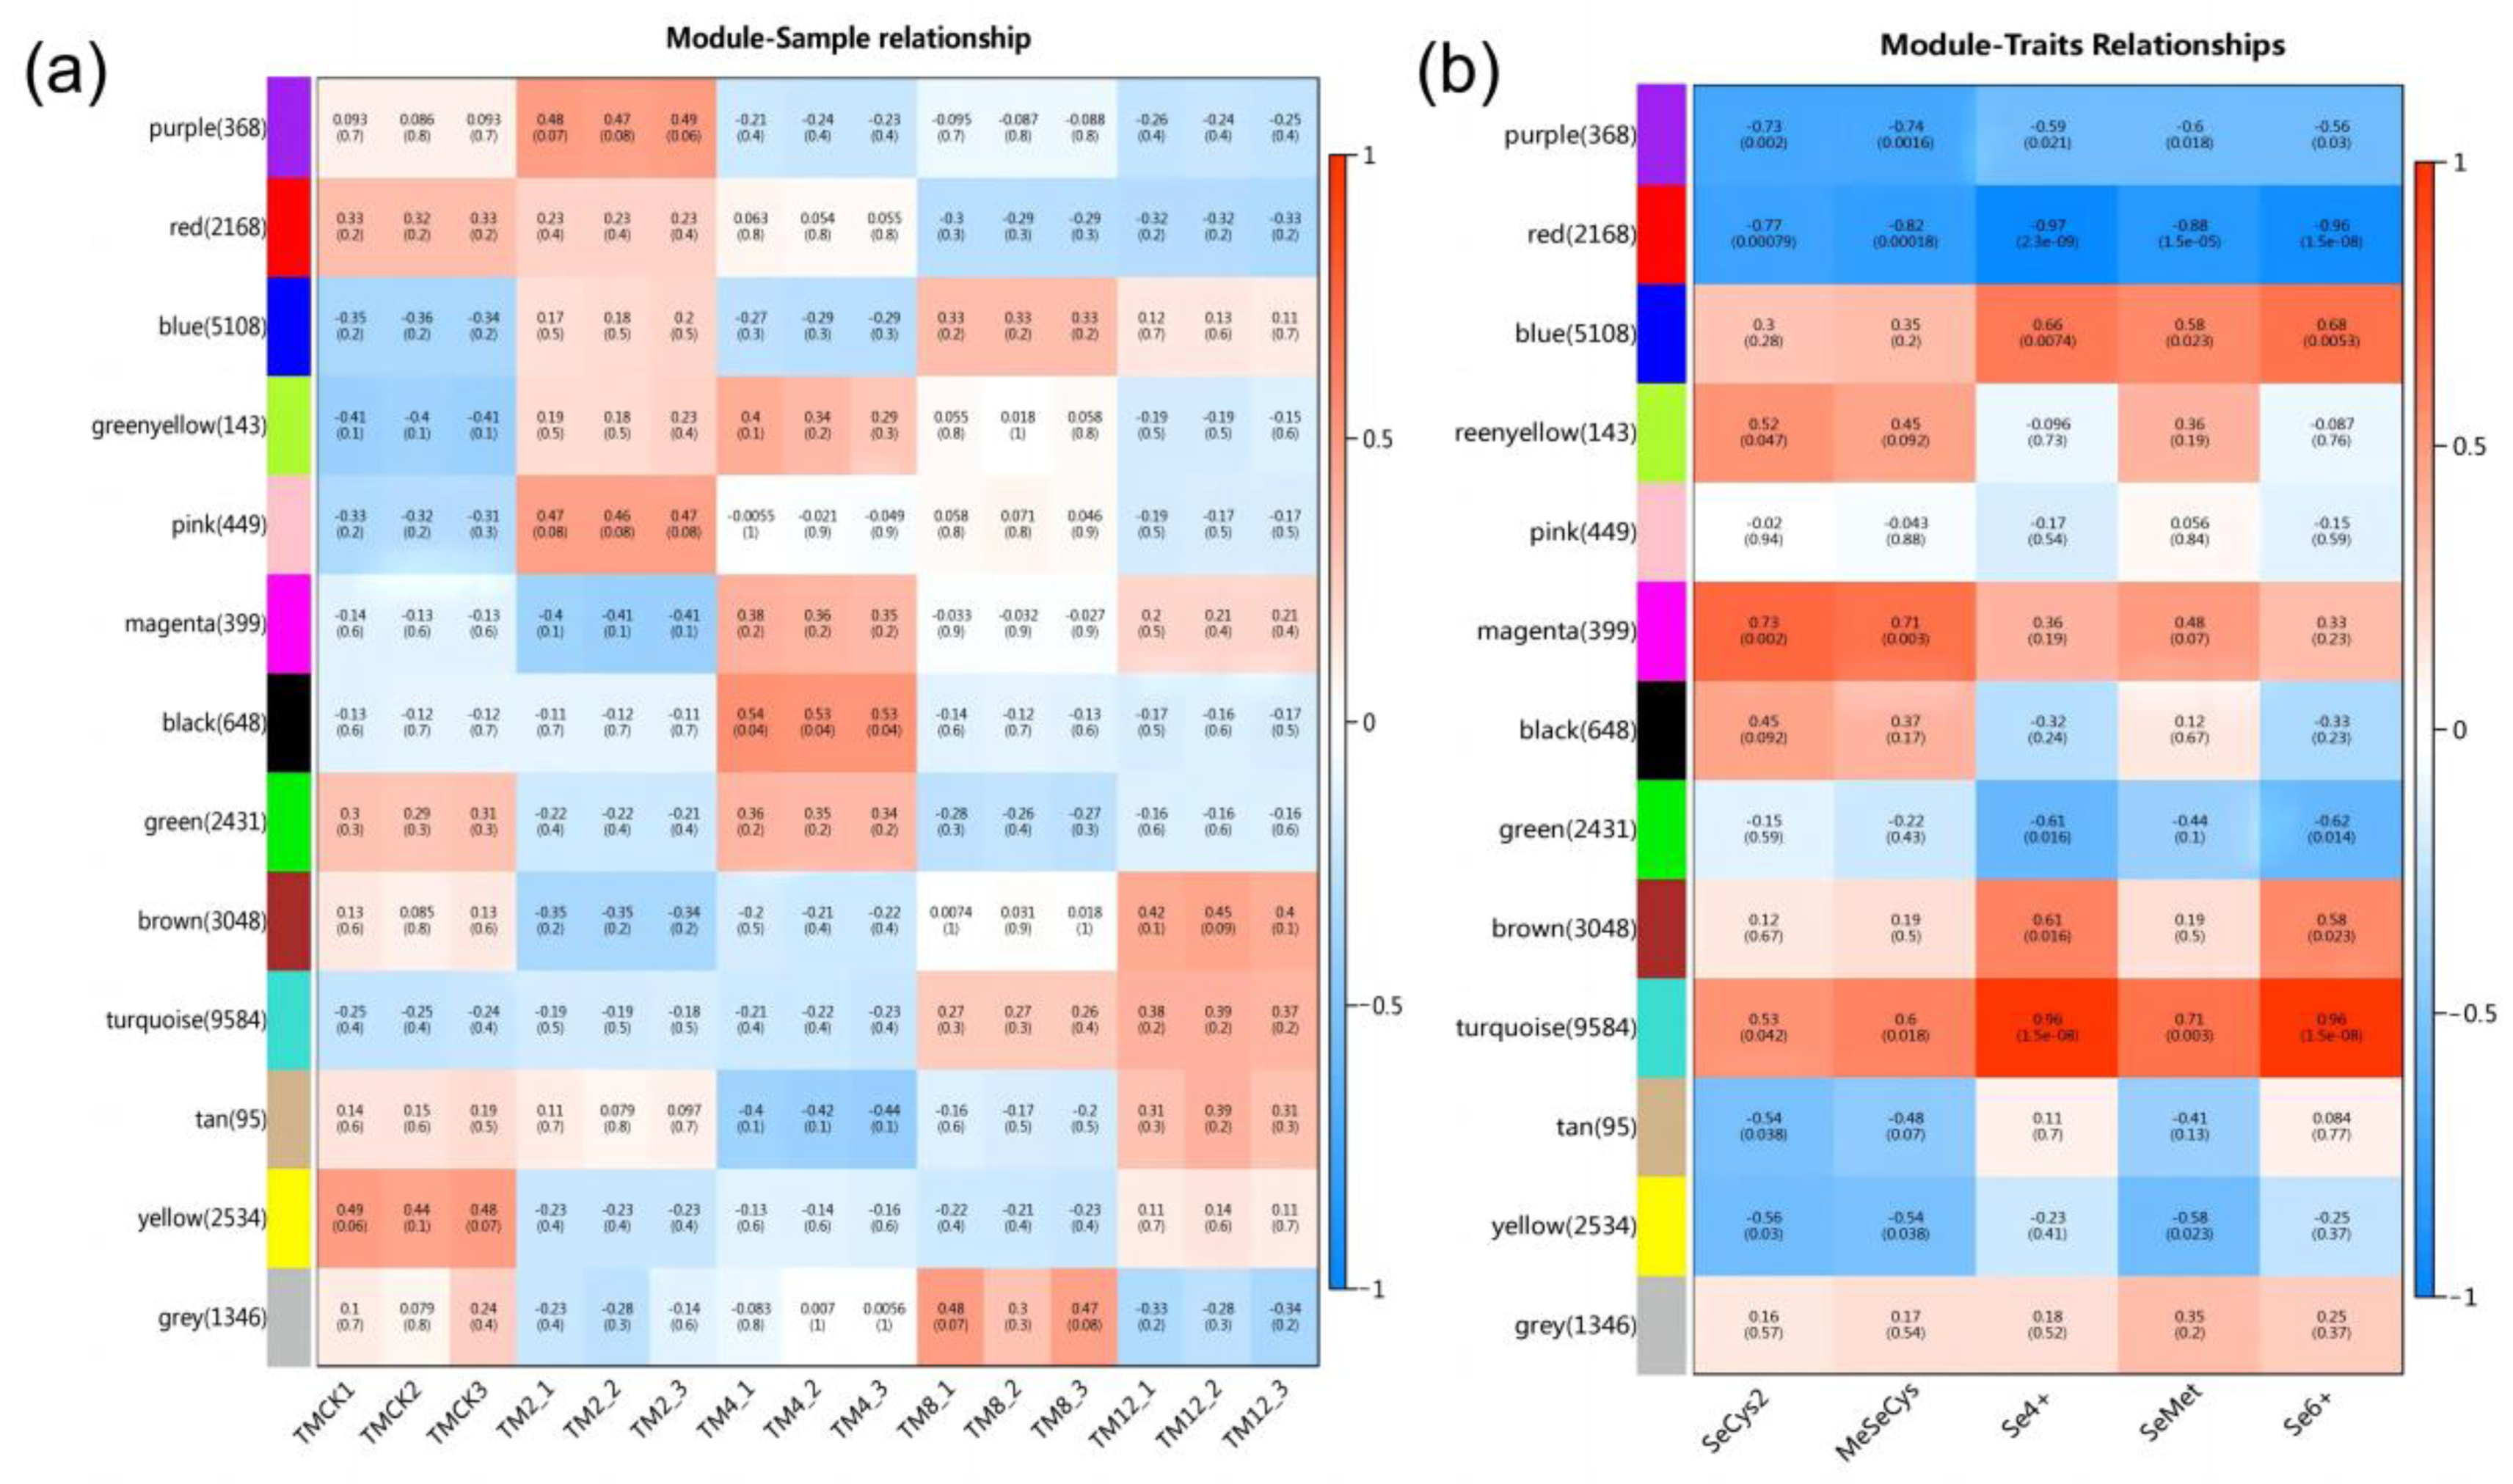
WGCNA analysis generated 13 modules with similar gene expression patterns, as shown in Figure S3. Figure 9a shows the correlation analysis of module characteristic genes in dandelion samples treated with different concentrations of Na2SeO3. Figure 9b shows the correlation analysis between module characteristic genes and the content of five Se species (SeCys2, MeSeCys, Se (IV), SeMet, and Se (VI)) in dandelion. The results indicated that the magenta and turquoise modules were positively correlated with Se species content, and the characteristic genes of these two modules were highly correlated with the organic Se synthesis of dandelion. The red module was negatively correlated with Se form content, and the characteristic genes of this module are highly correlated with the organic Se decomposition of dandelions.

3.11. Gene Functional Enrichment Analysis of Key Modules

The DEGs related to Se metabolism in dandelion were classified by Gene Ontology (GO) and Kyoto Encyclopedia of Genes and Genomes (KEGG) analysis. The GO analysis of the magenta module mainly focuses on biological processes (BP), with enriched functions such as the localization of ribonucleoprotein complexes and RNA export from the nucleus (Figure S4a). The GO analysis of the turquoise module mainly focuses on molecular function (MF), with enriched modules including RNA-dependent ATPase activity and transcriptional regulatory factor activity (Figure S4b). The GO entries in the red module mainly focus on cellular components (CC), with the main enriched modules being the chloroplast thylakoid membrane and the plastid thylakoid membrane (Figure S4c).
The KEGG enrichment analysis results of the magenta module are mainly enriched in pathways such as plant–pathogen interaction and plant hormone signal transduction (Figure S5a). The turquoise module was mainly enriched in pathways such as proteasomes, protein processing in the endoplasmic reticulum, and amino acid biosynthesis (Figure S5b). The red module was mainly enriched in pathways such as biosynthesis and metabolic pathways of secondary metabolites (Figure S5c).

3.12. Expression Regulation Analysis and Correlation Network of Key Genes

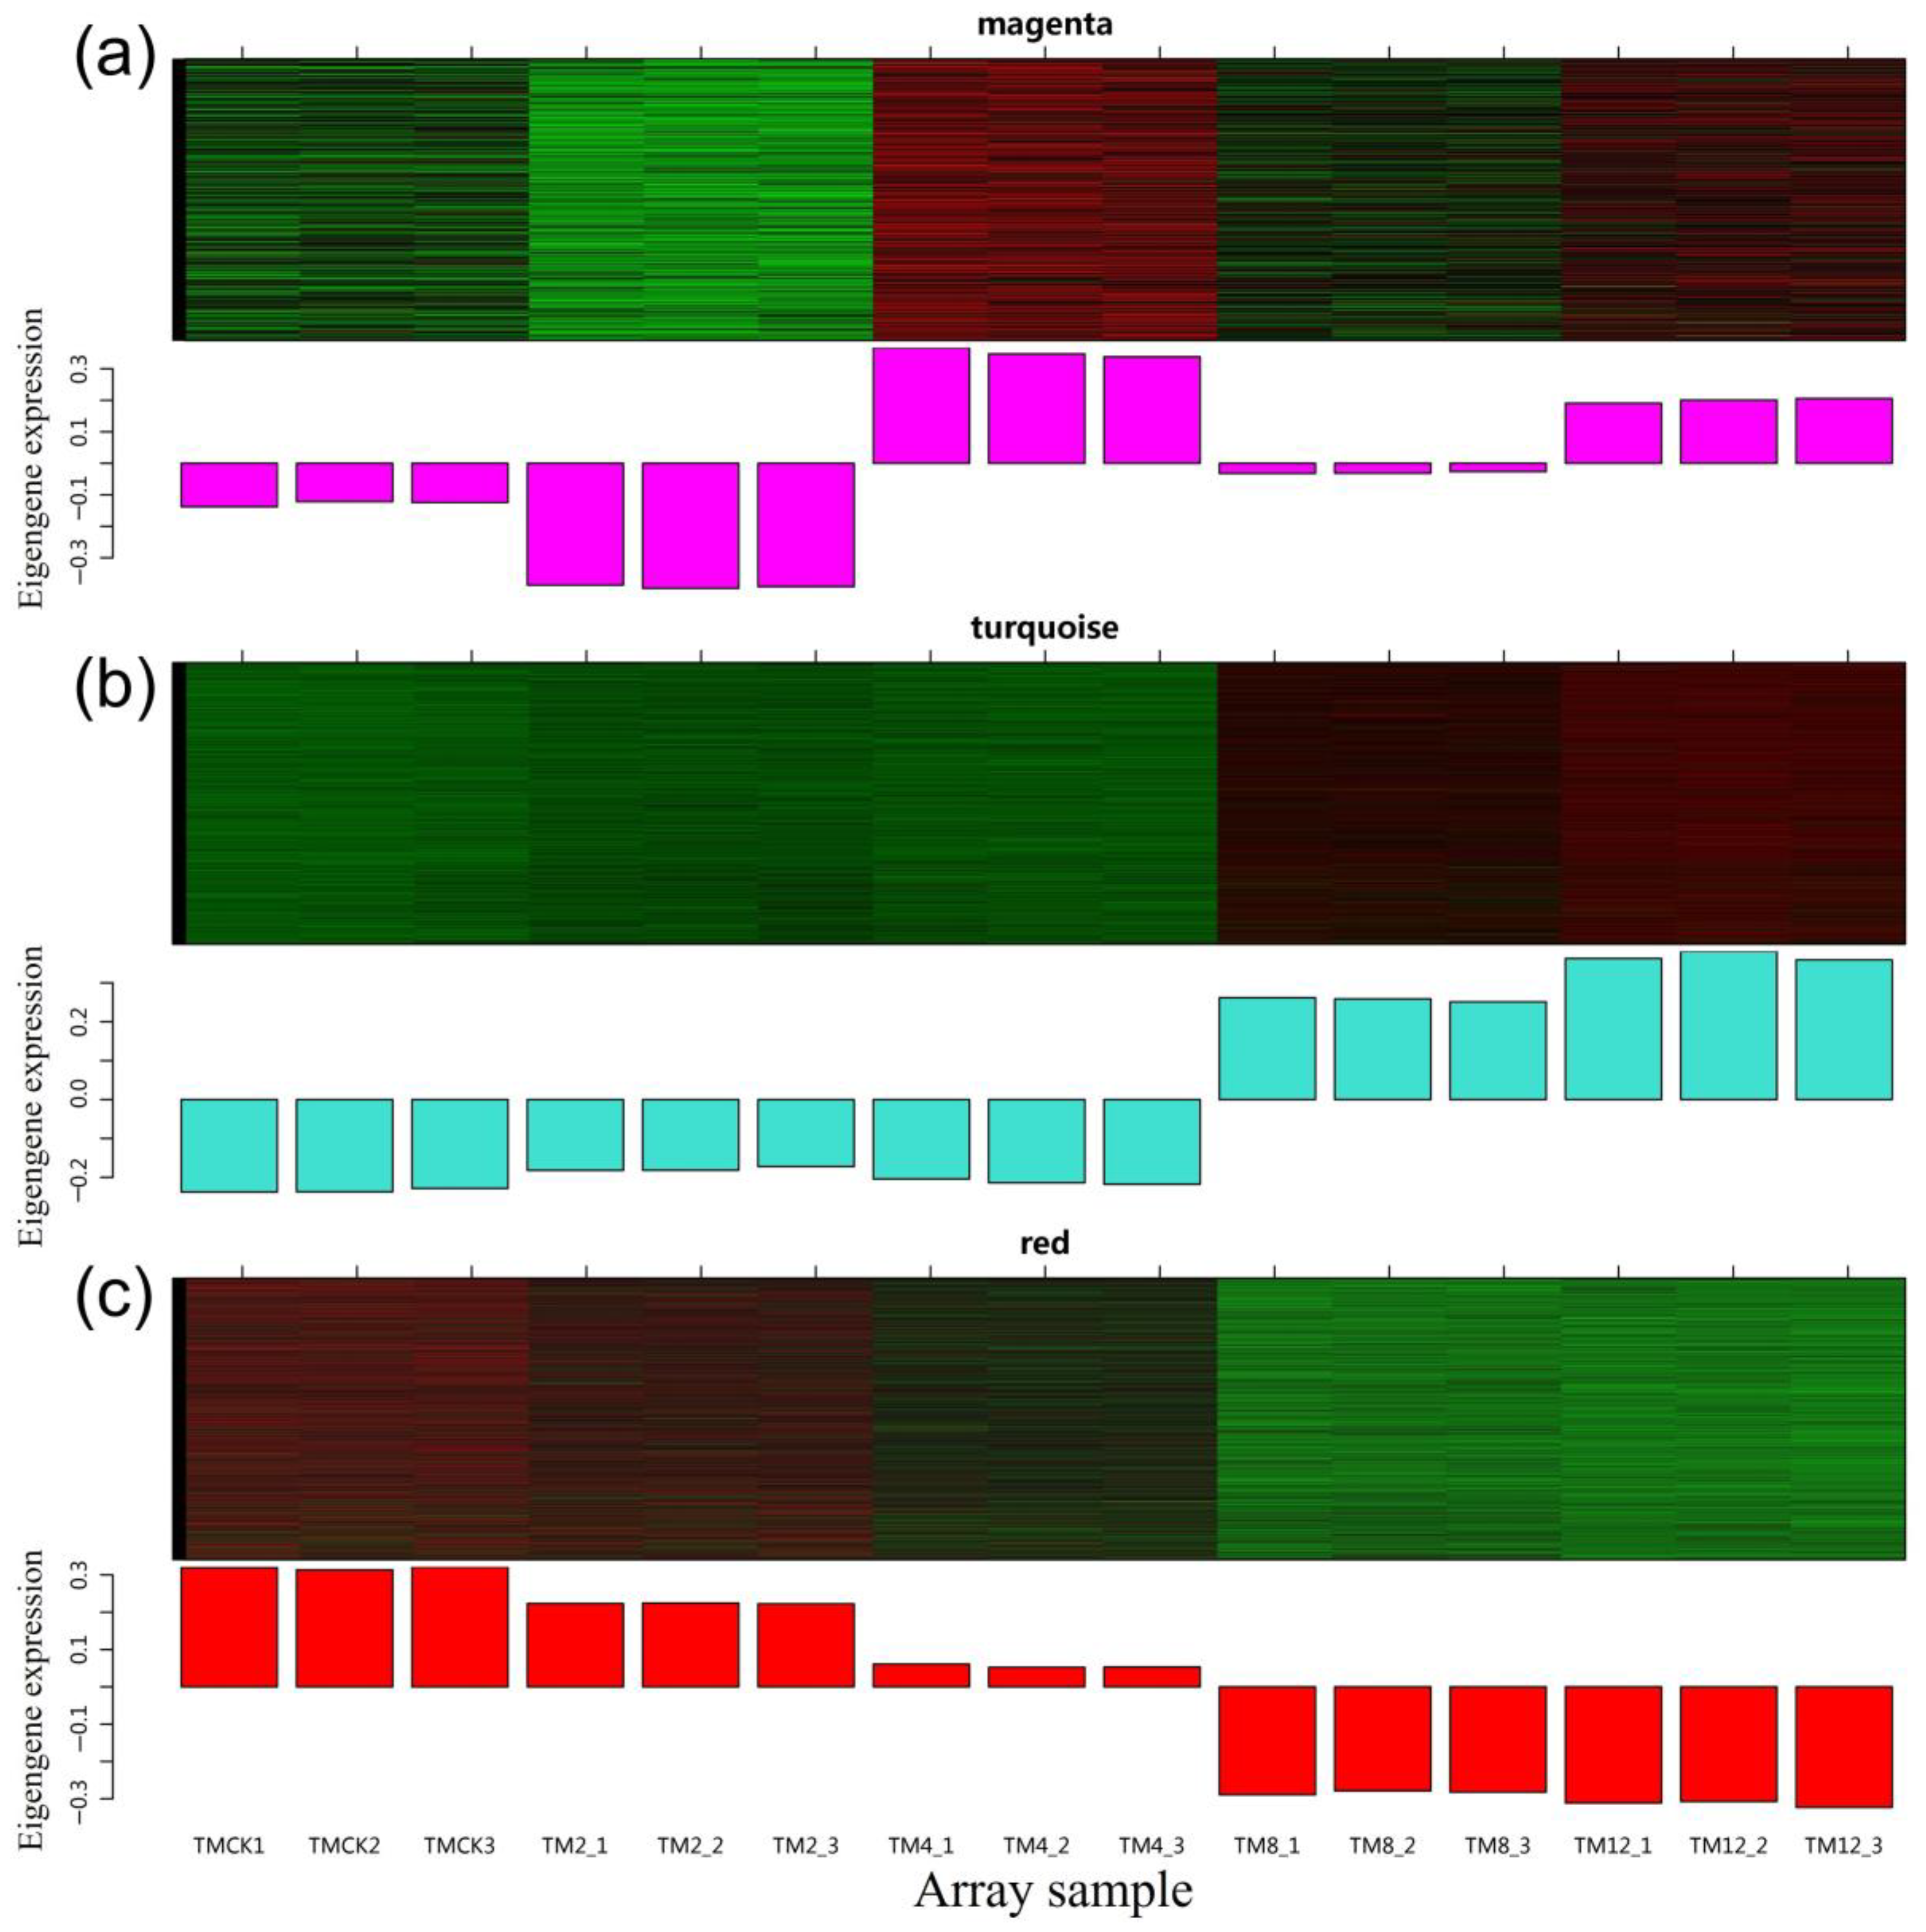
The heat map of gene expression levels in each module showed that the genes in the magenta module have the highest expression levels under the treatment with 4 mg/L Na2SeO3 (Figure 10a). The expression levels of genes in the turquoise module were upregulated under treatment with 8 mg/L and 12 mg/L Na2SeO3, with the highest expression levels observed under treatment with 12 mg/L (Figure 10b). The gene expression level in the red module was highest in the control sample, while the expression level was downregulated under the treatment with 8 mg/L and 12 mg/L Na2SeO3 (Figure 10c).
Through correlation analysis and a literature review, 60 hot genes with the highest correlation with organic Se metabolism were selected from three modules, and functional annotation of key genes was performed using data information from the NCBI database. Correlation analysis was conducted between the selected hot genes and different species of Se content. Figure 11a shows the correlation heatmap between key genes and Se form content (p < 0.05). Among them, gene TbA04G096540 (ABC11B) has the strongest positive correlation with the five species of Se content, followed by genes TbA03G023600 (C7317), TbA02G010540 (BAK1), and TbA03G012600 (CNGC1).
Figure 11b shows the correlation network between hot genes and Se form content, where the solid line represents positive correlation, the dashed line represents negative correlation, the size of the circle represents the number of related objects, and the thickness of the line represents the strength of the correlation. From the perspective of associated objects, the TbA01G057870 (PTR4) gene had the most associated objects with 21, followed by the TbA05G106060 (MOCOS) gene with 17 associated objects.

4. Discussion

4.1. The Effect of Se on the Growth of Dandelion

Low concentrations of Se can promote plant growth, while high concentrations of Se can inhibit growth. Mohd found that when 10 μmol/L of Se was applied, the aboveground, root length, and dry weight of tomatoes increased compared to the control group. However, when the Se concentration increased to 40 or 80 μmol/L, these indicators all decreased, indicating that high Se concentration slowed down plant growth and development, which had a negative impact on growth indicators [23]. In addition, Han found that the application of Na2SeO3 or Na2SeO4 can effectively alleviate drought stress in tobacco, increase its root length and surface area, and promote growth [24].
Photosynthetic pigments participate in the absorption and transfer of light energy during photosynthesis, and changes in the content of photosynthetic pigments can affect plant metabolism. Bai’s research found that low Se concentration treatment significantly increased the net photosynthetic rate of alfalfa leaves, which may be related to the increase in stomatal conductance and photosynthetic pigments [25]. In addition, studies have shown that the application of Se2−, Se4+, and Se6+ to rice roots all increased the photosynthetic rate of plants and increased their biomass [26]. In the present study, dandelion was more sensitive to Se. Treatment with 2–12 mg/L Na2SeO3 reduced the fresh weight and the aboveground and underground length of dandelion, and Na2SeO3 had an inhibitory effect on its growth. Under low-concentration Se treatment, there was a slight increase in the photosynthetic pigment of dandelion, but as the concentration increased, the photosynthetic pigment decreased significantly. Therefore, Se treatment reduced the photosynthetic pigment content of dandelions and caused a decrease in biomass. Gui’s research found that after treating broccoli with 0–1.6 mmol/L Na2SeO3, the fresh weight of plants treated with various concentrations was lower than the control, which is consistent with our research results [27].

4.2. The Effect of Se on the Nutritional Quality of Dandelion Vegetables

Soluble sugars and proteins can provide the necessary protein and energy for the human body and are important indicators for evaluating the nutritional quality of vegetables. He et al.’s research found that Se treatment significantly increased the content of soluble sugars and soluble proteins in cauliflower sprouts [28]. Xu’s research found that Se application improved the flavor and quality of tomatoes, increasing the content of total soluble solids, soluble sugars, and titratable acids [29]. Wang treated two varieties of mung beans with Na2SeO3 at concentrations of 15 g/ha, 30 g/ha, and 45 g/ha, respectively. Compared with the control group, both varieties of mung beans showed significant increases in protein, fat, total phenol, and total flavonoid content [30]. Spraying 1 mg/L of Na2SeO4 on the leaves of tomatoes during the flowering period found that Se treatment increased the content of soluble sugars, amino acids, flavonoids, Vc, and vitamin E in tomato fruits. This is because Se has a significant impact on carbohydrate metabolism, amino acid metabolism, and secondary metabolism [31]. Li’s research found that 20 mg/L of nano-Se can increase the chlorophyll and soluble sugar content of chili peppers. It activates the phenylpropanoid and branched chain fatty acid pathways, as well as the expression of AT3-related genes, leading to an increase in the content of capsaicin, flavonoids, and total phenols, improving crop quality [32]. In the present study, although the total biomass decreased after treatment with Na2SeO3, the content of soluble sugars, soluble proteins, flavonoids, Vc, and total phenols all increased with the increase in Na2SeO3 concentration.
After the foliar application of Se (IV), the Se content in rice grains was mainly composed of Se-substituted amino acids and other organic Se [26]. Luo’s research showed that the Se content in peanuts increases in a dose-dependent manner, and the main organic Se species in peanut protein are SeCys2, MeSeCys, and SeMet [33]. When treating mustard with different concentrations of Na2SeO3, it was found that five Se species, SeCys2, MeSeCys, Se (IV), SeMet, and Se (VI), were detected in its edible parts. Among them, organic Se content accounted for over 99%, and the proportion of SeMet content was the highest in each treatment group [12]. Li’s research showed that after treating B. juncea with different concentrations of Na2SeO3, the proportion of SeMet in the aboveground part was the highest, while MeSeCys and SeMet in the roots were the highest. Moreover, the increase in SeMet content in the roots effectively reduces the transportation of Cd to the aboveground part [34]. In this study, when dandelion was treated with 8 mg/L Na2SeO3, the total Se content reached 25.97 mg/kg, with organic Se accounting for 99.37%, which was of great significance for dietary Se supplementation.

4.3. The Effect of Se on the Antioxidant System of Dandelion

Plants produce reactive oxygen species (ROS) during their metabolic processes. Low concentrations of ROS molecules are important signaling molecules for plants, while high concentrations of ROS molecules disrupt the protective enzyme system, leading to membrane lipid peroxidation and the production of MDA [35]. The antioxidant protective enzyme systems in plants mainly include SOD, CAT, POD, etc. [36]. In addition, the antioxidant system of plants also includes natural nonenzymatic antioxidants such as glutathione, carotenoids, and ascorbic acid [37]. Se is mainly metabolized into SeCys and SeMet through sulfur assimilation [38]. SeCys is a coenzyme factor in the active center of glutathione peroxidase (GSH-PX) [39]. GSH-PX protects cell structure from oxidative damage [40].
Silva applied different concentrations of selenite and selenate to study the ROS scavenging mechanism in cowpea plants. The application of both selenite and selenate reduced lipid peroxidation; selenite mainly increased the activities of APX and GR, and selenate mainly increased the activity of CAT [41]. Liu used different concentrations of Na2SeO3 (0 mg/L, 200 mg/L, 500 mg/L, and 800 mg/L) to treat U. fasciata and A. schoberioides. All concentrations of treatment increased the activity of SOD, POD, CAT, and GPX. The MDA content was significantly reduced under the treatment with 200 mg/L Na2SeO3 [42]. Kalaei treated B. officinalis with different concentrations of Na2SeO3 and Na2SeO4 (2 mg/L, 4 mg/L, 8 mg/L, and 16 mg/L) and found that the antioxidant activity of plants treated with 8 mg/L Na2SeO4 was higher at the end of flowering [43]. In the present study, low-concentration Na2SeO3 (2 mg/L and 4 mg/L) treatment can reduce the MDA content of dandelion, while high-concentration Na2SeO3 (8 mg/L and 12 mg/L) treatment increases the MDA content. When the treatment concentration was 2 mg/L, the GSH content and SOD activity were highest. When the treatment concentration was 8 mg/L, the POD activity was highest. When the treatment concentration was 4 mg/L, CAT activity was highest. Low-concentration Na2SeO3 enhanced the antioxidant system activity of dandelion.

4.4. The Molecular Mechanism of Organic Se Conversion in Dandelion

Plants mainly absorb Se through transporters on the cytoplasmic membrane of their roots. Due to the chemical similarity between Se and sulfur, plants mainly absorb Se (VI) through sulfate transporters (high-affinity transporter SULTRs1;1 and SULTRs1;2) and Se (IV) through phosphate transporters or aquaporins. After being absorbed by the root system, Se (VI) was mainly transported through sulfate transporters (low-affinity transporter SULTRs2;1 and SULTRs2;2) through the xylem to the aboveground part and then redistributed by the phloem. Selenates within cells mainly enter the vacuoles through anion channels and are excreted by transport proteins (SULTRs4;1 and SULTRs4;2) in the vacuole membrane. Transport proteins (SULTRs3;1 and SULTRs3;5) also mediated the uptake of selenates on chloroplasts [44,45,46].
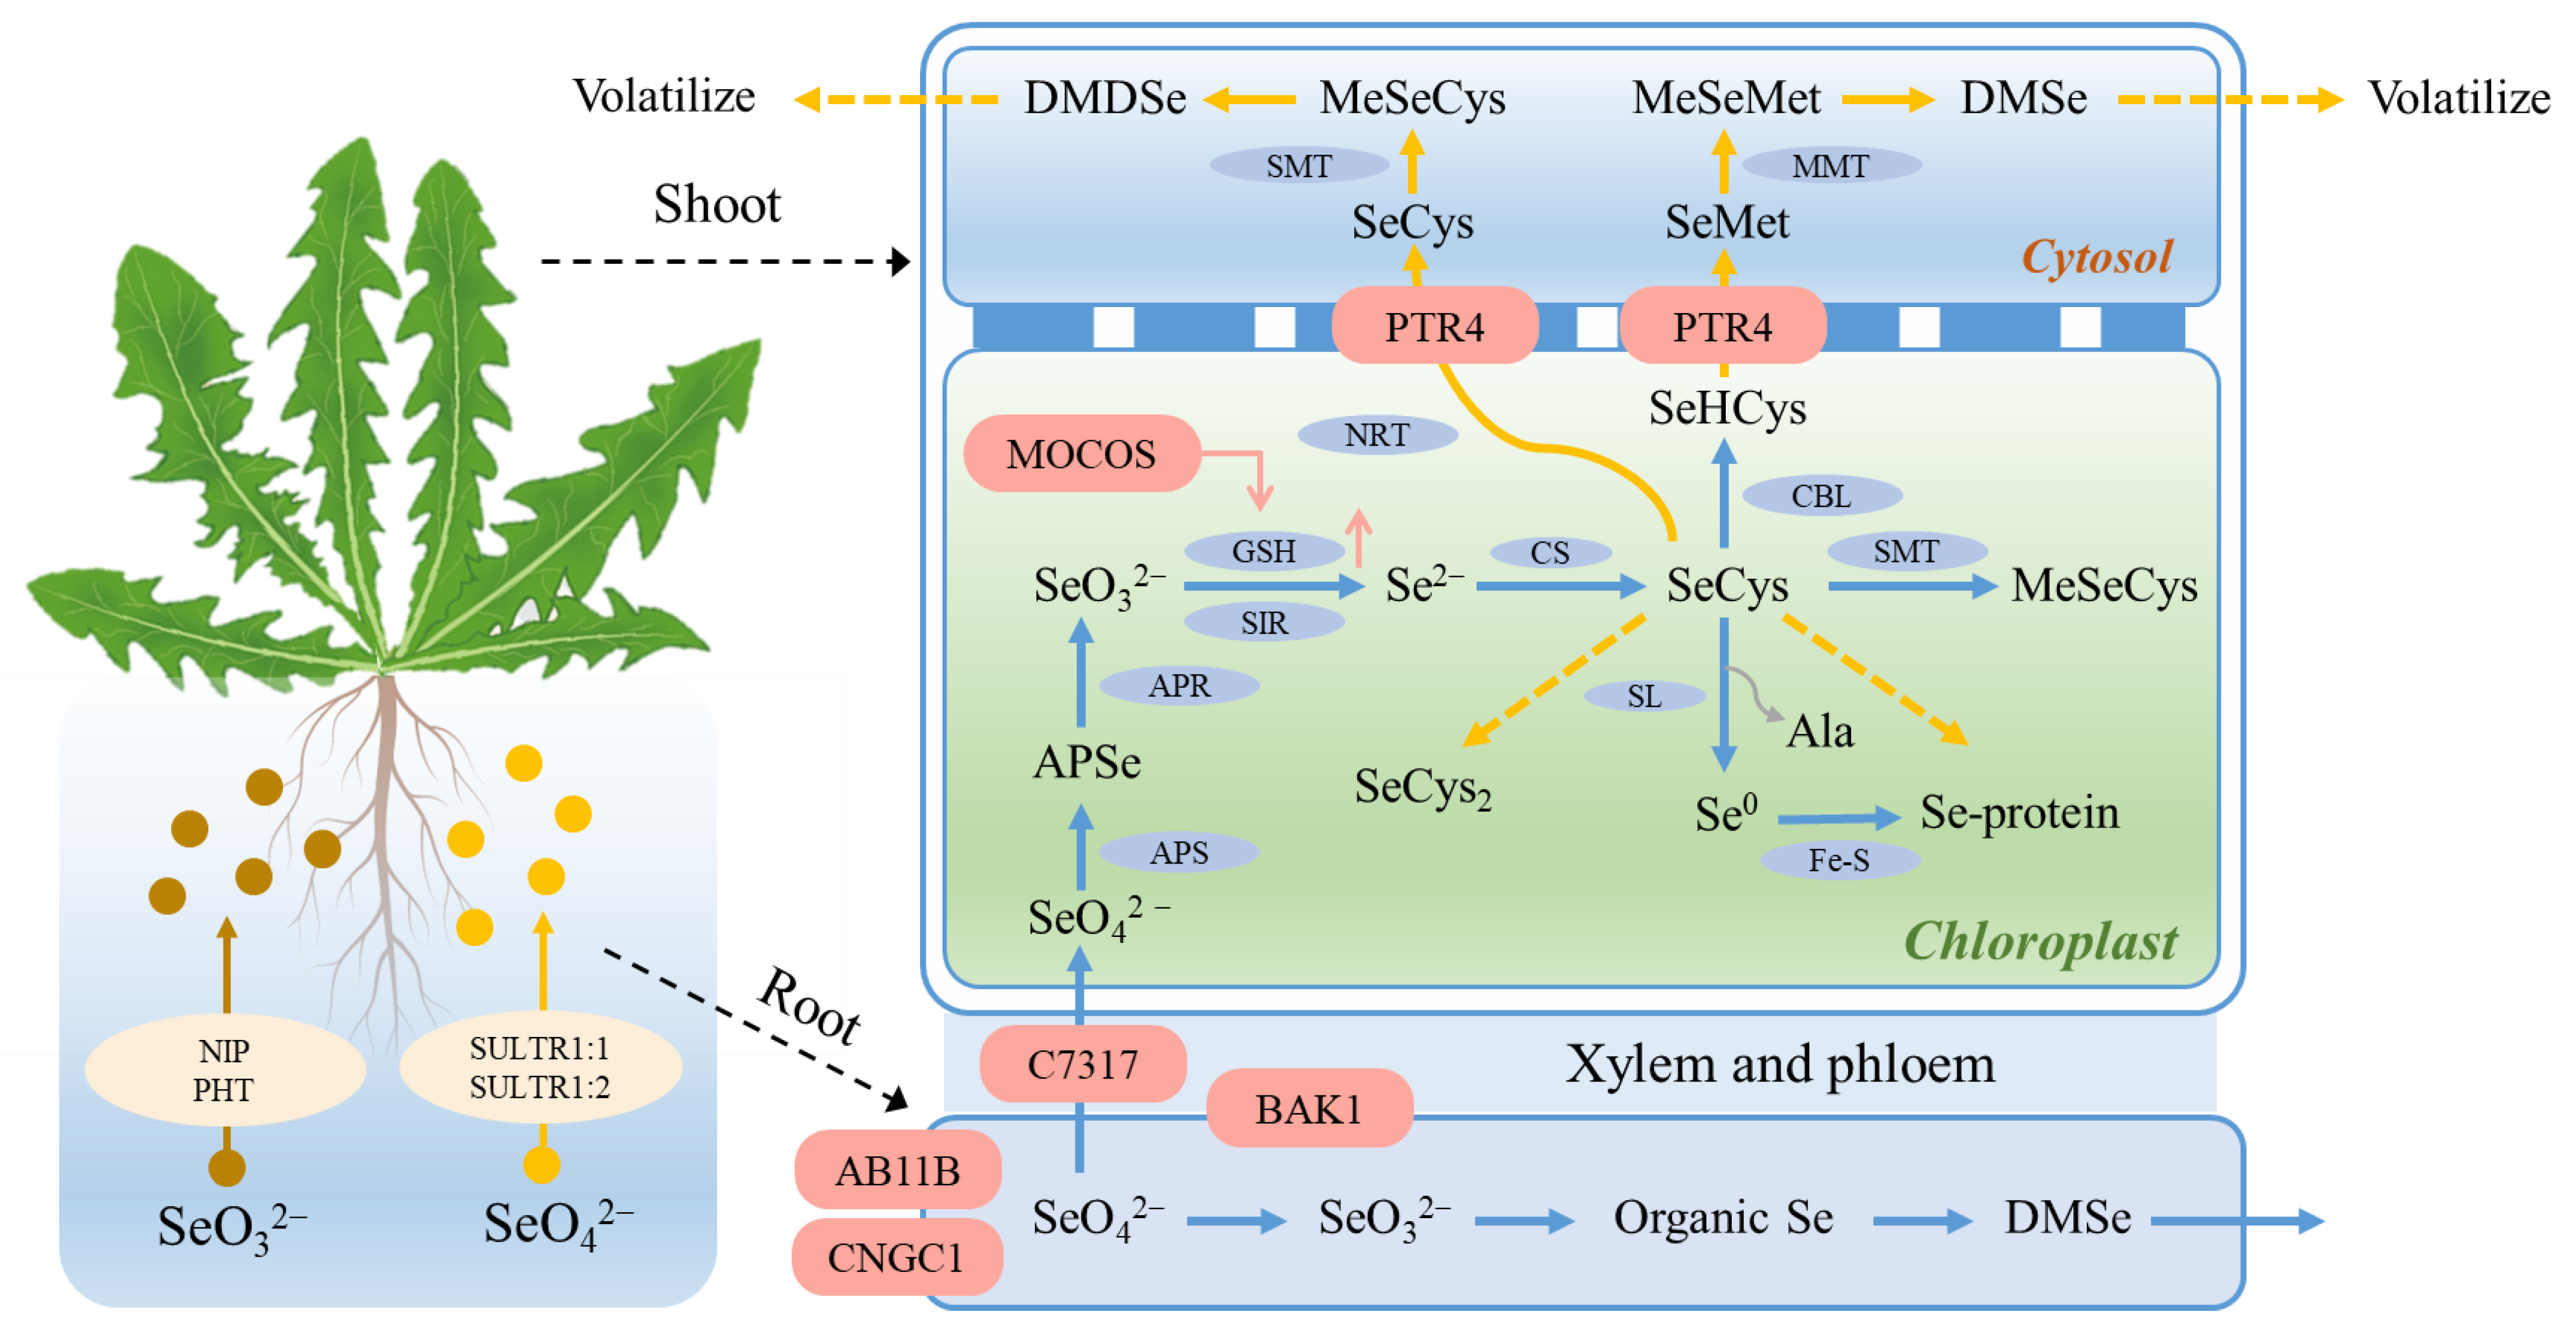
The first step in Se metabolism was the conversion of inorganic Se to 5′- adenosine selenate phosphate (APSe) by ATP sulfonylase (APS), followed by the conversion of APSe to Se (IV) by APS reductase (APR). Se (IV) was converted into selenides by the action of glutathione and sulfite reductase, which were further converted into SeCys by the action of cysteine synthase (CS). After the production of SeCys, there were several metabolic pathways of Se: the first was converted to Se (0) under the action of selenocysteine lyase (SL); the second pathway synthesized MeSeCys under the action of selenocysteine methyltransferase (SMT); the third pathway involved the cysteine sulfide- β- synthesis of selenocysteine (SeHCys) under the action of cystathionine β-lyase (CBL). SeHCys generated SeMet under the catalysis of methionine synthase (MTR), SeMet was converted to methyl selenomethionine (MeSeMet) under the action of methionine methyltransferase (MMT) and finally produced the volatile compound dimethyl Se (DMSe) [47]. Cheng studied the effects of different concentrations of Na2SeO3 on the growth and Se metabolism of mung bean sprouts through transcriptome and physiological index measurements. The study found that mung bean seeds absorbed Na2SeO3 through PHT1.1 and NIP2, and Se (IV) was transformed into Se (VI), which was then transported to the shoot parts; SULTRs3;3 played an important role in this transportation process [48]. Dou treated maize seedlings with different concentrations of Na2SeO3 and found that genes related to auxin signal transduction, DNA replication, and lignin biosynthesis were upregulated in the low-concentration Se treatment group, while the expression levels of these genes were downregulated in the high-concentration Se treatment group [49]. Rao studied the mechanism of Se accumulation and tolerance in C. violifolia and found that some calmodulin and Cys-rich kinase genes were downregulated after selenate treatment, while Se-binding protein 1 (SBP1) and sulfur deficiency-induced protein 2 (SDI2) genes were upregulated [50]. Previous studies have shown that SULTRs, NIP, PHT, etc., were the main genes mediating Se entry into plant roots. APS, APR, SIR, CS, SL, SMT, and CBL were the main genes mediating Se metabolism in chloroplasts. SMT, MTR, and MMT were the main genes mediating Se metabolism in the cytoplasm. And this study newly discovered that genes such as ABC11B, C7317, PTR4, MOCOS, BAK1, and CNGC1 were highly correlated with Se metabolism in dandelion roots, chloroplasts, and vacuoles (Figure 12).
ABC transporters are a class of transmembrane transporters that utilize the energy generated by ATP hydrolysis to extensively transfer various chemical substrates [51]. Li’s research indicated that ABC transporters play a positive role in Se absorption response, with ABCB, ABCC, and ABCG subfamilies playing important roles in Se absorption and transport in cowpeas [52]. Chen’s research found that after spraying Na2SeO3 on the leaves of the B. papyrifera, the expression levels of ABC transporters such as ABC11 and ABC5 were significantly upregulated, indicating that these genes may be involved in the transport of Na2SeO3 to vacuoles [53]. Wang’s research found that after spraying Na2SeO3 on the leaves of alfalfa, the expression level of ABC transporter G family member 36 (Q9XIE2) was significantly upregulated, which may be due to its involvement in the transport of Se to leaf tissue [54]. Zheng’s research found that after treating high Se tea plants with Na2SeO3, the expression of ABCB11 was upregulated [55]. The ABCB transporter protein can also mediate the transport of heavy metal ions such as cadmium, lead, and aluminum, participate in the transport of auxin in plants, and regulate leaf cell stomatal opening and closing. It was mainly located in the plasma membrane, and a few were located on the mitochondrial membrane, chloroplast membrane, or vacuole membrane [56]. In this study, ABC11B showed the strongest positive correlation with the five species of Se, and it may be involved in the transport of Se through the plasma membrane into cells (Figure 12).
Cytochrome P450 was the largest protein family in plants and a multifunctional biocatalyst that played an important role in biosynthesis and detoxification pathways [57,58]. It enhanced the molecular and chemical defense mechanisms of plants by regulating the biosynthesis of secondary metabolites, enhancing the ability to clear ROS [59]. Cytochrome P450 was involved in lignin biosynthesis under drought stress [60]. C7313 belonged to cytochrome P450, which was involved in the scavenging effect of Se on ROS (Figure 12).
NRT1/PTR family (NPF) proteins were initially characterized as nitrate or peptide transporters [56]. However, recent studies have revealed their involvement in the transport of a diverse range of substrates, including nitrite, selenide, mustard oil, auxin, abscisic acid (ABA), and methyl jasmonate [61]. Zheng found that the expression of NRT1 was upregulated under Na2SeO3 treatment, indicating that NRT1 plays an important role in the transport and distribution of Se [55]. Zhang’s study showed that nitrate transporter (NRT1.1B) enhanced the ability of rice to transport Se from root to shoot and promoted the transport of SeMet [62]. In addition, Weichert et al. isolated ATPTR4 and ATPTR6, two members of the NRT1/PTR family, from A. thaliana. These proteins were found to be located on the vacuolar membrane and mediated the release of compounds stored in the vacuole into the cytoplasm [63]. In the present study, PTR4, a member of the NRT1/PTR family, was also identified on the vacuolar membrane. PTR4 was implicated in the transport of Se amino acids from roots to shoots, further elucidating the role of this transporter family in Se metabolism and transport in plants (Figure 12).
Sulfuration of molybdenum cofactors is an important step to activate aldehyde oxidase. Molybdenum containing aldehyde oxidase is the key enzyme that catalyzes the final step of ABA biosynthesis in plants [64]. ABA induces the transcription of the GR gene [65]. Se metabolism in plants was highly correlated with endogenous stress-related plant phytohormones [66]. Wang’s study showed that compared with the single Se treatment, Se+ABA treatment significantly promoted the Se absorption in sugar beet and promoted more S/Se absorption and transport to chloroplasts, and there were more species of organic Se [38]. MOCOS is a molybdenum cofactor sulfide enzyme that promotes the biosynthesis of ABA, thus promoting the synthesis of GR, making plants produce more GSH, and participating in the transformation of SeO32− to Se2− (Figure 12).
Brassinosteroids are a class of polyhydroxysteroid plant hormones. Rice brassinosteroid-insensitive 1 (BRI1)-related receptor kinases (OsBAKs) are receptor kinases located on the plasma membrane (PM), belonging to the leucine-rich repeat (LRR) receptor kinase subfamily [67]. Liu found that BAK1 was an important mediator of transmembrane signal transduction regulating plant development and immunity in Arabidopsis [68]. Kim cloned a BAK1-binding protein, BAK1-related receptor-like kinase 1 (BARK1), which specifically binds BAK1 and its homologs. The results showed that the gene could be widely expressed in most plant tissues, especially in the xylem vascular system of primary and lateral roots and mature pollen [69]. In the present study, BAK1 is a brassinosteroid-insensitive 1-related receptor kinase 1, which mediates the transport of Se from the roots to shoots (Figure 12).
Cyclic nucleotide-gated ion channel (CNGC) is a key nonselective cation channel for signal transduction [70]. It was reported as a Ca2+ conduction ion channel, which can regulate a variety of physiological reactions in plants. Its subcellular localization is mainly on the plasma membrane. In addition, the localization of mitochondria, nuclei, and vacuoles has also been confirmed [71]. Pan’s study found that the molecular switch of calcium concentration regulation on or off calcium channels was composed of pollen tube-specific cyclic nucleotide-gated channels (CNGC18, CNGC8, and CNGC7) and calmodulin 2 (CAM2) [72]. In this study, CNGC1 is a cyclic nucleotide-gated ion channel, and its high expression mediates the physiological and biochemical response of dandelion in the transport of Se to plant root cells under Na2SeO3 treatment (Figure 12). In contrast to previous studies [12,34,48,50,52], the identification of these genes in dandelions treated with selenium offers valuable insights into the molecular mechanisms underlying selenium absorption and transport in crops, thus providing new supplements to the existing knowledge in this field.

5. Conclusions

The application of Na2SeO3 significantly impacts the growth, nutritional quality, and antioxidant system of T. mongolicum. Compared with the control group, high-concentration Se(>4 mg/L) treatment reduced the chlorophyll content of dandelion and increased the content of soluble sugar, soluble protein, flavonoids, total phenols, and Vc. Following treatment with Na2SeO3, the activities of SOD and POD in dandelion were elevated compared to those of the control. However, the content of MDA was only significantly increased after exposure to 8 mg/L and 12 mg/L Na2SeO3. Analysis of Se species reveals the presence of Se(IV), Se(VI), SeCys2, SeMet, and MeSeCys, with SeMet being the primary organic Se species. Transcriptome analysis further highlights the strong correlation between Se metabolism and genes such as ABC11B, C7317, PTR4, and MOCOS. ABC11B facilitates Se transport across the plasma membrane into cells, C7317 was involved in ROS scavenging in response to Se exposure, PTR4 mediates the vacuolar transport of selenoamino acids, and MOCOS indirectly participates in the conversion of SO32− to Se2−. Additionally, BAK1 regulates Se transport from roots to shoots, while CNGC1 mediated Se uptake into root cells. Collectively, these findings enhance our understanding of the molecular mechanisms underlying Se absorption and organic Se transformation in plants, offering valuable insights into Se uptake and metabolism in agricultural crops.

Supplementary Materials

The following supporting information can be downloaded at: https://www.mdpi.com/article/10.3390/horticulturae10030209/s1. Figure S1: Growth morphology of dandelion hydroponic treated seedlings after 15 days; Figure S2: Sample correlation heatmap of transcriptome data of dandelion treated with different concentrations of Na2SeO3; Figure S3. Distribution and quantity of DEGs in different modules; Figure S4. Enrichment analysis results of hot genes in magenta, turquoise, and red modules. (a) Figure shows the GO enrichment results of magenta module. (b) GO enrichment of turquoise module. (c) GO enrichment of red module; Figure S5. Enrichment analysis results of hot genes in magenta, turquoise, and red modules. (a) KEGG results of DEGs in the magenta module. (b) KEGG enrichment of DEGs in the turquoise module. (c) KEGG enrichment of DEGs in the red modules; Table S1: Concentration and sampling time of dandelion samples treated with Na2SeO3; Table S2: Transcriptome data statistics of dandelion treated with different concentrations of Na2SeO3.

Author Contributions

Conceptualization, supervision, and writing—original draft preparation, H.C.; methodology, software, and writing—original draft preparation, S.C. (Siyuan Chang); methodology, X.S.; formal analysis, Y.C.; project administration, X.C.; validation and writing—review and editing, L.L.; project administration, S.C. (Shuiyuan Cheng). All authors have read and agreed to the published version of the manuscript.

Funding

This research was funded by the Special Project of the Central Government for Science and Technology Development of Hubei Province (CN), Hubei Provincial Department of Science and Technology (No. 2019ABA113). The research was also supported by the Horizontal science and technology of Enshi Se-De Bioengineering Co., Ltd., grant number se1-202102.

Data Availability Statement

Data will be made available upon request.

Conflicts of Interest

Author Xin Cong was employed by the company Horizontal science and technology of Enshi Se-De Bioengineering Co., Ltd. The remaining authors declare that the research was conducted in the absence of any commercial or financial relationships that could be construed as a potential conflict of interest.

References

  1. Schweizer, U.; Fradejas-Villar, N. Why 21? The significance of selenoproteins for human health revealed by inborn errors of metabolism. FASEB J. 2016, 30, 3669–3681. [Google Scholar] [CrossRef]
  2. Wesselink, E.; Koekkoek, W.A.C.; Grefte, S.; Witkamp, R.F.; van Zanten, A.R.H. Feeding mitochondria: Potential role of nutritional components to improve critical illness convalescence. Clin. Nutr. 2019, 38, 982–995. [Google Scholar] [CrossRef] [PubMed]
  3. Deng, H.; Liu, H.; Yang, Z.; Bao, M.; Lin, X.; Han, J.; Qu, C. Progress of selenium deficiency in the pathogenesis of arthropathies and selenium supplement for their treatment. Biol. Trace Elem. Res. 2021, 200, 4238–4249. [Google Scholar] [CrossRef] [PubMed]
  4. Ferreira, R.L.U.; Sena-Evangelista, K.C.M.; de Azevedo, E.P.; Pinheiro, F.I.; Cobucci, R.N.; Pedrosa, L.F.C. Selenium in human health and gut microflora: Bioavailability of selenocompounds and relationship with diseases. Front. Nutr. 2021, 8, 685317. [Google Scholar] [CrossRef] [PubMed]
  5. Radomska, D.; Czarnomysy, R.; Radomski, D.; Bielawska, A.; Bielawski, K. Selenium as a bioactive micronutrient in the human diet and its cancer chemopreventive activity. Nutrients 2021, 13, 1649. [Google Scholar] [CrossRef] [PubMed]
  6. Danso, O.P.; Asante-Badu, B.; Zhang, Z.; Song, J.; Wang, Z.; Yin, X.; Zhu, R. Selenium biofortification: Strategies, progress and challenges. Agriculture 2023, 13, 416. [Google Scholar] [CrossRef]
  7. Gong, R.; Ai, C.; Zhang, B.; Cheng, X. Effect of selenite on organic selenium speciation and selenium bioaccessibility in rice grains of two Se-enriched rice cultivars. Food Chem. 2018, 264, 443–448. [Google Scholar] [CrossRef]
  8. Nothstein, A.K.; Eiche, E.; Riemann, M.; Nick, P.; Winkel, L.H.E.; Göttlicher, J.; Steininger, R.; Brendel, R.; Von Brasch, M.; Konrad, G. Tracking se assimilation and speciation through the rice plant–nutrient competition, toxicity and distribution. PLoS ONE 2016, 11, e0152081. [Google Scholar] [CrossRef]
  9. Schiavon, M.; Pilon-Smits, E.A.H. Selenium biofortification and phytoremediation phytotechnologies: A review. J. Environ. Qual. 2017, 46, 10–19. [Google Scholar] [CrossRef]
  10. El Mehdawi, A.F.; Jiang, Y.; Guignardi, Z.S.; Esmat, A.; Pilon, M.; Pilon-Smits, E.A.H.; Schiavon, M. Influence of sulfate supply on selenium uptake dynamics and expression of sulfate/selenate transporters in selenium hyperaccumulator and nonhyperaccumulator Brassicaceae. New Phytol. 2017, 217, 194–205. [Google Scholar] [CrossRef]
  11. Bai, B.; Zhang, S.; Suo, X.; Chen, W.; Shen, Y. Selenite uptake by Medicago sativa L. roots. Grassl. Sci. 2022, 68, 328–335. [Google Scholar] [CrossRef]
  12. Li, L.; Wu, S.; Wang, S.; Shi, X.; Cheng, S.; Cheng, H. Molecular mechanism of exogenous selenium affecting the nutritional quality, species and content of organic selenium in mustard. Agronomy 2023, 13, 1425. [Google Scholar] [CrossRef]
  13. Hossain, A.; Skalicky, M.; Brestic, M.; Maitra, S.; Sarkar, S.; Ahmad, Z.; Vemuri, H.; Garai, S.; Mondal, M.; Bhatt, R.; et al. Selenium biofortification: Roles, mechanisms, responses and prospects. Molecules 2021, 26, 881. [Google Scholar] [CrossRef]
  14. Gao, D. Analysis of nutritional components of Taraxacum mongolicum and its antibacterial activity. Pharmacogn. J. 2010, 2, 502–505. [Google Scholar] [CrossRef]
  15. Zhang, S.; Li, C.; Gu, W.; Qiu, R.; Chao, J.; Pei, L.; Ma, L.; Guo, Y.; Tian, R. Metabolomics analysis of dandelions from different geographical regions in China. Phytochem. Anal. 2021, 32, 899–906. [Google Scholar] [CrossRef] [PubMed]
  16. Duan, L.; Zhang, C.; Zhao, Y.; Chang, Y.; Guo, L. Comparison of bioactive phenolic compounds and antioxidant activities of different parts of Taraxacum mongolicum. Molecules 2020, 25, 3260. [Google Scholar] [CrossRef] [PubMed]
  17. Zhang, S.; Song, Z.; Shi, L.; Zhou, L.; Zhang, J.; Cui, J.; Li, Y.; Jin, D.Q.; Ohizumi, Y.; Xu, J.; et al. A dandelion polysaccharide and its selenium nanoparticles: Structure features and evaluation of anti-tumor activity in zebrafish models. Carbohydr. Polym. 2021, 270, 118365. [Google Scholar] [CrossRef] [PubMed]
  18. Islam, M.Z.; Park, B.J.; Kang, H.M.; Lee, Y.T. Influence of selenium biofortification on the bioactive compounds and antioxidant activity of wheat microgreen extract. Food Chem. 2019, 309, 125763. [Google Scholar] [CrossRef]
  19. Lichtenthaler, H.K.; Wellburn, A.R. Determinations of total carotenoids and chlorophylls a and b of leaf extracts in different solvents. Biochem. Soc. Trans. 1983, 603, 591–592. [Google Scholar] [CrossRef]
  20. Matos Reyes, M.N.; Cervera, M.L.; de la Guardia, M. Determination of total Sb, Se, Te, and Bi and evaluation of their inorganic species in garlic by hydride generation atomic fluorescence spectrometry. Anal. Bioanal. Chem. 2009, 394, 1557–1562. [Google Scholar] [CrossRef]
  21. Goenaga Infante, H.; Arias Borrego, A.; Peachey, E.; Hearn, R.; O’Connor, G.; García Barrera, T.; Gómez Ariza, J.L. Study of the effect of sample preparation and cooking on the selenium speciation of selenized potatoes by HPLC with ICP-MS and electrospray ionization MS/MS. J. Agric. Food Chem. 2008, 57, 38–45. [Google Scholar] [CrossRef]
  22. Shumate, A.; Wong, B.; Pertea, G.; Pertea, M. Improved transcriptome assembly using a hybrid of long and short reads with StringTie. Biorxiv Bioinform. 2021, 18, e1009730. [Google Scholar] [CrossRef]
  23. Saleem, M.; Fariduddin, Q. Novel mechanistic insights of selenium induced microscopic, histochemical and physio-biochemical changes in tomato (Solanum lycopersicum L.) plant. An account of beneficiality or toxicity. J. Hazard. Mater. 2022, 434, 128830. [Google Scholar] [CrossRef] [PubMed]
  24. Han, D.; Tu, S.; Dai, Z.; Huang, W.; Jia, W.; Xu, Z.; Shao, H. Comparison of selenite and selenate in alleviation of drought stress in Nicotiana tabacum L. Chemosphere 2022, 287, 132136. [Google Scholar] [CrossRef] [PubMed]
  25. Bai, B.; Wang, Z.; Gao, L.; Chen, W.; Shen, Y. Effects of selenite on the growth of alfalfa (Medicago sativa L. cv. Sadie 7) and related physiological mechanisms. Acta Physiol. Plant. 2019, 41, 78. [Google Scholar] [CrossRef]
  26. Yin, H.; Qi, Z.; Li, M.; Ahammed, G.J.; Chu, X.; Zhou, J. Selenium forms and methods of application differentially modulate plant growth, photosynthesis, stress tolerance, selenium content and speciation in Oryza sativa L. Ecotoxicol. Environ. Saf. 2019, 169, 911–917. [Google Scholar] [CrossRef] [PubMed]
  27. Gui, J.-Y.; Rao, S.; Gou, Y.; Xu, F.; Cheng, S. Comparative study of the effects of selenium yeast and sodium selenite on selenium content and nutrient quality in broccoli florets (Brassica oleracea L. var. italica). J. Sci. Food Agric. 2022, 102, 1707–1718. [Google Scholar] [CrossRef] [PubMed]
  28. He, R.; Gao, M.; Shi, R.; Song, S.; Zhang, Y.; Su, W.; Liu, H. The combination of selenium and LED light quality affects growth and nutritional properties of broccoli sprouts. Molecules 2020, 25, 4788. [Google Scholar] [CrossRef] [PubMed]
  29. Xu, X.; Wang, J.; Wu, H.; Yuan, Q.; Wang, J.; Cui, J.; Lin, A. Effects of selenium fertilizer application and tomato varieties on tomato fruit quality: A meta-analysis. Sci. Hortic. 2022, 304, 111242. [Google Scholar] [CrossRef]
  30. Wang, K.; Yuan, Y.; Luo, X.; Shen, Z.; Huang, Y.; Zhou, H.; Gao, X. Effects of exogenous selenium application on nutritional quality and metabolomic characteristics of mung bean (Vigna radiata L.). Front. Plant Sci. 2022, 13, 961447. [Google Scholar] [CrossRef]
  31. Zhu, Z.; Zhang, Y.; Liu, J.; Chen, Y.; Zhang, X. Exploring the effects of selenium treatment on the nutritional quality of tomato fruit. Food Chem. 2018, 252, 9–15. [Google Scholar] [CrossRef] [PubMed]
  32. Li, D.; Zhou, C.; Zhang, J.; An, Q.; Wu, Y.; Li, J.; Pan, C. Nanoselenium foliar applications enhance the nutrient quality of pepper by activating the capsaicinoid synthetic pathway. J. Agric. Food Chem. 2020, 68, 9888–9895. [Google Scholar] [CrossRef]
  33. Luo, L.; Zhang, J.; Zhang, K.; Wen, Q.; Ming, K.; Xiong, H.; Ning, F. Peanut selenium distribution, concentration, speciation, and effects on proteins after exogenous selenium biofortification. Food Chem. 2021, 354, 129515. [Google Scholar] [CrossRef] [PubMed]
  34. Li, L.; Wang, S.; Wu, S.; Rao, S.; Li, L.; Cheng, S.; Cheng, H. Morphological and physiological indicators and transcriptome analyses reveal the mechanism of selenium multilevel mitigation of cadmium damage in Brassica juncea. Plants 2023, 12, 1583. [Google Scholar] [CrossRef] [PubMed]
  35. Hasanuzzaman, M.; Parvin, K.; Bardhan, K.; Nahar, K.; Anee, T.I.; Masud, A.A.C.; Fotopoulos, V. Biostimulants for the regulation of reactive oxygen species metabolism in plants under abiotic stress. Cells 2021, 10, 2537. [Google Scholar] [CrossRef] [PubMed]
  36. Santos, E.F.; Kondo Santini, J.M.; Paixão, A.P.; Júnior, E.F.; Lavres, J.; Campos, M.; Reis, A.R.d. Physiological highlights of manganese toxicity symptoms in soybean plants: Mn toxicity responses. Plant Physiol. Biochem. 2017, 113, 6–19. [Google Scholar] [CrossRef]
  37. Michalak, M. Plant derived antioxidants: Significance in skin health and the ageing process. Int. J. Mol. Sci. 2022, 23, 585. [Google Scholar] [CrossRef]
  38. Wang, X.; Lu, W.; Zhao, Z.; Hao, W.; Du, R.; Li, Z.; Wang, Z.; Lv, X.; Wang, J.; Liang, D.; et al. Abscisic acid promotes selenium absorption, metabolism and toxicity via stress-related phytohormones regulation in Cyphomandra betacea Sendt. (Solanum betaceum Cav.). J. Hazard. Mater. 2023, 461, 132642. [Google Scholar] [CrossRef]
  39. Khanna, K.; Kumar, P.; Ohri, P.; Bhardwaj, R. Harnessing the role of selenium in soil–plant-microbe ecosystem: Ecophysiological mechanisms and future prospects. Plant Growth Regul. 2022, 100, 197–217. [Google Scholar] [CrossRef]
  40. Mroczek-Zdyrska, M.; Strubińska, J.; Hanaka, A. Selenium improves physiological parameters and alleviates oxidative stress in shoots of lead-exposed Vicia faba L. minor plants grown under phosphorus-deficient conditions. J. Plant Growth Regul. 2016, 36, 186–199. [Google Scholar] [CrossRef]
  41. Silva, V.M.; Rimoldi Tavanti, R.F.; Gratão, P.L.; Alcock, T.D.; Reis, A.R.D. Selenate and selenite affect photosynthetic pigments and ROS scavenging through distinct mechanisms in cowpea (Vigna unguiculata (L.) walp) plants. Ecotoxicol. Environ. Saf. 2020, 201, 110777. [Google Scholar] [CrossRef]
  42. Liu, Z.; Wang, Q.; Zou, D.; Yang, Y. Effects of selenite on growth, photosynthesis and antioxidant system in seaweeds, Ulva fasciata (Chlorophyta) and Gracilaria lemaneiformis (Rhodophyta). Algal Res. 2018, 36, 115–124. [Google Scholar] [CrossRef]
  43. Hosseinzadeh Rostam Kalaei, M.; Abdossi, V.; Danaee, E. Evaluation of foliar application of selenium and flowering stages on selected properties of Iranian Borage as a medicinal plant. Sci. Rep. 2022, 12, 12568. [Google Scholar] [CrossRef]
  44. Qu, L.; Xu, J.; Dai, Z.; Elyamine, A.M.; Huang, W.; Han, D.; Dang, B.; Xu, Z.; Jia, W. Selenium in soil-plant system: Transport, detoxification and bioremediation. J. Hazard. Mater. 2023, 452, 131272. [Google Scholar] [CrossRef] [PubMed]
  45. Kataoka, T.; Hayashi, N.; Yamaya, T.; Takahashi, H. Root-to-shoot transport of sulfate in arabidopsis. Evidence for the role of SULTR3;5 as a component of low-affinity sulfate transport system in the root vasculature. Plant Physiol. 2004, 136, 4198–4204. [Google Scholar] [CrossRef] [PubMed]
  46. Trippe, R.C.; Pilon-Smits, E.A.H. Selenium transport and metabolism in plants: Phytoremediation and biofortification implications. J. Hazard. Mater. 2020, 404, 124178. [Google Scholar] [CrossRef] [PubMed]
  47. Gupta, M.; Gupta, S. An overview of selenium uptake, metabolism, and toxicity in plants. Front. Plant Sci. 2017, 7, 2074. [Google Scholar] [CrossRef]
  48. Cheng, H.; Li, L.; Dong, J.; Wang, S.; Wu, S.; Rao, S.; Li, L.; Cheng, S.; Li, L. Transcriptome and physiological determination reveal the effects of selenite on the growth and selenium metabolism in mung bean sprouts. Food Res. Int. 2023, 169, 112880. [Google Scholar] [CrossRef] [PubMed]
  49. Dou, L.; Tian, Z.; Zhao, Q.; Xu, M.; Zhu, Y.; Luo, X.; Qiao, X.; Ren, R.; Zhang, X.; Li, H. Transcriptomic characterization of the effects of selenium on maize seedling growth. Front. Plant Sci. 2021, 12, 737029. [Google Scholar] [CrossRef] [PubMed]
  50. Rao, S.; Yu, T.; Cong, X.; Lai, X.; Xiang, J.; Cao, J.; Liao, X.; Gou, Y.; Chao, W.; Xue, H.; et al. Transcriptome, proteome, and metabolome reveal the mechanism of tolerance to selenate toxicity in Cardamine violifolia. J. Hazard. Mater. 2021, 406, 124283. [Google Scholar] [CrossRef] [PubMed]
  51. Thomas, C.; Aller, S.G.; Beis, K.; Carpenter, E.P.; Chang, G.; Chen, L.; Dassa, E.; Dean, M.; Duong Van Hoa, F.; Ekiert, D.; et al. Structural and functional diversity calls for a new classification of ABC transporters. FEBS Lett. 2020, 594, 3767–3775. [Google Scholar] [CrossRef] [PubMed]
  52. Li, L.; Xiong, Y.; Wang, Y.; Wu, S.; Xiao, C.; Wang, S.; Cheng, S.; Cheng, H. Effect of nano-selenium on nutritional quality of cowpea and response of ABCC transporter family. Molecules 2023, 28, 1398. [Google Scholar] [CrossRef] [PubMed]
  53. Chen, Q.; Yu, L.; Chao, W.; Xiang, J.; Yang, X.; Ye, J.; Liao, X.; Zhou, X.; Rao, S.; Cheng, S.; et al. Comparative physiological and transcriptome analysis reveals the potential mechanism of selenium accumulation and tolerance to selenate toxicity of Broussonetia papyrifera. Tree Physiol. 2022, 42, 2578–2595. [Google Scholar] [CrossRef] [PubMed]
  54. Wang, Q.; Zhang, Y.; Hu, H.; Hu, J.; Xiang, M.; Yang, Q. Comparative proteomics analysis of selenium responses in selenium-enriched alfalfa (Medicago sativa L.) leaves. Plant Physiol. Biochem. 2021, 165, 265–273. [Google Scholar] [CrossRef] [PubMed]
  55. Zheng, Q.; Guo, L.; Huang, J.; Hao, X.; Li, X.; Li, N.; Wang, Y.; Zhang, K.; Wang, X.; Wang, L.; et al. Comparative transcriptomics provides novel insights into the mechanisms of selenium accumulation and transportation in tea cultivars (Camellia sinensis (L.) O. Kuntze). Front. Plant Sci. 2023, 14, 1268537. [Google Scholar] [CrossRef] [PubMed]
  56. Cho, M.; Cho, H. The function of ABCB transporters in auxin transport. Plant Signal. Behav. 2013, 8, e22990. [Google Scholar] [CrossRef]
  57. Shi, J.; Zhang, F.; Wang, Y.; Zhang, S.; Wang, F.; Ma, Y. The cytochrome P450 gene, MdCYP716B1, is involved in regulating plant growth and anthracnose resistance in apple. Plant Sci. 2023, 335, 111832. [Google Scholar] [CrossRef]
  58. Zheng, X.; Li, P.; Lu, X. Research advances in cytochrome P450-catalysed pharmaceutical terpenoid biosynthesis in plants. J. Exp. Bot. 2019, 70, 4619–4630. [Google Scholar] [CrossRef]
  59. Singh, A.; Panwar, R.; Mittal, P.; Hassan, M.I.; Singh, I.K. Plant cytochrome P450s: Role in stress tolerance and potential applications for human welfare. Int. J. Biol. Macromol. 2021, 184, 874–886. [Google Scholar] [CrossRef] [PubMed]
  60. Hu, Y.; Li, W.; Xu, Y.; Li, G.; Liao, Y.; Fu, F. Differential expression of candidate genes for lignin biosynthesis under drought stress in maize leaves. J. Appl. Genet. 2009, 50, 213–223. [Google Scholar] [CrossRef] [PubMed]
  61. Corratgé-Faillie, C.; Lacombe, B. Substrate (un)specificity of arabidopsis NRT1/PTR FAMILY (NPF) proteins. J. Exp. Bot. 2017, 68, 3107–3113. [Google Scholar] [CrossRef]
  62. Zhang, L.; Hu, B.; Deng, K.; Gao, X.; Sun, G.; Zhang, Z.; Li, P.; Wang, W.; Li, H.; Zhang, Z.; et al. NRT1.1B improves selenium concentrations in rice grains by facilitating selenomethinone translocation. Plant Biotechnol. J. 2019, 17, 1058–1068. [Google Scholar] [CrossRef] [PubMed]
  63. Weichert, A.; Brinkmann, C.; Komarova, N.Y.; Dietrich, D.; Thor, K.; Meier, S.; Suter Grotemeyer, M.; Rentsch, D. AtPTR4 and AtPTR6 are differentially expressed, tonoplast-localized members of the peptide transporter/nitrate transporter 1 (PTR/NRT1) family. Planta 2011, 235, 311–323. [Google Scholar] [CrossRef] [PubMed]
  64. Huang, P.; Chen, J.; Wang, S. Tissue specific regulation of rice molybdenum cofactor sulfurase gene in response to salt stress and ABA. Acta Physiol. Plant. 2009, 31, 545–551. [Google Scholar] [CrossRef]
  65. Contour-Ansel, D.; Torres-Franklin, M.L.; Cruz De Carvalho, M.H.; D’Arcy-Lameta, A.; Zuily-Fodil, Y. Glutathione reductase in leaves of cowpea: Cloning of two cDNAs, expression and enzymatic activity under progressive drought stress, desiccation and abscisic acid treatment. Ann. Bot. 2006, 98, 1279–1287. [Google Scholar] [CrossRef] [PubMed]
  66. Schiavon, M.; Pilon-Smits, E.A.H. The fascinating facets of plant selenium accumulation-biochemistry, physiology, evolution and ecology. New Phytol. 2016, 213, 1582–1596. [Google Scholar] [CrossRef] [PubMed]
  67. Du, H.; Yong, R.; Zhang, J.; Cai, G.; Wang, R.; Li, J.; Wang, Y.; Zhang, H.; Gao, X.; Huang, J. OsBAK2/OsSERK2 expression is repressed by OsBZR1 to modulate brassinosteroid response and grain length in rice. J. Exp. Bot. 2023, 74, 4978–4993. [Google Scholar] [CrossRef] [PubMed]
  68. Liu, J.; Chen, S.; Chen, L.; Zhou, Q.; Wang, M.; Feng, D.; Li, J.; Wang, J.; Wang, H.; Liu, B. BIK1 cooperates with BAK1 to regulate constitutive immunity and cell death in Arabidopsis. J. Integr. Plant Biol. 2017, 59, 234–239. [Google Scholar] [CrossRef]
  69. Kim, M.H.; Kim, Y.; Kim, J.W.; Lee, H.S.; Lee, W.S.; Kim, S.K.; Wang, Z.; Kim, S.H. Identification of arabidopsis BAK1-associating receptor-like kinase 1 (BARK1) and characterization of its gene expression and brassinosteroid-regulated root phenotypes. Plant Cell Physiol. 2013, 54, 1620–1634. [Google Scholar] [CrossRef]
  70. Marchesi, A.; Gao, X.; Adaixo, R.; Rheinberger, J.; Stahlberg, H.; Nimigean, C.; Scheuring, S. An iris diaphragm mechanism to gate a cyclic nucleotide-gated ion channel. Nat. Commun. 2018, 9, 3978. [Google Scholar] [CrossRef]
  71. Chakraborty, S.; Toyota, M.; Moeder, W.; Chin, K.; Fortuna, A.; Champigny, M.; Vanneste, S.; Gilroy, S.; Beeckman, T.; Nambara, E.; et al. Cyclic Nucleotide-Gated Ion Channel 2 modulates auxin homeostasis and signaling. Plant Physiol. 2021, 187, 1690–1703. [Google Scholar] [CrossRef] [PubMed]
  72. Pan, Y.; Chai, X.; Gao, Q.; Zhou, L.; Zhang, S.; Li, L.; Luan, S. Dynamic interactions of plant CNGC subunits and calmodulins drive oscillatory Ca2+ channel activities. Dev. Cell 2019, 48, 710–725. [Google Scholar] [CrossRef] [PubMed]
Figure 1. Effects of different concentrations of Na2SeO3 on plant height, root length, and biomass of dandelion. (a) Growth status of dandelion under different concentrations of Na2SeO3 treatment. (b) Fresh weight of whole plant. (c) Length of shoots and roots. The error bar represents the standard error of the mean (n = 3), and different letters represent the difference level between the mean values of Duncan’s new complex range test (p < 0.05).
Horticulturae 10 00209 g001
Figure 2. Effects of different concentrations of Na2SeO3 on the contents of total Se and organic Se in dandelion seedlings. (a) Total Se content in dandelion seedlings. (b) Content of different Se species in dandelion seedlings. The error bar represents the standard error of the mean (n = 3), and different letters represent the difference level between the mean values of Duncan’s new complex range test (p < 0.05).
Horticulturae 10 00209 g002
Figure 3. The effects of different concentrations of Na2SeO3 on the content of photosynthetic pigments and carotenoids in dandelion leaves. (a) Chlorophyll a content. (b) Chlorophyll b content. (c) Carotenoid content. (d) Total chlorophyll content. The error bar represents the standard error of the mean (n = 3), and different letters represent the difference level between the mean values of Duncan’s new complex range test (p < 0.05).
Horticulturae 10 00209 g003
Figure 4. The impact of varying concentrations of Na2SeO3 on the levels of photosynthetic pigments and carotenoids within dandelion foliage. (a) Chlorophyll a content. (b) Chlorophyll b content. (c) Carotenoid content. (d) Total chlorophyll content. (e) Total vitamin C content. (f) Total phenolic content. The error bar represents the standard error of the mean (n = 3), and different letters represent the difference level between the mean values of Duncan’s new complex range test (p < 0.05).
Horticulturae 10 00209 g004
Figure 5. The effects of different concentrations of Na2SeO3 on MDA content of dandelion seedlings. The error bar represents the standard error of the mean (n = 3), and different letters represent the difference level between the mean values of Duncan’s new complex range test (p < 0.05).
Horticulturae 10 00209 g005
Figure 6. The influence of various concentrations of Na2SeO3 on the activity of antioxidant enzymes in dandelion seedlings. (a) GSH activity. (b) SOD activity. (c) POD activity. (d) CAT activity. The error bar represents the standard error of the mean (n = 3), and different letters represent the difference level between the mean values of Duncan’s new complex range test (p < 0.05).
Horticulturae 10 00209 g006
Figure 7. Statistics of number of differentially expressed genes. The blue bars represent the total differentially expressed genes, orange represents the downregulated differentially expressed genes, and yellow represents the number of upregulated differentially expressed genes.
Horticulturae 10 00209 g007
Figure 8. WGCNA and module–trait correlation analysis. (a) The fitting index (R2) of the scale-free network under various soft thresholds, where the red line corresponds to R2 = 0.9. (b) The average connectivity under different soft thresholds. (c) The WGCNA is constructed using the dynamic tree-cutting method, wherein different modules are distinguished by being marked with various colors. (d) Heatmap showing the correlation between different modules constructed through WGCNA.
Horticulturae 10 00209 g008
Figure 9. WGCNA analysis of the correlation between Se species and expression modules of transcriptome in various treatment groups. (a) The correlation between modules and traits. (b) Direct correlation coefficient between different processed samples and expression modules. The left side uses different color blocks to represent different modules.
Horticulturae 10 00209 g009
Figure 10. The expression of genes related to Se distribution in dandelion seedlings was shown in the magenta, turquoise, and red modules. (a) The gene expression pattern in the magenta module corresponded to Se species and contents. (b) The expression pattern of genes referred to Se species and contents in the turquoise modules. (c) The expression pattern of genes referred to Se species and contents in the red modules.
Horticulturae 10 00209 g010
Figure 11. The relationship between Se species and gene transcription patterns in the magenta, turquoise, and red modules is depicted through a correlation heatmap and network analysis. (a) The heatmap shows the correlation coefficient between different Se species and module characteristic genes. The white asterisk represents the significant level of correlation analysis, where * represents <0.5 and ** represents <0.1. (b) Additionally, a regulatory network has been created to illustrate how hot genes are regulated by different Se species in dandelion seedlings. The positive correlation threshold was set to be greater than or equal to 0.945, the negative correlation threshold was set to be less than or equal to −0.975, and the p-value threshold was less than 0.05, R version 3.6.1, igraph1.2.6.
Horticulturae 10 00209 g011
Figure 12. Mechanism of absorption, transformation, and transport of Na2SeO3 in hydroponic dandelion. PHT, Pi transporter; NIP, nodulin 26-like intrinsic aquaporin proteins; SULTRs1:1, sulfate transporter1:1; SULTRs1:2, sulfate transporter1:2; APS, adenosine triphosphate sulfurylase; APR, adenosine 5′-phosphosulfate reductase; SIR: sulfite reductase; CS, cysteine synthase; SL, cysteine lyase; SMT, selenocysteine methyltransferase; CBL, cystathionine β-lyase; NRT: nitrate transporters; MMT, methionine methyltransferase; MTR, methionine synthase; GSH, glutathione; SeCys, selenocysteine; MeSeCys, methyl selenocysteine; MeSeMet, methyl selenomethionine; DMSe, dimethylselenium; DMDSe, dimethyldiselenide; ABC11B, ABC transporter C family member 11; C7317, cytochrome P450 736A117; PTR4, protein NRT1/PTR family 5.3; MOCOS, molybdenum cofactor sulfurase; BAK1, brassinosteroid-insensitive 1-associated receptor kinase 1; CNGC1, cyclic nucleotide-gated ion channel 1.
Horticulturae 10 00209 g012
Table 1. The content and proportion of Se species in dandelion seedlings after Na2SeO3 treatment.
Na2SeO3 Concentration (mg/L)Content of Different Se Species (mg/kg DW)
SeCys2MeSeCysSe4+SeMetSe6+
00.0039 ± 0.0008 d0.0018 ± 0.0009 b0.0005 ± 0.0002 c0.0019 ± 0.0005 d0.0008 ± 0.0003 d
20.044 ± 0.0028 c0.0398 ± 0.0004 b0.0024 ± 0.002 c0.0947 ± 0.0024 c0.0028 ± 0.0002 d
40.1866 ± 0.0144 a0.178 ± 0.0207 a0.0126 ± 0.0031 b0.2808 ± 0.0159 b0.0146 ± 0.0015 c
80.1771 ± 0.0413 ab0.1888 ± 0.0404 a0.0695 ± 0.0079 a0.4827 ± 0.0399 a0.0937 ± 0.0046 a
120.1488 ± 0.0049 b0.16 ± 0.0187 a0.0651 ± 0.0057 a0.2939 ± 0.0148 b0.0786 ± 0.0038 b
Note: The lowercase letters a–d indicate the significant differences in the content of different Se species in dandelion after treatment with different concentrations of Na2SeO3, with a p-value < 0.05. The percentage in the table is the proportion of each Se species to the total Se content.
Disclaimer/Publisher’s Note: The statements, opinions and data contained in all publications are solely those of the individual author(s) and contributor(s) and not of MDPI and/or the editor(s). MDPI and/or the editor(s) disclaim responsibility for any injury to people or property resulting from any ideas, methods, instructions or products referred to in the content.