Article

Comprehensive Assessment of Coffee Varieties (Coffea arabica L.; Coffea canephora L.) from Coastal, Andean, and Amazonian Regions of Ecuador; A Holistic Evaluation of Metabolism, Antioxidant Capacity and Sensory Attributes

by
Raluca A. Mihai
1,*,
Diana C. Ortiz-Pillajo
1,
Karoline M. Iturralde-Proaño
1,
Mónica Y. Vinueza-Pullotasig
1,
Leonardo A. Sisa-Tolagasí
1,
Mary L. Villares-Ledesma
1,
Erly J. Melo-Heras
1,
Nelson S. Cubi-Insuaste
1 and
Rodica D. Catana
2
1
Army Scientific and Technological Research Center—CICTE, Department of Life Science and Agriculture, Universidad de Las Fuerzas Armadas—ESPE, Av. General Rumiñahui s/n y, Sangolqui 171103, Ecuador
2
Institute of Biology Bucharest of Romanian Academy, 296 Splaiul Independentei, 060031 Bucharest, Romania
*
Author to whom correspondence should be addressed.
Horticulturae 2024, 10(3), 200; https://doi.org/10.3390/horticulturae10030200
Submission received: 10 January 2024 / Revised: 14 February 2024 / Accepted: 14 February 2024 / Published: 21 February 2024
(This article belongs to the Special Issue Fruits Quality and Sensory Analysis)

Abstract

:
In Ecuador, the cultivation of two main coffee species, Coffea arabica L. and Coffea canephora L., holds significant economic, environmental, social, and public health importance. C. arabica displays wide adaptability to diverse growing conditions, while C. canephora exhibits less versatility in adaptation but is superior in metabolite production in the ripe fruits (with the potential to double caffeine content). Our hypothesis revolves around the differences in the production of secondary metabolites, antioxidant capacity and sensory attributes based on the environmental conditions of the two studies species cultivated in Ecuador. The assessment of the metabolic composition of high-altitude coffee grown in Ecuador involved the determination of secondary metabolites and quantification of the antioxidant capacity through the 2,2-diphenyl-1-picrylhydrazyl assay, 2,2′-azino-bis (3-ethylbenzothiazoline-6-sulfonic acid) quenching assay, and ferric reducing antioxidant power assay. In the case of C. arabica, a high positive correlation was observed for total phenolic content (TPC) (4.188 ± 0.029 mg gallic acid equivalent (GAE)/g dry weight (dw)) and total flavonoid content (TFC) (0.442 ± 0.001 mg quercetin (QE)/g dw) with the antioxidant activity determined through ABTS free-radical-scavenging activity (23.179 ± 1.802 µmol Trolox (TEAC)/g dw) (R = 0.68), a medium correlation with DPPH radical-scavenging activity (65.875 ± 1.129 µmol TEAC/g dw) (R = 0.57), and a low correlation with ferric reducing antioxidant power assay ((100.164 ± 0.332 µmol Fe2+/g dw) (R = 0.27). A high correlation (R > 90) was observed for the values evaluated in the case of C. canephora. The caffeine content was high in C. arabica beans from Los Ríos province and in C. canephora beans from Loja.

1. Introduction

Ecuador stands out as one of the most biodiverse countries globally, benefiting from optimal climatic conditions that support a wide array of crops. The Coastal region experiences a tropical, arid, and dry humid climate, with the rainy season occurring in April and May, and a dry season (characterized by low rainfall) from June to November/December. The average temperature ranges from 22 to 25 °C, and rainfall levels fluctuate between 60 and 2000 mm, influenced by the Humboldt current [1]. Moving to the Sierra region, extreme rainfall is observed in March, April, and October due to the sun’s position. The average annual rainfall in this area ranges from 700 to 1200 mm, and the temperature, varying between 13 and 16 °C, is contingent on altitude (ranging from 500 to 6000 m above sea level (m.a.s.l.). In the eastern region of Ecuador, the average altitude is 1000 m.a.s.l., with consistent humidity throughout the year, as the annual rainfall hovers between 2000 and 3000 mm.
The cultivation of coffee in Ecuador holds significant economic importance, contributing substantially to income generation and foreign exchange. Moreover, it plays a crucial role in the social fabric, involving diverse communities and ethnic groups across various provinces in Ecuador. From an environmental perspective, coffee cultivation is predominantly practiced within agroforestry systems, thereby aiding in preserving native flora and fauna within diverse soil and climatic conditions. Additionally, the institutional and health aspects of coffee production are noteworthy, as coffee consumption has been linked to a reduced incidence of health risks such as type 2 diabetes, liver damage, and neurodegenerative diseases [2,3]. According to Duicela-Guambi et al. [4], 68% of coffee plantations in Ecuador yield arabica coffee, while the remaining 32% produce robusta coffee.
Coffea is indeed a diverse genus, comprising around 80 different species, with C. arabica L. and C. canephora L. being the most economically significant. Species within the Coffea genus typically manifest as trees or saplings with dense, horizontally spreading branches [5]. Their hermaphroditic flowers are arranged in intricate inflorescences, featuring generally white corollas, occasionally pale pink, with exposed anthers and an elongated style [6]. The fruits take the form of drupe-like berries, exhibiting a color range from yellowish to reddish at maturity, with the coffee kernel or seed covered by a double layer and characterized by a ventral invagination [7]. The leaves of Coffea plants are shiny and dark green, with visible veining, and grow in an opposite arrangement with the next pair of leaves [8].
In Ecuador, C. arabica is indeed the most economically significant coffee species. It is a seasonal crop that exhibits wide adaptability, thriving in altitudes ranging between 1500 and 2000 m.a.s.l. and temperatures of 17–23 °C, while also demonstrating resistance to drought [9]. The ideal soil conditions for coffee cultivation in Ecuador are described as loam, sandy loam, or clay loam with a granular texture, a deep “A” horizon, good drainage, adequate organic matter content, and a pH level ranging from 5.5 to 6.5 [10,11].
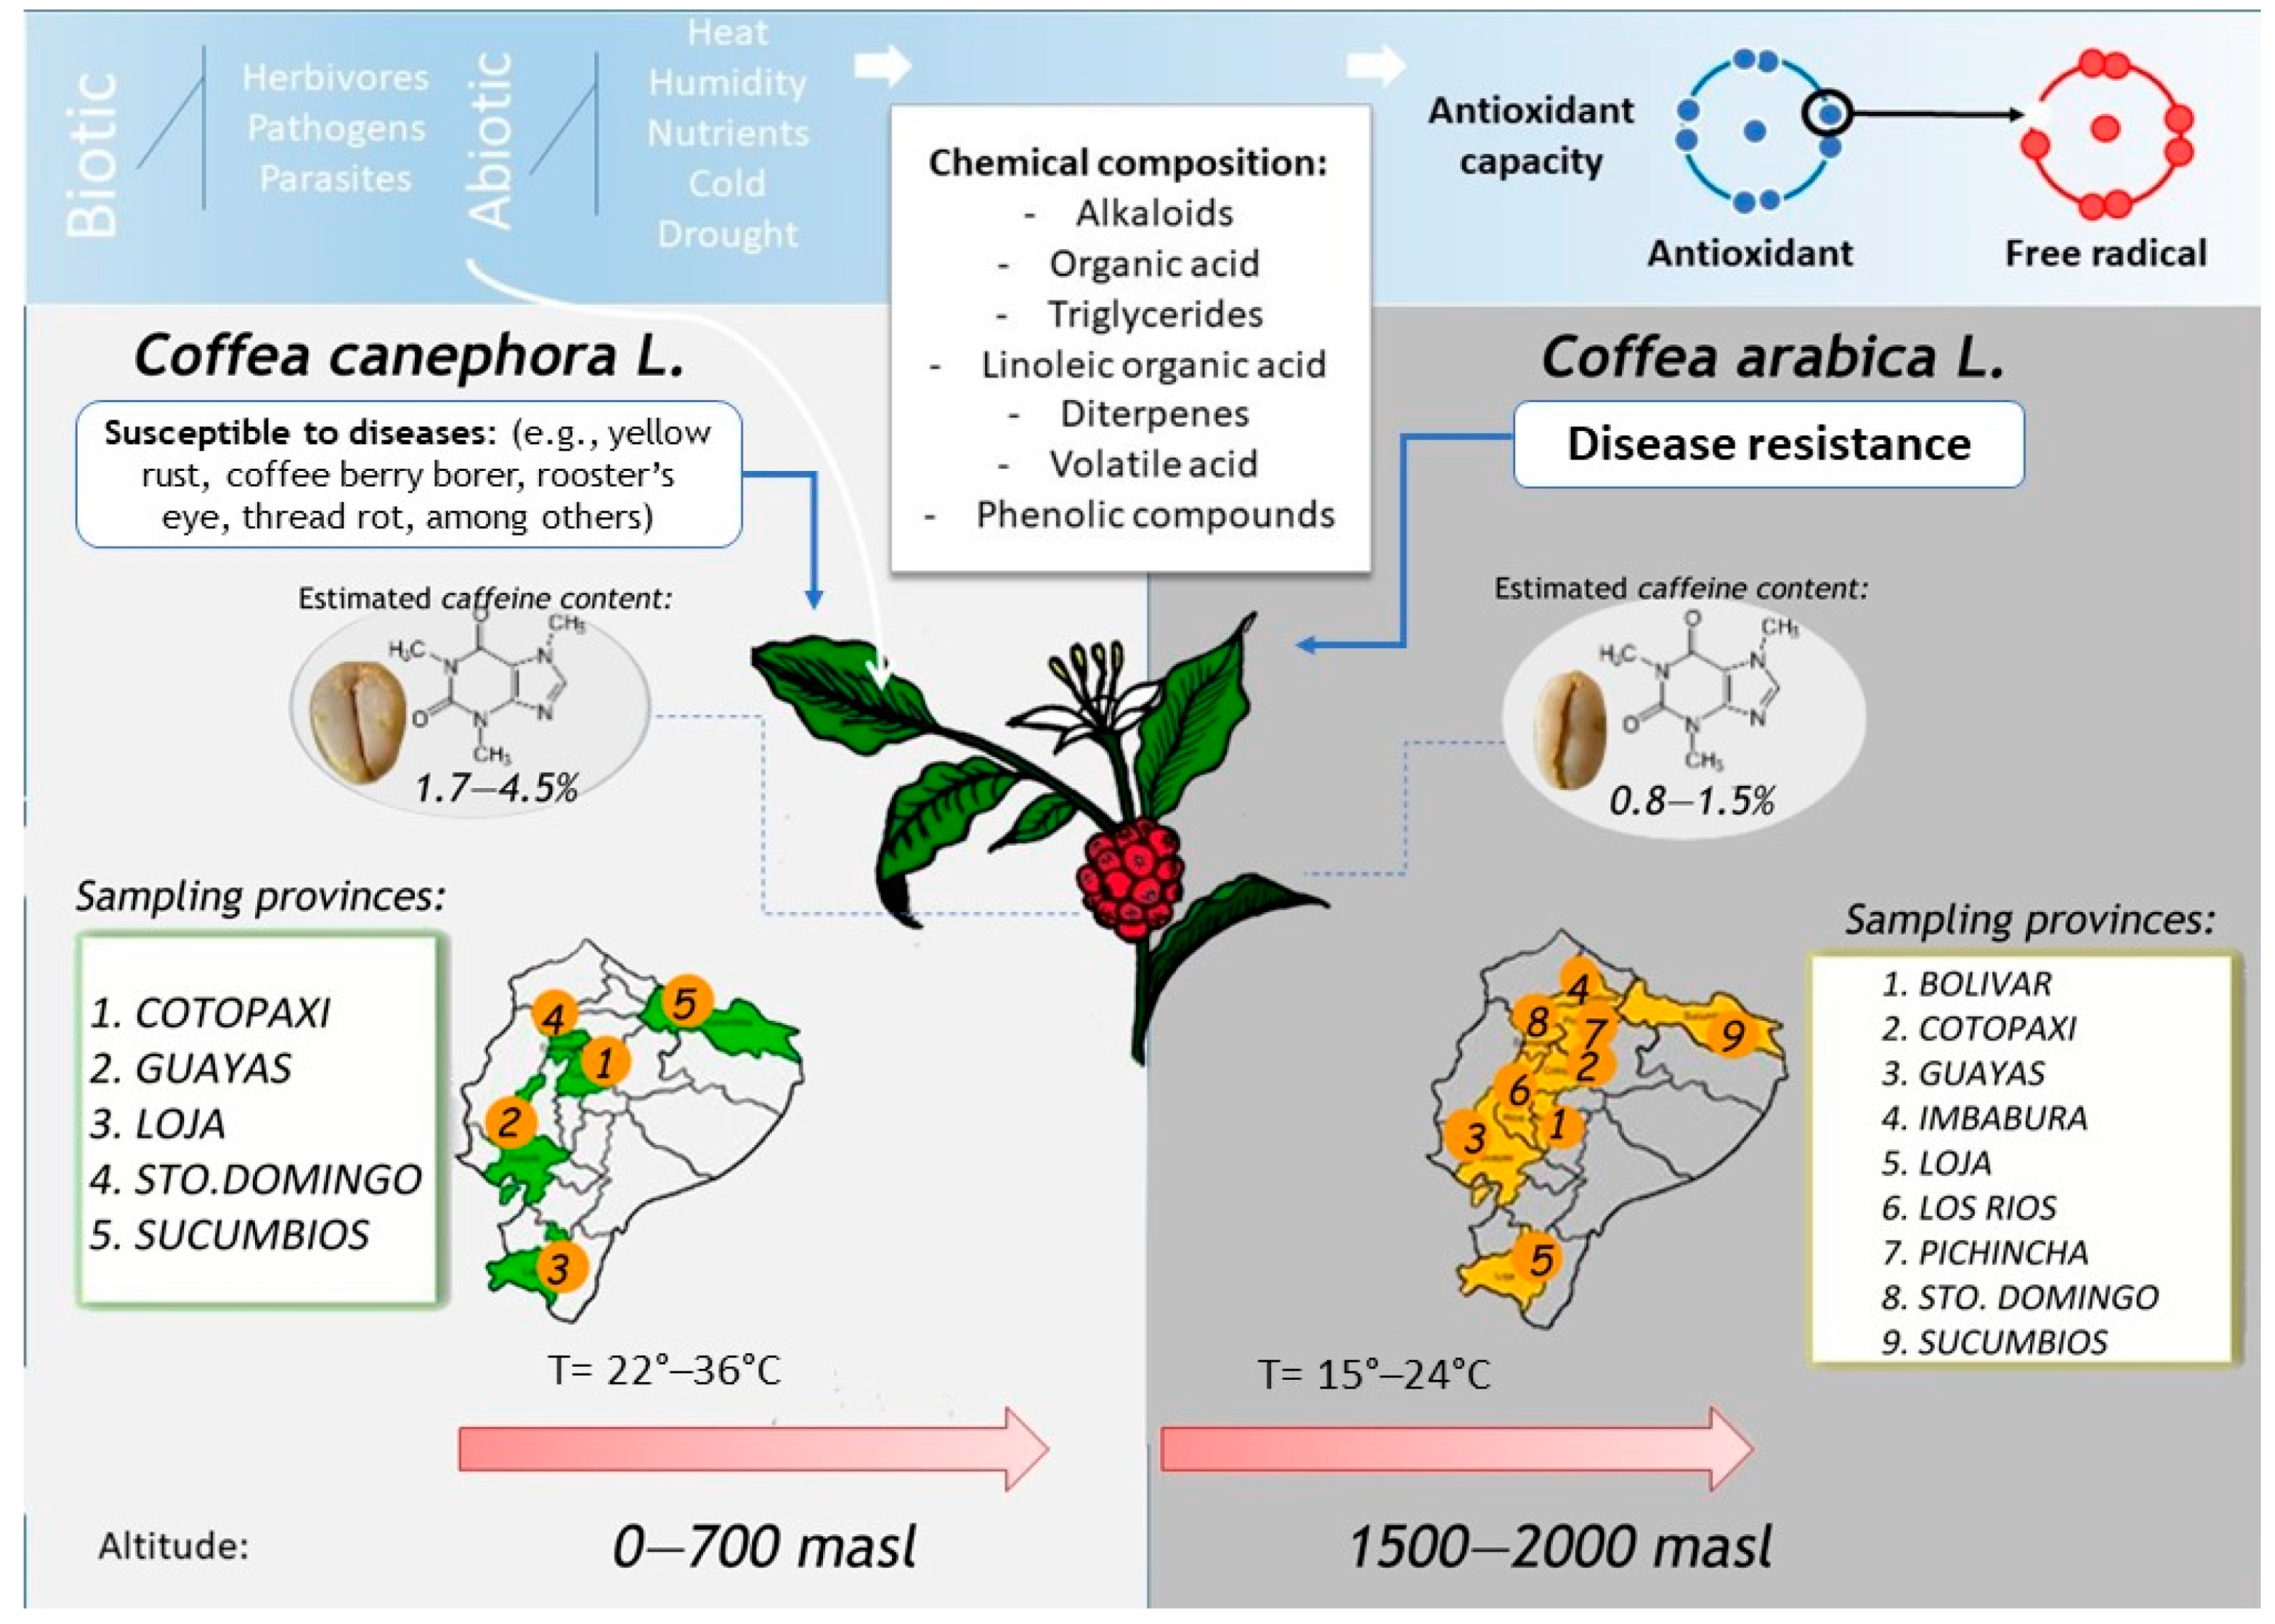
C. canephora, also known as robusta coffee, contains about twice as much caffeine as C. arabica. It is less fragrant compared to arabica and exhibits superior resistance to heat, diseases, and pests. This species thrives in regions with a yearly temperature range of 22–26 °C, annual rainfall between 2000–3500 mm, and humidity levels of 85–90%. Its optimal growing range is at altitudes of 0–700 m.a.s.l., and it produces round beans [12] with oval-shaped seeds [13]. Robusta coffee is typically cultivated at altitudes below 600 m.a.s.l., primarily in humid tropical forest areas prevalent in the Amazon and Coastal regions. The climatic conditions of C. arabica and C. canephora are described in Figure 1.
According to Gotteland & De Pablo [2], coffee has various applications beyond being a popular beverage due to its rich content of bioactive compounds, including phenolics, in particular, chlorogenic acids, which act as antioxidants in the body. These antioxidants play a role in combating oxidative stress and neutralizing free radicals, potentially contributing to protection against chronic diseases such as cardiovascular disease, type 2 diabetes, and certain types of cancer. Additionally, coffee is beneficial in protecting against oxidative damage and skin aging [17].
Metabolites with high biological activity can be found in plants of the Coffea genus, including phenolic compounds (chlorogenic acids), diterpenes, and melanins [18]. The production of these compounds is influenced by various internal and external factors such as soil composition, water demand, climate, growing conditions, and ripening stage [19]. Caffeine and chlorogenic acids are known to provide several health benefits, primarily related to their antioxidant properties, which help protect against damage from reactive oxygen species (ROS) and oxidative stress through the donation of hydrogen atoms [20].
According to Patay et al. [21], the most abundant phenolic compound in Coffea species is 5-caffeoylquinic acid and its isomers, and the most important alkaloid is caffeine. The characteristic aroma of coffee is attributed to the presence of terpenoids such as 4-vinylguaiacol, α-2-furfurylthiol, and 3-methylbutane yrosin [22]. Additionally, other secondary metabolites found in the mature leaves and fruits of Coffea plants include trigonelline (alkaloid), 2-ethyl-3,5-dimethylpyrazine, 3-methylbutanal, 2-furfurylthiol, methylpropanal, 3-mercapto-3-methylbutyl formate, and methanethiol [23]. Robusta coffee also contains 16-O-methylcaffeophestol [24], as described in Figure 2.
The present study aims to evaluate the metabolic composition, biological activity, and sensorial attributes of coffee varieties grown in Ecuador. The research emphasizes the significance of investigating the production of secondary metabolites not only at the bean level but also within the plant to achieve a high antioxidant capacity. This investigation considers differences in the production of secondary metabolites, antioxidant capacity, and sensorial attributes according to the environmental conditions of the two species C. arabica and C. canephora cultivated in Ecuador. This research will provide valuable insights into the influence of environmental factors on the production of bioactive compounds in coffee plants, particularly at high altitudes, and may have implications for the development of coffee cultivation practices to optimize the antioxidant potential of the beans.

2. Materials and Methods

2.1. Chemicals

For the determination of secondary metabolites, Folin—Ciocalteu reagents (for phenolics), aluminum chloride (AlCl3), and sodium acetate (CH3COONa) (for flavonoids) were used. For the quantification of the antioxidant capacity, 2,2-diphenyl-1-picrihydrazyl (DPPH), 2,2-azinobis (3-ethylbenzothiazoline-6-sulfonic acid) diammonium salt (ABTS), 2,4,6-Tri(2-pyridyl)-triazine (TPTZ), and iron (III) chloride hexahydrate were used. Calibration curves were constructed using standard solutions of 6-hydroxy-2,5,7,8-tetramethylchroman-2-carboxylic acid (Trolox), 3,4,5-trihydroxybenzoic acid (gallic acid), potassium persulfate, sulfate iron (III) heptahydrate, quercetin, and ethanol 95%. All of the chemicals were purchased from Sigma-Aldrich Chemical Co. (St. Louis, MO, USA).

2.2. Sample Collection and Processing

Leaves and fruits of both species were collected. C. arabica samples were collected from certified coffee-producing farms from Bolívar, Cotopaxi, and Guayas provinces in the rainy season, Imbabura in the dry season, Pichincha in the rainy season, Santo Domingo de los Tsáchilas in the rainy season, and Loja, Los Ríos, and Sucumbíos, in the rainy season as well. The C. canephora samples were collected from the Cotopaxi, Guayas, Loja, Santo Domingo de los Tsáchilas, and Sucumbíos provinces. Random sampling with 5 replicates was carried out at different points of the crop to guarantee the homogeneity of the samples of the C. canephora and C. arabica species. For fruits, the physical aspect was taken into account. Priority was given to ripe beans that exhibited a characteristic intense red color, and absence of rotten spots, or bruises, indicating the optimum state for harvesting. In contrast, for leaves, ripe leaves with a uniform color were taken, these were wrapped in paper towels and stored with silica gel, for transport in a cooler for analysis to the CICTE laboratory of the Universidad de las Fuerzas Armadas in Cantón Rumiñahui.

2.3. Extraction of Active Ingredients

Prior to the determination of the antioxidant character and phytochemical compounds produced by coffee plants, leaves, and fruits were washed with distilled water to remove impurities. Ground leaves (5 g) were placed in 25 mL of 95% ethanol (v/v), used as a solvent, for 24 h at 4 °C in the dark. Fresh coffee fruits were ground, using 30 g of the raw material with 100 mL of 95% ethanol for extraction in a 24 h period. The supernatants were filtered through Whatman no. 1 filter paper, vacuum evaporated, and kept at 4 °C until use [25]. Then, for phenolic and flavonoid content, and antioxidant capacity assays, three replicates from each sample were used for analysis.

2.4. Determination of Total Phenol Content

The method described by Madaan et al. [26], with modifications, was used to determine the total phenol content (TPC). Following the reaction between the phenolic groups and the phosphomolybdic and phosphotungstic acids from the Folin-Ciocalteu reagent, green-blue complex detectable at 710 nm is formed. Briefly, an aliquot of the extract was dissolved in the solvent extraction, diluted to 5 mL of Milli-Q water, and added to 1.5 mL of the Folin-Ciocalteu reagent. To carry out the reaction, the mixture was left for 5 min at room temperature (25 °C), then 2 mL of a 100 g/L solution of Na2CO3 was added. The absorbance was measured after 30 min with a spectrophotometer against a control without extract. Gallic acid was used for the calibration curve using standard solutions at a concentration between 0–250 mg/L, obtaining the equation, y = 0.0112x + 0.1759 with a correlation factor of R2 = 0.9794.

2.5. Determination of Flavonoid Content

The determination of the total content of flavonoids from our extracts was carried out spectrophotometrically according to the AlCl3 colorimetric method or the Dowd method [27], a method based on the formation of a flavonoid-aluminum complex with maximum absorption at 430 nm. A 1 mL aliquot of the extract solution was mixed with 0.3 mL of 10% (v/v) AlCl3 solution in methanol, 0.2 mL (1 M) potassium acetate, and 5.6 mL of distilled water. The mixture was incubated for 10 min at room temperature before measuring the absorbance of the reaction mixture at 430 nm. The standard calibration curve was performed at a concentration between 0–1.5 mg/L using quercetin as the standard, obtaining through linear regression the equation, y = 1.4566x + 0.0265 with a correlation factor of R2 = 0.9935.

2.6. HPLC Quantification of Caffeine Content

Quantification of the caffeine content present in coffee beans was performed by high-performance liquid chromatography (HPLC) using the methodology proposed by Wanyika et al. [28]. An Agilent 1100/1200 Series HPLC (Santa Clara, CA, USA) instrument with a binary pump (G1312A), column oven (G1316A), and auto-injector (G1329A) managed by Chemstation software LTS 01.11 (Agilent Technologies, Santa Clara, CA, USA) was used for caffeine content quantification. An Agilent Zorbax SB C18 column 150 × 3.9 mm2, internal diameter, particle size, 4 µm, at a flow rate of 1.4 mL/min and a temperature of 22 °C, using as the mobile phase a 20% (v/v) methanol solution in deionized water was used for the separation phase. The caffeine standard solution was prepared at a concentration of 100 mg/mL to match the mobile phase. The calibration curve was performed using the standard solutions prepared by serial dilution of the stock solution with the mobile phase at concentrations of 0, 0.02, 0.04, 0.06, and 0.08 mg/mL. Coffee pericarp was freeze-dried and a solution was prepared with distilled water at a concentration of 20 mg/mL. The sample was prepared with 5 mL of the freeze-dried coffee solution, and calibrated with the mobile phase to 50 mL. Standards and sample were placed in the HPLC system under the conditions: column, reversed phase, ODS detector, 250 × 4.6 nm2, a flow rate of 1 mL/min, wavelength of 278 nm, pressure of 150 khf/cm2, mobile phase of water, acetic acid, and methanol (79.9:0.1:20) and injection volume of 10 μL. The results (average values ± standard deviations) were expressed as mg/g dw.

2.7. Determination of Antioxidant Capacity

2.7.1. Free Radical Scavenging by Use of the DPPH Radical

The DPPH free radical method was based on the protocol established by Guo et al. [29] with modifications. A volume of 2 mL DPPH stock solution (0.1 mM) was added in each of the test tubes containing 0.1 mL of the crude extract sample and incubated in the dark, at room temperature, for 30 min. The absorbance was measured at a wavelength of 517 nm and the scavenging ability as a percentage was calculated as DPPH scavenging ability = (A control − A sample/A control) × 100. A Trolox standard solution was used for the calibration curve determination with concentrations ranging from 0–0.625 mM, obtaining the following equation, y = 158.07x − 1.6766 with a correlation factor of R2 = 0.9955.

2.7.2. Free Radical Scavenging through the Use of the ABTS Radical Cation

The method described by Loizzo et al. [30] was used to determine the antioxidant activity based on the ABTS free radical assay. A mixture of ABTS (2 mM) and potassium persulfate (70 mM) was allowed to stand overnight at room temperature in the dark to form the ABTS radical cation before use. The ABTS solution was then diluted with 80% methanol to obtain an absorbance of 0.700 ± 0.005 at 734 nm. A total of 100 μL of appropriately diluted samples was added to 2 mL of ABTS solution and the absorbance was recorded at 734 nm after 1 min of incubation at room temperature. The standard calibration curve was built using Trolox standard solutions with concentrations ranging from 0 to 2.5 mM, producing the equation, y = 31.995x + 3.9568 with a correlation factor of R2 = 0.9697.

2.7.3. Ferric Reducing Antioxidant Power Assay FRAP

The method used for determining the reducing capacity [31] uses antioxidants as reductants in a redox-related colorimetric method, using a slightly reduced oxidant, the ferric ion (Fe3+), present in stoichiometric excess. The ferric tripyridyltriazine complex (Fe3+-TPTZ) is reduced (in the presence of low pH) by the antioxidants in the sample to the ferrous form (Fe2+-TPTZ), which appears as a deep blue color. The reaction is monitored at 593 nm. The FRAP reagent was prepared by mixing the acetate buffer (300 mM, pH 3.6), a solution of 10 mM TPTZ in 40 mM HCl and 20 mMFeCl3 at 10:1:1 (v/v/v). The sample was incubated with 2 mL of FRAP solution (prepared by mixing 25 mL acetate buffer solution, 5 mL TPTZ solution, and 10 mL FeCl3·6H2O solution) at 37 °C, for 30 min in the dark. All solutions were prepared on the day of use. A standard curve was constructed by using different concentrations of FeSO4 × 7H2O ranging from 0–5 mM, following a linear regression to obtain the equation, y = 0.3654x − 0.0532 with a correlation factor of R2 = 0.9686.

2.8. Sensory and Organoleptic Evaluation

In this study, a panel of 36 coffee enthusiasts, who are regular consumers of coffee and possess a strong knowledge of its sensory attributes, was selected to participate in a sensory evaluation of fresh coffee fruits. Before the evaluation, the panelists received training to familiarize themselves with the specific characteristics of fresh coffee fruits and the lexicon used for sensory evaluation. The lexicon for sensory evaluation of fresh coffee fruits (in a standardized manner) includes descriptive terms related to aroma (e.g., floral, fruity, roasted), flavor (e.g., nutty, chocolatey, acidic), after-flavor (e.g., lingering, bitter), acidity (e.g., bright, sharp), sourness (e.g., mild, pronounced), body (e.g., full-bodied, light), color (e.g., dark, medium, light), and texture (e.g., smooth, gritty). Each panelist received a cup with 3 coffee beans from each province, for both C. arabica and C. canephora species. A total of 27 samples were tested for C. arabica, originating from the provinces of Bolívar, Cotopaxi, Guayas, Imbabura, Loja, Los Ríos, Pichincha, Santo Domingo, and Sucumbíos, while each panelist tested 15 samples from Cotopaxi, Guayas, Loja, Santo Domingo, and Sucumbíos for C. canephora. Before the evaluation, the samples were meticulously prepared to offer a comprehensive sensory experience. The procedure begins with a cleaning of the samples to exclude physical defects and impurities. After the first step, all samples must pass through sensory evaluations such as olfactory and visual; additionally, an examination of defects is prepared followed by the analysis of the physical variables represented by fragrance, flavor, residual flavor, acidity, body, bitterness, color, and texture [27]. The panelists received information about the specific characteristics of fresh coffee fruits and underwent training to familiarize themselves with the sensory attributes. Using a standardized questionnaire, panelists scored various attributes including aroma, flavor, after-flavor, acidity, sourness, body, color, and texture of the fresh coffee fruits. The data obtained from the sensory evaluation was then aggregated and analyzed to identify trends and preferences related to the characteristics of the fresh coffee fruits. All variables receive a rating from 0 to 10, where 9–10 is classified as very good, 6–8 as good, 4–5 as intermediate, 2–3 as low, and 0–1 as bad, according to the Specialty Coffee Association of Africa protocol [4].

2.9. Statistical Analysis

For statistical analysis, the R Studio statistic program was used. Data was analyzed by a three-way ANOVA test under a p < 0.05 value of significance. The assays were conducted in triplicate and presented as mean ± standard deviation. Permutational multivariate analysis of variance (PERMANOVA), which extends the univariate factorial linear model to multiple dimensions without requiring a known probability distribution of the dependent variables [32], was used to perform the statistical analysis of non-parametric data. The correlation between total phenolic content, total flavonoid content, and antioxidant capacity was evaluated by using Pearson’s correlation coefficient, while the correlation matrix was depicted as a scatter plot matrix. A negative value indicates a negative linear correlation, a positive value indicates a positive linear correlation, and 0 indicates no linear correlation [33]. The correlation ranking (values as *** high correlation, ** medium correlation, * low correlation) was established based on Maurage et al. [34]

3. Results

3.1. Total Phenolic Content and Total Flavonoid Content

The phenolic concentration was evaluated in leaves and fruit for each of the species, from different provinces of Ecuador. In the evaluated samples from C. arabica, the top concentration in fruit was recorded in the province of Cotopaxi (4.188 ± 0.029 mg GAE/g dw, while the lowest concentration was recorded in the province of Bolivar (0.996 ± 0.066 mg GAE/g dw). In the case of the leaf samples, the top phenolic content was in the province of Guayas (10.869 ± 0.002 mg GAE/g dw), while the lowest concentration was observed in the province of Los Ríos (1.124 ± 0.181 mg GAE/g dw). For the fruits of C. canephora, the province with the uppermost phenolic content was in Cotopaxi (3.036 ± 0.317 mg GAE/g dw), and the lowest concentration in the province of Loja (1.298 ± 0.101 mg GAE/g dw). In the case of the leaf samples, it was determined that the peak phenolic content was in Guayas Province (10.782 ± 0.004 mg GAE/g dw), and the lowest concentration in the province of Loja (2.533 ± 0.112 mg GAE/g dw). An analysis of variance (ANOVA) was carried out, determining significant differences between the samples (p-value < 0.0001) as shown in Figure 3a.
The province with the upper value of total flavonoid content in C. arabica fruit samples was Cotopaxi (0.442 ± 0.001 mg QE/g dw), while the lowest content was recorded in the province of Loja (0.076 ± 0.006 mg QE/g dw). In leaf samples, the total flavonoid content with the highest result was recorded in Guayas (1.028 ± 0.014 mg QE/g dw), and the lowest in Bolivar (0.129 ± 0.008 mg QE/g dw). In the case of the fruit of C. canephora, the top total flavonoid content was recorded in Sucumbios (0.385 ± 0.008 mg QE/g dw) and the lowest in Cotopaxi (0.128 ± 0.02 mg QE/g dw). An analysis of variance was carried out (p-value < 0.0001) with results reported in Figure 3b.

3.2. Determination of Caffeine Content

The highest value of caffeine content in C. arabica samples was recorded in the province of Los Ríos (15.09 mg/g dw); while the lowest value was found in the province of Imbabura (0.91 ± 0.00629 mg/g dw). Regarding the C. canephora species, the highest value was recorded in the province of Loja (18.05 ± 0.15803 mg/g dw), and the lowest value was recorded in the province of Santo Domingo de los Tsáchilas (1.97 ± 0.03557 mg/g dw), as shown in Table 1.

3.3. Antioxidant Capacity

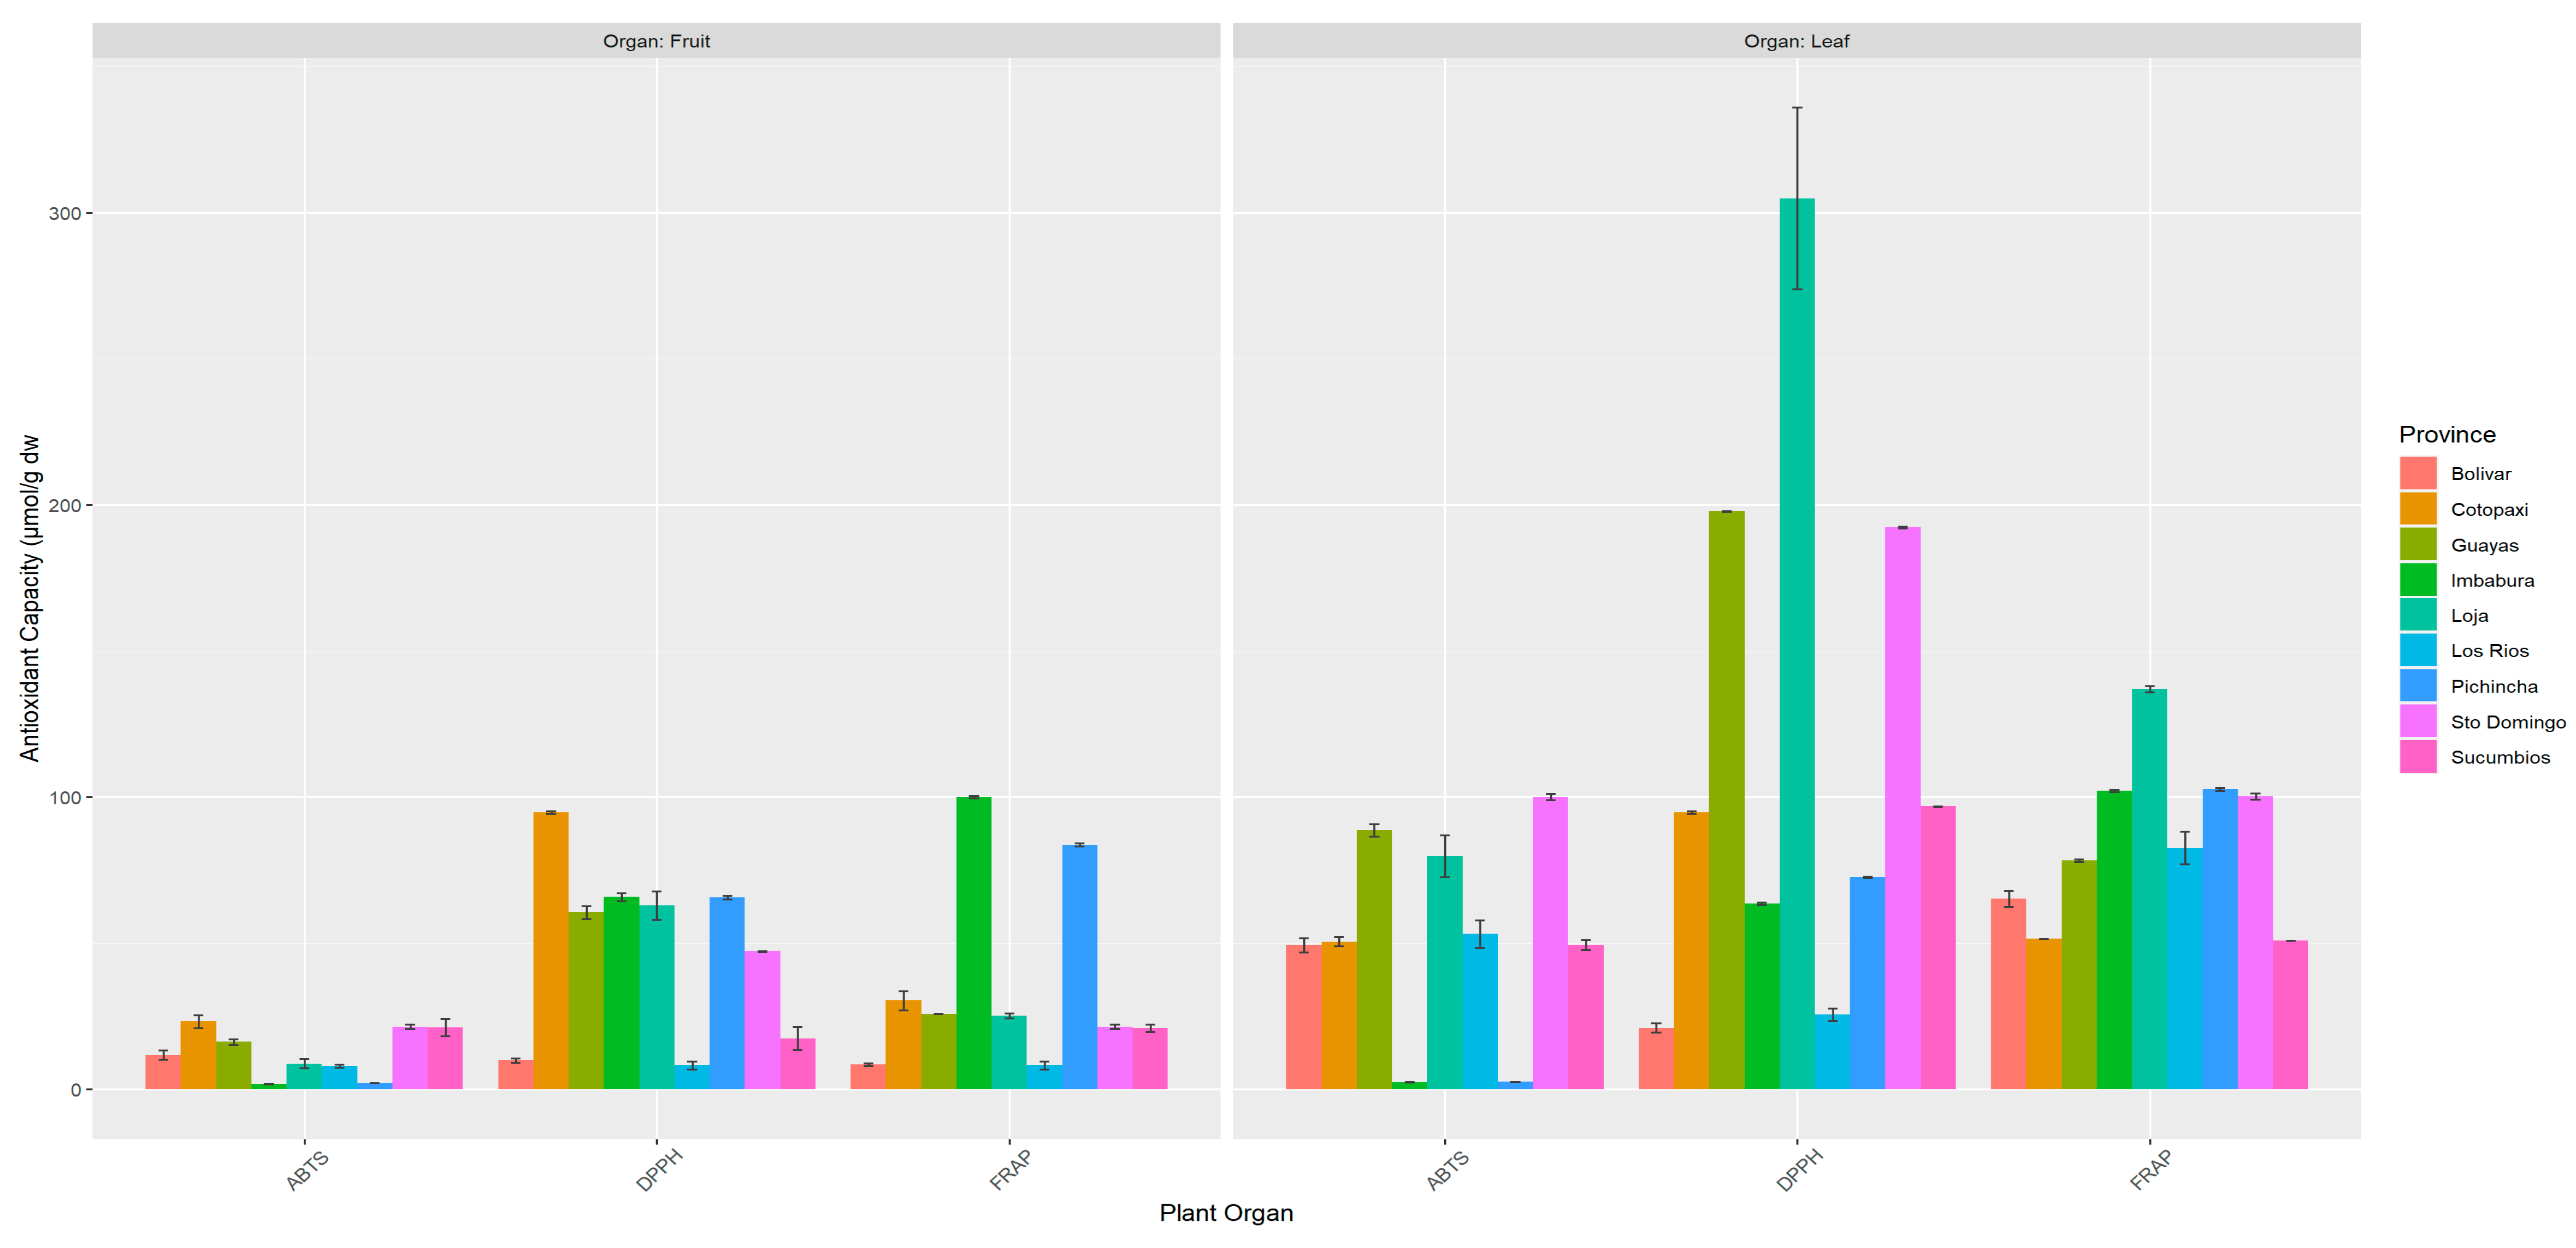
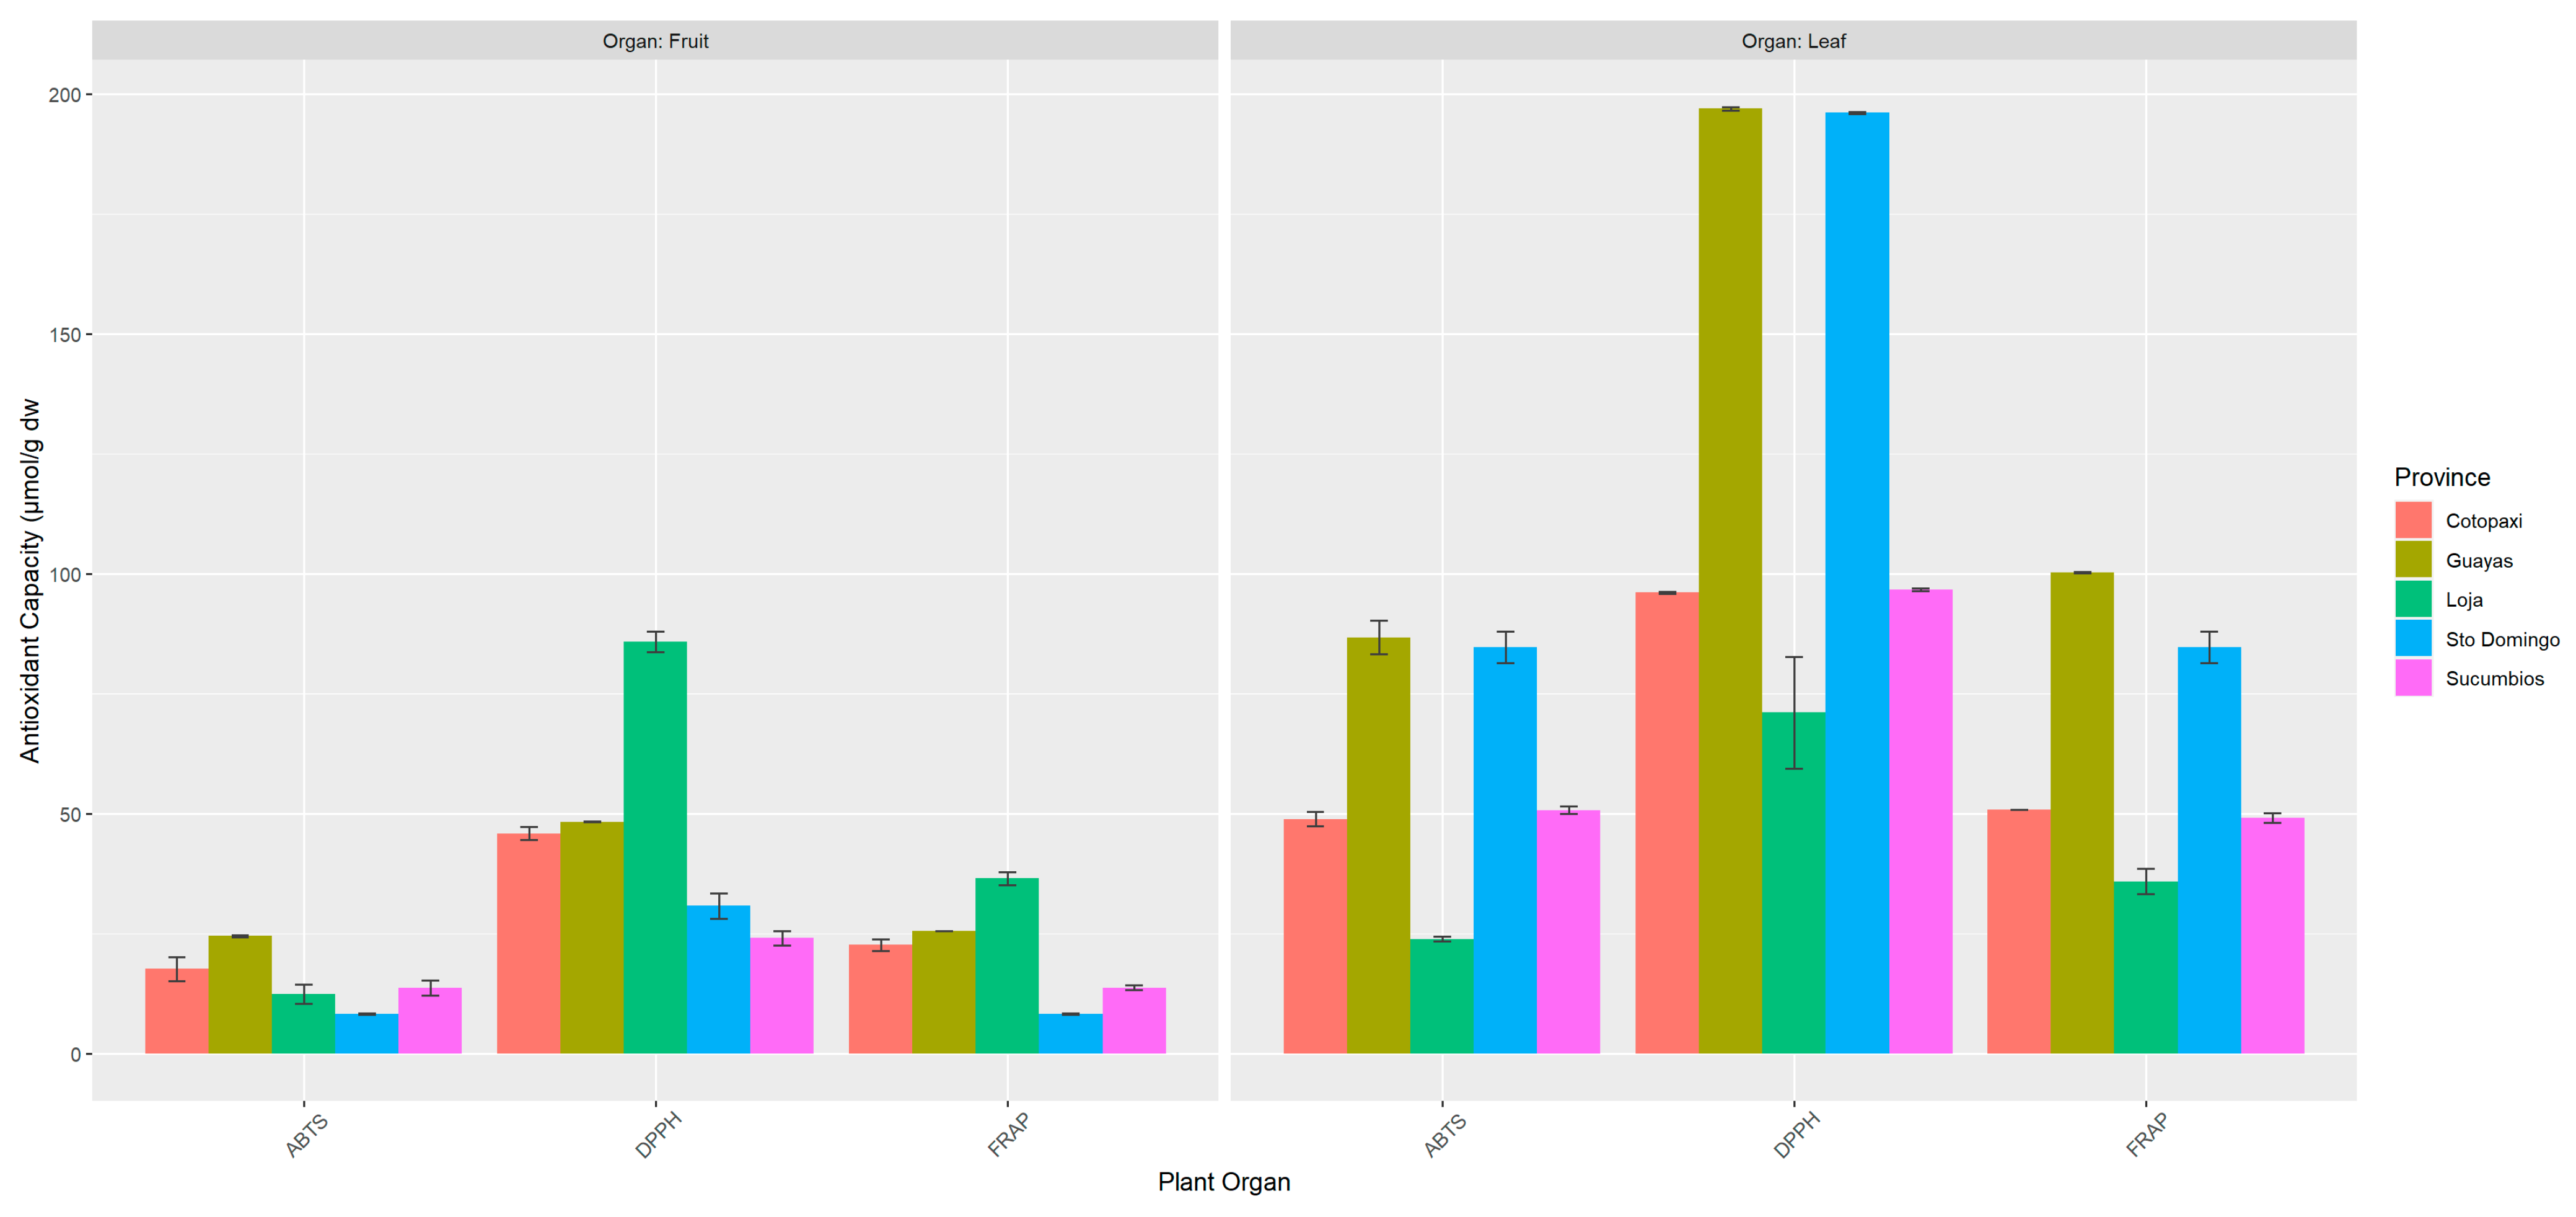
When evaluating the antioxidant capacity through the ABTS test, for the C. arabica species, the best antioxidant capacity in fruit samples was obtained in the province of Cotopaxi (23.179 ± 1.802 µmol TEAC/g dw) and the lowest value in Imbabura (1.885 ± 0.05 µmol TEAC/g dw), while in leaf samples, the highest result was found in Santo Domingo de los Tsáchilas Province (100.085 ± 0.817 µmol TEAC/g dw), and the lowest was recorded in the province of Imbabura (2.488 ± 0.045 µmol TEAC/g dw). For the fruit of C. canephora species, the best antioxidant capacity was found in the province of Guayas (24.533 ± 0.202 µmol TEAC/g dw), and the lowest was recorded in Santo Domingo de los Tsáchilas (8.331 ± 0.127 µmol TEAC/g dw), while for leaf samples, the highest antioxidant capacity was found in Guayas (24.533 ± 0.202 µmol TEAC/g dw) and the lowest in Loja (23.932 ± 0.416 µmol TEAC/g dw).
In the DPPH test, for C. arabica fruit, the highest antioxidant capacity was obtained in the province of Imbabura (65.875 ± 1.129 µmol TEAC/g dw) and the lowest value in Los Ríos (8.225 ± 1.138 µmol TEAC/g dw), however, for the leaf, the highest capacity was from the province of Loja (304.876 ± 25.455 µmol TEAC/g dw) and the lowest capacity was found in the province of Bolivar (21.028 ± 1.252 µmol TEAC/g dw). In the case of C. canephora, fruit samples from the Loja province showed the highest antioxidant capacity (85.869 ± 1.727 µmol TEAC/g dw), while the lowest was recorded in Sucumbios (24.124 ± 1.203 µmol TEAC/g dw). Regarding the antioxidant capacity of the leaf samples, the highest result was recorded in Guayas (196.956 ± 0.279 µmol TEAC/g dw) and the lowest in Loja (71.149 ± 9.519 µmol TEAC/g dw).
In the FRAP test, peak radical reduction power in C. arabica fruit was obtained in the province of Imbabura (100.164 ± 0.332 µmol Fe2+/g dw), and the lowest was registered from Los Ríos (8.225 ± 1.138 µmol Fe2+/g dw). Analyses of leaf samples resulted in a higher reduction power in the province of Pichincha (102.705 ± 0.447 µmol Fe2+/g dw). In the case of C. canephora, fruit samples from the Loja Province registered a higher radical reduction power (36.567 ± 1.127 µmol Fe2+/g dw), than the results recorded in Santo Domingo de los Tsáchilas (8.336 ± 0.127 µmol Fe2+/g dw). As for the leaf samples, the top capacity was recorded in Guayas (100.286 ± 0.114 µmol Fe2+/g dw) and the lowest in Loja (35.928 ± 2.164 µmol Fe2+/g dw). An analysis of variance was performed (p-value < 0.0001) and the results are presented in Figure 4 and Figure 5. Data were expressed in TEAC/g dw for ABTS and DPPH and µmol Fe2+/g dw for FRAP.

3.4. Correlation

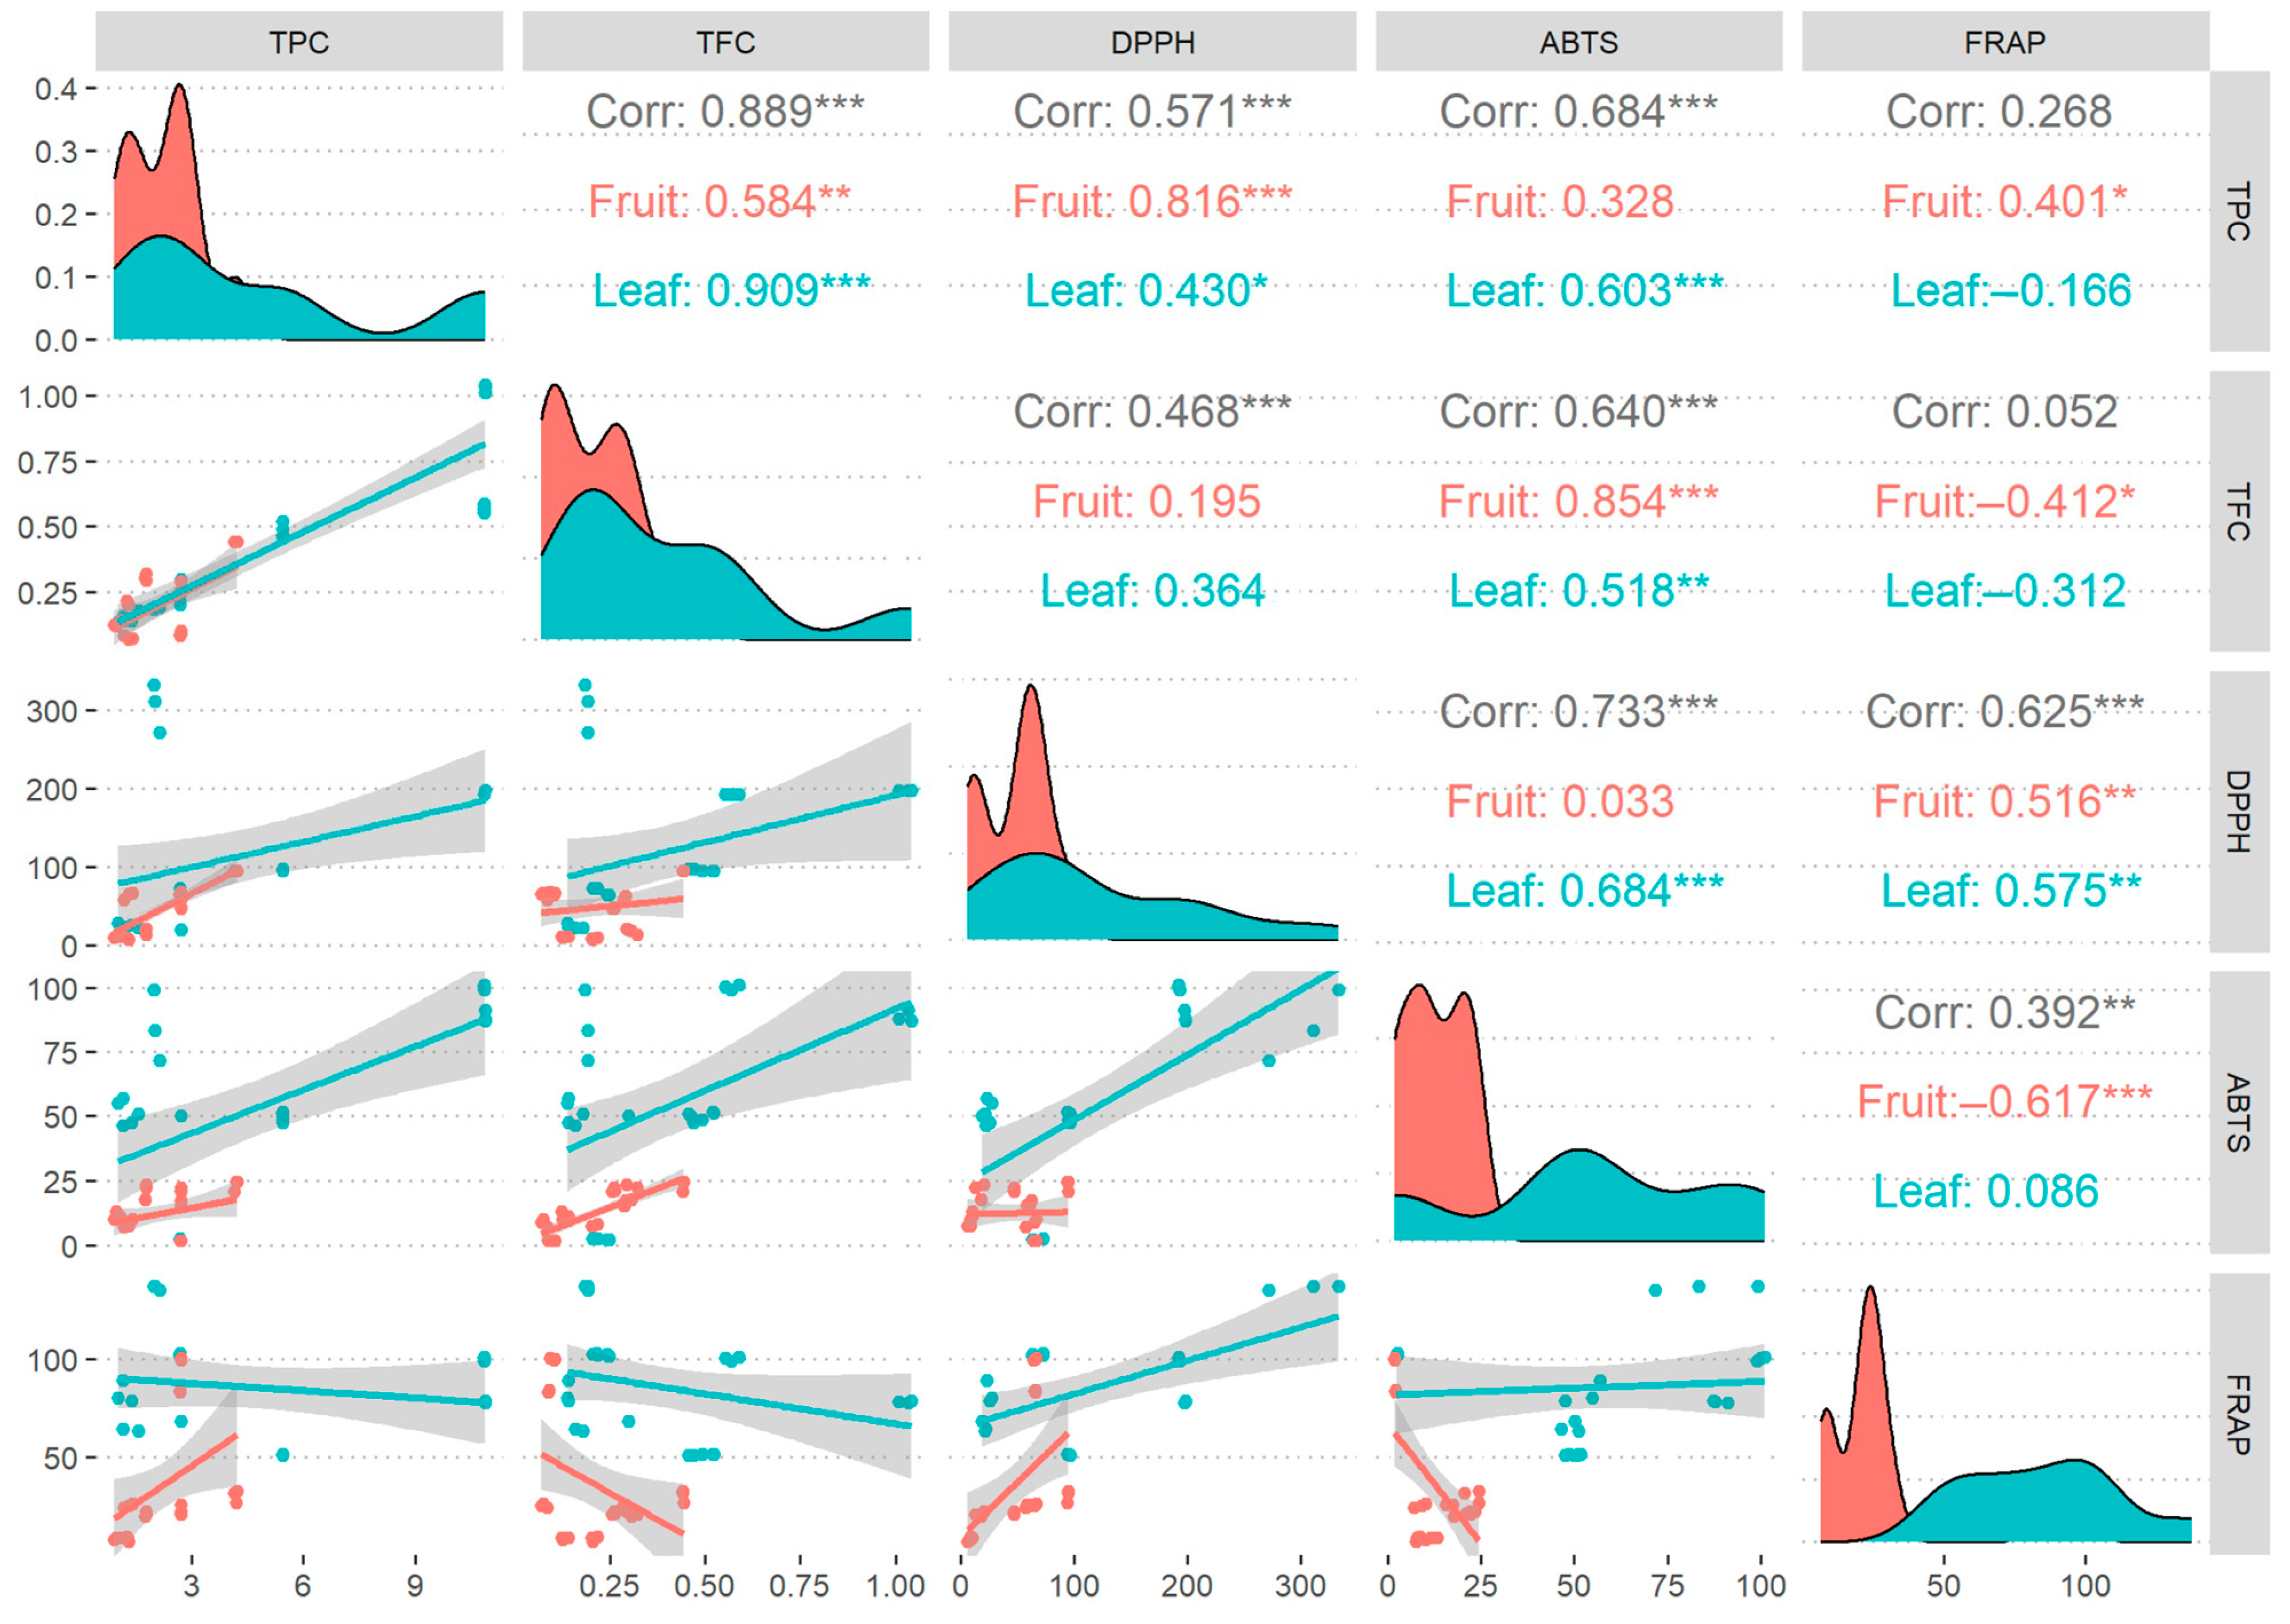
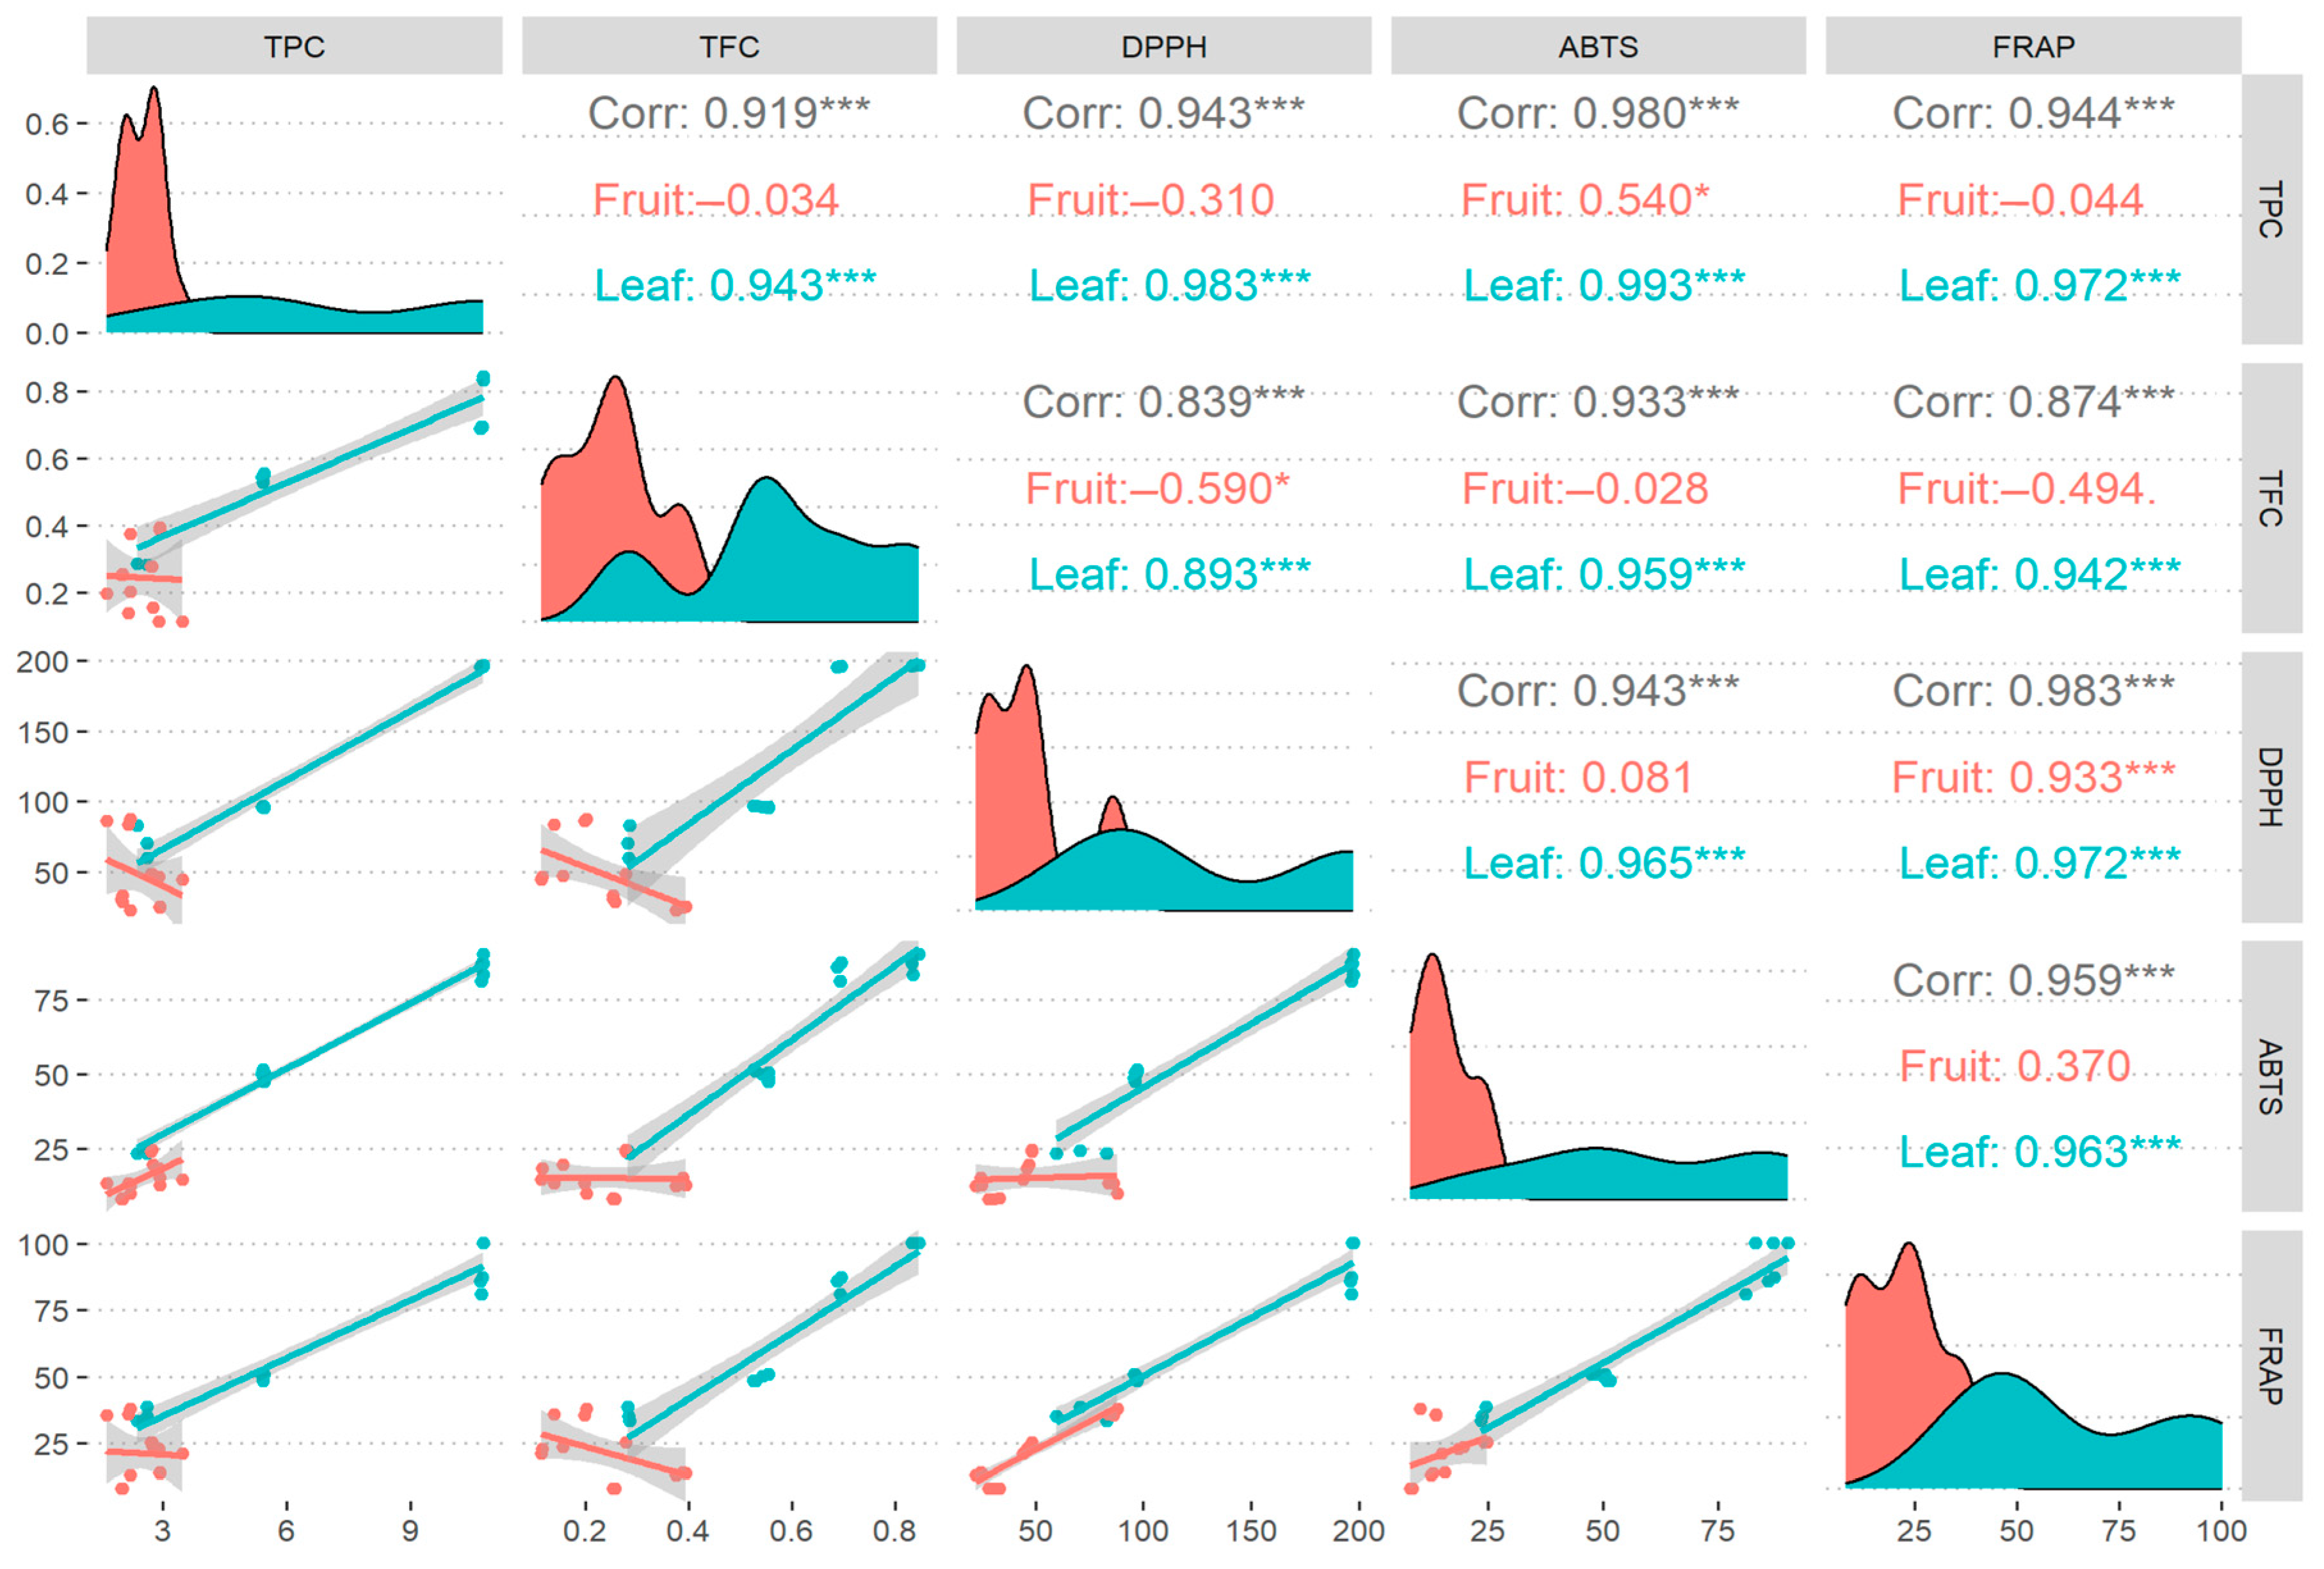
The correlations between the total content of secondary metabolites, phenolics, and flavonoids and the three antioxidant capacity methods (ABTS, DPPH, and FRAP) were evaluated for each species of Coffea sp. In the case of C. canephora, a high positive correlation (R > 90) was observed for all of the values evaluated. For C. arabica, the correlation of all of the values evaluated resulted in a high positive correlation for TPC in ABTS (R = 0.68), medium in DPPH (R = 0.57), and low in FRAP (R = 0.27), while for TFC a similar trend was observed with values for ABTS (R = 0.64) and DPPH (R = 0.47) of medium positive character and a low positive value for FRAP (R = 0.05) (Figure 6 and Figure 7).

3.5. Sensory and Organoleptic Evaluation of Raw Coffee Beans

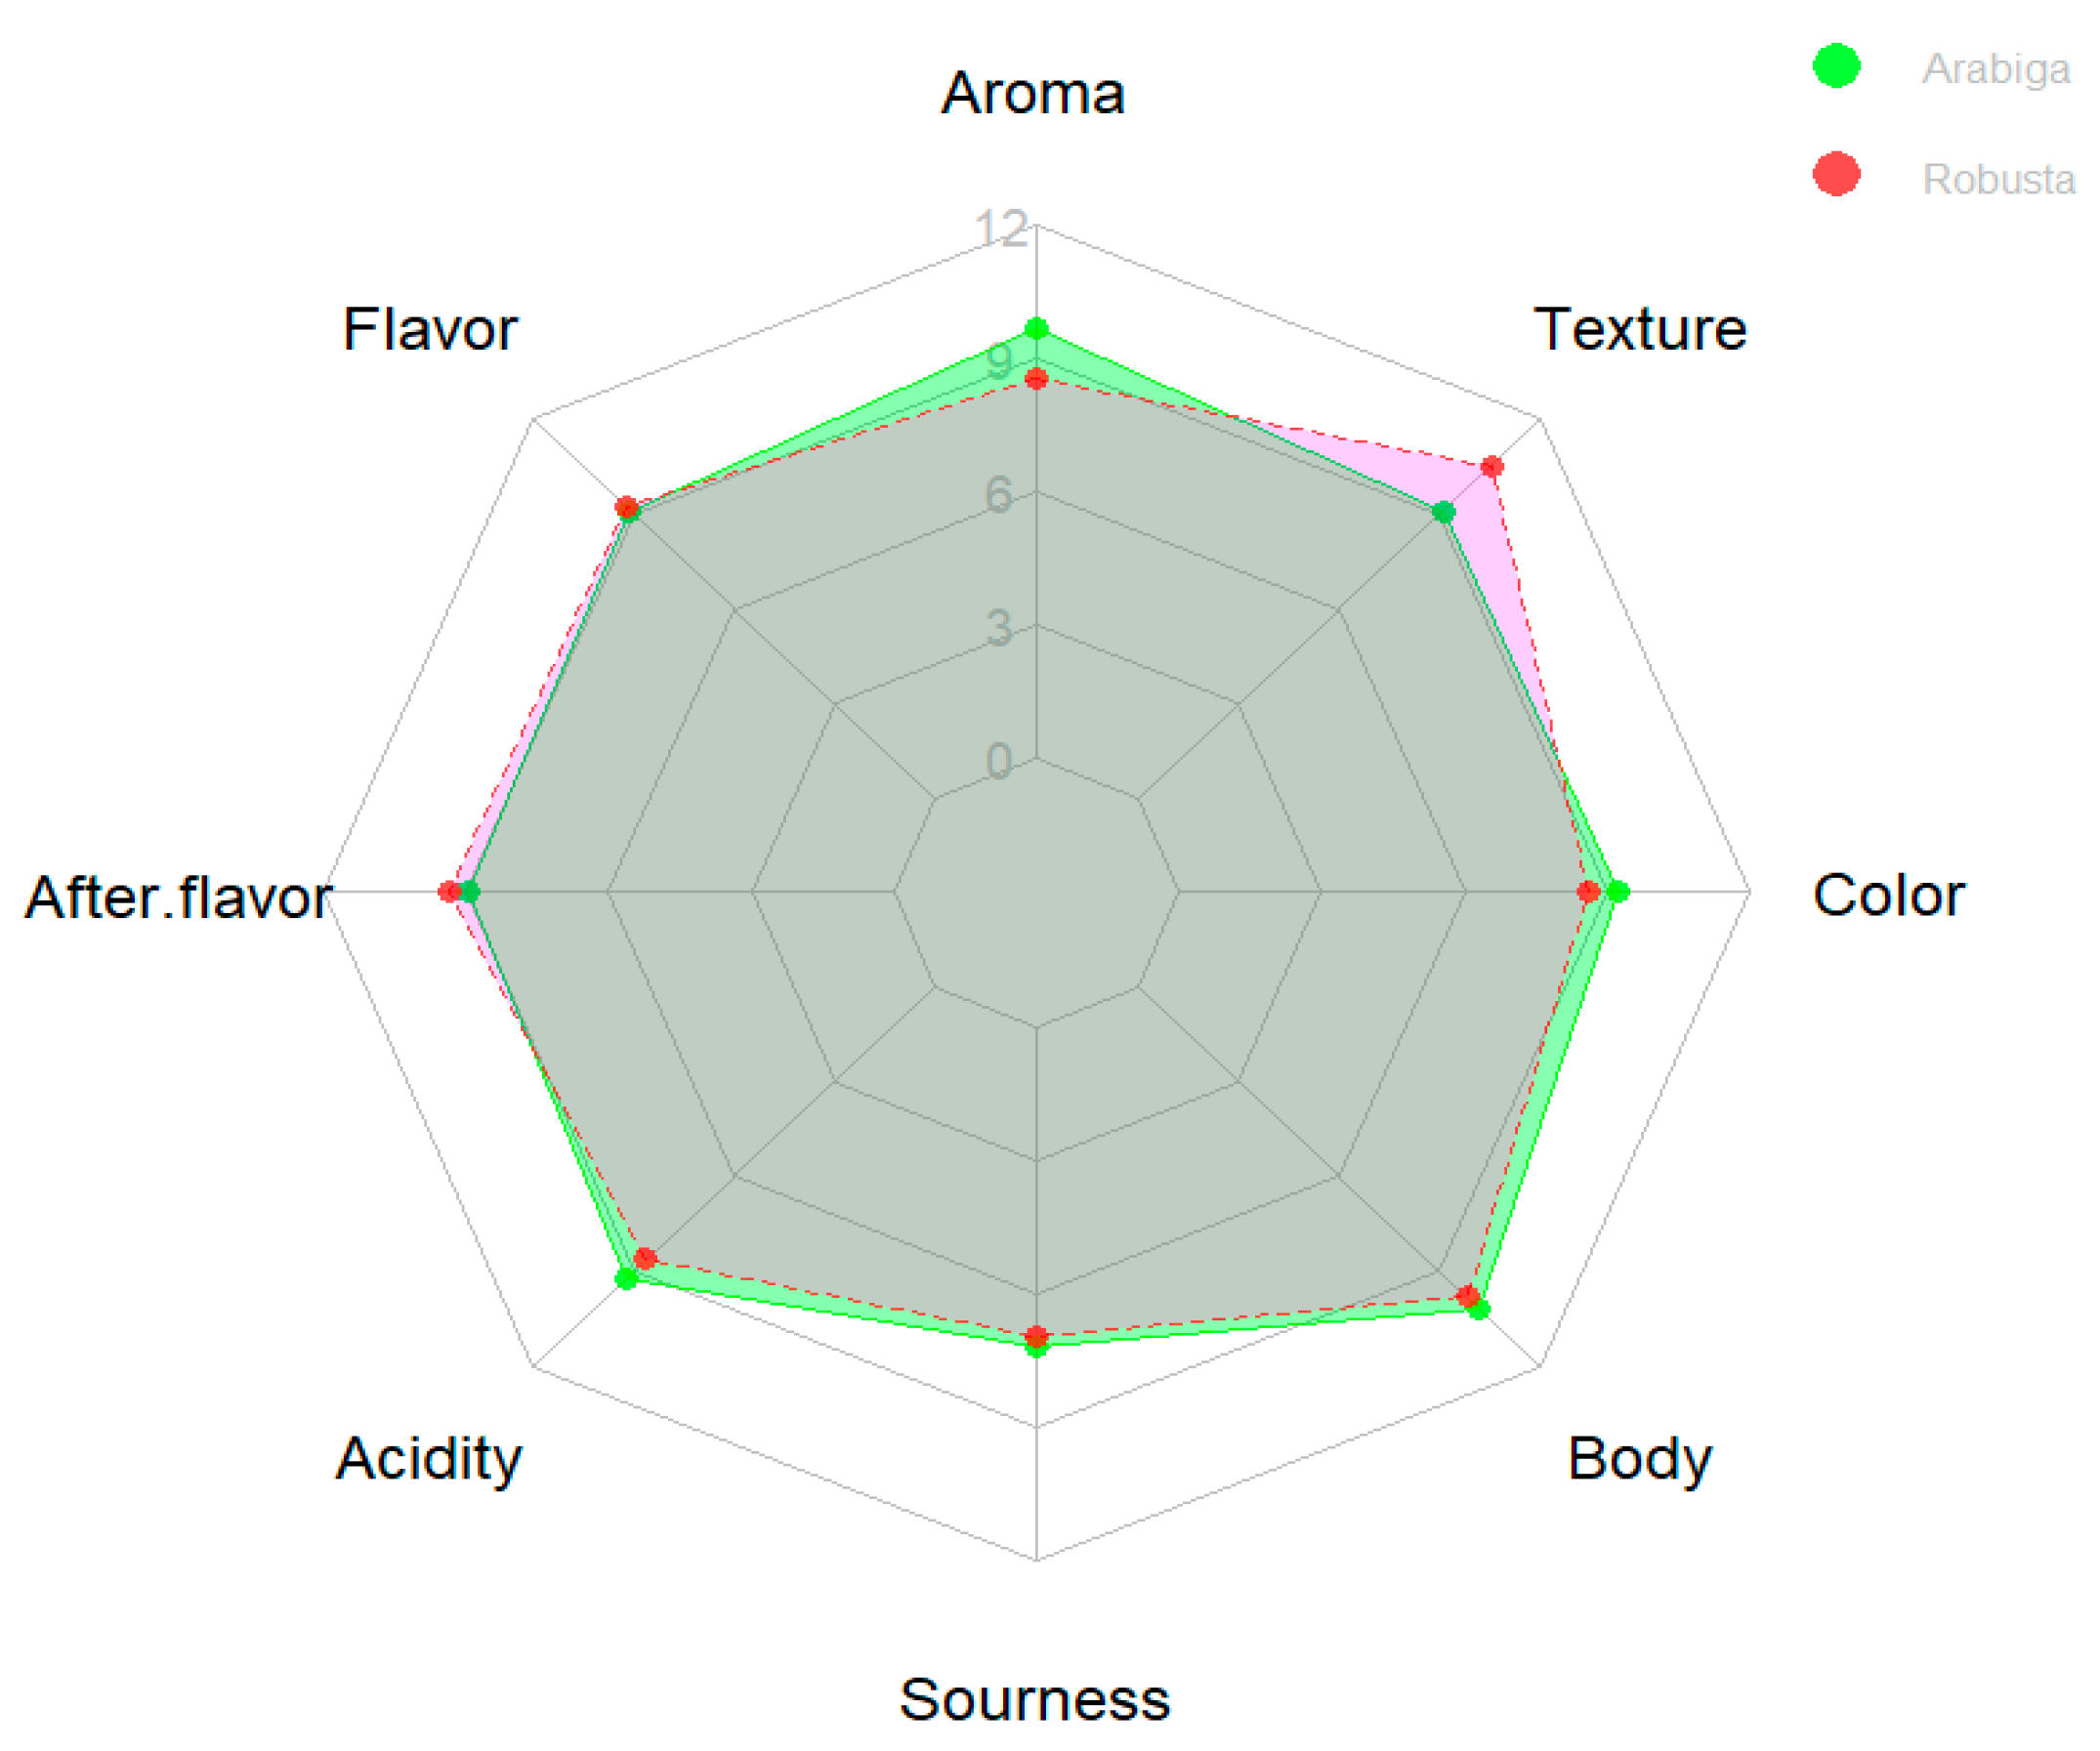
The C. arabica species predominates in fragrance with a mean score of 8.05 ± 1.234, while the lowest value was for bitterness with a mean of 6 ± 2.534. C. canephora predominates in bean texture with a mean score of 8.8, while the lowest score was for bitterness 5.8 ± 2.201. Flavor, residual flavor, acidity, body, and coloring are comparable in the two species (Figure 8).

4. Discussion

When comparing the results obtained for both Coffea species, it is not possible to establish a relationship between the province and the highest phenolic content, as both recorded higher values in different provinces, but when the lowest values were recorded, a tendency was established in the province of Loja for C. arabica and C. canephora. For C. canephora, Guayas province is among the provinces with the highest content. According to Carvalho Neto et al. [35], the beans contain high concentrations of caffeine, phenolic compounds, flavonoids, and triacylglycerols, bioactive compounds with high antioxidant and antimicrobial activity. Hudáková et al. [36] support these claims by stating that coffee is an exceptional source of antioxidants, particularly phenolic compounds, which play a significant role in neutralizing free radicals.
Mature coffee plants contain phenolic compounds such as catechins, carotenoids, anthocyanins, and chlorogenic acids [37]. The high content of phenolic compounds in leaves compared to coffee beans is congruent with Patay et al. [21], who reported that leaves have a higher concentration of chlorogenic acid compared to other parts of the plant because its presence is related to the level of exposure to UV light.
Chlorogenic acids comprise hydroxycinnamic esters with quinic acid, including caffeoylquinic acid, dicaffeoylquinic acid, feruloylquinic acid, and coumaroylquinic acid, compounds that show antioxidant capacity [38]. Chlorogenic acids, present in coffee, have attracted the attention of several researchers as it has antioxidant, antibacterial, antiviral, antibiotic, anti-inflammatory, and neuroprotective properties. Clinical applications are being developed thanks to their cardiovascular properties in the treatment of hypertension, as its role in plants is an intermediate for the synthesis of lignin [39].
The results regarding the neutralization of DPPH radicals show that for each gram of sample, a Trolox equivalent of 65.875 ± 1.129 µmol TEAC/g dw is inhibited in the fruits of the C. arabica species originating in the province of Imbabura, while the lowest concentration is observed in Los Ríos. As for leaves, the highest concentration was recorded in the province of Loja, while the lowest value was found in Bolivar. Abdulmajid [40] and Guambi et al. [4] mention that the antioxidant character of coffee varies depending on various pre-harvest factors such as altitude, soil type, geographical location, and plant genetics. Concerning the fruits of the C. canephora species, the highest antioxidant concentration was recorded in the province of Loja, in contrast to Sucumbios (lowest value). For leaves, the highest concentration was found in the province of Guayas, while the lowest was recorded in Loja. Lemos et al. [41] reported that the diversity present in the environments where coffee is grown can influence the chemical composition depending on the genetic variability of the species, harvesting processes, and other agronomic conditions. The highest antioxidant activity determined through the ABTS method was observed in C. arabica (23.179 ± 1.802 µmol TEAC/g dw) and C. canephora (24.533 ± 0.202 µmol TEAC/g dw) ripe fruits from Cotopaxi and Guayas provinces, respectively. Acidri et al. [42] reported on the antioxidant capacity of ripe coffee beans, highlighting that the fruits are the most crucial component of the plant and that as they ripen, approximately 7% of the total content of chlorogenic acids is lost, increasing the antioxidant character. Additionally, Platzer et al. [43] mention that absorbance readings can be affected, since the ABTS method measures hydrophilic antioxidants, leading to overestimates due to the thermodynamics of the reaction.
In the FRAP assay, Pacheco-Coello & Rabottini-Villamizar [44] reported the reducing potential of the ferric ion (Fe3+) with a value of 178.32 ± 0.99 μmol Fe2+/g, which differs significantly from the results obtained here, where the best readings were given in fruits and leaves of C. arabica species originating from the provinces of Imbabura (100.164 ± 0.332 μmol Fe2+/g dw) and Pichincha (102.705 ± 0.447 μmol Fe2+/g dw).
Echegaray et al. [45] point out that FRAP, being an assay based on redox reactions, is susceptible to any substance capable of yielding electrons, causing measurement errors due to possible interference. This assay is also limited when certain substances are found in the sample used through the assay, such as fluorides, phosphates, citrates, tartrates, the presence of lipids, and other intracellular molecules which can interfere with phenolics determination [46,47]. Ahmed et al. [23] mention in their study that they found both increases and decreases in secondary metabolites and sensory characteristics that define coffee quality in response to changes in environmental conditions. It is also influenced by the microenvironment in which the compound is located, which could result in interactions with each other, producing synergistic or inhibitory effects [48].
It is important to consider that the antioxidant capacity present in food originating from plants is not determined solely by the sum of the individual antioxidant capacities of each component [49]. Our results showed a positive correlation for C. arabica between the DPPH assay and TPC (0.571 ***), TFC (0.468 ***), and between ABTS and TPC (0.684 ***) and TFC (0.640 ***). In the case of C. canephora, significant correlations were observed between antioxidant activity determined through all assays used and secondary metabolites: DPPH and TPC (0.943 ***) and TFC (0.839 ***), ABTS and TPC (0.980 ***) and TFC (0.933 ***). In contrast to C. arabica, C. canephora showed significant correlation between FRAP and TPC (0.944 ***) and TFC (0.874 ***).
A representative metabolite of coffee is caffeine, contained in both green and roasted coffee beans and also in coffee beverages; the average caffeine content in green beans in C. arabica ranged from 0.7 to 1.3% [50]. In our tested samples, the caffeine content was higher in C. canephora collected from 2 of 5 provinces, compared with C. arabica; but lower than that described in the literature [51]. The caffeine content was found in higher percentages in the fruit of C. canephora from the province of Loja. According to Koshiro et al. [52], the caffeine content increases related to the stage of growth, being higher when the fruit is green or not completely reddened. Perdani et al. [53] noted that coffee fruits have a high content of phenolics, with chlorogenic acids being the highest phytochemical compound found (90%). In the same study, it was determined that the geographical position of the crop for the plant has a significant influence on the content of both phenolics and caffeine. According to Vega et al. [54], the amount of caffeine present in coffee plants is related to its role as a defense mechanism against herbivores, while for Stevenson et al. [55], the concentration of this metabolite could be related to the need to stimulate pollinators.
Sensory analysis of pulped coffee fruit showed differences between the parameters measured by Cotacallapa et al. [56], the organoleptic quality of the fruit depends on the cultivation practices, as well as the genetic origin or similarity of the variables. For Alves et al. [57], the organoleptic properties of coffee beans are affected by the amount of direct light received by the plant. The highest score was received for aroma. Ludwig et al. [58] mention that green coffee is characterized by mild aromas related to plant parts, such as flowers, fruits, and vegetables; the desirable fragrance associated with coffee beverages develops during roasting. According to Velásquez & Banchón [59], C. arabica is considered a high-altitude coffee and is characterized by a weak body, somewhat acidic, and strong fragrance due to its low caffeine content, while the altitude of cultivation of C. canephora is lower and gives it a less acidic sensory characteristic.

5. Conclusions

Coffee grown in the provinces in the Coastal region, with optimal temperatures ranging from 22 to 26 °C, has been found to yield better concentrations of phenols and flavonoids, along with enhanced antioxidant capacity. Notably, the highest antioxidant capacity for DPPH and ABTS tests was observed in Cotopaxi province for C. arabica and Loja province for C. canephora. Furthermore, C. canephora exhibited the highest caffeine content, which is a typical characteristic of this species. In sensory tests, C. arabica obtained the best score, while C. canephora scored the highest in terms of texture. These findings underscore the influence of environmental conditions on the production of bioactive compounds, biological capacity, and the sensory attributes of coffee, highlighting the potential for optimizing cultivation practices to enhance the quality and antioxidant properties of coffee beans.

Author Contributions

Conceptualization, R.A.M.; methodology, D.C.O.-P., K.M.I.-P. and M.Y.V.-P.; software, L.A.S.-T. and M.L.V.-L.; formal analysis, D.C.O.-P., K.M.I.-P., M.Y.V.-P., L.A.S.-T., M.L.V.-L. and N.S.C.-I.; writing—original draft preparation, R.A.M., E.J.M.-H. and R.D.C.; writing—review and editing, R.A.M., E.J.M.-H. and R.D.C.; supervision, R.A.M.; project administration, R.A.M.; funding acquisition, R.A.M. All authors have read and agreed to the published version of the manuscript.

Funding

This research was funded by Universidad de las Fuerzas Armadas-ESPE, grant number CV-GNP-0066-2020, and the Institute of Biology, Bucharest, Romanian Academy, grant number RO1567-IBB08/2023. The APC was funded by Universidad de las Fuerzas Armadas-ESPE.

Data Availability Statement

Data are contained within the article.

Acknowledgments

The authors gratefully acknowledge CICTE from the University of Army Forces-ESPE.

Conflicts of Interest

The authors declare no conflicts of interest. The funders had no role in the design of the study; in the collection, analyses, or interpretation of data; in the writing of the manuscript; or in the decision to publish the results.

References

  1. Varela, L.A.; Ron, S.R. Geografía y Clima del Ecuador. BIOWEB. Pontificia Universidad Católica del Ecuador. 2018. Available online: https://bioweb.bio/geografiaClima.html/ (accessed on 19 December 2023).
  2. Gotteland, M.; De Pablo, S. Some truths about coffee. Rev. Chil. Nutr. 2007, 34, 105–115. [Google Scholar] [CrossRef]
  3. Ponce-Vaca, L.A.; Orellana-Suarez, K.D.; Acuña-Velásquez, I.R.; Alfonso-Alemán, J.L.; Fuentes Figueroa, T. Situación de la caficultura ecuatoriana: Perspectivas. Rev. Estud. Desarro. Soc. Cuba. América Lat. 2018, 6, 307–325. [Google Scholar]
  4. Guambi, L.A.D.; Cedeño, S.d.R.V.; Talledo, D.S.F. Organoleptic Quality of Arabica Coffees in Relation to the Varieties and Altitudes of the Cultivation Zones, Ecuador. Rev. Iberoam. Tecnol. Postcosecha 2017, 18, 67–77. [Google Scholar]
  5. Arreaga Ronquillo, E.; Quezada Campoverde, J.; Barrezueta Unda, S.; Cervantes Alava, A.; Prado Carpio, E. Economic impact generated by coffee production in Ecuador in the period 2016–2019. 593 Digit. Publ. CEIT 2021, 6, 83–91. [Google Scholar] [CrossRef]
  6. Davis, A.P.; Govaerts, R.; Bridson, D.M.; Stoffelen, P. An annotated taxonomic conspectus of the genus Coffea (Rubiaceae). Bot. J. Linn. Soc. 2006, 152, 465–512. [Google Scholar] [CrossRef]
  7. Carvajal Herrera, J.J.; Aristizábal Torres, I.D.; Oliveros Tascón, C.E.; Mejía Montoya, J.W. Colorimetry of the Coffee Fruit (Coffea arabica L.) during its Development and Ripening. Rev. Fac. Nac. Agron. Medellín 2011, 64, 6229–6240. [Google Scholar]
  8. Farah, A.; Ferreira dos Santos, T. Chapter 1—The Coffee Plant and Beans: An Introduction. In Coffee in Health and Disease Prevention; Preedy, V.R., Ed.; Academic Press: Cambridge, MA, USA, 2015; pp. 5–10. [Google Scholar] [CrossRef]
  9. Beining, A.; Burkhardt, J.; Fetene, M. Water relations of Ethiopian wild coffee populations: Genetic fixation and phenotypic plasticity. In Proceedings of the 22nd International Scientific Colloquium on Coffee, Campinas, International Scientific Association on Coffee, CDROM-A105, Paris, France, 14–19 September 2008. [Google Scholar]
  10. INIAP. 2017 Guide to Facilitate Learning in the Management of Robusta Coffee (Coffea canephora P.). Learning Guide N° 008. Available online: https://repositorio.iniap.gob.ec/bitstream/41000/4788/7/iniapeecaga008.pdf (accessed on 2 December 2023).
  11. Vizuete-Montero, M.O.; Figueroa-Saavedra, H.F.; Barbaru-Grajales, A.D.; Zapata- Mayorga, H.A.; Herrera-Ocaña, H.R.; Moya, W. Physio-edaphoclimatic factors show optimal soil suitability for three tropical crops in the Ecuadorian Amazon. Sci. Agric. 2024, 81, e20220214. [Google Scholar] [CrossRef]
  12. Dethlefsen & Balk. Plant, Varieties and Growing Areas. 2018. Available online: https://www.dethlefsen-balk.de/ESP/10889/Kaffeepflanze.html (accessed on 20 December 2023).
  13. Clifford, M.N.; Willson, K.C. Coffee: Botany, Biochemistry and Production of Beans and Beverage, 1st ed.; Clifford, M.N., Ed.; Springer: Berlin, Germany; Croom Helm;: London, UK; Sydney, Australia; Westport, CT, USA, 1985; pp. 13–47. [Google Scholar]
  14. Gómez-Merino, F.; Trejo-Téllez, L.I.; Morales-Ramos, V.; Marín-Garza, T.; Crosby-Galván, M. Nutritional assessment of Robusta coffee (Coffea canephora) beans of different origins processed in Mexico. Agroproductividad 2018, 11, 25–29. [Google Scholar]
  15. Starovicova, M.; Hartemink, R. Food-Info.net: La planta de café. Food-Info: La Planta de Café. 2021. Available online: https://www.food-info.net/es/products/coffee/plant.htm (accessed on 20 November 2023).
  16. Cornelissen, P. Pictura Antique Prints: Antique Prints, Art, Maps and Books. Cafe Cofee Tree Coffea Arabica. 2021. Available online: https://pictura-prints.com/product/antique-print-pl-85-cafe-coffee-tree-coffea-arabica-turpin-chaumeton-1814/ (accessed on 20 November 2023).
  17. Vilaplana, M. Antioxidantes presentes en los alimentos. Vitaminas, minerales y suplementos. Ámbito Farmac. Nutric. 2007, 26, 79–86. Available online: https://www.elsevier.es/es-revista-offarm-4-articulo-antioxidantes-presentes-alimentos-vitaminas-minerales-13112893 (accessed on 20 December 2023).
  18. Wang, X.; Meng, Q.; Peng, X.; Hu, G.; Qiu, M. Identification of new diterpene esters from green Arabica coffee beans, and their platelet aggregation accelerating activities. Food Chem. 2018, 263, 251–257. [Google Scholar] [CrossRef] [PubMed]
  19. Good Kitzberger, C.S.; dos Santos Scholz, M.B.; de Toledo Benassi, M. Bioactive compounds content in roasted coffee from traditional and modern Coffea arabica cultivars grown under the same edapho-climatic conditions. Food Res. Int. 2014, 61, 61–66. [Google Scholar] [CrossRef]
  20. Mitraka, G.-C.; Kontogiannopoulos, K.N.; Batsioula, M.; Banias, G.F.; Assimopoulou, A.N. Spent Coffee Grounds’ Valorization towards the Recovery of Caffeine and Chlorogenic Acid: A Response Surface Methodology Approach. Sustainability 2021, 13, 8818. [Google Scholar] [CrossRef]
  21. Patay, É.B.; Sali, N.; Kőszegi, T.; Csepregi, R.; Balázs, V.L.; Németh, T.S.; Németh, T.; Papp, N. Antioxidant potential, tannin and polyphenol contents of seed and pericarp of three Coffea species. Asian Pac. J. Trop. Med. 2016, 9, 366–371. [Google Scholar] [CrossRef]
  22. Buffo, R.A.; Cardelli-Freire, C. Coffee flavor: An overview. Flavour Frag. J. 2004, 19, 99–104. [Google Scholar] [CrossRef]
  23. Ahmed, S.; Brinkley, S.; Smith, E.; Sela, A.; Theisen, M.; Thibodeau, C.; Warne, T.; Anderson, E.; Van Dusen, N.; Giuliano, P.; et al. Climate Change and Coffee Quality: Systematic Review on the Effects of Environmental and Management Variation on Secondary Metabolites and Sensory Attributes of Coffea arabica and Coffea canephora. Front. Plant Sci. 2021, 12, 708013. [Google Scholar] [CrossRef]
  24. Buzzo Mori, A.L.; Kalschne, D.L.; Gava Ferrão, M.A.; Almeida da Fonseca, A.F.; Gava Ferrão, R.; de Toledo Benassi, M. Diterpenes in Coffea canephora. J. Food Compos. Anal. 2016, 52, 52–57. [Google Scholar] [CrossRef]
  25. Kaisangsri, N.; Selammasakul, O.; Sonklin, C. Phenolic Compounds and Biological Activities of Coffee Extract for Cosmetic Product. J. Sci. Engin. 2019, 1, 71–76. Available online: https://www.jstage.jst.go.jp/article/sjse/1/1/1_71/_pdf/-char/ja (accessed on 20 December 2023).
  26. Madaan, R.; Bansal, G.; Kumar, S.; Sharma, A. Estimation of total phenols and flavonoids in extracts of Actaea spicata roots and antioxidant activity studies. Indian J. Pharm. Sci. 2011, 73, 666–669. [Google Scholar] [CrossRef]
  27. Arvouet-Grand, A.; Vennat, B.; Pourrat, A.; Legret, P. Standardization of propolis extract and identification of principal constituents. J. Pharm. Belg. 1994, 49, 462–468. [Google Scholar]
  28. Wanyika, H.N.; Gatebe, E.G.; Gitu, L.M.; Ngumba, E.K.; Maritim, C.W. Determination of caffeine content of tea and instant coffee brands found in the Kenyan market. Afr. J. Food Sci. 2010, 4, 353–358. [Google Scholar] [CrossRef]
  29. Guo, D.J.; Cheng, H.L.; Chan, S.W.; Yu, P.H.F. Antioxidative activities and the total phenolic contents of tonic Chinese medicinal herbs. Inflammopharmacology 2008, 16, 201–207. [Google Scholar] [CrossRef]
  30. Loizzo, M.R.; Pacetti, D.; Lucci, P.; Núñez, O.; Menichini, F.; Frega, N.G.; Tundis, R. Prunus persica var. platycarpa (Tabacchiera Peach): Bioactive compounds and antioxidant activity of pulp, peel and seed ethanolic extracts. Plant Foods Hum. Nutr. 2015, 70, 331–337. [Google Scholar] [CrossRef]
  31. Benzie, I.F.F.; Szeto, Y.T. Total antioxidant capacity of teas by the ferric reducing/antioxidant power assay. J. Agric. Food Chem. 1999, 47, 633–636. [Google Scholar] [CrossRef]
  32. Garrido-Martín, D.; Calvo, M.; Reverter, F.; Guigó, R. A fast non-parametric test of association for multiple traits. Genome Biol. 2023, 24, 230. [Google Scholar] [CrossRef]
  33. Osman, M.A.; Mahmoud, G.I.; Shoman, S.S. Correlation between total phenols content, antioxidant power and cytotoxicity. Biointerface Res. Appl. Chem. 2020, 11, 10640–10653. [Google Scholar] [CrossRef]
  34. Maurage, P.; Heeren, A.; Pesenti, M. Does Chocolate Consumption Really Boost Nobel Award Chances? The Peril of over-Interpreting Correlations in Health Studies. J. Nutr. 2013, 143, 931–933. [Google Scholar] [CrossRef] [PubMed]
  35. Carvalho Neto, D.P.D.; Gonot-Schoupinsky, X.P.; Gonot-Schoupinsky, F.N. Coffee as a Naturally Beneficial and Sustainable Ingredient in Personal Care Products: A Systematic Scoping Review of the Evidence. Front. Sustain. 2021, 2, 697092. [Google Scholar] [CrossRef]
  36. Hudáková, J.; Marcinčáková, D.; Legáth, J. Study of antioxidant effects of selected types of coffee. Folia Vet. 2016, 60, 34–38. [Google Scholar] [CrossRef]
  37. Maxiselly, Y.; Anusornwanit, P.; Rugkong, A.; Chiarawipa, R.; Chanjula, P. Morpho-Physiological Traits, Phytochemical Composition, and Antioxidant Activity of Canephora Coffee Leaves at Various Stages. Int. J. Plant Biol. 2022, 13, 11. [Google Scholar] [CrossRef]
  38. Tajik, N.; Tajik, M.; Mack, I.; Enck, P. The potential effects of chlorogenic acid, the main phenolic components in coffee, on health: A comprehensive review of the literature. Eur. J. Nutr. 2017, 56, 2215–2244. [Google Scholar] [CrossRef] [PubMed]
  39. Behne, S.; Franke, H.; Schwarz, S.; Lachenmeier, D.W. Risk Assessment of Chlorogenic and Isochlorogenic Acids in Coffee By-Products. Molecules 2023, 28, 5540. [Google Scholar] [CrossRef] [PubMed]
  40. Abdulmajid, A.M. Sensory Evaluation of beverage characteristics and biochemical components of Coffee Genotypes. Agric. Food Sci. 2015. Available online: https://api.semanticscholar.org/CorpusID:212469690 (accessed on 20 November 2023).
  41. Lemos, M.F.; de Andrade Salustriano, N.; de Souza Costa, M.M.; Lirio, K.; da Fonseca, A.F.A.; Pacheco, H.P.; Endringer, D.C.; Fronza, M.; Scherer, R. Chlorogenic acid and caffeine contents and anti-inflammatory and antioxidant activities of green beans of conilon and arabica coffees harvested with different degrees of maturation. J. Saudi Chem. Soc. 2022, 26, 101467. [Google Scholar] [CrossRef]
  42. Acidri, R.; Sawai, Y.; Sugimoto, Y.; Handa, T.; Sasagawa, D.; Masunaga, T.; Yamamoto, S.; Nishihara, E. Phytochemical Profile and Antioxidant Capacity of Coffee Plant Organs Compared to Green and Roasted Coffee Beans. Antioxidants 2020, 9, 93. [Google Scholar] [CrossRef]
  43. Platzer, M.; Kiese, S.; Herfellner, T.; Schweiggert-Weisz, U.; Miesbauer, O.; Eisner, P. Common Trends and Differences in Antioxidant Activity Analysis of Phenolic Substances Using Single Electron Transfer Based Assays. Molecules 2021, 26, 1244. [Google Scholar] [CrossRef]
  44. Pacheco-Coello, F.; Rabottini-Villamizar, T. Cafeína, Compuestos Fenólicos y Actividad Antioxidante en Granos de café Orgánico (Coffea arabica var. caturra) Sometidos a Tres Tiempos de Tostado, Nirgua, Estado Yaracuy, Venezuela; Saber, Universidad de Oriente: Cumaná, Venezuela, 2022; Volume 34, pp. 20–27. [Google Scholar] [CrossRef]
  45. Echegaray, N.; Pateiro, M.; Munekata, P.E.S.; Lorenzo, J.M.; Chabani, Z.; Farag, M.A.; Domínguez, R. Measurement of Antioxidant Capacity of Meat and Meat Products: Methods and Applications. Molecules 2021, 26, 3880. [Google Scholar] [CrossRef]
  46. Rajurkar, N.; Gaikwad, K.; Razavi, M.S. Evaluation of Free Radical Scavenging Activity of Justicia Adhatoda: A Gamma. Int. J. Pharm. Pharm. Sci. 2012, 4, 1–4. Available online: https://web.archive.org/web/20180413024655id_/http://ijppsjournal.com/Vol4Suppl4/3734.pdf (accessed on 20 November 2023).
  47. Tuncay, M.E. Comparison of Spectrophotometric Assays Determining Total Antioxidant Capacity Toplam Antioksidan Kapasiteyi Belirleyen Spektrofotometrik Yöntemlerin Karşılaştırılması. Türk Klin. Biyokim. Derg. 2019, 17, 111–119. Available online: https://tkb.dergisi.org/pdf/pdf_TKB_350.pdf (accessed on 20 November 2023).
  48. Mendoza Isaza, N.A.; Hoyos-Arbeláez, J.A.; Peláez-Jaramillo, C.A. Antioxidant capacity and total polyphenol content of Stevia rebaudiana stem extracts in several in vitro models. Rev. EIA 2020, 17, 1–9. [Google Scholar] [CrossRef]
  49. Rivas, D.; Dueñas, A.; Rodriguez, J. Secondary metabolites and antioxidant activity of wild tomatillo (Solanum pimpinellifolium L.). Rev. Ténica La Fac. Ing. 2020, 2, 26–32. [Google Scholar]
  50. Demianova, A.; Bobkova, A.; Lidiková, J.; Jurcaga, L.; Bobko, M.; Belej, L.; Kolek, E.; Polakova, K.; Iriondo-DeHond, A.; del Castillo, M. Volatiles as chemical markers suitable for identification of the geographical origin of green Coffea arabica L. Food Controñ 2022, 136, 3–7. [Google Scholar] [CrossRef]
  51. Teixeira, A.L.; Rocha, R.B.; Espindula, M.C.; Ramalho, A.R.; Júnior, J.R.V.; Alves, E.A.; Lunz, A.M.P.; Souza, F.d.F.; Costa, J.N.M.; Fernandes, C.d.F. Amazonian Robustas: New Coffea canephora coffee cultivars for the Western Brazilian Amazon. Crop Breed. Appl. Biotechnol. 2020, 20, e323420318. [Google Scholar] [CrossRef]
  52. Koshiro, Y.; Zheng, X.-Q.; Wang, M.-L.; Nagai, C.; Ashihara, H. Changes in content and biosynthetic activity of caffeine and trigonelline during growth and ripening of Coffea arabica and Coffea canephora fruits. Plant Sci. 2006, 171, 242–250. [Google Scholar] [CrossRef]
  53. Perdani, C.G.; Pranowo, D.; Qonitatilah. Total phenols content of green coffee (Coffea arabica and Coffea canephora) in East Java. IOP Conf. Ser. Earth Environ. Sci. 2019, 230, 012093. [Google Scholar] [CrossRef]
  54. Vega, F.E.; Ziska, L.H.; Simpkins, A.; Infante, F.; Davis, A.P.; Rivera, J.A.; Barnaby, J.Y.; Wolf, J. Early growth phase and caffeine content response to recent and projected increases in atmospheric carbon dioxide in coffee (Coffea arabica and C. canephora). Sci. Rep. 2020, 10, 5875. [Google Scholar] [CrossRef] [PubMed]
  55. Stevenson, P.C.; Nicolson, S.W.; Wright, G.A. Plant secondary metabolites in nectar: Impacts on pollinators and ecological functions. Funct. Ecol. 2017, 31, 65–75. [Google Scholar] [CrossRef]
  56. Cotacallapa, R.E.; Lima-Medina, I.; Cornejo-Condori, G.B. Comparative organoleptic quality of coffee (Coffea arabica L.) in Puno-Peru and La Paz-Bolivia. Rev. Investig. Altoandinas 2019, 21, 283–292. [Google Scholar] [CrossRef]
  57. Alves, A.L.; Pessoa, M.S.; de Souza, P.E.N.; Partelli, F.L.; Moscon, P.S.; da Silva, E.C.; Guimarães, A.O.; Muniz, E.P.; Pinheiro, P.F.; Borém, F.M.; et al. Influence of Environmental and Microclimate Factors on the Coffee Beans Quality (C. 65 canephora): Correlation between Chemical Analysis and Stable Free Radicals. Agric. Sci. 2018, 9, 9082. [Google Scholar] [CrossRef]
  58. Ludwig, I.A.; Clifford, M.N.; Lean, M.E.J.; Ashihara, H.; Crozier, A. Coffee: Biochemistry and potential impact on health. Food Funct. 2014, 5, 1695–1717. [Google Scholar] [CrossRef] [PubMed]
  59. Velásquez, S.; Banchón, C. Influence of pre- and post-harvest factors on the organoleptic and physicochemical quality of coffee: A short review. J. Food Sci. Technol. 2022, 60, 1–13. [Google Scholar] [CrossRef] [PubMed]
Figure 1. Summary of general characteristics of coffee plants Coffea arabica L. and Coffea canephora L. The optimal height for C. arabica is 800 to 2000 m above sea level, while C. canephora develops better from sea level to 700 m (Adapted from Gómez-Merino et al. [14], Starovicova & Hartemink [15], Cornelissen [16]).
Horticulturae 10 00200 g001
Figure 2. Coffea arabica L. and Coffea canephora L. sampling of crops cultivated in different Ecuadorian Provinces, stating the common chemical compounds and the role that antioxidant compounds play against free radicals, as well as the optimal growth conditions for each species, the species C. canephora is cultivated in the provinces of Cotopaxi, Guayas, Loja, Santo Domingo y Sucumbios while the species C. arabica is cultivated in the provinces of Bolivar, Cotopaxi, Guayas, Imbabura, Loja, Los Rios, Pichincha, Santo Domingo, Sucumbios.
Horticulturae 10 00200 g002
Figure 3. Total phenolic and flavonoid content from leaves and fruits for C. arabica (a) and C. canephora (b) collected from different regions of Ecuador. Legend: TFC—total flavonoid content, TPC—total phenolic content.
Horticulturae 10 00200 g003
Figure 4. Antioxidant activity (ABTS, DPPH, and FRAP) of Coffea arabica fruits and leaves from all the tested provinces. Legend: ABTS—Free radical scavenging using ABTS radical cation assay, DPPH—Free radical scavenging using DPPH radical assay, FRAP—Ferric reducing antioxidant power assay).
Horticulturae 10 00200 g004
Figure 5. Antioxidant activity (ABTS, DPPH and FRAP) of Coffea canephora fruits and leaves from all the tested provinces. Legend: ABTS—Free radical scavenging using ABTS radical cation assay, DPPH—Free radical scavenging using DPPH radical assay, FRAP—Ferric reducing antioxidant power assay).
Horticulturae 10 00200 g005
Figure 6. Correlation of total flavonoid content and total phenolic content to ABTS, DPPH, and FRAP assays in the C. arabica between plant organs leaf and fruit. A high positive correlation is observed. Asterisks indicate the type of correlation, *** high correlation, ** medium correlation, * low correlation. Legend: ABTS—Free radical scavenging using the ABTS radical cation assay, DPPH—Free radical scavenging using the DPPH radical assay, FRAP—Ferric reducing antioxidant power assay).
Horticulturae 10 00200 g006
Figure 7. Correlation of total flavonoid content and total phenolic content to ABTS, DPPH, and FRAP assays in the C. robusta between plant organs leaf and fruit. A high positive correlation is observed. Asterisks indicate the type of correlation, *** high correlation, * low correlation. Legend: ABTS—Free radical scavenging using the ABTS radical cation assay, DPPH—Free radical scavenging using the DPPH radical assay, FRAP—Ferric reducing antioxidant power assay).
Horticulturae 10 00200 g007
Figure 8. Sensory and organoleptic evaluation of raw coffee beans.
Horticulturae 10 00200 g008
Table 1. Total Caffeine Content in C. arabica and C. canephora collected from different regions of Ecuador.
SpeciesProvinceCaffeine Content (mg/g dw)
Coffea arabicaPichincha1.76 ± 0.0729
Imbabura0.91 ± 0.00629
Sucumbios12.23 ± 0.52208
Cotopaxi13.96 ± 0.27289
Loja9.29 ± 0.03744
Bolívar13.87 ± 0.15794
Los Ríos15.09 ± 0.15803
Guayas13.38 ± 0.23911
Santo Domingo de los Tsáchilas3.26 ± 0.09705
Coffea canephoraSucumbios10.32 ±0.02242
Cotopaxi16.31 ± 0.10919
Loja18.05 ± 0.21232
Guayas11.61 ± 0.12294
Santo Domingo de los Tsáchilas1.97 ± 0.03557
Disclaimer/Publisher’s Note: The statements, opinions and data contained in all publications are solely those of the individual author(s) and contributor(s) and not of MDPI and/or the editor(s). MDPI and/or the editor(s) disclaim responsibility for any injury to people or property resulting from any ideas, methods, instructions or products referred to in the content.