Article

Characterization of Changes in Active Ingredients and Mining of Key Metabolites in Bletilla striata under Shading and Drought Stresses

1
School of Forestry and Landscape Architecture, Anhui Agricultural University, Hefei 230036, China
2
Anhui Provincial Key Laboratory of Forest Resources and Silviculture, Anhui Agricultural University, Hefei 230036, China
3
College of Forestry and Landscape Architecture, South China Agricultural University, Guangzhou 510642, China
4
Key Laboratory of Vegetation Restoration and Management of Degraded Ecosystems, South China Botanical Garden, Chinese Academy of Sciences, Guangzhou 510520, China
*
Author to whom correspondence should be addressed.
Horticulturae 2024, 10(2), 163; https://doi.org/10.3390/horticulturae10020163
Submission received: 2 January 2024 / Revised: 4 February 2024 / Accepted: 8 February 2024 / Published: 10 February 2024

Abstract

:
Shading and drought are considered crucial abiotic stress factors that limit the normal growth of plants. Under natural conditions, the quality of Bletilla striata pseudobulbs (BP), a Chinese traditional medicinal crop, is often affected by the dual stresses of shading and drought. However, the relationship and mechanism of the interaction between the two stress factors in B. striata remain unclear. In this study, we examined the changes in photosynthetic properties and active ingredients of B. striata under shading (L), drought (W), and shading-drought dual stresses (LW). We aimed to explore the metabolite mechanism that led to these changes using GC-MS-based non-targeted metabolomics techniques. The results indicated a significant reduction in the polysaccharide content of BP under W and LW treatments compared to the control (CK). The total phenol content was significantly reduced under L treatment, while the total flavonoid content did not change significantly under the three stresses. The significant increase in militarine content under all three stresses implies that B. striata may modulate its biosynthesis in response to different environmental stresses. Transpiration rate and stomatal conductance were reduced, amino acid expression was up-regulated, and carbohydrate expression was down-regulated in B. striata under L treatment. The net photosynthesis rate, stomatal conductance, and transpiration rate exhibited significant reductions, and the tuber metabolic disorder marker Homocysteine increased and organic acid content as well under W treatment. The net photosynthetic rate, transpiration rate, stomatal conductance, and water use efficiency of B. striata were further reduced under LW compared with single stress, which is in agreement with the “trade-off theory”. Pseudobulb metabolite changes, in combination with the results of the two single stresses, showed an up-regulation of amino acids and disaccharide compounds and a down-regulation of monosaccharide compounds. A support vector machine model (SVM) was used to screen 10 marker metabolites and accurately predict the changes in active ingredient content through an artificial neural network model (ANN). The results suggest that an appropriate stress environment can enhance the content of the target active ingredients based on cultivation goals.

1. Introduction

Bletilla striata (Thunb.) Rchb. f. (Orchidaceae) is a perennial herb renowned for its medicinal and ornamental properties. It boasts white, triangular, oblate, or irregular rhombic pseudobulbs, typically bifurcated into two to four forks, accompanied by fibrous roots. The plant produces white flowers arranged in unbranched racemes of 3 to 11, blooming from April to June. These blooms exhibit a spectrum of colors, ranging from purple, pink, and yellow to white, occasionally even featuring shades of blue. The species is predominantly found in eastern Asia, including the Yangtze River basin, the Qinling Mountains in China, Japan, Korea, and northern Myanmar [1,2]. B. striata is a shade-tolerant plant, and both high light intensity and excessive shade are detrimental to its growth and development. Under natural conditions, it thrives in deciduous evergreen forests, dong forests, coniferous forests, roadside bushes, or rock crevices [3]. A growing body of modern chemical and pharmacological research indicates that B. striata possesses various medicinal values, such as wound healing, hemostasis, antioxidant properties, anti-inflammatory actions, antifibrotic effects, and modulation of in vitro immune activity [2]. These pharmacologic effects are attributed to its diverse functional constituents, including polysaccharides, saponins, flavonoids, terpenoids, trace elements, and other chemical substances. As a traditional Chinese medicine (TCM), militarine in Bletilla striata pseudobulbs (BP) is recognized for its beneficial effects in slowing down the aging process and preventing dementia. The Chinese Pharmacopoeia sets the content of militarine at not less than 2% as a crucial indicator for the quality control of BP [4]. Due to overexploitation, habitat destruction, and changes in atmospheric conditions, the wild resources of B. striata have declined significantly, leading to increased reliance on cultivation. Its growth and development processes and medicinal values are influenced by various environmental factors. However, fewer studies have been conducted on the growth and accumulation of active compounds under artificial cultivation conditions.
As the most basic biochemical reaction in the plant, photosynthesis provides the material and energy base for the plant’s life activities and influences the plant’s growth and material accumulation. Light intensity directly affects the amount of photosynthesis a plant can perform. Shading can lower soil and canopy temperatures, increase humidity, affect plant photosynthesis and nutrient uptake, alter plant physiological and biochemical characteristics, and ultimately result in differences in yield and active ingredient content [5]. Too high or too low a light intensity has no beneficial effect on plant growth or the accumulation of photosynthetic products, while moderate shading can promote plant growth [6]. The production of secondary metabolites as effective active ingredients in most plants is closely related to their physiological metabolic processes. In addition to the genetic control of the physiological and metabolic processes, the external environment also affects the physiological and metabolic processes in the plant [7]. Photosynthesis provides precursors for secondary metabolites and also inhibits their decomposition. The study of plant secondary metabolism enables a better understanding of the process of plant adaptation to environmental changes.
Moisture is another external environmental factor that is critical to plant growth. To prevent water loss from the body, plants produce a variety of responses to adapt to dry environments, balancing optimal water supply to all vital organs while maintaining cellular water content. From a molecular biology perspective, cellular water loss marks the onset of drought stress. As drought stress gradually intensifies, the plant’s net photosynthesis rate decreases. Plants with strong drought resistance may be less affected by drought. Under drought stress, photosynthesis is reduced by three effects: stomatal closure, decreased photosynthetic enzyme activity, and slowed permeability to CO2 at the cell wall site of the cuticle [8]. At the cellular level, drought signaling promotes the production of stress-protective metabolites, such as proline and alginate, by a variety of peroxidases, triggering an antioxidant system that maintains the dynamic redox balance and prevents acute cellular damage and reduced membrane integrity. Specific signaling responses are also triggered by the level of drought stress and the plant organs experiencing the stress, including the abscisic acid, oleuropein steroid, and ethylene phytohormone pathways [9,10,11]. As drought stress-related metabolites broadly affect other metabolic activities, the synthesis and accumulation of secondary metabolites can also be affected. When exposed to drought stress, plants produce a number of low-molecular-weight osmotic solutions, including glycine, glutamate, proline, and a variety of other amino acids, organic acids, sugars, and sugar alcohols, which play an important role in maintaining cellular functions under drought. Drought stress can reduce the growth of most plants [12]. However, plants exposed to drought stress can accumulate higher concentrations of secondary metabolites. The changes occur in some phenolic and terpenoid compounds, which may be due to stress-induced changes in biomass associated with a constant rate of biosynthesis of natural products or to a true increase in total content. Under natural conditions, light and water stress often occur simultaneously, and there are different views on the effects of dual light and water stresses on the photosynthetic properties of plants. The “trade-off theory” indicates that shading will aggravate the impact of drought on plants. In order to cope with the impact of insufficient light in a shading environment, plants will increase the growth of aboveground parts to improve light capture capabilities and light energy utilization, reducing the ability to utilize soil water and aggravating the effects of drought [13]. In contrast, the “facilitation theory” suggests that shading can reduce the negative effects of drought on plants [14]. The “interaction theory” proposes that either too much or too little light will exacerbate the negative effects of drought on plants and that the effects of drought are mitigated in moderate shade [15]. The “independent effects theory” states that there is no interaction between drought and shade and that they are independent of each other [16].
Plants contain 100 thousand to 1 million metabolites, making the plant metabolome highly diverse [17]. Primary metabolites (i.e., sugars, sugar alcohols, amino acids, etc.) and secondary metabolites (i.e., terpenoids, phenols, nitrogenous compounds, etc.) act as “phytochemicals” in response to biotic and abiotic stresses on plants [18,19]. The study of plant metabolomics is critical to understanding plant adaptation and defense responses to environmental stress and greatly enhances our knowledge of plant growth, developmental metabolism, and signaling pathways. Moreover, militarine is used in the Chinese Pharmacopoeia as the only indicator to identify the quality of BP. Given the abundance of active ingredients in B. striata, however, it is difficult to comprehensively evaluate the quality of BP using only a single chemical index. Therefore, we comprehensively selected polysaccharides, total flavonoids, total phenols, and militarine as indicators for quality evaluation of B. striata and used two-year-old B. striata to reveal its quality changes under stress environments by simulating shading and drought stresses. We hope to reveal the response pattern and adaptive mechanism of B. striata growth and metabolism to drought and shading environments through metabolomics and to provide a theoretical basis for the efficient compound management and bionic cultivation of B. striata.

2. Materials and Methods

2.1. Growth Conditions, Experimental Design, and Sampling

On 15 August 2021, 100 2-year-old B. striata plants with consistent height and growth (average height of approximately 35 cm) were selected for the control test. The soil culture potting method was used to cultivate individual plants per pot with a mixed substrate of m (garden soil)/m (peat soil)/m (perlite) = 1:1:1. The size of the pot used is 11.6 cm × 10.5 cm × 8.8 cm, with a substrate of 220 g. The maximum field water holding capacity is 1181.82 g kg−1. During the seedling slowing process, regular weighing is used to calculate the moisture content to ensure that the substrate moisture content is uniform and sufficient (up to 75% of the maximum field water-holding capacity). The experiment started on 30 September 2021. After the seedlings slowed, the pots were placed in an artificial climate incubator (CLIMACELL, maximum light intensity 13,000 Lux, MMM Medcenter, Munich, Germany). The diurnal temperature control varied at 26 °C/24 °C (day/night), with 12 h of light time, 60% air humidity, and 60% maximum light intensity in the incubator. A two-factor split-zone experimental design was used, with the main factor being light intensity. Based on field observations, the incubator was set up with light at 20% maximal light intensity (shading treatment) and 60% maximal light intensity (control). The secondary factor is soil moisture control, which is achieved by using the moisture control gradient proposed by Hsiao [20] as follows: 30% (drought treatment, 78 g of water per pot, and subsequently maintaining a total weight of 298 g) and 75% (control, 195 g of water per pot, and subsequently maintaining a total weight of 415 g) of the maximum field water holding capacity (replenish water and weigh every 3 days to maintain the set soil moisture). Six replicates of each treatment were set up, and the length of the experiment was 60 d. At the end of the experiment, the photosynthetic parameters of B. striata plants were measured. BP were freeze-dried, ground into powder, and sieved through a 60-mesh sieve for metabolomics determination. The contents of polysaccharides, total flavonoids, total phenols, and militarine were determined.

2.2. Determination of Photosynthetic Gas Exchange Parameters

From 9:00 a.m. to 11:00 a.m., the middle sections of the second and third functional leaves of B. striata were selected, and their photosynthetic parameters were determined using a CIRAS-3 portable photosynthesis meter (PP-Systems, Amesbury, Massachusetts, USA). The parameters for the measurements were set to a light intensity of 600 μmol m−2 s−1, a leaf chamber temperature of 25 °C, a humidity of 60%, and a CO2 concentration of 500 μmol mol−1. The parameters measured included net photosynthetic rate (A), intercellular CO2 concentration (Ci), transpiration rate (E), stomatal conductance (gs), and water use efficiency (WUE). The stomatal limiting value (Ls) was also calculated as: L s = 1 C i / C a (Ca is the atmospheric CO2 concentration).

2.3. Determination of Polysaccharides, Total Flavonoids, and Total Phenol Content

The polysaccharide content of BP was determined according to the method of Lu et al. [17]. The polysaccharide content was determined using the phenol-sulfuric acid method. BP samples (50 mg) were homogenized in 1 mL of distilled water, extracted at 100 °C for 2 h, and centrifuged at 10,000× g for 10 min. Then, 0.2 mL of the supernatant was mixed with 0.8 mL of anhydrous ethanol, left overnight at 4 °C, and centrifuged again. The resulting supernatant was discarded, and the precipitate was dissolved in 1 mL of distilled water. The next 400 µL of the solution was mixed with 200 µL of phenol and 1 mL of 98% sulfuric acid. After incubating at 90 °C for 20 min and rapid cooling, a 1 mL aliquot was taken for further analysis. The absorbance was measured at 760 nm with a UV-visible spectrophotometer (Lambda 750s, PerkinElmer, Waltham, MA, USA). The standard curve was prepared using glucose as the x-axis and absorbance as the y-axis. The linear regression equation obtained was y = 0.0641 x + 0.0126 with an R2 value of 0.997.
The total flavonoid content was measured by a slightly modified version of the previous method [21]. The absorbance was measured at 510 nm using a UV-visible spectrophotometer, with the linear regression equation obtained as y = 869.02 x + 77.28 and an R2 value of 0.999, where Rutin was the x-axis and absorbance was the y-axis. The lyophilized BP samples (100 mg) were dissolved in 60% ethanol at a liquid-to-material ratio of 1:25. Extraction was performed by shaking at 60 °C for 2 h, centrifugation at 10,000× g and 25 °C for 10 min, and then the supernatant was collected, and the extraction was repeated and combined once. The extract was fixed with 60% ethanol in 10 mL. The total flavonoid content was calculated using a standard curve by taking 1 mL of the extract.
The total phenols were determined by the Folin-Ciocalteu method [22]. The absorbance was measured at 760 nm with a UV-visible spectrophotometer, with the linear regression equation obtained as y = 0.003884 x + 0.041138 and an R2 value of 0.999, where gallic acid was the x-axis and absorbance was the y-axis. The extraction method for total phenol was the same as that for total flavonoids, and the total phenol content was calculated using the standard curve.

2.4. Determination of Militarine Content

Referring to the method in the Pharmacopoeia [4], six 20-mg samples were weighed for each treatment, added to 1.5 mL of 50% ethanol, mixed, and extracted by ultrasonication for 30 min. The militarine content was measured using HPLC (Agilent Technologies 1260 Infinity II, Santa Clara, California, USA). The chromatographic separation conditions were a column temperature of 40 °C, a flow rate of 0.25 mL min−1, a mobile phase A of ultrapure water containing 0.1% acetic acid, and a mobile phase B of acetonitrile solution containing 0.1% formic acid. The sample was injected into 5 μL, and the absorption peak area at 223 nm was determined. The method was feasible after verification. The measured peak area was substituted into the militarine standard curve ( y = 30199 x + 354.08 , R2 = 0.9961, where x is the militarine content (mg mL−1) and y is the peak area of the sample absorbed at 223 nm). The militarine contents were calculated in samples for each treatment.

2.5. GC-MS-Based Metabolite Analysis

2.5.1. Metabolite Extraction and Derivatization

A 50 mg powder sample was put in a 2 mL centrifuge tube, to which 1 mL of methanol/water = 3:1 extract was added, followed by the addition of 40 μL of adonitol solution (0.2 mg mL−1) as an internal standard. This was further transferred to a plant tissue grinder, ground at 35 Hz for 4 min, and centrifuged at 10,000 r min−1 for 20 min. The supernatant was filtered through a 0.22 μm membrane. Then, 0.25 mL of the filtrate was pipetted into a 2 mL centrifuge tube, and the solvent was evaporated to dryness by placing the extract into a centrifugal concentrator. Moreover, 60 μL of methoxylamine hydrochloride solution (20 mg mL−1) was added and vortexed for 30 s, and the reaction was held at 80 °C for 30 min, followed by the addition of 63 μL of the derivatization reagent, BSTFA (99% BSTFA + 1% TMCS; Supelco, Bellefonte, PA, USA). The sample was held at 88 °C for 96 min. The aspirate was transferred to the injection vial, stored at 4 °C, and assayed within 48 h. The sample was then analyzed by the analyzer.

2.5.2. GC-MS Detection Conditions

Metabolite analysis using Thermo triple quadrupole tandem MS (TRACE1310 and TSQ8000, Thermo Scientific, Waltham, MA, USA). The GC separations were carried out using a DB-5 MS (Thermo Scientific, USA) capillary column (15 m × 0.25 mm × 0.25 μm). The sample injection volume was 1 μL; the determination was performed in split mode with a split ratio of 1:80; the inlet temperature was 280 °C; the initial temperature of the split-mode column was 40 °C for five minutes, and then it was warmed up to 200 °C at 8 °C min−1 for 3 min, followed by 280 °C at 4 °C min−1 for 5 min; the MS transmission line was 280 °C; and the ion source was 270 °C. All mass spectra were acquired in electron impact ionization (EI) mode (70 eV) with a full-scan range of 50–550 m/z at 9 scans per second after a solvent delay of 630 s.

3. Results

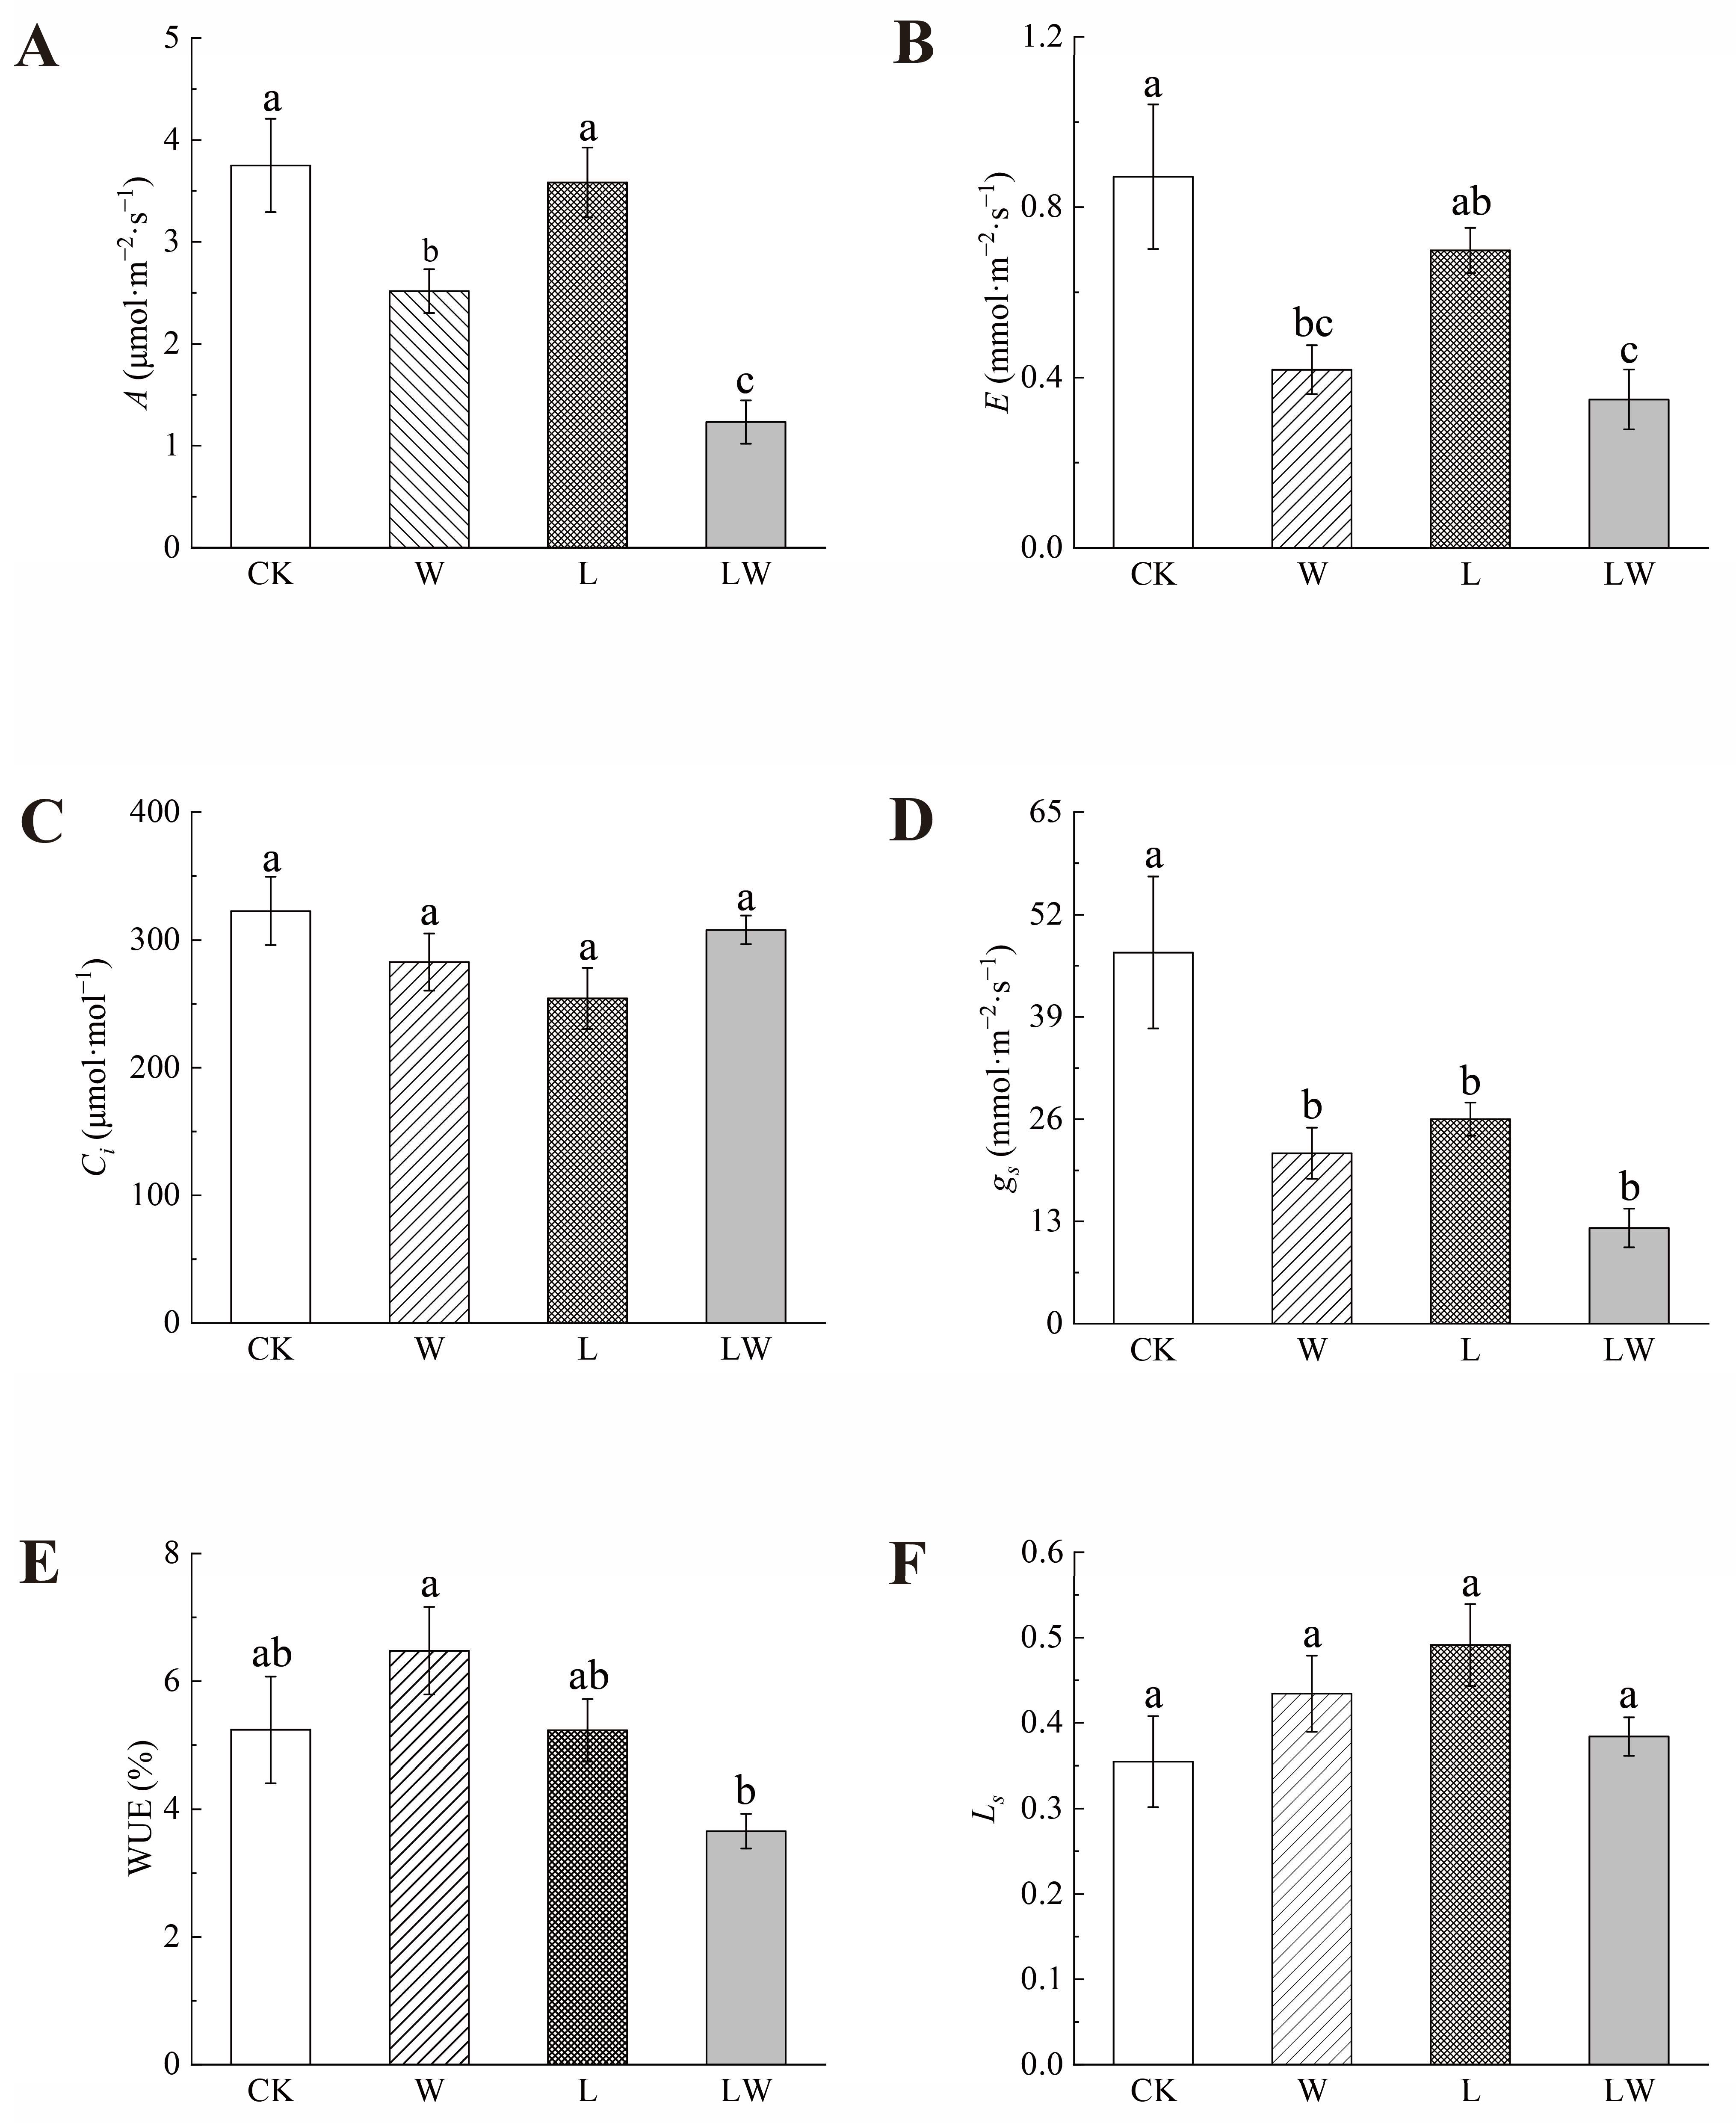
3.1. Effects of Different Stresses on the Photosynthetic Properties of B. striata

The response of B. striata leaf net photosynthetic rate (A) to shading stress did not exhibit significant changes (Figure 1). However, it was significantly reduced under the dual stresses of shading and drought (p < 0.05). A was significantly reduced by 32.80% (p < 0.05) under drought treatment (W) and by 67.20% (p < 0.05) under shading-drought dual stresses (LW) treatment compared to the control (CK). Transpiration rate I was significantly reduced by 51.71% (p < 0.05) under W treatment and by 59.77% under LW treatment compared to CK. Shading stress aggravated the effect of drought stress on leaf E. All stress treatments reduced leaf intercellular CO2 concentration (Ci), but Ci was higher under LW treatment than under shading treatment (L) and W treatments. The stomatal conductance (gs) was significantly reduced by 44.88%, 54.06%, and 74.20% (p < 0.05) under L, W, and LW treatments, respectively, compared with CK. The gs was lower under dual stresses than under single-stress treatment, indicating that shading aggravated the reduction of stomatal conductance by drought. WUE was significantly (p < 0.05) reduced by 30.15% under LW treatment, indicating that the dual stresses of shading and drought aggravated the reduction of water use efficiency (WUE). The Ls did not change significantly under the different treatments and showed L > W > LW > CK, and all stress treatments increased leaf stomatal limiting values (Ls).

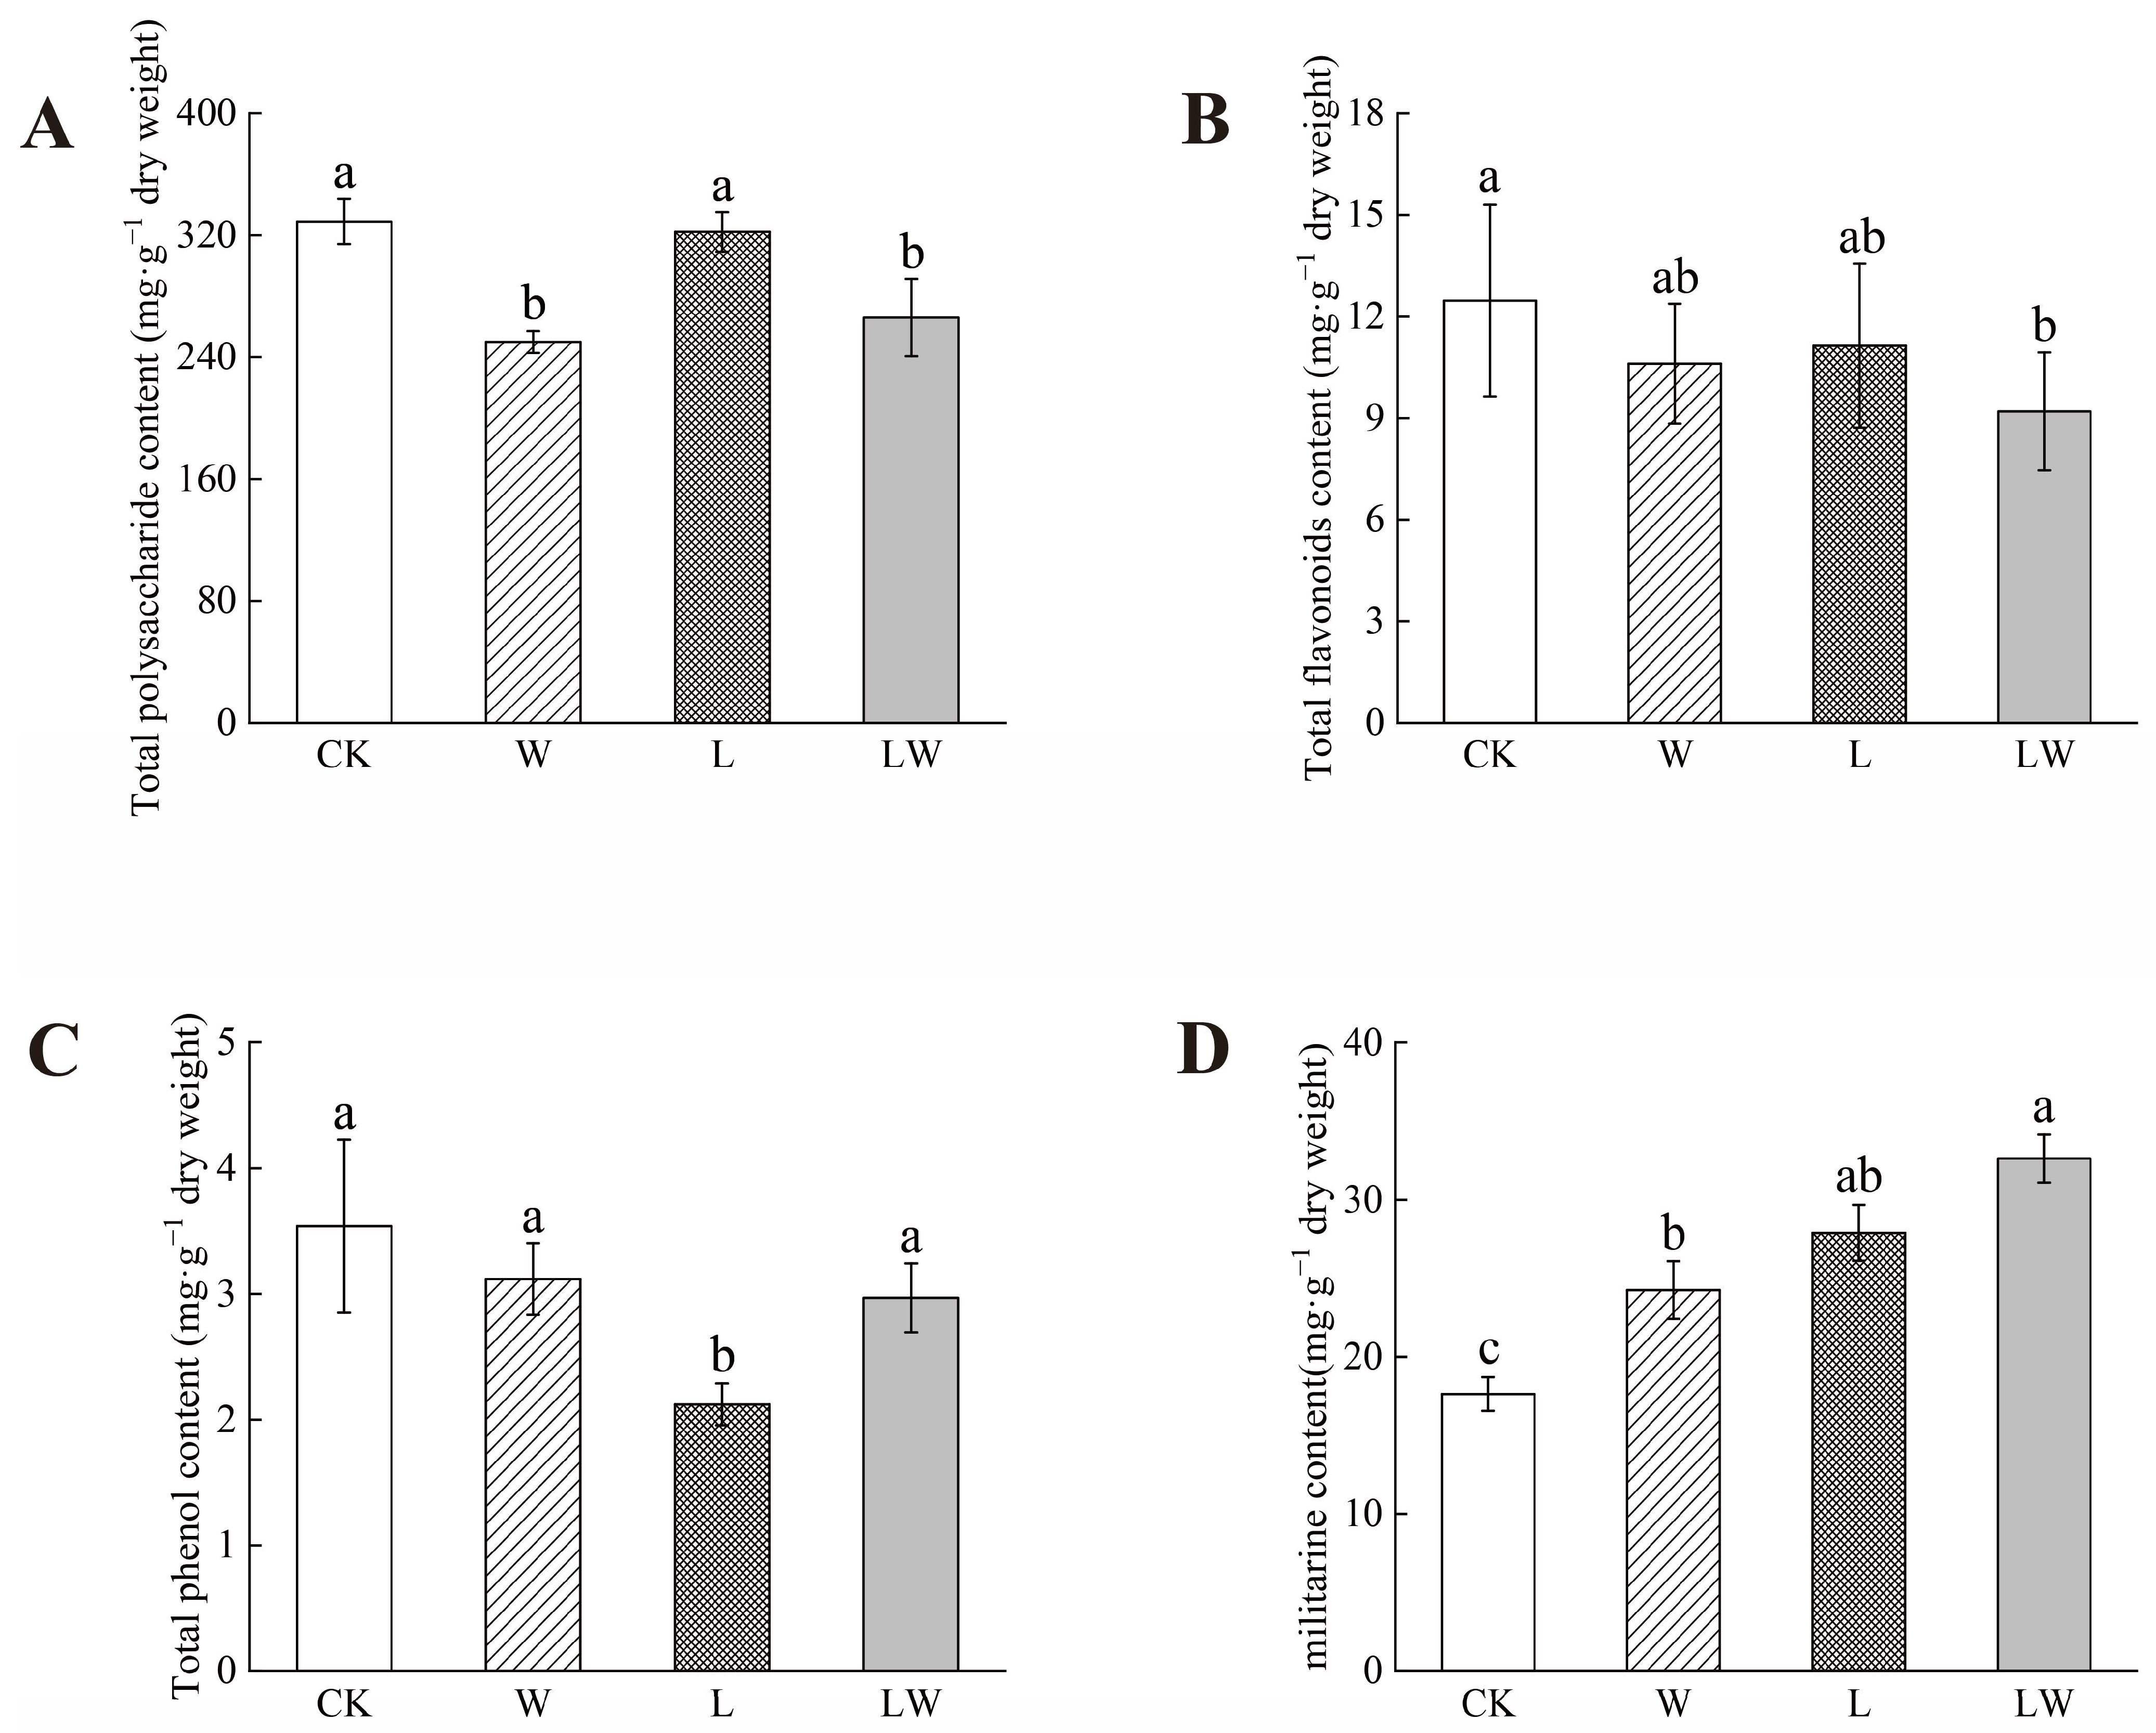
3.2. Effect of Different Stresses on the Active Components of BP

The polysaccharide, total flavonoids, and total phenol contents of BP were reduced under all three stress treatments (Figure 2). Compared with CK, the total phenol content in L treatment was significantly reduced by 40.11% (p < 0.05), and the polysaccharide content in W treatment was significantly reduced by 24.02% (p < 0.05). The polysaccharide and total flavonoid contents in LW treatment were significantly decreased by 19.16% and 26.22%, respectively (p < 0.05).
Compared to CK, militarine content was significantly increased (LW > L > W > CK) by 58.16%, 37.53%, and 85.03% in the L, W, and LW treatments, respectively. These findings confirm that the content of active ingredients in BP varies greatly under different environmental conditions.

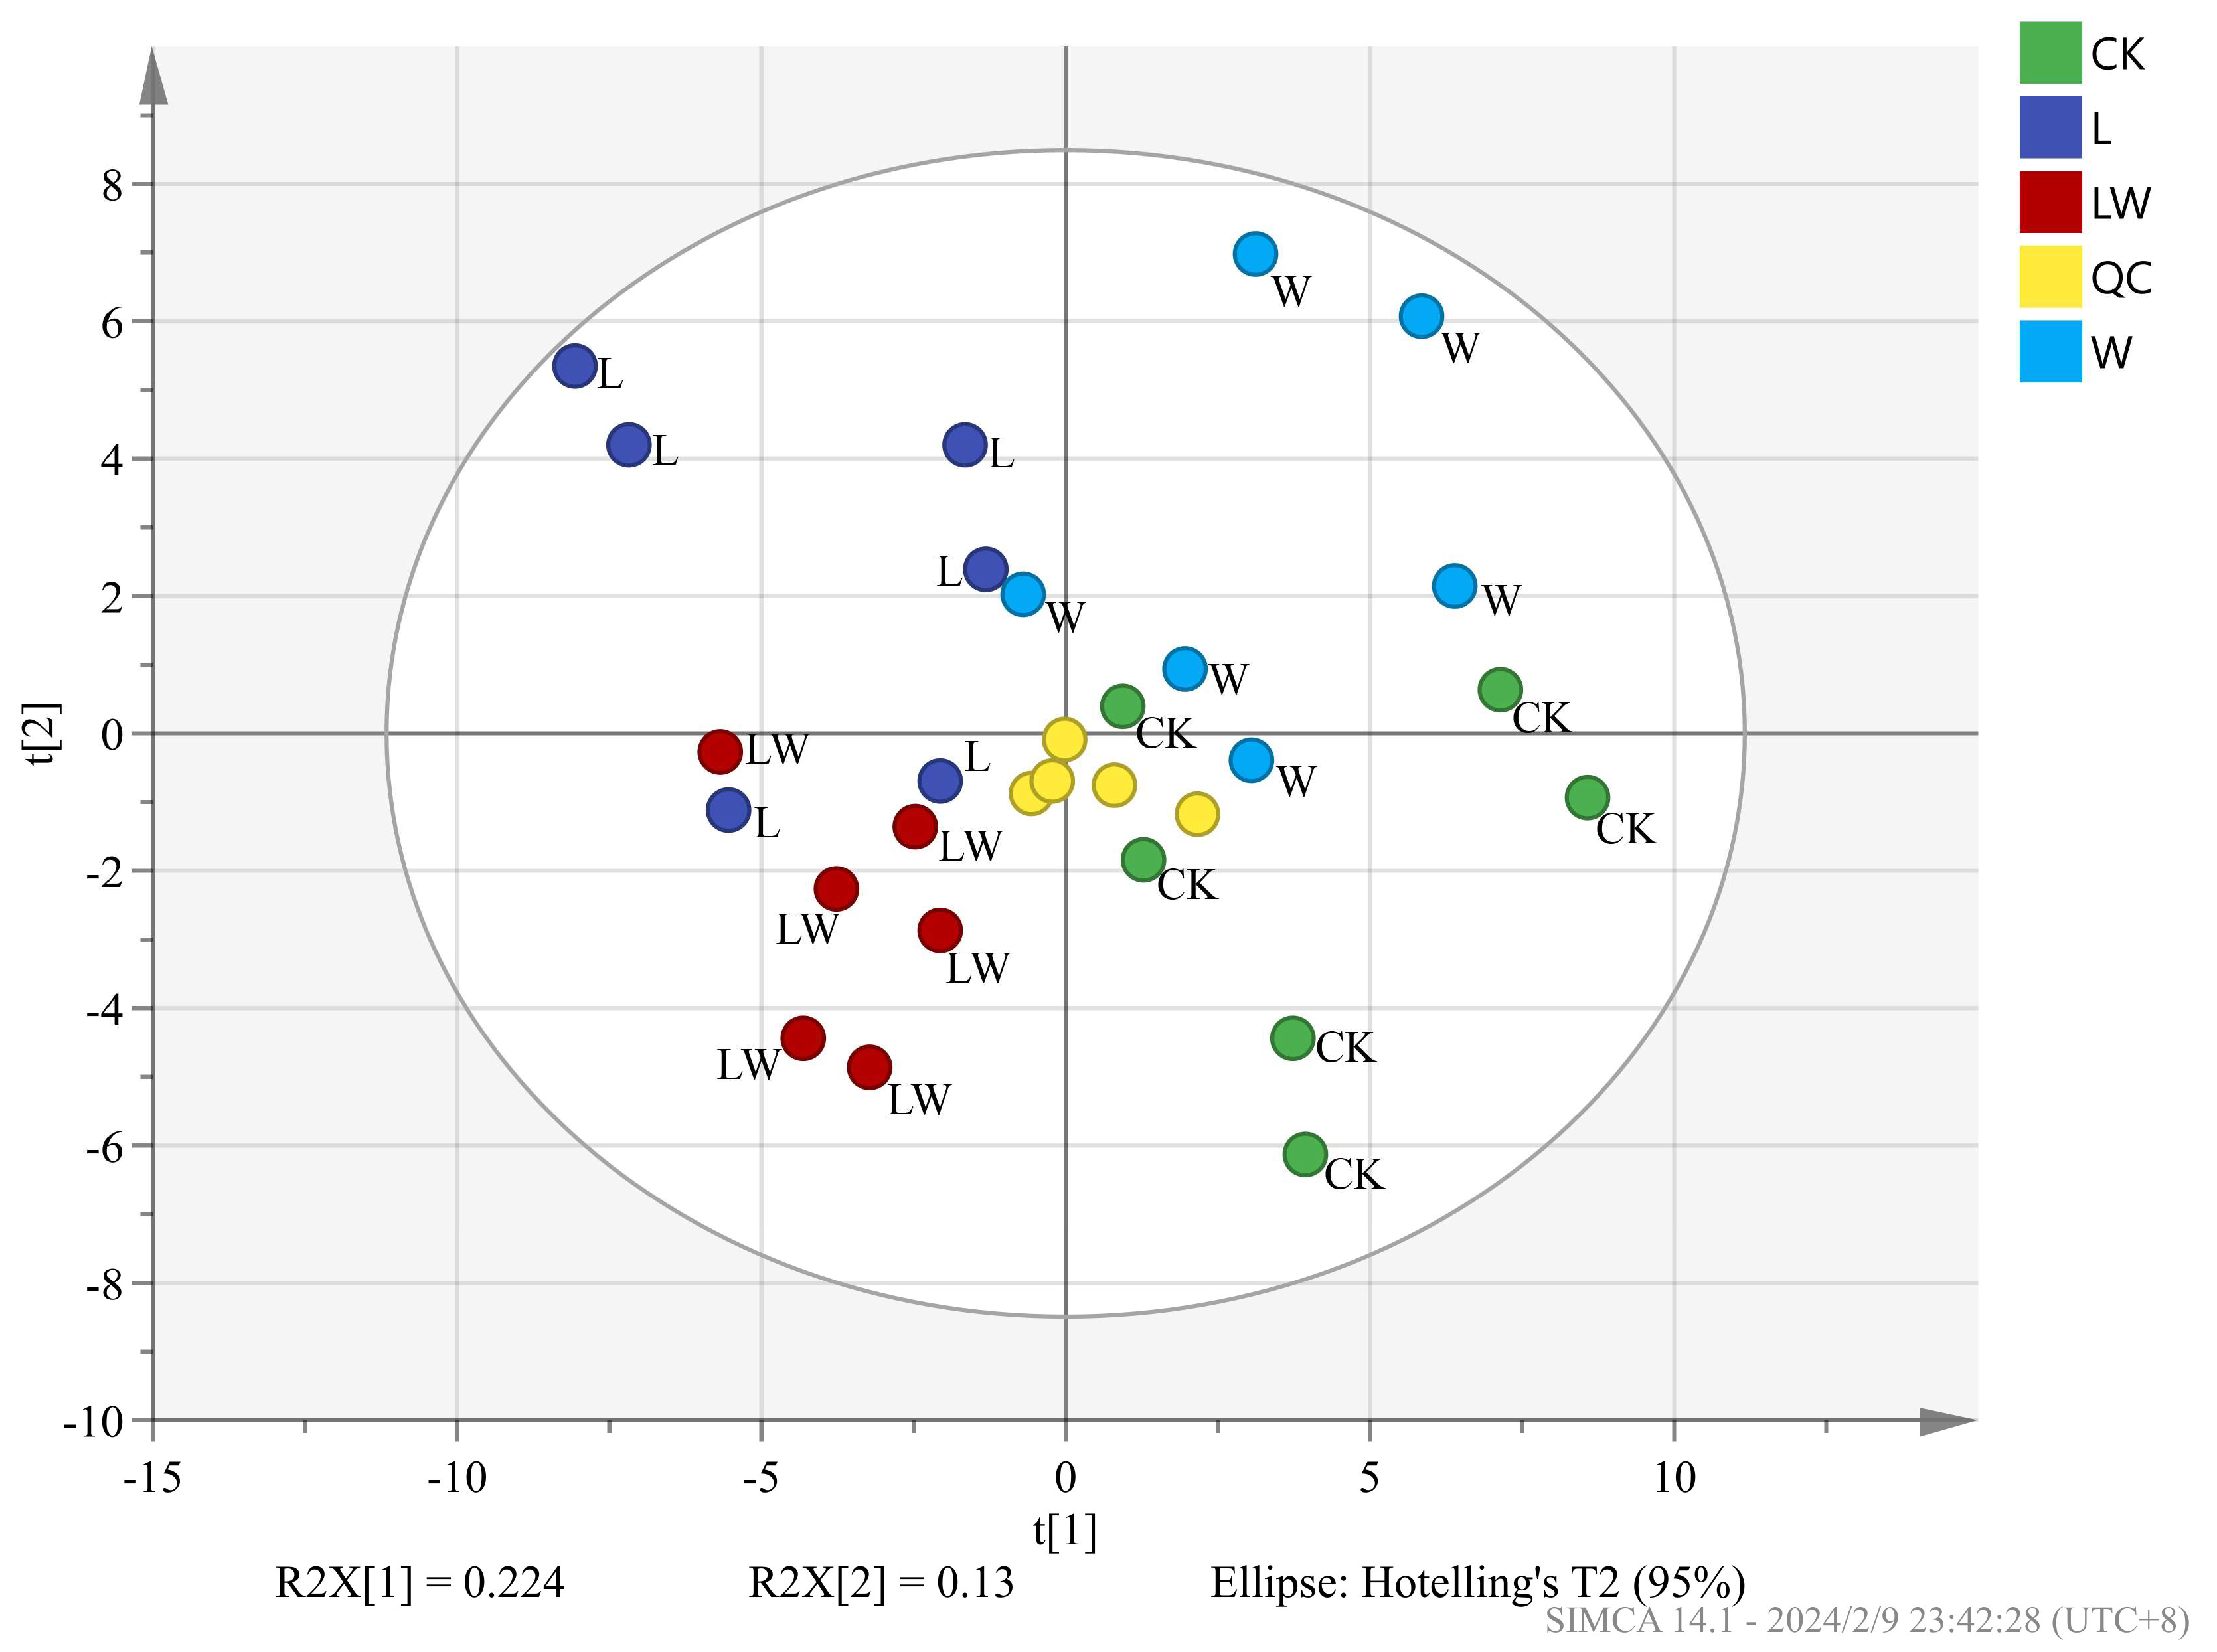
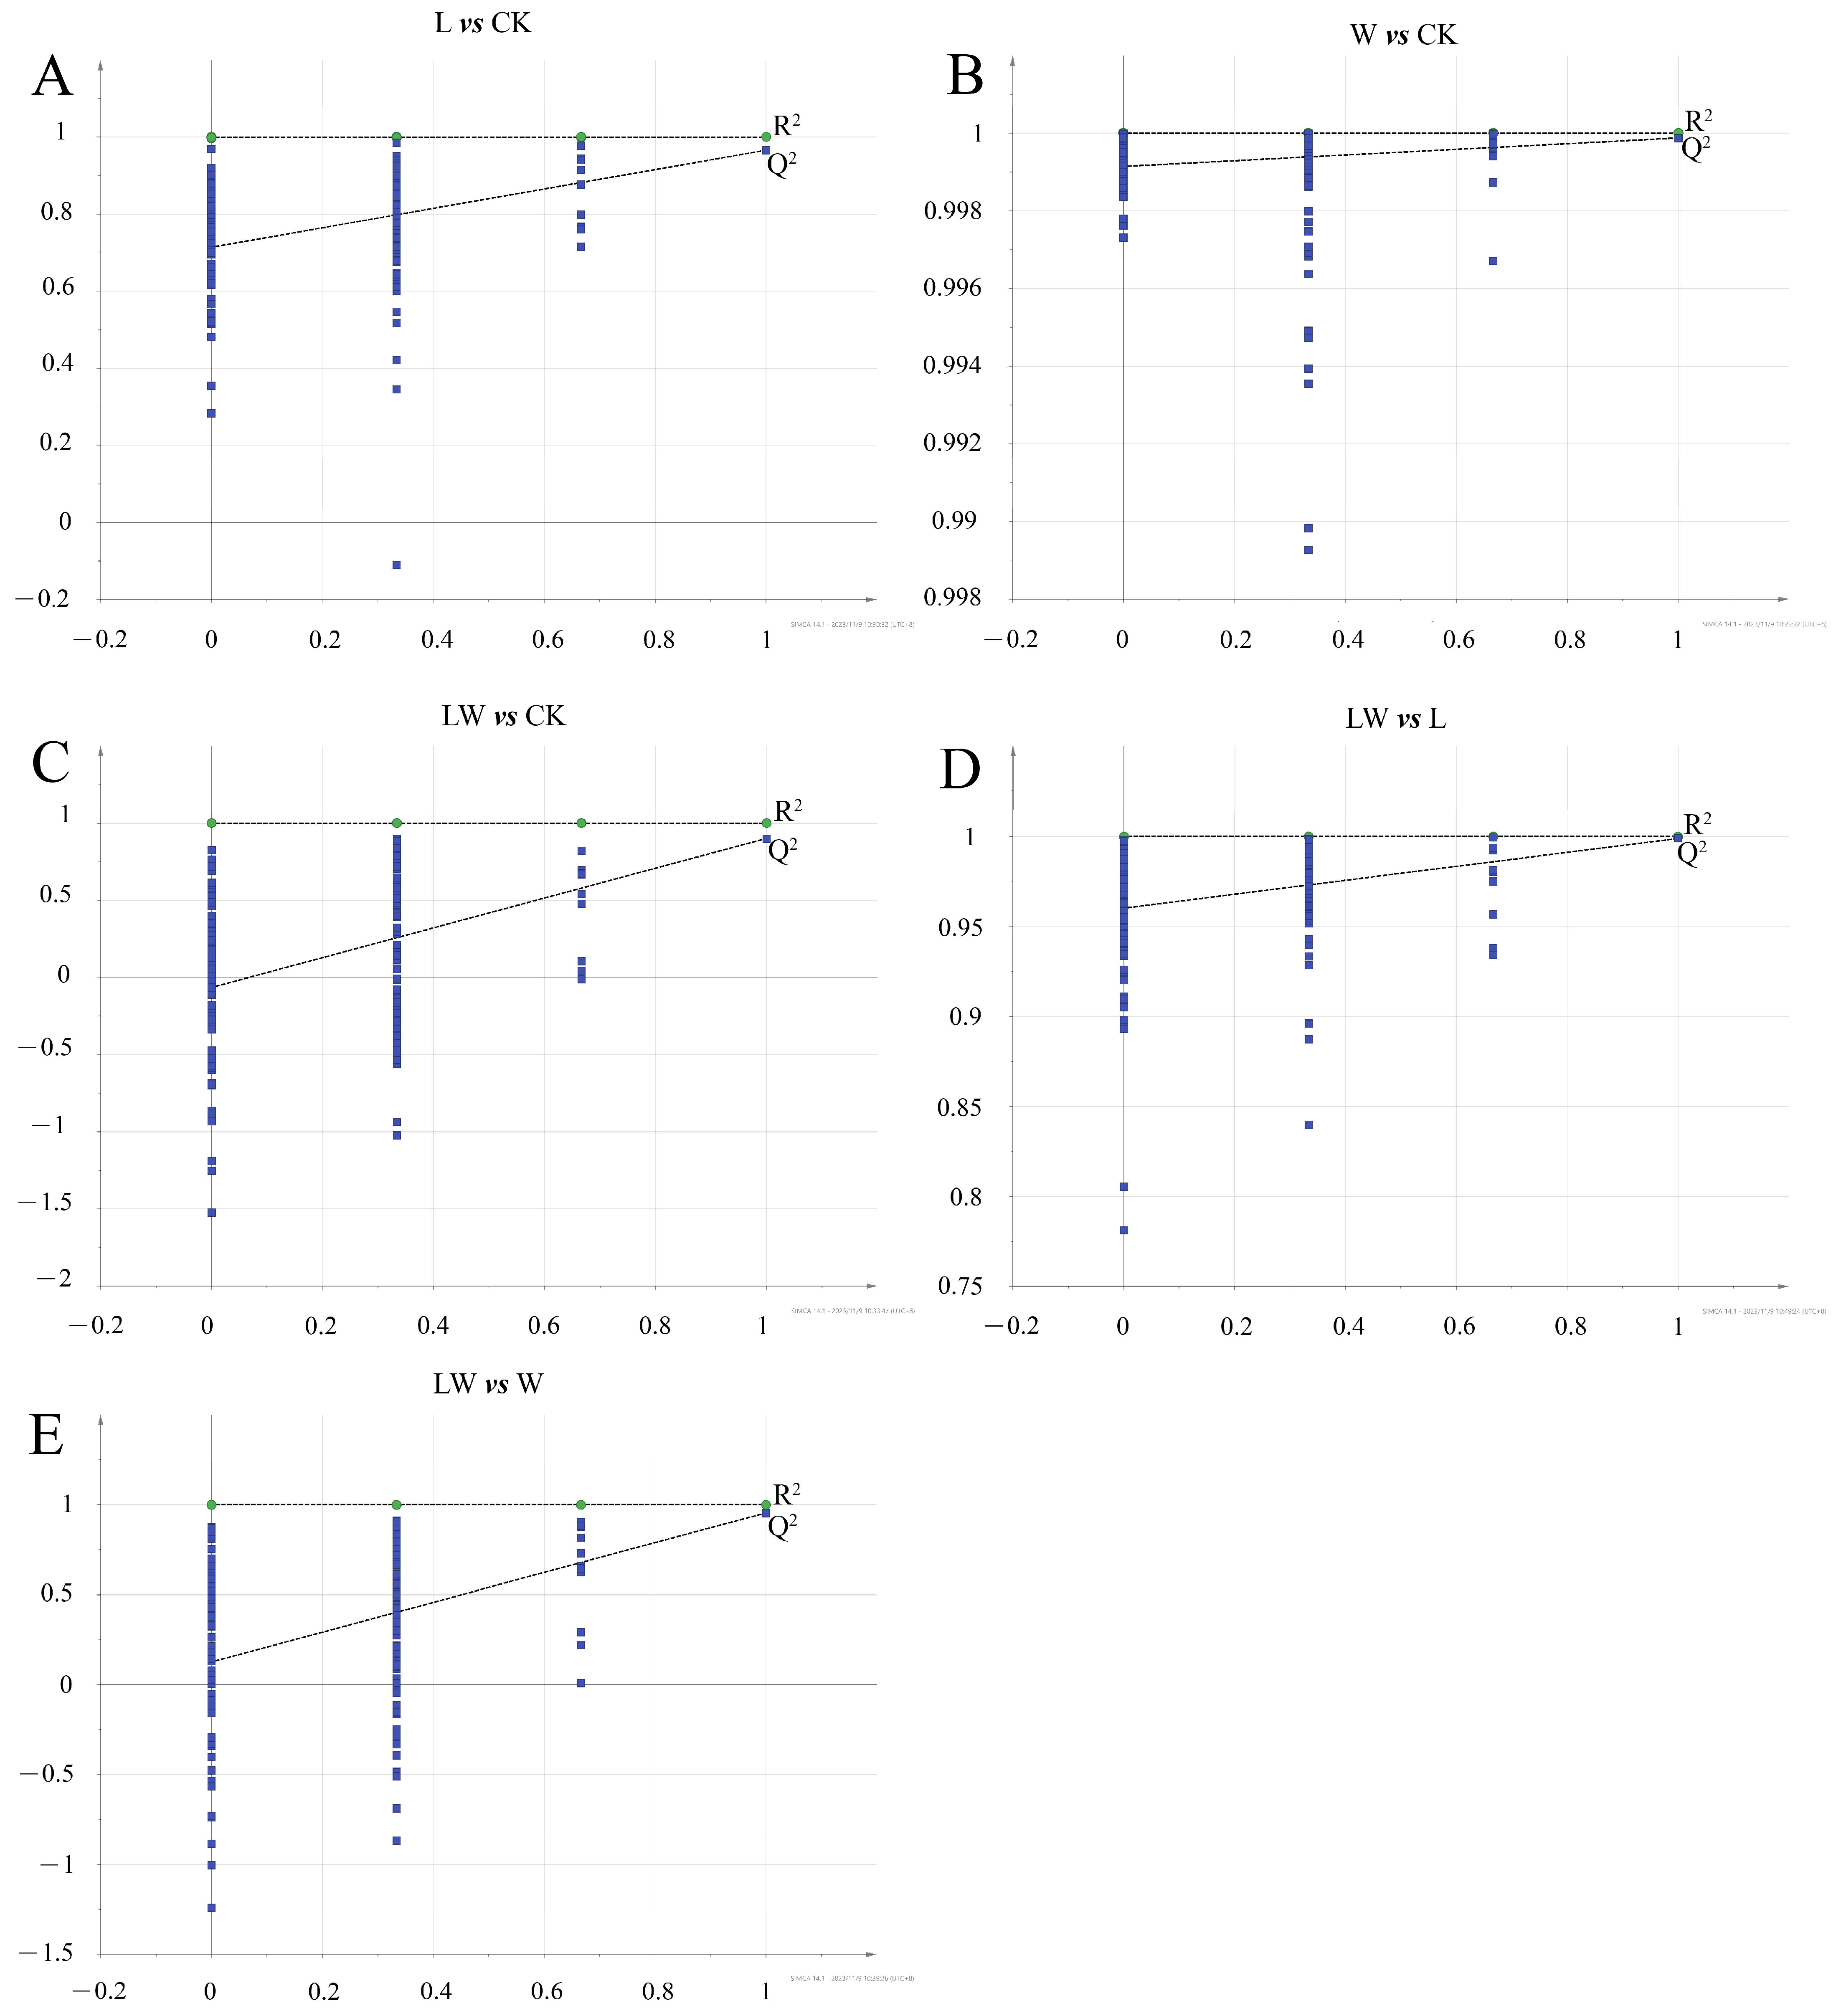
3.3. Metabolic Profiling Based on Meteorological Chromatography-Mass Spectrometry

Based on the results above, in order to investigate the causes of changes in the active ingredients of BP and to elucidate the metabolic fluctuation mechanism of B. striata under various stresses, we carried out non-targeted metabolomic analysis using a GC-MS platform to reveal the metabolic mechanisms in response to the environmental stresses in B. striata. The results indicated that the principal component analysis (PCA) model achieved R2X = 0.528 and Q2 = 0.104. All samples fell within the 95% confidence interval (Hotelling T2), and the quality control (QC) distribution exhibited centralization, signifying the robust instrumental stability and reproducibility of both the experiment and the applied methodology (Figure 3). We further used the OPLS-DA model to identify the metabolites responsible for the segregation that occurred in CK and treatments. The results demonstrated that data from all treatment groups exhibited significant separation within the 95% Hotelling T2 ellipse, indicating substantial differences in the metabolites detected by GC-MS between the groups (Figure A1, Table A1). Additionally, a rigorous assessment involving 7-fold internal cross-validation and 200 replacement tests was conducted to evaluate the predictive accuracy and statistical significance of these models. The R2X and R2Y values for all five model groups surpassed 0.5, with minimal divergence from Q2, affirming the reliability of these models for identifying differential metabolites between groups (Figure A2).

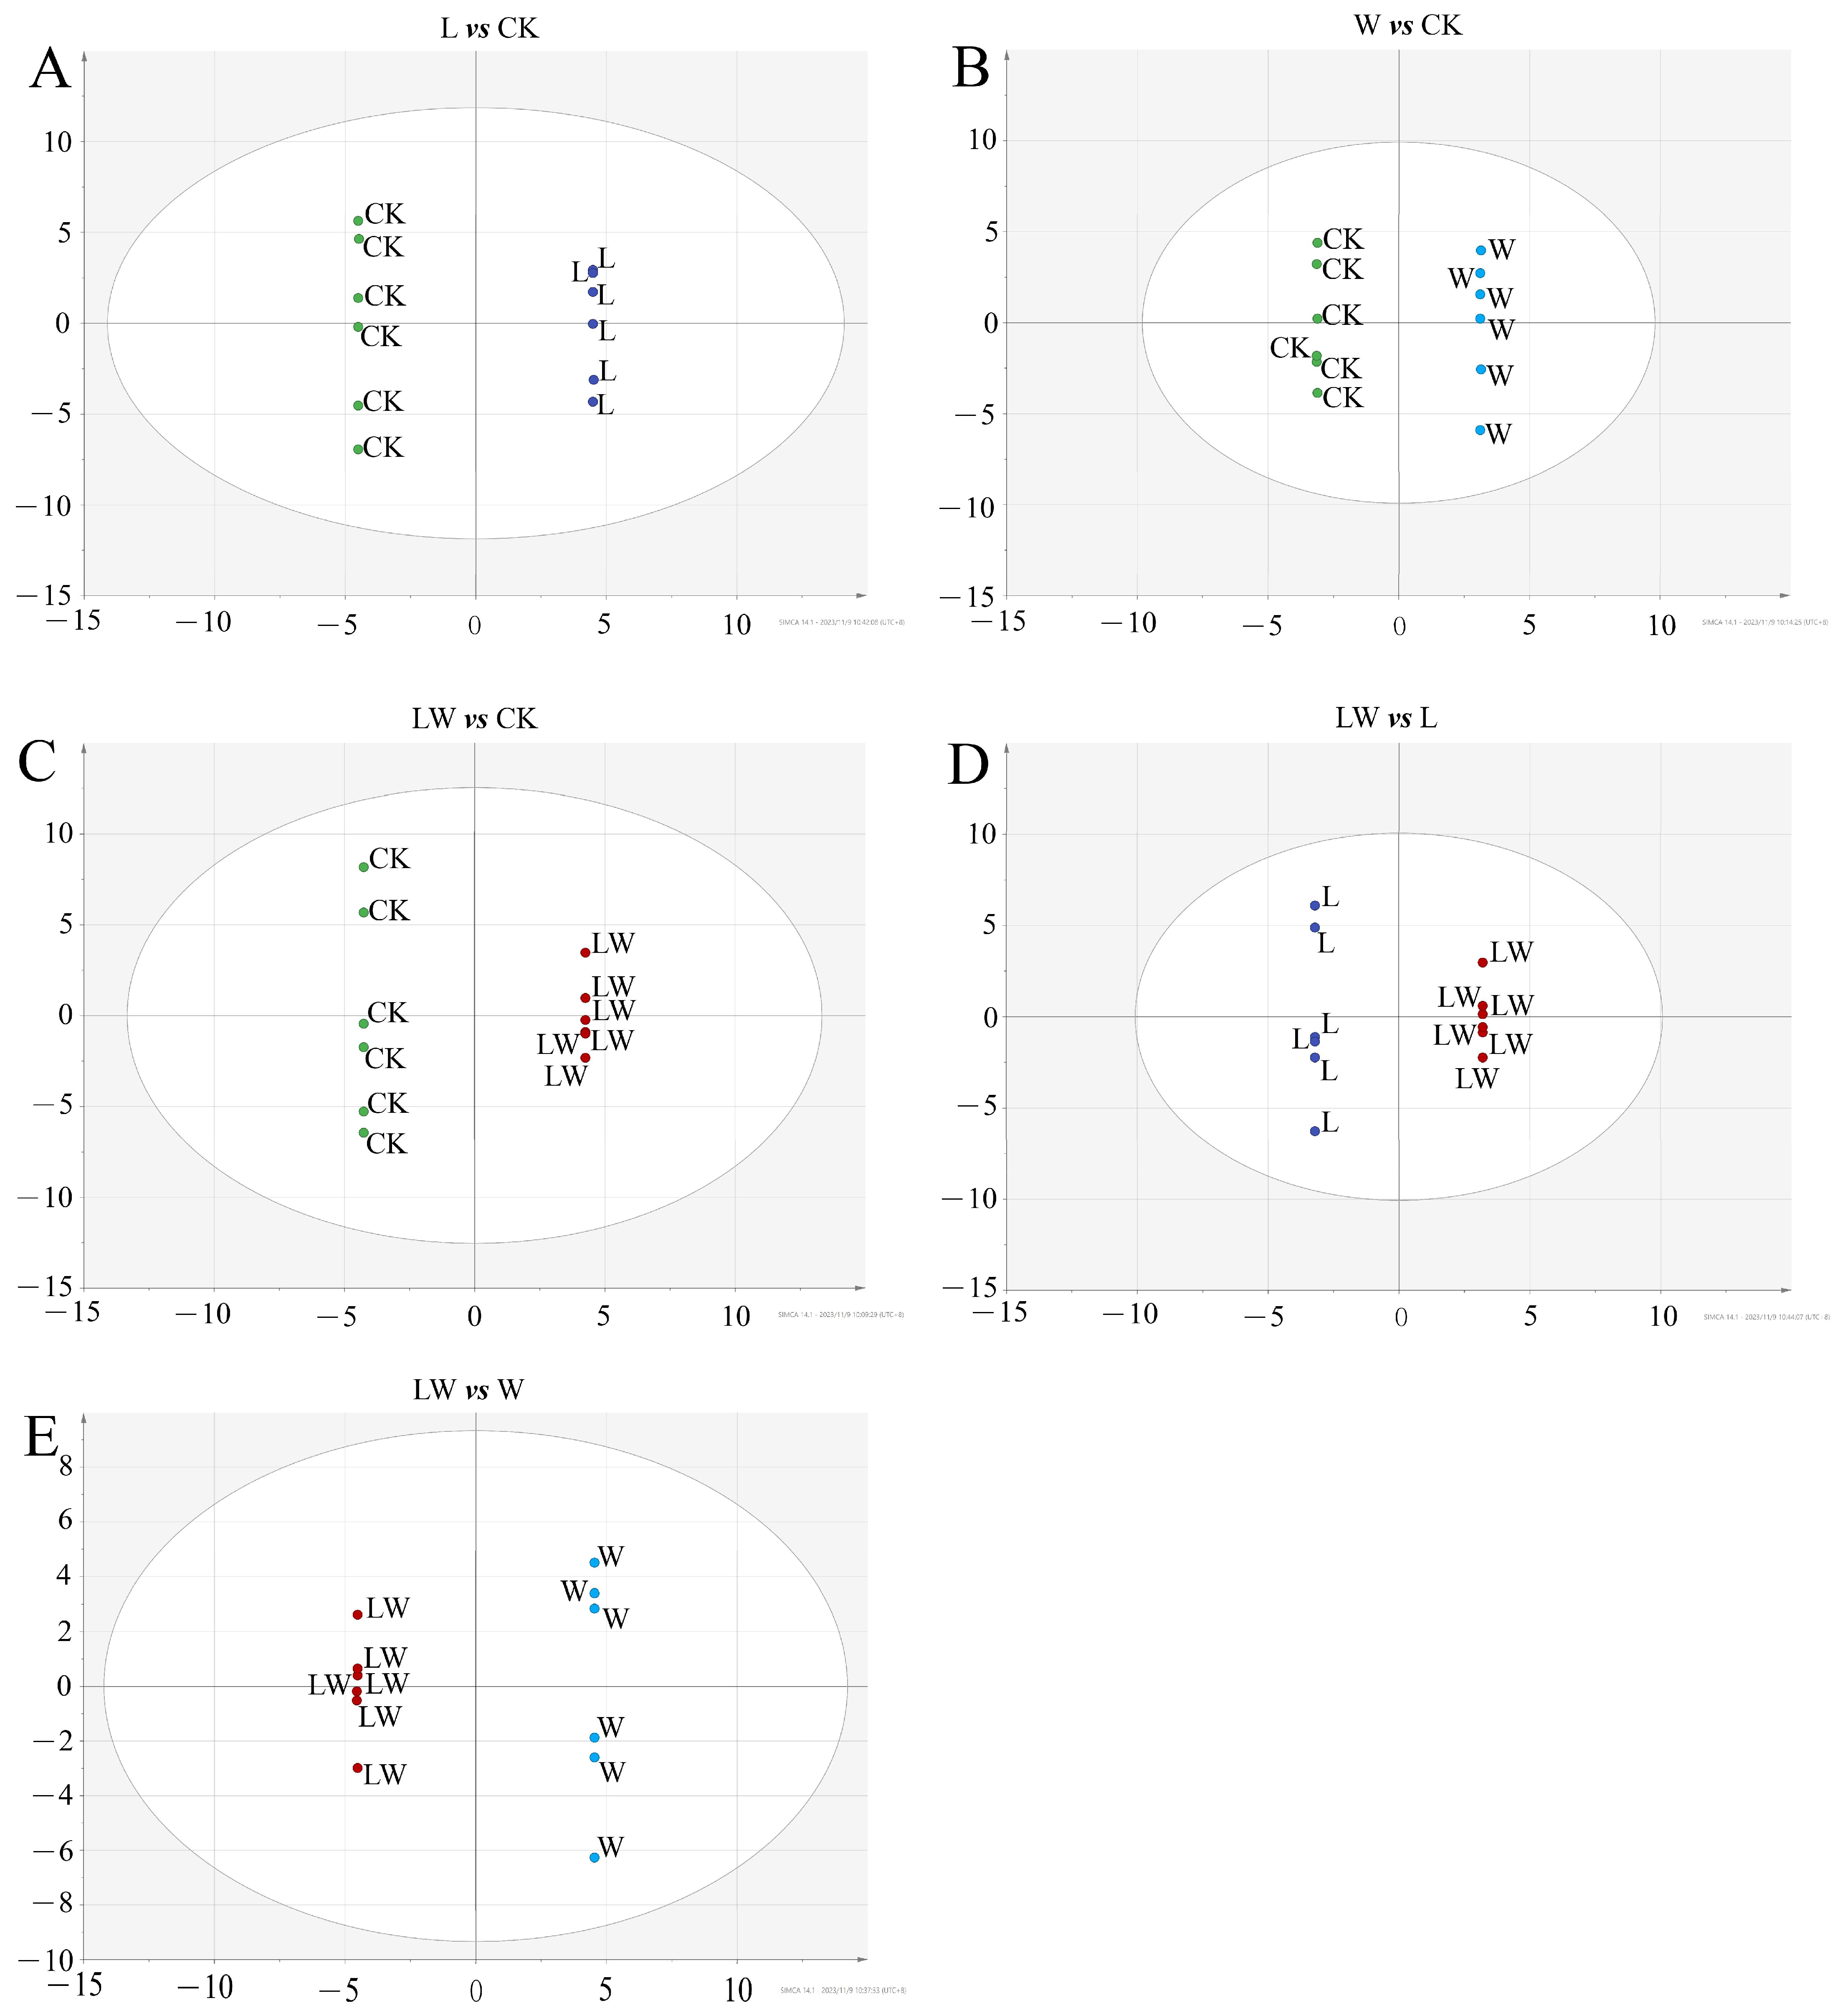
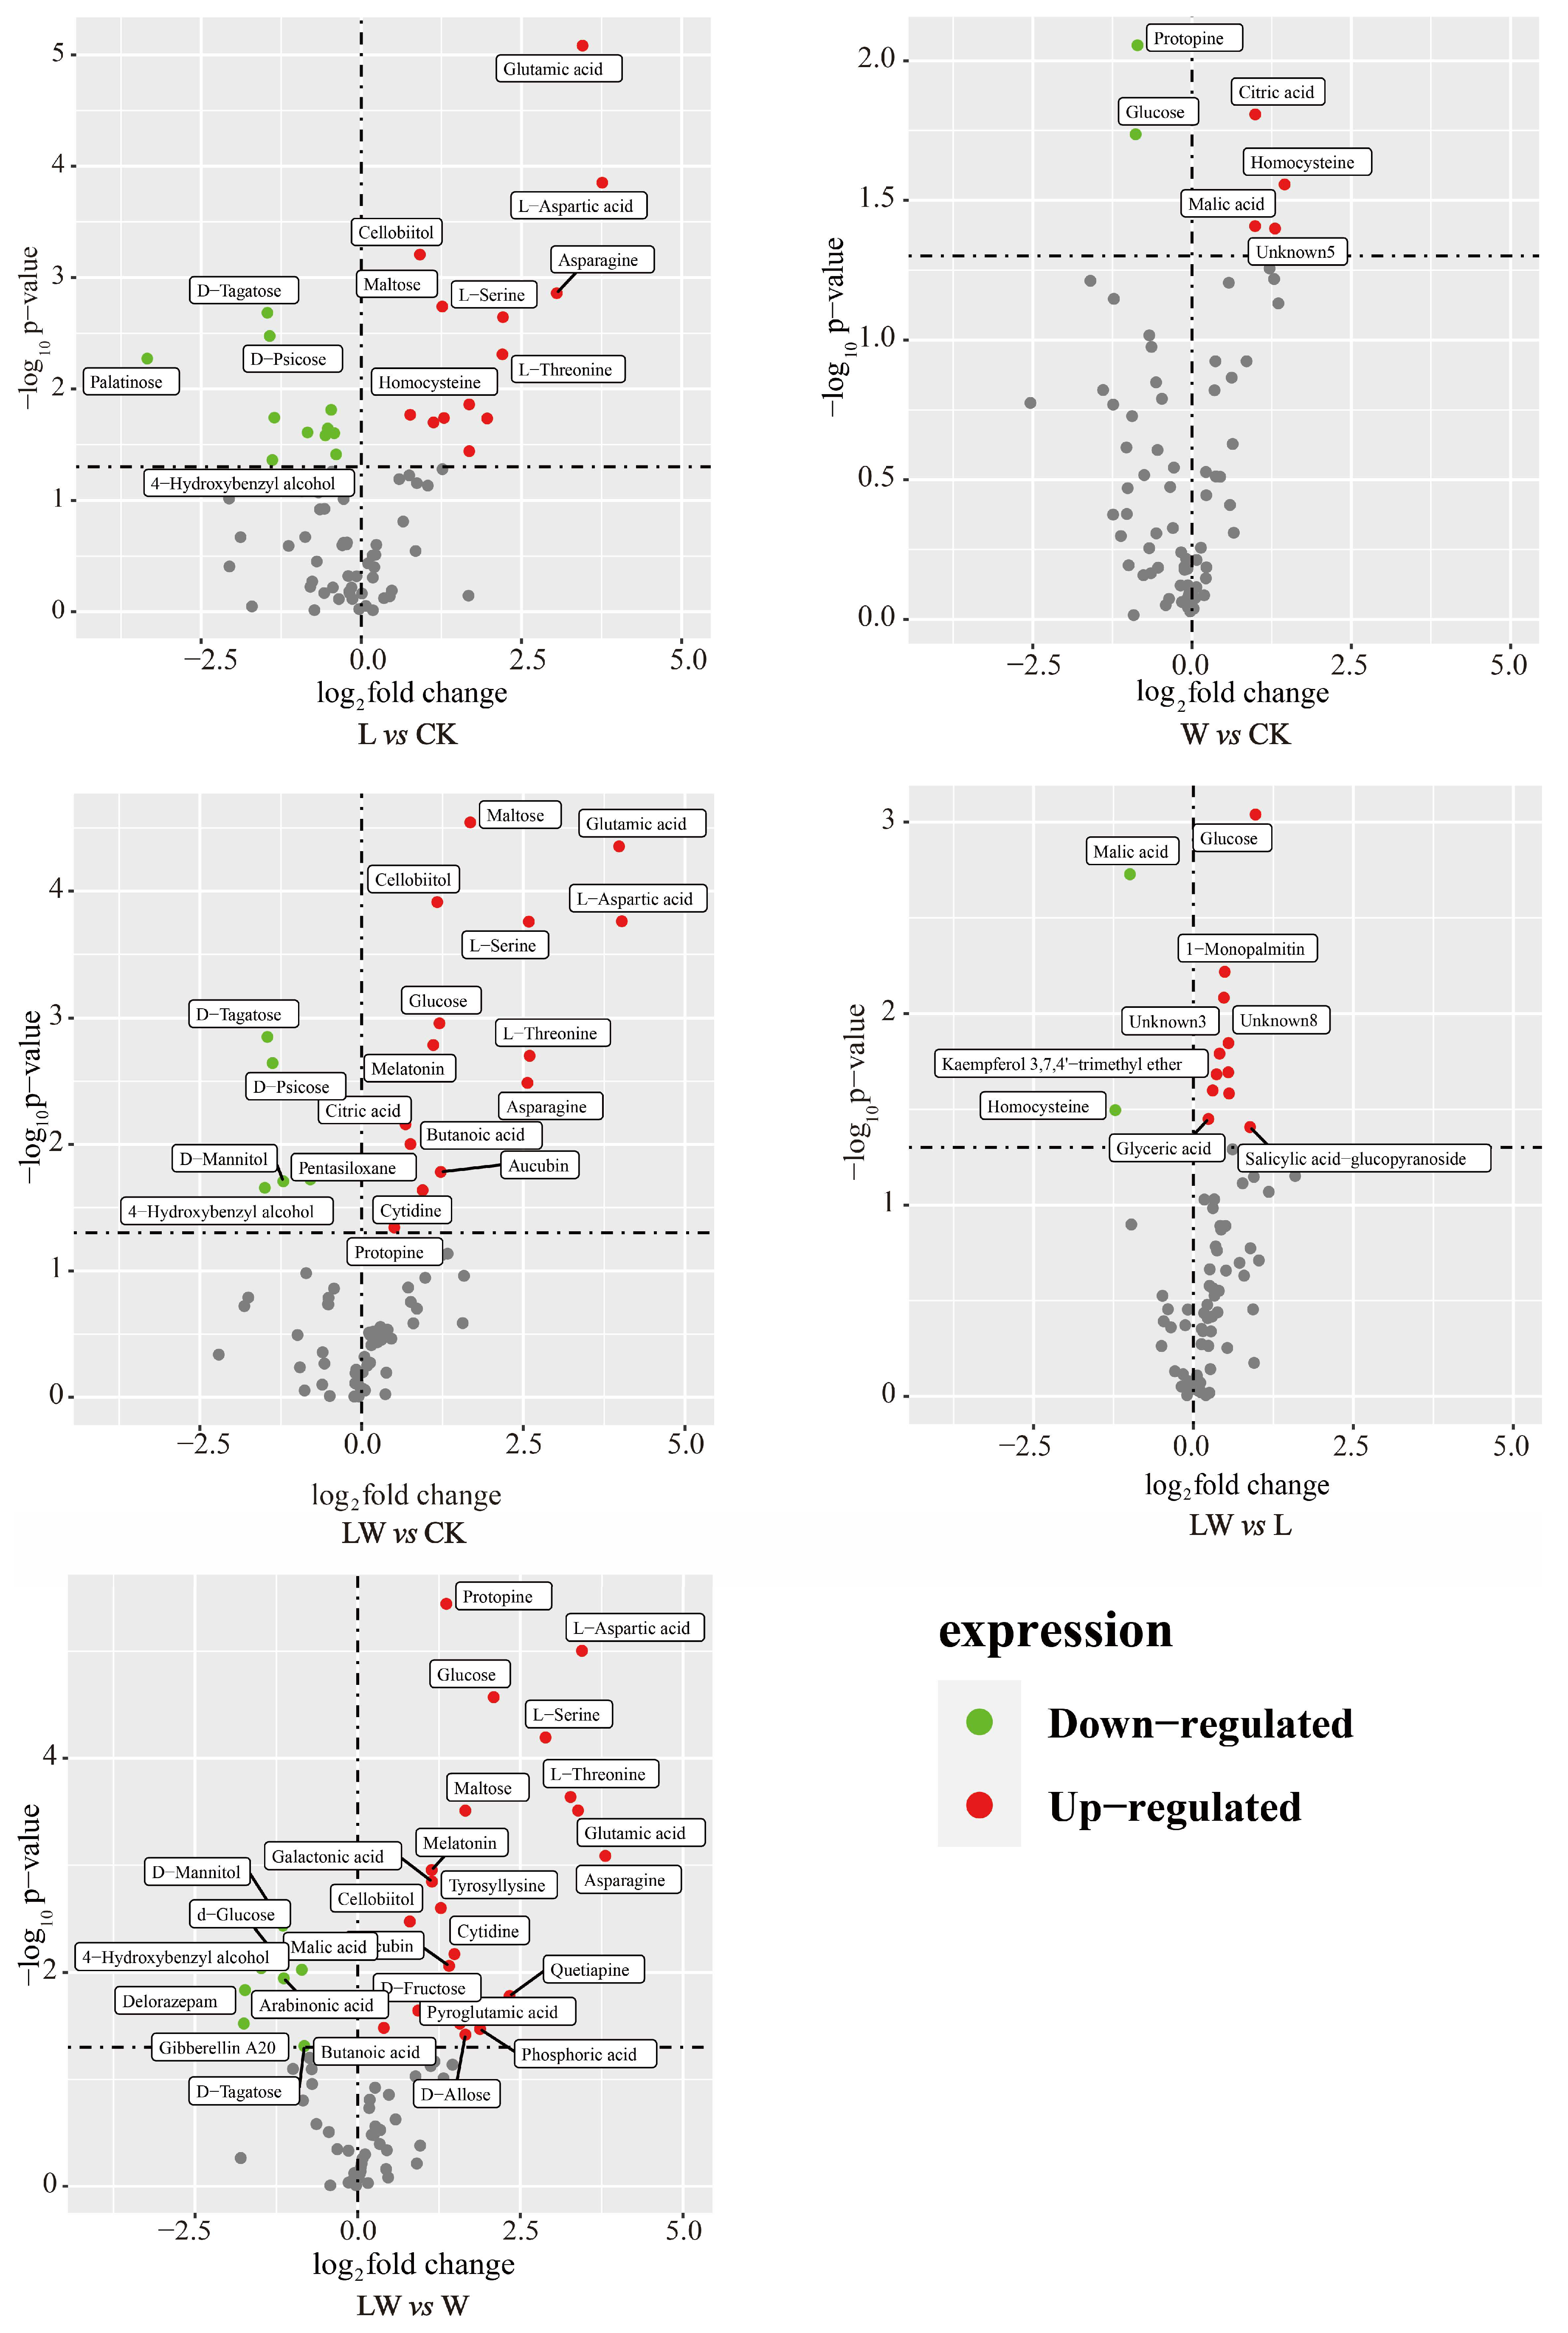
3.4. Changes in Metabolites of BP under Different Stresses

Differences in metabolites may be responsible for the variations in the active ingredients of pseudobulbs. Based on the VIP values of the OPLS-DA model (VIP > 1) and the corrected p-value of the t-test (p < 0.05) [23], screening for differential metabolites between L vs. CK, W vs. CK, LW vs. CK, LW vs. L, and LW vs. W (Figure 4). A total of 24 differential metabolites were identified in L vs. CK, of which 13 were up-regulated and 11 were down-regulated. Six differential metabolites were identified in W vs. CK, with four up-regulated and two down-regulated. Nineteen differential metabolites were identified in the LW vs. CK control, with 14 up-regulated and 5 down-regulated. Thirteen differential metabolites were identified in LW vs. L, with 11 up-regulated and 2 down-regulated. Twenty-seven differential metabolites were identified in LW vs. W, with 19 up-regulated and 6 down-regulated. These differential metabolites are mainly carbohydrates, amino acids, organic acids, fatty acids, alkaloids, terpenes, and total flavonoids.

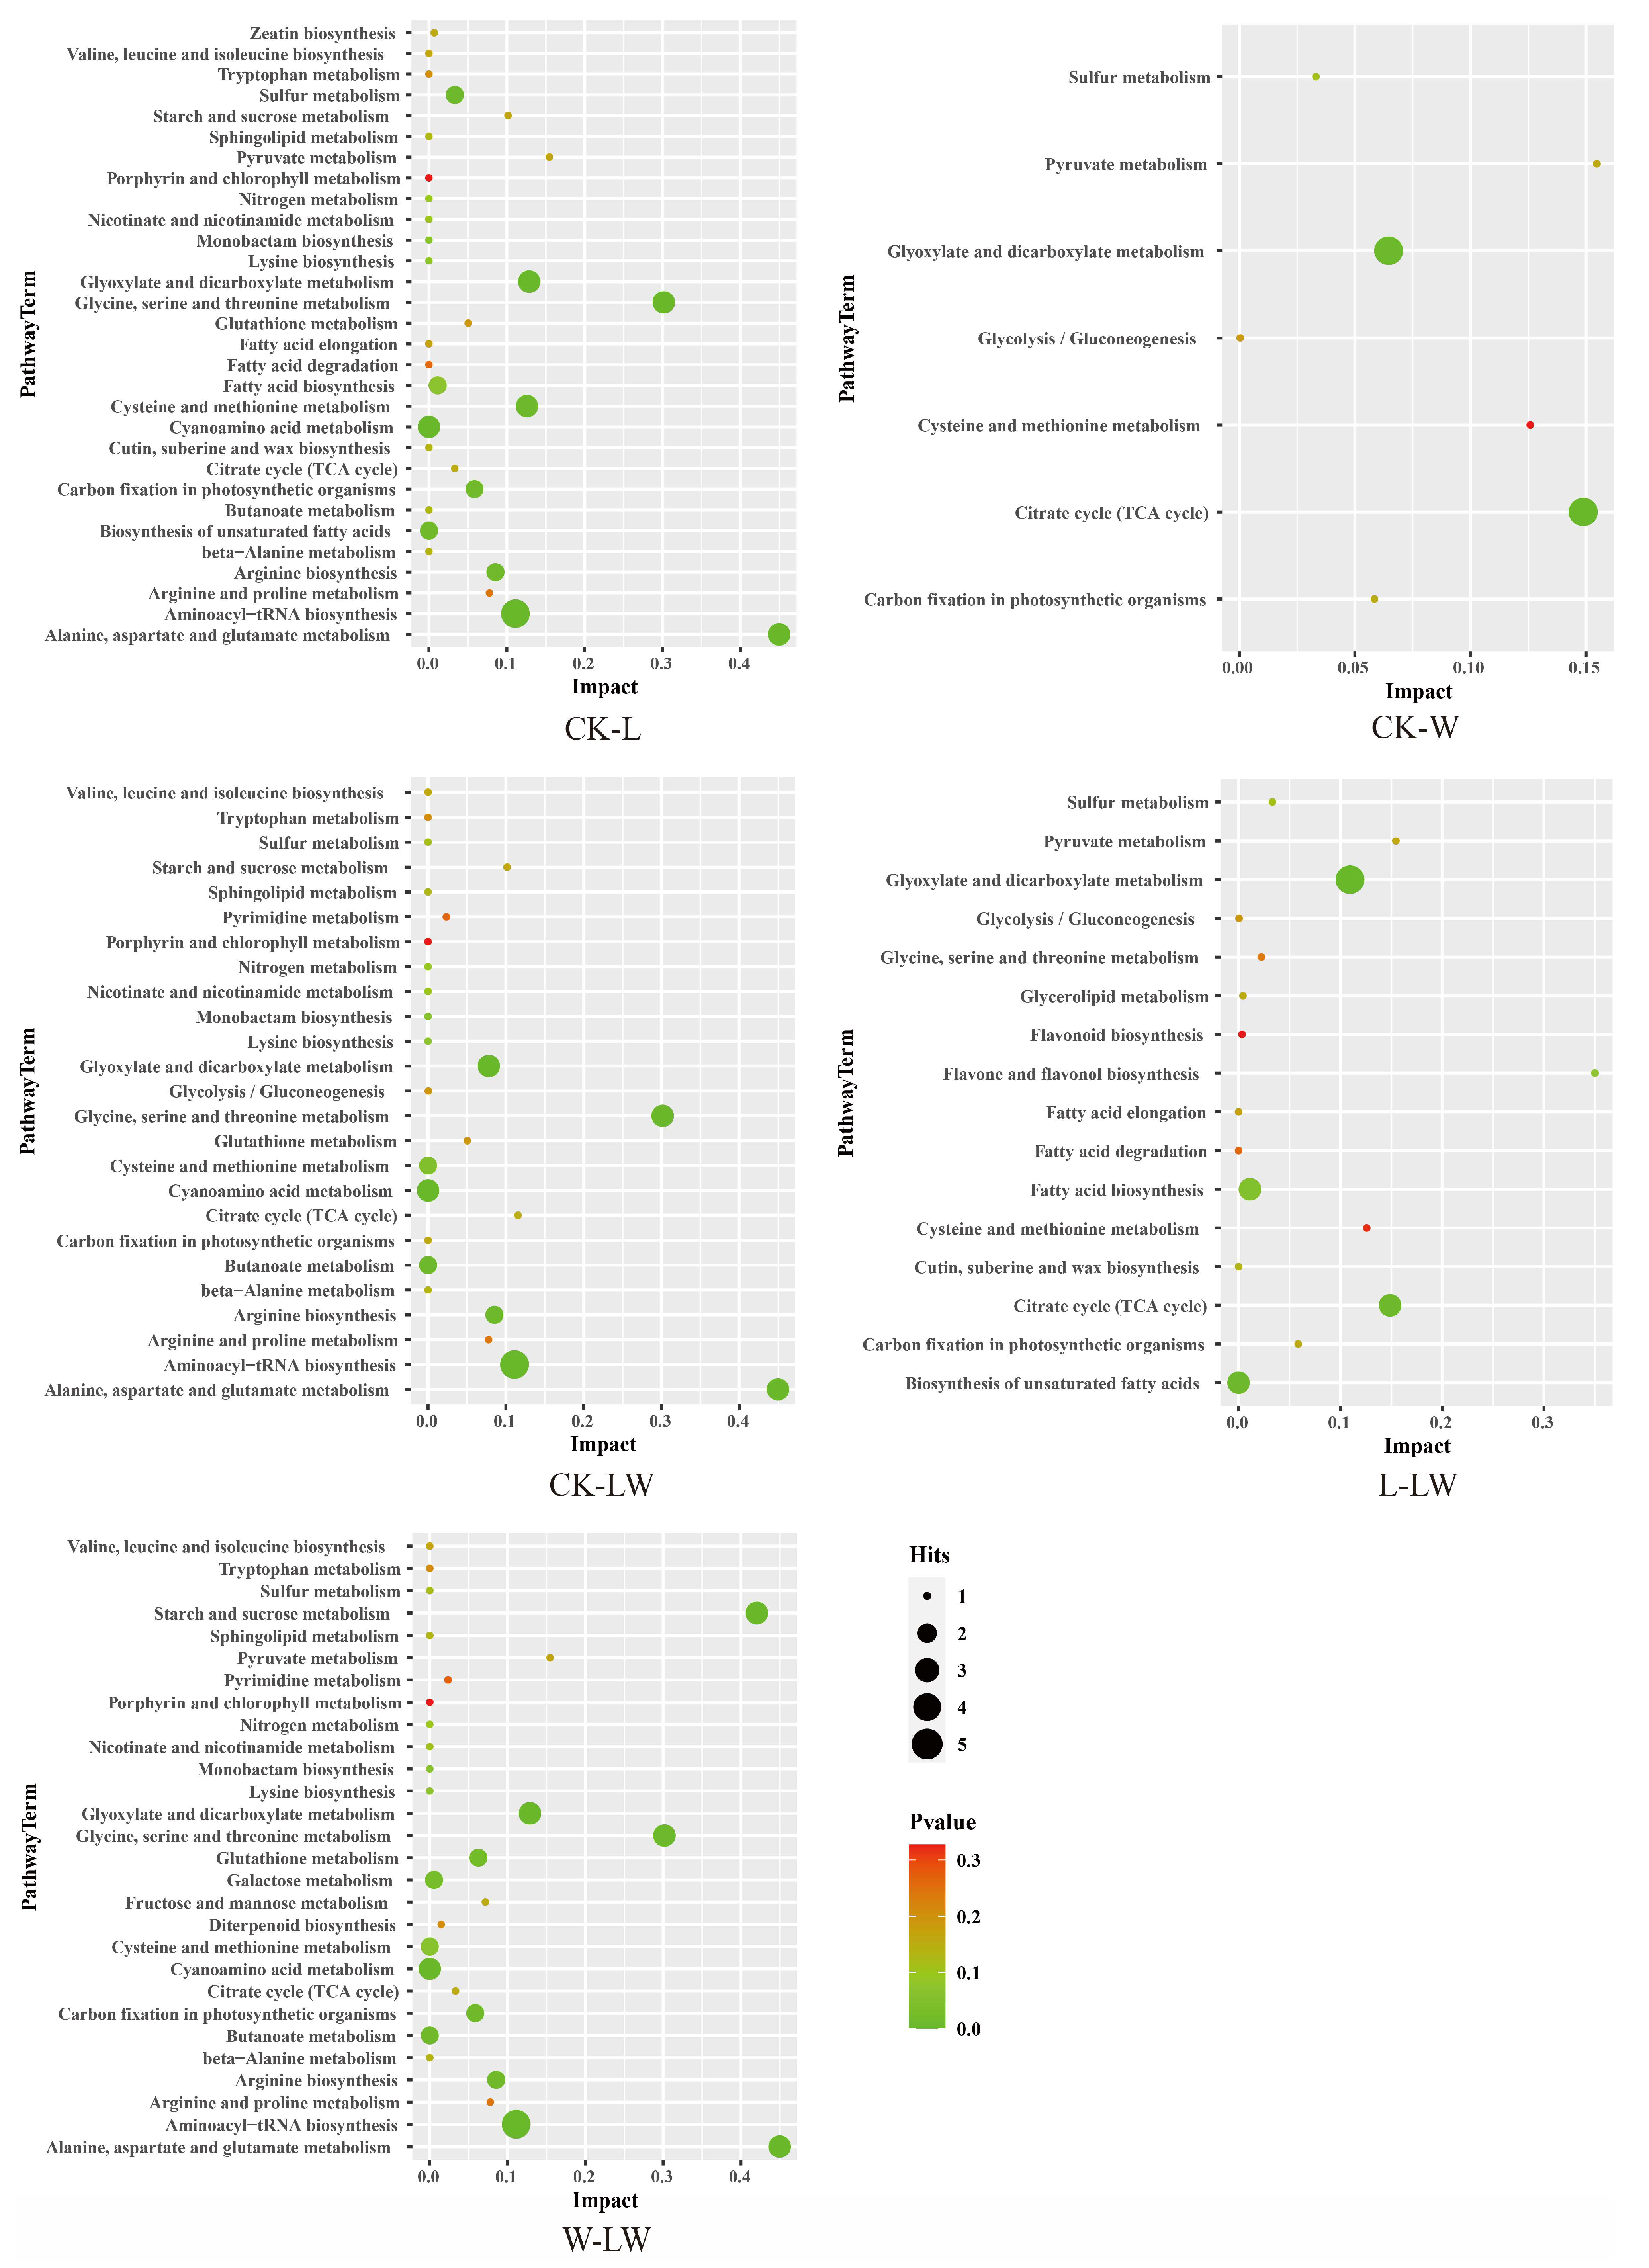
3.5. KEGG-Based Differential Metabolic Pathway Analysis

The results of the pathway analysis module in MetaboAnalyst 5.0 showed the following: 30 metabolic pathways were enriched in L vs. CK; 7 metabolic pathways in W vs. CK; 25 metabolic pathways in LW vs. CK; 16 metabolic pathways in LW vs. L; and 28 metabolic pathways in LW vs. W (Figure 5). Among these difference-rich metabolic pathways, L vs. CK had eight significant metabolic pathways (p < 0.01 or impact > 1), i.e., aminoacyl-tRNA biosynthesis; alanine, aspartate, and glutamate metabolism; cyanoamino acid metabolism; glyoxylate and dicarboxylate metabolism; glycine, serine, and threonine metabolism; cysteine and methionine metabolism; sulfur metabolism; and arginine biosynthesis. W vs. CK had two significant metabolic pathways, i.e., citrate cycle, glyoxylate metabolism, and dicarboxylate metabolism. LW vs. CK had seven significant metabolic pathways, i.e., aminoacyl-tRNA biosynthesis, alanine, aspartate metabolism, and glutamate metabolism; cyanoamino acid metabolism; glyoxylate and dicarboxylate metabolism; glycine, serine, and threonine metabolism; butanoate metabolism; and arginine biosynthesis. LW vs. L has three significant metabolic pathways, i.e., glyoxylate and dicarboxylate metabolism; citrate cycle; and biosynthesis of unsaturated fatty acids. There were six significant metabolic pathways for LW vs. W, i.e., aminoacyl-tRNA biosynthesis; starch and sucrose metabolism; alanine, aspartate, and glutamate metabolism; cyanoamino acid metabolism; glyoxylate and dicarboxylate metabolism; and glycine, serine, and threonine metabolism.

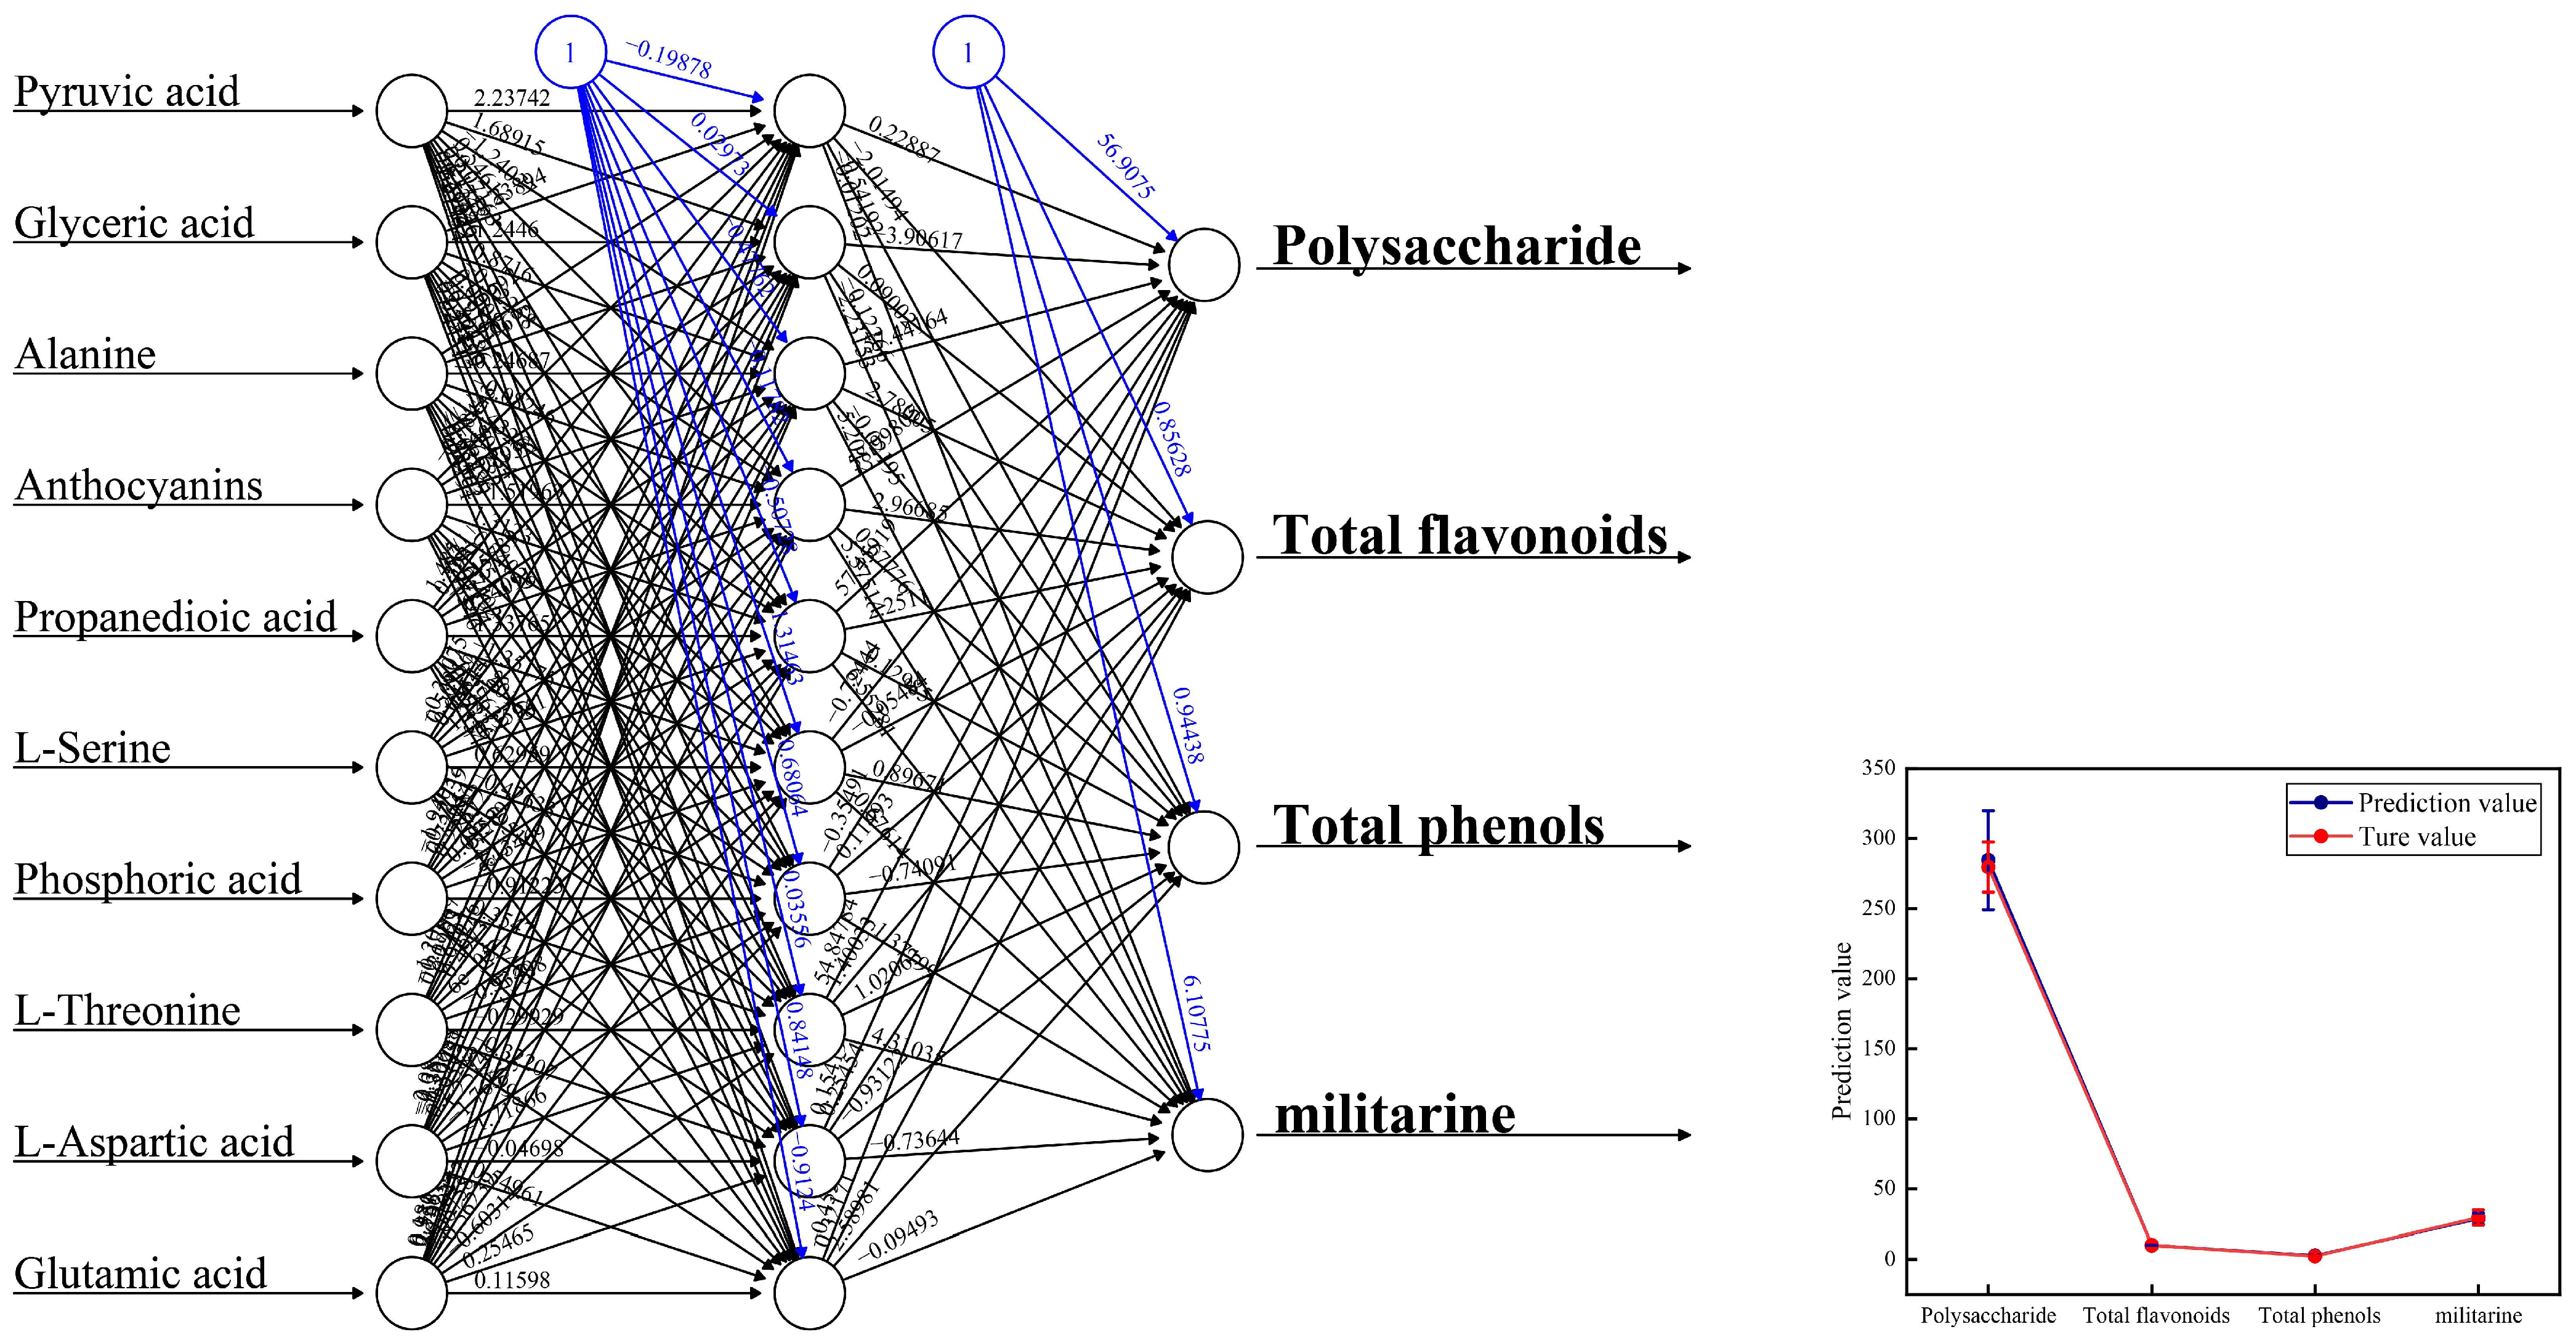
3.6. Relationship between Metabolic Changes and Active Ingredients

Traditional prediction methods, such as multiple linear regression, fail to produce valid estimates in the presence of multicollinearity and a lack of linear correlation, but artificial neural network (ANN) models do not require any link between input and output variables [22]. Support vector machines (SVM) can effectively analyze the data used for classification to find the characteristic metabolites that have a greater impact on the active ingredient. We identified a total of 10 compounds that significantly influenced the contents of active ingredients in BP, consisting of pyruvic acid, glyceric acid, alanine, anthocyanin, propanedioic acid, L-serine, phosphoric acid, L-threonine, L-aspartic acid, and glutamic acid. The ANN models were constructed using these 10 characterized metabolites to assess how well these substances can predict changes in the active ingredient. The results showed that the characterized metabolites provided reliable predictions of changes in polysaccharide, total flavonoids, total phenols, and militarine contents with correlation coefficients of 0.982, 0.996, 0.954, and 0.974 (Figure 6).

4. Discussion

4.1. Relationship between Changes in Photosynthetic Properties and Active Ingredients in Plants

With changes in the global climate and environment, more and more plants are affected by a lack of light and water [24]. The physiological characteristics of plants respond to changes in the external environment that affect their growth and development. It is generally believed that in arid environments, plant growth and production may be limited due to insufficient photosynthesis. Plants adapt to arid environments by absorbing large amounts of water, reducing the number of stomata, and decreasing transpiration [25]. According to the photosynthetic control theory of Farquhar and Sharkey [26], stomatal limitation of plants is characterized by a decrease in gs and Ci and an increase in Ls, whereas the effect of “non-stomatal limitation” indicated an increase in Ci and a decrease in Ls. We found that A of B. striata decreased with the decrease in gs and Ci and decreased with the increase in Ls under drought stress. The main reason for the decrease in A may be the stomatal limitation, which resulted in the reduction of raw materials needed for photosynthesis. It has been shown that drought stress leads to stomatal closure in plants, causing an increase in WUE with a decrease in E [27]. It is consistent with our results. Shade-grown plants usually maintain higher photosynthetic rates under shady conditions. In the present study, we found that gs decreased significantly under shading treatment, and the leaf E of B. striata decreased with the decrease in gs, and Ci also decreased with the decrease in gs. However, A did not change significantly, indicating that the photosynthetic assimilation capacity of B. striata remained relatively coordinated at this time. B. striata employs strategies to reduce the net photosynthetic rate, transpiration rate, and stomatal conductance in response to environmental stresses. This is consistent with the “trade-off theory” proposed by Smith and Huston [13] that shading can aggravate the negative effects of drought stress on plants. The changes in water use efficiency also support this theory.
The accumulation and transport of photosynthetic products in plants affect the formation of yield and quality [28]. Drought stress is an important environmental factor affecting the secondary metabolites in plants. Numerous studies have shown that plants accumulate higher concentrations of secondary metabolites under drought stress than under well-watered conditions [29]. The results of a study on Scutellaria baicalensis showed that appropriate drought could promote baicalin accumulation by stimulating the expression and activity of key enzymes involved in the biosynthesis of the compounds, while excessive drought led to the degradation of baicalin [30]. This is similar to our finding that polysaccharides, total flavonoids, and total phenolics were reduced in BP under severe drought. This may be because the drought led to the blockage of the synthetic pathways of these compounds. Hosseini et al. [31] found a similar result: mild drought increased liquiritigenin content in Glycyrrhiza glabra L., while moderate and severe drought decreased it.
Both shading and drought reduced the contents of flavonoids, total phenols, and polysaccharides in BP, but polysaccharides were the only ones with significant reductions under the dual stresses of shading and drought (p < 0.05). Interestingly, militarine is the only quality marker for BP specified in the Chinese Pharmacopoeia, and its content can significantly increase when exposed to environmental stress (p < 0.05), especially under the dual stresses of shading and drought. This confirms that environmental stress can increase the secondary metabolites of TCM [32].

4.2. Differential Metabolites in Response to Stressful Environments

Plants have the ability to synthesize various secondary metabolites to cope with the negative effects of stress [33]. The results showed that changes in the photosynthetic properties induced by environmental stress are not linearly related to the content of active ingredients in BP (unpublished data), indicating that the metabolite concentration of B. striata shows more complex changes under environmental stress. Our metabolomics results revealed significant up-regulation of citric acid, homocysteine (Hcy), malic acid, and significant down-regulation of protopine and levoglucosan in W vs. CK. Hcy is a sulfur-containing non-protein amino acid produced from redox-sensitive methionine metabolism; its accumulation triggers oxidative stress and related lipid peroxidation processes in plants. Sobieszczuk-Nowicka et al. [34] observed an increase in plant Hcy under stress conditions. The high expression of organic acids in plant tissues is likely due to their important role as photosynthetic intermediates, and organic acids can be used as metabolically active solutes for osmoregulation and cation excess homeostasis [35]. Previous studies have shown that the levels of both malic and citric acid in plants rise under water stress, resulting in an overall increase in total organic acid content. [36,37]. In this study, the drought stress induced a decrease in the photosynthetic capacity of B. striata, which led to an increase in the organic acid content of the plant to regulate growth and osmotic pressure homeostasis. The high expression of Hcy confirmed that B. striata was in a state of metabolic disorder at this time, and the photosynthetic assimilation capacity was reduced, causing a decrease in polysaccharides, total flavonoids, and total phenols. However, the reason for the change in militarine is not yet understood. It is necessary to conduct further study.
The changes in the differential metabolites were more complex under dual stresses than under a single stress. Similar changes in amino acid and monosaccharide compounds, observed under shade stress, were evident in the LW vs. CK comparison. During this period, there was an up-regulation in the expression of glutamate, L-aspartate, L-serine, L-threonine, and asparagine, while the expression of D-allosterose, D-alanose, and D-mannitol was down-regulated. Interestingly, in this study, the up-regulation of maltose, endoetherose, and fibeditol occurred under double-shaded drought stress, different from single-drought stress. This confirms the “interaction theory” mentioned above [15]. The changes in metabolites in BP under dual shading-drought stresses were more like a composite of the changes under shade stress and drought stress.
Differential metabolic pathway analysis can be helpful for a deeper understanding of metabolic processes and their regulatory mechanisms in cells or tissues, identifying changes in specific metabolic pathways involved in adaptation to environmental constraints [38,39]. Our results showed significant differences in both glyoxylate and dicarboxylate metabolism in different treatment groups. Glyoxylate and dicarboxylate metabolism is a metabolic pathway in plant cells that allows plants to synthesize carbohydrates from two-carbon compounds such as fatty acids or acetyl-CoA. This metabolic pathway plays an important role in regulating plant growth by helping plants maintain energy and carbon balance under conditions of limited photosynthesis or a lack of carbon sources [40,41]. The growth and development of B. striata can be affected to some extent by both single and dual stresses. The secondary metabolites in B. striata are highly diverse, of which militarine is the most important, according to a less in-depth study. Therefore, we combined SVM and ANN models to characterize the major metabolites regulating the active ingredients in BP under environmental stress. It was found that pyruvic acid, glyceric acid, alanine, anthocyanin, propanedioic acid, L-serine, phosphoric acid, L-threonine, L-aspartic acid, and glutamic acid were 10 compounds that highly regulated the contents of active ingredients in BP, including five amino acids (alanine, L-serine, L-threonine, L-aspartic acid, and glutamic acid) and three organic acids (pyruvic acid, glyceric acid, and propanedioic acid). Therefore, we hypothesize that amino acids and organic acids strongly regulate the expression of active compounds in BP.

5. Conclusions

In conclusion, environmental stresses significantly affected the content of active ingredients in BP. In this study, the results showed that B. striata could adopt a strategy of increasing amino acid concentration and decreasing carbohydrate concentration to cope with the shading stress, while using the strategy of decreasing photosynthetic rate and increasing organic acid concentration under the drought stress. Under the dual stresses of shading and drought, the strategic performance of B. striata is consistent with the “trade-off theory”. The ANN model established could predict the relationship between characteristic metabolites and active ingredients for the first time, laying the foundation for subsequent ingredient research on B. striata. The contents of polysaccharides, total flavonoids, and total phenols in BP decreased when subjected to environmental stress. However, militarine increased significantly in shading and drought stresses. Our results indicate that it becomes possible to efficiently obtain target components by regulating growth conditions based on cultivation objectives.

Author Contributions

Conceptualization and methodology, X.X. and R.Y.; software, R.Y. and P.D.; formal analysis, L.C.; investigation, R.Y. and L.C.; experiment analysis, P.D. and X.C.; data curation, L.C.; writing—original draft preparation, R.Y.; writing—review and editing, X.X.; visualization, R.Y., L.C. and X.C.; supervision, project administration, funding acquisition, X.X. All authors have read and agreed to the published version of the manuscript.

Funding

This research was financially supported by the National Key Research and Development Program of China (Grant No. 2018YFD060010503) and the Key Research and Development Program of Anhui Province (Grant No. 202007d06020010).

Data Availability Statement

Data are contained within the article and supplementary materials.

Conflicts of Interest

The authors declare no conflicts of interest.

Appendix A

Figure A1. Plot of OPLS-DA scores between different comparison groups: (A) L vs. CK, (B) W vs. CK, (C) LW vs. CK, (D) LW vs. L and (E) LW vs. W.
Horticulturae 10 00163 g0a1
Figure A2. OPLS-DA model replacement test between different comparison groups: (A) L vs. CK, (B) W vs. CK, (C) LW vs. CK, (D) LW vs. L and (E) LW vs. W.
Horticulturae 10 00163 g0a2
Table A1. OPLS-DA model parameters.
Comparison GroupR2XR2YQ2
L vs. CK0.8030.9990.8
W vs. CK0.8380.9990.702
LW vs. CK0.9420.9990.902
LW vs. L0.8740.9990.757
LW vs. W0.9020.9990.954

References

  1. He, X.; Wang, X.; Fang, J.; Zhao, Z.; Huang, L.; Guo, H.; Zheng, X. Bletilla striata: Medicinal uses, phytochemistry and pharmacological activities. J. Ethnopharmacol. 2017, 195, 20–38. [Google Scholar] [CrossRef]
  2. Ji, X.; Yin, M.; Nie, H.; Liu, Y. A review of isolation, chemical properties, and bioactivities of polysaccharides from Bletilla striata. BioMed Res. Int. 2020, 2020, 5391379. [Google Scholar] [CrossRef]
  3. Jiang, S.; Wang, M.; Jiang, L.; Xie, Q.; Yuan, H.; Yang, Y.; Zafar, S.; Liu, Y.; Jian, Y.; Li, B.; et al. The medicinal uses of the genus Bletilla in traditional Chinese medicine: A phytochemical and pharmacological review. J. Ethnopharmacol. 2021, 280, 114263. [Google Scholar] [CrossRef]
  4. Chinese Pharmacopoeia Commission. Pharmacopoeia of the People’s Republic of China 2020; The Medicine Science and Technology Press of China: Beijing, China, 2020. [Google Scholar]
  5. Cheng, X. Effects of Light on the Growth and Medicinal Components of Tetrastigma hemsleyanum. Master’s Thesis, Chinese Academy of Forestry, Beijing, China, 2018. [Google Scholar]
  6. Poorter, H.; Niinemets, U.; Ntagkas, N.; Siebenkas, A.; Maeenpaeae, M.; Matsubara, S.; Pons, T. A meta-analysis of plant responses to light intensity for 70 traits ranging from molecules to whole plant performance. New Phytol. 2019, 223, 1073–1105. [Google Scholar] [CrossRef]
  7. Li, Y.; Kong, D.; Fu, Y.; Sussman, M.; Wu, H. The effect of developmental and environmental factors on secondary metabolites in medicinal plants. Plant Physiol. Biochem. 2020, 148, 80–89. [Google Scholar] [CrossRef] [PubMed]
  8. Slavik, B. The Influence of decreasing hydration level on photosynthetic rate in the thalli of the hepatic conocephallum conicum. In Water Stress in Plants; Slavik, B., Ed.; Springer: Berlin/Heidelberg, Germany, 1965; pp. 195–202. [Google Scholar] [CrossRef]
  9. Tardieu, F.; Simonneau, T.; Muller, B. The physiological basis of drought tolerance in crop plants: A scenario-dependent probabilistic approach. Annu. Rev. Plant Biol. 2018, 69, 733–759. [Google Scholar] [CrossRef] [PubMed]
  10. Dinneny, J. Developmental responses to water and salinity in root systems. Annu. Rev. Cell Dev. Biol. 2019, 35, 239–257. [Google Scholar] [CrossRef] [PubMed]
  11. Rellan-Alvarez, R.; Lobet, G.; Dinneny, J. Environmental control of root system biology. Annu. Rev. Plant Biol. 2016, 67, 619–642. [Google Scholar] [CrossRef]
  12. de Abreu, I.N.; Mazzafera, P. Effect of water and temperature stress on the content of active constituents of Hypericum brasiliense Choisy. Plant Physiol. Biochem. 2005, 43, 241–248. [Google Scholar] [CrossRef] [PubMed]
  13. Smith, T.; Huston, M. A theory of the spatial and temporal dynamics of plant communities. Prog. Theor. Veg. Sci. 1990, 11, 49–69. [Google Scholar] [CrossRef]
  14. Quero, J.; Villar, R.; Maranon, T.; Zamora, R. Interactions of drought and shade effects on seedlings of four Quercus species: Physiological and structural leaf responses. New Phytol. 2006, 170, 819–834. [Google Scholar] [CrossRef]
  15. Holmgren, M.; Scheffer, M.; Huston, M. The interplay of facilitation and competition in plant communities. Ecology 1997, 78, 1966–1975. [Google Scholar] [CrossRef]
  16. Holmgren, M. Combined effects of shade and drought on tulip poplar seedlings: Trade-off in tolerance or facilitation? Oikos 2000, 90, 67–78. [Google Scholar] [CrossRef]
  17. Beale, D.; Pinu, F.; Kouremenos, K.; Poojary, M.; Narayana, V.; Boughton, B.; Kanojia, K.; Dayalan, S.; Jones, O.A.H.; Dias, D.A. Review of recent developments in GC–MS approaches to metabolomics-based research. Metabolomics 2018, 14, 152. [Google Scholar] [CrossRef]
  18. Walker, T.W.N.; Alexander, J.M.; Allard, P.M.; Baines, O.; Baldy, V.; Bardgett, R.D.; Capdevila, P.; Coley, P.D.; David, B.; Defossez, E.; et al. Functional Traits 2.0: The power of the metabolome for ecology. J. Ecol. 2022, 110, 4–20. [Google Scholar] [CrossRef]
  19. Ghatak, A.; Chaturvedi, P.; Weckwerth, W. Metabolomics in plant stress physiology. Plant Genet. Mol. Biol. 2018, 164, 187–236. [Google Scholar]
  20. Hsiao, T. Plant responses to water stress. Annu. Rev. Plant Physiol. 1973, 24, 519–570. [Google Scholar] [CrossRef]
  21. Lu, J.; Wang, Z.; Qin, L.; Shen, J.; He, Z.; Shao, Q.; Lin, D. Drying methods affect bioactive compound contents and antioxidant capacity of Bletilla striata (Thunb.) Reichb. f. flower. Ind. Crops Prod. 2021, 164, 113388. [Google Scholar] [CrossRef]
  22. Deng, P.; Yin, R.; Wang, H.; Chen, L.; Cao, X.; Xu, X. Comparative analyses of functional traits based on metabolome and economic traits variation of Bletilla striata: Contribution of intercropping. Front. Plant Sci. 2023, 14, 1147076. [Google Scholar] [CrossRef]
  23. Fu, Y.; Liu, T.Y.; Wang, X.; Wang, Y.; Gong, Q.; Li, G.; Lin, Q.; Zhu, S.Y. Untargeted metabolomics reveal rhizosphere metabolites mechanisms on continuous ramie cropping. Front. Plant Sci. 2023, 14, 1217956. [Google Scholar] [CrossRef]
  24. Barron-Gafford, G.; Pavao-Zuckerman, M.; Minor, R.; Sutter, L.; Barnett-Moreno, I.; Blackett, D.; Thompson, M.; Dimond, K.; Gerlak, A.; Nabhan, G.; et al. Agrivoltaics provide mutual benefits across the food–energy–water nexus in drylands. Nat. Sustain. 2019, 2, 848–855. [Google Scholar] [CrossRef]
  25. Mackova, J.; Vaskova, M.; Macek, P.; Hronkova, M.; Schreiber, L.; Santrucek, J. Plant response to drought stress simulated by ABA application: Changes in chemical composition of cuticular waxes. Environ. Exp. Bot. 2013, 86, 70–75. [Google Scholar] [CrossRef]
  26. Farquhar, G.; Sharkey, T. Stomatal conductance and photosynthesis. Annu. Rev. Plant Physiol. 1982, 33, 317–345. [Google Scholar] [CrossRef]
  27. Chaves, M.; Flexas, J.; Pinheiro, C. Photosynthesis under drought and salt stress: Regulation mechanisms from whole plant to cell. Ann. Bot. 2009, 103, 551–560. [Google Scholar] [CrossRef]
  28. Dong, B.; Yang, H.; Liu, H.; Qiao, Y.; Zhang, M.; Wang, Y.; Xie, Z.; Liu, M. Effects of shading stress on grain number, yield, and photosynthesis during early reproductive growth in wheat. Crop Sci. 2019, 59, 363–378. [Google Scholar] [CrossRef]
  29. Kleinwachter, M.; Selmar, D. New insights explain that drought stress enhances the quality of spice and medicinal plants: Potential applications. Agron. Sustain. Dev. 2014, 35, 121–131. [Google Scholar] [CrossRef]
  30. Cheng, L.; Han, M.; Yang, L.; Yang, L.; Sun, Z.; Zhang, T. Changes in the physiological characteristics and baicalin biosynthesis metabolism of Scutellaria baicalensis Georgi under drought stress. Ind. Crops Prod. 2018, 122, 473–482. [Google Scholar] [CrossRef]
  31. Hosseini, M.; Samsampour, D.; Ebrahimi, M.; Abadia, J.; Khanahmadi, M. Effect of drought stress on growth parameters, osmolyte contents, antioxidant enzymes and glycyrrhizin synthesis in licorice (Glycyrrhiza glabra L.) grown in the field. Phytochemistry 2018, 156, 124–134. [Google Scholar] [CrossRef]
  32. Shahrajabian, M.; Kuang, Y.; Cui, H.; Fu, L.; Sun, W. Metabolic changes of active components of important medicinal plants on the basis of traditional Chinese medicine under different environmental stresses. Curr. Org. Chem. 2023, 27, 782–806. [Google Scholar] [CrossRef]
  33. Pant, P.; Pandey, S.; Dall’Acqua, S. The influence of environmental conditions on secondary metabolites in medicinal plants: A literature review. Chem. Biodivers. 2021, 18, e2100345. [Google Scholar] [CrossRef] [PubMed]
  34. Sobieszczuk-Nowicka, E.; Arasimowicz-Jelonek, M.; Tanwar, U.; Floryszak-Wieczorek, J. Plant homocysteine, a methionine precursor and plant’s hallmark of metabolic disorders. Front. Plant Sci. 2022, 13, 1044944. [Google Scholar] [CrossRef]
  35. Lopez-Bucio, J.; Nieto-Jacobo, M.; Ramirez-Rodriguez, V.; Herrera-Estrella, L. Organic acid metabolism in plants: From adaptive physiology to transgenic varieties for cultivation in extreme soils. Plant Sci. 2000, 160, 1–13. [Google Scholar] [CrossRef] [PubMed]
  36. Zhang, G.; Xie, S. Influence of water stress on the citric acid metabolism related gene expression in the ponkan fruits. Agric. Sci. 2014, 5, 1513. [Google Scholar] [CrossRef]
  37. Timpa, J.; Burke, J.; Quisenberry, J.; Wendt, C. Effects of water stress on the organic acid and carbohydrate compositions of cotton plants. Plant Physiol. 1986, 82, 724–728. [Google Scholar] [CrossRef] [PubMed]
  38. Ma, N.; Aziz, A.; The, K.; Lam, S.; Cha, T. Metabolites re-programming and physiological changes induced in Scenedesmus regularis under nitrate treatment. Sci. Rep. 2018, 8, 9746. [Google Scholar] [CrossRef] [PubMed]
  39. Chmielewska, K.; Rodziewicz, P.; Swarcewicz, B.; Sawikowska, A.; Krajewski, P.; Marczak, L.; Ciesiolka, D.; Kuczynska, A.; Mikolajczak, K.; Ogrodowicz, P.; et al. Analysis of drought-induced proteomic and metabolomic changes in barley (Hordeum vulgare L.) leaves and roots unravels some aspects of biochemical mechanisms involved in drought tolerance. Front. Plant Sci. 2016, 7, 1108. [Google Scholar] [CrossRef] [PubMed]
  40. He, L.; Jin, P.; Chen, X.; Zhang, T.; Zhong, K.; Liu, P.; Chen, J.; Yang, J. Comparative proteomic analysis of Nicotiana benthamiana plants under Chinese wheat mosaic virus infection. BMC Plant Biol. 2021, 21, 51. [Google Scholar] [CrossRef]
  41. Wang, M.; Zang, L.; Jiao, F.; Perez-Garcia, M.; Oge, L.; Hamama, L.; Le, G.; Sakr, S.; Chen, J. Sugar signaling and post-transcriptional regulation in plants: An overlooked or an emerging topic? Front. Plant Sci. 2020, 11, 578096. [Google Scholar] [CrossRef]
Figure 1. Differences in photosynthetic parameters between groups: (A) net photosynthesis rate; (B) transpiration rate; (C) intracellular carbon dioxide concentration; (D) stomatal Conductance; (E) water use efficiency; and (F) stomatal limitation. CK: the control; L: shading treatment; W: drought treatment; LW: shading-drought dual stresses. The different letters in the same column indicate a significant difference among groups by one-way ANOVA (LSD, p < 0.05). Each value represents the mean ± SE of six replicates.
Horticulturae 10 00163 g001
Figure 2. Differences in effective components in BP under different stresses: (A) total polysaccharide; (B) total flavonoids; (C) total phenols; and (D) militarine. Each value represents the mean ± SE of six replicates. The different letters in the same column indicate a significant difference among groups by one-way ANOVA (LSD, p < 0.05). Each value represents the mean ± SE of six replicates.
Horticulturae 10 00163 g002
Figure 3. Scatterplot of PCA scores between groups derived from SIMCA-P analysis, with different colored points representing different treatments. The control (CK); the shading treatment (L); the drought treatment (W); and the shading-drought dual stresses (LW); and the quality control (QC).
Horticulturae 10 00163 g003
Figure 4. Differential metabolite volcano plots between treatment groups: red dots indicate a significant increase, and green dots indicate a significant increase.
Horticulturae 10 00163 g004
Figure 5. Enrichment of differential metabolites in KEGG metabolic pathways.
Horticulturae 10 00163 g005
Figure 6. Artificial neural network topology.
Horticulturae 10 00163 g006
Disclaimer/Publisher’s Note: The statements, opinions and data contained in all publications are solely those of the individual author(s) and contributor(s) and not of MDPI and/or the editor(s). MDPI and/or the editor(s) disclaim responsibility for any injury to people or property resulting from any ideas, methods, instructions or products referred to in the content.

