Abstract
The Ipomoea batatas ornamental variety of the edible sweet potato is a decorative sweet potato with exquisite leaves, available in different varieties. Due to its numerous characteristics related to resistance, adaptability to environmental conditions, rapid growth, and aesthetic traits, it has attracted the interest of researchers. The purpose of this study is to investigate the growth and development behaviour of two varieties of I. batatas, namely ‘Margarita’ and ‘Blackie’, cultivated in vertical systems, to provide guidelines for their usage in green façade design. The physiological growth processes throughout the growing season were analysed by monitoring three biometric parameters (diameter, height, and leaf count), transpiration (dehydration rate), and the photosynthesis process (photosynthetic pigment content) for treated and control variants and four cardinal orientations (N, E, S, and W). Compared to the control and western orientation, which proved to be less advantageous, the northern orientation and treatment appeared to be the most suitable options for both varieties analysed. Also, the content of organic substances was more intense in the Cropmax-treated ‘Blackie’, especially on the northern façade, with the highest quantities of chlorophyll a (17.1%), chlorophyll b (9.1%), and carotenoid pigments (7.5%). In addition, the leaf dehydration rate, as well as the amount of free water loss, were reduced on the northern façade of ‘Blackie’. Therefore, ‘Blackie’ can be recommended as a variety distinguished by its improved resistance to challenging environmental conditions, particularly drought.
1. Introduction
Reducing the negative impacts of excessive urbanisation has been a major concern for researchers from various fields of study in their attempts to provide an effective, sustainable solution to this currently challenging issue [1]. Both macro-level solutions on large land areas, such as urban and peri-urban forests [2], and micro-level solutions, which cover smaller surfaces (parks and squares) or unconventional surfaces such as green roofs and façades [3,4], aim to counteract such effects and contribute to greater urban comfort and life quality. The mitigation of urban heat islands, the reduction or elimination of air pollutants, a lowered level of noise, and improved physical and mental health, as well as the well-being of citizens, are some of the benefits provided by green areas [5,6].
Recently, studies have focused on the sweet potato (Ipomoea batatas [L.] Lam) owing to its unique nutritional and functional properties. Originally from Central America, it is a significant crop in temperate and tropical regions, especially in Africa and Asia [7,8,9,10]. Sweet potatoes are among the most versatile and underexploited food crops in the world. Their cultivation and production are highly important as they contribute to the alleviation of food shortages during such crises as natural disasters or wars [11]. Rich in complex carbohydrates [12], they are considered to be a highly nutritious food, and both the roots and leaves may be ingested [13]. The cultivation of sweet potato in Romania has been sporadic, mainly found in the sandy soils of a warmer climate, such as southern Oltenia [14,15].
Ipomoea batatas is cultivated primarily as a nutraceutical vegetable plant [16] and for industrial purposes, according to the literature [8,14]. It is a disease- and pest-resistant plant, tolerating both high [15] and relatively low humidity and low light conditions [17]. Moreover, it can withstand extreme temperatures and adapt well to different climate conditions [18]. These traits, along with the aesthetic features of its foliage, have allowed some varieties of I. batatas to be used for ornamental purposes. They grow rapidly and are easily cultivated [17,19], suitable in standalone planting as well as in floral combinations with other well-established species [15].
The ornamental sweet potato is a vegetable plant that has achieved popularity in the landscape industry as a result of its compact habitus, vigorous vegetative growth, and beautifully coloured leaves in shades of green or violet-red with delicate pink flowers [15]. The interest of horticulturists in cultivating sweet potatoes as ornamental plants, either as individual plants or in combination with other ornamental plants, was mainly sparked by the attractive colour of their leaves [20].
The ornamental plant has become increasingly popular, and several new varieties were recently introduced due to their manner of growth and distinctive leaf colours and forms [21]. The best-known varieties, ‘Blackie’ and ‘Margarita’, have been used to create vegetation carpets of intense violet and yellow-green [22]. Due to its greenish-coloured leaves that persist throughout the growth season, the I. batatas ‘Margarita’ may be successfully used as a supporter plant [23]. It is also considered a good ground cover plant [24].
The popularisation of ‘Blackie’ with its purple foliage has emphasised the ornamental value of the leaves of this species. ‘Margarita’ was discovered in the garden of Mr. Hunter Stubbs in Raleigh, N.C. He provided a single plant in the fall of 1995, which was propagated via vegetative cuttings in a greenhouse at the University of Georgia. In 1996, the variety was released by the New Crop Program of the University’s Department of Horticulture [25,26].
‘Margarita’ and ‘Blackie’ are characterised by a decumbent habit, and a high increase in shoots has been observed in this type of plant, especially in those cultivated in pots [27].
Studies on the aesthetic and practical advantages of sweet potato (air pollutant adsorption and phytoremediation) have become more prevalent as a result of the growing popularity of ornamental plant variations. In 2013, the Zhejiang University of Agriculture and Forestry in China conducted a study on 21 varieties of I. batatas, aiming to identify and select those with significant ornamental value [28]. Between 2014 and 2015, another study was carried out in Brazil that aimed to identify the ornamental potential of sweet potato accessions [19].
Five cultivars, including ‘Margarita’, were selected to be part of a study that investigated the correlation between the adsorption of atmospheric pollutants and the characteristics of the leaves. The effects of particulate matter stress the physiological characteristics of ornamental sweet potato cultivars [29]. Also, another study investigating the phytoremediation properties of sweet potato for the biological remediation of soils contaminated with heavy metals found that sweet potato is a hyperaccumulator of two heavy metals, Pb and Zn [30].
The purpose of this study is to investigate the growth and development behaviour of two varieties of I. batatas, namely ‘Margarita’ and ‘Blackie’, cultivated in vertical systems, to provide guidelines for their usage in green façade design. The physiological growth processes throughout the growing season were analysed by monitoring three biometric parameters (diameter, height, and leaf count), transpiration (dehydration rate), and the photosynthesis process (photosynthetic pigment content) for two variants (treated and control) and four cardinal orientations (N, E, S, and W).
2. Materials and Methods
2.1. Location and Climatic Conditions
This study was part of a field experiment conducted in May–September 2022 at the Floriculture Research Field of the Faculty of Horticulture of the University of Life Sciences of Iasi (47°19′41″ N, 27°55′55″ E). The climate in the experimental area is temperate–continental, associated with temperature variations in winter and summer ranging from –36 °C to +40 °C, with the annual average for the period 1901–2000 being +9.5 °C. (Iasi County Statistical Department) (https://iasi.insse.ro/ accessed on 10 August 2023). Extended periods of drought may occasionally be recorded.
The National Meteorology Centre in Iasi recorded an average temperature for the Iasi area in 2022 that ranged from 10.5 °C (September) to 27.8 °C (July) (Figure 1); the maximum precipitation value during the experiment reached 38.2 mm (August) (Table 1); the recorded average relative humidity ranged from 39% (July) to 96% (September); and the wind intensity ranged from 1.4 to 2 m/s (January–December) (NMA). (Humidity was measured on 41 of the 122 days of the experiment; Figure 2).
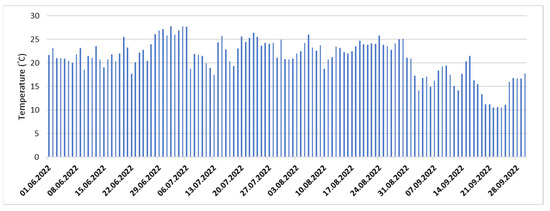
Figure 1.
Temperature in June–September 2022.

Table 1.
Climate data in Iasi, June–September 2022.
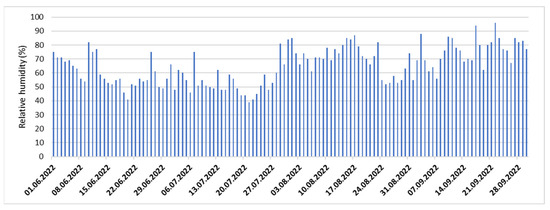
Figure 2.
Relative humidity in July–September 2022.
2.2. Experiment Material and Design
The study material consisted of two ornamental varieties of I. batatas, ‘Margarita’ and ‘Blackie’.
The experimental structure was constructed with plants placed on its faces in order to study the behaviour of vertically planted floral species (Figure 3a). Each face of the experimental structure was composed of four equally stacked tiers oriented towards a cardinal point. Each tier covered an area of 1 m2, replicated three times. A small intermediate space facilitating plant watering was left between the tiers [3].
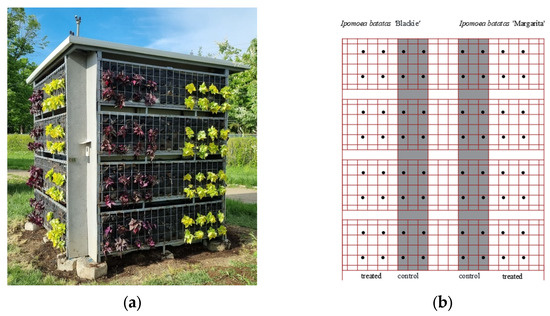
Figure 3.
Experimental site: (a) experimental set-up; (b) experimental scheme.
‘Blackie’ and ‘Margarita’ of I. batatas were arranged on each tier, one below the other in two distinct columns. The planting pattern was identical on all four faces of the experimental structure (Figure 3b).
Before planting, the following average values for the plant characteristics of ‘Blackie’ and ‘Margarita’ of I. batatas were determined, respectively: diameter = 13.1 cm; height = 13.4 cm; and number of leaves = 12.8 and diameter = 12.5 cm; height = 12.8 cm; and number of leaves = 18.2. The plant survival rate was 100%.
For the Cropmax-treated plants, a highly concentrated complex fertiliser for foliar fertilisation was selected. It was a 100% natural biological product and complied with the European Union requirements, BCS; ÖKO–Germany certified it. Previous studies using Cropmax as a growth stimulant for certain plant species have shown its favourable impact on the process of photosynthesis [31]. Auxins, cytokinins, gibberellins and others, plant growth stimulators, organic amino acids, plant vitamins, and enzymes are among the components that comprise it: macro-elements: nitrogen (N)—0.2%, phosphorus (P)—0.4%, and potassium (K)—0.02%; and micro-elements: iron—220 mg/L, magnesium—550 mg/L, zinc—49 mg/L, manganese—54 mg/L, copper—35 mg/L, boron—70 mg/L, and calcium, molybdenum, cobalt, nickel—10 mg/L.
The nutrient solution was supplied using a dose of 1.5 mL Cropmax/L water, applied at 7-day intervals from July until the end of August.
Observations were made monthly (June, July, August, and September), and the same parameters, namely plant diameter, plant height, and the number of leaves, were also monitored during planting. After applying the foliar fertiliser (in July, August, and September), the leaves were harvested from each variant to determine the content of photosynthetic pigments and calculate the rate of foliar dehydration (Section 3.3 and Section 3.4).
Additionally, photographic monitoring was conducted for a dynamic visual assessment of ornamental features. For each variety, the control variants were separately compared with the treated ones for each orientation and between orientations within the same measurement.
The data were statistically interpreted using the Mann–Whitney and Kruskal–Wallis non-parametric tests (Section 2.4).
2.3. The Content of Photosynthetic Pigments and the Rate of Dehydration
The quantity of photosynthetic pigments in the leaves of the ornamental sweet potato was identified using the spectrophotometric method, which involves the identification and quantification of chlorophyll a and b.
This method is based on the light absorption capacity of the acetone extract of the pigments. The pigment contents were extracted using 80% acetone and filtered using a Gooch filter, followed by spectrophotometer analysis using the Spectrocord 210 Plus (Analytik Jena, Jena, Germany). The pigment content was calculated using the following formulas to determine chlorophyll a (Equation (1)), chlorophyll b (Equation (2)), and carotenoids (Equation (3)):
where LU663, LU645, and LU470 represent the wavelengths used in the determinations [32,33].
The growth process was quantified by analysing the diameter of the plant (cm), the height of the plant (cm), and the number of leaves per plant in June, July, August, and September of 2022. For the visual assessment of the ornamental features, we conducted a monthly dynamic photographic monitoring of each individual orientation in both sweet potato varieties.
The foliar dehydration rate was analysed in the leaves of the ornamental sweet potato plants at intervals of 1, 2, 3, and 4 h after sampling, and the free water lost by the leaves was calculated after 24 h of dehydration.
Leaf samples were collected in July, August, and September and analysed on the same day. We analysed the leaves of the two varieties of I. batatas, a red-purple leaf from ‘Blackie’, and a green leaf from ‘Margarita’, which were harvested from both varieties (control and treated) for all 4 cardinal orientations of the experimental structure (Figure 4).

Figure 4.
Foliar dehydration rate–work stages ((a) harvested leaves placed to hydrate; (b,c) weighing the leaves after removing the petiole; (d) placing the leaves on individual sheets in view between the measurements).
2.4. Nutrient Mixture Analysis
The nutrient mixture used for the two ornamental varieties used in this research was sampled at two depths (0–20 cm and 20–40 cm) for each of the four orientations (north, east, south, and west) of the module. The nutrient mixture samples were analysed following the standard methods of our country and with the instructions provided by the National Research–Development Institute for Pedology, Agrochemistry and Environmental Protection (ICPA), Bucharest [34]. Prior to the start of the study, the nutrient mixture properties of 0–40 cm had a very strongly to moderately acidic reaction, a low content in total phosphorus , and a medium content in total potassium .
The main nutrient mixture properties used in the experimental site are given in Table 2.

Table 2.
Nutrient mixture analysis report (analyses were performed in aqueous extract at a ratio of 1:10 dry nutrient mixture at 105 °C/water).
2.5. Statistical Analysis
After collecting and grouping data to identify the most effective statistical tests, the Kolmogorov–Smirnov test was applied to test the normality of data distribution. The results indicated that the data groups did not have a normal distribution, and therefore, the non-parametric tests were applied.
The Mann–Whitney test was used to compare the differences between the two independent groups when the dependent variable was not normally distributed [35]. Therefore, the following hypotheses were formulated:
- Null hypothesis, H0: The population medians are equal: Me1 = Me2.
- Alternative hypothesis, H1: The population medians are not equal: Me1 ≠ Me2.
Also, the Kruskal–Wallis non-parametric test, or ‘one-way ANOVA on ranks,’ was used to determine if there were statistically significant differences between two or more groups of an independent variable. This test serves as an alternative to one-way ANOVA for data groups without a normal distribution, being an extension of the Mann–Whitney test and enabling the comparison of more than two independent groups.
The Kruskal–Wallis test determines whether the medians of multiple data groups are different [36,37]. Therefore, the test hypotheses are as follows:
- Null hypothesis, H0: The population medians are equal. Me1 = Me2= Me3 = …= Mek.
- Alternative hypothesis, H1: There is at least one pair of medians that are not equal. Me1 ≠ Me2 ≠ Me3 ≠ …≠ Mek
where Me1, Me2, Me3,…, Mek are the median values for the sets of analysed data.
The statistical tests were performed using MS Excel 2019 from the Office 2019 Professional package and were carried out at a significance level of 0.05.
3. Results
Growth is the process by which plant cells, tissues, and organs increase in volume and weight gradually and irreversibly due to the constant increase in the amount of dry substance as a result of the biosynthetic processes of their own organic substance transformation and deposition [38,39]. The process of growth starts with an embryonic stage that is found in the meristem called meresis. The growth subsequently proceeds to the auxesis, with an elongation of the formed cells, and ends with the differentiation of the typical anatomical structure. The length and thickness of the organ increase [38,39].
3.1. Growth of ‘Margarita’
The ‘Margarita’ plants achieved their peak appearance in August in both control and fertilised variants in all cardinal orientations (Figure 5, Figure 6, Figure 7 and Figure 8).
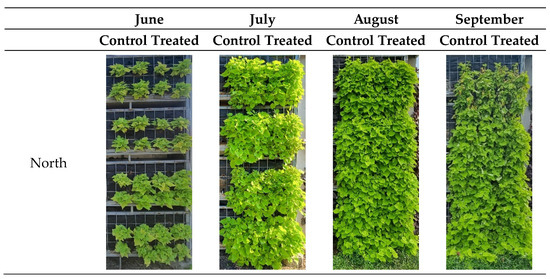
Figure 5.
Dynamic photographic monitoring by month for ‘Margarita’ on the north-facing façade.
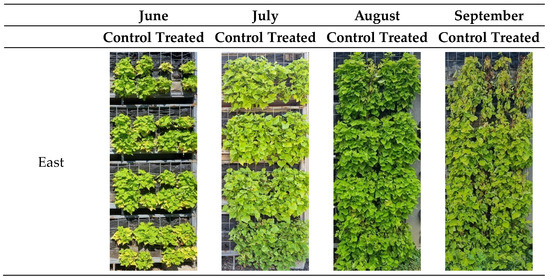
Figure 6.
Dynamic photographic monitoring by month for ‘Margarita’ on the east-facing façade.
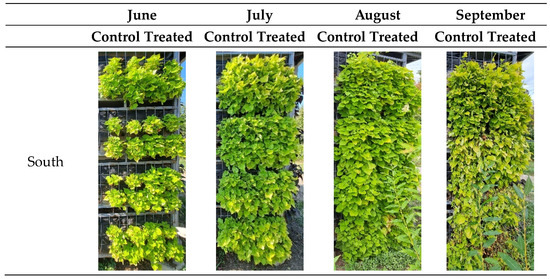
Figure 7.
Dynamic photographic monitoring by month for ‘Margarita’ on the south-facing façade.
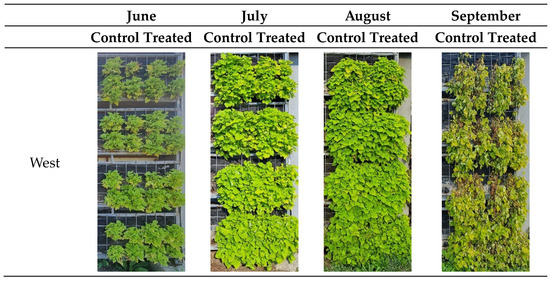
Figure 8.
Dynamic photographic monitoring by month for ‘Margarita’ on the west-facing façade.
We noted from the compared images that the north orientation was the most favourable among the façades, regardless of the month and the experimental variant (Figure 5). Additionally, we noticed that plants tended to start declining significantly earlier in the west orientation than in other orientations (Figure 8).
On the experimental structure, the diameter of the ‘Margarita’ leaves increased significantly in the Cropmax-treated variants in the north (N), east (E), and south (S) zones, reaching a maximum of 23.2 cm in the N zone (the difference between the first and last measurement), 19 cm in the E variant, and 19.9 cm in the S zone. There were differences of 2–3 cm characterising the treated variants compared to the untreated variants (Table 3).

Table 3.
Diameter of ‘Margarita’.
During the vegetation phase, the average height of ‘Margarita’ plants increased constantly, growing between 15.1 cm and 18.9 cm in the treated variants from June (13.8 cm) to September (32.7 cm) (Table 4). For all three months, when measurements were performed, the north orientation and the fertilised variant, with only small differences, resulted in the highest values for plant height.

Table 4.
Height of ‘Margarita’.
With a difference of 21–29.6 leaves between June and September, particularly in the N and E zones, the average number of leaves of each plant of ‘Margarita’ showed a significant increase in the Cropmax-treated plants compared to the control (Table 5).

Table 5.
Number of leaves for ‘Margarita’.
Regarding the number of leaves, the eastern orientation led to a higher number of leaves in the treated variant in the three months when measurements were taken. The lowest number of leaves was recorded in the west orientation (58.19 in July; 62.7 in August; and 62.94 in September).
Using the Mann–Whitney test to assess the values measured in the treated and untreated plants, we found that the stimulator produced significant differences (p < 0.05), especially regarding the leaf number parameter (N, S, West (W)) in all three months of analysis. However, for the plant height parameter, no significant differences were recorded (p > 0.05), except for August in the north orientation (p = 0.004703) (Table 6).

Table 6.
The Mann–Whitney test p-value for ‘Margarita’.
All parameters on the vertical system east-facing façade had highly equal means (p > 0.05), indicating that the stimulator had no effect on the monitored parameter values.
The Kruskal–Wallis test was applied to the datasets from the treated and untreated plants (collected in July, August, and September) and revealed that the cardinal orientation of the façades significantly influenced the three parameters (p < 0.05), except for the leaf number in July (for the control variant) and the plant height in August and September (for the treated variant) (Table 7).

Table 7.
The Kruskal–Wallis test for ‘Margarita’.
3.2. Growth of ‘Blackie’
The ‘Blackie’ plants maintained on the vertical system exhibited greater resistance than ‘Margarita’; while their overall appearance was maximised in August, plant growth remained high during September in all cardinal orientations (Figure 9, Figure 10, Figure 11 and Figure 12).
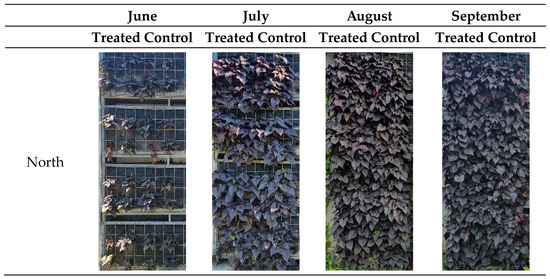
Figure 9.
Dynamic photographic monitoring by month for ‘Blackie’ on the north-facing façade.
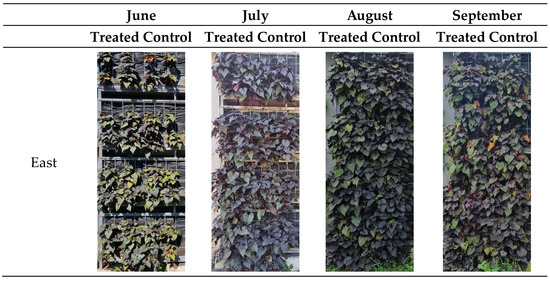
Figure 10.
Dynamic photographic monitoring by month for ‘Blackie’ on the east-facing façade.
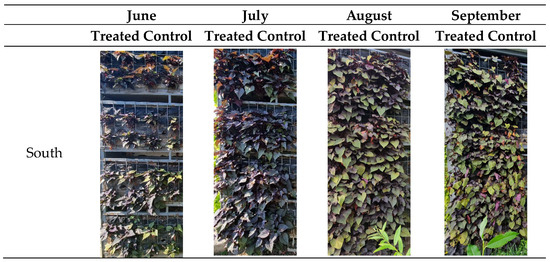
Figure 11.
Dynamic photographic monitoring by month for ‘Blackie’ on the south-facing façade.
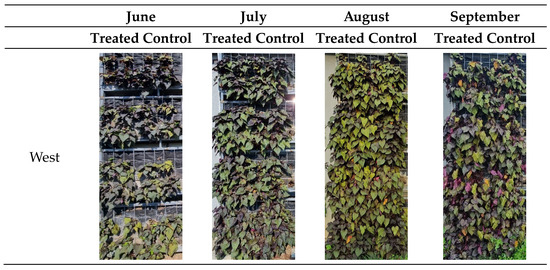
Figure 12.
Dynamic photographic monitoring by month for ‘Blackie’ on the west-facing façade.
Similar to ‘Margarita’, the north orientation was optimal for the ‘Blackie’ plants, where the purplish colour of the leaves remained constant throughout the month and regardless of the experimental variant.
From June to September, the diameter of ‘Blackie’ was evaluated. The Cropmax-treated variants showed significant improvements in all four cardinal points (Table 8). The N zone generated the largest sizes with a diameter that was 26.6 cm larger in September (45.3 cm) compared to June (18.7 cm). In September, the diameter of the same variant was approximately 7 cm greater compared to the untreated control variant.

Table 8.
Diameter of ‘Blackie’.
In August and September, the west and south façade plants in the control variant had the lowest values for plant diameter.
Plant height displayed a similar pattern with significant differences between the treated and the control variants. With a variation in plant length between June (13.0 cm) and September (32.2 cm), the treated variants in the north zone of the experimental structure exhibited the highest values (19.2 cm), followed by the south variants (13.5 cm in June and 30.8 cm in September), with lower values in the E and W (Table 9).

Table 9.
Plant height for ‘Blackie’.
On the south façade of the treated variant, ‘Blackie’ reached the highest average plant height values in July and August. In September, the highest value was in the treated variant on the north side (32.2 cm), while the control variant on the south side had the lowest value (26.9 cm).
During the entire three-month experiment, the plants of the control variant with the west orientation had the lowest number of leaves (35.0).
Table 10 shows that ‘Blackie’ grew intensely in the Cropmax-treated plants, with the highest values on the north side and a difference of 17 leaves between June (27.5) and September (44.5) in terms of average number of leaves per plant.

Table 10.
Number of leaves for ‘Blackie’.
On each façade of the experimental vertical structure, the values of the measured parameters of the treated and untreated plants were compared over a period of three months.
On the north façade, the p-values indicate that all measured parameters were highly influenced by the application of the foliar stimulator (p < 0.05) for all months when measurements were taken. For the east and west orientations, it was observed that the analysed parameters did not have significantly different average values (p > 0.05) for both the treated and the untreated plants, except for the plant height in the east and west orientations in August (Table 11).

Table 11.
The Mann–Whitney test for ‘Blackie’.
For the treated ‘Blackie’ plants, we noted that the cardinal orientation produced significant differences in the values of the monitored parameters (p < 0.05) in all three months of analysis, except for the number of leaves in July and August (p > 0.05) when the medians did not have significantly different values.
For the untreated plants, the cardinal orientation did not produce significant differences (p > 0.05). Exceptions were found at the beginning of the experiment for plant diameter (p = 0.00131) and plant height (p = 0.00001) (Table 12).

Table 12.
The Kruskal–Wallis test for ‘Blackie’.
3.3. Content of the Photosynthetic Pigments
The process of photosynthesis involves numerous substances found in the thylakoids and makes specific structures within chloroplasts. The photoreceptor pigments of the thylakoids, chloroplasts, and grana are grouped to form two photosystems comprising photoreceptor antennae and reaction centres. The photoreceptor antennae are composed of pigments that receive the energy from the photons in light radiation and transmit it to the reaction centres [40].
The assimilatory pigments are divided into two categories: chlorophyll pigments made of chlorophyll a and chlorophyll b and the carotenoid pigments made of carotene and xanthophyll. Chlorophyll is the pigment conferring on plants their characteristic green colour with the unique property of capturing solar energy, seen as the ‘true Prometheus stealing fire from heaven’ [38]. During the process of photosynthesis, light energy is absorbed and transformed into chemical energy by means of photosystem I (PSI) and photosystem II (PSII). These systems are composed of assimilatory pigments that act as absorption and reaction centres. They work together to transfer the energised electrons via photosynthetic phosphorylation. This chemical energy is used to synthesise organic molecules needed in plants [41].
The absorption centre in photosynthesis consists of molecules that act as antennae, capturing light energy and transferring it to the reaction centre. These molecules are called accessory auxiliary pigments or photoreceptor antennae, accounting for 99% of the total pigments in the photosynthetic system. The auxiliary pigments are responsible for absorbing light at different wavelengths, thus extending the absorption spectrum of plants and enabling them to capture a broader range of light energy. These pigments include chlorophylls a and b, as well as carotenoids, contributing to the characteristic colour of leaves and the efficient capture of light energy [42].
3.3.1. Experiment Result in July
In July, the chlorophyll content in ‘Blackie’ was the highest in the untreated control group compared to the group treated with Cropmax in all four zones of the experimental structure, indicating a higher photosynthetic intensity (Figure 13a).
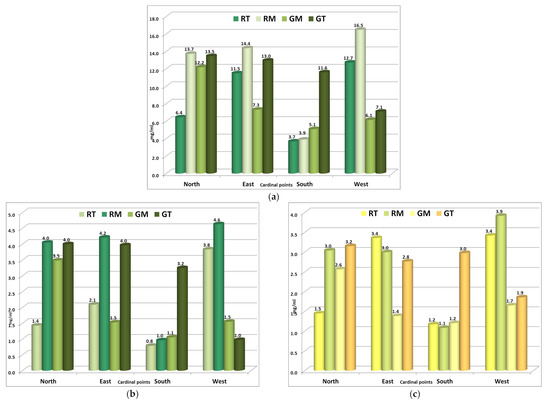
Figure 13.
July: (a) Chlorophyll a, (b) Chlorophyll b, (c) Carotenoids (RT—Red Treated ‘Blackie’, RM—Red Control ‘Blackie’, GT—Green Treated ‘Margarita’, GM—Green Control ‘Margarita’).
In ‘Margarita’, the Cropmax-treated plants stood out, accumulating the highest amount of chlorophyll a in the N (13.5 mg/mL) and E (13.0 mg/mL) zones, compared to the untreated control variants. The same behaviour was observed in the S and W zones, but the chlorophyll content was lower.
The same results were observed for chlorophyll b content, reaching the highest level in the leaves of ‘Blackie’ in the control plants in all analysed zones, with the highest levels in the leaves of the ‘Margarita’ treated with Cropmax, except for the W zone of the experimental structure. In this zone, a very low chlorophyll b content was found in both control and treated variants (Figure 13b).
The content of carotenoid pigments, which play a protective role for photosynthetic pigments against UV radiation, was higher in the leaves of ‘Blackie’ only in the eastern part of the experimental structure (3.4 mg/mL), with the untreated controls standing out in the other areas (Figure 13c).
In the leaves of ‘Margarita’, the content of carotenoid pigments was higher in the Cropmax-treated plants in the eastern and southern zones, even double compared to the control variants. In the western zone, a much lower content of carotenoid pigments was observed in the ‘Margarita’ plants compared to ‘Blackie’.
3.3.2. Experiment Result in August
In August, changes in the content of chlorophyll a were observed in the northern zone of the experimental structure, with ‘Blackie’ standing out with 11.1 mg/mL and the lowest value being observed in the leaves of the Cropmax-treated ‘Margarita’. The same pattern was found in the southern zone of the experimental structure (Figure 14a).
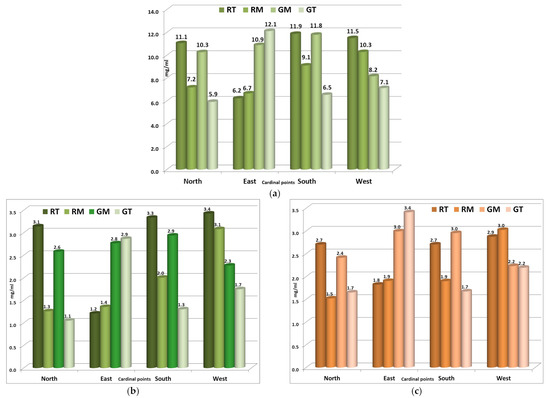
Figure 14.
August: (a) Chlorophyll a, (b) Chlorophyll b, (c) Carotenoids.
The plants in the eastern zone had the lowest content of chlorophyll a in ‘Blackie’ and the highest in ‘Margarita’, reaching 12.1 mg/mL in those treated with Cropmax. A decreasing trend in chlorophyll a content was observed in the western zone, where control variants had higher values than the treated ones, indicating lower photosynthetic intensity in these plants.
The same pattern was observed in the content of chlorophyll b, with higher values found in the north zone in the leaves of the Cropmax-treated ‘Blackie’ and lower values in the leaves of the treated ‘Margarita’ (Figure 14b).
In the eastern zone of the experimental structure, the content of chlorophyll b was the lowest in the leaves of ‘Blackie’ and higher in the leaves of the ‘Margarita’ variety, especially in the Cropmax-treated variants (2.9 mg/mL).
In the southern and western zones of the experimental structure, the Cropmax-treated ‘Blackie’ plants were noted for having a higher content of chlorophyll b (3.3 mg/mL and 3.4 mg/mL), while the lowest values were observed in the treated ‘Margarita’.
The content of carotenoid pigments in August was higher in the leaves of the Cropmax-treated ‘Blackie’ in the N and S zones (2.7 mg/mL) and lower in the leaves of the ‘Margarita’ (Figure 14c). In the eastern zone of the experimental structure, the green-leaf variants were found to have a higher content of carotenoid pigments, especially in the treated plants, showing better protection of photosynthetic pigments against the action of UV radiation. In the western zone, plants had almost equal values for both the controls and the Cropmax-treated variants, with a higher content of carotenoid pigments in ‘Blackie’.
3.3.3. Experiment Result in September
In September, the content of chlorophyll a was higher in the Cropmax-treated ‘Blackie’ compared to the controls in the N (10.6 mg/mL), E (11.7 mg/mL), and W (17.1 mg/mL) zones, showing a high photosynthetic intensity, while the lowest values were observed in the S zone (Figure 15a).
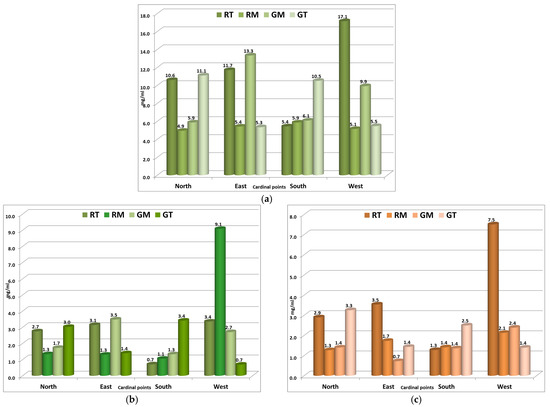
Figure 15.
September: (a) Chlorophyll a, (b) Chlorophyll b, (c) Carotenoids.
The leaves of ‘Margarita’ had a higher content of chlorophyll in the Cropmax-treated plants in the N and S zones and the lowest level in the E and W zones, indicating a low photosynthetic intensity. The content of chlorophyll b in September fell significantly in all analysed variants, reaching the lowest values, especially in the untreated controls, with the exception of the control variants of the ‘Blackie’ plants in the W zone (Figure 15b).
The same behaviour was found in the content of carotenoid pigments, with the lowest values in the leaves of plants in the N, E, and S zones in all analysed variants, except for the treated ‘Blackie’ in the W zone (7.5 mg/mL) (Figure 15c).
The great decline in the content of chlorophyll b and carotenoids in September could have been due to prolonged pedological and air drought conditions in 2022.
3.4. Dehydration Rate in Sweet Potato
Quantities of water in plant bodies generally reach 70–80%, but they can reach up to 95–98% depending on the organ, age, and living conditions. The dehydration rate of the leaf depends on the morpho-anatomical and physiological characteristics of the leaf blade and can be an indication of the transpiration intensity [39].
After 24 h, the free water content lost by the leaves was very high in the Cropmax-treated ‘Margarita’ (73%), indicating high sensitivity to the treatment compared to the control (46.2%) (Figure 16a).
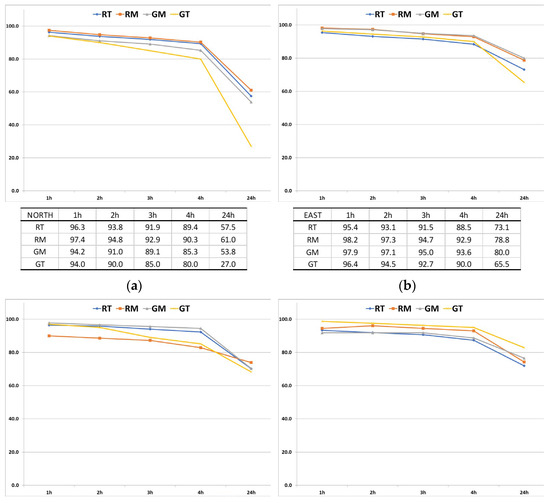

Figure 16.
Dehydration rate in July (a) in the north zone, (b) in the east zone, (c) in the south zone, and (d) in the west zone of the experimental structure.
In July, in the northern zone of the experimental structure, the most intense dehydration rate in the first hour of analysis was found in the Cropmax-treated ‘Margarita’ with a 6% water loss and only 3.7% in ‘Blackie’. The same dehydration rate was maintained over the following 3 h.
On the east side of the experimental structure, the Cropmax-treated plants had a dehydration rate similar to the controls, even slightly more intense, with the treatment not significantly affecting the intensity of transpiration. The free water lost by the leaves of both analysed variants was higher in the treated ‘Margarita’ (34.5%), the control in this case having proved to be more resistant (Figure 16b).
In July, the Cropmax-treated ‘Blackie’ stood out in the south zone of the experimental structure, having a lower dehydration rate compared to the control, both in the first hour and at 2, 3, and 4 h of analysis, indicating a slow water loss and better resistance to unfavourable environmental factors, especially drought. For the leaves of the ‘Margarita’, similar values were found for the treated plants and the control in the first 2 h, while after 3 and 4 h, the water loss in the treated variants was higher (10.9% and 14.9%) (Figure 16c).
The content of free water, expressed by the amount of water lost in 24 h, was highest in the treated variants compared to the control, with 31.7% water loss in the leaves of ‘Margarita’ and 29.8% in ‘Blackie’.
In the west zone of the experimental structure, the dehydration rate was more intense in the first hours, especially in the Cropmax-treated ‘Blackie’, with 6.7% water loss in the first hour, demonstrating more intense transpiration. The lowest dehydration rate was found in the leaves of the Cropmax-treated ‘Margarita’ with only 1.2% water loss in the first hour, a rate that remained consistent throughout the measurements, demonstrating better resistance to unfavourable factors (Figure 16d).
The content of free water loss in 24 h was lower on this side of the experimental structure for all analysed plants, with the best dehydration resistance observed in Cropmax-treated ‘Margarita’.
In August, the plants in the northern part of the experimental structure had a low dehydration rate, with very small differences between controls and treatments, indicating better resistance to unfavourable environmental factors (Figure 17a).
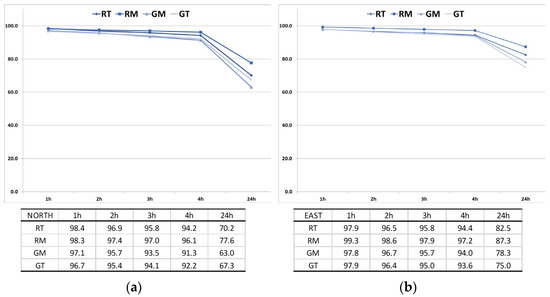
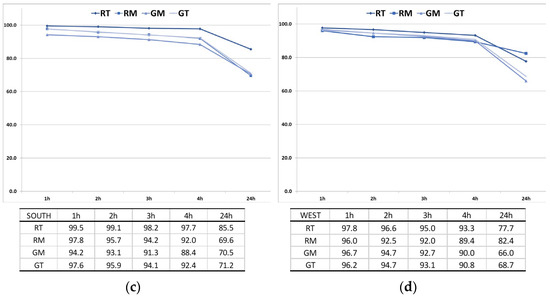
Figure 17.
Dehydration rate in August (a) in the north zone, (b) in the east zone, (c) in the south zone, and (d) in the west zone of the experimental structure.
After 24 h, the content of free water lost by plants was larger for ‘Margarita’ (37% and 32.7%) and lower in the leaves of ‘Blackie’ (29.8% and 22.4%).
The plants in the east zone of the experimental structure had a very low dehydration rate in August, both in the first hour and at 2, 3, and 4 h, with 0.7% to 2.2% water lost in the first hour (Figure 17b).
The free water lost after 24 h was quantitatively lower, especially for the ‘Blackie’ (17.5% and 12.7%) compared to ‘Margarita’ (25% and 21.7%), with treatments not having influenced the physiological process of leaf transpiration.
On the south side of the experimental structure, the same behaviour was noted, with a much-reduced dehydration rate in the first hours, with only 0.5% water lost in the first hour in the Cropmax-treated ‘Blackie’ and 2.4% in the treated ‘Margarita’ (Figure 17c).
Cropmax-treated ‘Blackie’ showed the best dehydration resistance, having lost the lowest quantity of free water in 24 h (15%) compared to the control (30.4%), while in ‘Margarita’, there were no significant differences between the control and the treated plants.
In August, the plants on the west side of the experimental structure lost 2.2% of water in the first hour of analysis in the Cropmax-treated ‘Blackie’ and 3.8% in the Cropmax-treated ‘Margarita’, the values close to those of the control, a trend that continued in the following hours (Figure 17d).
After 24 h, it was observed that the leaves of ‘Blackie’ lost less water compared to the leaves of ‘Margarita’, showing a higher dehydration rate.
In September, on the north side of the experimental structure, the lowest dehydration rate in the first hour of analysis was found in the leaves of Cropmax-treated ‘Blackie’ with 1.61% water loss and 2.16% in those of the treated ‘Margarita’. The red-leaf variant maintained a lower dehydration rate even after 2, 3, and 4 h of analysis compared to the green-leaf variant, indicating better resistance (Figure 18a).
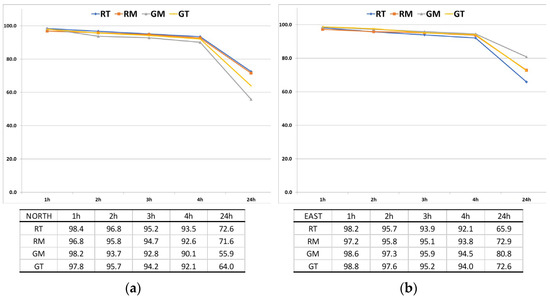
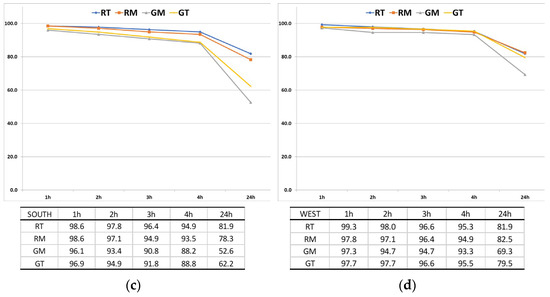
Figure 18.
Dehydration rate in September (a) in the north zone, (b) in the east zone, (c) in the south zone, and (d) in the west zone of the experimental structure.
The lowest amount of free water loss was found in the red-leaf variant (27.42% and 28.48%) compared to the green-leaf variant (44.14% and 35.97%).
Plants on the east side of the experimental structure showed the same behaviour, with a low dehydration rate, especially in the first hour when leaf transpiration was lower. In this case, ‘Margarita’ stood out with 1.19% water loss in the treated variant and 1.37% in the control variant (Figure 18b).
The amount of free water loss was lower again for the green-leaf variant, with control showing 19.18%, followed by the treated variant with 27.38%.
A specificity was observed in the Cropmax-treated ‘Blackie’, which had a low dehydration rate, with only 1.83% water loss in the first hour. This rate was maintained at 2, 3, and 4 h but experienced the highest amount of free water loss after 24 h, at 34.15%.
In the southern part of the experimental structure in September, the ‘Blackie’ plants had a lower dehydration rate compared to the green variants, with equal values (1.45%) for both the control and treated plants after the first hour (Figure 18c). The leaves of ‘Margarita’ had a more intense dehydration rate and after 24 h, showed the highest amount of free water loss, especially in the control (47.37%). The lowest amount of free water loss was in Cropmax-treated ‘Blackie’ at 18.12%. This variant also showed a low dehydration rate, indicating the high resistance of the plants.
The same Cropmax-treated red-leaf variant stood out in the western part of the experimental structure. A dehydration rate of only 0.67% water loss was found in the first hour in the ‘Blackie’ treated leaves, the lowest value over the analysed period (Figure 18d), underlining a low transpiration process.
The leaves of ‘Blackie’ also lost less free water after 24 h, indicating a higher resistance compared to the leaves of ‘Margarita’.
4. Conclusions
Due to its aesthetic properties, high resistance to environmental conditions, and uniform growth, the popularity of ornamental sweet potato is increasing worldwide.
In this study, the adaptability and evolution of ‘Margarita’ and ‘Blackie’ was monitored (both treated and control) on a vertical experimental structure with four façades oriented towards the four cardinal points within the particular climatic conditions of northeastern Romania. The obtained results show that both varieties reached their peak in August, except for ‘Blackie’, which proved to be more resilient and maintained an overall good appearance even in September. Furthermore, the plant diameter, height and leaf number were positively influenced across both the Cropmax fertilisation, as well as the cardinal orientation. It is important to highlight that ‘Blackie’ had the highest value parameters on the northern façade compared to the control. This was also observed in the Cropmax-treated ‘Blackie’ for the chlorophyll a, chlorophyll b and carotenoid pigments that had the highest percentage values with a maximum content of chlorophyll b and carotenoids in September due to the extended pedological and air drought conditions of 2022. These results further confirm the significant role of the plant variety and the cardinal orientation. Data collected on the leaf dehydration rate and the amount of free water loss indicated the lowest percentage in the ‘Blackie’ of the northern façade, highlighting an improved resistance to withstand challenging environmental conditions, particularly drought. However, ‘Margarita’ and western orientation showed the highest dehydration rate, suggesting a potential stress on the plant. Overall, the implementation of a vertical system with ‘Blackie’ seems to be an efficient and sustainable approach which distinguishes by its improved resistance to challenging environmental conditions, particularly drought, and good coverage of the vertical wall.
Author Contributions
Conceptualisation, M.C. and C.C.; methodology, M.C., A.E.M., I.G.C. and E.-L.C.; software, C.C.; validation, M.C., A.E.M., C.D.J., S.C. and I.G.C.; formal analysis, M.C., C.C. and A.E.M.; investigation, C.D.J., E.-L.C., S.C., I.G.C., P.A. and A.-M.-R.I.; resources, M.C.; data curation, P.A. and A.-M.-R.I.; writing—original draft preparation, M.C., C.C. and A.E.M.; writing—review and editing, M.C., C.C., A.E.M. and I.G.C.; visualisation, M.C., A.E.M., C.D.J., E.-L.C., S.C., I.G.C., P.A., A.-M.-R.I. and C.C.; supervision, M.C., A.E.M., I.G.C. and C.C.; project administration, M.C.; funding acquisition, M.C. All authors have read and agreed to the published version of the manuscript.
Funding
This research received no external funding.
Data Availability Statement
Data are contained within the article.
Acknowledgments
We thank the National Meteorological Administration—Moldova Regional Meteorological Centre for the climate data provided.
Conflicts of Interest
The authors declare no conflicts of interest.
Abbreviations
| OM | Organic Matter |
| N | Cardinal Point North |
| E | Cardinal Point East |
| S | Cardinal Point South |
| W | Cardinal Point West |
| NT | North Treated |
| NM | North Control |
| ET | East Treated |
| EM | East Control |
| ST | South Treated |
| SM | South Control |
| WT | West Treated |
| WM | West Control |
| RT | Red Treated ‘Blackie’ |
| RM | Red Control ‘Blackie’ |
| GT | Green Treated ‘Margarita’ |
| GM | Green Control ‘Margarita’ |
| Cla | Chlorophyll a |
| Clb | Chlorophyll b |
| Carot | Carotenoids |
| LU663, LU645, LU470 | Wavelengths |
References
- Htet, A.; Liana, S.R.; Aung, T.; Bhaumik, A. Green Facades and Renewable Energy: Synergies for a Sustainable Future. Int. J. Innov. Sci. Res. Technol. 2023, 8, 219–223. [Google Scholar] [CrossRef]
- Leca, Ș.; Popa, I.; Chivulescu, Ş.; Pitar, D.; Dobre, A.-C.; Pascu, I.-S.; Apostol, B.; Badea, O. Structure and Diversity in a Periurban Forest of Bucharest. Ann. For. Res. 2023, 66, 139–153. [Google Scholar] [CrossRef]
- Cojocariu, M.; Chelariu, E.L.; Chiruta, C. Study on Behavior of Some Perennial Flowering Species Used in Vertical Systems for Green Facades in Eastern European Climate. Appl. Sci. 2022, 12, 474. [Google Scholar] [CrossRef]
- Chiruta, C.; Stoleriu, I.; Cojocariu, M. Prediction Models for the Plant Coverage Percentage of a Vertical Green Wall System: Regression Models and Artificial Neural Network Models. Horticulturae 2023, 9, 419. [Google Scholar] [CrossRef]
- Wolch, J.R.; Byrne, J.; Newell, J.P. Urban Green Space, Public Health, and Environmental Justice: The Challenge of Making Cities “Just Green Enough”. Landsc. Urban Plan. 2014, 125, 234–244. [Google Scholar] [CrossRef]
- Ghazalli, A.J.; Brack, C.; Bai, X.; Said, I. Physical and Non-Physical Benefits of Vertical Greenery Systems: A Review. J. Urban Technol. 2019, 26, 53–78. [Google Scholar] [CrossRef]
- Li, G.; Lin, Z.; Zhang, H.; Liu, Z.; Xu, Y.; Xu, G.; Li, H.; Ji, R.; Luo, W.; Qiu, Y.; et al. Anthocyanin Accumulation in the Leaves of the Purple Sweet Potato (Ipomoea batatas L.) Cultivars. Molecules 2019, 24, 3743. [Google Scholar] [CrossRef] [PubMed]
- Sakamoto, M.; Suzuki, T. Effect of Nutrient Solution Concentration on the Growth of Hydroponic Sweetpotato. Agronomy 2020, 10, 1708. [Google Scholar] [CrossRef]
- Li, H.; Wang, B.; Shi, S.; Zhou, J.; Shi, Y.; Liu, X.; Liu, H.; He, T. Response of Crop Performance and Yield of Spring Sweet Potato (Ipomoea batatas [L.] Lam) as Affected by Mechanized Transplanting Properties. Agronomy 2023, 13, 1611. [Google Scholar] [CrossRef]
- Sun, H.; Mu, T.; Xi, L.; Zhang, M.; Chen, J. Sweet Potato (Ipomoea batatas L.) Leaves as Nutritional and Functional Foods. Food Chem. 2014, 156, 380–389. [Google Scholar] [CrossRef]
- Alam, M.K. A Comprehensive Review of Sweet Potato (Ipomoea batatas [L.] Lam): Revisiting the Associated Health Benefits. Trends Food Sci. Technol. 2021, 115, 512–529. [Google Scholar] [CrossRef]
- Laveriano-Santos, E.P.; Lopez-Yerena, A.; Jaime-Rodriguez, C.; Gonzalez-Coria, J.; Lamuela-Raventos, R.M.; Vallverdu-Queralt, A.; Romanya, J.; Perez, M. Sweet Potato Is Not Simply an Abundant Food Crop: A Comprehensive Review of Its Phytochemical Constituents, Biological Activities, and the Effects of Processing. Antioxidants 2022, 11, 1648. [Google Scholar] [CrossRef]
- Ishida, H.; Suzuno, H.; Sugiyama, N.; Innami, S.; Tadokoro, T.; Maekawa, A. Nutritive Evaluation on Chemical Components of Leaves, Stalks and Stems of Sweet Potatoes (Ipomoea batatas Poir). Food Chem. 2000, 68, 359–367. [Google Scholar] [CrossRef]
- Muşat, C. Research Regarding the Possibility of Using the Sweet Potato (Ipomoea batatas Poir.) as an Ornamental Plant (in romanian). Hortic. Vitic. Și Vinif. Silvic. Și Grădini Publice Protecția Plantelor 2010, 24, 238–243. [Google Scholar]
- Grebla-AL-Zaben, B.; Babalau-Fuss, V.; Biris-Dorhoi, S.E.; Talos, I.; Tofana, M. A Review of the Composition and Health Benefits of Sweet Potato. Bull. Univ. Agric. Sci. Vet. Med. Cluj-Napoca Food Sci. Technol. 2021, 78, 1–10. [Google Scholar] [CrossRef] [PubMed]
- Ludvik, B.; Waldhäusl, W.; Prager, R.; Kautzky-Willer, A.; Pacini, G. Mode of Action of Ipomoea batatas (Caiapo) in Type 2 Diabetic Patients. Metabolism 2003, 52, 875–880. [Google Scholar] [CrossRef] [PubMed]
- Ali, M.A.; Abido, A.I.; El-Torky, M.G.; Hassan, B.A.; Abdelwahab, M.M. Initiation of Ipomoea batatas through Tissue Culture Technique. Egypt. Acad. J. Biol. Sci. H. Bot. 2021, 12, 79–83. [Google Scholar] [CrossRef]
- Smith, T. Production Guidelines for Four Crops—Osteospermum, Angelonia, Calibrachoa & Ornamental Sweet Potato (Ipomoea batatas). Available online: https://ag.umass.edu/greenhouse-floriculture/fact-sheets/production-guidelines-for-four-crops-osteospermum-angelonia (accessed on 24 November 2023).
- de SOUSA, R.M.d.D.; Peixoto, J.R.; Amaro, G.B.; Vilela, M.S.; Costa, A.P.; Nóbrega, D.d.S. Ornamental Potential of Sweet Potato Accessions. Biosci. J. 2018, 34, 11–16. [Google Scholar] [CrossRef]
- Othman, N. Some Physiological Studies on Ornamental Ipomoea batatas as a Groundcover Species. Ph.D. Thesis, Universiti Pertanian Malaysia, Kuala Lumpur, Malaysia, 1991. [Google Scholar]
- Miller, C.T.; Craver, J.K.; Cruz, M.G.; Williams, K.A. Screening of Ornamental Sweet Potato (Ipomoea batatas) Cultivars for Intumescence Development. Hortscience 2015, 50, 253. [Google Scholar]
- Lyons, R.E. Herbaceous Perennials: An Intoxicating Prescription for Outstanding Landscape Color. Acta Hortic. 2008, 766, 189–192. [Google Scholar] [CrossRef]
- Appell, S. Annuals for Every Garden, 1st ed.; Brooklyn Botanic Garden: Brooklyn, NY, USA, 2003; ISBN 978-1-889538-57-0. [Google Scholar]
- Gantait, S.S. Advances in Floriculture and Urban Horticulture. In Proceedings of the National Symposium on Recent Advances in Floriculture and Urban Horticulture in Global Perspective, Kalyani, West Bengal, 4–5 January 2018; Studera Press: New Delhi, India, 2018. ISBN 978-93-85883-65-1. [Google Scholar]
- Armitage, A.M.; Garner, J.M. Ipomoea batatas ‘Margarita’. Hortscience 2001, 36, 178. [Google Scholar] [CrossRef]
- Armitage, A.M. New Ornamental Crop Introduction: A Model of Cooperation Between Industry and Academia. Acta Hortic. 2003, 624, 25–27. [Google Scholar] [CrossRef]
- Todiraş, N. The Collection of Ipomoea batatas L. in “Alexandru Ciubotaru” National Botanical Garden (Institute). Rev. Bot. 2020, 189. [Google Scholar] [CrossRef]
- Wang, C.; Lu, G.; Zhao, X.; Guo, D. Comprehensive Ornamental Evaluation of Ipomoea batatas. Jiangsu J. Agric. Sci. 2015, 43, 176–178. [Google Scholar]
- Lee, J.K.; Kim, D.Y.; Park, S.H.; Woo, S.Y.; Nie, H.; Kim, S.H. Particulate Matter (PM) Adsorption and Leaf Characteristics of Ornamental Sweet Potato (Ipomoea batatas L.) Cultivars and Two Common Indoor Plants (Hedera Helix L. and Epipremnum Aureum Lindl. & Andre). Horticulturae 2022, 8, 26. [Google Scholar] [CrossRef]
- Toishimanov, M.; Abilda, Z.; Daurov, D.; Daurova, A.; Zhapar, K.; Sapakhova, Z.; Kanat, R.; Stamgaliyeva, Z.; Zhambakin, K.; Shamekova, M. Phytoremediation Properties of Sweet Potato for Soils Contaminated by Heavy Metals in South Kazakhstan. Appl. Sci. 2023, 13, 9589. [Google Scholar] [CrossRef]
- Marta, A.E.; Slabu, C.; Mihaela Covasa, M.; Motrescu, I.; Jitareanu, C.D. Comparative Analysis of the Influence of Different Biostimulators on the Germination and Sprouting Behaviour of Four Wheat Varieties. JALSE 2023, 55, 377–390. [Google Scholar] [CrossRef]
- Lichtenthaler, H.K. Chlorophylls and Carotenoids: Pigments of Photosynthetic Biomembranes. In Methods in Enzymology; Plant Cell Membranes; Academic Press: Cambridge, MA, USA, 1987; Volume 148, pp. 350–382. [Google Scholar]
- Lichtenthaler, H.; Buschmann, C. Chlorophylls and Carotenoids: Measurements and Characterization by UV-Vis Spectroscopy. Food Anal. Chem. Pigment. Color. Flavors Texture Bioact. Food Compon. 2005, 1, 171–178. [Google Scholar] [CrossRef]
- Topa, D.; Cara, I.G.; Jitareanu, G. Long Term Impact of Different Tillage Systems on Carbon Pools and Stocks, Soil Bulk Density, Aggregation and Nutrients: A Field Meta-Analysis. Catena 2021, 199, 105102. [Google Scholar] [CrossRef]
- Lehmann, E.L.; D’Abrera, H.J.M. Nonparametrics: Statistical Methods Based on Ranks; Prentice Hall: Hoboken, NJ, USA, 1998; ISBN 978-0-13-997735-0. [Google Scholar]
- Draper, D. Rank-Based Robust Analysis of Linear Models. I. Exposition and Review. Stat. Sci. 1988, 3, 266–271. [Google Scholar] [CrossRef]
- Rawlings, J.O.; Pantula, S.G.; Dickey, D.A. (Eds.) Class Variables in Regression. In Applied Regression Analysis: A Research Tool; Springer Texts in Statistics; Springer: New York, NY, USA, 1998; pp. 269–323. ISBN 978-0-387-22753-5. [Google Scholar]
- Toma, L.D.; Jitareanu, C.D. Fiziologie vegetala; Ion Ionescu de la Brad: Iasi, Romania, 2007; ISBN 978-973-147-001-6. [Google Scholar]
- Jitareanu, C.D.; Marta, A.E. Fiziologie Vegetala. Manual de Studiu Pentru Studenti; Ion Ionescu de la Brad: Iasi, Romania, 2018; ISBN 978-973-147-302-4. [Google Scholar]
- Burzo, I.; Toma, S.; Craciun, C.; Voican, V.; Dobrescu, A.; Delian, E. Fiziologia Plantelor de Cultura; Editura Stiința: Chisinau, Moldova, 1999; Volume 1, ISBN 9975-67-141-1. [Google Scholar]
- Milică, C.; Dorobanu, N.; Baia, V.; Nedelcu, P.; Suciu, T.; Tesu, V.; Molea, I.; Fiziologie vegetală. Editura Didactica si Padagogica, Bucuresti. 1982. Available online: https://bibliotecamm.ebibliophil.ro/mon/fiziologie-vegetala-ae2kb7da (accessed on 27 November 2023).
- Jitareanu, C.D.; Marta, A.E. Lucrari Practice de Fiziologia Plantelor; Ion Ionescu de la Brad: Iasi, Romania, 2020; ISBN 978-973-147-356-7. [Google Scholar]
Disclaimer/Publisher’s Note: The statements, opinions and data contained in all publications are solely those of the individual author(s) and contributor(s) and not of MDPI and/or the editor(s). MDPI and/or the editor(s) disclaim responsibility for any injury to people or property resulting from any ideas, methods, instructions or products referred to in the content. |
© 2024 by the authors. Licensee MDPI, Basel, Switzerland. This article is an open access article distributed under the terms and conditions of the Creative Commons Attribution (CC BY) license (https://creativecommons.org/licenses/by/4.0/).