Article

Growth and Leaf Color of Coleus under Light Conditions Modified by Translucent Agrivoltaic Panels and Light-Emitting Diodes in a Greenhouse

1
Department of Horticulture and Life Science, Yeungnam University, Gyeongsan 38541, Republic of Korea
2
Department of Horticultural Science, Jeju National University, Jeju 63243, Republic of Korea
*
Author to whom correspondence should be addressed.
Horticulturae 2024, 10(2), 115; https://doi.org/10.3390/horticulturae10020115
Submission received: 16 December 2023 / Revised: 22 January 2024 / Accepted: 22 January 2024 / Published: 24 January 2024
(This article belongs to the Section Protected Culture)

Abstract

:
Dye-sensitized solar cells (DSSCs) can be used as greenhouse glazing materials in agrivoltaic systems because they are translucent, have different colors, and can produce electricity. However, the light quality of DSSCs differs from that of sunlight, and the visible light transmittance is low. Therefore, we compared the plant shape, growth, and leaf color of coleus, a highly photosensitive plant, under transparent glass and red-colored DSSCs. Coleus ‘Highway Rose’ was grown in transparent (T, the control), shaded (S), and DSSC (D) chambers maintained at 23 ± 2 °C. The DSSC chambers were additionally illuminated with blue (B), green (G), white (W), B+G, and R+B+W light-emitting diodes (LEDs) (D+L) at 60 μmol·m−2·s−1 photosynthetic photon flux density for 15 h from 05:00 to 20:00. The coleus generally exhibited good growth under the T treatment. However, the light quality of DSSCs differed from that of sunlight, and the visible light transmittance decreased. Coleus exhibited increased growth and leaf color characteristics under the supplemental B lighting treatments (D+L(RBW), D+L(B), D+L(BG), and D+L(W)). Supplemental lighting with B LEDs using DSSCs improved plant morphology growth and leaf color. On the other hand, supplemental G lighting reinforced the shade avoidance syndrome. Moreover, DSSCs could aid in reducing the energy required to control the environment.

1. Introduction

Installing agrivoltaic systems, which are photovoltaic systems used in farmlands and greenhouses, can help improve farmers’ income by generating electricity and increasing crop production [1]. Dye-sensitized solar cells (DSSCs) have gained prominence as substitutes for crystalline silicon solar cells for harnessing sunlight, a renewable energy source, to generate electricity [2,3,4]. Crystalline silicon solar cells constructed from semiconductors are constrained by expensive materials and processes. In contrast, DSSCs employ inexpensive nanosized dye molecules with high transparency and the ability to express various colors. Furthermore, they can be applied to curved surfaces and have the potential to supplement windows in buildings [5]. When DSSCs are installed in horticultural greenhouses, the amount of sunlight required for plant growth remains at a specific level [1,6]. The electricity generated can be utilized to operate a greenhouse. However, the quality of the sunlight transmitted varies depending on the color of the dye [1,7]. Therefore, it is crucial to precisely determine the light conditions in greenhouses owing to DSSCs and apply them to plant cultivation.
In South Korea, 80,611 ha of land was used for protected cultivation (greenhouses) in 2020, an increase from 54,051 ha in 2016, as reported by KOSTAT [8]. Heated facilities accounted for approximately 30% of the total area. Among these facilities, 78% utilize oil (diesel or kerosene) as fuel, whereas 14% utilize renewable energy and electricity [9,10]. Owing to the reliance of South Korean horticultural facilities on imported oil for heating greenhouses, energy costs contribute to over 30% of the total production expenses in heated cultivation. Consequently, the South Korean government must decrease carbon emissions from the agriculture and fisheries sectors by 31.2–37.7% of the 2018 amount of 24.7 million tonnes to achieve a carbon-neutral scenario by 2050 [9,10]. Alternative solutions are necessary to minimize carbon emissions in the horticultural facility sector, and increasing the incorporation of renewable energy is a potential avenue. The use of DSSCs as cladding materials for glass greenhouses can significantly reduce production expenses by harnessing sunlight to generate electricity. Moreover, the residual sunlight can be used to produce plants.
As an energy and signal, light is essential for plant survival, as well as for growth, development, and response to the external environment [11]. Blue (B, 400–500 nm), green (G, 500–600 nm), and red (R, 600–700 nm) light are photosynthetically active radiation (PAR), and ultraviolet (UV, 300–400 nm) and far red (FR, 700–800 nm) light are physiologically active radiation. Plants change their morphology (architecture) or development in response to light quality (color, wavelength), which is called photomorphogenesis [12]. Photomorphogenesis is strongly influenced by light ratio rather than light intensity. Stem elongation, stomatal opening, germination, flowering, leaf expansion, phototropism, and pigment biosynthesis are well-known photomorphogenic responses. FR-rich environments with low R:FR ratios induce shade avoidance response (SAR) responses such as stem elongation, leaf expansion, leaf hyponasty, petiole elongation, and increased apical dominance [13]. B light inhibits stem elongation and leaf expansion [14]. It also promotes the formation of pigments such as anthocyanins [15]. G light induces a SAR similar to that induced by FR light [13].
Plant responses to mixed and monochromatic light differ. In other words, blocking certain wavelengths in mixed sunlight can elicit a different response than creating a similar wavelength ratio in monochromatic light, such as B, G, R, and FR light [16,17,18]. Therefore, the effects of the R:B ratio, produced by using certain wavelengths of sunlight to generate power in a DSSC, on plant responses may differ when identical R:FR, R:FR, and R:B ratios are produced by exposure to light-emitting diodes (LEDs). Hence, conducting practical trials with suitable indicator plants is crucial for validating the effectiveness of DSSCs selected for greenhouse utilization.
Coleus (Solenostemon scutellarioides) is a variegated plant with a unique leaf color consisting of two or more color combinations, such as red, pink, and purple colors for anthocyanin and green color for chlorophyll [19,20,21]. The area ratio of each leaf color is sensitive to changes in the light environment [20,21,22,23]. When exposed to high light intensity, many coleus species change their coloration by increasing the anthocyanin content and decreasing the chlorophyll content [20,22]. Anthocyanins in coleus leaves are responsible for protecting them from strong light, especially UV light [24].
Because of the above-mentioned responses of coleus to light, it can be used as an indicator plant in greenhouses to evaluate the morphology, growth, and pigment expression of plants in response to changes in light quality and quantity caused by DSSCs. To overcome the lack of light quantity and specific wavelengths due to the light absorption of DSSCs, it is essential to investigate the effect of complementary light of single or mixed wavelengths, assuming that the power generated by DSSCs is supplied to LEDs, which is especially important when plant morphology or growth are affected by changes in the light environment caused by DSSCs. The Z907 DSSC used in this experiment absorbs in the B and G wavelength regions, so it is necessary to investigate the compensation of these wavelengths using LEDs.
Therefore, the following hypotheses were made in this study: (1) reduced light quantity using DSSCs induces SAR in coleus, a photosensitive ornamental plant, negatively affecting morphology, growth, and leaf color; (2) DSSC-induced reduction in B and G causes different responses than the same PAR reduction produced by neutral shading; (3) supplemental LED light with appropriate wavelengths can compensate for the negative effects of DSSCs; and (4) supplemental LED light with different B and G light ratios causes different responses in plants. Ultimately, this study aimed to evaluate the effects of DSSC-induced changes in the light environment and LED supplementation of different wavelengths on coleus growth, morphology, and leaf color to provide a rationale for the use of DSSCs in greenhouses.

2. Materials and Methods

2.1. Plant Materials and Environmental Conditions

Coleus (Solenostemon scutellarioides (L.) Codd.) was selected as the plant material because the variegation and color of its leaves are very sensitive to light conditions [20,22]. Plug seedlings of ‘Highway Rose’ coleus were received from a specialized floriculture nursery (ACC KA Seed and Seedling Co., Ltd., Chungju, Republic of Korea) 7 weeks after sowing on 9 February 2022, and transplanted into 9.5 cm plastic pots filled with a commercial potting medium (Sunshine Mix 4, Sun Gro Horticulture, Agawam, MA, USA).
After 1 week of greenhouse cultivation, uniform plants were selected and moved to a light chamber inside the glasshouse for light treatment. The chamber was fitted with an air conditioning unit (AR07K5190HV, Samsung, Seoul, Republic of Korea) to maintain the temperature at 23 ± 5 °C and the relative humidity at 60 ± 10%. The plants situated in the chamber were irrigated thrice per week, and 1 g/pot of slow-releasing fertilizer (Osmocote Plus 15-11-13 +2MgO+TE, ICL Specialty Fertilizers, Geldermalsen, The Netherlands) was applied after 3 and 7 weeks.

2.2. Light Treatment Using DSSCs and LEDs in a Greenhouse

Several literature reviews and expert advice led to the selection of D35, CYC-B11, and Z907 DSSCs as DSSC candidates for this study because of their potential use in greenhouse coverings and solar panels [25,26,27]. Among them, the Z907 DSSC absorbs less blue light and has a higher photovoltaic efficiency than the D35 and CYC-B11 DSSCs (Figure 1). The D-35 dye was absorbed primarily in the blue light region (400–450 nm) upon TiO2 deposition and was, therefore, excluded due to concerns that the plant may be deficient in blue light (Figure 1B). The CYC-B11 dye was excluded for the same reason as D-35 because it absorbed mainly blue light with an absorption peak at 400 nm (Figure 1C). On the other hand, the Z907 dye showed similar absorption at 400–500 nm by TiO2 adsorption (Figure 1D) and was selected for this study because it is a dye with proven efficiency and durability in the field (according to Jung-Kwan Lee, a chemical engineer at the DSSC manufacturer, Sangbo, Gimpo, Republic of Korea).
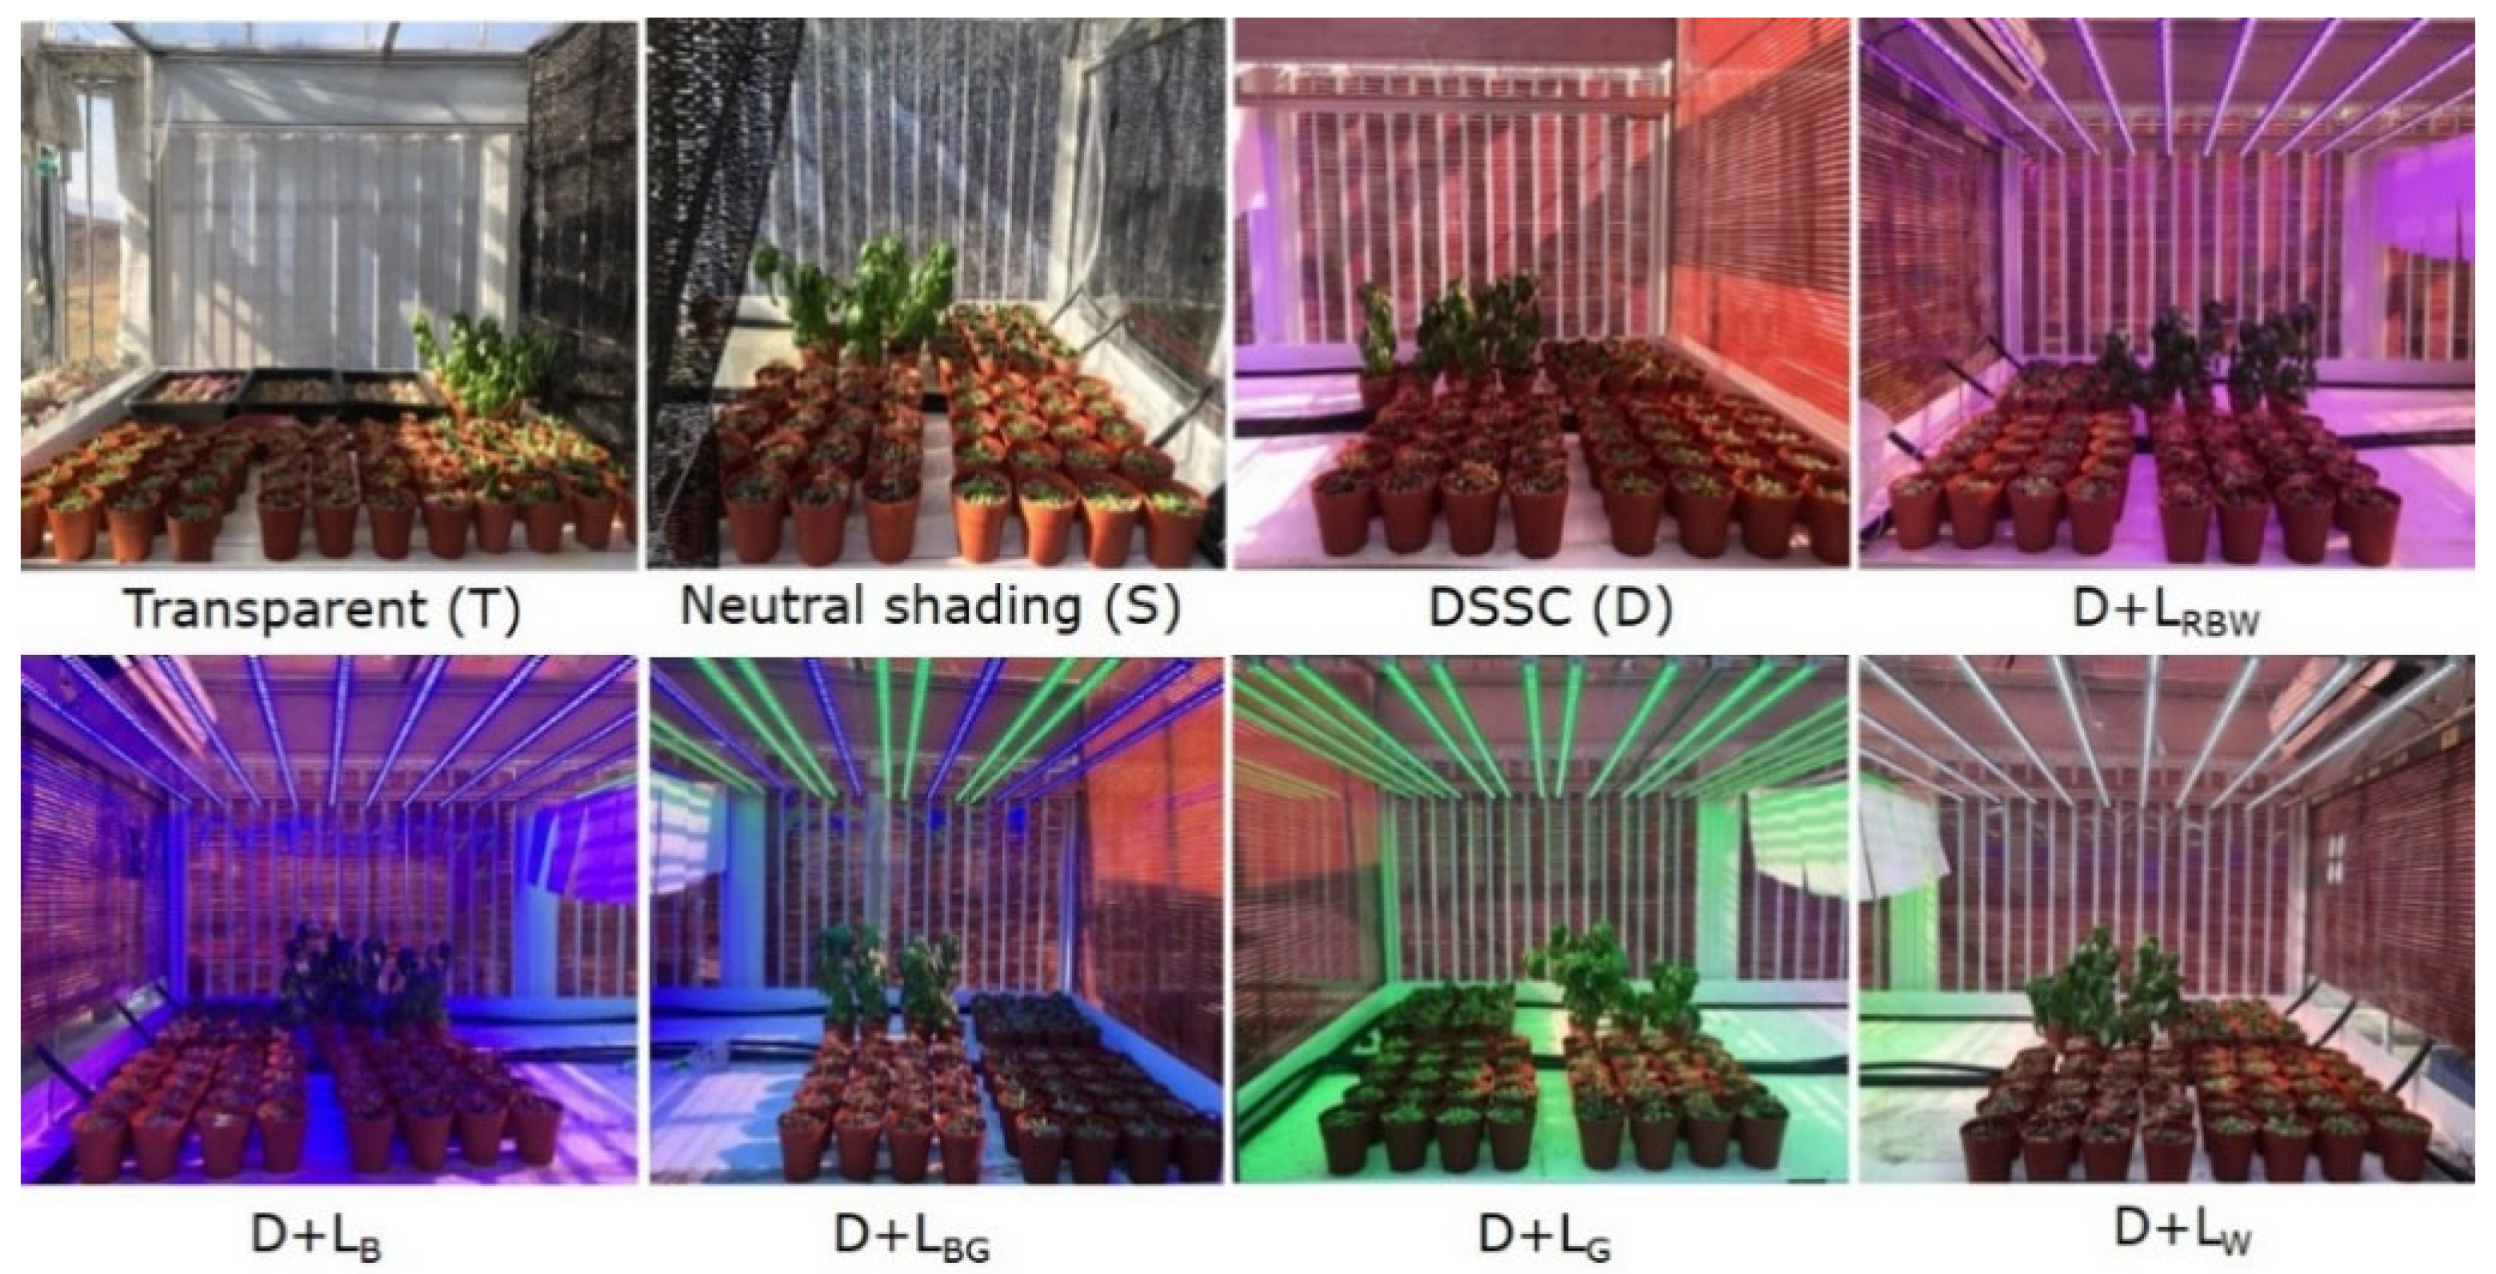
The experiment was conducted in a greenhouse with four modules measuring 3.1 × 1.5 × 1.2 m (L × W × H), which were divided into two halves and then divided into eight treatments. The chamber was composed of clear polycarbonate (PC) (Figure 2). To prevent light interference between the modules, a hardboard (L 150 cm × W 60 cm) material was installed to separate the treatments. The untreated condition was the transparent treatment (T, control), and the 60% shaded condition was the shaded treatment (S) with a black saran. In the remaining treatments, red DSSCs (Z907) customized by a specialized manufacturer (Sangbo, Gimpo, Republic of Korea) were attached to the outside of the ceiling and sides of the chamber (D).
As the DSSC-covered treatments received less blue (B) and green (G) light, LED lighting was used to supplement the light at the missing wavelengths, that is, B, G, white (W), blue + green (BG), and red + blue + white (RBW). Supplemental LED illumination (D+L) was provided for 15 h (05:00–20:00) at 60 μmol·m−2·s−1 photosynthetic photon flux density (PPFD). T, S, and D chambers were also supplied with 1–2 μmol·m−2·s−1 PPFD of scattered light from 05:00–20:00 to match the same photoperiod as the LED treatments. Therefore, the number of treatments in this study was eight (Table 1). Each of the eight treatments consisted of 20 plants evenly spaced throughout the area within each light chamber. Sunlight was introduced into each chamber during the day.
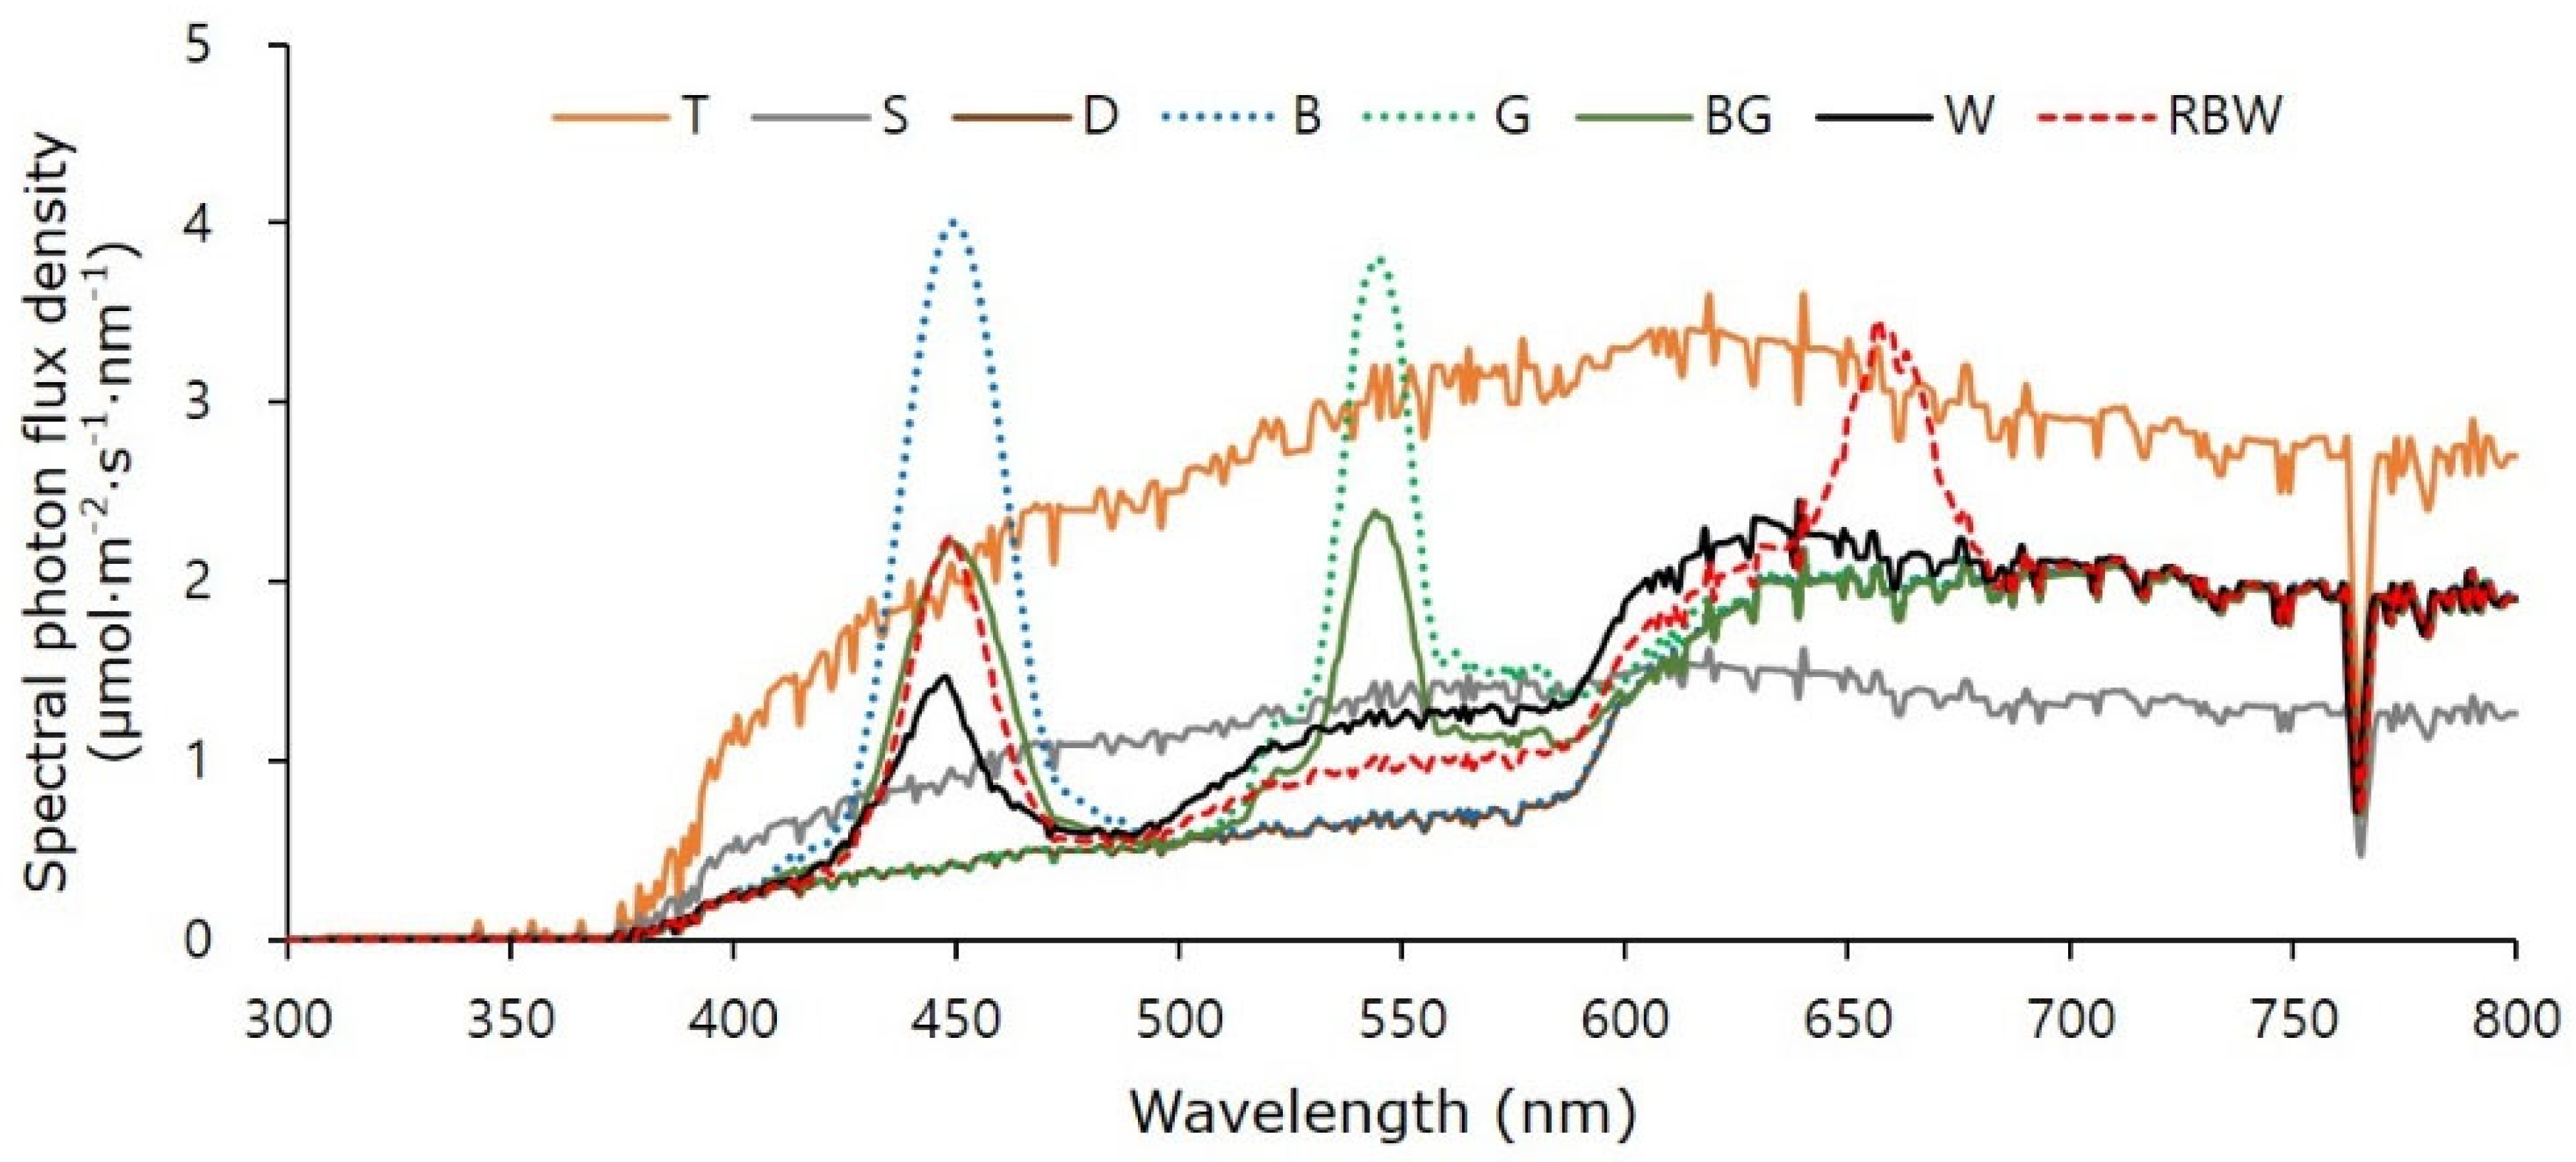
The light intensity in each chamber was measured using a light meter (LI-250A; Li-Cor Inc., Lincoln, NE, USA) between 11:00 and 12:00 on a clear day. The light spectrum of each chamber was measured with a spectroradiometer (PAR-200; J&C Tech Co., Ltd., Yongin City, Republic of Korea) at 08:00, 12:00, and 16:00 on a clear day (Figure 3). The wavelengths were labeled blue (B, 400–500 nm), green (G, 500–600 nm), red (R, 600–700 nm), or far-red (FR, 700–800 nm). Moreover, the photosynthetically active radiation (PAR, 400–700 nm) was measured (Table 1).
Each treatment had different light qualities (B, G, R, and FR), light intensities of PAR, and daily light integrals (DLIs) (Table 2). Among the T, S, and D conditions without LEDs, the T without shade and S shaded with neutral shade cloth conditions were similar in light quality. The transmittance and DLI of PAR at noon on a clear day were 45.1% and 40.9% of T, respectively (Table 2). The PAR transmittance of D was slightly lower at 37.0% of T; however, its DLI was similar to that of S at 40.4%. The light quality of D shaded by the DSSC was different from that of S, with less B and G light and more R and FR light. The lowest DLI appropriate for growing most flowering ornamental plants is usually known to be 10–12 mol·m−2·d−1 [28]. That of T was high enough at 16.52 mol·m−2·d−1, while those of S and D were insufficient at 6.75 and 6.67 mol·m−2·d−1, respectively (Table 2). Moreover, those of the five treatments with LED supplemental light were close to 10 mol·m−2·d−1 at 9.36–9.61 mol·m−2·d−1.
In treatments where different LEDs illuminated the chamber with the same light quantity and quality as the D treatment, the corresponding light quality increased with each LED illumination, increasing the DLI from 40.3 to 44.1% of D to 57.1 to 58.2% of T (Table 2). Wavelength distributions and inter-wavelength ratios different from T and S, such as the R:FR ratio and changes in the amount and proportion of G and B light, were expected to affect plant growth and morphology, including SAR [29,30,31].

2.3. Measurements and Statistical Analysis

The experiment was conducted for 6 weeks, from 2 April to 18 May 2022. At the end of the treatment, the plant height, number of leaves, stem diameter, fresh and dry weights, and leaf area by color (green, dark green, and pink) were assessed. The stem diameter was measured at the second node from the shoot apex. Plant weight was measured after drying in a drying oven (DS-80MP-1, Dasol Scientific, Hwaseong-si, Republic of Korea) at 80 °C for 5 days. The leaf-specific weight was obtained by dividing the leaf dry weight by the leaf area. The S/R ratio was calculated by dividing the shoot dry weight by the root dry weight.
In each coleus leaf, green, dark red, and pink areas were distinguished from the outside to the inside. To measure the leaf color ratio, the area of each of the three colors was measured using a leaf image analysis system (WinDIAS 3 Image Analysis System, Delta-T Devices Ltd., Cambridge, UK), and the percentage (%) of the total area was expressed. The last mature leaves were used to measure L’ (lightness), a’ (red/green coordinate), and b’ (yellow/blue coordinate) values for each color segment using a colorimeter (CR-300, Konica Minolta, Tokyo, Japan). The relative chlorophyll content of the leaf green area was determined in the last mature leaves using a chlorophyll meter (SPAD-502, Minolta, Japan).
In addition, the correlation between the B or G light percentage of the light source and the growth characteristics was determined using regression analysis. The photon flux density (PFD) value of B or G light was divided by the PFD value of 400–800 nm to obtain the green light ratio. The B light percentages of D+L(B), D+L(G), D+L(BG), D+L(W), and D+L(RBW) were 26, 7, 16, 12, and 15%, respectively. The G light percentages were 12, 30, 21.1, 21, and 16%, respectively (Table 2).
Statistical analysis of the collected data was performed using SPSS Statistics (IBM SPSS Statistics 23, IBM, New York, NY, USA) with Duncan’s multiple range test at a 5% significance level. Regression analysis was performed in SigmaPlot 10.0 (SPSS, Chicago, IL, USA).

3. Results and Discussion

3.1. Growth and Morphological Characteristics

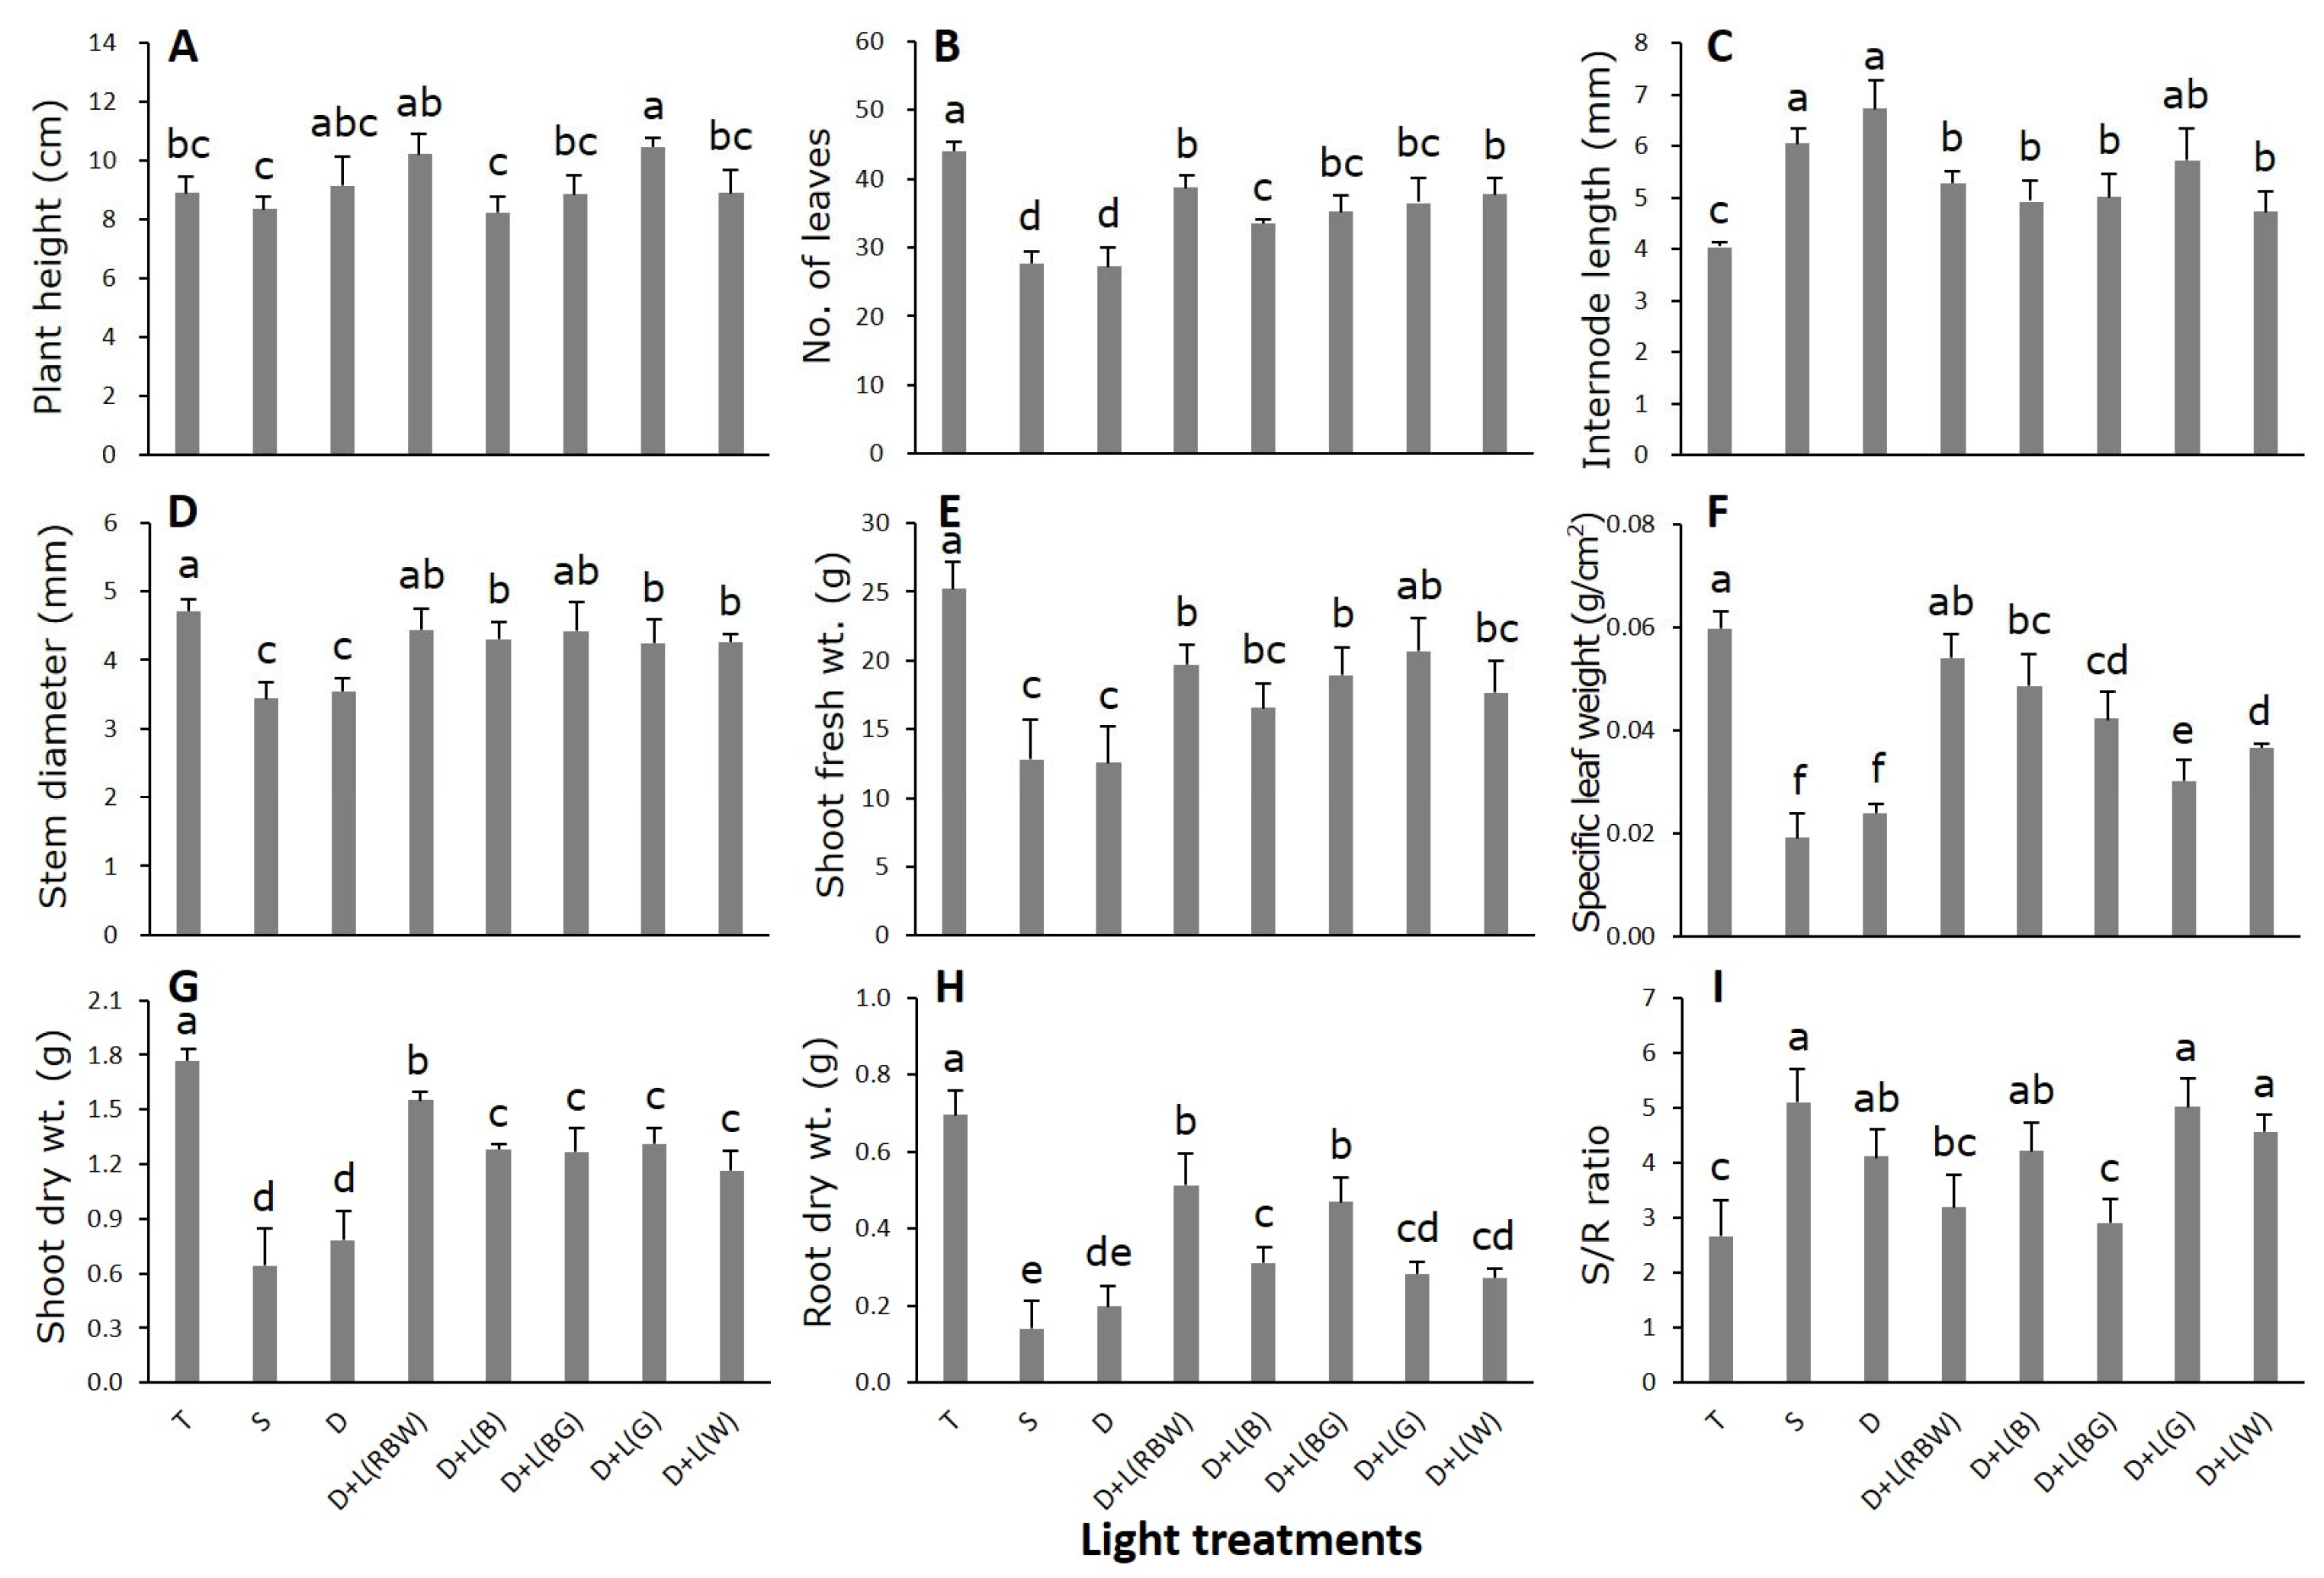
To determine the growth response of coleus to light treatment, we compared the plant height, internode length, leaf water content, fresh weight, and building weight after 6 weeks of treatment and found differences among the treatments (Figure 4 and Figure 5). The plant height was significantly greater in D+L(RBW) and D+L(G) at 10.25 cm and 10.45 cm, respectively, compared with 8.90 cm in the control (T) (Figure 4A). In contrast, the number of leaves was significantly lower than 44.1 in T in all treatments, especially 27.6 and 27.2 in S and D, respectively, with a lower DLI (Figure 4B). The internode length increased in all treatments compared with 4.04 cm in T and was particularly high in D+L(G), which compensated for the low DLI in S, D, and G at 6.05, 6.73, and 5.73 cm, respectively (Figure 4C). The stem diameter was significantly lower in all treatments, except in D+L(RWB) and D+L(BG), compared with 4.70 mm in T. It was particularly lower in S and D, with low DLI at 3.44 and 3.54 mm, respectively (Figure 4D).
For these growth characteristics, a decrease in the DLI resulted in a decrease in the leaf number, diameter, and elongated internodes. Moreover, LED supplemental lighting increased the leaf number and diameter and decreased internode length compared with the D treatment. These results suggest that low DLI may be responsible for the decrease in leaf number, diameter, and elongation of the internodes. These results are consistent with reports that a low DLI reduced leaf water content and promoted stem elongation, whereas a high DLI or supplemental light had the opposite effect [32,33]. However, in the D+L(G) treatment supplemented with G LEDs, the internode length was similar to that in the D treatment (Figure 4C). This is similar to a previous report that G light can induce a phloem response in Arabidopsis [31].
Six weeks after treatment, the live and construction weights were significantly lower in the S and D treatments than in the T treatment and were increased via LED supplementation (Figure 4E,H,I). The decrease in fresh weight was greater in the roots than in the stems, resulting in a significant increase in the S/R ratio to 5.10, 5.02, and 4.57 in the S, D+L(G), and D+L(W) treatments, respectively, compared with 2.66 in T (Figure 4I). An increase in S/R indicates greater shoot dry weight than root dry weight, a phenomenon that also occurs under light deficit or increased G or FR light intensity [29,30,31,34].
Specific leaf weight (SLW) is the leaf dry weight divided by the leaf area and is proportional to leaf thickness [35]. The SLW was also significantly reduced to 0.019 and 0.024 g·cm−2 in the S and D treatments with low DLI, respectively, compared with 0.060 g·cm−2 in the T treatment. It was significantly increased via LED supplementation (Figure 4F). However, the increase was smaller in the D+L(G), D+L(W), and D+L(BG) treatments with higher G light ratios, which could be attributed to the increase in leaf area (Figure 5C). In particular, the D+L(G) treatment had the lowest value of 0.030 g·cm−2 among the light treatments, indicating wider and thinner leaves. Regarding plant weight-related traits, the total weight decreased with DLI reduction and increased with LED supplemental lighting. However, the rate of increase was lower under LED lighting with a higher percentage of G light. This trait can be attributed to a decrease in photosynthesis due to a reduction in DLI and an increase in the degree of SAR due to an increase in the percentage of G light [31,36].

3.2. Leaf Area and Color Distribution

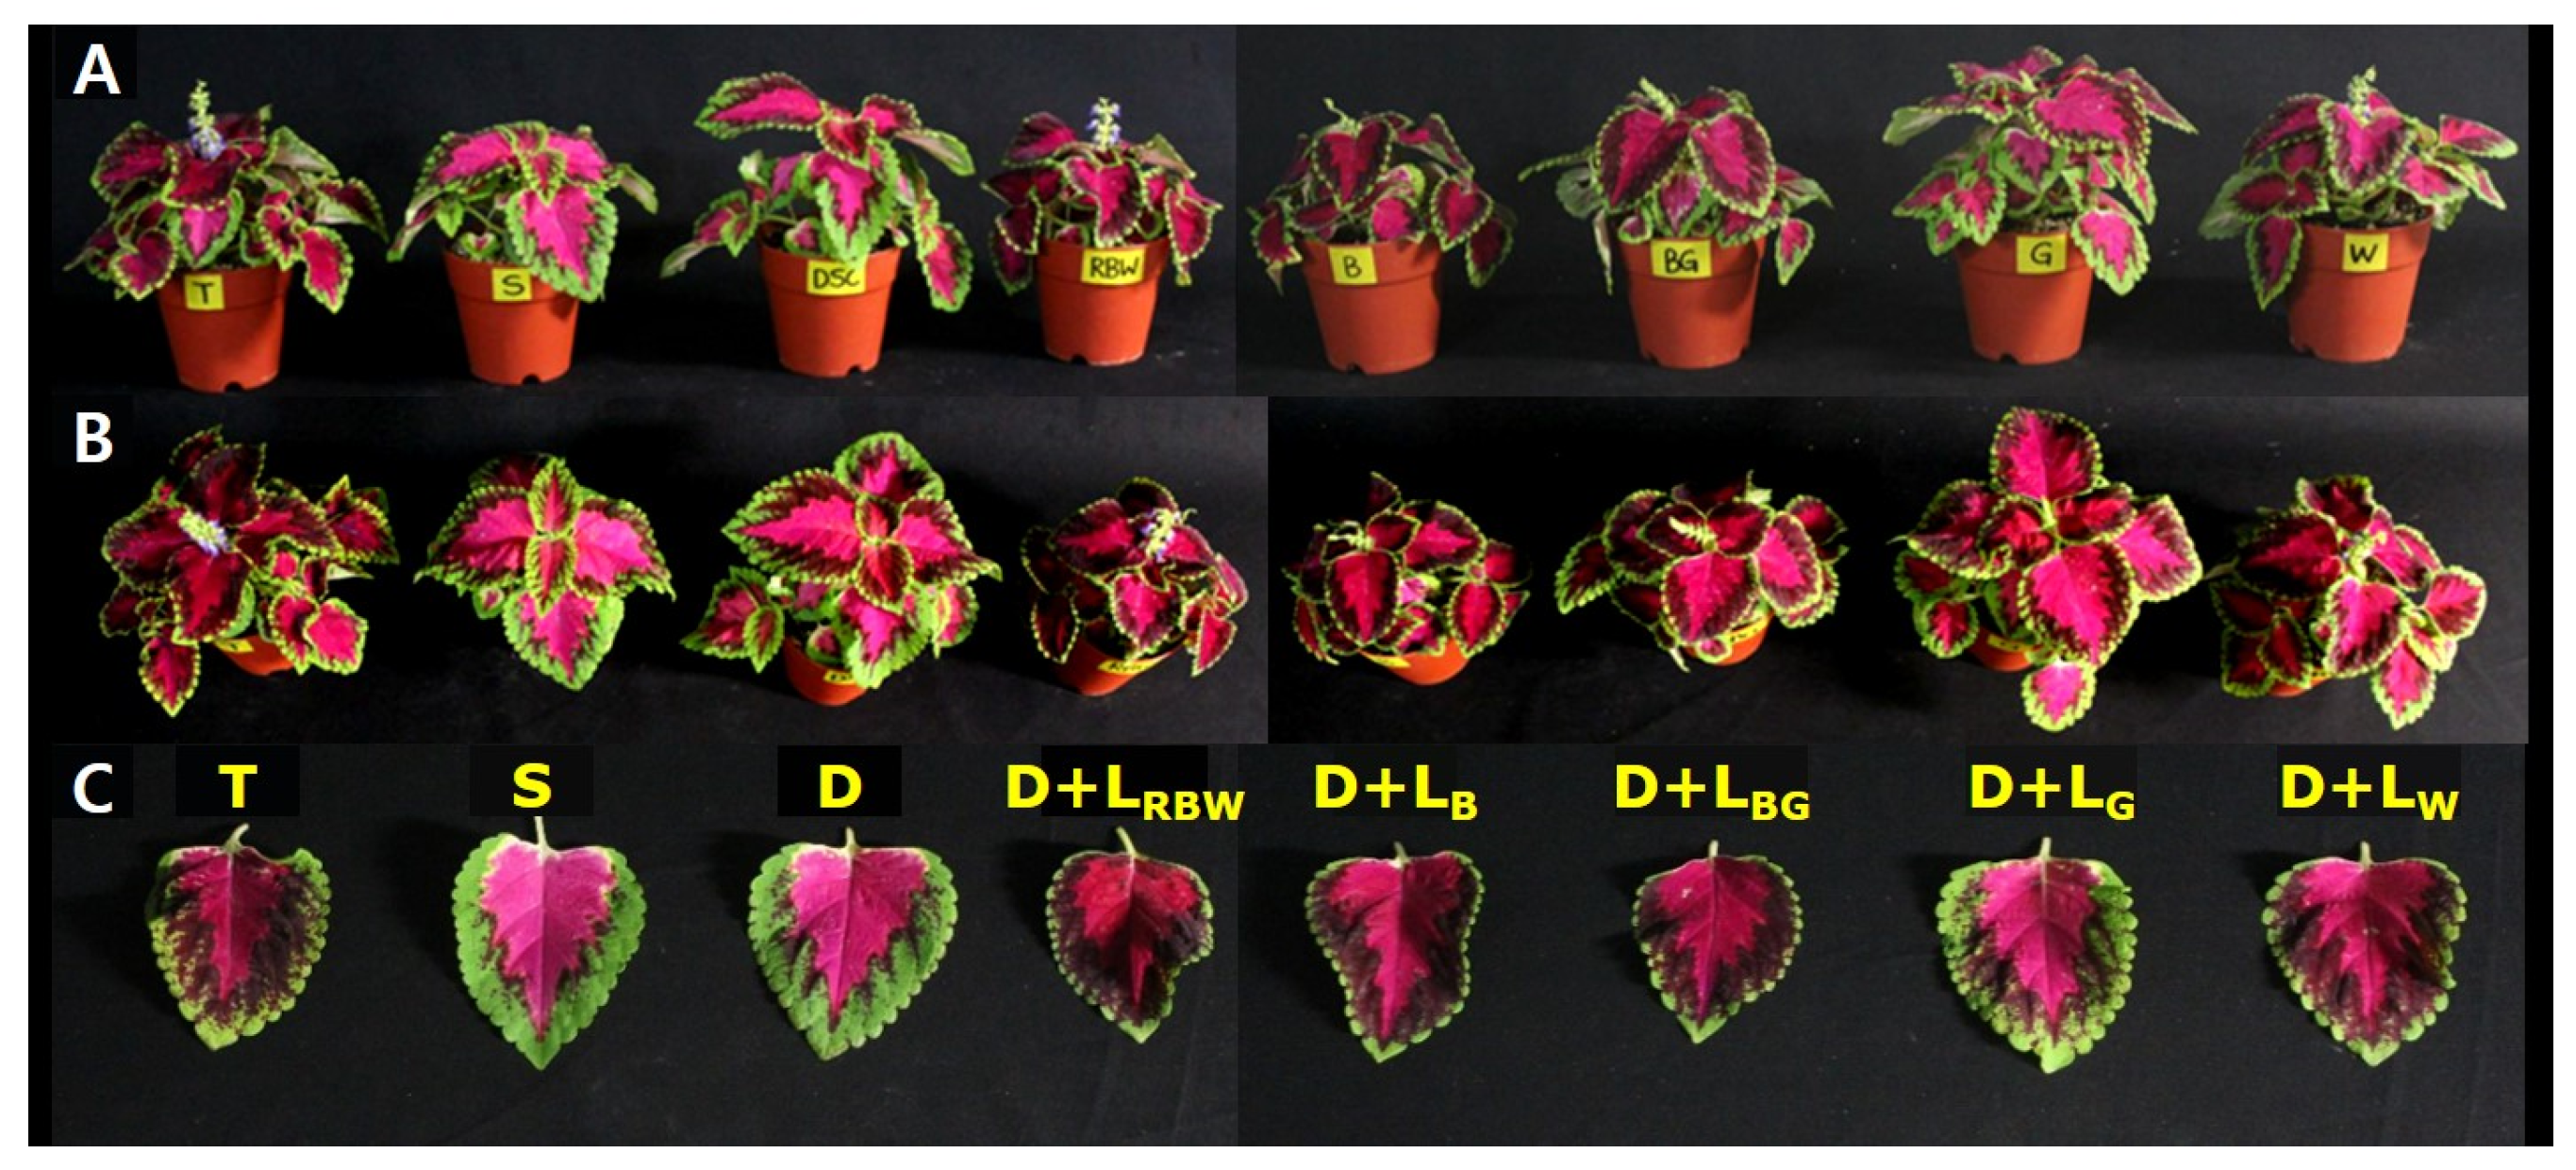
The leaf area, leaf color, and area ratio of each leaf color in coleus were affected by the light environment (Figure 4 and Figure 5). For the leaf area, only D+L(G) had a significantly larger value (43.9 cm2) compared with 30.7 cm2 in the control (T) (Figure 5B). Moreover, compared with the D treatment (34.0 cm2), D+L(G) caused a significant increase in the leaf area, while D+L(RBW) and D+L(B) caused a significant decrease to 28.8 cm2 and 26.5 cm2, respectively. The leaf area also tended to increase under high G light treatments, similar to the induction of SAR by G light [31,36]. Furthermore, the high percentage of B light (26%) in D+L(B) and the high R:FR ratio (1.24) in D+L(RBW) may have contributed to the reduction in leaf area [18,37,38]. In addition, the thickness of leaves with large leaf areas had a thinning effect (Figure 4F).
Coleus is a houseplant with a unique leaf color consisting of two or more color combinations, such as red, green, pink, and purple. Leaves with fewer green areas and more red areas are said to have ornamental value because of their showiness [22]. The leaf color of coleus ‘Highway Rose’ comprises three colors: pink, dark red, and green. Moreover, the proportion of leaf area and area per color varied among the treatments (Figure 4A and Figure 5C). The pink area, the innermost part of the leaf, was significantly larger in the D+L(G) treatment (24.4 cm2) compared with 18.2 cm2 in T, and the areas in the other treatments were not significant (Figure 5C). However, the dark red area was significantly smaller in the S and D treatments than in the control. The green area was significantly increased in the S, D, and D+L(G) treatments; that is, the dark red area decreased, and the green area increased in the S and D treatments with lower DLI. Moreover, the pink and green areas increased in the D+L(G) treatment.
The leaves were divided by color and measured using a leaf area meter. The results were expressed as a percentage (%). We observed that the treatments with less green and darker red were the control (14.3% and 26.4%, respectively), D+L(RBW), D+L(B), D+L(BG), and D+L(W) (Figure 5B). In contrast, the S and D treatments with low DLI had very high percentages of green areas (33.8% and 39.1%, respectively) and relatively low percentages of dark red areas (9.4% and 10.0%, respectively). The D+L(G) treatment with a high G ratio also had a higher percentage of green areas (24.1%) and a lower percentage of dark red areas (20.5%) than the other illumination treatments. The area of red pigment expression (pink and dark red) was significantly reduced to 66.5% and 61.2% in the S and D treatments, respectively, compared with 85.7% in the T treatment and 76.1% in the D+L(G) treatment, with a high G ratio. On the other hand, the percentage of red-pigmented areas in the supplemental LED lighting treatments with high B light were 83.5–87.8%, similar to T.
On the other hand, colorimetric measurements of each leaf color area to compare differences in leaf color according to light treatments (Table 3) showed that the Hunter’s L’ value (lightness) of the pink area was higher in S, D, and D+L(G) and lower in LED light treatments. In particular, all light treatments except G LED light (D+L(G)) had lower lightness than the control (T). It can be inferred that the lower lightness is the darker pink color and less pink pigment (anthocyanin). In other words, low light intensity or high G light ratio inhibits anthocyanin production [13], while supplemental B LED lighting increases anthocyanin pigment synthesis.
The redness (Hunter’s a’ value) of the pink area was high in T, B, and W, particularly low in G, and lower than the control in S, D, D+L(RBW), and D+L(BG) (Table 3). The dark red and green areas were missing some data because the areas of some treatments were too small to measure. Although the data are limited, the lightness of the green area was lower in S, D, and D+L(G) than in T, probably due to a decrease in chlorophyll content with decreased light quantity and increased G light. A similar result can be seen in the relative chlorophyll content, with higher SPAD values in D and D+L(G). However, it was lower in T and D+L(B).
In a study by Garland et al. (2010), coleus grown at low DLI had a greater green leaf area [22]. In variegated plants, the red color of the leaves is mainly due to the expression of a flavonoid pigment, anthocyanin [39]. Studies have also shown that the anthocyanin content is highest under B light [40]. In this study, the percentage of pink areas where only anthocyanins were expressed ranged from a maximum of 59.3% (T) to a minimum of 51.9% (D), with no significant difference between the treatments. However, the lightness of the pink area was higher in the S, D, and D+L(G) treatments (Table 3, Figure 6C), indicating a lower concentration of pink pigments. It can be concluded that the anthocyanin pigment content decreases under light conditions with a lower DLI or a higher percentage of G light.

3.3. Correlation between Blue Light and Growth and Leaf Characteristics

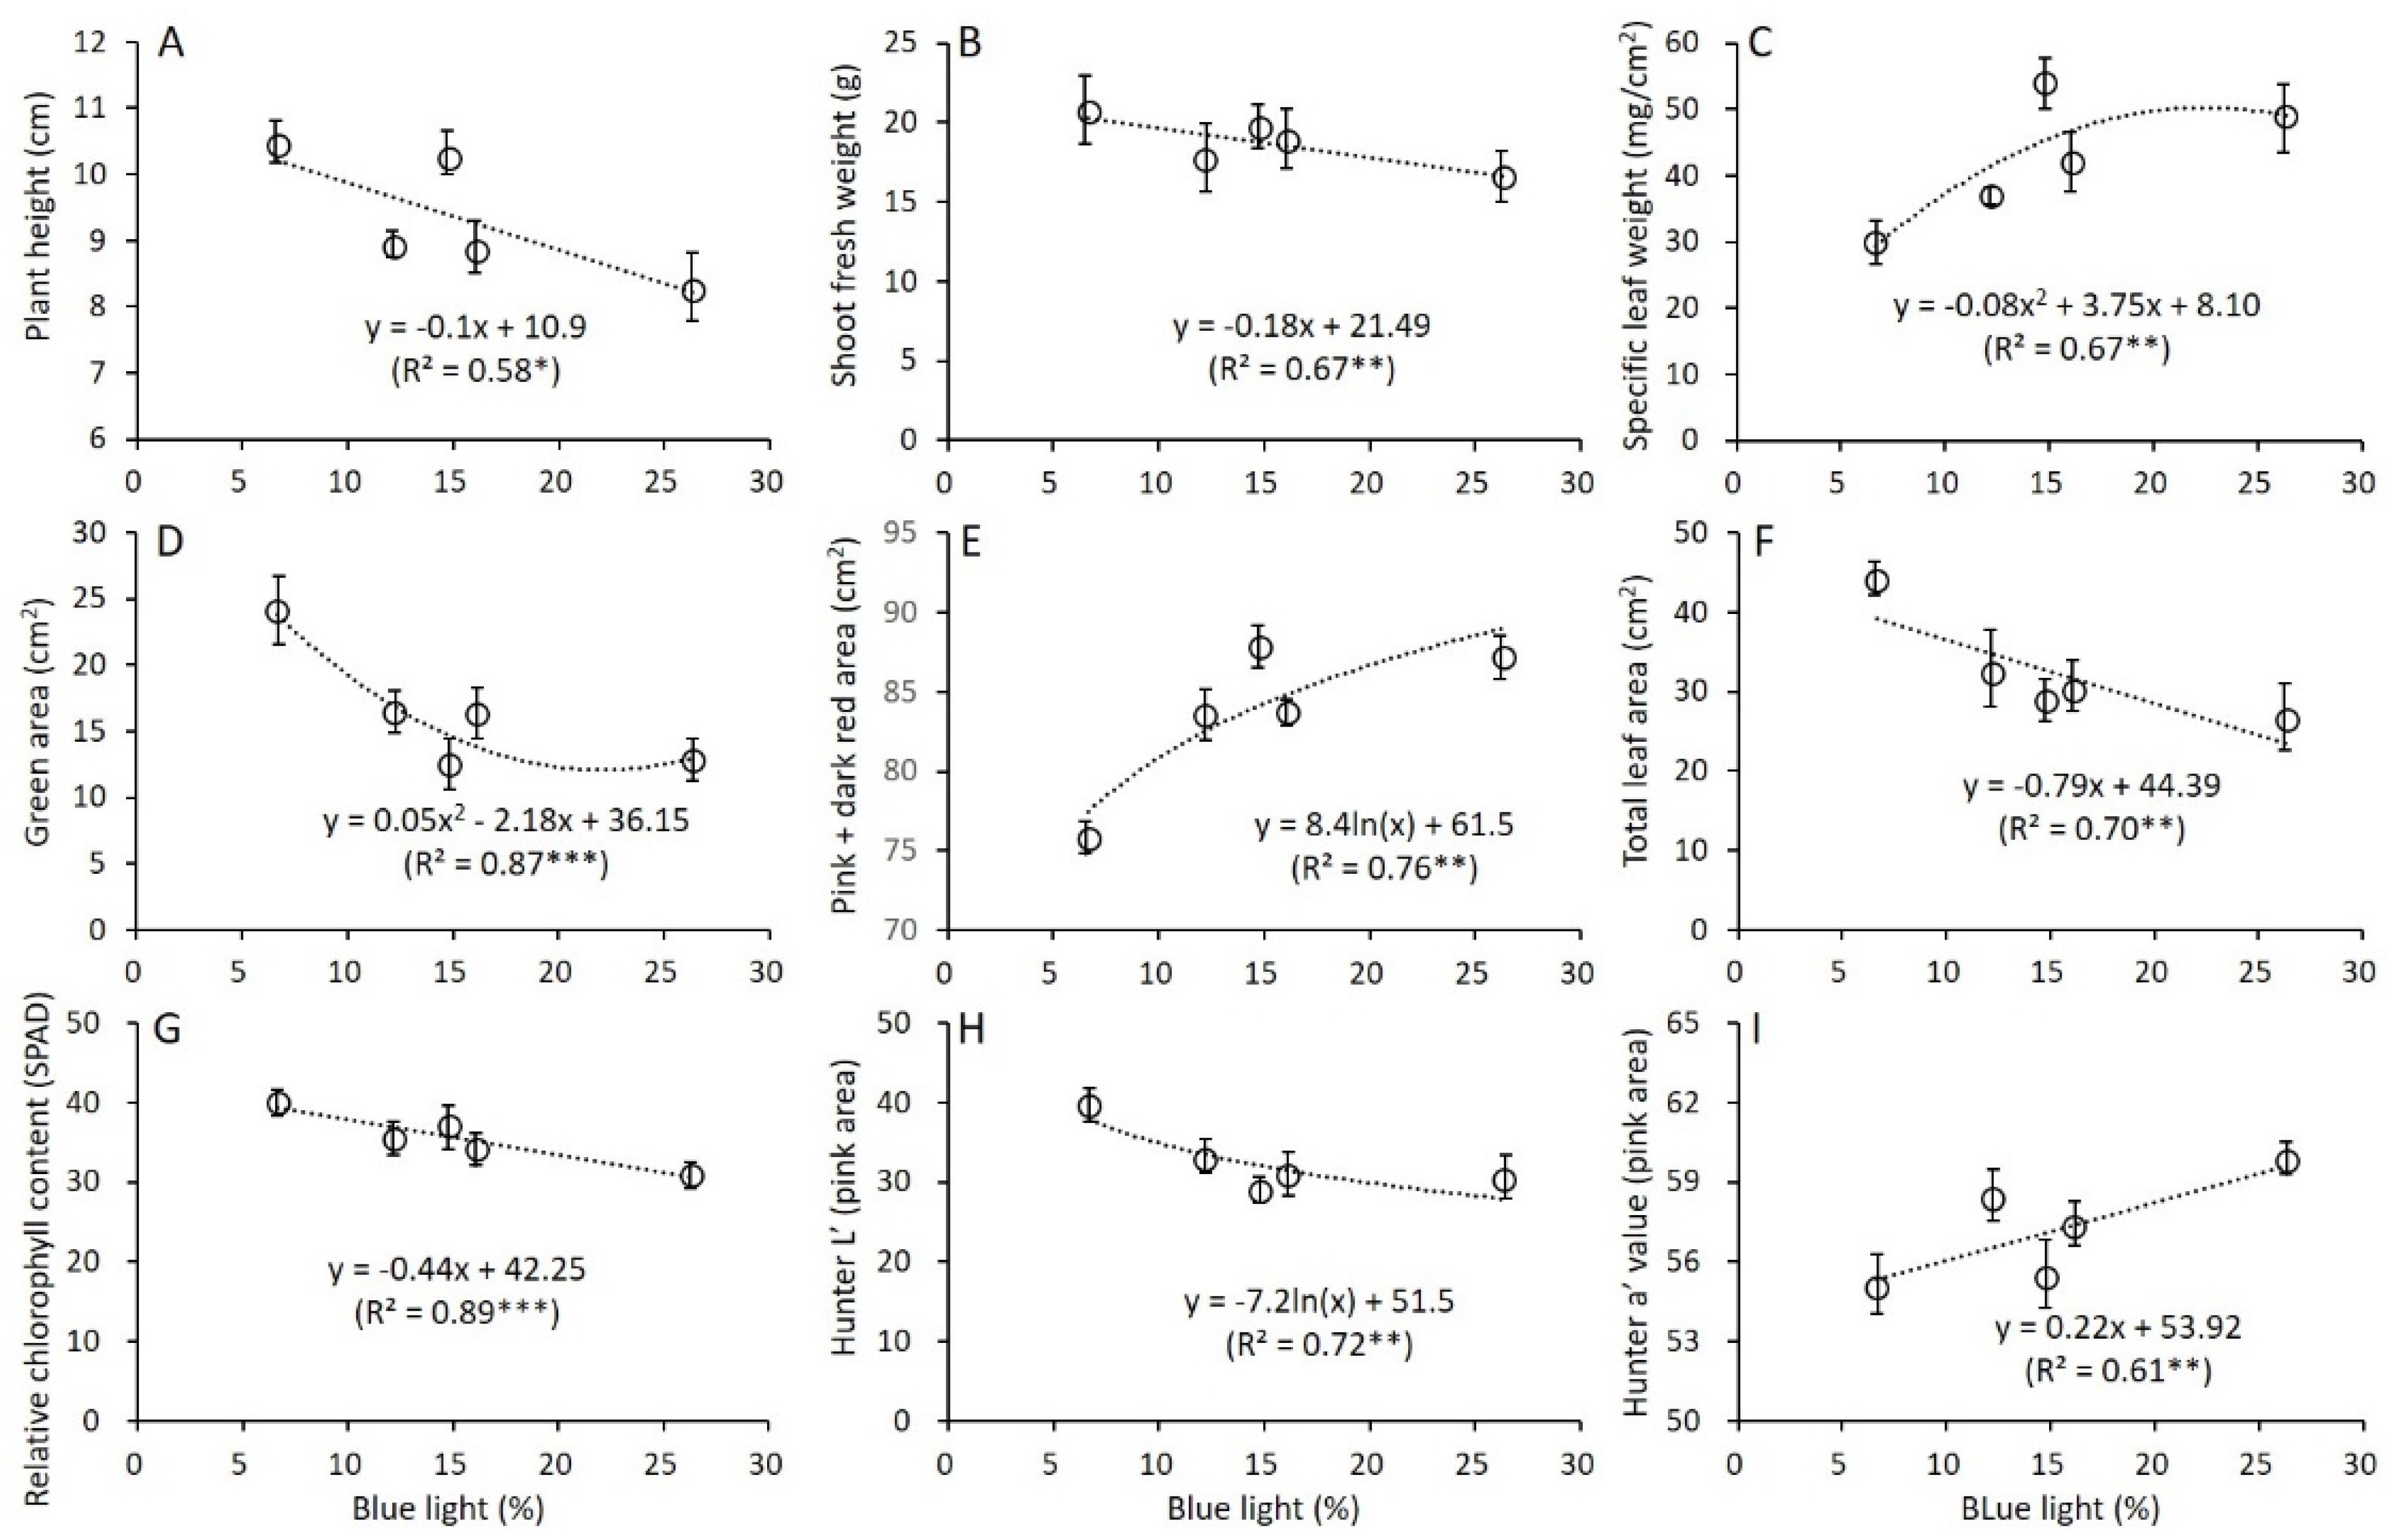
As there were differences in the growth and leaf color of coleus between the LED light sources, a regression analysis was performed regarding the G light percentage and the observed traits following treatment (Figure 7). As the B light percentage increased, the plant height (y = −0.1x + 10.9, R2 = 0.58, p > 0.05) and shoot fresh weight (y = −0.18x + 21.49, R2 = 0.67, p < 0.01) tended to decrease (Figure 7A,B). However, the specific leaf weight (y = −1.08x2 + 3.75x + 8.10, R2 = 0.67, p < 0.01), representing leaf thickness, tended to increase (Figure 7C). The color-specific leaf area was also highly correlated with the B light percentage (Figure 7D,E,F); as the B light percentage increased, the green area decreased (y = 0.05x2 − 2.18x + 36.15, R2 = 0.87, p < 0.001), the anthocyanin expression (pink + dark red) area increased (y = 8.4ln(x) + 61.5, R2 = 0.76, p < 0.01), and the total leaf area decreased (y = −0.79x + 44.36, R2 = 0.70, p < 0.01).
In addition, with increasing B light percentage, the relative chlorophyll content (SPAD) in the green area (y = −0.44x + 42.25, R2 = 0.89, p < 0.001) and the lightness (Hunter’s L’) in the pink area (y = −7.2ln(x) + 51.5, R2 = 0.72, p < 0.01) increased (Figure 7G,H), while the redness (Hunter’s a’) in the pink area (y = 0.22x + 53.92, R2 = 0.61, p < 0.01) decreased (Figure 7I). In other words, it can be seen that the increase in B light percentage decreases the chlorophyll content but increases the anthocyanin content [41] of coleus leaves.
These results suggest that B light is the causal wavelength that inhibits stem elongation, shoot growth, leaf expansion, and chlorophyll production and increases leaf thickness and anthocyanin production [14] in coleus.

3.4. Correlation between Green Light and Growth and Leaf Characteristics

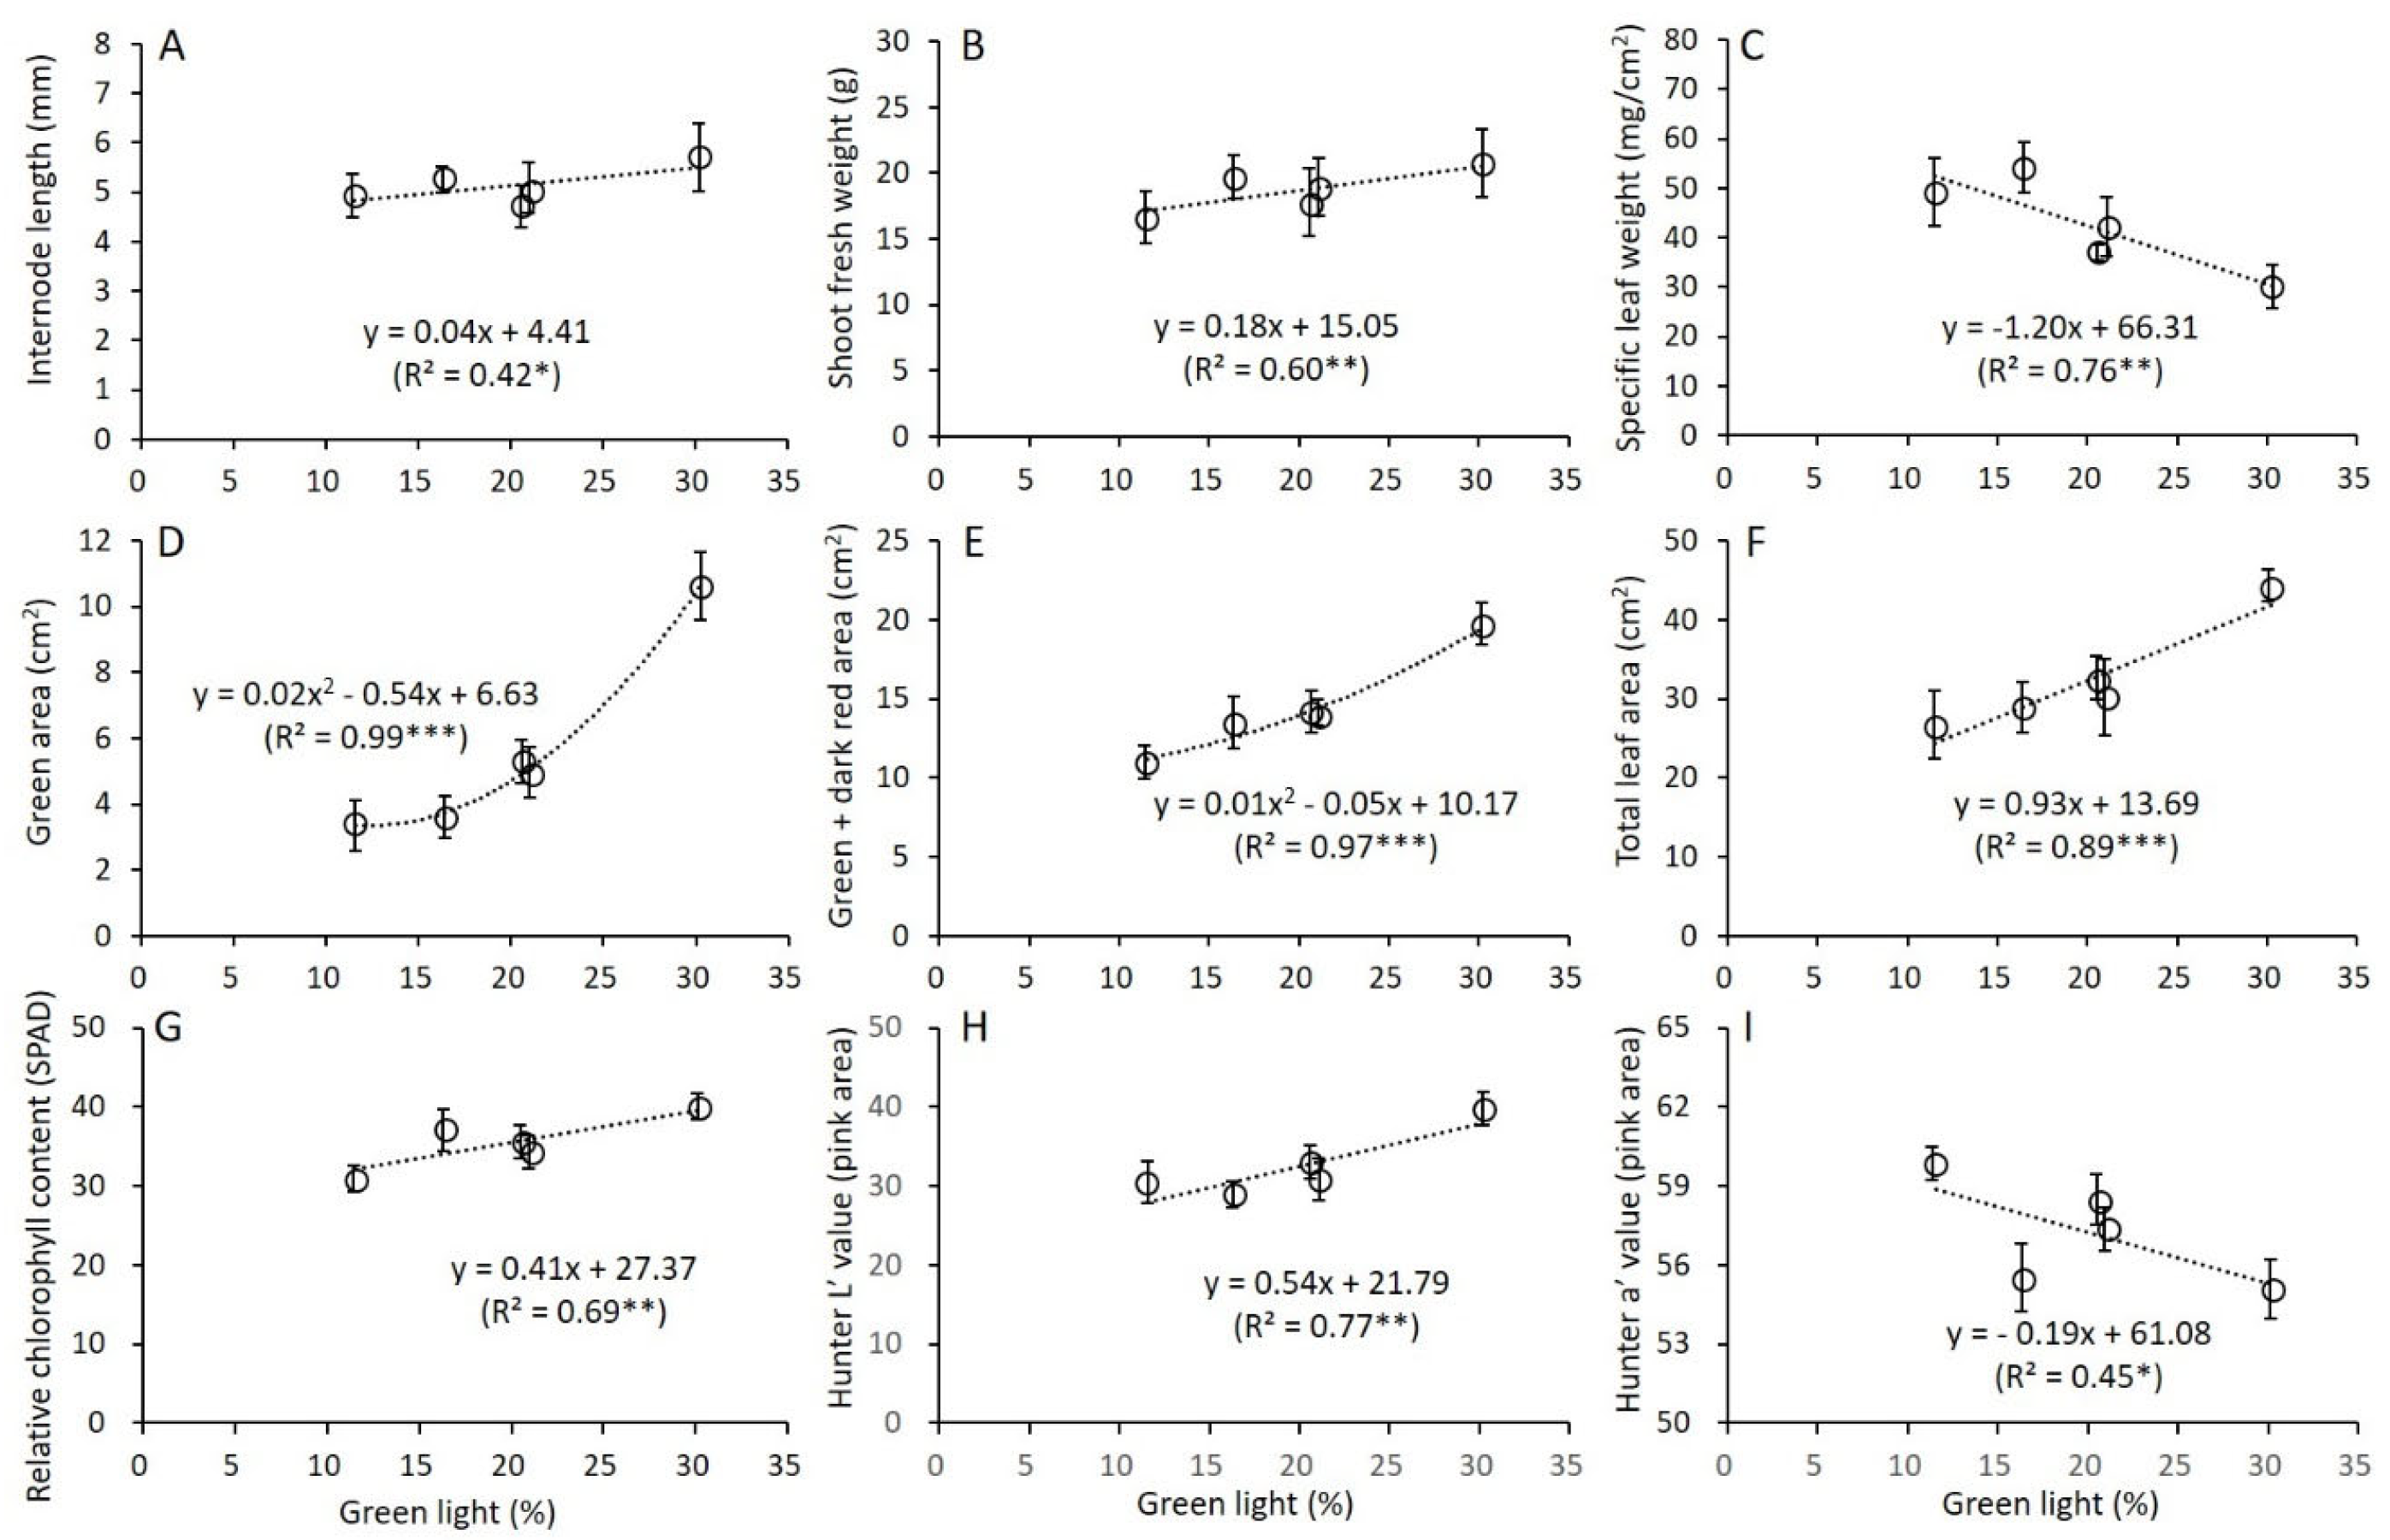
As there were differences in the growth and leaf color of coleus between the LED light sources, a regression analysis was performed regarding the G light percentage and the observed traits following treatment (Figure 8). As the G light percentage increased, the internode length (y = 0.04x + 4.41, R2 = 0.42, p > 0.035) and shoot fresh weight (y = 0.18x + 15.05, R2 = 0.60, p < 0.001) tended to increase. However, the specific leaf weight (y = −1.20x + 66.31, R2 = 0.76, p < 0.005), representing leaf thickness, tended to decrease (Figure 7C).
The color-specific leaf area was also highly correlated with the G light percentage, as a higher G light percentage was associated with a higher green area (y = 0.02x2 − 0.54x + 6.63, R2 = 0. 99, p < 0.001), chlorophyll expression (green + dark green) area (y = 0.01x2 − 0.05x + 10.17, R2 = 0.97, p < 0.001), and total leaf area (y = 0.93x + 13.69, R2 = 0.89, p < 0.001). In addition, with increasing G light ratio, the relative chlorophyll content (SPAD) in the green area (y = 0.41x + 27.37, R2 = 0.69, p < 0.01) and the lightness (Hunter’s L’) in the pink area (y = 0.54x + 21.79, R2 = 0.77, p < 0.01) increased (Figure 8G,H), while the redness (Hunter’s a’) in the pink area (y = −0.19x + 61.08, R2 = 0.45, p < 0.05) decreased (Figure 8I). In other words, it can be seen that the increase in G light increases the chlorophyll content but decreases the anthocyanin content [41] of coleus leaves.
These results suggest that green light is the causative wavelength of SAR [13,30,36]. Although the relationship between the R:FR ratio and SAR detected by phytochromes is well known [18,38] and has been used in horticulture, green light-induced SAR is a relatively recent discovery [30,36]. Therefore, it is important to examine the growth and morphological responses of plants to green light.

4. Conclusions

After 6 weeks of treatment, the growth and morphological characteristics of ‘Highway Rose’ coleus in a red DSSC (Z907) covered plant growth module in a greenhouse were influenced by the supplemental LED light quality. Moreover, the comparison of coleus growth and leaf colors under different light conditions showed that the transparent treatment (T) produced appropriate potted plants of coleus in terms of plant height (internode length), leaf water content, fresh and dry weight, leaf thickness, S/R ratio, leaf area, and leaf color. Under DSSC conditions, negative responses (i.e., SARs) were observed, such as increased internode length and leaf area, increased S/R ratio, increased relative chlorophyll content, and decreased redness in the coleus leaves. The supplementation of DSSCs with appropriate wavelengths (i.e., high B light) of LED light restored growth and morphology to some extent.
The LED supplementation treatments, except for the D+L(G) treatment, improved the ornamental value through the growth and morphological characteristics, such as shorter internode and small and thick leaves and an increase in the pink area of leaves, compared with S, D, and D+L(G) with high G light. Furthermore, the regression analysis regarding the B light percentage of the light source and the main growth traits within the supplemental lighting treatments showed a clear positive response to B light, such as a decrease in plant height, shoot fresh weight, and leaf area, with an increase in B light percentage and an increase in leaf thickness (SLW) or an increase in pink area and redness of leaves.
However, among the LED supplementation treatments, the D+L(G) treatment showed different responses, such as larger internode length and leaf area and an increase in the G light percentage of leaves, compared with the other supplementation treatments. Furthermore, the regression analysis regarding the G light percentage of the light source and the main growth characteristics within the supplementation treatments showed a clear negative response to G light, such as an increase in internode length, shoot fresh weight, and leaf area, with an increase in G light percentage and a decrease in leaf thickness (SLW) or an increase in green area and redness of leaves.
This study characterized the growth and morphological responses of coleus, a photosensitive plant, under Z907 DSSCs, a customized DSSC predicted to be suitable for plant growth, in a small-scale growth module. We found that the reduced light quantity and altered light quality caused by the DSSCs resulted in undesirable plant growth, morphology, and leaf color that could be restored by supplemental lighting with LEDs including appropriate B ratio, indicating their potential as greenhouse agrivoltaics. However, it is unclear whether these results could be replicated in a commercial greenhouse. It is also necessary to find DSSCs that are more suitable for plant growth than Z907. Therefore, further studies with DSSCs of different wavelengths and transmittance values and/or in larger greenhouses are required for the commercial use of DSSCs.

Author Contributions

S.P.: methodology, investigation, visualization, software, and writing of the original draft. J.K.: investigation, visualization, software, and review. W.O.: conceptualization, methodology, project administration, supervision, funding acquisition, writing, review, and editing. All authors have read and agreed to the published version of the manuscript.

Funding

This work was supported by the Korea Institute of Planning and Evaluation for Technology in Food, Agriculture, and Forestry (IPET) through the Agricultural Energy Self-Sufficient Industrial Model Development Program funded by the Ministry of Agriculture, Food, and Rural Affairs (MAFRA) (grant no. 322005-02).

Data Availability Statement

Data are contained within the article.

Conflicts of Interest

The authors declare no conflicts of interest.

References

  1. Stallknecht, E.J.; Herrera, C.K.; Yang, C.; King, I.; Sharkey, T.D.; Lunt, R.R.; Runkle, E.S. Designing plant—Transparent agrivoltaics. Sci. Rep. 2023, 13, 1903. [Google Scholar] [CrossRef]
  2. Chalkias, D.A.; Charalampopoulos, C.; Aivali, S.; Andreopoulou, A.K.; Karavioti, A.; Stathatos, E. A di-carbazole-based dye as a potential sensitizer for greenhouse-integrated dye-sensitized solar cells. Energies 2021, 14, 1159. [Google Scholar] [CrossRef]
  3. Ki, H.C.; Jung, H.Y.; Gu, H.B. A study on the efficiency of dye sensitized solar cell employing TiO2 photoelectrode synthesized using basic catalyst. J. Korean Inst. Electr. Electron. Mater. Eng. 2013, 26, 736–740. [Google Scholar]
  4. Roslan, N.; Ya’acob, M.E.; Radzi, M.A.M.; Hashimoto, Y.; Jamaludin, D.; Chen, G. Dye sensitized solar cell (DSSC) greenhouse shading: New insights for solar radiation manipulation. Renew. Sustain. Energy Rev. 2018, 92, 171–186. [Google Scholar] [CrossRef]
  5. Kim, H.S.; Lee, J.; Shin, M. Effective refractive index of dye-sensitized solar cell using transmittance and reflectance measurements. Curr. Photovolt. Res. 2015, 3, 91–96. [Google Scholar]
  6. Moon, B.E.; Choi, E.G.; Kim, J.G.; Ryou, Y.S.; Yoon, Y.C.; Kim, H.T. Performance analysis of the TiO2 dye-sensitized solar cell according to seasonal changes. Prot. Hortic. Plant Fact. 2014, 23, 221–228. [Google Scholar] [CrossRef]
  7. Kim, J.J.; Kang, M.; Kwak, O.K.; Yoon, Y.J.; Min, K.S.; Chu, M.J. Fabrication and characterization of dye-sensitized solar cells for greenhouse application. Int. J. Photoenergy 2014, 2014, 376315. [Google Scholar] [CrossRef]
  8. Statistics Korea (KOSTAT). Agricultural Area Statistics in 2020; KOSTAT: Daejeon, Republic of Korea, 2021; pp. 66–69.
  9. Jeong, H.K.; Seong, J.H.; Kim, H.J. Agricultural policy tasks to achieve carbon neutrality. In Agricultural Outlook 2022; Korea Rural Economy Institute (KREI): Naju, Republic of Korea, 2022; pp. 109–131. [Google Scholar]
  10. Song, Y.H.; Jeong, S.R.; Go, E.; Moon, H.D.; Lim, H.J.; Noh, G.W.; Lee, J.P. Korea 2050 Carbon Neutrality Scenario K-Map: System Improvement Tasks and Budget Proposals to Achieve the 2030 K-Map Goal; Green Energy Strategy Research Institute, Green Transition Research Institute, Next Corporation, and Agora Energiewende: Seoul, Republic of Korea, 2023; pp. 5–17. [Google Scholar]
  11. Lopez, R.; Fisher, P.; Runkle, E. Introduction to specialty crop lighting. In Light Management in Controlled Environments; Lopez, R., Runkle, E., Eds.; Meister Media Worldwide: Willoughby, OH, USA, 2017; pp. 12–20. [Google Scholar]
  12. Hernandez, R.; Kubota, C. Light quality and photomorphogenesis. In Light Management in Controlled Environments; Lopez, R., Runkle, E., Eds.; Meister Media Worldwide: Willoughby, OH, USA, 2017; pp. 29–37. [Google Scholar]
  13. Wang, Y.; Folta, K.M. Contributions of green light to plant growth and development. Am. J. Bot. 2013, 100, 70–78. [Google Scholar] [CrossRef]
  14. Ahmad, M.; Grancher, N.; Heil, M.; Black, R.C.; Giovani, B.; Galland, P.; Lardemer, D. Action spectrum for cryptochrome-dependent hypocotyl growth inhibition in Arabidopsis. Plant Physiol. 2002, 129, 774–785. [Google Scholar] [CrossRef]
  15. Sng, B.J.R.; Mun, B.; Mohanty, B.; Kim, M.; Phua, Z.W.; Yang, H.; Lee, D.Y.; Jang, I.C. Combination of red and blue light induces anthocyanin and other secondary metabolite biosynthesis pathways in an age-dependent manner in Batavia lettuce. Plant Sci. 2021, 310, 110977. [Google Scholar] [CrossRef]
  16. Runkle, E.S.; Heins, R.D. Specific functions of red, far red, and blue light in flowering and stem extension of long day plants. J. Am. Soc. Hortic. Sci. 2001, 126, 275–282. [Google Scholar] [CrossRef]
  17. Runkle, E.S.; Heins, R.D. Stem extension and subsequent flowering of seedling grown under a film creating a far-red deficient environment. Sci. Hortic. 2002, 96, 257–265. [Google Scholar] [CrossRef]
  18. Park, I.S.; Cho, K.J.; Kim, J.; Cho, J.Y.; Lim, T.J.; Oh, W. Growth and flowering responses of petunia to various artificial light sources with different light qualities. Korean J. Hortic. Sci. Technol. 2016, 34, 55–66. [Google Scholar] [CrossRef]
  19. Li, M.; Coneva, V.; Robbins, K.R.; Clark, D.; Chitwood, D.; Frank, M. Quantitative dissection of color patterning in the foliar ornamental coleus. Plant Physiol. 2021, 187, 1310–1324. [Google Scholar] [CrossRef]
  20. Nguyen, P.; Cin, V.D. The role of light on foliage colour development in coleus (Solenostemon scutellarioides (L.) Codd). Plant Physiol. Biochem. 2009, 47, 934–945. [Google Scholar] [CrossRef]
  21. Rogers, R. Coleus: Rainbow Foliage for Containers and Gardens; Timber Press Inc.: Portland, OR, USA, 2008. [Google Scholar]
  22. Garland, K.F.; Burnett, S.E.; Stack, L.B.; Zhang, D. Minimum daily light integral for growing high-quality coleus. HortTechnology 2010, 20, 929–933. [Google Scholar] [CrossRef]
  23. Gusmawan, M.W.A.; Sitawati, S.; Karyawati, A.S. The effect of paclobutrazol concentrations in different shade levels on coleus plant leaves color. J. Agric. Eng. 2022, 11, 647–657. [Google Scholar] [CrossRef]
  24. Burger, J.; Edwards, G.E. Photosynthetic efficiency, and photodamage by UV and visible radiation, in red versus green leaf coleus varieties. Plant Cell Physiol. 1996, 37, 395–399. [Google Scholar] [CrossRef]
  25. Park, J.; Lee, P.; Ko, M.J. Design and fabrication of long-term stable dye-sensitized solar cells: Effect of water contents in electrolytes on the performance. Int. J. Precis. Eng. Manuf. Green Technol. 2019, 6, 125–131. [Google Scholar] [CrossRef]
  26. Yeoh, M.E.; Chan, K.Y. A review on semitransparent solar cells for real-life applications based on dye-sensitized technology. IEEE J. Photovolt. 2021, 11, 354–361. [Google Scholar] [CrossRef]
  27. Barichello, J.; Vesce, L.; Mariani, P.; Leonardi, E.; Braglia, R.; Di Carlo, A.; Canini, A.; Reale, A. Stable semi-transparent dye-sensitized solar modules and panels for greenhouse application. Energies 2021, 14, 6393. [Google Scholar] [CrossRef]
  28. Oh, W.; Runkle, E.S.; Warner, R.M. Timing and duration of supplemental lighting during the seedling stage influence quality and flowering in petunia and pansy. HortScience 2010, 45, 1332–1337. [Google Scholar] [CrossRef]
  29. Franklin, K.A. Shade avoidance. New Phytol. 2008, 179, 930–944. [Google Scholar] [CrossRef]
  30. Franklin, K.A.; Whitelam, G.C. Phytochromes and shade-avoidance responses in plants. Ann. Bot. 2005, 96, 169–175. [Google Scholar] [CrossRef]
  31. Zhang, T.; Maruhnich, S.A.; Folta, K.M. Green light induces shade avoidance symptoms. Plant Physiol. 2011, 157, 1528–1536. [Google Scholar] [CrossRef]
  32. Oh, W. Effects of temperature, photoperiod and light intensity on growth and flowering in Eustoma grandiflorum. Hortic. Sci. Technol. 2015, 33, 349–355. [Google Scholar] [CrossRef]
  33. Oh, W.; Cheon, I.H.; Kim, K.S.; Runkle, E.S. Photosynthetic daily light integral influences flowering time and crop characteristics of Cyclamen persicum. HortScience 2009, 44, 341–344. [Google Scholar] [CrossRef]
  34. Tan, T.; Li, S.; Fan, Y.; Wang, Z.; Raza, M.A.; Shafiq, I.; Wang, B.; Wu, X.; Yong, T.; Wang, X.; et al. Far-red light: A regulator of plant morphology and photosynthetic capacity. Crop. J. 2022, 10, 300–309. [Google Scholar] [CrossRef]
  35. Wilson, P.J.; Thompson, K.E.N.; Hodgson, J.G. Specific leaf area and leaf dry matter content as alternative predictors of plant strategies. New Phytol. 1999, 143, 155–162. [Google Scholar] [CrossRef]
  36. Schenkels, L.; Saeys, W.; Lauwers, A.; Maurice, P. Green light induces shade avoidance to alter plant morphology and increases biomass production in Ocimum basilicum L. Sci. Hortic. 2020, 261, 109002. [Google Scholar] [CrossRef]
  37. Johkan, M.; Shoji, K.; Goto, F.; Hashida, S.N.; Yoshihara, T. Blue light-emitting diode light irradiation of seedlings improves seedling quality and growth after transplanting in red leaf lettuce. HortScience 2010, 45, 1809–1814. [Google Scholar] [CrossRef]
  38. Ilias, I.F.; Rajapakse, N. The effects of end-of-the-day red and far-red light on growth and flowering of Petunia × hybrida ‘Countdown Burgundy’ grown under photoselective films. HortScience 2005, 40, 131–133. [Google Scholar] [CrossRef]
  39. Beckwith, A.G.; Zhang, Y.; Seeram, N.P.; Cameron, A.C.; Nair, M.G. Relationship of light quantity and anthocyanin production in Pennisetum setaceum cvs. Rubrum and Red Riding Hood. J. Agric. Food Chem. 2004, 52, 456–461. [Google Scholar] [CrossRef]
  40. Kadomura-Ishikawa, Y.; Miyawaki, K.; Noji, S.; Takahashi, A. Phototropin 2 is involved in blue light-induced anthocyanin accumulation in Fragaria × ananassa fruits. J. Plant Res. 2013, 126, 847–857. [Google Scholar] [CrossRef]
  41. Zhang, T.; Folta, K.M. Green light signaling and adaptive response. Plant Signal. Behav. 2012, 7, 75–78. [Google Scholar] [CrossRef]
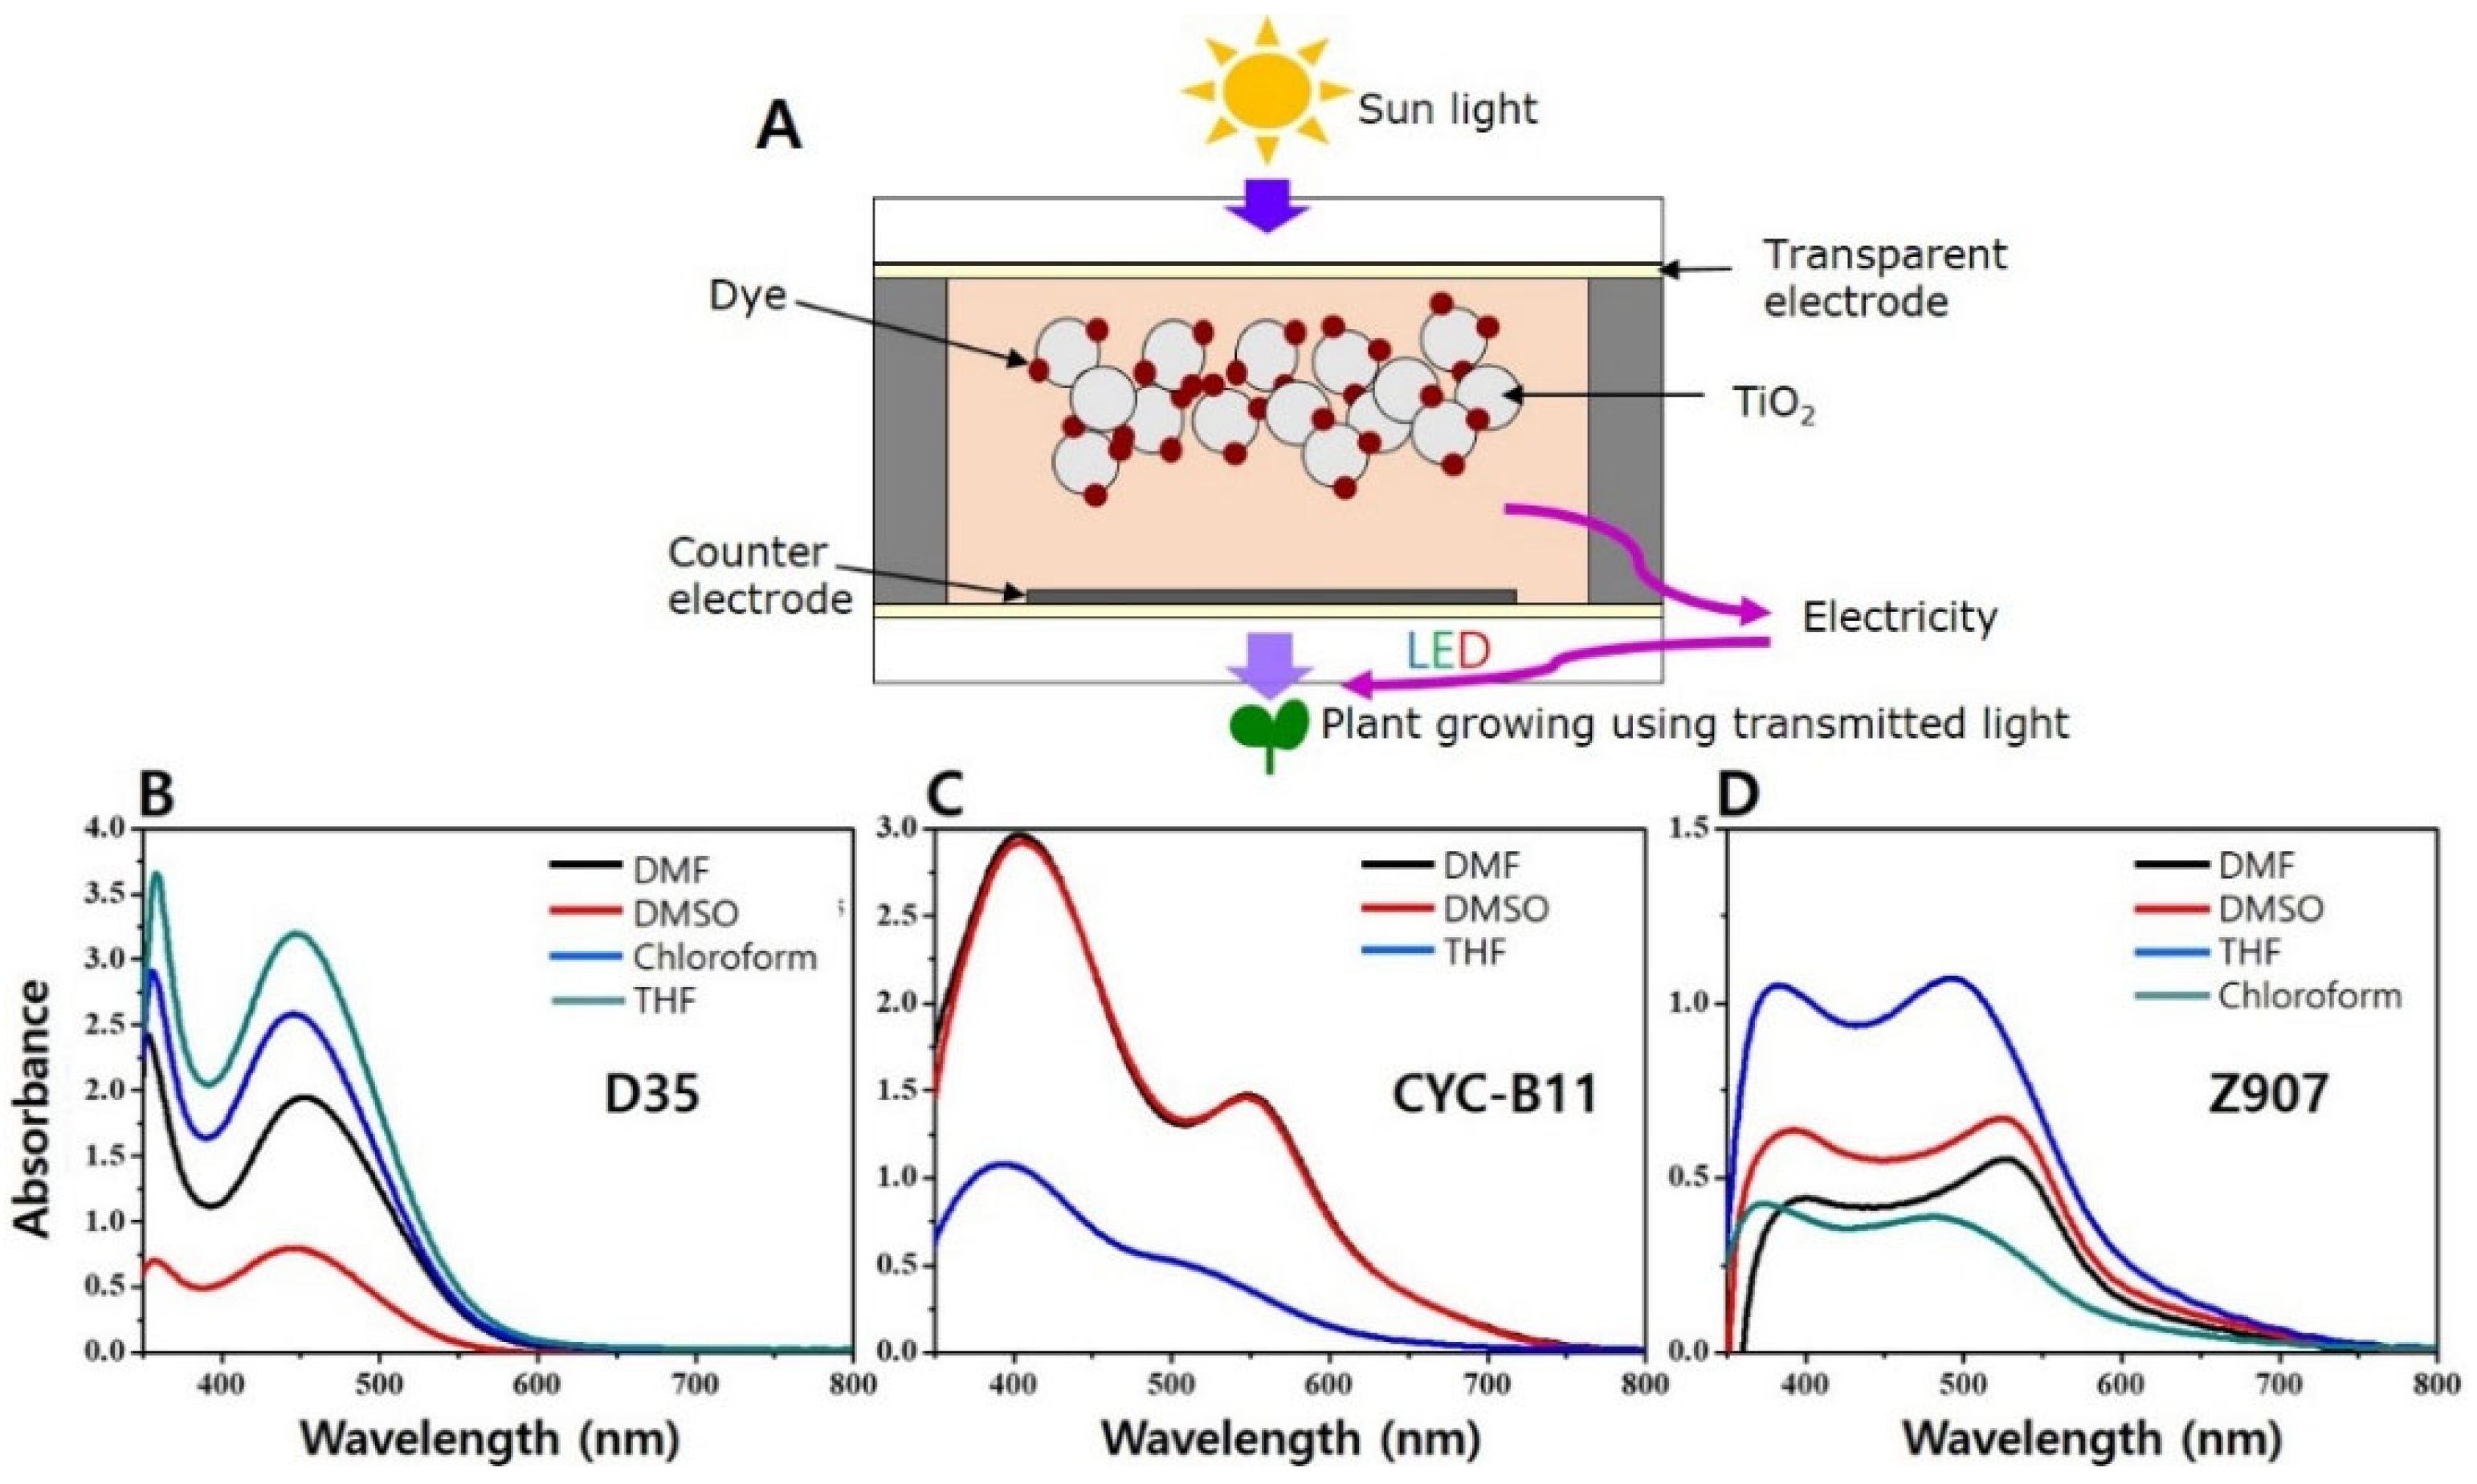
Figure 1. Conceptual diagram of dye-sensitized solar cells (DSSCs) for plant production in greenhouses (A) and absorbance of the DSSC candidates for this experiment: D35 (B), CYC-B11 (C), and Z907 (D). Solvents: DMF (N,N-dimethylformamide), DMSO (dimethylsulfoxide), THF (tetrahydrofuran), and chloroform. In this study, the electricity generated by the DSSC was not connected to illuminate the LEDs.
Horticulturae 10 00115 g001
Figure 2. The eight chambers for light treatments. The light conditions were determined by the transparent (T), shaded (S), and dye-sensitized solar cell (DSSC) (D) chambers. The DSSC chambers also comprised different light-emitting diode (LED) lighting treatments (D+L): red + blue + white (RBW), blue (B), blue + green (BG), green (G), and white (W).
Horticulturae 10 00115 g002
Figure 3. Light spectra of eight light treatments using Z907 dye-sensitized solar cells (DSSCs) and light-emitting diodes (LEDs). Light conditions were applied by transparent (T), shaded (S), DSSC (D) chambers, and DSSC chambers with different LED lighting treatments (D+L): red + blue + white (RBW), blue (B), blue + green (BG), green (G), and white (W).
Horticulturae 10 00115 g003
Figure 4. Growth characteristics of Solenostemon scutellarioides (L.) Codd ‘Highway Rose’ plants grown under different light treatment conditions involving dye-sensitized solar cells (DSSCs) and supplemental lighting with light-emitting diodes (LEDs) for 6 weeks: Plant height (A), number of leaves (B), internode length (C), stem diameter (D), shoot fresh weight (E), specific leaf weight (F), shoot dry weight (G), root dry weight (H), and S/R ratio (I). The light conditions were determined by the transparent (T), shaded (S), and DSSC (D) chambers. The DSSC chambers also comprised different LED lighting treatments (D+L): red + blue + white (RBW), blue (B), blue + green (BG), green (G), and white (W). Within-graph means followed by the same letter are not significantly different by Duncan’s multiple range test at p ≤ 0.05. Values are the means ± SE (n = 20).
Horticulturae 10 00115 g004
Figure 5. Leaf color (A), color area (B), and color distribution (C) of Solenostemon scutellarioides (L.) Codd ‘Highway Rose’ plants grown under different light treatment conditions involving dye-sensitized solar cells (DSSCs) and supplemental lighting with light-emitting diodes (LEDs) for 6 weeks. The conditions involved transparent (T), shaded (S), and DSSC chambers. The DSSC chambers comprised different LED lighting treatments (RBW, BG, B, G, and W). Within-graph means followed by the same letter within the same colors are not significantly different by Duncan’s multiple range test at p ≤ 0.05. Values are the means ± SE (n = 20) (B).
Horticulturae 10 00115 g005
Figure 6. Effects of light treatment involving dye-sensitized solar cells (DSSCs) and supplemental lighting with light-emitting diodes (LEDs) on plant morphology from above (A) and the side (B), leaf shape and color (C) of Solenostemon scutellarioides (L.) Codd ‘Highway Rose’ plants after 6 weeks of treatments. The light conditions were determined by the conditions of the transparent (T), shaded (S), and DSSC (D) chambers. The DSSC chambers also comprised different LED lighting treatments (D+L): red + blue + white (RBW), blue (B), blue + green (BG), green (G), and white (W).
Horticulturae 10 00115 g006
Figure 7. Relationship between the blue light percentage and the plant height (A), shoot fresh weight (B), specific leaf weight (C), green area (D), green and dark-red area (E), total leaf area (F), relative chlorophyll content (G), Hunter L’ (H), and a’ (I) values of Solenostemon scutellarioides (L.) Codd ‘Highway Rose’ plants grown in the dye-sensitized solar cell (DSSC) chambers with supplemental light-emitting diode (LED) lighting (RBW, BG, B, G, and W) for 6 weeks. The green light percentage (relative spectral distribution), internode length, shoot fresh weight, specific leaf weight, and leaf areas were derived from Table 2 and Figure 4C,E,F, and Figure 5B, respectively. Values are the means ± SE (n = 20). *, **, *** Significant at p ≤ 0.05, 0.01, or 0.001, respectively.
Horticulturae 10 00115 g007
Figure 8. Relationship between the green light percentage and the internode length (A), shoot fresh weight (B), specific leaf weight (C), green area (D), green and dark-red area (E), total leaf area (F), relative chlorophyll content (G), Hunter L’ (H), and a’ (I) values of Solenostemon scutellarioides (L.) Codd ‘Highway Rose’ plants grown in the dye-sensitized solar cell (DSSC) chambers with supplemental light-emitting diode (LED) lighting (RBW, BG, B, G, and W) for 6 weeks. The green light percentage (relative spectral distribution), internode length, shoot fresh weight, specific leaf weight, and leaf areas were derived from Table 2 and Figure 4C,E,F, and Figure 5B, respectively. Values are the means ± SE (n = 20). *, **, *** Significant at p ≤ 0.05, 0.01, or 0.001, respectively.
Horticulturae 10 00115 g008
Table 1. Light treatments using Z907 dye-sensitized solar cells (DSSCs) and light-emitting diodes (LEDs).
ChamberLight ConditionsNatural Light (%)Supplemental Lighting (SL) with LEDs *
TTransparent chamber (control)100An amount of 1–2 μmol·m−2·s−1 PPFD with scattered light for the same photoperiod (15 h) as LED treatments.
SChamber shaded by a neutral curtain40.9
DChamber covered with DSSCs40.4
D+L(B)DSSC + blue LED41.2An amount of 60 μmol·m−2·s−1 PPFD with different colored LEDs in the DSSC chamber. The photoperiod was set to 15 h (05:00–20:00). The LEDs turned on when natural light was less than 300 μmol·m−2·s−1 PPFD.
D+L(G)DSSC + green LED40.0
D+L(BG)DSSC + blue and green LED40.7
D+L(W)DSSC + cool white LED40.4
D+L(RBW)DSSC + red, blue, and white LED41.3
* SL with LEDs added 10–20% of the daily light integral from sunlight.
Table 2. Spectral photon fluxes and relative distribution in each chamber under shaded cloth; dye-sensitized solar cell (DSSC); and blue (B), green (G), red (R), and white (W) light-emitting diode (LED) conditions measured at noon on a clear day.
Light ChamberPhoton Flux Density (µmol∙m−2∙s−1)Light Transmittance y (%)Relative Spectral Distribution (%)RatioDLI x
(mol∙m−2∙d−1)
DLI
(%)
B zGRFRPARPAR + FRPARPAR + FRBGRFRB:RR:FR
Transparent (T)1962973172698101079100100192931210.621.1816.52100
Shaded (S)8913314312636549145.145.5192831220.621.136.7540.9
DSSC (D)417018919030049037.045.491642340.220.996.6740.4
D+L(B)1627119019242361552.257.0261231310.850.999.4757.3
D+L(G)4118619119141860951.656.473031310.211.009.3656.7
D+L(BG)9913018818941760651.556.2162131310.530.999.4457.1
D+L(W)7512721819342061351.956.8122135310.341.139.4056.9
D+L(RBW)9110123819243062253.157.6151639310.381.249.6158.2
z B—blue: 400–500 nm; G—green: 500–600 nm; R—red: 600–700 nm; FR—far-red: 700–800 nm; and PAR—photosynthetically active radiation: 400–700 nm. y Light transmittance (%): the sum of sunlight and LED light divided by the value of the T treatment. x Daily light integral (DLI) is the daily integration value of the photosynthetic photon flux density (400–700 nm).
Table 3. Leaf color index and relative chlorophyll content of Solenostemon scutellarioides (L.) Codd ‘Highway Rose’ plants grown under different light treatment conditions involving dye-sensitized solar cells (DSSCs) and supplemental lighting with light-emitting diodes (LEDs) for 6 weeks.
Light Chamber zHunter’s ValueRelative Chlorophyll Content (SPAD)
Pink AreaDark-Red AreaGreen Area
LabLabLab
T35.86 c y59.21 ab7.79 a- x--56.92 a−21.65 a40.10 a31.2 c
S41.98 a57.44 bc2.06 b---50.51 b−21.19 a33.04 b37.6 ab
D39.95 ab56.46 c3.04 b---47.01 c−22.09 a35.17 ab39.5 a
D+L(RBW)28.92 e55.44 cd9.42 a16.86 b13.13 a2.56 b---37.1 ab
D+L(B)30.33 de59.83 a7.14 a21.30 a12.34 a6.08 a---30.8 c
D+L(BG)30.85 de57.36 bc8.82 a17.20 b12.38 a3.11 b---34.2 bc
D+L(G)39.63 ab55.06 d7.65 a---53.62 b−21.74 a37.97 ab39.9 a
D+L(W)32.93 d58.39 ab6.76 a20.11 a13.37 a4.33 ab---35.5 b
z Transparent (T), shaded (S), and DSSC chambers. The DSSC chambers comprised different LED lightings (RBW, BG, B, G, and W). y Within-column means followed by the same letter are not significantly different by Duncan’s multiple range test at p ≤ 0.05. x No measurement due to the very narrow leaf area.
Disclaimer/Publisher’s Note: The statements, opinions and data contained in all publications are solely those of the individual author(s) and contributor(s) and not of MDPI and/or the editor(s). MDPI and/or the editor(s) disclaim responsibility for any injury to people or property resulting from any ideas, methods, instructions or products referred to in the content.