Article

Optimization of Cannabinoid Production in Hemp Through Methyl Jasmonate Application in a Vertical Farming System

1
Department of Horticultural Science, Chungnam National University, Daejeon 34134, Republic of Korea
2
Department of Bio-AI Convergence, Chungnam National University, Daejeon 34134, Republic of Korea
3
Institute of Agricultural Science, Chungnam National University, Daejeon 34134, Republic of Korea
*
Author to whom correspondence should be addressed.
Horticulturae 2024, 10(11), 1165; https://doi.org/10.3390/horticulturae10111165
Submission received: 9 October 2024 / Revised: 29 October 2024 / Accepted: 31 October 2024 / Published: 1 November 2024

Abstract

:
Cannabis sativa, a versatile plant containing over 150 cannabinoids, is increasingly valued for its medicinal properties. It is classified into hemp and marijuana based on its Δ9-tetrahydrocannabinol (Δ9-THC) content. The objective of this study was to optimize cannabinoid production in hemp within a vertical farming system by investigating the effects of methyl jasmonate (MeJA) on plant growth and specific cannabinoid contents. After propagating hemp plants, they were treated with various concentrations of MeJA (0, 100, 200, and 400 μM). Plant growth parameters, glandular trichome (GT) density, and the contents of specific cannabinoids—cannabidiolic acid (CBDA), cannabidiol (CBD), tetrahydrocannabinolic acid (THCA), and Δ9-THC—were analyzed. The results showed that MeJA treatment decreased plant height and leaf area while increasing GT density and the synthesis of CBDA and THCA at lower concentrations. Specifically, treatment with 100 μM MeJA provided optimal conditions for enhancing cannabinoid production while controlling plant height, which is advantageous for vertical farming. These findings suggest that precise application of MeJA in controlled environments can increase yields of valuable cannabinoids with efficient use of space, thereby enhancing the commercial and medicinal value of hemp.

1. Introduction

Cannabis sativa, an ancient plant known by various names, has been utilized for fiber, food, and medicine [1,2]. C. sativa is significant as a medicinal plant, with over 150 cannabinoids and various compounds discovered [3,4,5]. Cannabinoids primarily have structures involving a monoterpene isoprenyl moiety (C10) and pentyl side chain (C5). Representative forms include acidic forms such as tetrahydrocannabinolic acid (THCA), cannabidiolic acid (CBDA), cannabichromenic acid (CBCA), and cannabigerolic acid (CBGA), and neutral forms such as Δ9-tetrahydrocannabinol (Δ9-THC), cannabidiol (CBD), cannabichromene (CBC), and cannabigerol (CBG) [4,6]. In the biosynthesis pathway, cannabinoids were initially produced in acidic forms, which were then transformed into neutral forms through decarboxylation and cyclization processes [7]. According to the 2018 U.S. Farm Bill, medicinal cannabis (hemp, Δ9-THC < 0.3%) was excluded from the Controlled Substances Act, bringing attention to the CBD of hemp [8]. CBD, a non-psychoactive compound, has been reported to have therapeutic effects on conditions such as epilepsy, anxiety, and chronic pain [9,10,11,12,13,14,15].
The global demand for medicinal plants is on the rise as their usage becomes more prevalent [16]. The World Health Organization (WHO) reported that about 80% of the global population depends on medicinal plant-based treatments for primary healthcare [17]. The production of secondary metabolites in plants can be significantly influenced by environmental stressors and elicitors, which stimulate their accumulation [18]. Biotechnological methods, particularly elicitation, are widely applied to enhance the production of secondary metabolites, which are essential for both biomass growth and the accumulation of pharmacologically active compounds [19,20]. Elicitation, the process of stimulating secondary metabolite production, can be achieved through the use of biological and non-biological elicitors [21]. Biological elicitors include polysaccharides, proteins, glycoproteins, and components from fungal and plant cell walls (such as cellulose and pectin), as well as microorganisms like chitin and glucan. In contrast, non-biological elicitors consist of chemical agents (such as heavy metal salts, vanadyl sulfate, and sodium orthovanadate) and physical factors (such as thermal stress, osmotic stress, UV irradiation, and wounding) [22]. Among these, methyl jasmonate (MeJA) stands out as one of the most effective elicitors, functioning as a plant hormone inducer that significantly enhances both plant growth and the production of secondary metabolites [16].
Several studies have reported the effects of MeJA on plant growth and secondary metabolite production [18,23,24,25,26,27,28,29]. JA and its methyl ester MeJA have various biological effects, including leaf senescence, abscission, stomatal closure, β-carotene and ethylene synthesis, and inhibition of root growth [27,29]. Moreover, JA and MeJA are pivotal in the signaling pathways that regulate plant defense responses, which are strongly linked to the increased production of secondary metabolites [18,28].
With the advancement of protected agriculture and vertical farming technologies, there has been a growing interest in utilizing these systems to produce high-quality crops under precisely controlled conditions [30]. Vertical farms, in particular, provide an ideal environment for applying biotechnological approaches like elicitation, allowing for the efficient regulation of plant growth and the optimization of secondary metabolite production, including valuable cannabinoids in C. sativa [31,32]. This controlled environment presents a unique opportunity to maximize the benefits of elicitors such as MeJA, offering both space-efficient cultivation and enhanced cannabinoid yields.
This study investigated how the growth and cannabinoid content of hemp change in response to different concentrations of MeJA within a vertical farming system. The aim of this study is to explore the potential use of MeJA specifically for hemp in vertical farming systems and to determine the optimal concentrations for its application. The results of this study can be applied to enhance cannabinoid production in hemp grown in vertical farms, thereby increasing the commercial and medicinal utility of hemp. Thus, this study is expected to provide a new strategy for regulating the growth and cannabinoid content of hemp through the appropriate concentrations of elicitors.

2. Materials and Methods

2.1. Plant Cultivation

The experiment was conducted based on the cultivation method of Hahm et al. [33]. Feminized hemp (C. sativa L. ‘Hot blond’) seeds were sourced from Blue Forest Farms (Blue Forest Farms Co., Ltd., Long Beach, CA, USA). The ‘Hot blond’ cultivar was selected for its high CBD content and robust growth characteristics, making it suitable for this study. After growing the mother plant, which was approximately 10 months old, to a height of 1.7 ± 0.2 m, stem cuttings (3–4 true leaves) were taken and propagated [34]. The stem cuttings were induced to form adventitious roots for three weeks in a chamber set to a light intensity of 100 ± 6 μmol·m−2·s−1 under blue light, with a photoperiod of 20/4 h (light/dark), a temperature of 25 °C, and a relative humidity of 90%. Uniform plants with a height of 12.6 ± 1.3 cm were selected from those that had completed root induction. Plants were transplanted into rock wool cubes, with a total of 24 plants, six plants per treatment group. The plants were then transferred to a vertical farm cultivation bed, planted on rock wool slabs. The environmental conditions were set to a temperature of 25 ± 1.2 °C, humidity of 70 ± 6%, photoperiod of 18/6 h (light/dark), and light intensity of 400 ± 31.7 μmol·m−2·s−1 for the vegetative growth stage, and light intensity was measured using a spectrometer (LI-180, LICOR, Lincoln, NE, USA). After three weeks of vegetative growth, the plants were transitioned to the reproductive growth stage. Spacing adjustments were made to account for light competition due to shoot development. The conditions for the reproductive growth stage were maintained the same as the vegetative growth stage, except the photoperiod was changed to 12 h light/12 h dark and the light intensity to 500 ± 35.1 μmol·m−2·s−1 for six weeks. The light quality was the same during both vegetative and reproductive growth phases (Figure 1). The nutrient solution (Hoagland solution; N 14.6 me·L−1, P 1 me·L−1, K 6 me·L−1, Ca 7.6 me·L−1, Mg 4 me·L−1, and S 4 me·L−1) concentration for irrigation was maintained at EC 2.0 ± 0.2 dS·m−1 and pH 6.5 ± 0.3, and the changes in EC and pH of the nutrient solution were measured every morning at 9 am using an EC meter (HI 98130, HANNA instrument, Warwick, RI, USA). The hemp plants were grown for a total of nine weeks using a drip irrigation system.

2.2. Methyl Jasmonate Treatment

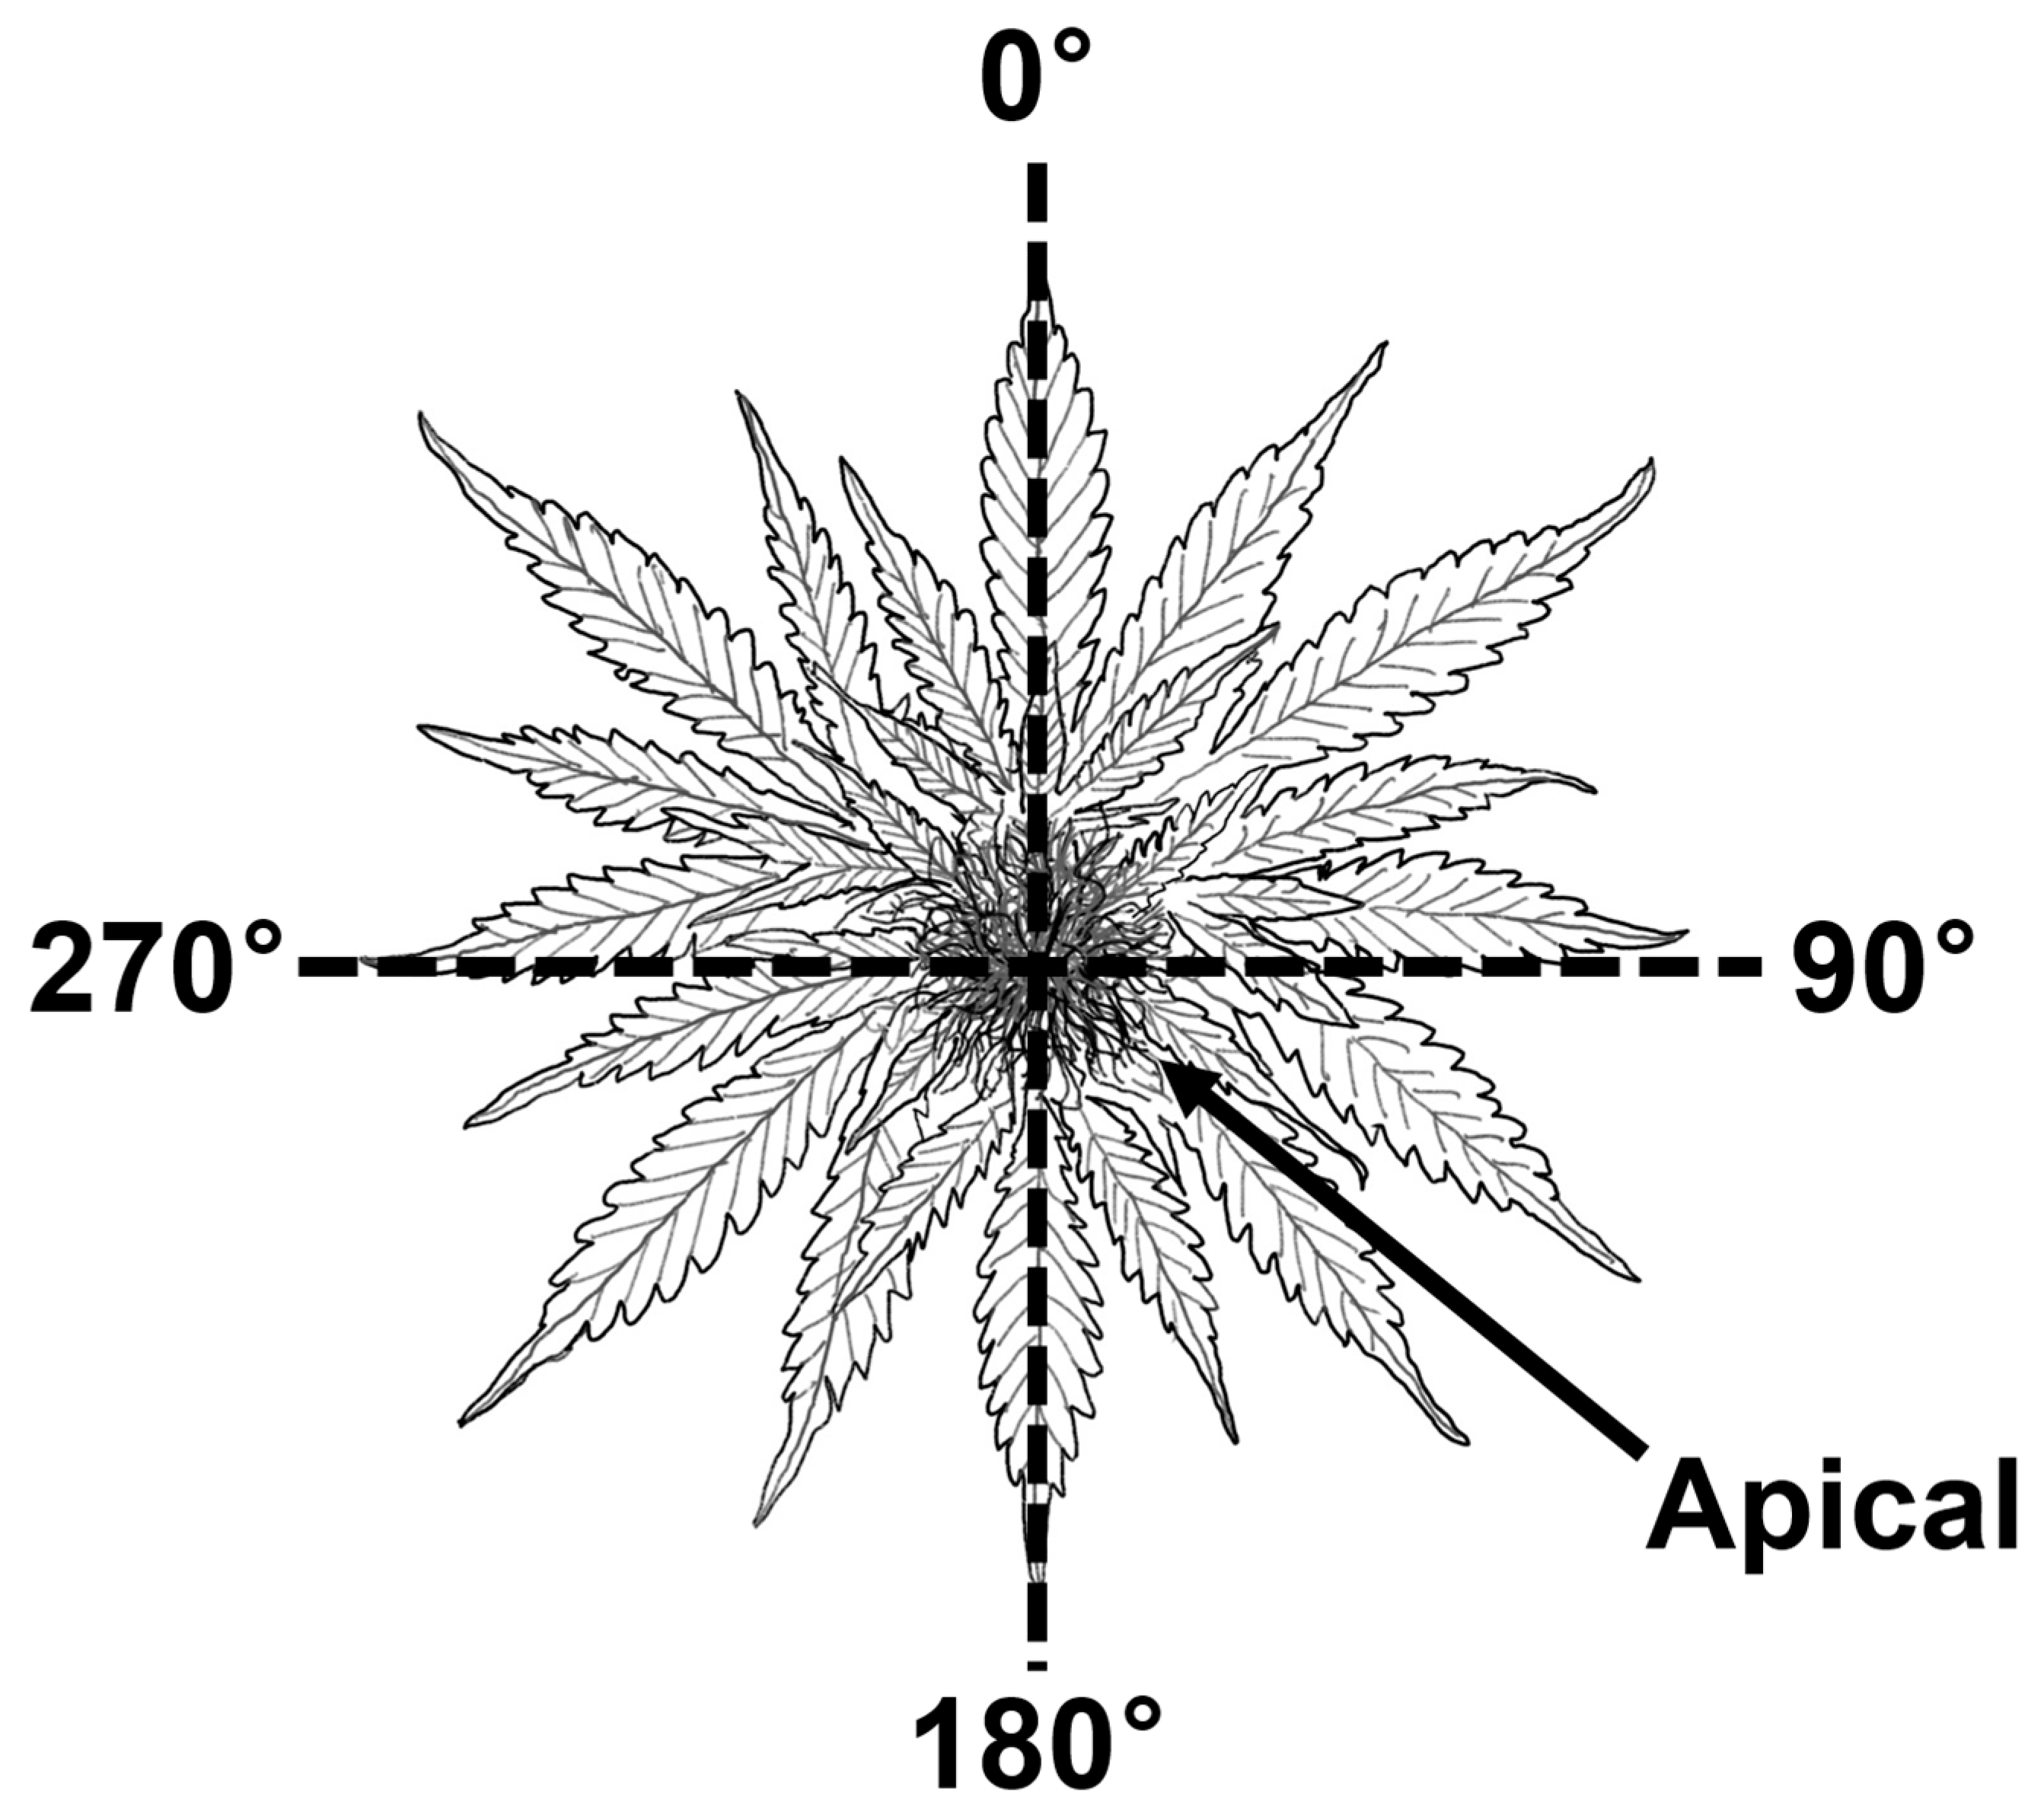
The experiment was modified from the method of Rahimi et al. [35]. MeJA (Sigma-Aldrich, St. Louis, MO, USA) was diluted to concentrations of 0 (control, non-treatment), 100, 200, and 400 μM, and foliar spray (28 mm Trigger sprayer and HDPE Bottle) was conducted. Using a sprayer that dispenses 1 mL per pump, each plant was treated with 5 pumps per section (0°, 90°, 180°, 270°) (Figure 2) and additional pumps were applied where needed, totaling 25 pumps (25 mL) per plant. Treatments were applied twice, on the 0th and 21st day after the transition to reproductive growth. The MeJA treatments on the 0th and 21st day of the reproductive growth phase are strategic measures to maximize the synthesis of secondary metabolites during the early and late stages of development, respectively [36,37,38].

2.3. Analysis of Plant Growth Parameters

Plant growth analysis was conducted by examining three plants per treatment group. After harvest, leaves were collected from the upper (apex), middle (11th node), and lower (3rd node) sections of the hemp plant, and leaf length (mm) and width (mm) were measured using a ruler. Stem diameter (mm) was measured using calipers (SD500-300PRO, Shin Con Co., Ltd., Anyang, Republic of Korea), and plant height (cm) was measured from the base to the apex using a ruler. Leaf area (cm2/plant) was measured using a leaf area meter (Li-3100, LICOR, USA), and fresh weight (stem fresh weight, SFW; leaf fresh weight, LFW; inflorescence fresh weight, infFW; g/plant) was measured using an electronic scale (MW-2N, CAS Co., Ltd., Yangsan, Republic of Korea). For dry weight (stem dry weight, SDW; leaf dry weight, LDW; inflorescence dry weight, infDW; g/plant) measurement, samples were dried for seven days in a freeze-dryer (−70 °C, TFD550, Ilshin BioBase Co., Ltd., Dongducheon, Republic of Korea) and weighed using the same electronic scale. The use of a freeze-dryer for measuring dry weight was selected to preserve the structural integrity of cannabinoids, as it mitigates the risk of degradation or loss that can occur with conventional drying methods due to thermal exposure [39].

2.4. Glandular Trichome Density Measurement

For glandular trichome (GT) density measurement, five calyxes were collected from each plant, as shown in Figure 3 (n = 5, 3 repetitions). Images were obtained at 20× magnification using an electron microscope (MM-300, CARSON, Santa Monica, CA, USA). The number of GTs on a 6 × 4 mm leaf surface area was counted using ImageJ software (version 1.53t, National institutes of Health, Bethesda, MD, USA), and the density was calculated per mm2. The final graphs were prepared using Sigmaplot (10.0, Systat Software, Inc., San Jose, CA, USA).

2.5. Analysis of Phytocannabinoids Using HPLC

The analysis of cannabinoids in hemp was conducted by adapting the methods of Hädener et al. [40] and Hahm et al. [33]. Leaves and inflorescences were collected separately from nine-week-old female hemp plants (with each treatment having three samples and three repetitions), then dried for seven days using a freeze-dryer (−70 °C, TFD550, Ilshin BioBase Co., Ltd., Republic of Korea). The dried samples were ground into a fine powder with a mortar and pestle. A portion of the powder (100 mg) was placed in a 2.0 mL tube, mixed with a solution of MeOH (9:1; 2 mL), vortexed for 1 min, and sonicated for 20 min at 25 °C (powersonic420, Hwashin Tech Co., Ltd., Daegu, Republic of Korea) to extract the cannabinoids. After sonication, the mixture was vortexed again for 1 min and centrifuged at 13,000 rpm for 5 min to obtain the supernatant. The supernatant was filtered using a 0.2 μm syringe filter (25HP020AN, Advantech Co., Ltd., Asan, Republic of Korea) and transferred to HPLC vials (1 mL per sample) for analysis. The HPLC system used included an Agilent 1260 Infinity II binary pump (G7112B), vial sampler (G7129C), multi-column thermostat (G7116A), and diode array detector HS (G7117C), all from Agilent Technologies Inc. (Santa Clara, CA, USA). Chromatographic separation was carried out on a Poroshell 120 EC-C18 column (4.6 × 50 mm, 2.7 µm, Agilent Technologies Inc.) using a gradient elution with mobile phase A (water with 0.1% formic acid, reagent-grade, >96%, Sigma-Aldrich, Saint Louis, MO, USA) and mobile phase B (acetonitrile with 0.1% formic acid, HPLC-grade, Ducsan Pure Chemical Co., Ltd., Incheon, Republic of Korea). The flow rate was 1 mL·min−1, and the oven temperature was maintained at 25 °C. The gradient conditions were 0–5 min at 55% B, 5–25 min increasing to 85% B, 25–30 min at 85% B, 30–30.1 min decreasing to 55% B, and 30.1–35 min at 55% B. The injection volume was 10 µL, with the entire spectrum recorded from 200 to 800 nm, and quantification was performed at a detection wavelength of 210 nm. Cannabinoid standards for CBDA (CAS No. 1244-58-2) [41] and CBD (CAS No. 13956-29-1) [42] were purchased from Lipomed (Arlesheim, Switzerland), while THCA (CAS No. 23978-85-0) [43] and Δ9-THC (CAS No. 1972-08-3) [44] were obtained from Sigma-Aldrich (St. Louis, MO, USA). These standards helped determine retention times and prepare six-point calibration curves for each cannabinoid. The chromatograms obtained from HPLC analysis were used to visualize the separation and quantification of the cannabinoids (Figure S1). Calibration verification standards were injected at the beginning of each analysis day to confirm retention times and quantification accuracy. Quantification was based on calibration curves ranging from 50 to 1000 µg·mL−1, with linear equations y = 32.251x + 19.131 for CBDA (r2 = 0.99), y = 83.907x − 24.125 for CBD (r2 = 0.99), y = 31.180x + 35.423 for THCA (r2 = 0.99), and y = 86.082x − 0.954 for Δ9-THC (r2 = 0.99). All experiments were performed in triplicate.

2.6. Yield of Major Cannabinoids

To calculate the total yield of major cannabinoids (mg/plant DW), the results of the HPLC analysis and plant growth parameters were combined. The TotalCBD and TotalΔ9-THC content (mg∙g−1 DW) present in the inflorescences and leaves of the control and treatment groups were multiplied by the dry weight of each inflorescence (infDW, g/plant) and leaf (LDW, g/plant). The calculated yields of major cannabinoids from inflorescences and leaves were individually summed for CBD and Δ9-THC yield (mg/plant DW).

2.7. Statistical Analysis

The analysis of hemp growth and cannabinoid content was performed using ANOVA tests with the SPSS program (Version 22.0.0.1, SPSS Inc., Armonk, NY, USA), and the significance between means was tested using Tukey’s multiple range test (p ≤ 0.05). To understand the trends in the production of CBD and Δ9-THC, primary and secondary regression analyses were conducted using the SPSS program. Additionally, Pearson’s correlation coefficient analysis was performed using the SPSS program to analyze the correlation between growth and cannabinoid content.

3. Results

3.1. Growth Parameter Analysis

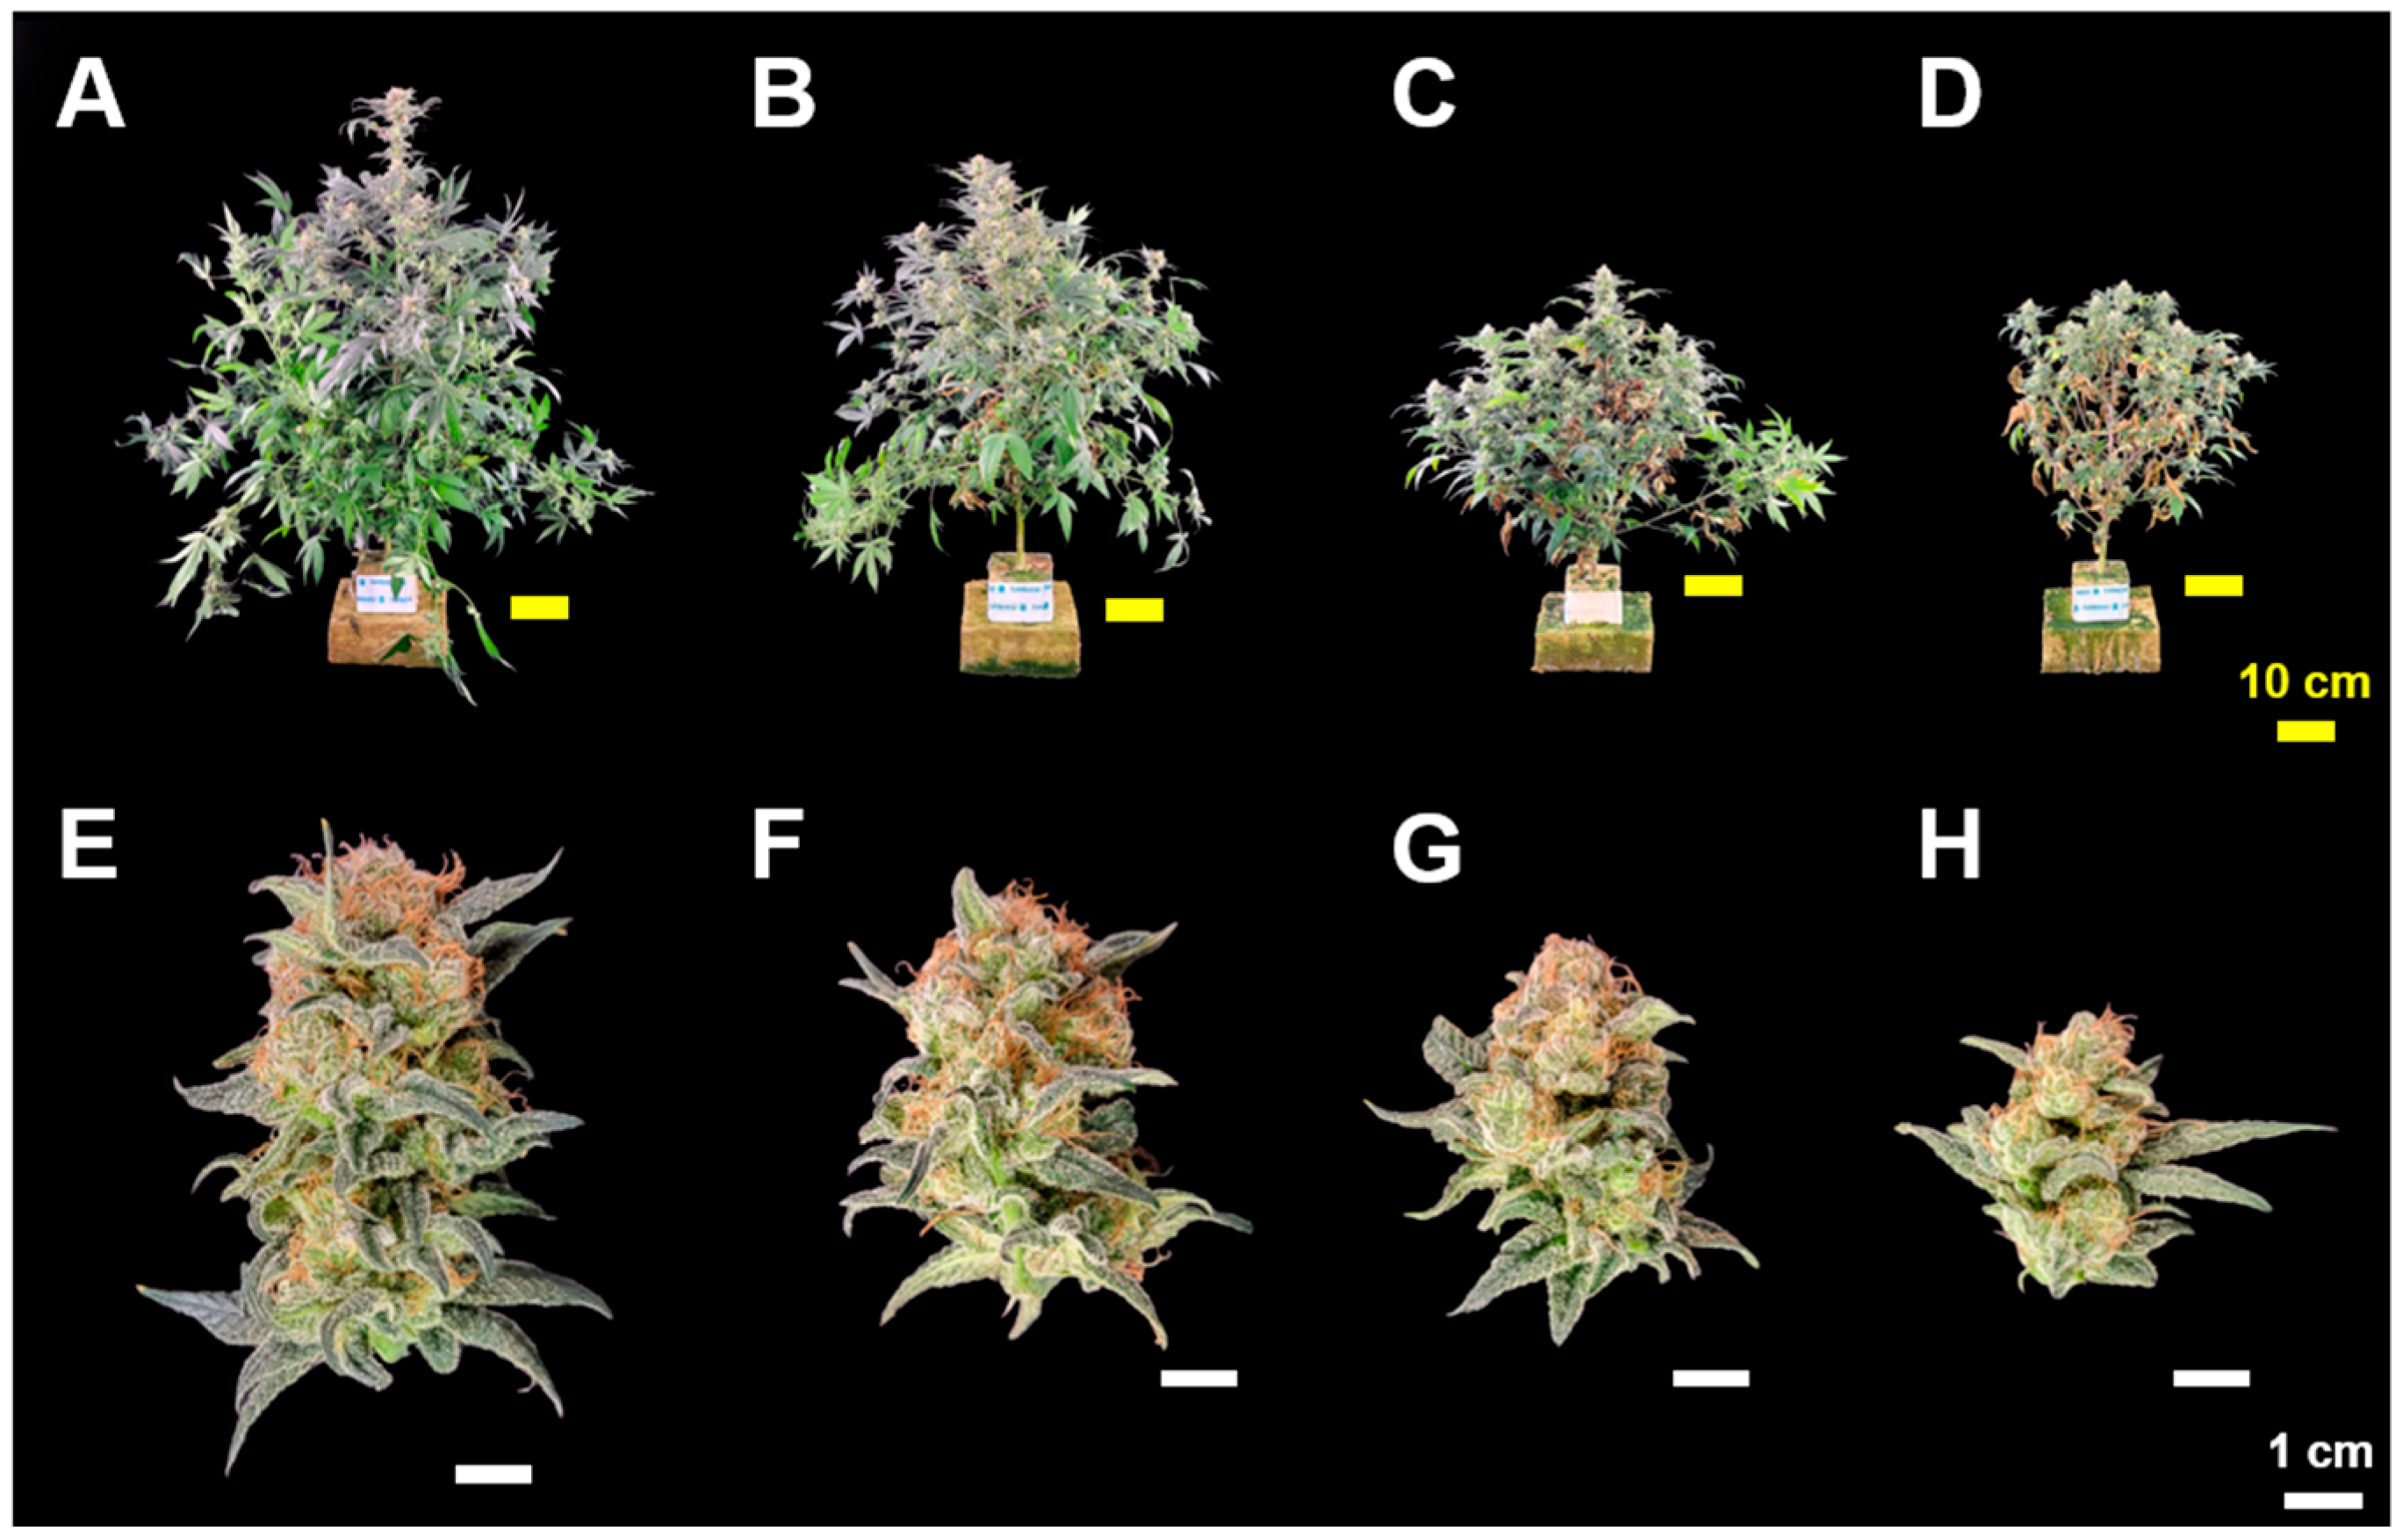
This study compared the effects of MeJA on hemp growth. Increasing MeJA concentrations led to overall growth decreases (Figure 4).
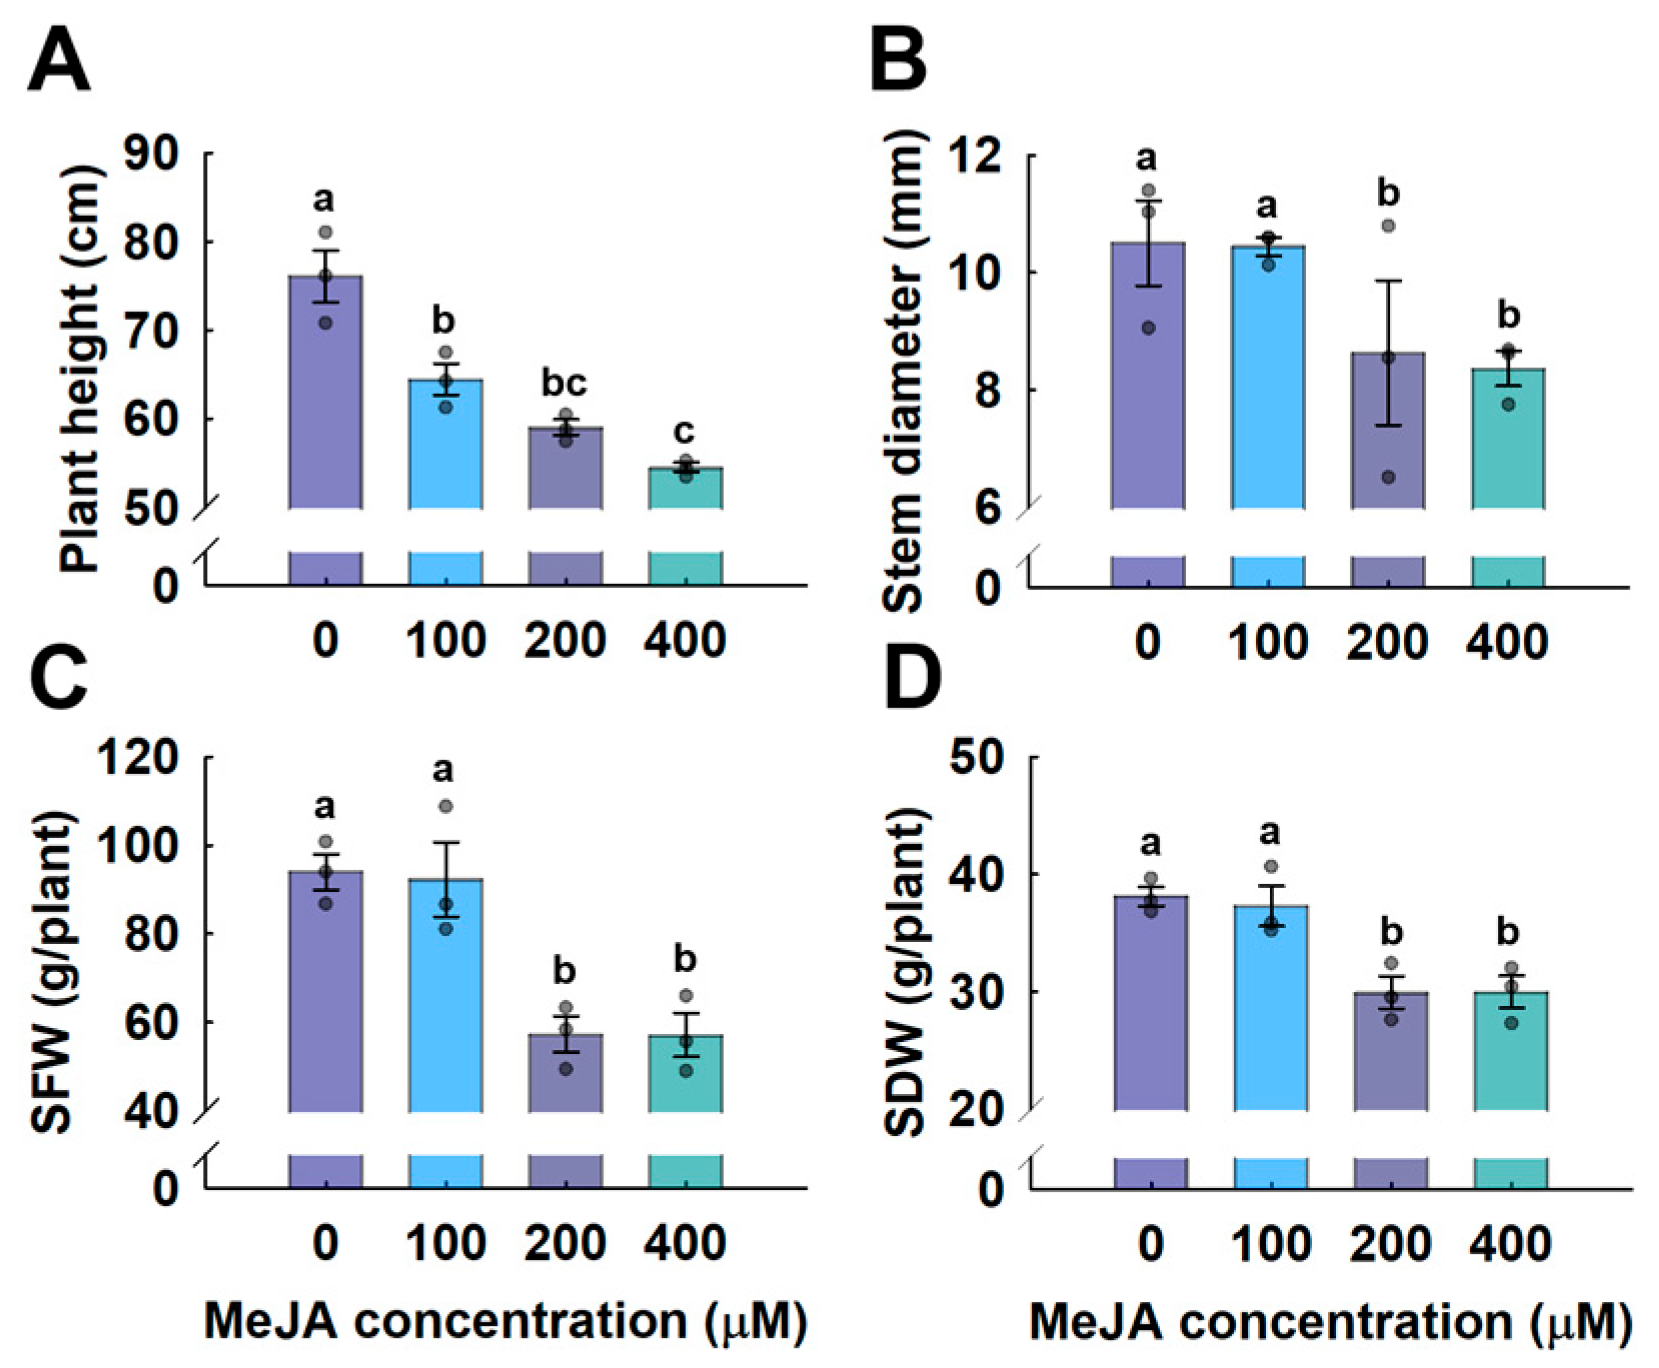
Plant height was highest in the control (76.0 cm) and decreased by 5.83% and 7.08% in the MeJA 200 μM and 400 μM groups, respectively (Figure 5A). The stem diameter also decreased (Figure 5B). SFW and SDW decreased by approximately 39% in the 200 μM and 400 μM MeJA groups (Figure 5C,D).
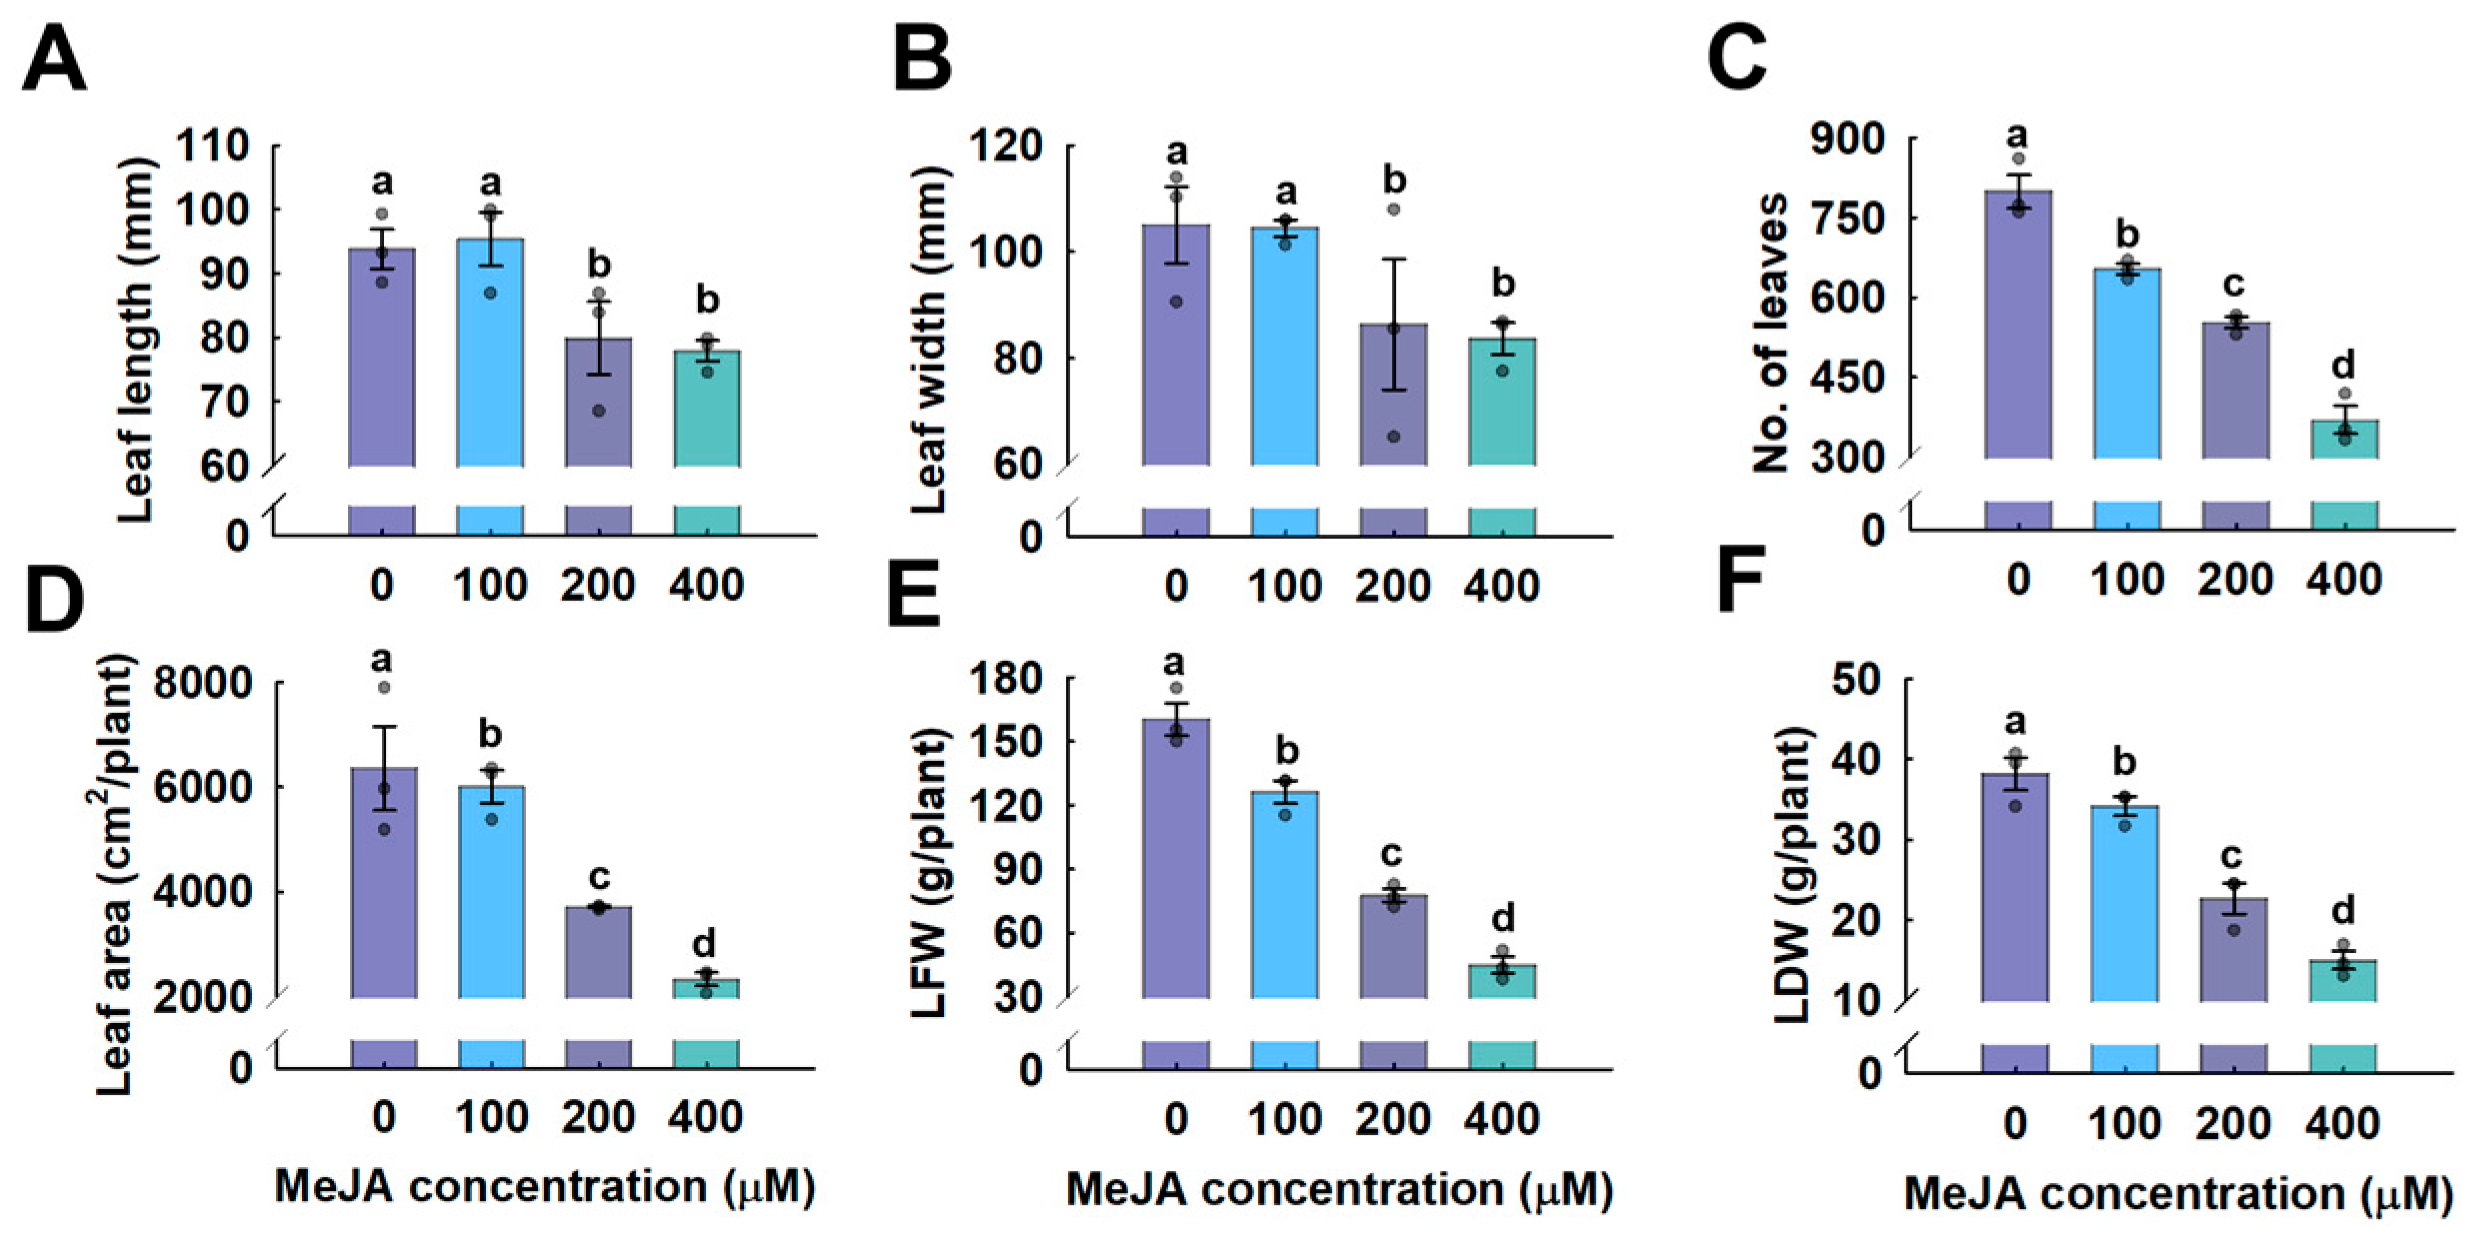
For leaves, no significant differences in length and width were observed between the control and the MeJA 100 μM treatments. However, leaf length and width decreased by 14.80–20.95% in the MeJA 200 μM and 400 μM treatments (Figure 6A,B). The number of leaves and leaf area significantly decreased with higher MeJA concentrations (Figure 6C,D). LFW and LDW tended to decrease, with significant differences at all MeJA concentrations (Figure 6E,F).
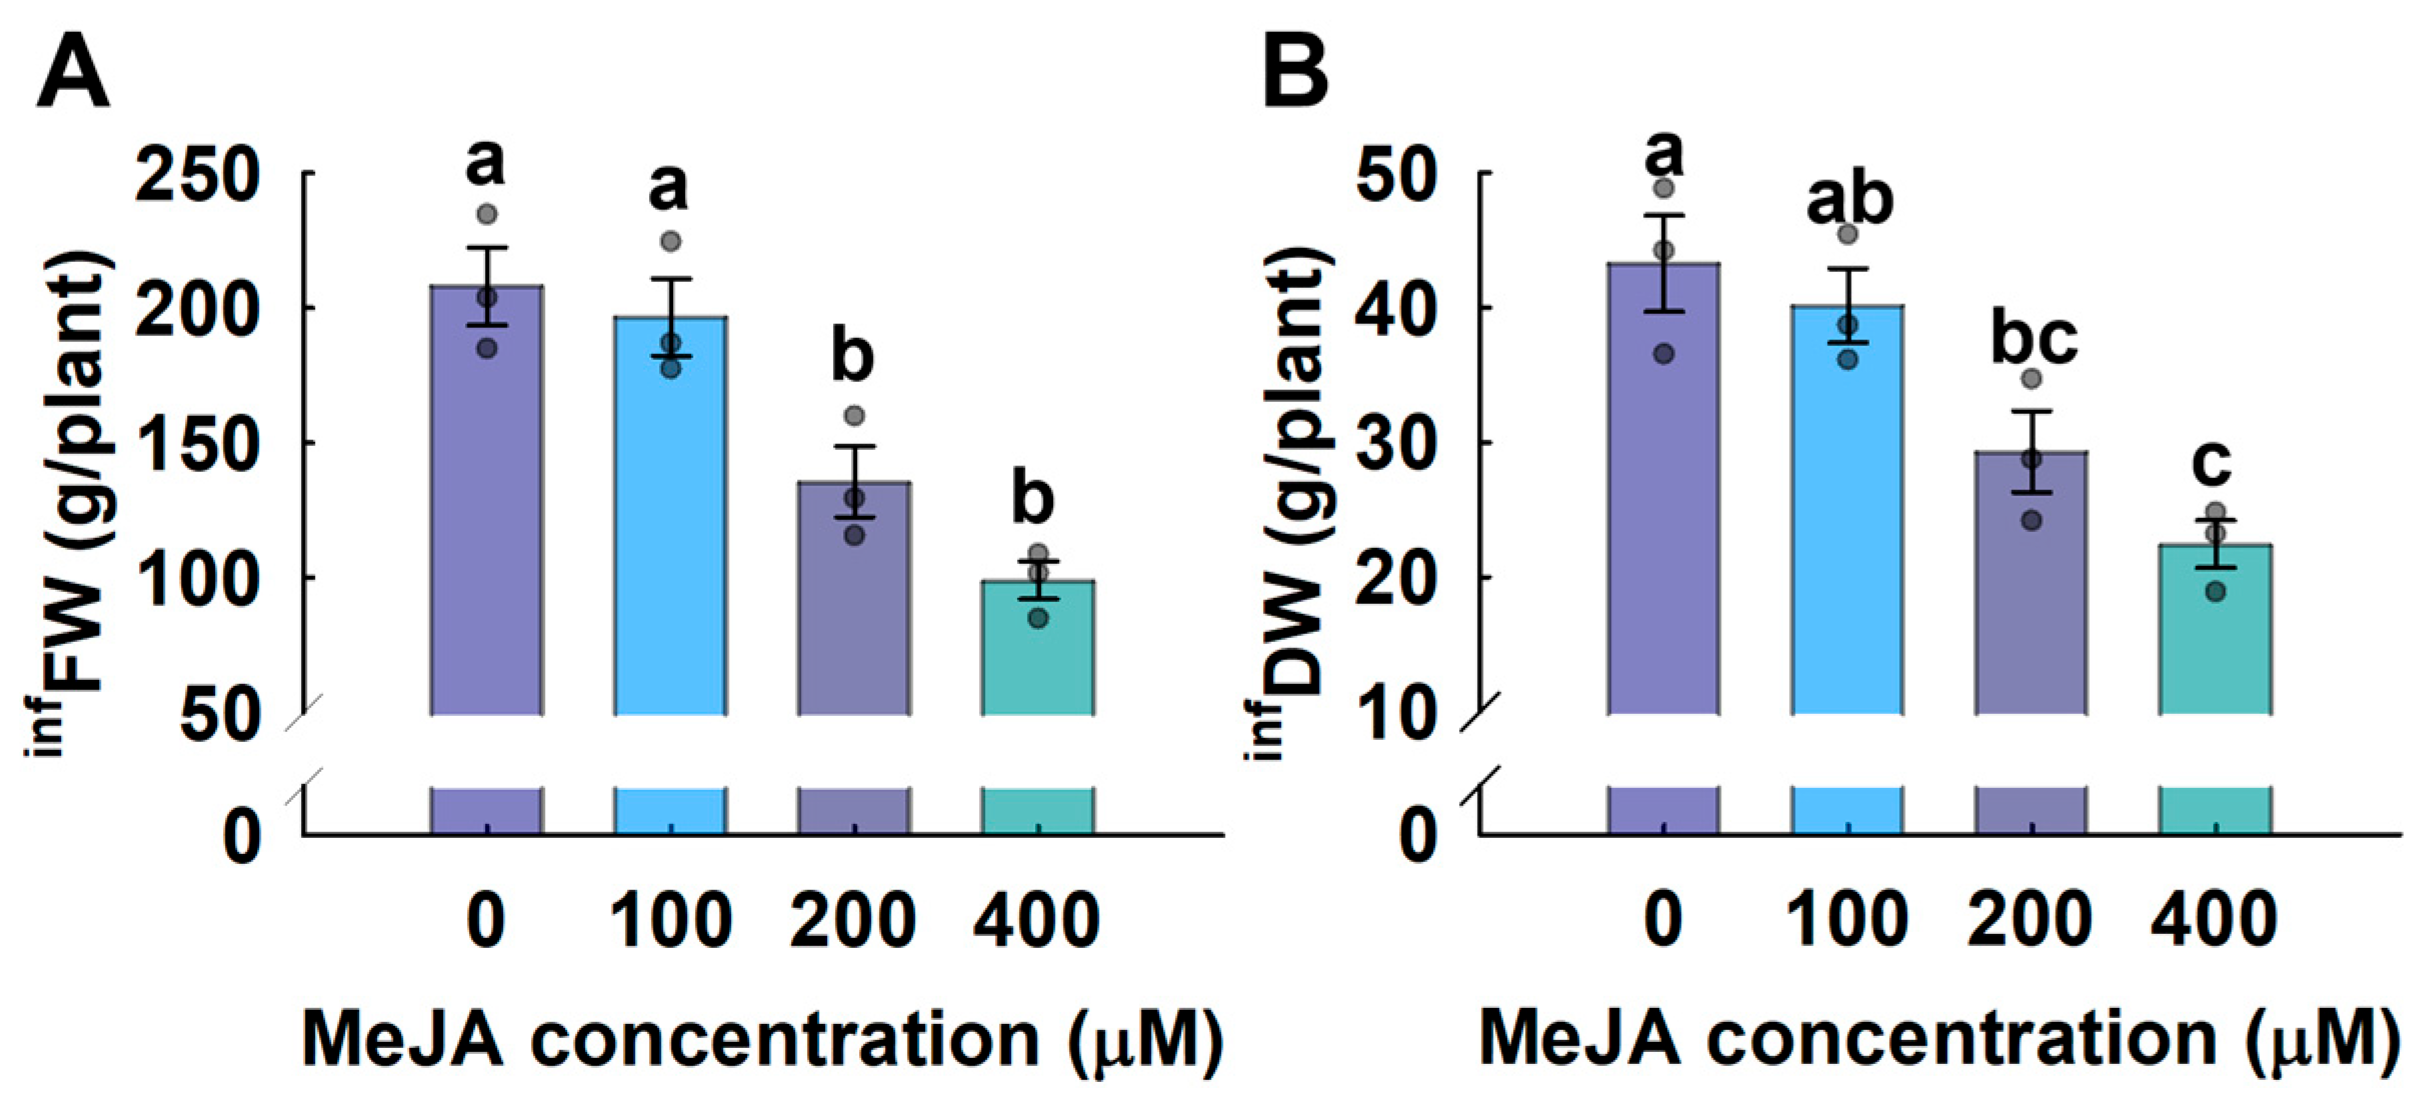
For inflorescences, it was observed that as the concentration of MeJA increased, the size of terminal inflorescences decreased (Figure 4E–H). There was no significant difference in infFW between the control (208.03 g/plant) and MeJA 100 μM treatments (196.61 g/plant), but there was a tendency for the infFW to decrease as the concentration increased (Figure 7A). The infDW showed a similar trend to the infFW (Figure 7B).

3.2. Glandular Trichome Density Analysis

MeJA treatment was observed to promote the development of GT (Figure 8A–D). Measurement results of GT density showed the lowest count in the control, with an average of 17.8 trichomes·mm−2, and the highest in the MeJA 100 μM group with an average of 32.0 trichomes·mm−2. The MeJA 200 μM and MeJA 400 μM treatment groups had 25.9 and 24.8 trichomes·mm−2, respectively, with no significant difference between. The GT density increased by 79.78% in the MeJA 100 μM group compared to the control, showing the highest increase among all treatments (Figure 8E).

3.3. Cannabinoid Content Analysis Using HPLC

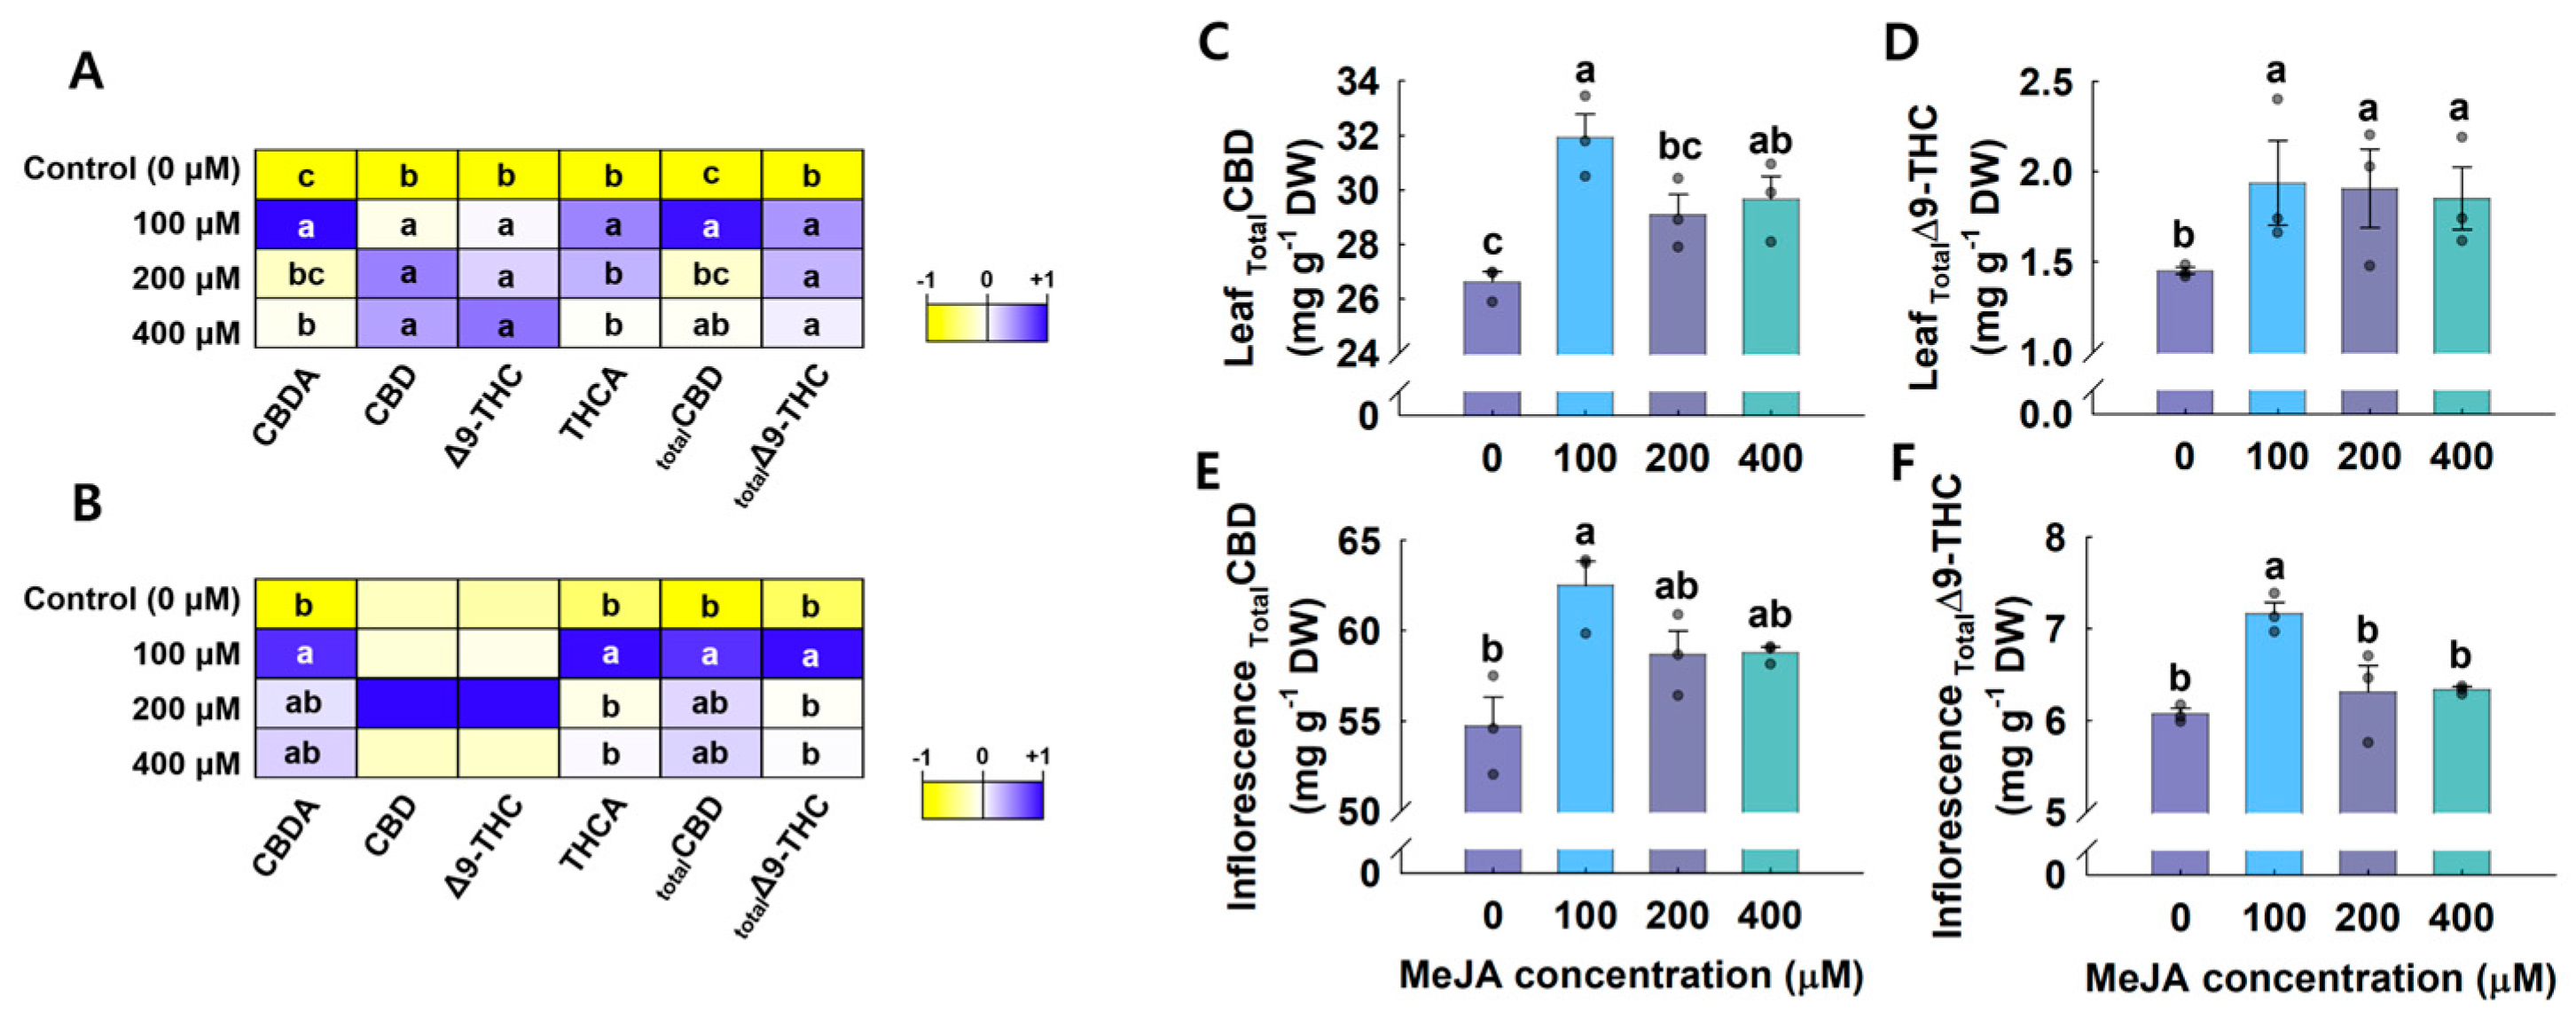
This study examined how MeJA treatments affected cannabinoid content in hemp (Figure 9). For MeJA treatment, the highest CBDA content in leaves was found the MeJA 100 μM group (35.68 mg∙g−1 DW); the TotalCBD and TotalΔ9-THC contents increased by 19.81% and 33.10%, respectively, compared to the control (Figure 9A,C,D). In inflorescences, CBDA and TotalCBD contents were highest in the MeJA 100 μM group, with increases of 14.17% for TotalCBD and 17.95% for TotalΔ9-THC compared to the control (Figure 9B,E,F). MeJA at 200 and 400 μM resulted in lower accumulation of TotalCBD and TotalΔ9-THC in both leaves and inflorescences compared to the 100 μM treatment (Figure 9).

3.4. Correlation Coefficient Analysis

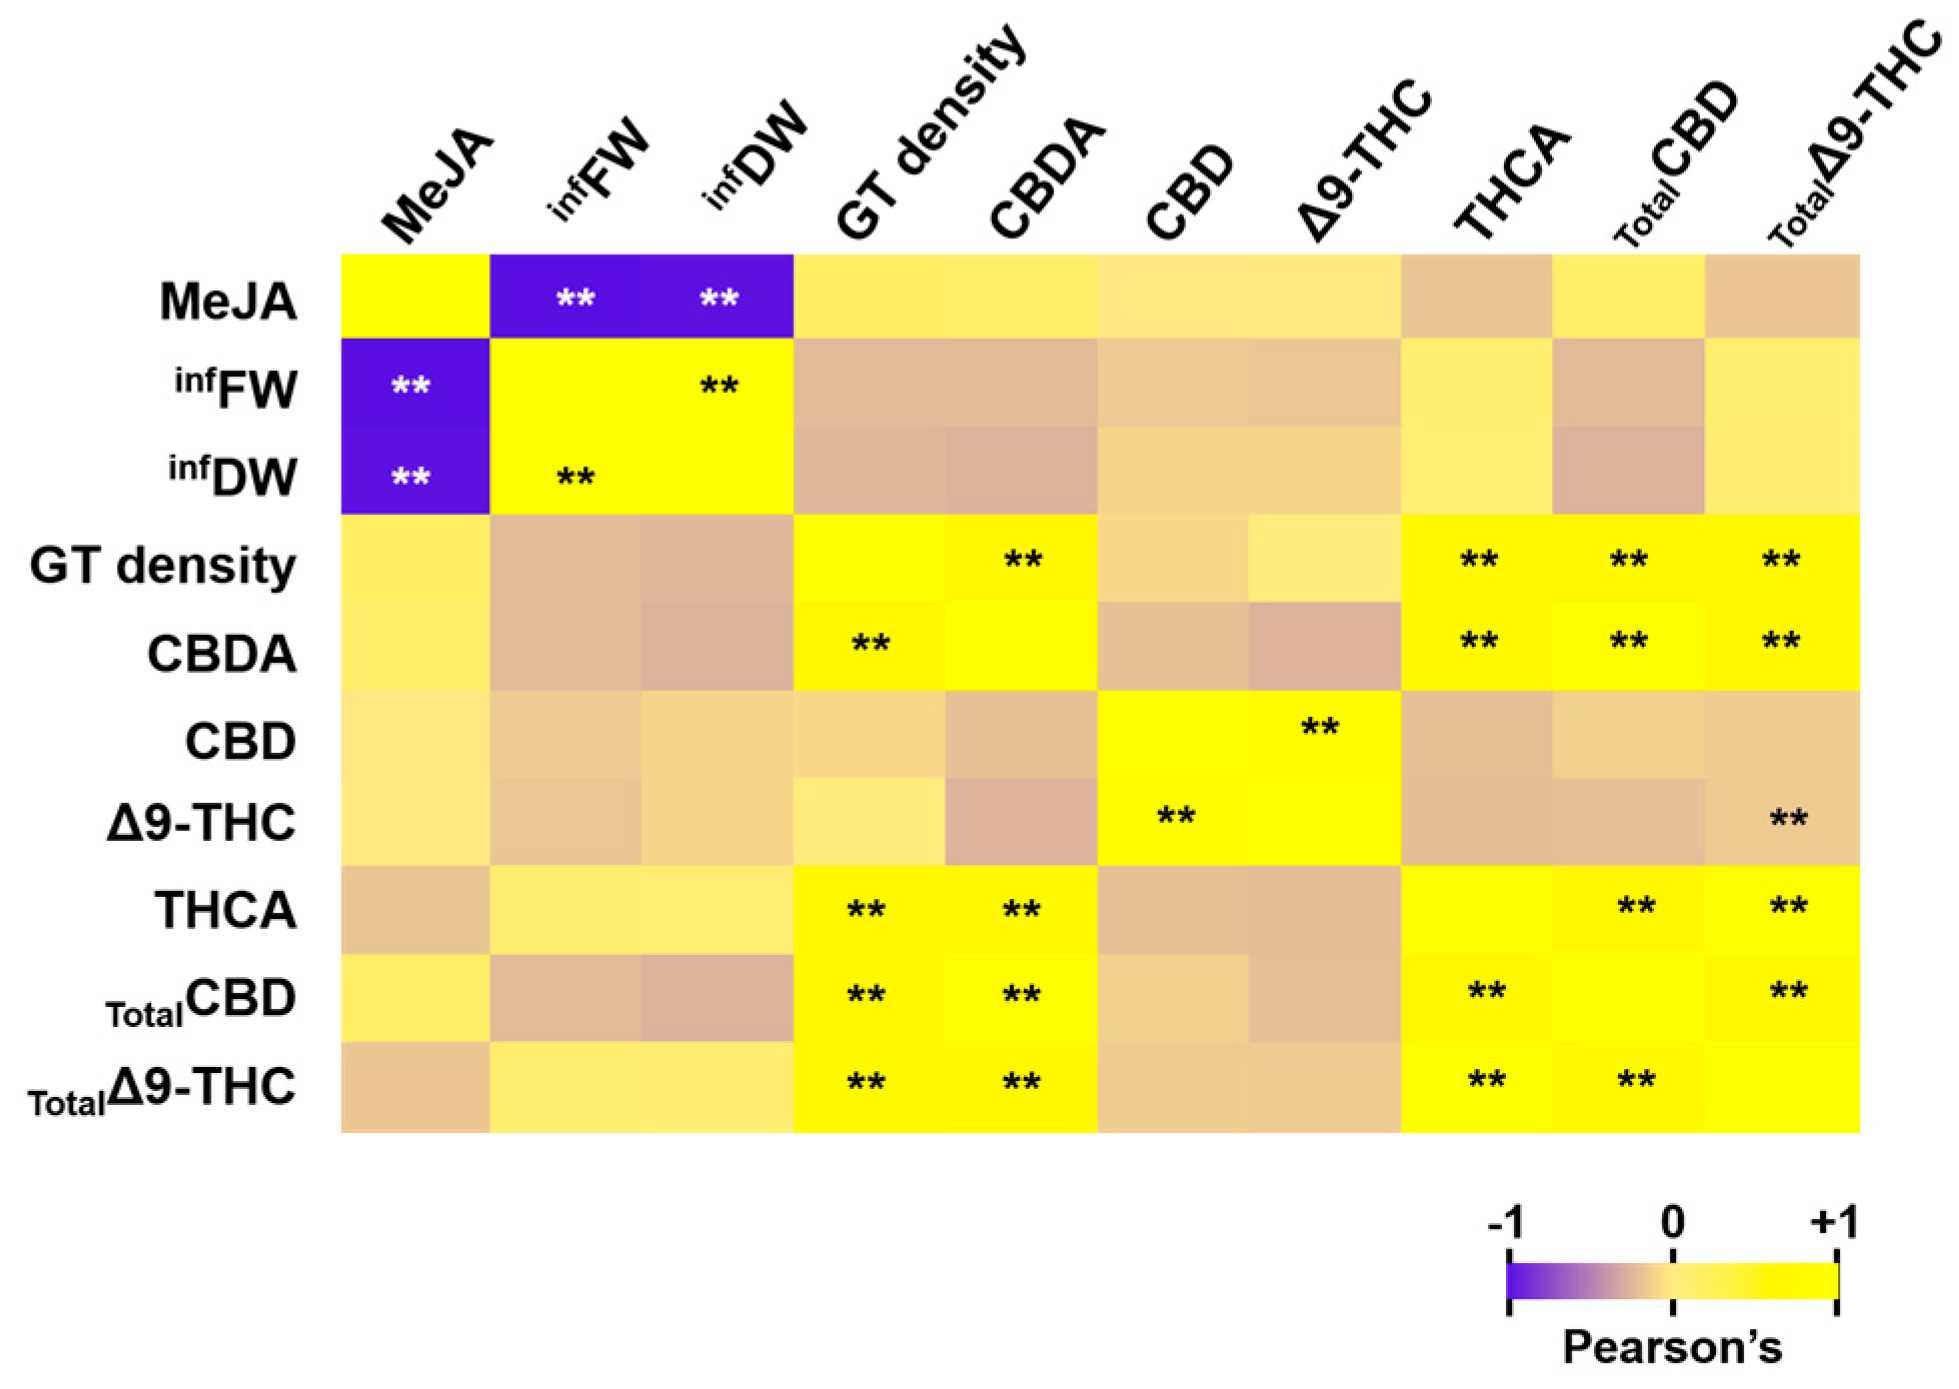
MeJA showed a strong negative correlation with infFW and infDW (p = −0.903 and −0.883), indicating that higher MeJA concentrations decrease infFW and infDW. It had a weak positive correlation with GT density (p = 0.315), suggesting a slight increase. GT density showed a strong positive correlation with CBDA, THCA, TotalCBD, and TotalΔ9-THC content (p = 0.717, 0.721, 0.723 and 0.734). CBDA and THCA had strong positive correlations with trichome density and with each other, as well as with TotalCBD and TotalΔ9-THC (Figure 10).

3.5. Cannabinoid Yield Analysis

The production of CBD and Δ9-THC followed a quadratic regression curve, generally decreasing with increasing MeJA concentrations (r2 = 0.84, 0.80). At 100 μM of MeJA, CBD and Δ9-THC production remained stable (3604.535 mg/plant DW and 353.82 mg/plant DW) compared to the control (3377.274 mg/plant DW and 318.755 mg/plant DW). However, at 200 μM and 400 μM of MeJA, CBD production decreased by 29.41% and 47.82%, while Δ9-THC production decreased by 28.05% and 46.73% compared to the control (Figure 11).

4. Discussion

4.1. Methyl Jasmonate Reduces the Growth of Hemp

Jasmonic acid (JA) is an essential plant hormone that enhances resistance against herbivores and pathogens, as noted by Thaler et al. [45] and Traw and Bergeison [46]. The application of MeJA generally inhibits plant growth and development, according to Zhao et al. [47]. Our study observed that MeJA treatment reduced the growth of hemp, with higher MeJA concentrations resulting in greater reduction rates (Figure 5, Figure 6 and Figure 7). Similar results were reported by Li et al. [48] in tomatoes (Solanum lycopersicum), soybeans (Glycine max), and sunflowers (Helianthus annuus), where MeJA treatment decreased plant height and biomass in a concentration-dependent manner. Other studies also confirmed that MeJA treatment reduces growth in various plant species, including Heijari et al. [49] (Pinus sylvestri), Gould et al. [50] (Pinus radiata), and Sampedro et al. [51] (Pinus pinaster). The inhibitory effects of JA on plant growth are closely linked to transcriptional regulation pathways, particularly those involving the MYC family of transcription factors (MYC 2/3/4), which are critical in plant stress response and growth regulation. JA’s inhibitory effects extend to various aspects of plant growth and development, particularly flowering. JA inhibits flowering in Arabidopsis by regulating the function of MYC family transcription factors (MYC 2/3/4) [52] and delays flowering in other plant species. For instance, JA negatively impacts the flowering time of wheat (Triticum aestivum) [53], Chenopodium rubrum [54], and corn (Zea mays) [55]. In Arabidopsis, JA inhibits flowering through the CORONATINE-INSENSITIVE 1 (COI1)-JASMONATE ZIM DOMAIN (JAZ)/TARGET OF EAT (TOE)-FLOWERING LOCUS T (FT) pathway. Mutants such as coi1-2, JAZ1Δ3A transgenic plants, and JAZ9-overexpressing plants show early flowering [56] because JAZ proteins interact with APETALA2 (AP2) family transcription factors, TOE1, and TOE2 to repress FT transcription [57]. Conversely, in tomatoes, the SlJAZ2 protein accelerates flowering, and SlJAZ2-overexpressing plants flower earlier [56,58]. These molecular mechanisms not only clarify the role of JA in regulating plant growth and flowering but also provide insights into how these processes could be manipulated to optimize commercial production in crops like hemp, particularly in controlled environments like vertical farming. Understanding how JA-related pathways affect plant development could allow for more precise regulation of plant size and flowering time, improving both cannabinoid yield and biomass accumulation for industrial purposes.

4.2. Methyl Jasmonate Influences Cannabinoid Synthesis and Trichome Development in Hemp

Trichomes develop from epidermal cells on the surface of plant aerial parts and protect plants from biotic and abiotic stresses such as heat loss, water loss, insects, herbivores, and pathogens [59]. JA has been reported to be involved in trichome formation in Arabidopsis thaliana [60]. In C. sativa, trichomes are known to store cannabinoids, particularly in high concentrations within GT [61,62]. MeJA has been reported to positively affect trichome development [63,64]. When 50 μM of MeJA was applied to tomatoes, trichome density increased, and the HD-ZIP transcription factor SlHD8 regulated SlJAZ4 to control trichome elongation [65]. Our study supports these findings as MeJA treatment increased trichome density significantly, especially at the 100 μM concentration (Figure 8).
Different plant species have various types of trichomes, classified as unicellular or multicellular trichomes [66]. These two types of trichomes can develop through different mechanisms [65], suggesting the need to study the specific effects of JA on GT development in hemp. Given the strong correlation between GT density and cannabinoid content, further investigation is crucial to better understand the molecular mechanisms by which MeJA regulates both trichome development and cannabinoid synthesis in hemp. Liu et al. [67] reported that the expression of CsAP2L, CsMYB1, and CsWRKY1 could regulate the expression of THCAS, CBDAS, and CBCAS. MYB and WRKY transcription factors are known to be regulated in JA signaling pathways [68]. Our results showed that MeJA affected TotalCBD and TotalΔ9-THC content, with significant changes observed at different concentrations (Figure 9). Additionally, GT density and cannabinoid content showed a strong positive correlation (Figure 10). This suggests that MeJA treatments may not only influence trichome density but also significantly enhance cannabinoid synthesis in hemp, making it a valuable tool for optimizing cannabinoid production in commercial cultivation systems.

4.3. Methyl Jasmonate Increases the Efficiency of Cannabinoid Yield in Vertical Farms

Vertical farms excel in producing high-quality crops efficiently within controlled environments. However, the variety of crops that can be grown is somewhat restricted due to specific growth requirements [69]. To enhance cultivation efficiency and productivity, developing compact crop varieties is crucial. As a result, vertical farms often focus on leafy green vegetables like lettuce [70,71]. By cultivating small plants such as leafy greens and herbs in multiple layers, vertical farms can maximize yield per unit area [33,72]. On the other hand, growing larger plants like tomatoes or peppers requires different cultivation methods, the creation of specific plant varieties, and the use of genetic editing technologies to control plant size [69,72]. Additionally, plant growth regulators, such as the gibberellic acid inhibitor diniconazole, can be used to manage plant size [33]. Our research highlights that the use of elicitors like MeJA in vertical farming not only enhances the quality of the crops but also effectively manages plant size, addressing one of the key challenges in space-constrained environments. For instance, MeJA (100 µM) treatment has been effective in maintaining cannabinoid production while reducing crop growth parameters (Figure 11). This strategy could be applied to other high-value crops, beyond hemp, to enhance both productivity and space efficiency in controlled agricultural systems. Considering the environmental conditions and cultivation practices in vertical farms, MeJA (100 µM) has been confirmed to be beneficial for optimizing cannabinoid production in hemp.

5. Conclusions

This study explored the impact of MeJA on cannabinoid production in hemp (C. sativa). The results indicated that MeJA treatment could maintain cannabinoid yield while reducing growth parameters. These findings suggest that using specific concentrations of inducers in vertical farming systems can effectively boost cannabinoid production in hemp. In particular, combining a 100 µM MeJA treatment with vertical farming proves to be efficient in increasing cannabinoid production. Furthermore, this approach not only enhances cannabinoid yield but also addresses space limitations, making it highly suitable for controlled environments like vertical farms. This study provides essential data for enhancing the quality and productivity of cannabinoids in the pharmaceutical, cosmetic, and health food sectors. To further optimize cannabinoid production, future research should focus on the optimization of MeJA concentrations for different crops in vertical farms, investigate the molecular mechanisms by which MeJA influences GT development and cannabinoid synthesis, and evaluate the broader impact of MeJA on other high-value crops. This line of research will aid in developing new production methods that more efficiently enhance cannabinoid production, thus optimizing the cultivation of high-value crops like hemp in vertical farms.

Supplementary Materials

The following supporting information can be downloaded at https://www.mdpi.com/article/10.3390/horticulturae10111165/s1, Figure S1: Chromatogram of cannabinoids analyzed in the study. Peaks corresponding to cannabidiol (CBD, 7.73 min), cannabidiolic acid (CBDA, 9.20 min), tetrahydrocannabinolic acid (THCA, 14.81 min), and Δ9-tetrahydrocannabinol (Δ9-THC, 17.54 min) are labeled with their respective retention times.

Author Contributions

Conceptualization, S.H. and J.P.; methodology, S.H. and Y.L.; formal analysis, S.H., Y.L. and K.L.; investigation, S.H., Y.L. and K.L.; data curation, S.H.; writing—original draft preparation, S.H., Y.L. and J.P.; writing—review and editing, S.H., Y.L. and J.P.; visualization, S.H.; supervision, K.L. and J.P.; project administration, J.P.; funding acquisition, J.P. All authors have read and agreed to the published version of the manuscript.

Funding

This research was funded by the “Cooperative Research Program for Agriculture Science and Technology Development, Rural Development Administration”, grant number “RS-2022-RD010421”.

Data Availability Statement

The original contributions presented in the study are included in the article material, further inquiries can be directed to the corresponding author.

Conflicts of Interest

The authors declare no conflicts of interest.

References

  1. Al-Khazaleh, A.K.; Zhou, X.; Bhuyan, D.J.; Münch, G.W.; Al-Dalabeeh, E.A.; Jaye, K.; Chang, D. The Neurotherapeutic Arsenal in Cannabis sativa: Insights into Anti-Neuroinflammatory and Neuroprotective Activity and Potential Entourage Effects. Molecules 2024, 29, 410. [Google Scholar] [CrossRef]
  2. Pisanti, S.; Bifulco, M. Medical Cannabis: A plurimillennial history of an evergreen. J. Cell. Physiol. 2019, 234, 8342–8351. [Google Scholar] [CrossRef]
  3. Bonini, S.A.; Premoli, M.; Tambaro, S.; Kumar, A.; Maccarinelli, G.; Memo, M.; Mastinu, A. Cannabis sativa: A comprehensive ethnopharmacological review of a medicinal plant with a long history. J. Ethnopharmacol. 2018, 227, 300–315. [Google Scholar] [CrossRef]
  4. Hanuš, L.O.; Meyer, S.M.; Muñoz, E.; Taglialatela-Scafati, O.; Appendino, G. Phytocannabinoids: A unified critical inventory. Nat. Prod. Rep. 2016, 33, 1357–1392. [Google Scholar] [CrossRef]
  5. Jin, D.; Dai, K.; Xie, Z.; Chen, J. Secondary metabolites profiled in cannabis inflorescences, leaves, stem barks, and roots for medicinal purposes. Sci. Rep. 2020, 10, 3309. [Google Scholar] [CrossRef] [PubMed]
  6. Happyana, N.; Kayser, O. Monitoring metabolite profiles of Cannabis sativa L. trichomes during flowering period using 1H NMR-based metabolomics and real-time PCR. Planta Med. 2016, 82, 1217–1223. [Google Scholar] [CrossRef]
  7. Flores-Sanchez, I.J.; Verpoorte, R. Secondary metabolism in cannabis. Phytochem. Rev. 2008, 7, 615–639. [Google Scholar] [CrossRef]
  8. Yang, R.; Berthold, E.C.; McCurdy, C.R.; da Silva Benevenute, S.; Brym, Z.T.; Freeman, J.H. Development of cannabinoids in flowers of industrial hemp (Cannabis sativa L.): A pilot study. J. Agric. Food Chem. 2020, 68, 6058–6064. [Google Scholar] [CrossRef]
  9. Bergamaschi, M.M.; Karschner, E.L.; Goodwin, R.S.; Scheidweiler, K.B.; Hirvonen, J.; Queiroz, R.H.; Huestis, M.A. Impact of prolonged cannabinoid excretion in chronic daily cannabis smokers’ blood on per se drugged driving laws. Clin. Chem. 2013, 59, 519–526. [Google Scholar] [CrossRef]
  10. Capano, A.; Weaver, R.; Burkman, E. Evaluation of the effects of CBD hemp extract on opioid use and quality of life indicators in chronic pain patients: A prospective cohort study. Postgrad. Med. 2020, 132, 56–61. [Google Scholar] [CrossRef]
  11. Devinsky, O.; Patel, A.D.; Cross, J.H.; Villanueva, V.; Wirrell, E.C.; Privitera, M.; Greenwood, S.M.; Roberts, C.; Checketts, D.; VanLandingham, K.E. Effect of cannabidiol on drop seizures in the Lennox–Gastaut syndrome. N. Engl. J. Med. 2018, 378, 1888–1897. [Google Scholar] [CrossRef] [PubMed]
  12. Jadoon, K.A.; Tan, G.D.; O’Sullivan, S.E. A single dose of cannabidiol reduces blood pressure in healthy volunteers in a randomized crossover study. JCI Insight 2017, 2, e93760. [Google Scholar] [CrossRef] [PubMed]
  13. Leweke, F.; Piomelli, D.; Pahlisch, F.; Muhl, D.; Gerth, C.; Hoyer, C.; Klosterkötter, J.; Hellmich, M.; Koethe, D. Cannabidiol enhances anandamide signaling and alleviates psychotic symptoms of schizophrenia. Transl. Psychiatry 2012, 2, e94. [Google Scholar] [CrossRef] [PubMed]
  14. Shannon, S.; Opila-Lehman, J. Effectiveness of cannabidiol oil for pediatric anxiety and insomnia as part of posttraumatic stress disorder: A case report. Perm. J. 2016, 20, 16-005. [Google Scholar] [CrossRef]
  15. Wu, H.-Y.; Chu, R.-M.; Wang, C.-C.; Lee, C.-Y.; Lin, S.-H.; Jan, T.-R. Cannabidiol-induced apoptosis in primary lymphocytes is associated with oxidative stress-dependent activation of caspase-8. Toxicol. Appl. Pharmacol. 2008, 226, 260–270. [Google Scholar]
  16. Jeyasri, R.; Muthuramalingam, P.; Karthick, K.; Shin, H.; Choi, S.H.; Ramesh, M. Methyl jasmonate and salicylic acid as powerful elicitors for enhancing the production of secondary metabolites in medicinal plants: An updated review. Plant Cell Tissue Organ Cult. (PCTOC) 2023, 153, 447–458. [Google Scholar] [CrossRef]
  17. Kumari, R.; Kotecha, M. A review on the standardization of herbal medicines. Int. J. Pharma Sci. Res. 2016, 7, 97–106. [Google Scholar]
  18. Zhao, J.; Davis, L.C.; Verpoorte, R. Elicitor signal transduction leading to production of plant secondary metabolites. Biotechnol. Adv. 2005, 23, 283–333. [Google Scholar] [CrossRef]
  19. Halder, M.; Sarkar, S.; Jha, S. Elicitation: A biotechnological tool for enhanced production of secondary metabolites in hairy root cultures. Eng. Life Sci. 2019, 19, 880–895. [Google Scholar] [CrossRef]
  20. Kandoudi, W.; Radácsi, P.; Gosztola, B.; Zámboriné Németh, É. Elicitation of medicinal plants in vivo—Is it a realistic tool? The effect of methyl jasmonate and salicylic acid on lamiaceae species. Horticulturae 2021, 8, 5. [Google Scholar] [CrossRef]
  21. Zhao, J.-L.; Zhou, L.-G.; Wu, J.-Y. Effects of biotic and abiotic elicitors on cell growth and tanshinone accumulation in Salvia miltiorrhiza cell cultures. Appl. Microbiol. Biotechnol. 2010, 87, 137–144. [Google Scholar] [CrossRef] [PubMed]
  22. Vasconsuelo, A.; Boland, R. Molecular aspects of the early stages of elicitation of secondary metabolites in plants. Plant Sci. 2007, 172, 861–875. [Google Scholar] [CrossRef]
  23. Baenas, N.; García-Viguera, C.; Moreno, D.A. Biotic elicitors effectively increase the glucosinolates content in Brassicaceae sprouts. J. Agric. Food Chem. 2014, 62, 1881–1889. [Google Scholar] [CrossRef] [PubMed]
  24. Li, X.; Guo, H.; Qi, Y.; Liu, H.; Zhang, X.; Ma, P.; Liang, Z.; Dong, J. Salicylic acid-induced cytosolic acidification increases the accumulation of phenolic acids in Salvia miltiorrhiza cells. Plant Cell Tissue Organ Culture (PCTOC) 2016, 126, 333–341. [Google Scholar] [CrossRef]
  25. Popova, L.; Ananieva, E.; Hristova, V.; Christov, K.; Georgieva, K.; Alexieva, V.; Stoinova, Z. Salicylic acid-and methyl jasmonate-induced protection on photosynthesis to paraquat oxidative stress. Bulg. J. Plant Physiol. 2003, 29, 133–152. [Google Scholar]
  26. Rao, M.V.; Lee, H.-i.; Creelman, R.A.; Mullet, J.E.; Davis, K.R. Jasmonic acid signaling modulates ozone-induced hypersensitive cell death. Plant Cell 2000, 12, 1633–1646. [Google Scholar] [CrossRef]
  27. Szabo, E.; Thelen, A.; Petersen, M. Fungal elicitor preparations and methyl jasmonate enhance rosmarinic acid accumulation in suspension cultures of Coleus blumei. Plant Cell Rep. 1999, 18, 485–489. [Google Scholar] [CrossRef]
  28. Walker, T.S.; Bais, H.P.; Vivanco, J.M. Jasmonic acid-induced hypericin production in cell suspension cultures of Hypericum perforatum L. (St. John’s wort). Phytochemistry 2002, 60, 289–293. [Google Scholar] [CrossRef]
  29. Yu, K.-W.; Gao, W.; Hahn, E.-J.; Paek, K.-Y. Jasmonic acid improves ginsenoside accumulation in adventitious root culture of Panax ginseng CA Meyer. Biochem. Eng. J. 2002, 11, 211–215. [Google Scholar] [CrossRef]
  30. Kozai, T.; Niu, G.; Takagaki, M. Plant Factory: An Indoor Vertical Farming System for Efficient Quality Food Production; Academic press: Cambridge, MA, USA, 2019. [Google Scholar]
  31. García-Tejero, I.F.; Hernández, A.; Ferreiro-Vera, C.; Zuazo, V.H.D.; García, J.H.; Sánchez-Carnerero, C.; Casano, S. Yield of new hemp varieties for medical purposes under semi-arid Mediterranean environment conditions. Comun. Sci. 2020, 11, e3264. [Google Scholar] [CrossRef]
  32. Stutte, G.W. Commercial transition to LEDs: A pathway to high-value products. HortScience 2015, 50, 1297–1300. [Google Scholar] [CrossRef]
  33. Hahm, S.; Lee, B.; Bok, G.; Kim, S.; Park, J. Diniconazole Promotes the Yield of Female Hemp (Cannabis sativa) Inflorescence and Cannabinoids in a Vertical Farming System. Agronomy 2023, 13, 1497. [Google Scholar] [CrossRef]
  34. Caplan, D.; Stemeroff, J.; Dixon, M.; Zheng, Y. Vegetative propagation of cannabis by stem cuttings: Effects of leaf number, cutting position, rooting hormone, and leaf tip removal. Can. J. Plant Sci. 2018, 98, 1126–1132. [Google Scholar] [CrossRef]
  35. Rahimi, A.R.; Rokhzadi, A.; Amini, S.; Karami, E. Effect of salicylic acid and methyl jasmonate on growth and secondary metabolites in Cuminum cyminum L. J. Biodivers. Environ. Sci. 2013, 3, 140–149. [Google Scholar]
  36. Hesami, M.; Pepe, M.; Jones, A.M.P. Morphological characterization of Cannabis sativa L. throughout its complete life cycle. Plants 2023, 12, 3646. [Google Scholar] [CrossRef]
  37. Punja, Z.K.; Sutton, D.B.; Kim, T. Glandular trichome development, morphology, and maturation are influenced by plant age and genotype in high THC-containing cannabis (Cannabis sativa L.) inflorescences. J. Cannabis Res. 2023, 5, 12. [Google Scholar] [CrossRef]
  38. Stack, G.; Toth, J.; Carlson, C.; Cala, A.; Marrero-González, M.; Wilk, R.; Gentner, D.; Crawford, J.; Philippe, G.; Rose, J. Season-long characterization of high-cannabinoid hemp (Cannabis sativa L.) reveals variation in cannabinoid accumulation, flowering time, and disease resistance. GCB Bioenergy 2021, 13, 546–561. [Google Scholar] [CrossRef]
  39. AL Ubeed, H.M.S.; Wills, R.B.H.; Chandrapala, J. Post-Harvest Operations to Generate High-Quality Medicinal Cannabis Products: A Systemic Review. Molecules 2022, 27, 1719. [Google Scholar] [CrossRef]
  40. Hädener, M.; König, S.; Weinmann, W. Quantitative determination of CBD and THC and their acid precursors in confiscated cannabis samples by HPLC-DAD. Forensic Sci. Int. 2019, 299, 142–150. [Google Scholar] [CrossRef]
  41. Tura, M.; Mandrioli, M.; Valli, E.; Toschi, T.G. Quality indexes and composition of 13 commercial hemp seed oils. J. Food Compos. Anal. 2023, 117, 105112. [Google Scholar] [CrossRef]
  42. CAS 13956-29-1; Cannabidiol Solution. Accu Standard: New Haven, CN, USA, 2024.
  43. CAS 23978-85-0; Delta 9-Tetrahydrocannabinolic Acid A (THCA-A) 1000 µg/mL in Acetonitrile. LGC Standards Ltd.: Teddington, UK, 2024.
  44. CAS 1972-08-3; Delta-9-Tetrahydrocannabinol (THC). Accu Standard: New Haven, CN, USA, 2024.
  45. Thaler, J.S.; Humphrey, P.T.; Whiteman, N.K. Evolution of jasmonate and salicylate signal crosstalk. Trends Plant Sci. 2012, 17, 260–270. [Google Scholar] [CrossRef] [PubMed]
  46. Traw, M.B.; Bergelson, J. Interactive effects of jasmonic acid, salicylic acid, and gibberellin on induction of trichomes in Arabidopsis. Plant Physiol. 2003, 133, 1367–1375. [Google Scholar] [CrossRef] [PubMed]
  47. Zhao, L.; Li, X.; Chen, W.; Xu, Z.; Chen, M.; Wang, H.; Yu, D. The emerging role of jasmonate in the control of flowering time. J. Exp. Bot. 2022, 73, 11–21. [Google Scholar] [CrossRef] [PubMed]
  48. Li, C.; Wang, P.; Menzies, N.W.; Lombi, E.; Kopittke, P.M. Effects of methyl jasmonate on plant growth and leaf properties. J. Plant Nutr. Soil Sci. 2018, 181, 409–418. [Google Scholar] [CrossRef]
  49. Heijari, J.; Nerg, A.M.; Kainulainen, P.; Viiri, H.; Vuorinen, M.; Holopainen, J.K. Application of methyl jasmonate reduces growth but increases chemical defence and resistance against Hylobius abietis in Scots pine seedlings. Entomol. Exp. Appl. 2005, 115, 117–124. [Google Scholar] [CrossRef]
  50. Gould, N.; Reglinski, T.; Northcott, G.L.; Spiers, M.; Taylor, J.T. Physiological and biochemical responses in Pinus radiata seedlings associated with methyl jasmonate-induced resistance to Diplodia pinea. Physiol. Mol. Plant Pathol. 2009, 74, 121–128. [Google Scholar] [CrossRef]
  51. Sampedro, L.; Moreira, X.; Zas, R. Resistance and response of Pinus pinaster seedlings to Hylobius abietis after induction with methyl jasmonate. Plant Ecol. 2011, 212, 397–401. [Google Scholar] [CrossRef]
  52. Wang, H.; Li, Y.; Pan, J.; Lou, D.; Hu, Y.; Yu, D. The bHLH transcription factors MYC2, MYC3, and MYC4 are required for jasmonate-mediated inhibition of flowering in Arabidopsis. Mol. Plant 2017, 10, 1461–1464. [Google Scholar] [CrossRef]
  53. Diallo, A.O.; Agharbaoui, Z.; Badawi, M.A.; Ali-Benali, M.A.; Moheb, A.; Houde, M.; Sarhan, F. Transcriptome analysis of an mvp mutant reveals important changes in global gene expression and a role for methyl jasmonate in vernalization and flowering in wheat. J. Exp. Bot. 2014, 65, 2271–2286. [Google Scholar] [CrossRef]
  54. Albrechtova, J.; Ullmann, J. Methyl jasmonate inhibits growth and flowering in Chenopodium rubrum. Biol. Plant. 1994, 36, 317–319. [Google Scholar] [CrossRef]
  55. Beydler, B.; Osadchuk, K.; Cheng, C.-L.; Manak, J.R.; Irish, E.E. The juvenile phase of maize sees upregulation of stress-response genes and is extended by exogenous jasmonic acid. Plant Physiol. 2016, 171, 2648–2658. [Google Scholar] [CrossRef] [PubMed]
  56. Li, C.; Xu, M.; Cai, X.; Han, Z.; Si, J.; Chen, D. Jasmonate signaling pathway modulates plant defense, growth, and their trade-offs. Int. J. Mol. Sci. 2022, 23, 3945. [Google Scholar] [CrossRef] [PubMed]
  57. Zhai, Q.; Zhang, X.; Wu, F.; Feng, H.; Deng, L.; Xu, L.; Zhang, M.; Wang, Q.; Li, C. Transcriptional mechanism of jasmonate receptor COI1-mediated delay of flowering time in Arabidopsis. Plant Cell 2015, 27, 2814–2828. [Google Scholar] [CrossRef] [PubMed]
  58. Yu, X.; Chen, G.; Tang, B.; Zhang, J.; Zhou, S.; Hu, Z. The Jasmonate ZIM-domain protein gene SlJAZ2 regulates plant morphology and accelerates flower initiation in Solanum lycopersicum plants. Plant Sci. 2018, 267, 65–73. [Google Scholar] [CrossRef]
  59. Hussain, S.; Zhang, N.; Wang, W.; Ahmed, S.; Cheng, Y.; Chen, S.; Wang, X.; Wang, Y.; Hu, X.; Wang, T. Involvement of ABA responsive SVB genes in the regulation of trichome formation in Arabidopsis. Int. J. Mol. Sci. 2021, 22, 6790. [Google Scholar] [CrossRef]
  60. An, L.; Zhou, Z.; Yan, A.; Gan, Y. Progress on trichome development regulated by phytohormone signaling. Plant Signal. Behav. 2011, 6, 1959–1962. [Google Scholar] [CrossRef]
  61. Livingston, S.J.; Quilichini, T.D.; Booth, J.K.; Wong, D.C.; Rensing, K.H.; Laflamme-Yonkman, J.; Castellarin, S.D.; Bohlmann, J.; Page, J.E.; Samuels, A.L. Cannabis glandular trichomes alter morphology and metabolite content during flower maturation. Plant J. 2020, 101, 37–56. [Google Scholar] [CrossRef]
  62. Rodziewicz, P.; Loroch, S.; Marczak, Ł.; Sickmann, A.; Kayser, O. Cannabinoid synthases and osmoprotective metabolites accumulate in the exudates of Cannabis sativa L. glandular trichomes. Plant Sci. 2019, 284, 108–116. [Google Scholar] [CrossRef]
  63. Boughton, A.J.; Hoover, K.; Felton, G.W. Methyl jasmonate application induces increased densities of glandular trichomes on tomato, Lycopersicon esculentum. J. Chem. Ecol. 2005, 31, 2211–2216. [Google Scholar]
  64. Tian, D.; Tooker, J.; Peiffer, M.; Chung, S.H.; Felton, G.W. Role of trichomes in defense against herbivores: Comparison of herbivore response to woolly and hairless trichome mutants in tomato (Solanum lycopersicum). Planta 2012, 236, 1053–1066. [Google Scholar]
  65. Hua, B.; Chang, J.; Xu, Z.; Han, X.; Xu, M.; Yang, M.; Yang, C.; Ye, Z.; Wu, S. HOMEODOMAIN PROTEIN8 mediates jasmonate-triggered trichome elongation in tomato. New Phytol. 2021, 230, 1063–1077. [Google Scholar] [CrossRef] [PubMed]
  66. Xia, X.-C.; Hu, Q.-Q.; Li, W.; Chen, Y.; Han, L.-H.; Tao, M.; Wu, W.-Y.; Li, X.-B.; Huang, G.-Q. Cotton (Gossypium hirsutum) JAZ3 and SLR1 function in jasmonate and gibberellin mediated epidermal cell differentiation and elongation. Plant Cell Tissue Organ Culture (PCTOC) 2018, 133, 249–262. [Google Scholar] [CrossRef]
  67. Liu, Y.; Zhu, P.; Cai, S.; Haughn, G.; Page, J.E. Three novel transcription factors involved in cannabinoid biosynthesis in Cannabis sativa L. Plant Mol. Biol. 2021, 106, 49–65. [Google Scholar] [CrossRef] [PubMed]
  68. Ruan, J.; Zhou, Y.; Zhou, M.; Yan, J.; Khurshid, M.; Weng, W.; Cheng, J.; Zhang, K. Jasmonic acid signaling pathway in plants. Int. J. Mol. Sci. 2019, 20, 2479. [Google Scholar] [CrossRef]
  69. Kwon, C.-T.; Heo, J.; Lemmon, Z.H.; Capua, Y.; Hutton, S.F.; Van Eck, J.; Park, S.J.; Lippman, Z.B. Rapid customization of Solanaceae fruit crops for urban agriculture. Nat. Biotechnol. 2020, 38, 182–188. [Google Scholar] [CrossRef]
  70. Benke, K.; Tomkins, B. Future food-production systems: Vertical farming and controlled-environment agriculture. Sustain. Sci. Pract. Policy 2017, 13, 13–26. [Google Scholar] [CrossRef]
  71. Touliatos, D.; Dodd, I.C.; McAinsh, M. Vertical farming increases lettuce yield per unit area compared to conventional horizontal hydroponics. Food Energy Secur. 2016, 5, 184–191. [Google Scholar] [CrossRef]
  72. Beacham, A.M.; Vickers, L.H.; Monaghan, J.M. Vertical farming: A summary of approaches to growing skywards. J. Hortic. Sci. Biotechnol. 2019, 94, 277–283. [Google Scholar] [CrossRef]
Figure 1. The light quality of the artificial light (light-emitting diode, LED) used in the experiment. Blue, 400–500 nm; green, 500–600 nm; red, 600–700 nm.
Horticulturae 10 01165 g001
Figure 2. Schematic top-view image of hemp with methyl jasmonate (MeJA) treatment section.
Horticulturae 10 01165 g002
Figure 3. Analysis method for glandular trichome (GT) density. Five calyxes were collected per plant, and 20× magnification images were captured using a microscope.
Horticulturae 10 01165 g003
Figure 4. The hemp growth under methyl jasmonate (MeJA) treatment. Overall growth of hemp (AD); apical inflorescences of hemp (E,F); MeJA 0 µM (control, non-treatment) (A,E); MeJA 100 µM (E,F); MeJA 200 µM (C,G); MeJA 400 µM (D,H). Yellow and white bars are 10 cm and 1 cm, respectively.
Horticulturae 10 01165 g004
Figure 5. The stem growth parameters based on varying methyl jasmonate (MeJA) treatment levels (MeJA 0 µM (control, non-treatment); MeJA 100 µM; MeJA 200 µM; MeJA 400 µM). Plant height (cm) (A); stem diameter (mm) (B); stem fresh weight (SFW; g/plant) (C); stem dry weight (SDW; g/plant) (D). Data are the mean of three measurements (n = 3). Error bars represent the standard error. Different letters (a–c) indicate significant differences among treatments at the level of 5%, according to Tukey’s test.
Horticulturae 10 01165 g005
Figure 6. The leaf growth parameters based on varying methyl jasmonate (MeJA) levels (MeJA 0 µM (control, non-treatment); MeJA 200 µM; MeJA 400 µM). Leaf length (mm) (A); leaf width (mm) (B); no. of leaves (C); leaf area (cm2/plant) (D); leaf fresh weight (LFW; g/plant) (E); leaf dry weight (LDW; g/plant) (F). Data are the mean of three measurements (n = 3). Error bars represent the standard error. Different letters (a–d) indicate significant differences among treatments at the level of 5%, according to Tukey’s test.
Horticulturae 10 01165 g006
Figure 7. Inflorescence fresh weight (infFW; g/plant) (A) and dry weight (infDW; g/plant) (B) based on varying methyl jasmonate (MeJA) treatment levels (MeJA 0 µM (control, non-treatment); MeJA 100 µM; MeJA 200 µM; MeJA 400 µM). Data are the mean of three measurements (n = 3). Error bars represent the standard error. Different letters (a–c) indicate significant differences among treatments at the level of 5%, according to Tukey’s test.
Horticulturae 10 01165 g007
Figure 8. Distribution of glandular trichomes (GTs) on hemp calyx (C. sativa L. ‘Hot blond’) based on varying methyl jasmonate (MeJA) levels. Photos were taken one day before harvest. Scale bar is 1 mm. MeJA 0 µM (control, non-treatment) (A); MeJA 100 µM (B); MeJA 200 µM (C); MeJA 400 µM (D); GT density (E). Data are presented in boxplots (n = 15). Different letters (a–c) indicate significant differences among treatments at the 5% level, according to Tukey’s test. Asterisks denote statistically significant differences (one-way ANOVA, ** p ≤ 0.01, *** p ≤ 0.001).
Horticulturae 10 01165 g008
Figure 9. Variations in cannabinoid contents based on methyl jasmonate (MeJA) levels (MeJA 0 µM (control, non-treatment); MeJA 100 µM; MeJA 200 µM; MeJA 400 µM). Heatmap of leaf cannabinoids (cannabidiolic acid (CBDA), cannabidiol (CBD), Δ9-tetrahydrocannabinol (Δ9-THC), tetrahydrocannabinolic acid (THCA), TotalCBD and TotalΔ9-THC) (A); heatmap of inflorescence cannabinoids (B); leaf TotalCBD (mg·g−1 DW) (C); leaf TotalΔ9-THC (mg·g−1 DW) (D); inflorescence TotalCBD (mg·g−1 DW) (E); inflorescence TotalΔ9-THC (mg·g−1 DW) (F). Data are the mean of three measurements (n = 3). Error bars represent the standard error. Different letters (a–c) indicate significant differences among treatments at the level of 5%, according to Tukey’s test.
Horticulturae 10 01165 g009
Figure 10. Correlation analysis of interactions between methyl jasmonate (MeJA) and key parameters of hemp. The heatmap displays Pearson’s correlation coefficients. Asterisks (*) indicate statistically significant correlations (** p ≤ 0.01). Yellow to blue color gradient indicates the strength and direction of correlation in the heatmap. Inflorescence fresh weight (infFW); inflorescence dry weight (infDW); glandular trichome (GT) density; cannabidiolic acid (CBDA); cannabidiol (CBD); Δ9-tetrahydrocannabinol (Δ9-THC); tetrahydrocannabinolic acid (THCA); TotalCBD and TotalΔ9-THC.
Horticulturae 10 01165 g010
Figure 11. Effects of methyl jasmonate (MeJA) on cannabinoid yields (mg/plant DW) in hemp (C. sativa L. ‘Hot blonde’). The yield of cannabidiol (CBD) (A,B) and Δ9-tetrahydrocannabinol (Δ9-THC) (C,D) at different MeJA concentrations (MeJA 0 µM (control, non-treatment); MeJA 100 µM; MeJA 200 µM; MeJA 400 µM). The plant on the y-axis refers to the shoot (excluding the stem). Data are presented in boxplots (n = 9). Error bars represent the standard error (n = 9). Different letters (a–c) indicate significant differences among treatments at the level of 5%, according to Tukey’s test. The equations represent the quadratic regression models fitted to the data with their respective coefficients of determination (r2).
Horticulturae 10 01165 g011
Disclaimer/Publisher’s Note: The statements, opinions and data contained in all publications are solely those of the individual author(s) and contributor(s) and not of MDPI and/or the editor(s). MDPI and/or the editor(s) disclaim responsibility for any injury to people or property resulting from any ideas, methods, instructions or products referred to in the content.