Article

Physiological and Transcriptomic Analyses Reveal the Role of the Antioxidant System and Jasmonic Acid (JA) Signal Transduction in Mulberry (Morus alba L.) Response to Flooding Stress

by
Xuejiao Bai
1,2,†,
He Huang
3,†,
Dan Li
4,
Fei Yang
5,
Xinyao Cong
6,
Siqi Wu
1,2,
Wenxu Zhu
1,2,
Shengjin Qin
7,* and
Yibo Wen
1,2,*
1
College of Forestry, Shenyang Agricultual University, Shenyang 110866, China
2
Research Station of Liaohe-River Plain Forest Ecosystem, Chinese Forest Ecosystem Research Network (CFERN), Shenyang Agricultural University, Shenyang 110866, China
3
The Second Hospital Affiliated to Liaoning University of Traditional Chinese Medicine, Shenyang 110866, China
4
Liaoning Non-Ferrous Geological Exploration and Research Institute Co., Ltd., Shenyang 110866, China
5
Liaoning Province Nonferrous Geology 104 Team Co., Ltd., Yingkou 115000, China
6
College of Agronomy, Sichuan Agricultural University, Chengdu 611130, China
7
College of Resources and Environment, Anqing Normal University, Anqing 246133, China
*
Authors to whom correspondence should be addressed.
These authors contributed equally to this work.
Horticulturae 2024, 10(10), 1100; https://doi.org/10.3390/horticulturae10101100
Submission received: 29 August 2024 / Revised: 26 September 2024 / Accepted: 12 October 2024 / Published: 16 October 2024

Abstract

:
In recent decades, the frequency of flooding has increased as a result of global climate change. Flooding has become one of the major abiotic stresses that seriously affect the growth and development of plants. Mulberry (Morus alba L.) is an important economic tree in China. Flooding stress is among the most severe abiotic stresses that affect the production of mulberry. However, the physiological and molecular biological mechanisms of mulberry responses to flooding stress are still unclear. In the present study, reactive oxygen species (ROS) metabolism, antioxidant mechanism, and plant hormones in mulberry associated with the response to flooding stress were investigated using physiological and transcriptomic analysis methods. The results showed significant increases in the production rate of superoxide anion (O2•−) and the content of hydrogen peroxide (H2O2) in leaves on the 5th day of flooding stress. This led to membrane lipid peroxidation and elevated malondialdehyde (MDA) levels. Antioxidant enzymes such as catalase (CAT), superoxide dismutase (SOD), and peroxidase (POD) exhibited enhanced activities initially, followed by fluctuations. The ascorbic acid–glutathione (AsA-GSH) cycle played a crucial role in scavenging ROS, promoting the reduction of oxidized glutathione (GSSG) to reduced glutathione (GSH). Transcriptomic analysis revealed the up-regulation of the gene-encoding antioxidant enzymes (APX, MDHAR, GPX, GR, GST) involved in ROS scavenging and stress tolerance mechanisms. Jasmonic acid (JA) levels and the expression of JA synthesis-related genes increased significantly in mulberry leaves under flooding stress. This activation of the JA signaling pathway contributed to the plant’s adaptability to flooding conditions. Proline (Pro) and soluble sugar (SS) contents increased notably in response to flooding stress. Proline helped maintain cell turgor and protected enzymes and membranes from damage, while soluble sugars supported anaerobic respiration and energy supply. However, soluble protein (SP) content decreased, suggesting inhibition of protein synthesis. The study provides insights into mulberry’s flooding tolerance mechanisms, guiding future molecular breeding efforts. This summary captures the key findings and implications of the study on mulberry’s response to flooding stress, focusing on physiological and molecular mechanisms identified in the research.

1. Introduction

Appropriate water quality and quantity are the basic requirements for normal plant growth. However, due to the influence of global warming, extreme precipitation, rising groundwater levels, unreasonable irrigation practices, and other factors, flooding stress has become one of the main adverse factors affecting crop yield and quality worldwide [1,2]. For example, the United States lost nearly 217 million dollars over the 2000–2011 period as a result of flooding events [3]. In addition, Pakistan, India, Colombia, and Australia experienced serious flooding events in the summer of 2010 [4]. China is also one of the countries most seriously affected by floods worldwide. Indeed, the average frequency of extreme floods in the middle eastern region of China over the past 54 years was about 2.78 times per year, showing an increasing rate of 0.0118 times per year [5]. Flooding stress leads to partial or total submergence of plants, affecting all plant growth stages, from seed germination to vegetative and reproductive growth stages [6]. A high amount of water on the soil surface can hinder the plant–atmosphere gas exchange, thereby causing hypoxia in the flooded tissues of plants and seriously affecting the physiological metabolism of plants, including hormone metabolism disorder [7,8,9], membrane lipid peroxidation [10], osmotic potential decrease [11] and root solute uptake inhibition [12], resulting in a gradual decrease in the crop yield and quality and even the destruction of large agricultural areas [13,14,15,16].
The environment changes from normoxic to hypoxic can affect the dynamic balance of reactive oxygen species (ROS) in plants, causing a metabolic disorder and electron leakage, thereby resulting in the accumulation of ROS, including superoxide anion (O2•−), hydroxyl radical (•OH), hydrogen peroxide (H2O2), and singlet oxygen (1O2) [17,18]. ROS are not only present in chloroplasts, mitochondria, and peroxisomes but also in the plant cellular components (proteins and molecules) with strong redox potential [19]. Although ROS are signaling molecules and are necessary for biological processes (e.g., cell reproduction and differentiation) at appropriate concentrations, excessive accumulation of ROS may cause serious damage to DNA, RNA, protein, and cell membrane [20]. Iqbal et al. [6] found that flooding stress affects muscadine grapes by increasing the levels of superoxide (O2•−) and hydrogen peroxide (H2O2). This increase causes oxidative damage and results in high lipid peroxidation rates in both the leaves and roots. In order to resist the toxic effect of ROS under flooding stress, plants can develop antioxidant defense compounds after long-term evolution and adaptation [18], such as compounds with non-enzymatic ROS scavenging (e.g., ascorbic acid and vitamin E), active oxygen scavenging enzymes, and enzymes regenerating the reduced antioxidants [21], thus reducing the damage of ROS accumulation to plants under flooding stress. Studies have shown that high active oxygen scavenging enzymes, namely superoxide dismutase (SOD), catalase (CAT), and ascorbic acid peroxidase (APX) activities, play an important role in the tolerance of rice (Oryza sativa L. cv. Yamabiko) [22], tobacco (Nicotiana tabacum) [23,24], sunflower (Helianthus annuus L.) [25], wheat (Triticum aestivum L. cv. Yangmai 9) [26], and soybean (Glycine max) [27] to flooding conditions.
Plants can respond to flooding stress at morphological, physiological, biochemical, and molecular levels by changing metabolism, gene expression, photosynthesis, and plant hormone balance. In fact, plant hormones are signaling molecules that regulate the responses of plants to abiotic stress. Studies have shown that ethylene [28], gibberellins [29], brassinosteroids [30], and salicylic acid [31] are involved in the response of plants to flooding stress. Jasmonic acid (JA) is a unique plant hormone that plays a crucial role in regulating reproductive growth, storing nutrients, and transporting assimilates to the roots [32,33] and is involved in the defense response to abiotic stress [34,35,36]. However, JA signals in plant leaves have not been investigated in terms of the sensing and integrating signal networks that affect plant behavior during flooding stress, especially at the molecular level. Transcriptome technology is one of the useful techniques for analyzing changes in plant genes under stress. In particular, this technique is of great importance for investigating the molecular mechanism of plant adaptability to stress [37,38]. Numerous studies, using transcriptome technology, have demonstrated that the molecular and metabolic regulations of highland barley [39], sweet clover [40], soybean [41], duck toe grass [42], and poplar [43] under flooding stress are mainly related to the energy production process, as well as to carbon, nitrogen, and amino acid metabolisms. Mulberry is a significant economic tree in China and shows various natural responses to abiotic stresses like drought and salt. In drought conditions, mulberry adjusts its wax layers and produces certain proteins and hormones to preserve cellular water balance and physiological functions [44]. During salt stress, mulberry regulates ion balance and osmotic processes to manage salt levels within and outside cells, which involves changes in root ion absorption and distribution, along with the production of antioxidants to reduce oxidative damage [45]. Flooding stress has been reported to affect gene expression patterns and photosynthesis in different breeding methods and mulberry (Morus) varieties [46]; however, studies on oxidative damage in this context are still limited. In this study, mulberry was used to reveal the role of the antioxidant system and JA signal transduction in mulberry response to flooding stress based on the plant physiology and transcriptome methods. This study provides new insights into understanding the molecular mechanism of mulberry response and adaptation to flooding stress. It also provides a reference for the study of flooding tolerance mechanisms and for the selection of flood-tolerant plant varieties.

2. Materials and Methods

2.1. Plant Materials and Experimental Treatment

The annual Morus alba seedling was selected as experimental material in this study. The culture medium consisted of peat soil and vermiculite, with a volume ratio of 2:1. Seedlings were grown in an artificial climate chamber at a temperature of 25/23 °C (light/dark), the light intensity of 400 µmol∙m−2∙s−1, photoperiod of 12/12 h (light/dark cycles), and relative humidity of about 75%, with regular watering and seedling stage management. The plants were transplanted in pots (20 cm diameter × 50 cm height) after they reached a height of about 10 cm, with a density of 2 plants per pot. Afterward, 80 pots with relatively consistent plant growth (about 40 cm) were selected for experimental treatment. Four treatment groups were considered in the experiment. Mulberry trees without flooding treatment were considered the flooding control group (Ctl) and were watered daily with tap water to maintain the water holding capacity at 70%. However, in the flooding treatment group, the water level was maintained during the experiment at 5 cm above the soil surface. Randomly select mulberry leaves from the third to the fifth leaf position of plants from the Control (Ctl), 5 days flooding (D5), 10 days flooding (D10), and 15 days flooding (D15) groups to analyze physiological and transcriptomic indicators.

2.2. Methods Used in the Determination of Parameters

2.2.1. Determination of Reactive Oxygen Species (ROS) and Malondialdehyde (MDA) Content

The method for measuring the production rate of superoxide anion (O2•−) and hydrogen peroxide (H2O2) content follows procedures established by Zhang et al. [47] and Alexieva et al. [48]. Measure 0.5 g of leaves, combine with 5 mL of 50 mM phosphate buffer including 0.1 mM EDTA and 4% polyvinylpyrrolidone (PVP), homogenize the mixture, and centrifuge at 3000× g for 15 min to collect 100 μL of the supernatant. Mix this with 50 mM phosphate buffer (pH 7.8) and 1 mM hydroxylamine hydrochloride. Incubate the mixture at 30 °C for 30 min, then add 17 mM p-aminobenzenesulfonamide and 7 mM 1-naphthylamine, and maintain it at 30 °C in a warm water bath for an additional 15 min. The absorbance at 530 nm is measured, and the O2•− production rate is determined using the standard nitrite curve. To determine the content of H2O2, mix 0.5 mL of 0.1% trichloroacetic acid (TCA) leaf extract supernatant with 0.5 mL of 100 mM potassium phosphate buffer. Conduct the reaction in complete darkness for one hour, then measure the absorbance at 390 nm. Calculate the hydrogen peroxide content using the established standard curve. For determining malondialdehyde (MDA) content, thiobarbituric acid (TBA) colorimetry is employed [49]. First, weigh 0.2 g of leaves, mix with 5 mL of 5% trichloroacetic acid (TCA), and homogenize. Centrifuge the mixture at 4 °C at 3000× g for 15 min, extract the supernatant, and add 0.5% thiobarbituric acid solution. Heat the solution in boiling water for 15 min, cool it quickly, and centrifuge again at 3000× g for 10 min. Measure the absorbance at 523 nm and 600 nm from the supernatant, and use the standard samples to determine and calculate the resulting standard curve.

2.2.2. Determination of Antioxidant Metabolites

The measurement of reduced ascorbic acid (AsA) and dehydroascorbic acid (DHA) is carried out using Wang’s reported method [50]. Begin by grinding 0.1 g of leaves with 1.5 mL of 6% perchloric acid in a cooled mortar. After centrifuging the extract at 10,000× g at 4 °C for 10 min, utilize the supernatant for further analysis. Ascorbic acid concentrations are quantified using spectrophotometry at a 265 nm wavelength in 200 mM sodium acetate buffer (pH 5.6) before and after a 15 min incubation with ascorbate oxidase. To assess total ascorbic acid, adjust 100 μL of the extract to pH 6 to 7 using 30 μL of 1.82 mM NaHCO3, add 130 μL of 20 mM GSH and 100 mM Tricine KOH buffer (pH 8.5), incubate at room temperature for 30 min, and measure using photometry. Calculate DHA content by the discrepancy between total and reduced ascorbic acid levels. Additionally, determine reduced (GSH) and oxidized glutathione (GSSG) using Rahman et al.‘s method, where GSH is oxidized by 5,5′-dithio-bis 2-nitrobenzoic acid (DTNB) to produce the yellow derivative 5′-thio-2-nitrobenzoic acid (TNB), detectable at 412 nm [51].

2.2.3. Determination of Antioxidant Enzyme Activity

The activities of superoxide dismutase (SOD) and peroxidase (POD) were measured using the nitrogen blue tetrazole and guaiacol methods, respectively. Specifically, SOD activity was assessed using the nitrogen blue tetrazole assay provided by Suzhou Grace Biotechnology Co., Ltd. (Suzhou, Jiangsu, China) under item number G0101F [52]. Peroxidase (POD) activity was measured using the guaiacol method with the same company’s kit, item number G0107F [53]. For CAT, the method involved catalyzing hydrogen peroxide to form water and oxygen [54]. The residual hydrogen peroxide was then used for color development with a colorimetric probe peaking at 510 nm absorption. CAT activity was quantified based on the reduction of hydrogen peroxide, employing the same kit, item number G0105F. Ascorbate peroxidase (APX) activity is measured by evaluating the oxidation rate of ascorbic acid (ASA) after forming an intermediate complex with H2O2, utilizing the Gris kit (item No. G0203F) [55]. Monodehydroascorbate reductase (MDHAR) activity is assessed by the decline in NADH absorption at 340 nm, catalyzing the reduction of monodehydroascorbate (MDHA) to ASA using the Gris kit (item No. G0213F) [56]. Dehydroascorbate reductase (DHAR) activity, using the Grith kit (item No. G0212F), involves catalyzing the reduction of dehydroascorbate (DHA) to ASA, with the rate of ASA production measured at 265 nm [57]. Glutathione peroxidase (GSH-Px) activity is determined by the plant glutathione peroxidase kit (item No. G0204F). Glutathione reductase (GR) uses the Ellman method with the Grice kit (item No. G0209F) [58]. Glutathione S-transferase (GST) activity, which is evaluated by the Gleis kit (item No. G0208F), involves catalyzing the binding of glutathione (GSH) and 1-chloro-2,4-dinitrobenzene (CDNB), with the activity measured by the rate of absorbance increase at 340 nm [59]. Thioredoxin reductase (TrxR) and thioredoxin peroxidase (Prx) activities are assessed using kits from Grice Biotechnology Co., Ltd., Suzhou, China (item No. G0216F), following the specific instructions provided with each kit.

2.2.4. Determination of Physiological Indicators

JA contents were determined using ELISA kits (JL-bio, Shanghai, China) [60]. Mix the sample to be tested with the biotin-labeled antibody to allow binding. Add the enzyme-linked antibody and the substrate for the enzyme, incubate thoroughly, and then measure the results at a wavelength of 450 nm. The contents of soluble sugar (SS), soluble protein (SP), and proline were determined by anthrone, Coomassie brilliant blue, and ninhydrin colorimetric methods, respectively [61]. The soluble sugar content in mulberry leaves was determined using the phenol-sulfuric acid method. Fresh leaves were immediately frozen in liquid nitrogen and ground to a fine powder. A 100 µL aliquot of the supernatant was mixed with 1 mL of phenol solution (5% w/v) and 5 mL of concentrated sulfuric acid. The reaction mixture was thoroughly mixed and allowed to stand at room temperature for 30 min to develop color. The optical density (OD) was measured at 490 nm using a UV-visible spectrophotometer. The concentration of soluble sugars in the leaf extracts was determined using a standard glucose curve. Results were expressed as milligrams of soluble sugar per gram of fresh weight (mg/g FW) of leaf tissue. The soluble protein content in mulberry leaves was quantified using the Bradford method. Fresh leaves were immediately frozen in liquid nitrogen and ground to a fine powder. For the protein samples, 100 µL of the extract was mixed with 900 µL of Bradford reagent in a cuvette. The reaction was allowed to stand at room temperature for 5 min to develop color. The optical density (OD) was measured at 595 nm using a UV-visible spectrophotometer. A standard curve was created using the absorbance values of standard samples to determine the protein concentration in the extracts. Results were expressed as milligrams of protein per gram of fresh weight (mg/g FW) of leaf tissue. The proline content in mulberry leaves was determined using the ninhydrin colorimetric method. Fresh leaves were immediately frozen in liquid nitrogen and ground into a fine powder. To quantify proline, the supernatant was mixed with ninhydrin reagent and glacial acetic acid, followed by heating in a boiling water bath. The mixture was then cooled on ice to develop a colored complex. After cooling, toluene was added and thoroughly mixed. The organic phase was separated, and the absorbance was measured at 520 nm using a spectrophotometer. A standard curve was created using the absorbance values of standard samples to determine the proline content in the extracts.

2.2.5. Determination of Transcriptome

Randomly select mulberry leaves from the third to the fifth leaf position of plants were trimmed, wrapped in tinfoil, and frozen in liquid nitrogen for 30 min before being shipped to Shanghai Majorbio (Shanghai, China) for transcriptome analysis, preserved with dry ice. The process involved three main steps:
(1)
Sequencing Experiment
RNA Extraction: Total RNA was extracted, and its concentration and purity were assessed using a NanoDrop2000. RNA integrity was verified through agarose gel electrophoresis and an Agilent2100, with requirements set for RNA quantity, concentration, and absorbance ratios to proceed with library construction.
mRNA Isolation: Using magnetic beads with Oligo (dT), mRNA was isolated from total RNA due to its polyA tail structure.
mRNA Fragmentation: The mRNA was fragmented into approximately 300 bp pieces using a fragmentation buffer.
cDNA Synthesis: First-strand cDNA was synthesized from mRNA using random hexamers and reverse transcriptase, followed by second-strand synthesis to create a stable double-stranded structure.
Library Preparation and Sequencing: The double-stranded cDNA was processed with an End Repair Mix, adapters were added, and the library was enriched and sequenced on an Illumina NovaSeq 6000 platform using a PE library setup.
(2)
Quality Control
Data from sequencing contained adapter sequences, low-quality reads, and short sequences, which were filtered out using tools like SeqPrep and Sickle to ensure the production of high-quality clean data for accurate bioinformatics analysis.
(3)
Differential Gene Screening
Expression differences were analyzed using DESeq2 to identify differentially expressed genes (DEGs) between groups, with significance thresholds set at log2FC > 1 and p < 0.05.
This detailed workflow ensures thorough data preparation and analysis for studying transcriptomic changes in mulberry leaves.

2.2.6. RT-PCR Analysis

Approximately 100 mg of plant tissue was used to extract total RNA with the OMEGA Plant RNA Kit (Bio-tek, Norcross, GA, USA), following the provided instructions. This RNA served as a template for synthesizing single-strand cDNA using the PrimeScript RT Reagent Kit (TaKaRa, We have confirmed We have confirmed We have confirmed We have confirmed We have confirmed, Japan). Real-time PCR was conducted using SYBR Premix Ex Taq (TaKaRa, Shiga, Japan) based on a SYBR Green fluorescence method. The PCR protocol included an initial denaturation at 94 °C for 10 min, followed by 40 cycles of 94 °C for 20 s and 60 °C for 20 s. Post-amplification, a melting curve analysis was performed from 60 °C to 95 °C in 1 °C increments to ensure specificity. The actin gene was used as a reference for normalizing the data, and relative gene expression levels were calculated using the 2−∆∆Ct method [62]. Specific primer sequences for genes were also utilized (Table 1).

2.3. Statistical Analysis

Data analysis was conducted using Microsoft Excel 2016 (Redlands, WA, USA) and SPSS 22.0 (IBM, Inc., Armonk, NY, USA). Results were expressed as mean ± standard error (SE) based on five biological replicates (n = 5). Statistical differences among various data groups were assessed using one-way analysis of variance (ANOVA) and Fischer’s least significant difference (LSD) method.

3. Results

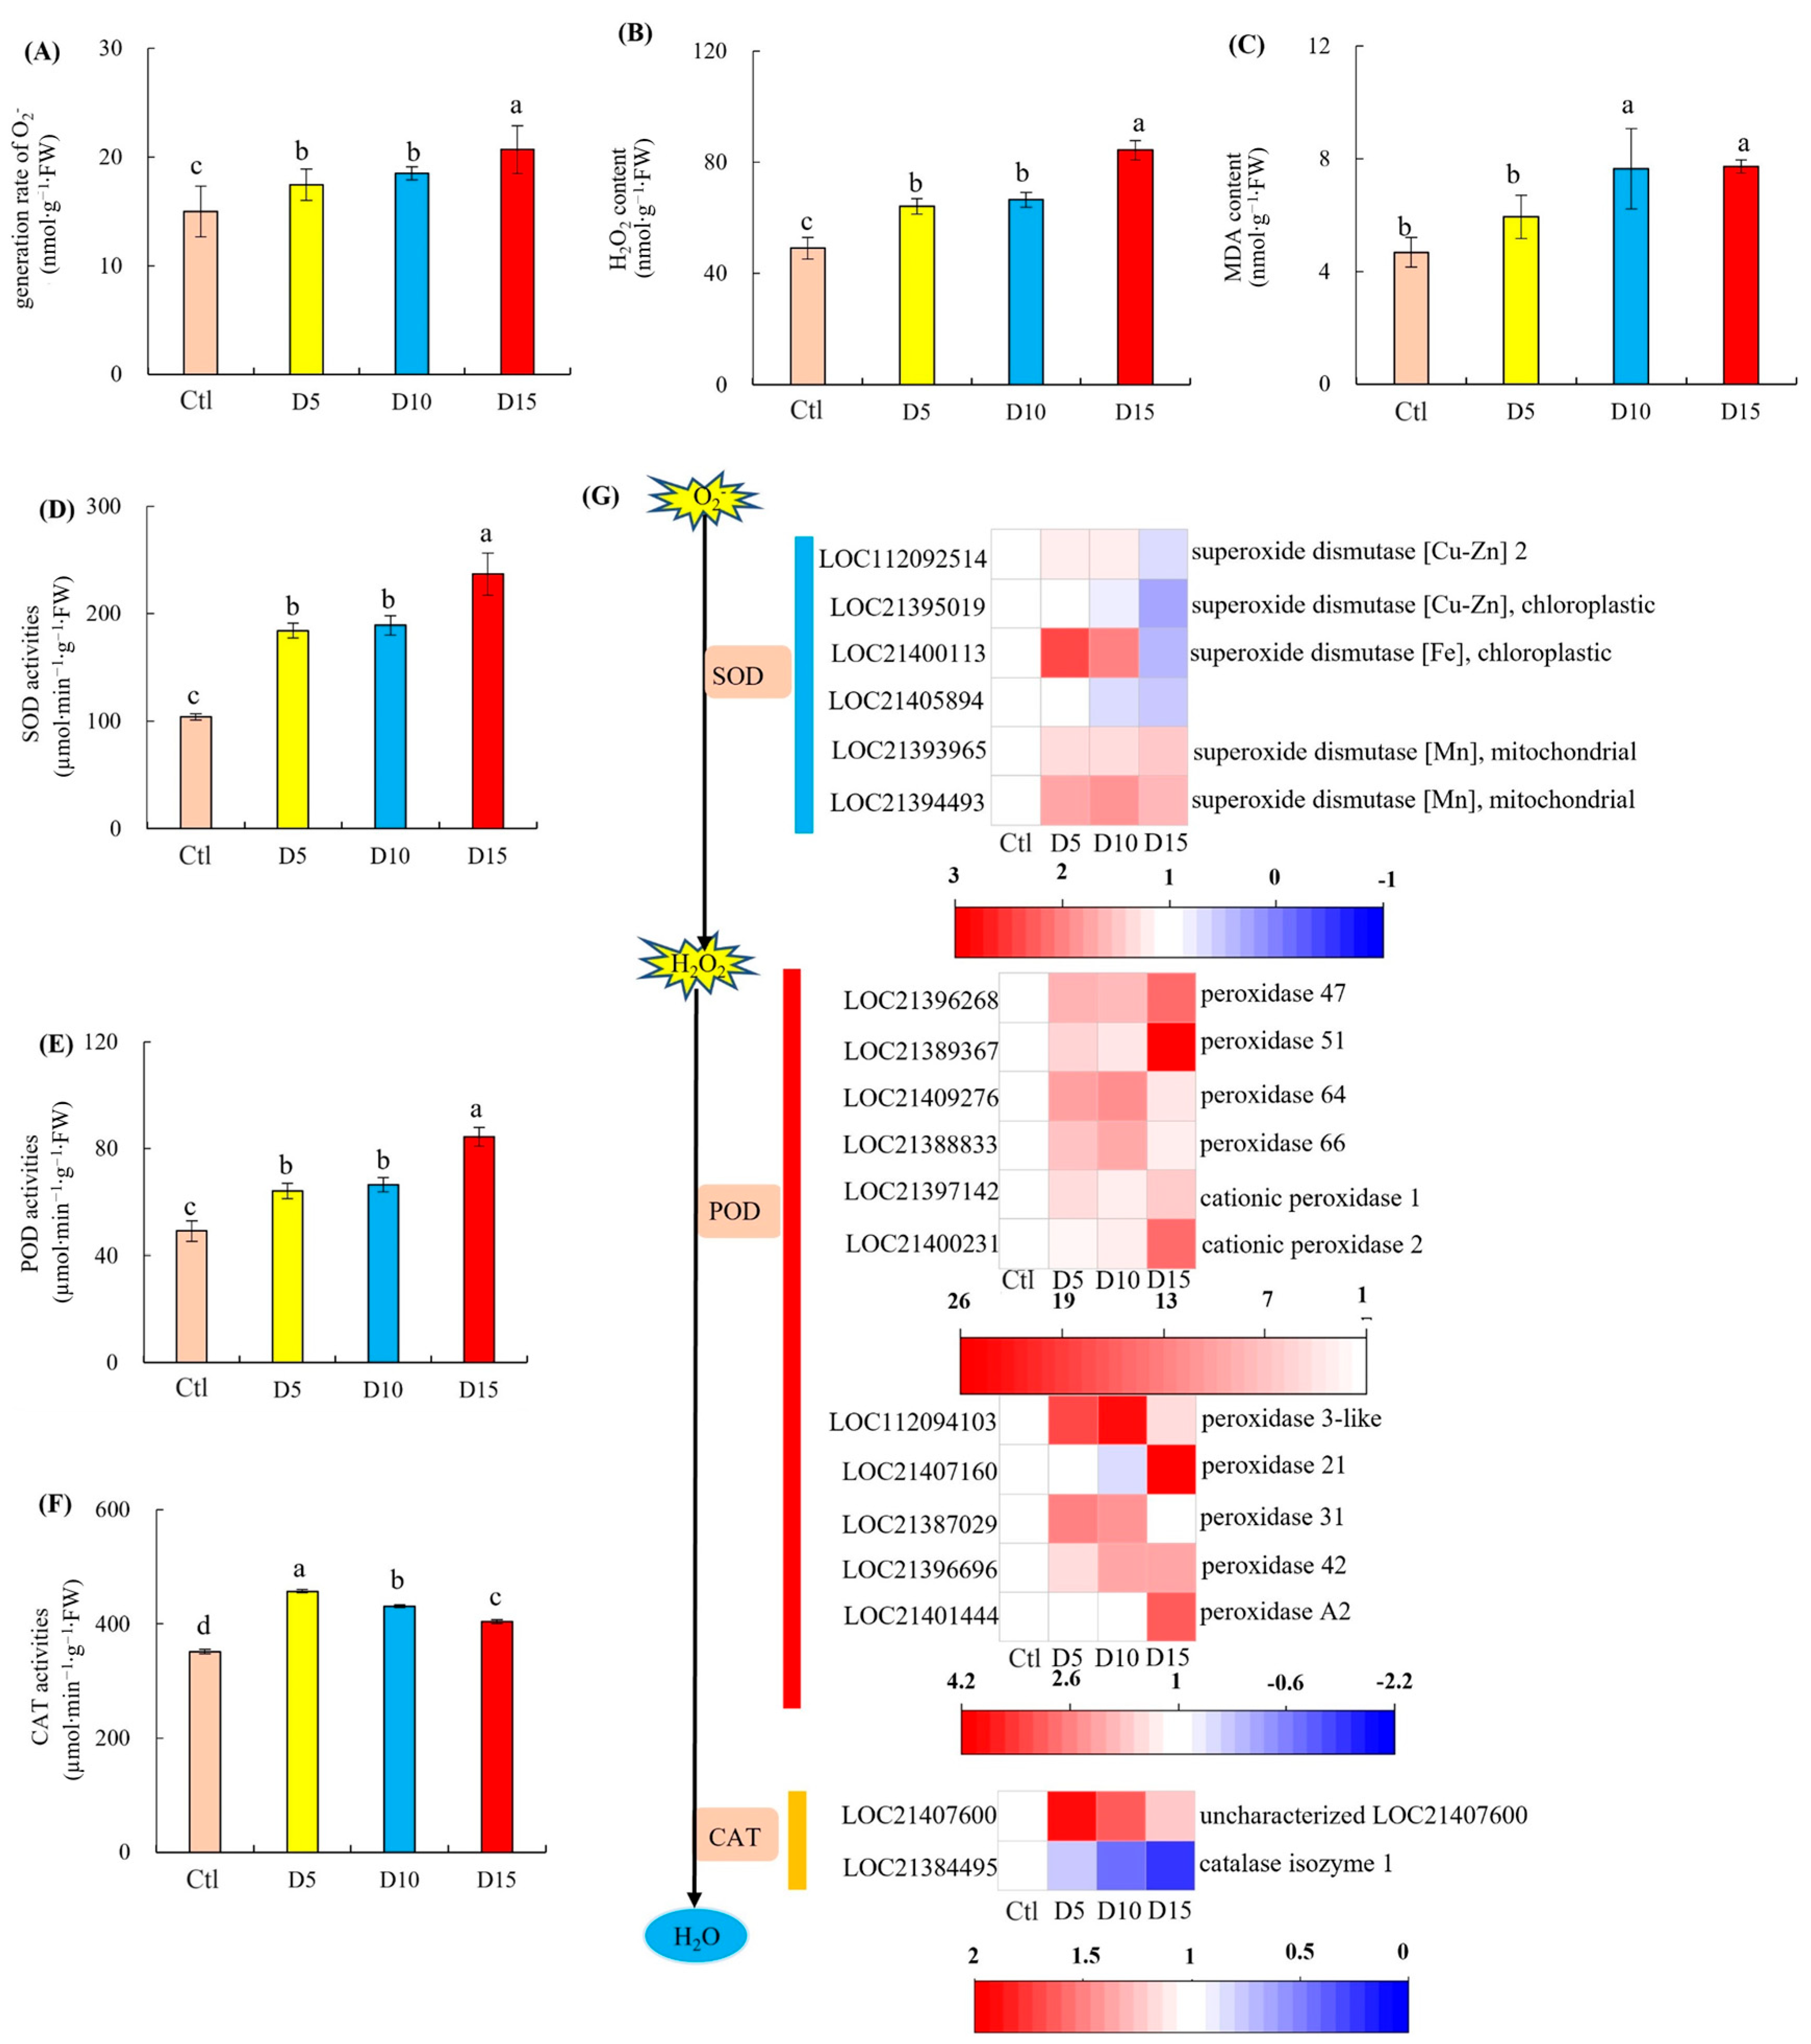
3.1. ROS Contents and SOD, POD, and CAT Activities

As the duration of flooding increased, the production rate of superoxide anion (O2•−) and the content of hydrogen peroxide (H2O2) exhibited a steadily increasing trend (Figure 1A,B). The production rate of O2•− increased by 16.64% (p < 0.05) on the 5th day of flooding, by 23.62% (p < 0.05) on the 10th day, and by 38.25% (p < 0.05) on the 15th day. The H2O2 content showed an increase of 30.67% (p < 0.05) on the 5th day, 35.53% (p < 0.05) on the 10th day, and 71.91% (p < 0.05) on the 15th day of flooding.
On the 5th day of flooding, the malondialdehyde (MDA) content in mulberry leaves showed a slight increase compared to the control (Ctl), but the difference was not significant. By the 10th day of flooding, MDA content began to increase significantly, with an increase of 63.34% (p < 0.05) (Figure 1C). The activities of superoxide dismutase (SOD) and peroxidase (POD) in the leaves increased with the extension of flooding duration (Figure 1D,E). The SOD activity on the 5th, 10th, and 15th days of flooding increased by 76.91%, 81.6%, and 127.57% (p < 0.05), respectively. The POD activity increased by 11.26% (p < 0.05) on the 5th day, by 12.97% (p < 0.05) on the 10th day, and by 29.66% (p < 0.05) on the 15th day. Additionally, the activity of catalase (CAT) also increased following flooding, with the highest increase of 30.09% (p < 0.05) observed on the 5th day. However, the activities of CAT on the 10th and 15th days decreased compared to the 5th day, with decreases of 5.81% (p < 0.05) and 12.30% (p < 0.05), respectively (Figure 1F).
The expression levels of Cu/Zn-SOD (LOC112092514) and Fe-SOD (LOC21400113) increased significantly on the 5th and 10th days of flooding (Figure 1G). Among the 11 coding genes located in POD, POD21 (LOC21407160) and PODA2 (LOC2140144) were down-regulated on the 5th and 10th day of flooding, while the expression of POD31 (LOC21387029) showed a lack of a significant change on the 15th day of flooding. The expressions of the remaining genes were up-regulated under flooding stress. On the other hand, the expression of the CAT coding gene (LOC21407600) under flooding stress was significantly higher than that observed in Ctl, showing a significant increase on the 5th day of flooding and decreases on the 10th and 15th day of flooding. The expression of CAT1 (LOC21384495) decreased significantly with increasing flooding days.

3.2. AsA-GSH Cycle and the Expression of Related Protein

The contents of dehydroascorbate (DHA), glutathione (GSH), and oxidized glutathione (GSSG) in the leaves showed significant increases compared to the control (Ctl), with increases of 9.33% (p < 0.05), 15.3% (p < 0.05), and 14.13% (p < 0.05) on the 5th day of flooding stress, respectively. However, the changes in ascorbic acid (ASA) content, as well as the ASA/DHA and GSH/GSSG ratios, were not significant. On the 10th day of flooding, the contents of DHA, GSH, GSSG, ASA, and the GSH/GSSG ratio in the leaves significantly increased compared to Ctl, with increases of 68.65% (p < 0.05), 77.79% (p < 0.05), 23.13% (p < 0.05), 34.07% (p < 0.05), and 23.13% (p < 0.05), respectively. Conversely, the ASA/DHA ratio significantly decreased by 20.34% (p < 0.05). On the 15th day of flooding, the contents of DHA, GSH, GSSG, ASA, and the GSH/GSSG ratio again showed significant increases compared to Ctl, with increases of 83.32% (p < 0.05), 92.65% (p < 0.05), 40.22% (p < 0.05), 49.36% (p < 0.05), and 37.45% (p < 0.05), respectively. The ASA/DHA ratio continued to significantly decrease by 18.63% (p < 0.05) (Figure 2A–F). The activities of ascorbate peroxidase (APX), guaiacol peroxidase (GPX), glutathione reductase (GR), and glutathione S-transferase (GST) significantly increased on the 5th day of flooding compared to Ctl, with increases of 18.7% (p < 0.05), 43.67% (p < 0.05), 93.91% (p < 0.05), and 100.9% (p < 0.05), respectively. By the 10th day of flooding, the activities of APX, monodehydroascorbate reductase (MDHAR), dehydroascorbate reductase (DHAR), GPX, GR, and GST significantly increased, with increases of 67.45% (p < 0.05), 376.61% (p < 0.05), 252.83% (p < 0.05), 141.15% (p < 0.05), 54.22% (p < 0.05), and 101.02% (p < 0.05), respectively. On the 15th day of flooding, the activities of APX, MDHAR, DHAR, GPX, GR, and GST also significantly increased, with increases of 51.74% (p < 0.05), 517.42% (p < 0.05), 301.72% (p < 0.05), 150.36% (p < 0.05), 281.11% (p < 0.05), and 61.93% (p < 0.05), respectively (Figure 2G–L).
The APX coding gene, namely APX3 (LOC21409303), showed no significant difference on the 5th day of flooding compared with Ctl (Figure 2M), while the expressions of the remaining genes were increased after flooding stress and then decreased on the 15th day of flooding. In addition, the expressions of MDHAR4 (LOC21403414) and MDHAR (LOC 21393482 and LOC 21396944) were down-regulated and up-regulated, respectively, after flooding stress. Except for GPX2 (LOC21407427), GPX encoding genes were not significantly different from Ctl on the 5th day of flooding, while other genes were significantly up-regulated under flooding stress. In addition, the expression of GR (LOC21393382) was significantly up-regulated after flooding stress. On the 5th and 10th days of flooding, GST coding genes, namely GST (LOC21394898, LOC21386514, LOC21390809, LOC21410549, and LOC21410550), were significantly up-regulated, while GST (LOC 21394898, LOC21390809, LOC214110549, and LOC21410550) were significantly up-regulated on the 15th day of flooding.

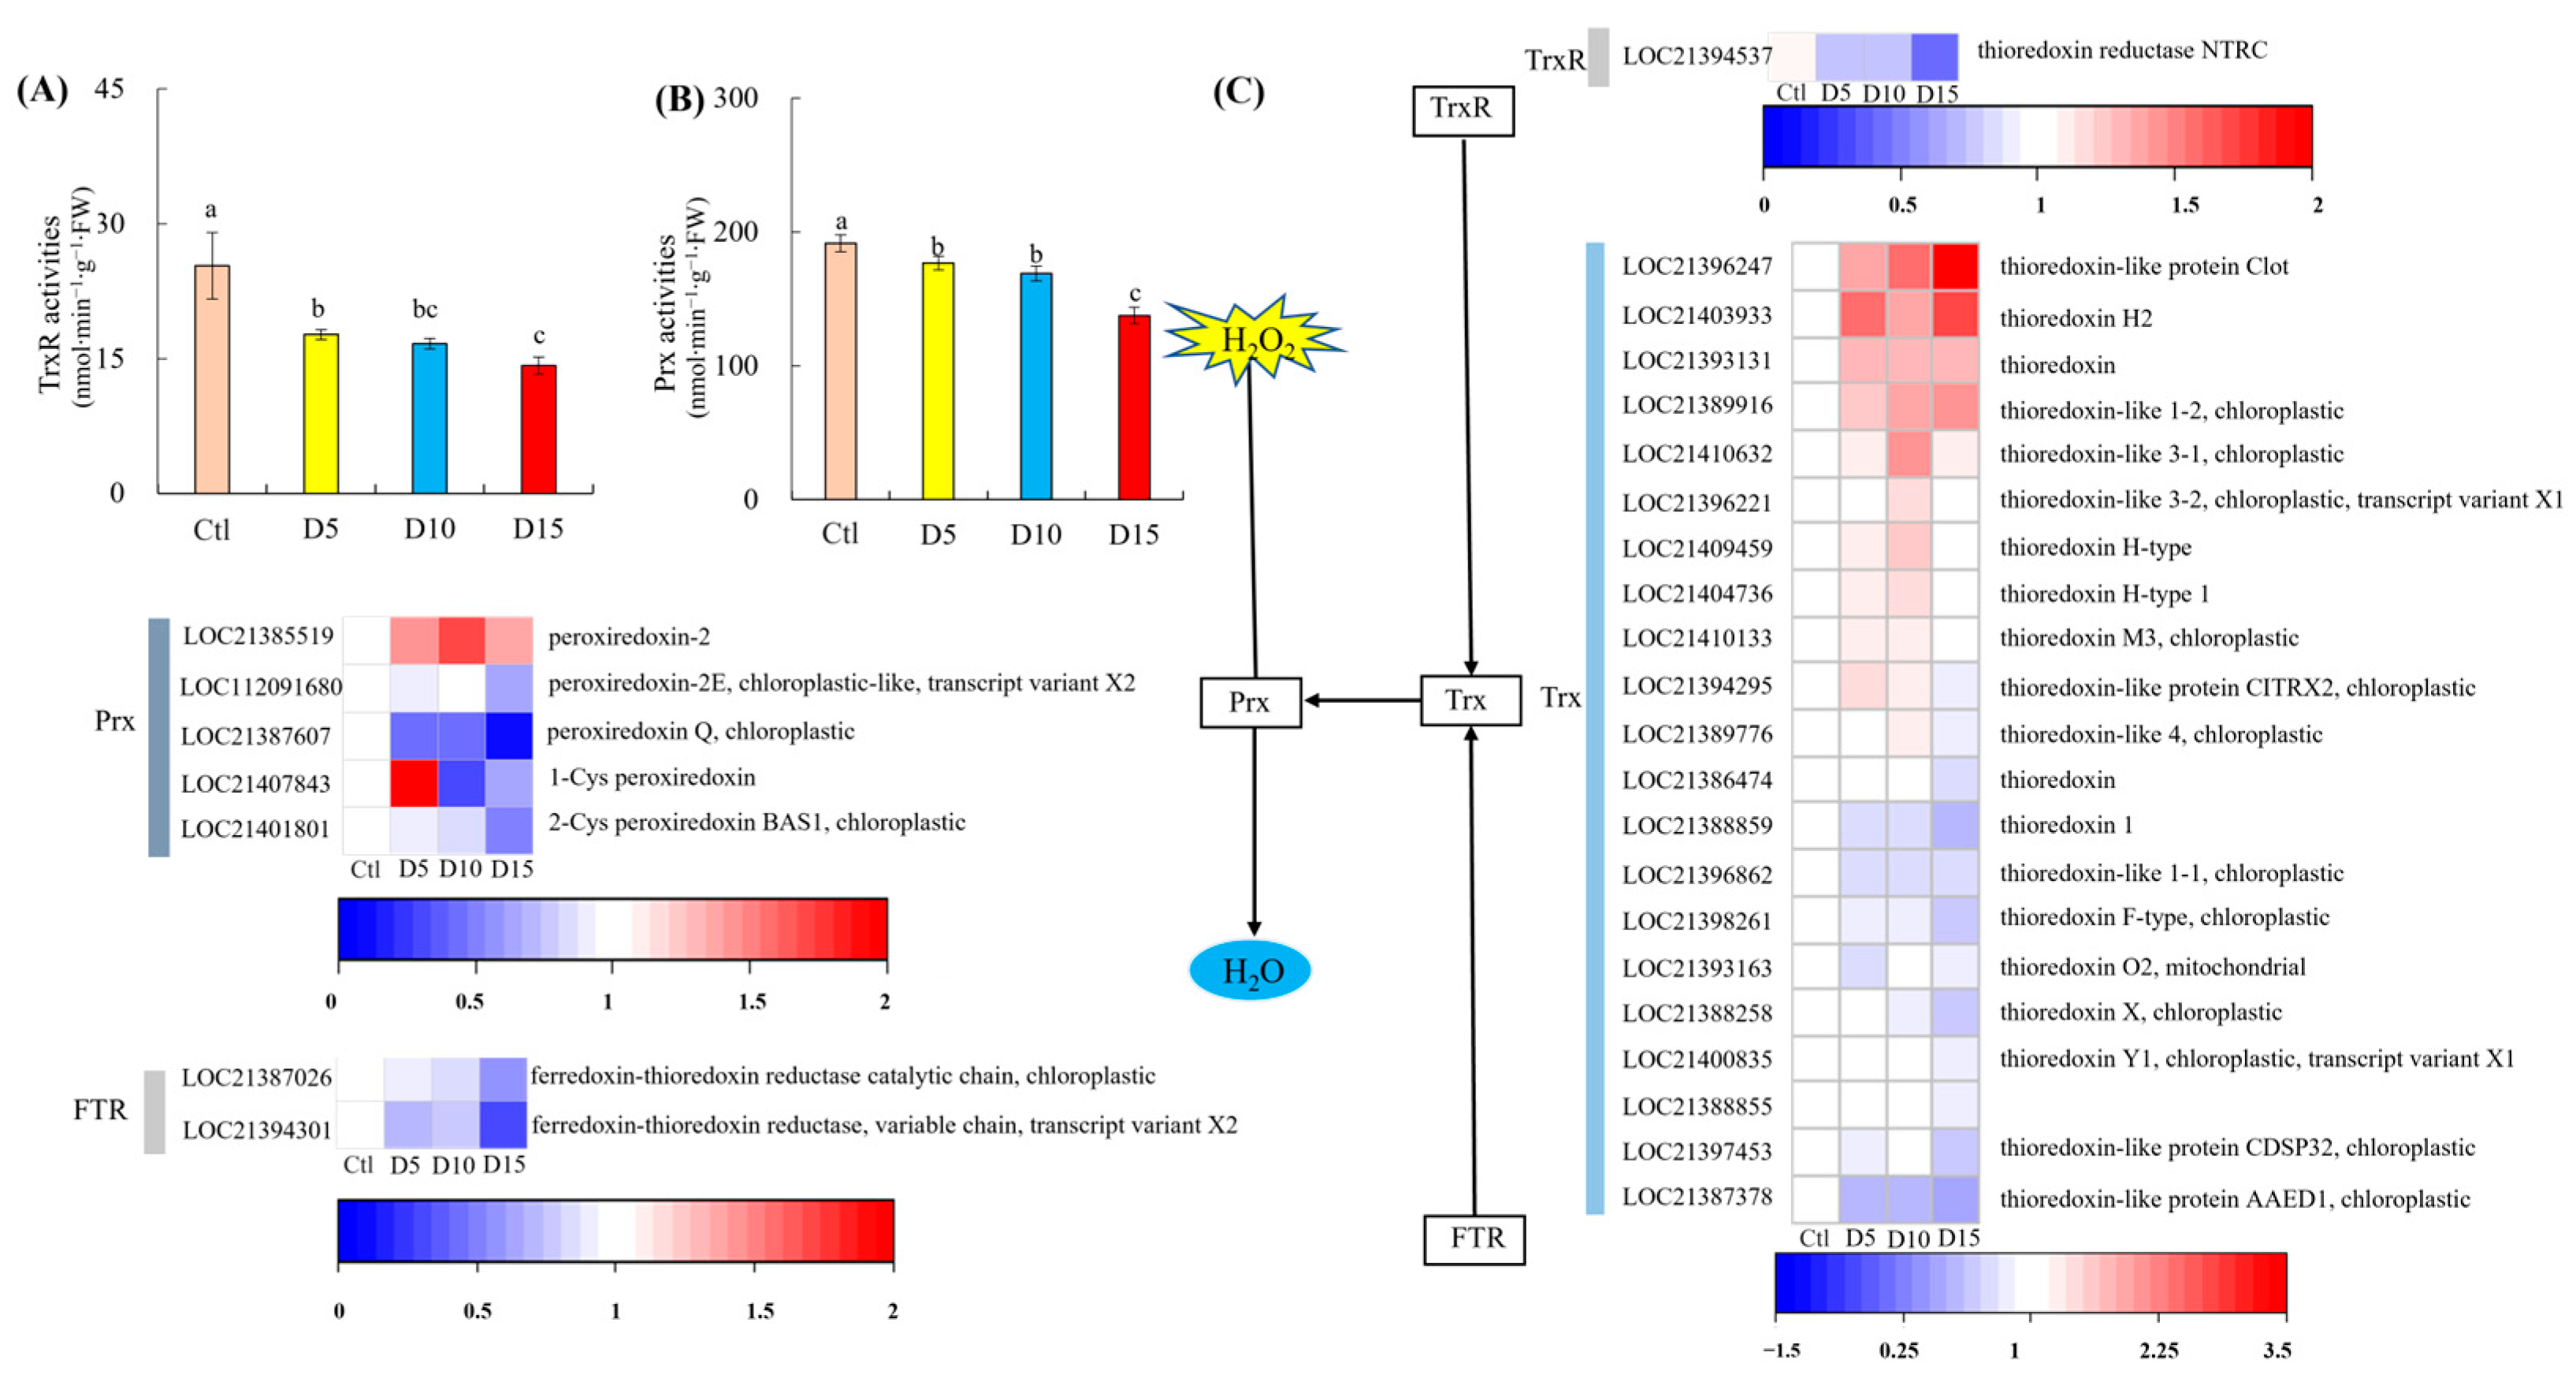
3.3. Expression of Trx-Prx Pathway-Related Proteins

As shown in Figure 3A,B, with the increase in flooding duration, the activities of thioredoxin reductase (TrxR) and peroxiredoxin (Prx) in mulberry leaves significantly decreased. On the 5th day of flooding, the activities of TrxR and Prx decreased by 30.23% (p < 0.05) and 7.65% (p < 0.05), respectively, compared to the control (Ctl). On the 10th day of flooding, the activities of TrxR and Prx decreased by 34.18% (p < 0.05) and 11.82% (p < 0.05), respectively, compared to Ctl. By the 15th day of flooding, the activities of TrxR and Prx showed further decreases of 43.96% (p < 0.05) and 28.26% (p < 0.05), respectively, compared to Ctl. The expression levels of TrxR (LOC21394537) and FTR (LOC21387026 and LOC21394301) were significantly down-regulated under flooding stress. In addition, compared to Ctl, the expressions of Trx (LOC21396247, LOC21403933, LOC2139311, LOC21389916, and LOC21410632) were significantly up-regulated under flooding stress, while the expressions of Trx (LOC21409459, LOC21404736, and LOC214010133) were significantly higher on the 5th and 10th day of flooding and revealed no significant change on the 15th day of flooding. The expressions of Trx (LOC21388859, LOC21396862, LOC21398261, LOC21393163, LOC21388258, LOC21397453, and LOC21387378) were significantly down-regulated under flooding stress. However, although the expressions of Trx (LOC21400835 and LOC2138855) were not significantly different from those observed in Ctl on the 5th and 10th day of flooding stress, they were significantly down-regulated on the 15th day of flooding stress.
Compared with Ctl, the expressions of Prx (LOC21385519 and LOC21407843) were significantly up-regulated, while the expressions of Prx (LOC112091680, LOC21387607, and LOC21401801) were significantly down-regulated on the 5th day of flooding. On the 10th day of flooding, the expressions of Prx, namely LOC21385519 and LOC112091680, exhibited significant up-regulation and no significant change, respectively, while the expressions of Prx (LOC21387607, LOC21407843, and LOC21401801) were significantly down-regulated. On the other hand, the expressions of all genes were significantly down-regulated on the 15th day of flooding, except for Prx (LOC21385519), which showed up-regulation (Figure 3C).

3.4. JA Signal

As shown in Figure 4A, with the increase in flooding duration, the content of jasmonic acid (JA) in mulberry leaves exhibited an upward trend, increasing by 24.54% (p < 0.05) on the 5th day of flooding, by 28.07% (p < 0.05) on the 10th day, and by 42.68% (p < 0.05) on the 15th day. The results suggested that 40 DEGs were involved in the synthesis of JA. In addition, the results showed significant up-regulation in five KAT, one MFP2, five ACX, seven OPCL1, two OPR, two AOC, two AOS, and one LOX genes under flooding stress. In addition, 13 DEGs were involved in the JA signal transduction process. Among them, the expressions of JAR1 and COI1 were significantly up-regulated (Figure 4B). In total, five genes among the eight coding genes of JAZ were significantly down-regulated under flooding stress. In the MYC2 coding gene, the expressions of MYC2 (LOC21406020 and LOC21406208) were down-regulated, while the expression of MYC2 (LOC21398450) was significantly up-regulated under flooding stress. By the 15th day of flooding, its expression was up-regulated by more than 13 times, compared to that observed in Ctl.

3.5. Impact of Flooding Duration on Pro, SS, and SP Contents in Mulberry Leaves

The Pro and SS contents in mulberry leaves increased significantly with increasing flooding duration by 209.29 (p < 0.05) and 47.78% (p < 0.05), respectively, on the 15th day of flooding compared with Ctl (Figure 5). In addition, compared with Ctl, the SP contents decreased slightly on the 5th and 10th day of flooding, without exhibiting significant differences, then decreased significantly on the 15th day of flooding by 19.40% (p < 0.05).

3.6. RT-qPCR Validation of Transcriptome Data

In order to identify the differential expressions of genes in mulberry leaves under normal growth and flooding stress screened by the transcriptome and the accuracy of their expression levels, 20 differentially expressed genes were randomly selected for the RT qPCR quantitative verification. The results showed that the differentially expressed genes were consistent with the results of transcriptome data, thus demonstrating that the results of transcriptome data were reliable and can further be used for the analysis of differentially expressed genes (Figure 6).

4. Discussion

The Adversities of stress can cause an imbalance of the plant photosystem and Mehler’s reaction, resulting in the accumulation of ROS ions, such as superoxide anion (O2•−) and hydrogen peroxide (H2O2) [42,63]. ROS ions can also be accumulated as a result of an aerobic respiration imbalance and anaerobic metabolic process induced by flooding stress [21]. In addition, the accumulation of ROS ions can lead to toxic effects on plants [20,64,65]. Previous studies have found that flooding stress induces oxidative damage to the muscarine plant alkaloid by increasing the content of O2•− and H2O2, resulting in a high rate of lipid peroxidation in leaves and roots [21]. In this study, a significant increase in O2•− production rate and H2O2 content in mulberry leaves was observed on the 5th day of flooding, which is consistent with results reported in previous studies showing rapid increases in the contents of H2O2 in sesame (Sesamum indicum L. cv. BARI Til-4) [66], cotton (Gossypium hirsutum L.) [67] and soybean (Glycine max L. Merr. cv. Asoagari) [41] after flooding stress. The adversity of stress can also enhance the membrane lipid peroxidation and increase the malondialdehyde (MDA) content in plant leaves [68,69]. Studies have found that MDA contents in leaves of rice (Oryza sativa L.) increased significantly following flooding stress [70,71], which is consistent with the change in the MDA content revealed in the present study. This result can be explained by the fact that flooding stress can generate a large number of oxygen free radicals in plants, causing membrane lipid peroxidation in plants, thus increasing the MDA content. To prevent the potentially toxic effects of ROS, plants use an array of antioxidant enzymes and non-enzymatic scavengers to alleviate cellular damage under oxidative stress conditions [72,73]. Indeed, SOD is the first line of defense enzyme against ROS produced during flooding stress [66]. Previous studies showed increases in the SOD activity in Citrus [74], Zea mays [75,76], Cajanus cajan [77], and Hordeum vulgare [26] following flooding stress, which is consistent with the results reported in the present study showing significant up-regulation in the expression of Mn-SOD gene. However, the expression of the Cu/Zn-SOD gene in chloroplasts showed a downward trend over the flooding period. In fact, chloroplasts are the main sites of the production of O2•− under stress [60], explaining the significant increase in the O2•− rate produced in leaves under flooding stress. SOD can catalyze the conversion of O2•− to H2O2, which is a stable molecule that can either act as a signal or be further converted to water through the action of POD and CAT [78,79]. Enzymes such as SOD and POD in submergence-tolerant plants can remove the accumulated ROS by plants under submergence stress. For example, the activities of SOD and POD enzymes in leaves of Kandelia obovata were significantly increased following 8h of flooding, enhancing the resistance of seedlings to flooding stress [80]. The study found a notable increase in POD activity in mulberry leaves after 5 days of flooding, indicating a marked up-regulation of the POD gene expression. CAT is one of the main enzymes that scavenge lipid hydrogen peroxide. In addition, CAT can directly convert H2O2 to H2O, which is an essential substance for eliminating ROS under flooding stress [81]. Some studies have revealed increases in the CAT activity in Zea mays [75,82], Sesamum indicum [66], and Hordeum vulgare [26] under flooding stress. In this study, CAT activity and its gene expression showed increased first and then decreased behavior over the flooding experiment. The reduction in CAT activity highlights the crucial role of POD and SOD in oxygen-reactive scavenging systems, aligning with Ahmed et al.’s findings of decreased CAT activity in mungbean after 8 days of flooding [83].
The ascorbic acid–glutathione (AsA-GSH) system is crucial for eliminating ROS free radicals in plants [84]. AsA/DHA and GSH/GSSG can determine whether cells are under oxidative stress [85]. Compared to Ctl, the AsA and DHA contents in mulberry seedlings increased significantly over the flooding experiment, while the ratio of AsA/DHA decreased significantly, indicating that AsA and DHA contents of mulberry seedlings could be adjusted to resist flooding stress. Flooding stress promoted the reduction of GSSG to GSH and increased the GSH/GSSG ratio to resist the adverse environment. Wang et al. [86] pointed out that higher antioxidant content (AsA and GSH) and redox power (DHA and GSSG) in plants can effectively protect cell membranes from damage caused by flooding stress, which is consistent with the results of the current study. In the ASA-GSH cycle, the main enzymes are APX, MDHAR, DHAR, GPX, GR, and GST [87]. Wu et al. [88] showed that APX and DHAR are the two key enzymes with the strongest activity in the ASA-GSH cycle, and their activities can directly affect the ASA and DHA contents. H2O2 can be removed by APX through reduction to H2O. In our results, APX activity and the expression of coding genes were significantly up-regulated in mulberry seedlings under flooding stress, which is consistent with the findings reported by Damanik et al. [69], showing a significant up-regulation of the APX activity of rice plants at different growth stages due to flooding stress, thereby preventing plants from damage caused by flooding stress at high concentrations. On the other hand, the produced MDHAR can be oxidized to DHA. However, when MDHAR and DHAR are both present, DHAR utilizes GSH to reduce DHA, leading to the regeneration of ASA, which directly aids in O2•− clearance [89,90]. In our experimental results, the increase in the ASA content in mulberry seedlings under flooding stress was due to the combined effect of the increased activities of DHAR and MDHAR. GPX specifically catalyzes the reaction between reduced glutathione and ROS, forming oxidized glutathione (GSSG) and thereby protecting the biofilm from ROS damage [91]. In addition, the GR activity level is considered to be an important indicator of antioxidant status, which can directly affect the GSH content [92]. Anee et al. [66] revealed a significant increase and decrease in the GPX and GR activities, respectively, in sesame following 6 days of flooding stress. However, Ahmed et al. [83] showed an increase in the GR activity in Phaseolus radiatus at the early stage of flooding, playing a key role in the elimination of free radicals accumulated in cells. In the experiment of the present study, the GPX activity, GR activity, and the expression of related genes in mulberry leaves began to increase on the 5th day of flooding stress. Therefore, GST can remove LOOH (lipid hydroperoxides) [93]. In addition, flooding stress increased and up-regulated the GST activity and the encoded genes, respectively, to varying degrees. These findings are consistent with those reported by Wu et al. [94], showing a higher expression of DEGs encoding antioxidant enzymes of Nymphoides peltata under flooding conditions than under normal conditions. Conversely, the Trx-Prx pathway, a part of the redox system [89], regulates redox signaling during development by controlling the exchange of dimercapto-disulfide bonds in target proteins [95,96,97]. Nishizawa et al. [98] found a higher Prx activity in soybean [glycine max (L.) merr.] under flooding conditions than in normal seedlings. This finding was not consistent with that observed in the current study, showing a down-regulation in the Prx activity and expression of the coding gene in mulberry leaves following flooding stress. Trx is present in all plant kingdoms, acting as a regulator of the Prx activity [89]. The results of the current study showed down-regulation in most genes encoded by Trx, which may explain the lack of an increase in the Prx expression. Additionally, FTR is known to facilitate the transfer of electrons from Fd to Trx [99]. Our results showed a down-regulation in the expression of FTR in mulberry leaves under flooding stress, indicating inhibition of electrons supply for Trx. This finding could also explain the significant limitation of ROS scavenging by the Trx-Prx pathway in mulberry leaves under flooding stress.
Plant hormones are crucial for growth, development, and responses to both biotic and abiotic stresses [100,101,102]. Jasmonic acid (JA) improves relative water content and water use efficiency by employing proline to decrease water potential and osmotic pressure, thereby preventing leaf dehydration. In addition, JA activation plays an important role in ion homeostasis, which is related to the induction of transporters, namely SOS1, NHX2, and HVP1 [33]. The increase in the JA level can effectively improve ion transport, osmotic regulation, and antioxidant defense [103]. Previous studies have revealed temporal increases in JA levels in leaves of all citrus genotypes under flooding stress. However, increased contents in JA were observed earlier in the flood-sensitive plant genotypes [104]. Xu et al. [105] found that the JA content in the hypocotyl of the waterlogging-sensitive cucumber strain Peplno was about twice as much as that observed in the control group after 2 days of flooding. The JA content in the hypocotyl of waterlogging-tolerant Zaoer-N decreased significantly following flooding stress, indicating a negative correlation between JA contents and waterlogging tolerance. The results of the current study showed increases in JA contents in mulberry leaves under flooding stress, while JA synthesis-related genes, namely LOX, AOS, AOC, OPR, OPCL1, ACX, MFP2, and KAT, were up-regulated to varying degrees. Other studies have reported similar findings, affirming the role of JA as an early mediator linking stress perception to the activation of physiological responses [106,107,108]. An increase in JA content activates the JA signaling pathway. JA- and ATP-dependent JAR1 generates JA-Ile, which facilitates the binding of JA receptor proteins (COI1 and JAZ), promotes JAZ degradation by the 26S proteasome, and relieves the inhibition of the transcription factor MYC2, thereby initiating the transcription of JA response genes [109].
In this study, 13 DEGs of the plant hormone signal transduction pathway were involved in the JA signal transduction process. Therefore, flooding stress can activate the transduction process of the JA hormone signal by inducing JA synthesis, promoting the transcriptional activity of JAR1, COI1, and MYC2, inhibiting the expression of JAZ, and improving the adaptability of mulberry to flooding stress.
The concentration of solute molecules inside and outside the root system of plants can vary significantly under flooding stress. The concentration of solute in the cell was higher than that observed in the flooded environment, resulting in a lower intracellular osmotic potential than the extracellular osmotic potential, promoting the absorption of water by the cells of plants to form turgor and causing damage to cells of plants [110]. Plants can adapt to a certain range of environmental stress. Indeed, proline (Pro), an osmotic protective molecule, can maintain and improve the water status of plants [64]. Pro can be used as an antioxidant to protect cells from free radicals and maintain the cellular environment, thereby effectively synthesizing biomolecules that play a role in stress adaptation [111]. Previous studies have shown exponential increases in the Pro contents in plant cells under flooding stress, which maintain cell turgor and protect enzymes and membrane systems from damage caused by flooding. Other studies have highlighted a correlation between the free Pro contents and the waterlogging tolerance of plants in vivo [112]. In addition, relevant studies have indicated an increase in the Pro content in highland barley and cucumber by 90 and 58.9% following 120 h and 10 days of flooding, respectively [111,113], which is consistent with the results of the current study, showing an increase in Pro content by more than 2 times of that observed in Ctl after 15 days of flooding, with strong osmotic adjustment ability. However, the Pro content of sesame leaves decreased after flooding stress. This finding may be due to the low tolerance or high sensitivity of this sesame variety, leading to the reduction of the osmotic adjustment ability of plant cells [64]. Soluble sugar (SS) is an important osmotic regulator, which can be regulated by plant cells to maintain the balance of osmotic potential under flooding conditions. This phenomenon is considered a mechanism of adaptation and protection of plants to the adversity of stress [114]. For example, SS, reducing sugar and sucrose contents in rice leaves (Oryza sativa) increased under flooding stress [115]. Albrecht et al. [116] and Mustroph et al. [117] revealed rapid increases in soluble sugar contents in wheat roots under hypoxia and hypoxia, which can maintain high rates of anaerobic respiration and energy supply [114]. These findings are consistent with the results reported in the present study. The buildup of soluble proteins (SP) serves as a key adaptive mechanism in plants under flooding stress [118]. Luki et al. [119] and Tian et al. [120] showed a significant increase in SP contents in Maize (Zea mays L.) hybrids, thereby reducing the damage caused by flooding stress. However, the results of the current study revealed a downward trend in SP contents in mulberry leaves, suggesting the synthesis of plant protein may be inhibited [121,122].
The results of the present study showed significant increases in the O2•− production rate, H2O2, and MDA contents in leaves on the 5th day of flooding stress. In addition, although CAT activity and CAT gene expression increased first and then decreased over the flooding period, the ability of ROS scavenging of SOD and POD was enhanced. Moreover, the AsA-GSH cycle in mulberry leaves was enhanced as a result of flooding stress. Although plants reduced the AsA/DHA ratio to resist external environmental stress, they promoted the reduction of GSSG to GSH and increased the GSH/GSSG ratio to resist adverse environmental conditions. The activities of APX, MDHAR, GPX, GR, and GST in leaves and the expression of their coding genes were increased following flooding stress to eliminate the accumulated free radicals and lipid hydroperoxidase in cells. However, the results indicated that the ability to eliminate ROS through the Trx-Prx pathway was limited. In addition, JA contents and JA synthesis-related genes in mulberry leaves were increased and up-regulated, respectively, under flooding stress to varying degrees. The increase in the JA content activated the JA signaling pathway and improved the adaptability of mulberry to flooding stress. On the other hand, a marked increase in the Pro content was noted in this study, maintaining the expansion of plant cells and protecting enzymes and membrane systems from damage caused by flooding stress. Moreover, SS contents showed a similar trend pattern, which can maintain high rates of anaerobic respiration and maintain energy supply, while SP contents showed a downward trend, inhibiting the synthesis of plant proteins.

5. Conclusions

The physiological and molecular response mechanisms of plants to flooding stress are complex and variable. This study utilized physiological and transcriptomic techniques to analyze the response mechanisms of mulberry varieties under flooding stress conditions. We found that after flooding stress, oxidative damage to the leaves increased, while the activity of antioxidant enzymes and the ability to scavenge intracellular reactive oxygen species (ROS) was enhanced, with the expression levels of related genes up-regulated. Although the content of soluble proteins decreased, the levels of proline and soluble sugars significantly increased, indicating that soluble sugars (SS) and proline (Pro) play important roles in osmoregulation in mulberry trees under flooding stress. Furthermore, the content of jasmonic acid (JA) and the expression levels of related synthesis genes in the leaves significantly increased under flooding stress, suggesting that the activation of the JA signaling pathway is crucial for enhancing the adaptation of mulberry trees to flooding stress. Our findings contribute to a deeper understanding of the complex regulatory mechanisms involved in mulberry responses to flooding stress and provide important information for future molecular breeding efforts.

Author Contributions

Conceptualization, X.B. and H.H.; methodology, D.L.; software, X.C.; validation, S.W. and H.H.; formal analysis, W.Z.; investigation, Y.W.; data curation, S.Q.; writing—original draft preparation, X.B.; writing—review and editing, S.Q. and Y.W.; visualization, Y.W.; supervision, F.Y.; project administration, H.H. All authors have read and agreed to the published version of the manuscript.

Funding

This work was supported by the National Natural Science Foundation of China [Grant No. 32271843] and the National Forestry and Grass Bureau science and technology innovation research and development project [Grant No. LLC202407].

Data Availability Statement

The NCBI database SRA accession number for the raw high-throughput sequencing data of soil bacterial communities is PRJNA939272, and the number for fungal communities is PRJNA939403.

Acknowledgments

Thank you to everyone who contributed to this article.

Conflicts of Interest

Author Dan Li was employed by the company Liaoning Non-Ferrous Geological Exploration and Research Institute Co., Ltd. Author Fei Yang was employed by the company Liaoning Province Nonferrous Geology 104 Team Co., Ltd. The remaining authors declare that the research was conducted in the absence of any commercial or financial relationships that could be construed as a potential conflict of interest.

References

  1. Deng, X.B.; Yang, D.; Sun, H.; Liu, J.; Song, H.Y.; Xiong, Y.Q.; Wang, Y.M.; Ma, J.Y.; Zhang, M.H.; Li, J.; et al. Time-course analysis and transcriptomic identification of key response strategies to complete submergence in Nelumbo nucifera. Hortic. Res. 2022, 9, uhac001. [Google Scholar] [CrossRef]
  2. Ahmed, M.; Stockle, C.O. Quantification of Climate Variability, Adaptation and Mitigation for Agricultural Sustainability; Springer: Berlin/Heidelberg, Germany, 2017. [Google Scholar]
  3. Tanoue, M.; Hirabayashi, Y.; Ikeuchi, H. Global-scale river flood vulnerability in the last 50 years. Sci. Rep. 2016, 6, 36021. [Google Scholar] [CrossRef]
  4. Kundzewicz, Z.W.; Kanae, S.; Seneviratne, S.I.; Handmer, J.; Nicholls, N.; Peduzzi, P.; Mechler, R.; Bouwer, L.M.; Arnell, N.; Mach, K.; et al. Flood risk and climate change: Global and regional perspectives. Hydrol. Sci. J. 2014, 59, 1–28. [Google Scholar] [CrossRef]
  5. Zhang, W.; Pan, S.M.; Cao, L.G.; Cai, X.; Zhang, K.X.; Xu, Y.H.; Xu, W. Changes in extreme climate events in eastern China during 1960–2013: A case study of the Huaihe River Basin. Quat. Int. 2015, 380, 22–34. [Google Scholar] [CrossRef]
  6. Iqbal, Z.; Sarkhosh, A.; Balal, R.M.; Gomez, C.; Zubair, M.; Ilyas, N.; Khan, N.; Shahid, M.A. Silicon alleviate hypoxia stress by improving enzymatic and non-enzymatic antioxidants and regulating nutrient uptake in muscadine grape (Muscadinia rotundifolia Michx.). Front. Plant Sci. 2021, 11, 618873. [Google Scholar] [CrossRef]
  7. Geigenberger, P. Response of plant metabolism to too little oxygen. Curr. Opin. Plant Biol. 2003, 6, 247–256. [Google Scholar] [CrossRef]
  8. Kaelke, C.M.; Dawson, J.O. Seasonal flooding regimes influence survival, nitrogen fixation, and the partitioning of nitrogen and biomass in Alnus incana ssp rugosa. Plant Soil 2003, 254, 167–177. [Google Scholar] [CrossRef]
  9. Fukao, T.; Bailey-Serres, J. Ethylene—A key regulator of submergence responses in rice. Plant Sci. 2008, 175, 43–51. [Google Scholar] [CrossRef]
  10. Arbona, V.; Hossain, Z.; Lopez-Climent, M.F.; Perez-Clemente, R.M.; Gomez-Cadenas, A. Antioxidant enzymatic activity is linked to waterlogging stress tolerance in citrus. Physiol. Plantarum. 2008, 132, 452–466. [Google Scholar] [CrossRef]
  11. Olgun, M.; Kumlay, A.M.; Adiguzel, M.C.; Caglar, A. The effect of waterlogging in wheat (Triticum aestivum L.). Acta Agric. Scand. Sect. B Soil Plant Sci. 2008, 58, 193–198. [Google Scholar]
  12. Greenway, H.; Armstrong, W.; Colmer, T.D. Conditions leading to high CO2 (>5kPa) in waterlogged–flooded soils and possible effects on root growth and metabolism. Ann. Bot. 2006, 98, 9–32. [Google Scholar] [CrossRef]
  13. Akhtar, I.; Nazir, N. Effect of waterlogging and drought stress in plants. Int. J. Water Resour. Environ. Sci. 2013, 2, 34–40. [Google Scholar]
  14. Osakabe, Y.; Osakabe, K.; Shinozaki, K.; Tran, L.S.P. Response of plants to water stress. Front. Plant Sci. 2014, 5, 86. [Google Scholar] [CrossRef]
  15. Asif, M.; Kamran, A. Plant breeding for water-limited environments. Crop Sci. 2011, 51, 2911–2912. [Google Scholar] [CrossRef]
  16. Gray, S.B.; Brady, S.M. Plant developmental responses to climate change. Dev. Biol. 2016, 419, 64–77. [Google Scholar] [CrossRef]
  17. Fukao, T.; Bailey-Serres, J. Plant responses to hypoxia—Is survival a balancing act? Trends Plant Sci. 2004, 9, 449–456. [Google Scholar] [CrossRef]
  18. Islam, M.A.; Macdonald, S.E. Ecophysiological adaptations of black spruce (Picea mariana) and tamarack (Larix laricina) seedlings to flooding and nutrition stress. Trees 2004, 18, 35–42. [Google Scholar] [CrossRef]
  19. Green, J.; Crack, J.C.; Thomson, A.J.; Lebrun, N.E. Bacterial sensors of oxygen. Curr. Opin. Microbiol. 2009, 12, 145–151. [Google Scholar] [CrossRef]
  20. Mittler, R.; Vanderauwera, S.; Gollery, M.; Van Breusegem, F. Reactive oxygen gene network of plants. Trends Plant Sci. 2004, 9, 490–498. [Google Scholar] [CrossRef]
  21. Blokhina, O.; Virolainen, E.; Fagerstedt, K.V. Antioxidants, oxidative damage and oxygen deprivation stress: A review. Ann. Bot. 2003, 91, 179–194. [Google Scholar] [CrossRef]
  22. Ushimaru, T.; Shibasaka, M.; Tsuji, H. Development of the O2•−-detoxification system during adaptation to air of submerged rice seedlings. Plant Cell Physiol. 1992, 33, 1065–1071. [Google Scholar]
  23. Hurng, W.P.; Kao, C.H. Effect of flooding on the activities of some enzymes of activated oxygen metabolism, the levels of antioxidants, and lipid peroxidation in senescing tobacco leaves. Plant Growth Regul. 1994, 14, 37–44. [Google Scholar] [CrossRef]
  24. Hurng, W.P.; Kao, C.H. Lipid peroxidation and antioxidative enzymes in senescing tobacco leaves during post-flooding. Plant Sci. 1994, 96, 41–44. [Google Scholar] [CrossRef]
  25. Grassini, P.; Indaco, G.V.; Pereira, M.L.; Hall, A.J.; Trapani, N. Responses to short-term waterlogging during grain filling in sunflower. Field Crops Res. 2007, 101, 352–363. [Google Scholar] [CrossRef]
  26. Zhang, G.P.; Tanakamaru, K.; Abe, J.; Morita, S. Influence of waterlogging on some anti-oxidative enzymatic activities of two barley genotypes differing in anoxia tolerance. Acta Physiol. Plant. 2007, 29, 171–176. [Google Scholar] [CrossRef]
  27. Shi, F.; Yamamoto, R.; Shimamura, S.; Hiraga, S.; Nakayama, N.; Nakamura, T.; Yukawa, K.; Hachinohe, M.; Matsumoto, H.; Komatsu, S. Cytosolic ascorbate peroxidase 2 (cAPX 2) is involved in the soybean response to flooding. Phytochemistry 2008, 69, 1295–1303. [Google Scholar] [CrossRef]
  28. Zhao, N.; Li, C.W.; Yan, Y.J.; Cao, W.; Song, A.P.; Wang, H.B.; Chen, S.M.; Jiang, J.F.; Chen, F.D. Comparative transcriptome analysis of waterlogging-sensitive and waterlogging-tolerant chrysanthemum morifolium cultivars under waterlogging stress and reoxygenation conditions. Int. J. Mol. Sci. 2018, 19, 1455. [Google Scholar] [CrossRef]
  29. Ayano, M.; Kani, T.; Kojima, M.; Sakakibara, H.; Kitaoka, T.; Kuroha, T.; Angeles-Shim, R.B.; Kitano, H.; Nagai, K.; Ashikari, M. Gibberellin biosynthesis and signal transduction is essential for internode elongation in deepwater rice. Plant Cell Environ. 2014, 37, 2313–2324. [Google Scholar] [CrossRef]
  30. Schmitz, A.J.; Folsom, J.J.; Jikamaru, Y.; Ronald, P.; Walia, H. SUB1A-mediated submergence tolerance response in rice involves differential regulation of the brassinosteroid pathway. New Phytol. 2013, 198, 1060–1070. [Google Scholar] [CrossRef]
  31. Kim, Y.H.; Hwang, S.J.; Wagas, M.; Khan, A.L.; Lee, J.H.; Lee, J.D.; Nguyen, H.T.; Lee, I.J. Comparative analysis of endogenous hormones level in two soybean (Glycine max L.) lines differing in waterlogging tolerance. Front. Plant Sci. 2015, 6, 714. [Google Scholar] [CrossRef]
  32. Alisofi, S.; Einali, A.; Sangtarash, M.H. Jasmonic acid-induced metabolic responses in bitter melon (Momordica charantia) seedlings under salt stress. J. Pomol. Hortic. Sci. 2019, 95, 247–259. [Google Scholar] [CrossRef]
  33. Wan, S.W.; Xin, X.F. Regulation and integration of plant jasmonate signaling: A comparative view of monocot and dicot. J. Genet. Genom. 2022, 49, 704–714. [Google Scholar] [CrossRef] [PubMed]
  34. Ou, L.J.; Zou, C.H.; Liu, Z.B.; Wei, G.; Yang, B.Z.; Zou, X.X. Mitigation of waterlogging-induced damages to pepper by exogenous MeJA. Pak. J. Bot. 2017, 49, 1127–1135. [Google Scholar]
  35. Balfagon, D.; Sengupta, S.; Gomez-Cadenas, A.; Fritschi, F.B.; Azad, R.; Mittler, R.; Zandalinas, S.I. Jasmonic acid is required for plant acclimation to a combination of high light and heat stress. Plant Physiol. 2019, 181, 1668–1682. [Google Scholar] [CrossRef]
  36. Ghaffari, H.; Tadayon, M.R.; Nadeem, M.; Razmjoo, J.; Cheema, M. Foliage applications of jasmonic acid modulate the antioxidant defense under water deficit growth in sugar beet. Span. J. Agric. Res. 2019, 17, e0805. [Google Scholar] [CrossRef]
  37. Sun, Y.P.; Wang, F.W.; Wang, N.; Dong, Y.Y.; Liu, Q.; Zhao, L.; Chen, H.; Liu, W.C.; Yin, H.L.; Zhang, X.M. Transcriptome exploration in Leymus chinensis under saline-alkaline treatment using 454 pyrosequencing. PLoS ONE 2013, 8, e53632. [Google Scholar] [CrossRef]
  38. Geng, G.; Lv, C.H.; Stevanato, P.; Li, R.R.; Liu, H.; Yu, L.H.; Wang, Y.G. Transcriptome analysis of salt-sensitive and tolerant genotypes reveals salt-tolerance metabolic pathways in sugar beet. Int. J. Mol. Sci. 2020, 20, 5910. [Google Scholar] [CrossRef]
  39. Borrego-Benjumea, A.; Carter, A.; Tucker, J.R.; Yao, Z.; Xu, W.; Badea, A. Genome-wide analysis of gene expression provides new insights into waterlogging responses in Barley (Hordeum vulgare L.). Plants 2020, 9, 240. [Google Scholar] [CrossRef]
  40. Fu, S.H.; Chang, P.L.; Friesen, M.L.; Teakle, N.L.; Tarone, A.M.; Sze, S.H. Identifying similar transcripts in a related organism from de Bruijn graphs of RNA-Seq data, with applications to the study of salt and waterlogging tolerance in Melilotus. BMC Genom. 2019, 20, 425. [Google Scholar] [CrossRef]
  41. Alam, I.; Lee, D.G.; Kim, K.H.; Park, C.H.; Sharmin, S.A.; Lee, H.; Oh, K.W.; Yun, B.W.; Lee, B.H. Proteome analysis of soybean roots under waterlogging stress at an early vegetative stage. J. Biosci. 2010, 35, 49–62. [Google Scholar] [CrossRef]
  42. Zeng, B.; Zhang, Y.J.; Zhang, A.L.; Qiao, D.D.; Ren, J.C.; Li, M.Y.; Cai, K.; Zhang, J.H.; Huang, L.K. Transcriptome profiling of two Dactylis glomerata L. cultivars with different tolerance in response to submergence stress. Phytochemistry 2020, 175, 112378. [Google Scholar] [CrossRef] [PubMed]
  43. Peng, Y.J.; Zhou, Z.X.; Zhang, Z.; Yu, X.L.; Zhang, X.Y.; Du, K.B. Molecular and physiological responses in roots of two full-sib poplars uncover mechanisms that contribute to differences in partial submergence tolerance. Sci. Rep. 2018, 8, 12829. [Google Scholar] [CrossRef] [PubMed]
  44. Li, R.X.; Su, X.Q.; Zhou, R.; Zhang, Y.P.; Wang, T.C. Molecular mechanism of mulberry response to drought stress revealed by complementary transcriptomic and iTRAQ analyses. Bmc Plant Biol. 2022, 22, 18. [Google Scholar] [CrossRef] [PubMed]
  45. Liu, Y.; Ji, D.F.; Turgeon, R.; Chen, J.; Lin, T.B.; Huang, J.; Luo, J.; Zhu, Y.; Zhang, C.K.; Lv, Z.Q. Physiological and Proteomic Responses of Mulberry Trees (Morus alba L.) to Combined Salt and Drought Stress. Int. J. Mol. Sci. 2019, 20, 2486. [Google Scholar] [CrossRef]
  46. Li, Y.; Huang, J.; Yu, C.; Mo, R.; Zhu, Z.; Dong, Z.; Hu, X.; Zhuang, C.; Deng, W. Physiological and Transcriptome Analyses of Photosynthesis in Three Mulberry Cultivars within Two Propagation Methods (Cutting and Grafting) under Waterlogging Stress. Plants 2023, 12, 2066. [Google Scholar] [CrossRef]
  47. Zhang, C.G.; Leung, K.K.; Wong, Y.S.; Tam, N.F.Y. Germination, growth and physiological responses of mangrove plant (Bruguiera gymnorrhiza) to lubricating oil pollution. Environ. Exp. Bot. 2007, 60, 127–136. [Google Scholar] [CrossRef]
  48. Alexieva, V.; Sergiev, I.; Mapelli, S.; Karanov, E. The effect of drought and ultraviolet radiation on growth and stress markers in pea and wheat. Plant Cell Environ. 2001, 24, 1337–1344. [Google Scholar] [CrossRef]
  49. Buege, J.A.; Aust, S.D. Microsomal lipid peroxidation. Methods Enzymol. 2004, 52, 302–310. [Google Scholar]
  50. Wang, P.; Sun, X.; Li, C.; Wei, Z.W.; Liang, D.; Ma, F.W. Long-term exogenous application of melatonin delays drought-induced leaf senescence in apple. J. Pineal Res. 2012, 54, 292–302. [Google Scholar] [CrossRef]
  51. Rahman, I.; Kode, A.; Biswas, S.K. Assay for quantitative determination of glutathione and glutathione disulfide levels using enzymatic recycling method. Nat. Protoc. 2006, 1, 3159–3165. [Google Scholar] [CrossRef]
  52. Fridovich, I. Superoxide dismutases. Annu. Rev. Biochem. 2013, 44, 147–159. [Google Scholar] [CrossRef] [PubMed]
  53. Bernroitner, M.; Zamocky, M.; Furtmuller, P.G.; Peschek, G.A.; Obinger, C. Occurrence, phylogeny, structure, and function of catalases and peroxidases in cyanobacteria. J. Exp. Bot. 2009, 60, 423–440. [Google Scholar] [CrossRef] [PubMed]
  54. Cakmak, I.; Marschner, H. Magnesium deficiency and high light intensity enhance activities of superoxide dismutase, ascorbate peroxidase, and glutathione reductase in bean leaves. Plant Physiol. 1992, 98, 1222–1227. [Google Scholar] [CrossRef] [PubMed]
  55. Yoshiyuki, N.; Kozi, A. Hydrogen peroxide is scavenged by ascorbate-specific peroxidase in spinach chloroplasts. Plant Cell Physiol. 1981, 22, 867–880. [Google Scholar]
  56. Arrigoni, O.; Dipierro, S.; Borraccino, G. Ascorbate free radical reductase, a key enzyme of the ascorbic acid system. FEBS Lett. 1981, 125, 242–244. [Google Scholar] [CrossRef]
  57. Bocova, B.; Huttova, J.; Liptakova, L.; Mistrik, I.; Olle, M.; Tamas, L. Impact of short-term cadmium treatment on catalase and ascorbate peroxidase activities in barley root tips. Biol. Plant. 2012, 56, 724–728. [Google Scholar] [CrossRef]
  58. Hossain, M.A.; Hasanuzzaman, M.; Fujita, M. Up-regulation of antioxidant and glyoxalase systems by exogenous glycinebetaine and proline in mung bean confer tolerance to cadmium stress. Physiol. Mol. Biol. Plants 2010, 16, 259–272. [Google Scholar] [CrossRef]
  59. Hossain, M.Z.; Hossain, M.D.; Fujita, M. Induction of pumpkin glutathione S-transferases by different stresses and its possible mechanisms. Biol. Plant. 2006, 50, 210–218. [Google Scholar] [CrossRef]
  60. Wang, Y.; Yu, Y.T.; Zhang, H.B.; Huo, Y.Z.; Liu, X.Q.; Che, Y.H.; Wang, J.C.; Sun, G.Y.; Zhang, H.H. The phytotoxicity of exposure to two polybrominated diphenyl ethers (BDE47 and BDE209) on photosynthesis and the response of the hormone signaling and ROS scavenging system in tobacco leaves. J. Hazard. Mater. 2022, 424, 127265. [Google Scholar] [CrossRef]
  61. Li, H.S. Principles and Techniques of Plant Physiological and Biochemical Experiments; Higher Education Press: Beijing, China, 2000. [Google Scholar]
  62. Livak, K.J.; Schmittgen, T.D. Analysis of relative gene expression data using real-time quantitative PCR and the 2(-Delta Delta C(T)) Method. Methods 2001, 25, 402–408. [Google Scholar] [CrossRef]
  63. Inze, D.; Montagu, V.M. Oxidative Stress in Plants. In Taylor and Francis; CRC Press: Boca Raton, FL, USA, 2001. [Google Scholar]
  64. Ashraf, M. Biotechnological approach of improving plant salt tolerance using antioxidants as markers. Biotechnol. Adv. 2009, 27, 84–93. [Google Scholar] [CrossRef] [PubMed]
  65. Narayanan, S.; Ruma, D.; Gitika, B.; Sharma, S.K.; Pauline, T.; Ram, M.S.; Ilavazhagan, G.; Sawhney, R.C.; Kumar, D.; Banerjee, P.K. Antioxidant activities of seabuckthorn (Hippophae rhamnoides) during hypoxia induced oxidative stress in glial cells. Mol. Cell. Biochem. 2005, 278, 9–14. [Google Scholar] [CrossRef] [PubMed]
  66. Anee, T.I.; Nahar, K.; Rahman, A.; Al-Mahmud, J.; Bhuiyan, T.F.; Ul-Alam, M.; Fujita, M.; Hasanuzzaman, M. Oxidative damage and antioxidant defense in sesamum indicum after different waterlogging durations. Plants 2019, 8, 196. [Google Scholar] [CrossRef] [PubMed]
  67. Zhang, Y.J.; Chen, Y.Z.; Lu, H.Q.; Kong, X.Q.; Dai, J.L.; Li, Z.H.; Dong, H.Z. Growth, lint yield and changes in physiological attributes of cotton under temporal waterlogging. Field Crops Res. 2016, 194, 83–93. [Google Scholar] [CrossRef]
  68. Labudda, M. Lipid Peroxidation as a Biochemical Marker for Oxidative Stress during Drought. An Effective Tool for Plant Breeding. E-Wydawnictwo, Poland. 2013. Available online: http://www.e-wydawnictwo.eu/Document/DocumentPreview/334 (accessed on 6 March 2013).
  69. Pallavi, S.; Bhushan, J.A.; Shanker, D.R.; Mohammad, P. Reactive oxygen species, oxidative damage, and antioxidative defense mechanism in plants under stressful conditions. J. Bot. 2012, 2012, 217037. [Google Scholar]
  70. Damanik, R.I.; Maziah, M.; Ismail, M.R.; Ahmad, S.; Zain, A. Responses of the antioxidative enzymes in Malaysian rice (Oryza sativa L.) cultivars under submergence condition. Acta Physiol. Plant. 2010, 32, 739–747. [Google Scholar] [CrossRef]
  71. Ushimaru, T.; Ogawa, K.; Ishida, N.; Shibasaka, M.; Kanematsu, S.; Asada, K.; Tsuji, H. Changes in organelle superoxide dismutase isoenzymes during air adaptation of submerged rice seedlings: Differential behaviour of isoenzymes in plastids and mitochondria. Planta 1995, 196, 606–613. [Google Scholar] [CrossRef]
  72. Cheng, X.X.; Yu, M.; Zhang, N.; Zhou, Z.Q.; Xu, Q.T.; Mei, F.Z.; Qu, L.H. Reactive oxygen species regulate programmed cell death progress of endosperm in winter wheat (Triticum aestivum L.) under waterlogging. Protoplasma 2016, 253, 311–327. [Google Scholar] [CrossRef]
  73. Hernandez, M.; Fernandez-Garcia, N.; Diaz-Vivancos, P.; Olmos, E. A different role for hydrogen peroxide and the antioxidative system under short and long salt stress in Brassica oleracea roots. J. Exp. Bot. 2010, 61, 521–535. [Google Scholar] [CrossRef]
  74. Hossain, Z.; Lopez-Climent, M.F.; Arbona, V.; Perez-Clemente, R.M.; Gomez-Cadenas, A. Modulation of the antioxidant system in citrus under waterlogging and subsequent drainage. J. Plant Physiol. 2009, 166, 1391–1404. [Google Scholar] [CrossRef]
  75. Tian, L.X.; Li, J.; Bi, W.S.; Zuo, S.Y.; Li, L.J.; Li, W.L.; Sun, L. Effects of waterlogging stress at different growth stages on the photosynthetic characteristics and grain yield of spring maize (Zea mays L.) under field conditions. Agric. Water Manag. 2019, 218, 250–258. [Google Scholar] [CrossRef]
  76. Yadav, D.K.; Srivastava, J.P. Temporal changes in biochemical and antioxidant enzymes activities in Maize (Zea mays L.) under waterlogging stress during early growth stage. Int. J. Curr. Microbiol. Appl. Sci. 2017, 6, 351–362. [Google Scholar] [CrossRef]
  77. Kumutha, D.; Ezhilmathi, K.; Sairam, R.K.; Srivastava, G.C.; Deshmukh, P.S.; Meena, R.C. Waterlogging induced oxidative stress and antioxidant activity in pigeonpea genotypes. Biol. Plant. 2009, 53, 75–84. [Google Scholar] [CrossRef]
  78. Fukao, T.; Barrera-Figueroa, B.E.; Juntawong, P.; Pena-Castro, J.M. Submergence and waterlogging stress in plants: A review highlighting research opportunities and understudied aspects. Front. Plant Sci. 2019, 10, 340. [Google Scholar] [CrossRef] [PubMed]
  79. Zhang, X.C.; Shabala, S.; Koutoulis, A.; Shabala, L.; Johnson, P.; Hayes, D.; Nichols, D.S.; Zhou, M.X. Waterlogging tolerance in barley is associated with faster aerenchyma formation in adventitious roots. Plant Soil 2015, 394, 355–372. [Google Scholar] [CrossRef]
  80. Chen, L.Z.; Wang, W.Q.; Lin, P. Photosynthetic and physiological responses of Kandelia candel L. Druce seedlings to duration of tidal immersion in artificial seawater. Environ. Exp. Bot. 2005, 54, 256–266. [Google Scholar]
  81. Frank, V.B.; Eva, V.; James, F.D.; Dirk, I. The role of active oxygen species in plant signal transduction. Plant Sci. 2001, 161, 405–414. [Google Scholar]
  82. Tang, B.; Xu, S.Z.; Zou, X.L.; Zheng, Y.L.; Qiu, G.Z. Changes of antioxidative enzymes and lipid peroxidation in leaves and roots of waterlogging-tolerant and waterlogging-sensitive maize genotypes at seedling stage. Agric. Sci. China 2010, 9, 651–661. [Google Scholar] [CrossRef]
  83. Ahmed, S.; Nawata, E.; Hosokawa, M.; Domae, Y.; Sakuratani, T. Alterations in photosynthesis and some antioxidant enzymatic activities of mungbean subjected to waterlogging. Plant Sci. 2002, 163, 117–123. [Google Scholar] [CrossRef]
  84. Rahantaniaina, M.S.; Li, S.; Chatel-Innocenti, G.; Tuzet, A.; Issakidis-Bourguet, E.; Mhamdi, A.; Noctor, G. Cytosolic and chloroplastic DHARs cooperate in oxidative stress-driven activation of the salicylic acid pathway. Plant Physiol. 2017, 174, 956–971. [Google Scholar] [CrossRef]
  85. Liu, N.; Li, J.W.; Lv, J.; Yu, J.H.; Xie, J.M.; Wu, Y.; Tang, Z.Q. Melatonin alleviates imidacloprid phytotoxicity to cucumber (Cucumis sativus L.) through modulating redox homeostasis in plants and promoting its metabolism by enhancing glutathione dependent detoxification. Ecotoxicol. Environ. Saf. 2021, 217, 112248. [Google Scholar] [CrossRef] [PubMed]
  86. Wang, X.; Huang, M.; Zhou, Q.; Cai, J.; Dai, T.B.; Cao, W.X.; Jiang, D. Physiological and proteomic mechanisms of waterlogging priming improves tolerance to waterlogging stress in wheat (Triticum aestivum L.). Environ. Exp. Bot. 2016, 132, 175–182. [Google Scholar] [CrossRef]
  87. Luo, Q.X.; Peng, M.; Zhang, X.L.; Lei, P.; Ji, X.M.; Chow, W.; Meng, F.J.; Sun, G.Y. Comparative mitochondrial proteomic, physiological, biochemical and ultrastructural profiling reveal factors underpinning salt tolerance in tetraploid black locust (Robinia pseudoacacia L.). BMC Genom. 2017, 18, 648. [Google Scholar] [CrossRef]
  88. Wu, X.; Lu, X.M. Effects of brassinolide on the growth and ascorbate-glutathione cycle of cucumber seedling roots under suboptimal temperature, light and salt environment. Chin. J. Ecol. 2015, 34, 2149–2154. [Google Scholar]
  89. Zhang, H.H.; Li, X.; Guan, Y.P.; Li, M.B.; Wang, Y.; An, M.J.; Zhang, Y.H.; Liu, G.J.; Xu, N.; Sun, G.Y. Physiological and proteomic responses of reactive oxygen species metabolism and antioxidant machinery in mulberry (Morus alba L.) seedling leaves to NaCl and NaHCO3 stress. Ecotoxicol. Environ. Saf. 2020, 193, 110259. [Google Scholar]
  90. Jin, Y.H.; Tao, D.L.; Hao, Z.Q.; Ye, J.; Du, Y.J.; Liu, H.L.; Zhou, Y.B. Environmental stresses and redox status of ascorbate. Acta Bot. Sin. 2003, 45, 795–801. [Google Scholar]
  91. Yoshimura, K.; Miyao, K.; Gaber, A.; Takeda, T.; Kanaboshi, H.; Miyasaka, H.; Shigeoka, S. Enhancement of stress tolerance in transgenic tobacco plants overexpressing Chlamydomonas glutathione peroxidase in chloroplasts or cytosol. Plant J. 2004, 37, 21–33. [Google Scholar] [CrossRef]
  92. Uchida, A.; Jagendorf, A.T.; Hibino, T.; Takabe, T.; Takabe, T. Effects of hydrogen peroxide and nitric oxide on both salt and heat stress tolerance in rice. Plant Sci. 2002, 163, 515–523. [Google Scholar] [CrossRef]
  93. Cummins, I.; Cole, D.J.; Edwards, R. A role for glutathione transferases functioning as glutathione peroxidases in resistance to multiple herbicides in black-grass. Plant J. Cell Mol. Biol. 1999, 18, 285–292. [Google Scholar] [CrossRef]
  94. Wu, J.W.; Zhao, H.B.; Yu, D.; Xu, X.W. Transcriptome profiling of the floating-leaved aquatic plant Nymphoides peltata in response to flooding stress. BMC Genom. 2017, 18, 119. [Google Scholar] [CrossRef]
  95. Wang, Y.H.; Ying, Y.; Chen, J.; Wang, X.C. Transgenic Arabidopsis overexpressing Mn-SOD enhanced salt-tolerance. Plant Sci. 2004, 167, 671–677. [Google Scholar] [CrossRef]
  96. Hong, S.H.; Lee, S.S.; Chung, J.M.; Jung, H.S.; Singh, S.; Mondal, S.; Jang, H.H.; Cho, J.Y.; Bae, H.J.; Chung, B.Y. Site-specific mutagenesis of yeast 2-Cys peroxiredoxin improves heat or oxidative stress tolerance by enhancing its chaperone or peroxidase function. Protoplasma Int. J. Cell Biol. 2018, 254, 327–334. [Google Scholar] [CrossRef] [PubMed]
  97. Tripathi, B.N.; Bhatt, I.; Dietz, K.J. Peroxiredoxins: A less studied component of hydrogen peroxide detoxification in photosynthetic organisms. Protoplasma 2009, 235, 3–15. [Google Scholar] [CrossRef] [PubMed]
  98. Nishizawa, K.; Komatsu, S. Characteristics of soybean 1-Cys peroxiredoxin and its behavior in seedlings under flooding stress. Plant Biotechnol. 2011, 28, 83–88. [Google Scholar] [CrossRef]
  99. Balmer, Y.; Buchanan, B.B. Yet another plant thioredoxin. Trends Plant Sci. 2002, 7, 191–193. [Google Scholar] [CrossRef]
  100. Pacurar, D.I.; Perrone, I.; Bellini, C. Auxin is a central player in the hormone cross-talks that control adventitious rooting. Physiol. Plant. 2014, 151, 83–96. [Google Scholar] [CrossRef]
  101. Zou, X.L.; Tan, X.Y.; Hu, C.W.; Zeng, L.; Lu, G.Y.; Fu, G.P.; Cheng, Y.; Zhang, X.K. The transcriptome of Brassica napus L. roots under waterlogging at the seedling stage. Int. J. Mol. Sci. 2013, 14, 2637–2651. [Google Scholar] [CrossRef]
  102. Benkova, E. Plant hormones in interactions with the environment. Plant Mol. Biol. 2016, 91, 597. [Google Scholar] [CrossRef]
  103. Liu, H.W.; Carvalhais, L.C.; Schenk, P.M.; Dennis, P.G. Effects of jasmonic acid signalling on the wheat microbiome differ between body sites. Sci. Rep. 2017, 7, 41766. [Google Scholar] [CrossRef]
  104. Arbona, V.; Gomez-Cadenas, A. Hormonal modulation of citrus responses to flooding. J. Plant Growth Regul. 2008, 27, 241–250. [Google Scholar] [CrossRef]
  105. Xu, X.W.; Wang, H.H.; Qi, X.H.; Xu, Q.; Chen, X.H. Waterlogging-induced increase in fermentation and related gene expression in the root of cucumber (Cucumis sativus L.). Sci. Hortic. 2014, 179, 388–395. [Google Scholar]
  106. O’Donnell, P.J.; Schmelz, E.; Block, A.; Miersch, O.; Wasternack, C.; Jones, J.B.; Klee, H.J. Multiple hormones act sequentially to mediate a susceptible tomato pathogen defense response. Plant Physiol. 2003, 133, 1181–1189. [Google Scholar] [CrossRef] [PubMed]
  107. Pedranzani, H.; Racagni, G.; Alemano, S.; Miersch, O.; Ramirez, I.; Pena-Cortes, H.; Taleisnik, E.; Machado-Domenech, E.; Abdala, G. Salt tolerant tomato plants show increased levels of jasmonic acid. Plant Growth Regul. 2003, 41, 149–158. [Google Scholar] [CrossRef]
  108. Mahouachi, J.; Arbona, V.; Gómez-Cadenas, A. Hormonal changes in papaya seedlings subjected to progressive water stress and re-watering. Plant Growth Regul. 2007, 53, 43–51. [Google Scholar] [CrossRef]
  109. Suza, W.P.; Staswick, P.E. The role of JAR1 in Jasmonoyl-l-isoleucine production during Arabidopsis wound response. Planta 2008, 227, 1221–1232. [Google Scholar] [CrossRef]
  110. Kishor, P.B.K.; Kumari, P.H.; Sunita, M.S.L.; Sreenivasulu, N. Role of proline in cell wall synthesis and plant development and its implications in plant ontogeny. Front. Plant Sci. 2015, 6, 544. [Google Scholar] [CrossRef]
  111. Barickman, T.C.; Simpson, C.R.; Sams, C.E. Waterlogging causes early modification in the physiological performance, carotenoids, chlorophylls, proline, and soluble sugars of cucumber plants. Plants 2019, 8, 160. [Google Scholar] [CrossRef]
  112. Zheng, F.L.; Liang, S.M.; Chu, X.N.; Yang, Y.L.; Wu, Q.S. Mycorrhizal fungi enhance flooding tolerance of peach through inducing proline accumulation and improving root architecture. Plant Soil Environ. 2020, 66, 624–631. [Google Scholar] [CrossRef]
  113. Yordanova, R.Y.; Popova, L.P. Photosynthetic response of barley plants to soil flooding. Photosynthetica 2001, 39, 515–520. [Google Scholar] [CrossRef]
  114. Sairam, R.K.; Dharmar, K.; Chinnusamy, V.; Meena, R.C. Waterlogging-induced increase in sugar mobilization, fermentation, and related gene expression in the roots of mung bean (Vigna radiata). J. Plant Physiol. 2009, 166, 602–616. [Google Scholar] [CrossRef]
  115. Sarkar, R.K.; Das, A. Changes in anti-oxidative enzymes and antioxidants in relation to flooding tolerance in rice. J. Plant Biol. 2000, 27, 307–311. [Google Scholar]
  116. Lbrecht, G.; Mustroph, A.; Fox, T.C. Sugar and fructan accumulation during metabolic adjustment between respiration and fermentation under low oxygen conditions in wheat roots. Physiol. Plant. 2010, 120, 93–105. [Google Scholar] [CrossRef] [PubMed]
  117. Mustroph, A.; Albrecht, G. Tolerance of crop plants to oxygen deficiency stress: Fermentative activity and photosynthetic capacity of entire seedlings under hypoxia and anoxia. Physiol. Plant. 2010, 117, 508. [Google Scholar] [CrossRef]
  118. Ou, L.J.; Dai, X.Z.; Zhang, Z.Q.; Zou, X.X. Responses of pepper to waterlogging stress. Photosynthetica 2011, 49, 339–345. [Google Scholar] [CrossRef]
  119. Nataa, L.; Tanja, T.; Danijela, K.; Biljana, K. Modulations of the antioxidants defence system in two maize hybrids during flooding stress. J. Plant Res. 2021, 134, 237–248. [Google Scholar]
  120. Tian, L.X.; Bi, W.S.; Liu, X.; Sun, L.; Li, J. Effects of waterlogging stress on the physiological response and grain-filling characteristics of spring maize (Zea mays L.) under field conditions. Acta Physiol. Plant. 2019, 41, 63. [Google Scholar] [CrossRef]
  121. Wang, C.Y.; Li, C.X.; Zhang, Y. Effects of submergence-drought stresses on growth and physiological characteristics of salix rosthornii seedlings. Sci. Silvae Sin. 2013, 49, 164–170. [Google Scholar]
  122. Zhan, J.H.; Lan, Z.H. Effect of flooding on some physiological indexes of Panicum repens. Guihaia 2011, 31, 823–826. [Google Scholar]
Figure 1. Production rate of O2•− (A), H2O2 (B) and MDA content (C), SOD activity (D), POD activity (E), CAT activity (F), and heatmaps of genes expression of ROS scavenging enzymes (G) in mulberry (Morus alba L.) leaves under flooding stress. Note: Heat map data are derived from the gene expression data of transcriptome analysis results, which are drawn according to the normalized gene expression amount under Ctl conditions. Under different waterlogging conditions, the gene expression amount higher than the average value under Ctl conditions is marked with red, and vice versa, and the gene expression amount lower than the average value is marked with blue. The color shading indicates the degree of difference between gene expression and Ctl. The darker the color, the more significant the difference. Data are represented as means ± SD of five replicate samples. Different lowercase letters indicating significant differences (p < 0.05).
Horticulturae 10 01100 g001
Figure 2. Activity key enzymes, content of metabolic substance, and heatmaps of gene expression in ASA-GSH cycle in mulberry (Morus alba L.) leaves under flooding stress. The content of ascorbic acid (A), the content of dehydroascorbate (B), the ratio of the content of ascorbate to dehydroascorbate (C), the content of glutathione (D), the content of glutathiol (E), the ratio of the content of glutathione to glutathiol (F), the activity of ascorbate peroxidase (G), the activity of monodehydroascorbate reductase (H), the activity of dehydroascorbate reductase (I), the activity of glutathione peroxidase (J), the activity of glutathione reductase (K), the activity of glutathione S-transferase (L), heatmaps of the expression levels of relevant genes in the AsA-GSH cycle (M). APX: ascorbate peroxidase; MDHAR: monodehydroascorbate reductase; GPX: glutathione peroxidase; GR: gluathione reductase; DHAR: dehydroascorbate reductase; AsA: ascorbate; DHA: dehydroascorbate; GSH: glutathione; MDHA: monodehydroascorbate; GSSG: glutathiol. Note: Heat map data processing method is the same as above. Data are represented as means ± SD of five replicate samples. Different lowercase letters indicating significant differences (p < 0.05).
Horticulturae 10 01100 g002
Figure 3. Activity key enzymes and heatmaps of genes expression in Trx-Prx pathway in mulberry (Morus alba L.) leaves under flooding stress. The activity of thioredoxin reductase (A), the activity of peroxiredoxin (B), heatmaps of the expression levels of related genes in the Trx-Prx pathway (C). Note: Data are represented as means ± SD of five replicate samples. Different lowercase letters indicating significant differences (p < 0.05).
Horticulturae 10 01100 g003
Figure 4. JA content and heatmaps of gene expression in JA synthesis and JA signal in mulberry (Morus alba L.) leaves under flooding stress. The content of JA (A), heatmaps of the expression levels of related genes in JA synthesis and JA signal (B). Note: Data are represented as means ± SD of five replicate samples. Different lowercase letters indicating significant differences (p < 0.05).
Horticulturae 10 01100 g004
Figure 5. Proline content (A), soluble sugar content (B), and soluble protein content (C) in mulberry (Morus alba L.) leaves under flooding stress. Note: Data are represented as means ± SD of five replicate samples. Different lowercase letters indicating significant differences (p < 0.05).
Horticulturae 10 01100 g005
Figure 6. RT-qPCR verified transcript expression levels of DEGs in mulberry (Morus alba L.) leaves under flooding stress. Data are represented as means ± SD of five replicate samples. Different lowercase letters indicating significant differences (p < 0.05).
Horticulturae 10 01100 g006
Table 1. Primers used for RT-PCR.
Gene NameForward Primer Sequence (5′-3′)Reverse Primer Sequence (5′-3′)
actin (Reference genes)GGAACGGGTTGAGGAGAAAGAAGGCAAGAACAAGATGAAGCACAGAGC
SOD (LOC21393965)TTTTGGGAAACTGTTTTGGGGATGTTATTCGCCTGTCGCCT
SOD (LOC21405894)GCCCACCTCCTACATGCTTAGGTAATATGCGTGCTGCGTG
POD (LOC21396268)CTTCCAACAAGCTCTACTACTCATGAGCACCGAGCTACTCCAAG
POD (LOC21389367)ATCCACATTGTACCCAGCGTATAATGTAGGGCCGGGGGAT
CAT (LOC21407600)TTTCTTACGATGGCCGCACTAACAGTCACAGCCTACTTCGC
APX (LOC21409302)TATGCTGAAGCCCATGCCAAGGACTAAGATACCAGGCAGGC
MDHAR (LOC21393482)TCCATCTGCAAGCTTGTTTTTCAGGCACTGGTTGATCGTCTCA
GPX (LOC21407427)TTGGAGGCGGAGTCTTCCTATTCACGGCGTAAACGCAAAG
GST (LOC21394898)TCCAAAGGCGACCACAAGAATGTGGGTGTTTGAATTTACCGAA
GST (LOC21386514)CGGCATGAGGGTCAGAGTAGAGCTAGAACGGAGGCTTGG
OPR (LOC21397444)TGCTAAAGTTCTCTGCTTGTTACTAGCCGCATGGATCTCAACTC
OPR (LOC21409989)GATCACCTTGATGCCGTGGACCATAGGCCGTGTAACGAGG
JAZ (LOC21402520)GGTTCTTGGAAAAGCGACGGAACTTGGTGAACCGCCTCC
JAZ (LOC21384207)ACCACCTCAGATGCCTACCAACTTGAGCCAAATGCTCGCC
AOS (LOC21409613)TCTGTTCAAGTGGCTCGGACCGATAAGCCAAGGGTCTCAGG
MYC2 (LOC21406020):TGGTCGAATTGGGATCCACGGAGCTGATCTGCTGGTTCGT
MYC2 (LOC21406208)TCCCGACTTCTACCGGAGTTACTGTATTGGCCCTGTGTCG
MYC2 (LOC21398450)AGGCTTAGCACATCCGATCACAATCACCGGCTTTCTCCCT
Disclaimer/Publisher’s Note: The statements, opinions and data contained in all publications are solely those of the individual author(s) and contributor(s) and not of MDPI and/or the editor(s). MDPI and/or the editor(s) disclaim responsibility for any injury to people or property resulting from any ideas, methods, instructions or products referred to in the content.

