Article

Integrated Metabolome and Transcriptome Analyses Reveal the Mechanisms Regulating Flavonoid Biosynthesis in Blueberry Leaves under Salt Stress

by
Bin Ma
1,
Yan Song
1,
Xinghua Feng
1,
Pu Guo
1,
Lianxia Zhou
1,
Sijin Jia
1,
Qingxun Guo
1,2,* and
Chunyu Zhang
1,2,*
1
Department of Horticulture, College of Plant Science, Jilin University, Changchun 130062, China
2
Jilin Engineering Research Center for Crop Biotechnology Breeding, College of Plant Science, Jilin University, Changchun 130062, China
*
Authors to whom correspondence should be addressed.
Horticulturae 2024, 10(10), 1084; https://doi.org/10.3390/horticulturae10101084
Submission received: 12 August 2024 / Revised: 25 September 2024 / Accepted: 7 October 2024 / Published: 9 October 2024
(This article belongs to the Special Issue Advances in Developmental Biology in Tree Fruit and Nut Crops)

Abstract

:
The flavonoids play important roles in plant salt tolerance. Blueberries (Vaccinium spp.) are extremely sensitive to soil salt increases. Therefore, improving the salt resistance of blueberries by increasing the flavonoid content is crucial for the development of the blueberry industry. To explore the underlying molecular mechanism, we performed an integrated analysis of the metabolome and transcriptome of blueberry leaves under salt stress. We identified 525 differentially accumulated metabolites (DAMs) under salt stress vs. control treatment, primarily including members of the flavonoid class. We also identified 20,920 differentially expressed genes (DEGs) based on transcriptome data; of these, 568 differentially expressed transcription factors (TFs) were annotated, and bHLH123, OsHSP20, and HSP20 TFs might be responsible for blueberry leaf salt tolerance. DEGs involved in the flavonoid biosynthesis pathway were significantly enriched at almost all stages of salt stress. Salt treatment upregulated the expression of most flavonoid biosynthetic pathway genes and promoted the accumulation of flavonols, flavonol glycosides, flavans, proanthocyanidins, and anthocyanins. Correlation analysis suggested that 4-coumarate CoA ligases (4CL5 and 4CL1) play important roles in the accumulation of flavonols (quercetin and pinoquercetin) and flavan-3-ol (epicatechin and prodelphinidin C2) under salt stress, respectively. The flavonoid 3′5′-hydroxylases (F35H) regulate anthocyanin (cyanidin 3-O-beta-D-sambubioside and delphinidin-3-O-glucoside chloride) biosynthesis, and leucoanthocyanidin reductases (LAR) are crucial for the biosynthesis of epicatechin and prodelphinidin C2 during salt stress. Taken together, it is one of the future breeding goals to cultivate salt-resistant blueberry varieties by increasing the expression of flavonoid biosynthetic genes, especially 4CL, F35H, and LAR genes, to promote flavonoid content in blueberry leaves.

1. Introduction

Soil salinity is a major abiotic stress that adversely affects the growth and development of horticultural crops [1]. According to the FAO, about 90 million hectares of land worldwide are affected by salinization, accounting for approximately 6% of the global arable land area [2]. Salt stress is commonly caused by high concentrations of sodium ions (Na cations) and chloride ions (Cl anions) in the soil [3]. Plants have developed a variety of physiological, biochemical, and molecular adaptive mechanisms in response to salt stress [4]. Systematic studies of salt tolerance mechanisms have been performed in many plant species [5]. In general, the excessive accumulation of reactive oxygen species (ROS) can damage DNA, proteins, and lipids and inhibit plant growth [6]. Secondary metabolites, especially phenylpropanoid metabolites including cinnamic acids, coumarins, and flavonoids, serve as nonenzymatic systems to eliminate ROS and thus improve plant acclimation to salt stress [6,7] and tolerance of other stresses [8]. Some studies also showed that flavonoid metabotites, including quercetin, catechincan, anthocyanin, and proanthocyanidin, enhanced tolerance to salinity in plants [9,10,11,12].
The phenylpropanoid biosynthetic pathway has been extensively studied in several plant species. The precursor of all phenylpropanoid metabolites, p-coumaric acid, is biosynthesized via general phenylpropanoid pathway enzymes including phenylalanine ammonia-lyase (PAL), cinnamate 4-hydroxylase (C4H), and 4-coumarate CoA ligase (4CL). P-coumaric acid is then converted into various phenolic acids by shikimate O-hydroxycinnamoyltransferase (HCT), caffeoyl shikimate esterase (CSE), or caffeic acid 3-O-methyltransferase (COMT) and into flavonoids by chalcone synthase (CHS), chalcone isomerase (CHI), flavanone 3-hydroxylase (F3H), flavonoid 3′-hydroxylase (F3′H), and flavonoid 3′5′-hydroxylase (F3′5′H). Finally, flavonol synthase (FLS) catalyzes flavonol biosynthesis, while dihydroflavonol 4-reductase (DFR) and anthocyanidin synthase (ANS) catalyze anthocyanin and flavan-3-ol (flavans and proanthocyanidin) biosynthesis, and UDP-glucose flavonoid 3-O-glucosyl transferase (UFGT) and UDP-glycosyltransferase (UGT) are responsible for anthocyanin biosynthesis. Finally, leucoanthocyanidin reductase (LAR) and anthocyanidin reductase (ANR) are crucial for flavan-3-ol biosynthesis [8,13].
Some studies reported that salt tress promoted the expression of the most genes encoding these proteins [14,15]. For example, 1.2% NaCl promoted the expression of PAL, C4H, 4CL, CHS, CHI, and ANR for Sophora alopecuroides roots [15]. At the same time, heterologous expression of AvFLS from Apocynum venetum increased the total flavonoid content and enhanced plant salinity tolerance in tobacco [16]. The NtCHS1 RNAi-silenced transgenic tobacco plants reduced flavonoid accumulation and weakened ROS-scavenging ability under salt stress; in contrast, NtCHS1 overexpressing plants had higher tolerance to salinity [17]. Overexpression of a tea (Camellia sinensis) CsF3H gene confers tolerance to salt stress in transgenic tobacco [18]. Thus, most genes from the flavonoid biosynthetic pathway can enhance plant salinity tolerance.
Blueberries, Vaccinium sp., native to North America, are a popular fruit worldwide known for its health benefits due to its abundant secondary metabolites, particularly flavonoids [19,20]. According to data reported in 2022 by FAOSTAT, currently, the global area used for blueberries is 256,701 hectares. Of the continents, the largest blueberry producer is China (77,641 hectares), followed by the USA (46,539 hectares) and Canada (42,216 hectares). In recent years, blueberries have seen an increase not only in fresh consumption but also in the processing industry. The rising demand for blueberry plants has led to the global expansion of blueberry cultivation [21]. In China, Vaccinium corymbosum, the most important blueberry species, is widely cultivated in northern China. Like most perennial fruit crops, blueberry has low salt tolerance and is extremely sensitive to soil salt increases [22,23,24]. For the blueberry cultivar ‘Tifblue’, the plants’ shoot and root dry weight increase in plants subjected to 100 mM NaCl for 76 d was only 38.51% and 42.64%, respectively, for the unsalinized controls [25]. With the increase in blueberry planting area and decrease in suitable soil conditions, cultivating salt-tolerant varieties to expand blueberry growing conditions are important measures to promote the development of the blueberry industry [24]. However, molecular regulatory mechanisms of blueberry responses to salt stress are unclear. Therefore, it is important to explore the molecular regulatory mechanisms of the response of blueberry to salt stress by combining metabolome and transcriptome data to further improve salt tolerance in blueberry.
In this study, we identified differentially accumulated metabolites (DAMs) and differentially expressed genes (DEGs) in blueberry leaves in response to salt stress by performing metabolome and transcriptome analysis, respectively. To elucidate the mechanism driving flavonoid biosynthesis in blueberry leaves, we mapped the flavonoid biosynthetic Kyoto Encyclopedia of Genes and Genomes (KEGG) pathways in blueberry leaves under salt stress and analyzed the correlation between differentially accumulated flavonoid metabolites and DEGs from the flavonoid biosynthesis pathway by integrating transcriptome and metabolome data. The results of this study broaden our understanding of flavonoid biosynthesis in response to salt stress and provide a basis for breeding salt-resistant blueberry varieties.

2. Materials and Methods

2.1. Plant Materials and Salt Stress Treatments

The plants of the blueberry (Vaccinium corymbosum) cultivar ‘Northland’ were used as experimental materials. The in vitro-grown plants were kept in laboratory conditions in the Department of Horticulture at Jilin University, China. We obtained them from an institutional laboratory.
About two hundred in vitro-grown blueberry plants were transferred to 7-cm pots containing soil and grown in a growth chamber at 25 °C with 70% relative humidity under a 16 h light/8 h dark photoperiod for six months. Then the potted plants were irrigated with 1/2 Hoagland solution containing 200 mM NaCl [26,27]. The first to third fully expanded leaves were collected from randomly selected plants at 6 h (S6), 12 h (S12), 24 h (S24), and 48 h (S48) of NaCl treatment, using samples collected at time 0 h (S0) with 1/2 Hoagland solution (without NaCl) as control. The samples were flash-frozen in liquid nitrogen and stored at −80 °C for transcriptome deep sequencing (RNA-seq) analysis and metabolomic profiling. RNA-seq analysis was performed in three replicates, while the metabolomic profiling experiment was performed in five replicates.

2.2. Metabolomics Analysis by UHPLC-MS/MS

Frozen samples of blueberry leaves from NaCl treated for 6 h (S6), 12 h (S12), 24 h (S24), and 48 h (S48) and NaCl untreated for 0 h (S0) control were ground to a powder. The 80 mg of powder were resuspended in 1 mL methanol:acetonitrile:H2O (2:2:1, v/v/v) solution for metabolite extraction. The mixture was centrifuged for 20 min (14,000× g, 4 °C), and the supernatant was dried in a vacuum centrifuge. The sample was dissolved in 0.1 mL acetonitrile: water (1:1, v/v) and centrifuged for 15 min (14,000× g, 4 °C), and 2 μL of the supernatant was used for LC–MS analysis. The ultra-high-performance liquid chromatography-quadrupole time-of-flight mass spectrometry (UHPLC-Q-TOF-MS) was performed using an Agilent 1290 infinity LC ultra-performance liquid chromatography (UHPLC) system with a C-18 column (ACQUITY UPLC BEH C-18 1.7 μm, 2.1 mm × 100 mm; Waters, Ireland) coupled to a quadrupole time-of-flight instrument (AB Sciex Triple TOF 6600). The column temperature was 40 °C, and the flow rate was set at 0.4 mL/min. Mobile phase A consisted of 25 mM ammonium acetate and 0.5% formic acid in water, and mobile phase B was methanol. The gradient elution procedure was as follows: 5% B (0–0.5 min); then B changed linearly to 100% from 0.5 to 10 min; 100% B (10–12 min); B changed linearly from 100% to 5% from 12.0 to 12.1 min; 5% B (12.1–16 min). Throughout the analysis, each sample was placed in an automatic sampler at 4 °C. Quality control (QC) samples were inserted into the sample queue to monitor and evaluate the stability and reliability of the data. The electrospray ionization (ESI) source conditions were described previously. During MS data acquisition, the instrument was set to acquire data over a m/z range of 60–1000 Da, and the accumulation time for TOF MS scans was set at 0.20 s/spectra. For automatic MS/MS acquisition, the instrument was set to acquire data over a m/z range of 25–1000 Da, and the accumulation time for the product ion scan was set at 0.05 s/spectra. The product ion scan was acquired using information-dependent acquisition (IDA) at high sensitivity mode.
To analyze the metabolome data, the raw data were converted to the final data format by employing ProteoWizard MSConvert (https://sourceforge.net/projects/proteowizard/, accessed on 1 December 2023), and the matched peak data and peak area data were obtained using MS-DIAL software (ver. 4.60) for normalization. Collection of Algorithms of MEtabolite pRofile Annotation (CAMERA) was used to annotate isotopes and adducts. Among the extracted ion features, only variables having more than 50% of the nonzero measurement values in at least one group were retained. Compound identification of metabolites was performed by comparing the accuracy of m/z values (<10 ppm) and MS/MS spectra using an in-house database established with available authentic standards.
All metabolites detected in positive and negative ion mode were analyzed for differences according to FC > 1.5 or FC < 0.67 and p-value < 0.05 based on univariate statistical analysis. Pareto-scaled principal component analysis (PCA) and orthogonal partial least-squares discriminant analysis (OPLS-DA) were performed via multivariate statistical analysis using the ropls R package. Seven-fold cross-validation and response permutation testing were used to evaluate the robustness of the model.

2.3. Transcriptomic Analysis by RNA Sequencing

Total RNA was extracted from blueberry leaves using TRIzol reagent (Invitrogen, CA, USA), and paired-end libraries were prepared using an ABclonal mRNA-seq Lib Prep Kit (ABclonal, Wuhan, China) according to the manufacturer’s instructions. The libraries were sequenced on an Illumina NovaSeq 6000 (or MGISEQ-T7) instrument (San Diego, CA, USA) and 150-bp paired-end reads were generated. Raw data in fastq format were processed using in-house Perl scripts. The clean reads were used for subsequent analysis by removing the adapter sequences and filtering out low-quality reads and reads with N ratios > 5%. The GC content of clean reads and quality score of Q20 and Q30 were calculated to evaluate base quality. The clean reads were separately aligned to the reference Vaccinium corymbosum cv. Draper V1.0 genome sequence (https://www.vaccinium.org/genomes, accessed on 10 March 2024) using HISAT2 software (http://daehwankimlab.github.io/hisat2/, accessed on 10 March 2024) to obtain mapped reads.
FeatureCounts (http://subread.sourceforge.net/, accessed on 20 March 2024) was used to count the number of reads mapped to each gene. The fragments per kilobase of transcript per million fragments mapped (FPKM) of each gene was calculated based on the length of the gene and the number of reads mapped to this gene. DEGs were identified based on the criteria absolute log2(fold change) ≥ 1 and p-value < 0.05 using DESeq2 (http://bioconductor.org/packages/release/bioc/html/DESeq2.html, accessed on 20 March 2024). The clusterProfiler R software package (Version 4.12.6) was used for gene ontology (GO) functional enrichment and KEGG pathway enrichment analysis. A GO or KEGG function was considered to be significantly enriched when p < 0.05.

2.4. RNA Sequencing Data Validation

Total RNA was extracted using an RNA Extraction Kit (Sangon Biotech, Shanghai, China), and RT-qPCR was performed on an ABI 7900HT real-time PCR system. Eight genes of flavonoid biosynthetic genes (PAL-1, 4CL1, C4H, DFR, F3′5′H-1, F3H, UFGT-1, and LAR-3) were selected for RT-qPCR analysis, and GAPDH (AY123769) was used as the reference transcript. Primer sequences are shown in Table S1. The relative expression levels of each gene were calculated using the 2−∆∆Ct method [28].

2.5. Integrative Analysis of Transcriptomic and Metabolomic Data

The phenylpropanoid and flavonoid biosynthetic pathways were mapped against the phenylpropanoid, flavonoid, flavonol, and anthocyanin KEGG pathways using the target DEGs and DAMs identified above. To perform integrative analysis of DEGs and DAMs in both the metabolomic and transcriptomic data from flavonoid biosynthetic pathways, Pearson correlation coefficients were calculated to determine the correlation between DEGs and DEMs using SPSS-V 29.0 software. Heatmaps of gene expression levels were constructed using log10 (FPKM), and heatmaps of metabolites were constructed using scale-normalized log10 (peak intensity) values with Tbtools (v1.098761) software [29].

3. Results

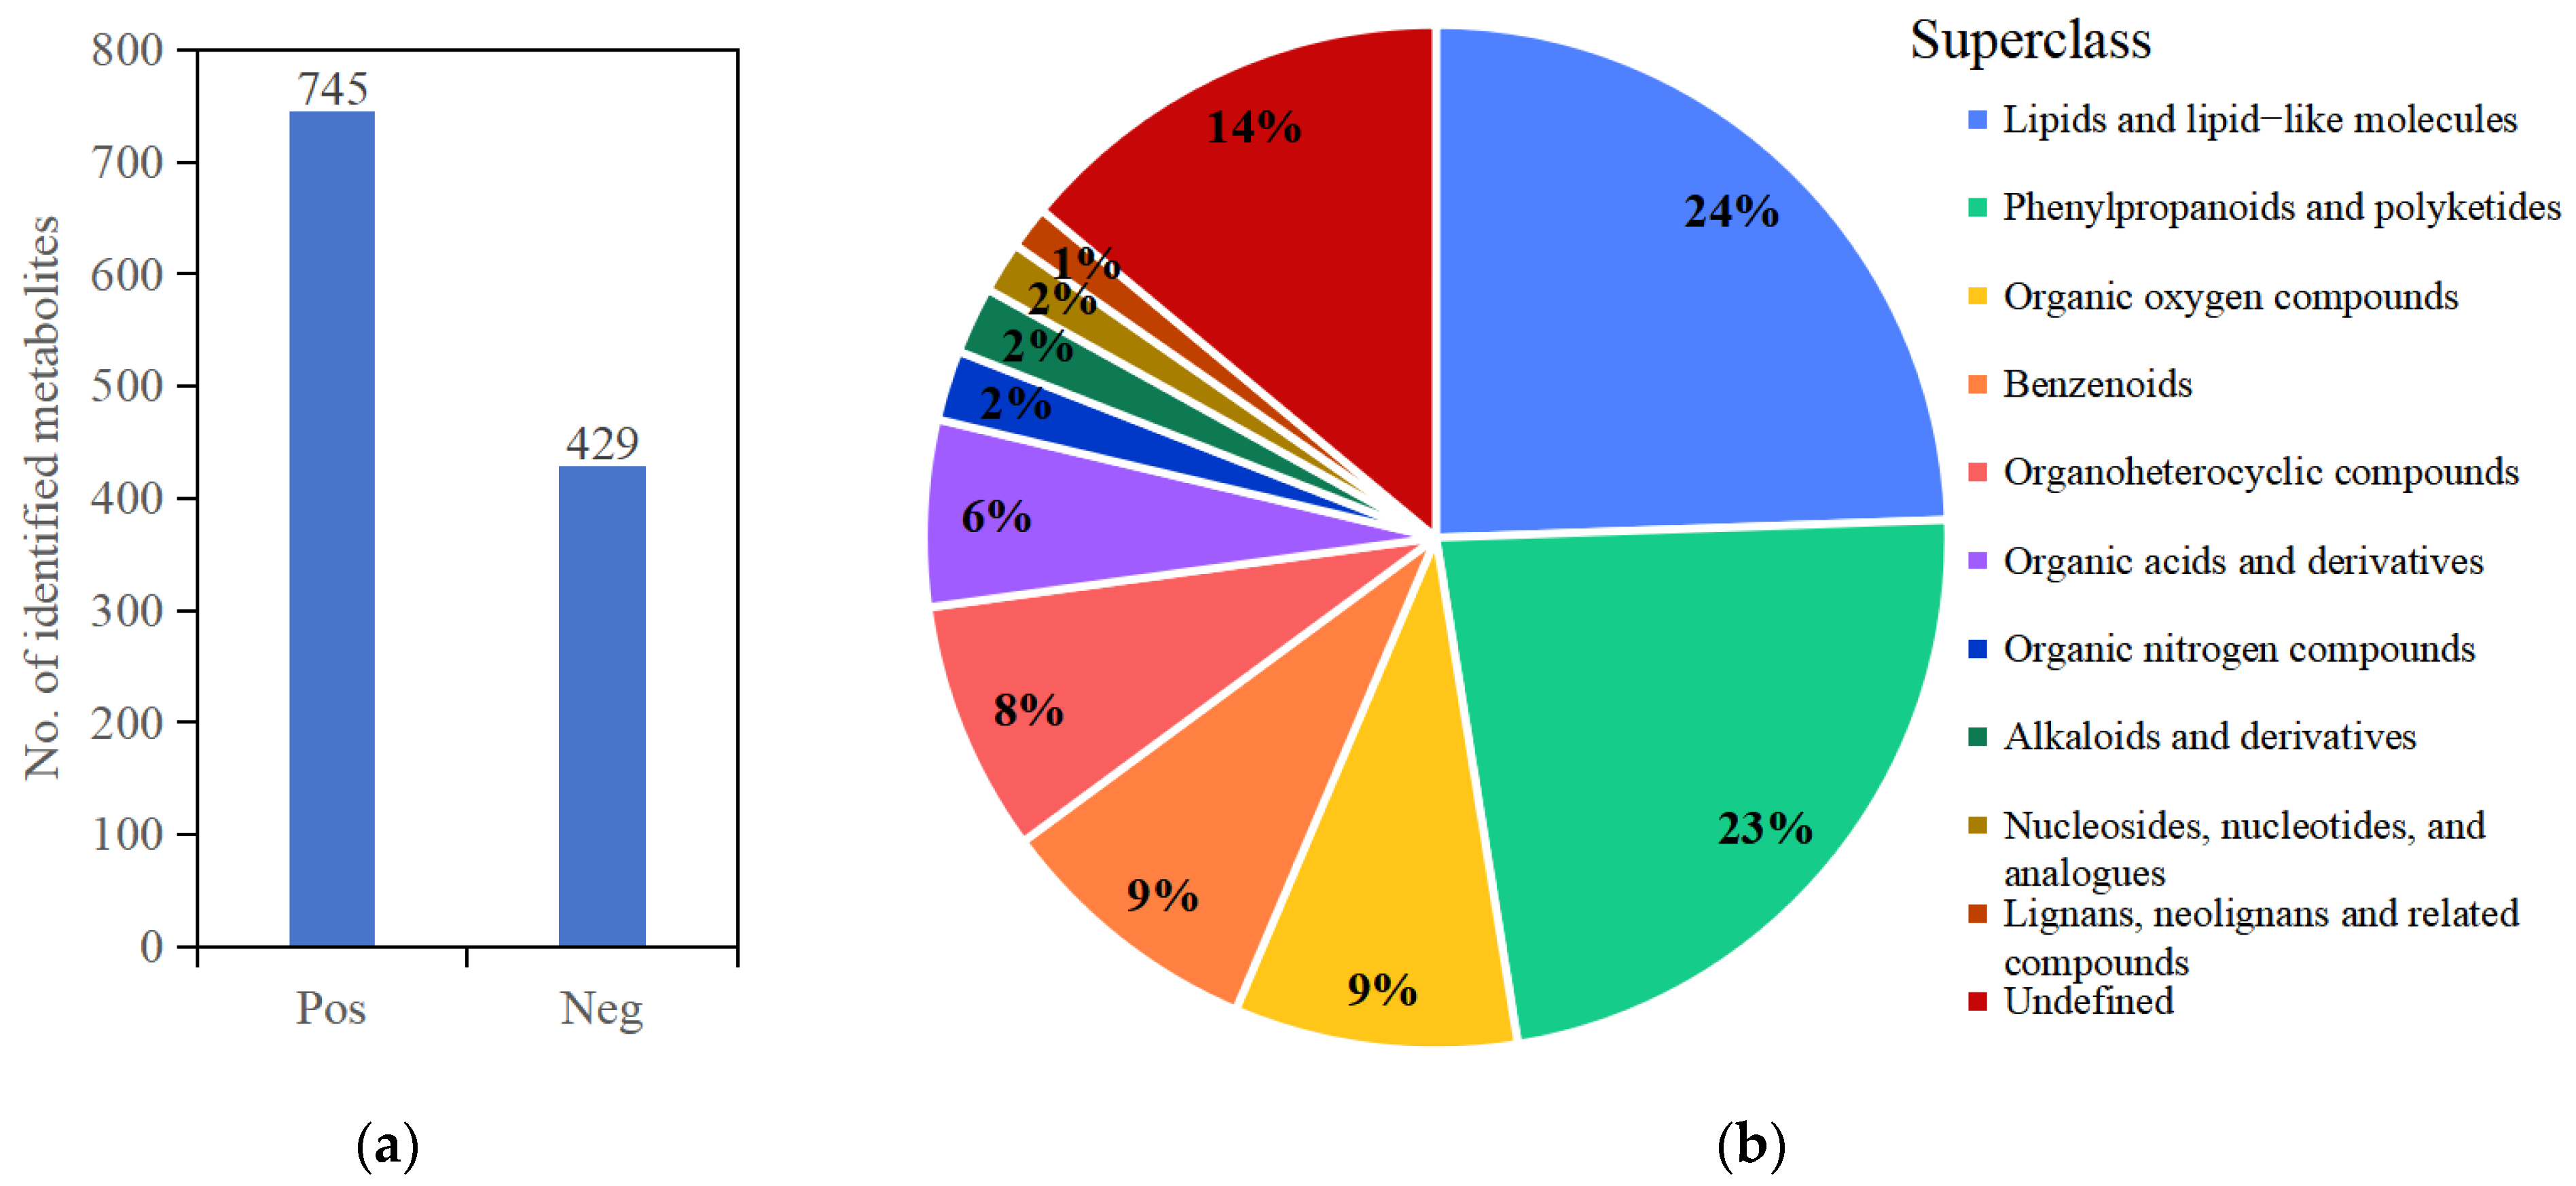
3.1. Metabolome Analysis for Blueberry Leaves under Salt Stress

Using non-targeted metabolomic profiling, we detected 1174 metabolomic substances in positive (745) and negative (429) ion modes in blueberry leaves in response to salt stress (Figure 1a and Table S2). Most of these metabolomic substances belonged to 10 superclasses, including lipids and lipid-like molecules (24%), phenylpropanoids and polyketides (23%), organic oxygen compounds (9%), benzenoids (9%), organoheterocyclic compounds (8%), organic acids and derivatives (6%), and so on (Figure 1b and Table S3). Thus, lipids and lipid-like molecules, phenylpropanoids, and polyketides are the main metabolites for blueberry leaves under salt stress.
We analyzed the peaks obtained from all experimental samples and quality control (QC) samples by principal component analysis (PCA). The QC samples in positive and negative ion mode were closely clustered together (Figure S1). At the same time, Pearson correlation coefficient analysis showed that the correlations between QC samples were >0.992 for negative ion mode and 0.973 for positive ion mode, indicating good repeatability of the experiment (Figure S2a,b).

3.2. Analysis of DAMs for Blueberry Leaves under Salt Stress

To explore the effects of salt stress on metabolism in blueberry, we constructed volcano plots of all metabolites detected in positive and negative ion mode under salt treatment for 6 h (S6), 12 h (S12), 24 h (S24), and 48 h (S48) compared to 0 h (S0) control, based on FC > 1.5 or FC < 0.67 and p-value < 0.05 by univariate statistical analysis (Figure S3). A total of 525 DAMs (333 positive ion mode; 192 negative ion mode) were significantly upregulated or downregulated under salt stress, with more DAMs identified in positive ion mode than negative ion mode. The number of DAMs increased during salt treatment. For example, 121 DAMs were identified in S6_vs_S0, 272 in S12_vs_S0, 328 in S24_vs_S0, and 383 in S48_vs_S0. A line regression analysis also showed that the number of DAMs increased gradually with increasing salt treatment duration (Figure 2a and Table S4). A total of 31 DAMs were shared by all four pairwise comparisons; 7 DAMs were identified only in S6_vs_S0, 27 in S12_vs_S0, 40 in S24_vs_S0, and 57 in S48_vs_S0, indicating that the number of specific DAMs also increased with increasing duration of salt treatment (Figure 2b). Most of these DAMs belonged to the lipid and lipid-like molecules superclass (137 DAMs) and the phenylpropanoid and polyketide superclass (133 DAMs). Flavonoid metabolites (79 DAMs) accounted for more than 50% of DAMs in the phenylpropanoid and polyketide superclass, representing the largest group of major DAMs in blueberry leaves under salt stress (Figure 2c). These results indicated that flavonoid metabolites are the main DAMs for blueberry leaves under salt stress.

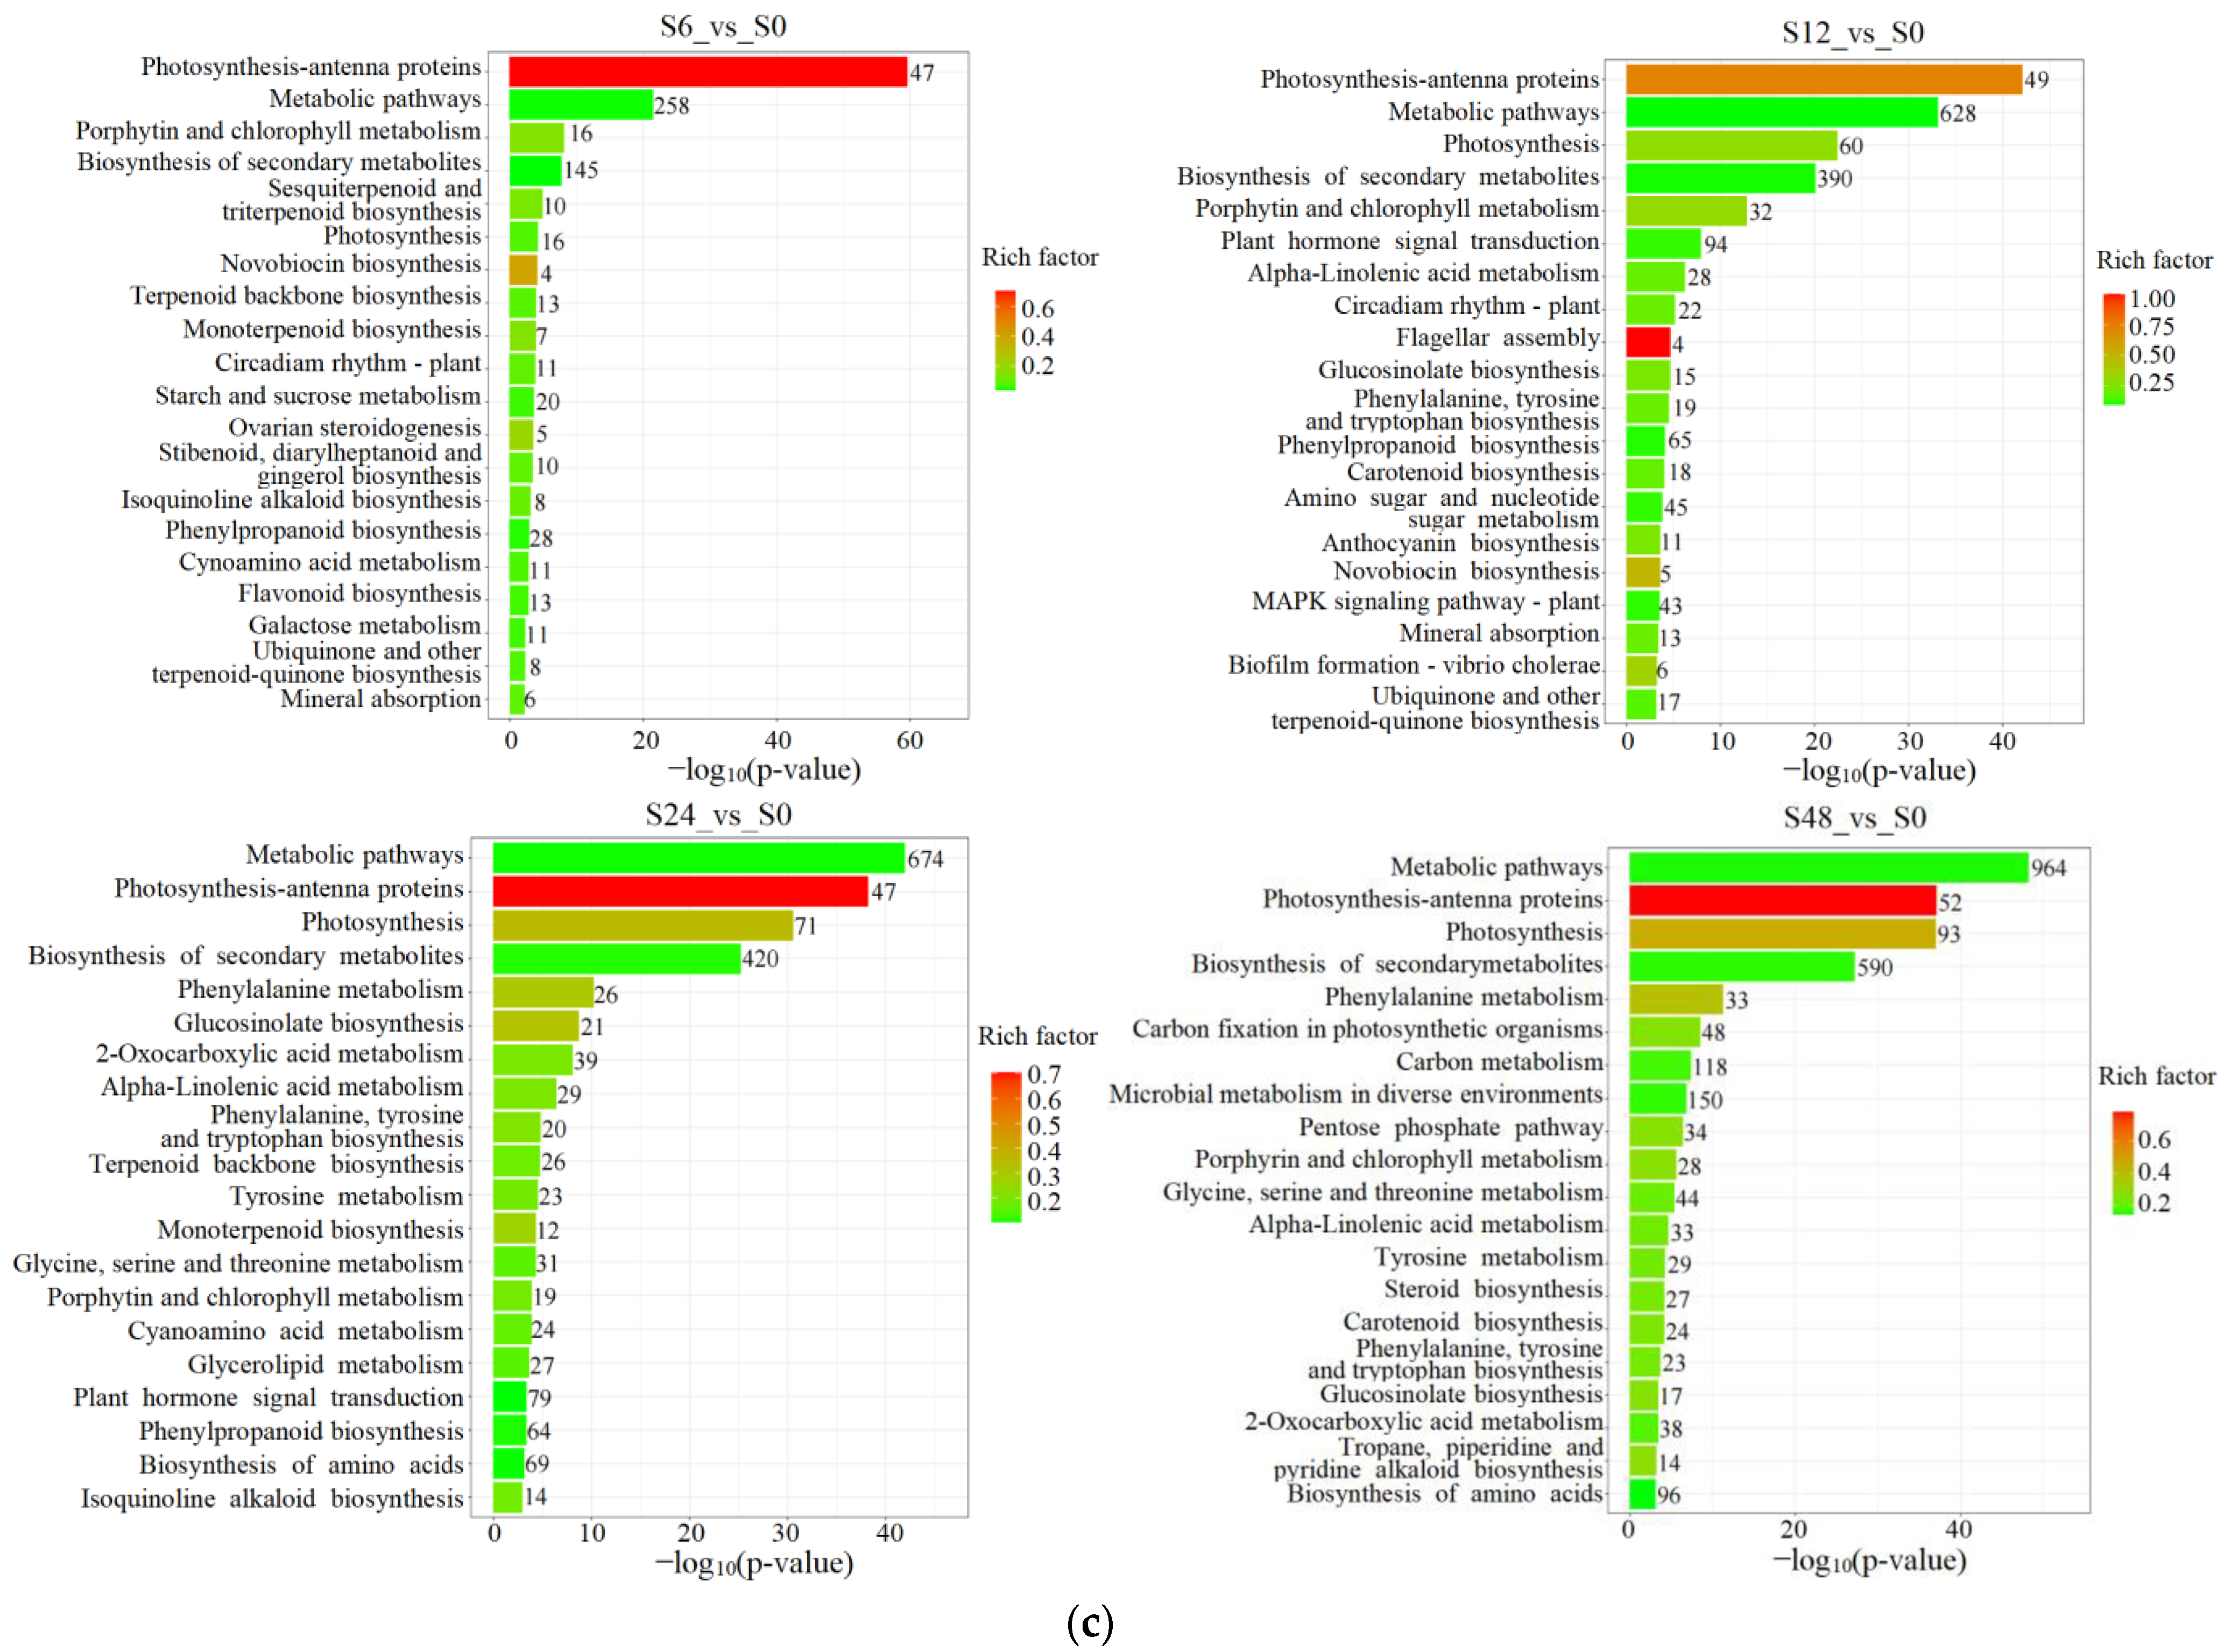
3.3. Enrichment Analysis of the KEGG Pathways of the DAMs

All DAMs were assigned to 89 significantly enriched KEGG pathways at p-value < 0.05 under salt stress, and 59 significantly enriched KEGG pathways were shared by three pairwise comparisons, as shown in a Venn diagram (Figure 3a and Table S5). Of these, 61 significantly enriched KEGG pathways were found in S6_vs_S0, 24 in S12_vs_S0, 66 in S24_vs_S0, and 60 in S48_vs_S0 (Figure 3b). The 272 DAMs in S12_vs_S0 were only annotated to 24 enriched KEGG pathways, mainly because more DAMs were annotated to the same enriched KEGG pathway. For example, five DAMs were annotated to the flavonoid biosynthesis pathway (ko00941) in S12_vs_S0; however, only two DAMs were annotated to the flavonoid biosynthesis pathway in S24_vs_S0. The top 20 significantly enriched KEGG pathways were the hedgehog signaling pathway (ko04340), cell cycle (ko04111), longevity-regulating pathway (ko04213), circadian rhythm (ko04710), and vasopressin-regulated water reabsorption (ko04962) for DAMs after 6, 24, and 48 h of salt stress compared to the 0 h control samples. In addition, flavonoid biosynthesis was significantly enriched at 12 h and 24 h of salt stress compared to the 0 h control samples (Figure 3c).

3.4. Transcriptome Analysis and DEGs for Blueberry Leaves under Salt Stress

To investigate the responses of blueberries to salt stress, we sequenced the same materials used in the metabolite analysis. In total, 6.5–8.61 Gb of clean bases were obtained for each sample, with a Q20 ranging from 95.32 to 97.2% and a Q30 ranging from 87.62 to 92.12%. The GC content was greater than 45.7%. The clean reads were successfully mapped to the blueberry reference genome with an average mapping efficiency of 90.13% (Table S6). These results implied that the sequencing quality was high.
To examine changes in gene expression under salt stress, we identified DEGs during NaCl treatment (Table S7). A total of 20,920 DEGs were detected, including 4468 DEGs in S6_vs_S0 (2150 upregulated and 2318 downregulated), 9814 in S12_vs_S0 (5353 upregulated and 4461 downregulated), 10,333 in S24_vs_S0 (4859 upregulated and 5474 downregulated), and 14,195 in S48_vs_S0 (6570 upregulated and 7625 downregulated). The line regression analysis also showed that the number of DEGs increased gradually with increasing salt treatment duration (Figure 4a). Moreover, 1326 DEGs were shared among the 6, 12, 24, and 48 h of salt stress groups relative to the 0 h control, as revealed in a Venn diagram (Figure 4b).

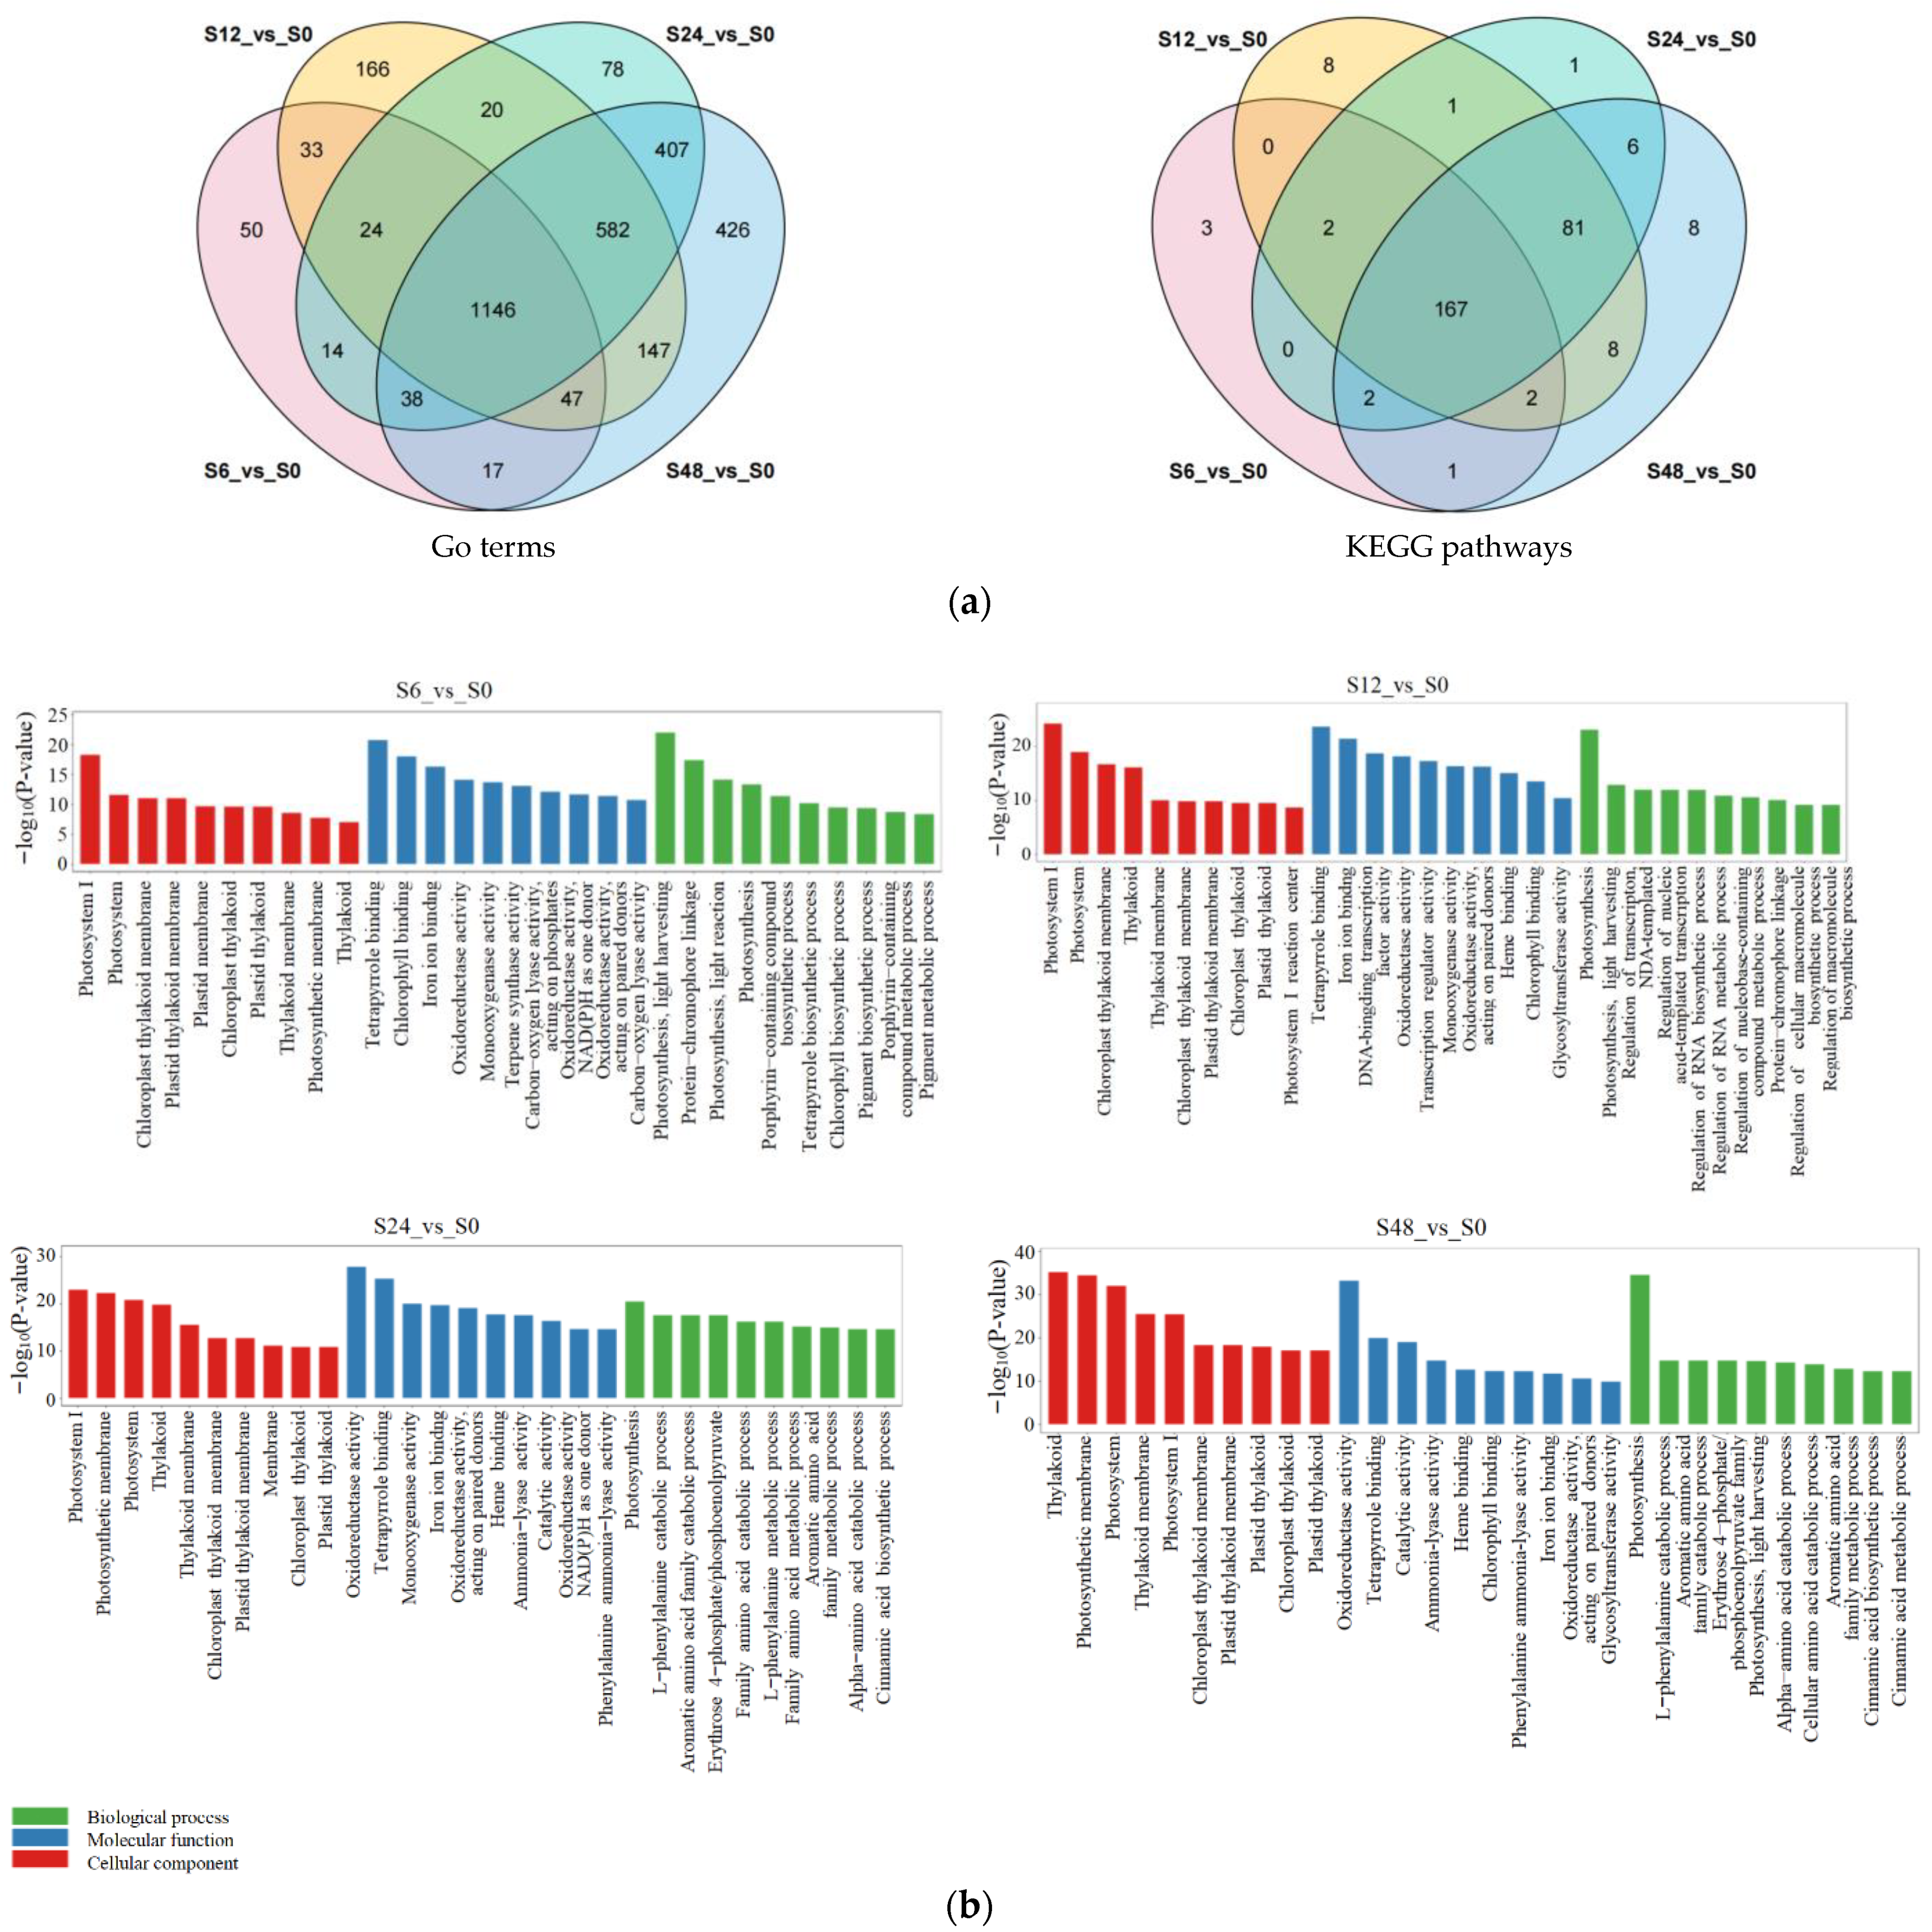
3.5. Functional Annotation and Enrichment Analysis of DEGs

We annotated the functions of the DEGs under salt stress using the gene ontology (GO) and KEGG databases (Tables S8 and S9). The DEGs were assigned to 3195 GO terms and 290 KEGG pathways, including 1146 GO terms and 167 KEGG pathways that were shared in all four pairwise comparisons (Figure 5a). We also analyzed the top 30 GO terms and top 20 KEGG pathways. Among the top 30 GO terms, photosystem was the most highly enriched in the cellular components category, photosynthesis in the biological process category, and tetrapyrrole binding and oxidoreductase activity in the molecular functions category. In addition, phenylalanine ammonia-lyase activity was significantly enriched at the later stages of salt stress (24 h and 48 h) compared to 0 h control samples (Figure 5b). Among the top 20 KEGG pathways, biosynthesis of secondary metabolites, metabolic pathways, porphyrin and chlorophyll metabolism, photosynthesis, and photosynthesis—antenna proteins were significantly enriched at almost all stages of salt treatment (Figure 5c). Moreover, many DEGs were involved in the biosynthesis of phenylpropanoid-derived compounds, including the phenylpropanoid and flavonoid biosynthesis pathways, which were significantly enriched at almost all stages of salt stress. Likewise, DEGs were significantly enriched in the anthocyanin biosynthesis pathway at 6, 12, and 48 h of salt stress compared to 0 h control samples (Table S9). Therefore, DEGs involved in the biosynthesis of phenylpropanoid-derived compounds were significantly enriched under salt stress.

3.6. Identification of Differentially Expressed Transcription Factors (TFs) under Salt Stress

To explore the responses of TFs to salt stress in blueberry, we further screened the differentially expressed TFs (Table S10). The total of 568 differentially expressed transcription factor genes were identified by merging the redundant sequences under salt stress. According to the different functional domains, these TFs were annotated to 12 major TF families, including zinc finger (133 members), AP2 (70 members), MYB (57 members), bHLH (50 members), and HSP (46 members), WRKY (40 members), NAC (31 members), Homeobox (31 members), AUX/IAA (15 members), GATA (11 members), bZip (10 members), and B3 (10 members). For zinc finger proteins, CCCH-type (18 members) was the most, followed by RING-type (14 members), CCT-type (9 members), C2H2-type (9 members), and so on (Figure 6). Among them, 13 TFs were significantly upregulated more than 4.190 times at 6, 12, 24, and 48 h of salt stress compared to 0 h control (Table 1). These TFs were from the AP2 family (ERF114, ABR1, ERF4, ERF110, and ERF011), HSP family (HSP20), bHLH family (bHLH35, bHLH123, and bHLH162), MYB family (MYB102, MYB13, and MYB14), and zinc finger family (ZAT12), and may play an important role under salt stress.

3.7. DAMs and DEGs in Phenylpropanoid and Flavonoid Biosynthetic KEGG Pathways under Salt Stress

Metabolomic and transcriptomic analyses indicated that the DEGs and DAMs in response to salt stress were highly enriched in phenylpropanoid and flavonoid biosynthesis pathways. We identified 46 DEGs encoding 16 types of enzymes and 103 DAMs from four classes (phenylpropionic acids, cinnamic acids and derivatives, coumarins and derivatives, and flavonoids) of the phenylpropanoid and flavonoid biosynthesis pathways (Tables S11 and S12). Most DAMs belonging to the cinnamic acids and derivatives class (2-hydroxycinnamic acid, 4-hydroxycinnamic acid, calceolarioside, rosmarinic acid, caffeic acid, and caffeoylshikimic acid) were upregulated under salt stress. DAMs in flavonoid biosynthesis pathways were upregulated or downregulated under salt stress. Specifically, quercetin and pinoquercetin (flavonols), epicatechin (flavan), prodelphinidin C2 (proanthocyanidin), cyanidin 3-O-beta-D-sambubioside, cyanidin-3-O-rhamnoside, and delphinidin-3-O-glucoside chloride (anthocyanins), and kaempferol 3,7-diglucoside, kaempferol 3-O-arabinoside, kaempferol 3-O-beta-D-xyloside, myricetin-3-o-galactoside, and isorhamnetin-3-O-glucoside (flavonol glycosides) were upregulated under salt stress. By contrast, cyanidin (anthocyanidin) and cyanidin 3-arabinoside, cyanidin 3-O-glucoside, cyanidin-3-O-alpha-arabinoside, and delphinidin 3-rutinoside (anthocyanins), and quercetin-3-neohesperidoside-7-rhamnoside and syringetin-3-O-galactoside (flavonol glycosides) were downregulated under salt stress (Table S11 and Figure 7). In general, most DAMs involved in the phenylpropanoid and flavonoid biosynthesis pathways were upregulated under salt stress.
Most DEGs were upregulated under salt stress, including PAL, C4H, COMT, 4CL1, 4CL5, 4CL7, CHS, DFR, and UGT75C1, and their expression reached their highest levels at 48 h. In addition, four ANS genes were downregulated at 6 h of salt stress. Most HCT genes were downregulated, and most CSE genes in the phenylpropanoid biosynthesis pathway were upregulated under salt stress. Most F3H and F3′H genes, which are involved in the flavonoid biosynthetic pathway, were upregulated under salt stress, especially at 48 h of salt treatment. By contrast, most F3′5′H and FLS genes (flavonol biosynthesis genes) were downregulated under salt stress. Both ANR and LAR genes are involved in flavan and proanthocyanin biosynthesis. Almost all ANR genes were downregulated under salt stress, especially at 6 h of treatment, whereas most LAR genes were upregulated, especially at 24 and 48 h of salt stress. UFGT genes, which are involved in anthocyanin biosynthesis, were upregulated or downregulated under salt stress. These results indicate that most genes involved in phenylpropanoid and flavonoid biosynthetic pathways were induced under salt stress, and most of these genes were rapidly upregulated at 48 h of salt treatment. We mapped the 46 DEGs and 29 DAMs onto KEGG phenylpropanoid and flavonoid biosynthetic pathways (Figure 7). These genes play an important role in phenylpropanoid and flavonoid biosynthesis for blueberry leaves under salt stress.
To validate the accuracy and reliability of the RNA-seq data, we selected eight flavonoid biosynthetic genes for RT-qPCR analysis (Figure S4). A linear regression analysis showed significant correlation between the RNA-seq and RT-qPCR results, with correlation coefficients (R2) greater than 0.8312 for all the compared groups. This result confirmed that the RNA-seq data are accurate and reliable in this study.

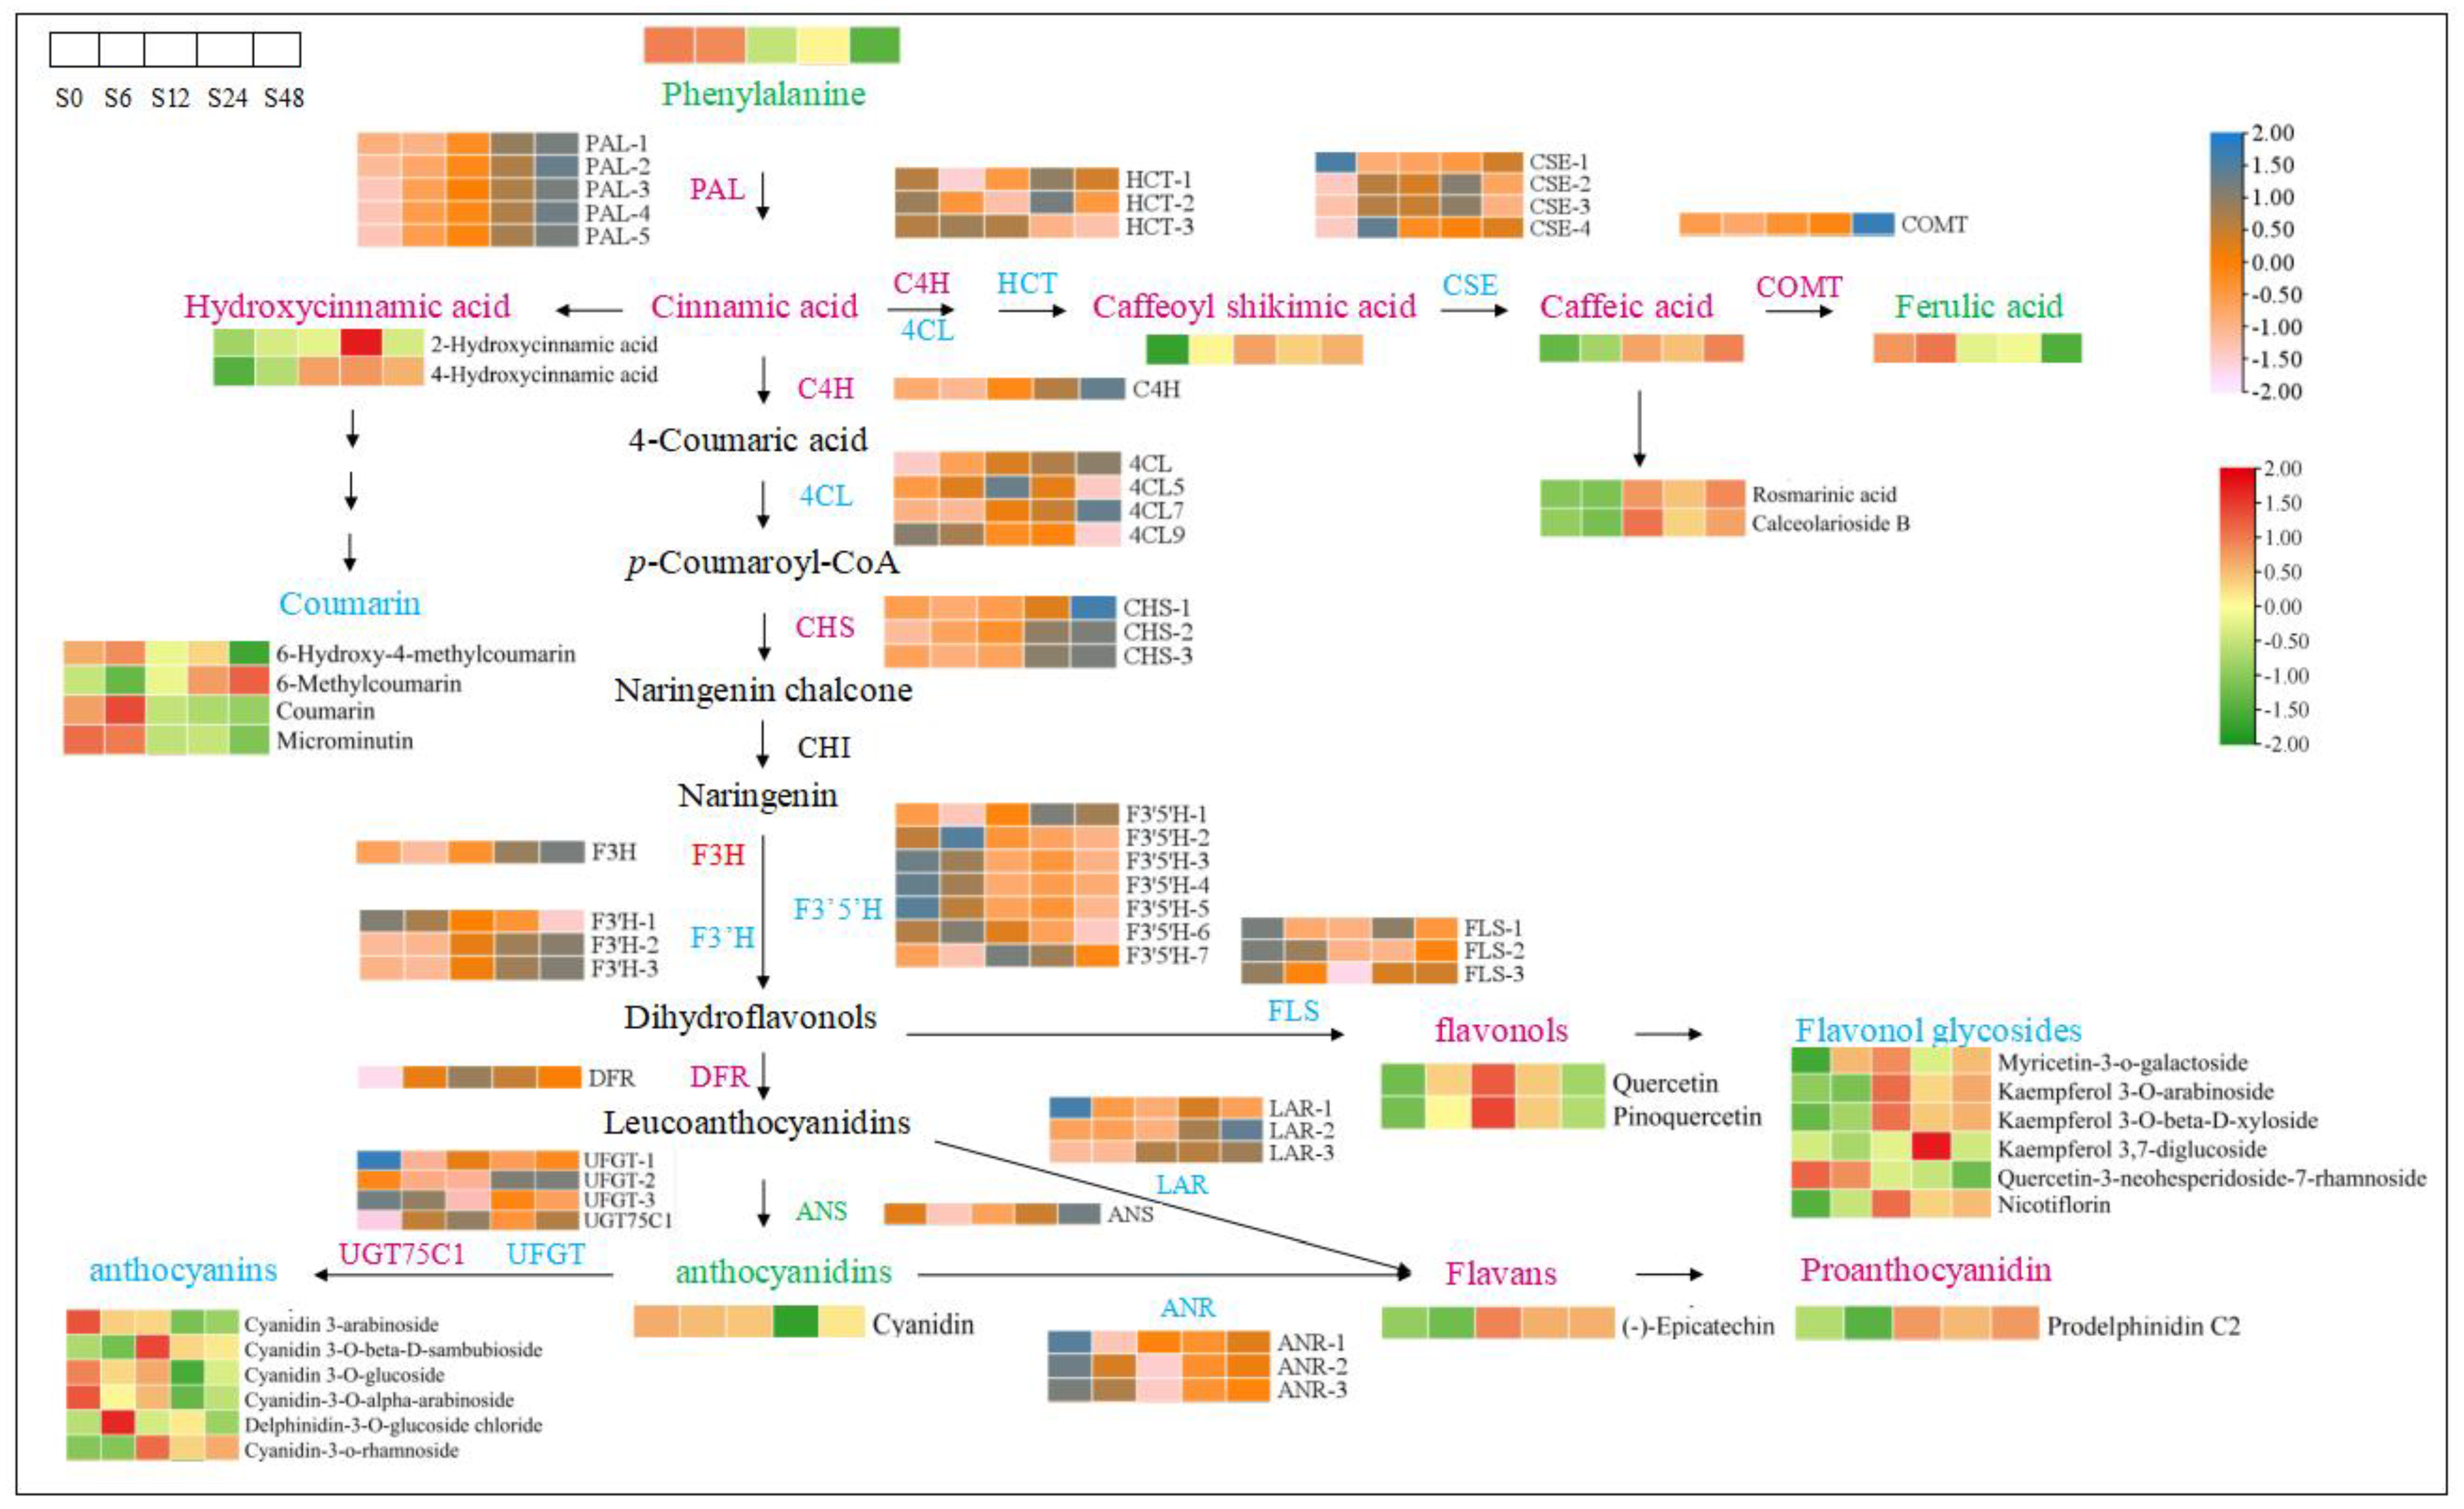
3.8. Combined Metabolome and Transcriptome Analysis of the Flavonoid Biosynthetic Pathway under Salt Stress

To investigate the functions of DEGs in the flavonoid pathway, we calculated the Pearson’s correlation coefficients (r) between the FPKM values of the DEGs and peak areas of DAMs involved in flavonoid biosynthesis during salt stress (Table 2). The levels of the flavonol metabolites quercetin and pinoquercetin were positively correlated with 4CL5 and negatively correlated with FLS (FLS-3) expression, suggesting that 4CL5 and FLS-3 genes might be the key genes involved in flavonol accumulation in blueberries under salt stress. Among the five flavonol glycosides, the levels of myricetin-3-o-galactoside, kaempferol 3-O-beta-D-xyloside, and nicotiflorin were negatively correlated with FLS and F3′5′H expression; the level of kaempferol 3-O-arabinoside was negatively correlated with FLS expression; and the level of quercetin-3-neohesperidoside-7-rhamnoside was negatively correlated with PAL, C4H, 4CL1, and CHS expression and positively correlated with 4CL9, F3′5′H, and FLS expression. These results indicate that FLS and F3′5′H genes play important roles in flavonol glycoside biosynthesis.
Epicatechin (flavan) and prodelphinidin C2 (proanthocyanidin) levels were positively correlated with 4CL1 and LAR-3 expression and negatively correlated with ANR expression, indicating that 4CL1 and LAR-3 are the key genes for epicatechin and prodelphinidin C2 biosynthesis under salt stress. Cyanidin, an anthocyanidin metabolite, was negatively correlated with C4H, 4CL7, CHS-2, and F3′5′H-1 expression. Among the six anthocyanin metabolites, UFGT was negatively correlated with cyanidin 3-O-beta-D-sambubioside and cyanidin-3-o-rhamnoside and positively correlated with cyanidin-3-O-alpha-arabinoside. Cyanidin 3-arabinoside was significantly correlated with most flavonoid biosynthesis genes, including PAL, C4H, 4CL1, 4CL7, CHS, F3′H, F3′5′H, and ANR. Cyanidin 3-O-glucoside was negatively correlated with C4H, 4CL7, and F3′5′H (Table 2). These results indicate that salt stress regulates anthocyanin biosynthesis in blueberry leaves by upregulating or downregulating the expression of genes in the anthocyanin biosynthesis pathway.

4. Discussion

4.1. Salt Stress Regulates the Accumulation of Phenylpropanoid and Flavonoid Metabolites

Phenylpropanoid metabolites are beneficial to human health, and they also contribute to abiotic stress tolerance in plants [30,31,32]. Cinnamic acid and its derivatives are important phenylpropanoid metabolites that can improve the adaptabilities of plants to salt stress [33,34]. In the current study, the levels of cinnamic acid and its derivatives, including 2-hydroxycinnamic acid, 4-hydroxycinnamic acid, calceolarioside, rosmarinic acid, caffeic acid, and caffeoylshikimic acid, increased in blueberry leaves in response to salt stress (Table S11 and Figure 7). These results suggest that blueberry leaves may mitigate damage from salt stress by promoting the accumulation of cinnamic acid and its derivatives.
Flavonoids are a large group of phenylpropanoid metabolites that are widespread among plants. Flavonols, flavans, anthocyanins, and proanthocyanidins are the main flavonoids in the leaves of Vaccinium species [35,36]. Many studies have shown that flavonoid accumulation is strongly influenced by salt stress [37,38,39]. For example, salt stress promoted the accumulation of total flavonoids, quercetin-3-O-glucuronide, quercetin-3-O-galactoside, isoquercitrin, kaempferol-3-O-glucuronide, quercetin-3-O-rhamnoside, and kaempferol-3-O-rhamnoside and affected the accumulation of pelargonidin, dihydrokaempferol, kaempferol, astragalin, quercetin, quercitrin, isoquercitrin, rutin, epicatechin, and cyanidin in Cyclocarya paliurus leaves [6]. Salt stress also upregulated the levels of quercetin in the root tissues of S. alopecuroides [15]. Saline-alkali stress increased the accumulation of dihydroquercetin, dihydromyricetin, delphinidin, cyanidin, and cyanidin-3-O-malonylhexoside and decreased the accumulation of kaempferol and rutin in sorghum (Sorghum bicolor) leaves [40].
Here, we determined that salt stress significantly promoted the accumulation of flavonoid metabolites in blueberry leaves (Table S11 and Figure 7), in which quercetin increased 1.85-fold after 12 h of salt treatment and pinoquercetin increased 2-fold and 1.52-fold after 12 h and 24 h of salt treatment, respectively, relative to the 0 h control. Kaempferol 3,7-diglucoside and kaempferol 3-O-beta-D-xyloside increased 2.03-fold and 1.56-fold after 12 h of salt treatment relative to the 0 h control, respectively. Kaempferol 3-O-arabinoside increased 1.71-fold at 12 h and 1.52-fold at 48 h; myricetin-3-o-galactoside increased 1.60-fold at 6 h, 1.17-fold at 12 h, and 1.58-fold at 48 h under salt stress compared to 0 h control. Epicatechin increased 2.99-fold, 2.44-fold, and 2.44-fold after 12 h, 24 h, and 48 h, respectively, and prodelphinidin C2 increased 2.23-fold after 24 h of salt treatment relative to the 0 h control. These results indicated that most flavonoid metabolites of blueberry leaves were upregulated during salt stress, especially at 24 h of salt stress compared to 0 h control.
Flavonols include quercetin, myricetin, kaempferol, rutin, and isorhamnetin as well as their derivatives (primarily glycosides); quercetin is the predominant flavonol in the fruits and leaves of Vaccinium species [33,34,35]. Proanthocyanidin, catechin, and epicatechin are the predominant flavan-3-ols in blueberry [41,42]. Some reports suggest that flavonoids can improve salt tolerance by removing excess ROS in soybeans (Glycine max), and the accumulation of flavonoids also enhanced salt tolerance in Arabidopsis [43,44]. In addition, quercetin can minimize salt-induced toxicity in tomato [9]. Thus, quercetin, pinoquercetin, kaempferol glycosides, epicatechin, and prodelphinidin C2 may play important roles in alleviating salt stress in blueberry leaves.
The most common anthocyanidins in blueberries are cyanidin, delphinidin, petunidin, peonidin, and malvidin. Most anthocyanins are glycosylated with glucopyranose, galactopyranose, or arabinopyranose at position 3 of the C-ring [45,46,47]. In the current study, the contents of cyanidin and some anthocyanins (cyanidin 3-arabinoside, cyanidin 3-O-glucoside, cyanidin-3-O-alpha-arabinoside, and delphinidin 3-rutinoside) were downregulated, and some anthocyanins (cyanidin 3-O-beta-D-sambubioside, cyanidin-3-O-rhamnoside, and delphinidin-3-O-glucoside chloride) were upregulated under salt stress (Table S11 and Figure 7). High anthocyanin content in plants is potentially a crucial physiological characteristic that enhances plant tolerance to salt stress [48]. For example, high anthocyanin accumulation enhances tolerance to high salinity environments in Arabidopsis [11,49]. The increasing of anthocyanin content in transgenic Brassica napus plants also enhanced the tolerance of transgenic plants to salt stress [50]. Thus, various anthocyanins may play different roles in the response of blueberry to salt stress, and cyanidin 3-O-beta-D-sambubioside, cyanidin-3-O-rhamnoside, and delphinidin-3-O-glucoside chloride may be able to alleviate the damage of salt stress on blueberry leaves.

4.2. Salt Stress Regulates the Expression of Genes from the Phenylpropanoid and Flavonoid Pathways

Plant responses to salt stress are accompanied by changes in the expression patterns of numerous genes. Many studies have been performed on the responses of the phenylpropanoid and flavonoid biosynthetic pathways to salt stress in plants using transcriptomic approaches [15,26,51]. Here, we determined that the phenylpropanoid biosynthesis and flavonoid biosynthesis pathways were significantly enriched in blueberry leaves under salt stress (Table S9 and Figure 5c). Genes from the phenylpropanoid biosynthesis pathway and the flavonoid biosynthesis pathway also contribute to plant tolerance to drought and cold stress in blueberries [52,53].
PAL, the first enzyme of the phenylpropanoid biosynthesis pathway, produces cinnamic acid, and C4H and 4CL subsequently produce 4-coumaric acid. These enzymes lead to the production of downstream phenylpropanoid metabolites, including cinnamic acids and derivatives, coumarins and derivatives, and flavonoids. Several studies have shown that PAL and C4H are upregulated in response to salt stress, leading to a switch to the biosynthesis of other secondary metabolites in various plants [15,39,54]. Indeed, in the present study, PAL and C4H expression was also promoted by salt stress in blueberries, indicating that PAL and C4H play important roles in the accumulation of phenylpropanoid metabolites (Table S12 and Figure 7). The 4CL enzymes are present in multiple isoforms, and genes encoding 4CL isoforms are upregulated or downregulated in response to abiotic stress [55,56,57]. In the leaves of Persian walnut (Juglans regia) and Manchurian walnut (Juglans mandshurica), 75% of Jr4CLs and 78.95% of Jm4CLs showed increased expression, and 25% of Jr4CLs and 21.05% of Jm4CLs showed decreased expression in response to salt treatment [58]. Similarly, in the current study, most 4CL genes (4CL1, 4CL5, and 4CL7) were upregulated and only 4CL9 was downregulated in response to salt stress; similar results were also found in other plants [59]. Thus, 4CLs might be positively or negatively regulated in response to salt stress, and positive regulation appears to be predominant.
CHS, F3H, F3′H, F3′5′H, and DFR function in the salt stress response and flavonoid biosynthesis [60,61,62,63]. Several studies have indicated that salt stress inhibits or promotes the expression of these genes [64,65,66]. In the current study, all CHS, F3H, and DFR genes, most F3′H genes, and some F3′5′H genes were upregulated by salt stress in blueberry leaves, suggesting that these genes play important roles in the plant response to salt stress by promoting flavonoid biosynthesis (Table S12 and Figure 7). Some studies showed that the NtCHS1 promoted flavonoid accumulation and increased salt tolerance, the CsF3H gene confers tolerance to salt stress in transgenic tobacco, and the AtDFR gene can be effectively manipulated to modulate salinity stress tolerance by directing to high accumulation of anthocyanins in oilseed plants [17,18,50]. FLS is the key enzyme of flavonol biosynthesis, and overexpression of the FLS gene increases the salt tolerance in plants [16]. Here, we found that salt stress promoted or inhibited the expression of FLS genes (Table S12 and Figure 7). These data suggested that CHS, F3H, DFR, and FLS genes play important roles in enhancing salt tolerance by promoting the accumulation of flavonoids in blueberry leaves.
Both ANR and LAR, the key genes of flavan and proanthocyanidin biosynthesis, are upregulated or downregulated under salt stress [15,67,68]. The expression of ANS, UFGT, and UGT, the key genes of anthocyanin biosynthesis, is also regulated by salt stress in many plants [6,69]. Our study showed that ANR, LAR, and UFGT were upregulated or downregulated, ANS was downregulated, and UGT was upregulated in blueberry leaves under salt stress (Table S12 and Figure 7). In Arabidopsis, UGT79B2 and UGT79B3 contribute to salt stress tolerance via modulating anthocyanin accumulation [70]. These results indicate that salt stress affects flavonoid biosynthesis by modulating the expression of flavonoid biosynthesis genes, and the UGT gene may play an important role in promoting anthocyanin accumulation of blueberry leaves under salt stress.

4.3. The Differentially Expressed Transcription Factors (TFs) in Response to Salt Stress

The transcription factors play a crucial role in stress adaptation [71]. It has been reported that many TFs, including AP2, MYB, bHLH, WRKY, NAC, bZip, and GATA, are involved in the regulation of the salt stress response in plants [72,73]. In this study, we identified 568 TFs that mainly belonged to zinc finger, AP2, MYB, bHLH, and HSP families under salt stress in blueberry leaves (Figure 6). APETALA2/ethylene-responsive factor (AP2/ERF) family transcription factors are well-documented in plant responses to a wide range of biotic and abiotic stresses. Overexpression of tomato AP2/ERF transcription factor SlERF.B1 increases sensitivity to salt and drought stresses [74]. Overexpression of SlERF5 in transgenic tomato plants resulted in high tolerance to drought and salt stress and increased levels of relative water content compared with wild-type plants [75]. In rice (Oryza sativa), OsSERF1 gene overexpression improved salinity tolerance [76]. Overexpression of the Zoysia japonica ZjABR1/ERF10 enhanced tolerances to salt stress in transgenic rice [77]. Here, AP2/ERF TFs, ERF114, ABR1, ERF4, ERF110, and ERF011 were significantly upregulated by 4.924 to 11.758 times during salt stress compared to the 0 h control (Table 1). Therefore, we predict that these TFs may be involved in the blueberry leaf salt tolerance.
The plant bHLHs and MYBs play crucial roles in abiotic stresses, especially salt stress [78,79,80]. In our study, bHLH35, bHLH123, bHLH162, MYB102, MYB13, and MYB14 were significantly upregulated during salt stress. The heterologous expression of the Anthurium andraeanum AabHLH35 gene in Arabidopsis improved tolerance to cold and drought stresses, and the overexpression of tobacco NtbHLH123 resulted in a greater resistance to salt stress, while NtbHLH123-silenced plants had reduced resistance to salt stress but improved salt tolerance [81,82]. In peanut (Arachis hypogaea), the overexpression of AhbHLH121 improved salt resistance, whereas silencing AhbHLH121 resulted in the inverse correlation [83]. The heterologous overexpression of the Vitis amurensis VaMyb14 gene in Arabidospis improves cold and drought tolerance, and Atmyb102 was upregulated in Arabidospis upon treatment with ABA, JA, or a combined treatment of osmotic stress and wounding [84,85]. Thus, bHLH35, bHLH123, bHLH162, MYB102, MYB13, and MYB14 may be involved in the salt tolerance of blueberry leaves, especially, bHLH123 (NtbHLH123 homolog) transcription factor.
The HSP are a group of proteins found in living organisms and are called stress proteins. The zinc finger proteins are one of the most abundant groups of proteins and have a wide range of molecular functions [86,87]. The heterologous expression of rice OsHSP20 in Escherichia coli or Pichia pastoris cells enhanced heat and salt stress tolerance when compared with the control cultures, and Zat12 is thought to be involved in cold and oxidative stress signaling in Arabidopsis [88,89,90]. In Arabidospis, knockout AtZat12 plants were more sensitive than wild-type plants to salinity stress [91]. Here, HSP20 (OsHSP20 homolog) and ZAT12 (AtZAT12 homolog) were induced significant upregulation under salt stress in blueberry leaves. Thus, HSP20 and ZAT12 might be responsible for blueberry leaf salt tolerance.

4.4. Salt Stress Promotes Flavonoid Biosynthesis by Activating the Expression of Flavonoid Biosynthesis Pathway Genes

The flavonoid biosynthesis pathway was enriched among DAMs and DEGs in blueberry leaves under salt stress, as revealed by transcriptome and metabolome analysis. PAL, C4H, and 4CL in the general phenylpropanoid pathway provide the precursors for flavonoid biosynthesis, and the expression of their underlying genes affects the accumulation of flavonoid metabolites [6]. Here, we showed that the expression levels of 4CL genes were positively correlated with the accumulation of flavonoids, including 4CL-3 with epicatechin and prodelphinidin C2, 4CL5 with flavonols (quercetin and pinoquercetin), and 4CL9 with quercetin-3-neohesperidoside-7-rhamnoside. Epicatechin, prodelphinidin C2, quercetin, and pinoquercetin levels increased under salt stress, and 4CL family members may play key roles in flavonol, flavan, and proanthocyanidin biosynthesis in blueberries under salt stress (Table 2).
The “early” flavonoid biosynthetic genes CHS, F3H, F3′H, and F3′5′H promote flavonoid biosynthesis. For example, BdCHS from Brachypodium distachyon, VcF3H from blueberry, GmF3′H from soybean, and ScF3′5′H from Senecio cruentus promote anthocyanin biosynthesis [60,61,92,93]. We determined that the expression levels of CHS, F3′H, and F3′5′H were significantly correlated with quercetin-3-neohesperidoside-7-rhamnoside and cyanidin 3-arabinoside levels, suggesting that these genes are coordinately regulated to function in the early steps of flavonoid biosynthesis in response to salt stress in blueberry leaves. Moreover, F3′5′H expression was positively correlated with quercetin-3-neohesperidoside-7-rhamnoside, epicatechin, cyanidin 3-arabinoside, cyanidin 3-O-beta-D-sambubioside, and delphinidin-3-O-glucoside chloride accumulation and negatively correlated with myricetin-3-o-galactoside, kaempferol 3-O-beta-D-xyloside, nicotiflorin, epicatechin, cyanidin, cyanidin 3-O-glucoside, and cyanidin-3-o-rhamnoside accumulation (Table 2). Thus, these F3′5′H genes might be responsive to salt stress and positively or negatively regulate the accumulation of flavonol glycosides, flavans, anthocyanidins, and anthocyanins. Salt stress promoted the accumulation of cyanidin 3-O-beta-D-sambubioside and delphinidin-3-O-glucoside chloride and upregulated the expression of F3′5′H genes (F3′5′H-7 and F3′5′H-2), indicating that F3′5′H genes might be the key genes of cyanidin 3-O-beta-D-sambubioside and delphinidin-3-O-glucoside chloride biosynthesis in blueberry leaves under salt stress.
The DFR, ANS, and UFGT genes, which are “late” structural genes in the anthocyanin biosynthetic pathway, are key genes for anthocyanin biosynthesis [94,95,96]. FLS is the key gene responsible for the accumulation of flavonols and flavonol glycosides, and both LAR and ANR are key genes for flavan and proanthocyanidin biosynthesis [97,98,99]. In this study, transcriptome and metabolome analyses showed that UFGT-1 expression was positively correlated with cyanidin-3-O-alpha-arabinoside accumulation and UFGT-3 expression was negatively correlated with cyanidin 3-O-beta-D-sambubioside and cyanidin-3-o-rhamnoside accumulation in blueberry under salt stress. Most flavonols or flavonol glycosides were negatively correlated with FLS family genes, and only quercetin-3-neohesperidoside-7-rhamnoside was positively correlated with FLS. ANRs were negatively correlated with epicatechin, and LAR-3 were positively correlated with epicatechin and prodelphinidin C2 (Table 2). Thus, these genes positively or negatively regulate anthocyanin, flavonol, flavan, or proanthocyanidin biosynthesis under salt stress. We also found that salt stress promoted the accumulation of epicatechin prodelphinidin C2 and increased the expression of LAR-3 genes, suggesting that LAR-3 are the key genes for the biosynthesis of epicatechin prodelphinidin C2 in response to salt stress (Tables S11 and S12 and Figure 7).

5. Conclusions

In this study, we conducted metabolomic and transcriptomic analyses for six-month-old blueberry cultivar ‘Northland’ via UHPLC-MS/MS and RNA-seq, respectively, to explore the underlying molecular mechanism of flavonoid biosynthesis in blueberry leaves in response to salt stress. Metabolomics analysis showed that salt stress significantly promoted the accumulation of flavonols, flavonol glycosides, flavan, proanthocyanidin, and anthocyanins. Transcriptomic analysis indicated that salt stress upregulated the expression of PALs, C4Hs, 4CL1, 4CL5, 4CL7s, CHSs, F3H, and DFRs and most F3′5′H, UFGT, and ANR genes. Integrative metabolomic and transcriptomic analysis suggested that 4CL5 and F3′5′H are key genes for flavonol and anthocyanin biosynthesis, respectively, and that 4CL1 and LAR-3 are key genes for flavan-3-ol biosynthesis in the flavonoid biosynthetic pathway in blueberry leaves under salt stress. The bHLH123, OsHSP20, and HSP20 TFs might be responsible for blueberry leaf salt tolerance. These findings reveal the possible molecular mechanism of flavonoid accumulation in blueberries during salt stress, providing a basis for future studies aimed at cultivating salt-resistant blueberry varieties.

Supplementary Materials

The following supporting information can be downloaded at: https://www.mdpi.com/article/10.3390/horticulturae10101084/s1, Table S1: Primers used for qRT- PCR; Table S2: The identified metabolites under salt stress from blueberry leaves. Table S3: The number of metabolites identified in each superclass under salt stress from blueberry leaves; Table S4: Identification of differential metabolites based on FC > 1.5 or FC < 0.67 and p value < 0.05 under salt stress; Table S5: The enrichment analysis of KEGG pathways for differential metabolites under salt stress; Table S6: Summary of RNA-seq database; Table S7: Identification of differential expressed genes under salt stress; Table S8: The enrichment analysis of GO terms for differential expressed genes under salt stress; Table S9: The enrichment analysis of KEGG pathways for differential expressed genes under salt stress; Table S10: The differential expressed transcription factors under salt stress; Table S11: Identification of differential metabolites from phenylpropanoid metabolite pathway based on FC > 1.5 or FC < 0.67 and p-value < 0.05 under salt stress; Table S12: The differential expressed genes from phenylpropanoid metabolite pathway under salt stress; Figure S1: Principal component analysis (PCA) of the peaks obtained from all experimental samples and quality control (QC) samples. S0, S6, S12, S24, and S48 represent that 200 mM NaCl treated the samples for 0, 6, 12, 24, and 48 h, respectively; Figure S2: Pearson correlation coefficients between quality control samples (QC) samples detected in negative ion mode and positive ion mode. (a) MultiScatter negative ion mode; (b) MultiScatter positive ion mode. The points in each small grid represent the ion peaks (metabolites) extracted from QC samples; Figure S3: Volcano plots of all metabolites detected in positive and negative ion mode (including unidentified metabolites). Metabolites with FC > 1.5 or FC < 0.67 and a p-value < 0.05 were considered to be differentially accumulated. S0, S6, S12, S24, and S48 represent the 200 mM NaCl-treated samples for 0, 6, 12, 24, and 48 h, respectively; Figure S4: Validation of transcript expression changes by qRT-qPCR. The figure is based on log2(2−ΔΔCt) data from qRT-PCR and log2(fold change) data from RNA-seq. The linear trend line and the R2 are shown.

Author Contributions

Conceptualization, Q.G., C.Z. and B.M.; methodology, Y.S.; software, B.M., Y.S. and X.F.; validation, Y.S. and P.G.; formal analysis, B.M. and X.F.; investigation, S.J.; resources, Q.G.; data curation, L.Z.; writing—original draft preparation, B.M.; writing—review and editing, Q.G. and C.Z.; visualization, L.Z.; supervision, Q.G. and C.Z.; project administration, C.Z. and Q.G.; funding acquisition, C.Z. All authors have read and agreed to the published version of the manuscript.

Funding

This study was supported by the National Natural Science Foundation of China (grant number 31700260).

Data Availability Statement

Data are contained within the article and Supplementary Materials. We have uploaded the RNA-Seq data generated in this study to the BioProject in the NCBI repository with the following accession number: PRJNA1128395.

Conflicts of Interest

The authors declare no conflicts of interest.

References

  1. Hao, S.; Wang, Y.; Yan, Y.; Liu, Y.; Wang, J.; Chen, S. A Review on Plant Responses to Salt Stress and Their Mechanisms of Salt Resistance. Horticulturae 2021, 7, 132. [Google Scholar] [CrossRef]
  2. Parihar, P.; Singh, S.; Singh, R.; Singh, V.P.; Prasad, S.M. Effect of salinity stress on plants and its tolerance strategies: A review. Environ. Sci. Pollut. R. 2015, 22, 4056–4075. [Google Scholar] [CrossRef]
  3. Guo, M.; Wang, X.; Guo, H.; Bai, S.; Khan, A.; Wang, X.; Gao, Y.; Li, J. Tomato salt tolerance mechanisms and their potential applications for fighting salinity: A review. Front. Plant Sci. 2022, 13, 949541. [Google Scholar] [CrossRef]
  4. Gupta, B.; Huang, B. Mechanism of salinity tolerance in plants: Physiological, biochemical, and molecular characterization. Int. J. Genom. 2014, 2014, 701596. [Google Scholar] [CrossRef]
  5. Van Zelm, E.; Zhang, Y.; Testerink, C. Salt Tolerance Mechanisms of Plants. Annu. Rev. Plant Biol. 2020, 71, 403–433. [Google Scholar] [CrossRef]
  6. Zhang, L.; Zhang, Z.; Fang, S.; Liu, Y.; Shang, X. Integrative analysis of metabolome and transcriptome reveals molecular regulatory mechanism of flavonoid biosynthesis in Cyclocarya paliurus under salt stress. Ind. Crops Prod. 2021, 170, 113823. [Google Scholar] [CrossRef]
  7. Lin, S.; Zeng, S.; Biao, A.; Yang, X.; Yang, T.; Zheng, G.; Mao, G.; Wang, Y. Integrative analysis of transcriptome and metabolome reveals salt stress orchestrating the accumulation of specialized metabolites in Lycium barbarum L. Fruit. Int. J. Mol. Sci. 2021, 22, 4414. [Google Scholar] [CrossRef]
  8. Vogt, T. Phenylpropanoid biosynthesis. Mol. Plant 2010, 3, 2–20. [Google Scholar] [CrossRef]
  9. Parvin, K.; Hasanuzzaman, M.; Bhuyan, M.; Mohsin, S.M.; Fujita, A.M. Quercetin mediated salt tolerance in tomato through the enhancement of plant antioxidant defense and glyoxalase systems. Plants 2019, 8, 247. [Google Scholar] [CrossRef]
  10. Yiu, J.; Tseng, M.; Liu, C.; Kuo, C. Modulation of NaCl stress in Capsicum annuum L. seedlings by catechin. Sci. Hortic. 2012, 134, 200–209. [Google Scholar] [CrossRef]
  11. Truong, H.A.; Lee, W.J.; Jeong, C.Y.; Trịnh, C.S.; Lee, S.; Kang, C.S.; Cheong, Y.K.; Hong, S.W.; Lee, H. Enhanced anthocyanin accumulation confers increased growth performance in plants under low nitrate and high salt stress conditions owing to active modulation of nitrate metabolism. J. Plant Physiol. 2018, 231, 41–48. [Google Scholar] [CrossRef] [PubMed]
  12. Guo, B.; Chen, F.; Liu, G.; Li, W.; Li, W.; Zhuang, J.; Zhang, X.; Wang, L.; Lei, B.; Hu, C.; et al. Effects and mechanisms of proanthocyanidins-derived carbon dots on alleviating salt stress in rice by muti-omics analysis. Food Chem. X 2024, 22, 101422. [Google Scholar] [CrossRef] [PubMed]
  13. Jaakola, L.; Määttä, K.; Pirttilä, A.M.; Törrönen, R.; Kärenlampi, S.; Hohtola, A. Expression of genes involved in anthocyanin biosynthesis in relation to anthocyanin, proanthocyanidin, and flavonol levels during bilberry fruit development. Plant Physiol. 2002, 130, 729–739. [Google Scholar] [CrossRef] [PubMed]
  14. Zhang, Q.; Wang, S.; Qin, B.; Sun, H.; Yuan, X.; Wang, Q.; Xu, J.; Yin, Z.; Du, Y.; Du, J.; et al. Analysis of the transcriptome and metabolome reveals phenylpropanoid mechanism in common bean (Phaseolus vulgaris) responding to salt stress at sprout stage. Food Energy Secur. 2023, 12, e481. [Google Scholar] [CrossRef]
  15. Zhu, Y.; Wang, Q.; Wang, Y.; Xu, Y.; Li, J.; Zhao, S.; Wang, D.; Ma, Z.; Yan, F.; Liu, Y. Combined transcriptomic and metabolomic analysis reveals the role of phenylpropanoid biosynthesis pathway in the salt tolerance process of Sophora alopecuroides. Int. J. Mol. Sci. 2021, 22, 2399. [Google Scholar] [CrossRef]
  16. Wang, M.; Ren, T.; Huang, R.; Li, Y.; Zhang, C.; Xu, Z. Overexpression of an Apocynum venetum flavonols synthetase gene confers salinity stress tolerance to transgenic tobacco plants. Plant Physiol. Biochem. 2021, 162, 667–676. [Google Scholar] [CrossRef]
  17. Chen, S.; Wu, F.; Li, Y.; Qian, Y.; Pan, X.; Li, F.; Wang, Y.; Wu, Z.; Fu, C.; Lin, H.; et al. NtMYB4 and NtCHS1 are critical factors in the regulation of flavonoid biosynthesis and are involved in salinity responsiveness. Front. Plant Sci. 2019, 10, 178. [Google Scholar] [CrossRef]
  18. Mahajan, M.; Yadav, S.K. Overexpression of a tea flavanone 3-hydroxylase gene confers tolerance to salt stress and alternaria solani in transgenic tobacco. Plant Mol. Biol. 2014, 85, 551–573. [Google Scholar] [CrossRef]
  19. Norberto, S.; Silva, S.; Meireles, M.; Faria, A.; Pintado, M.; Calhau, C. Blueberry anthocyanins in health promotion: A metabolic overview. J. Funct. Foods. 2013, 5, 1518–1528. [Google Scholar] [CrossRef]
  20. Ribera, A.E.; Reyes-Diaz, M.; Alberdi, M.; Zuñiga, G.E.; Mora, M.L. Antioxidant compounds in skin and pulp of fruits change among genotypes and maturity stages in highbush blueberry (Vaccinium corymbosum L.) grown in southern Chile. J. Soil Sci. Plant Nutr. 2010, 10, 509–536. [Google Scholar] [CrossRef]
  21. Rodriguez-Saona, C.; Vincent, C.; Isaacs, R. Blueberry IPM: Past successes and future challenges. Annu. Rev. Entomol. 2019, 64, 95–114. [Google Scholar] [CrossRef] [PubMed]
  22. Muralitharan, M.S.; Chandler, S.; Van, S.R. Effects of NaCl and Na2SO4 on growth and solute composition of highbush blueberry (Vaccinium corymbosum). Funct. Plant Biol. 1992, 19, 155–164. [Google Scholar] [CrossRef]
  23. Bryla, D.R.; Scagel, C.F.; Lukas, S.B.; Sullivan, D.M. Ion-specific limitations of sodium chloride and calcium chloride on growth, nutrient uptake, and mycorrhizal colonization in northern and southern highbush blueberry. J. Am. Soc. Hort. Sci. 2021, 146, 399–410. [Google Scholar] [CrossRef]
  24. Molnar, S.; Clapa, D.; Pop, V.C.; Hârța, M.; Andrecan, F.A.; Bunea, C.I. Investigation of salinity tolerance to different cultivars of highbush blueberry (Vaccinium corymbosum L.) grown in vitro. Not. Bot. Horti Agrobot. 2024, 52, 13691. [Google Scholar] [CrossRef]
  25. Wright, G.C.; Patten, K.D.; Drew, M.C. Salinity and supplemental calcium influence growth of rabbiteye and southern highbush blueberry. J. Am. Soc. Hortic. Sci. 1992, 117, 749–756. [Google Scholar] [CrossRef]
  26. Gan, T.; Lin, Z.; Bao, L.; Hui, T.; Cui, X.; Huang, Y.; Wang, H.; Su, C.; Jiao, F.; Zhang, M.; et al. Comparative proteomic analysis of tolerant and sensitive varieties reveals that phenylpropanoid biosynthesis contributes to salt tolerance in mulberry. Int. J. Mol. Sci. 2021, 22, 9402. [Google Scholar] [CrossRef]
  27. Wu, Q.; Bai, X.; Zhao, W.; Xiang, D.; Wan, Y.; Yan, J.; Zou, L.; Zhao, G. De novo assembly and analysis of tartary buckwheat (Fagopyrum tataricum Garetn.) transcriptome discloses key regulators involved in salt-stress response. Genes 2017, 8, 255. [Google Scholar] [CrossRef]
  28. Pfaffl, M.W. A new mathematical model for relative quantification in real-time RT-PCR. Nucl. Acids Res. 2001, 29, e45. [Google Scholar] [CrossRef]
  29. Chen, C.; Chen, H.; Zhang, Y.; Thomas, H.R.; Frank, M.H.; He, Y.; Xia, R. TBtools: An integrative toolkit developed for interactive analyses of big biological data. Mol. Plant 2020, 13, 1194–1202. [Google Scholar] [CrossRef]
  30. Sellappan, S.; Akoh, C.C.; Krewer, G. Phenolic compounds and antioxidant capacity of Georgia-grown blueberries and blackberries. J. Agric. Food Chem. 2002, 50, 2432–2438. [Google Scholar] [CrossRef]
  31. Giovanelli, G.; Buratti, S. Comparison of polyphenolic composition and antioxidant activity of wild Italian blueberries and some cultivated varieties. Food Chem. 2009, 112, 903–908. [Google Scholar] [CrossRef]
  32. Zhang, H.; Han, B.; Wang, T.; Chen, S.; Li, H.; Zhang, Y.; Dai, S. Mechanisms of plant salt response: Insights from proteomics. J. Proteome Res. 2012, 11, 49–67. [Google Scholar] [CrossRef] [PubMed]
  33. Häkkinen, S.H.; Törrönen, A.R. Content of flavonols and selected phenolic acids in strawberries and Vaccinium species: Influence of cultivar, cultivation site and technique. Food Res. Int. 2000, 33, 517–524. [Google Scholar] [CrossRef]
  34. Riihinen, K.; Jaakola, L.; Kärenlampi, S.; Hohtola, A. Organ-specific distribution of phenolic compounds in bilberry (Vaccinium myrtillus) and ‘northblue’ blueberry (Vaccinium corymbosum × V. angustifolium). Food Chem. 2008, 110, 156–160. [Google Scholar] [CrossRef]
  35. Raudone, L.; Vilkickyte, G.; Pitkauskaite, L.; Raudonis, R.; Vainoriene, R.; Motiekaityte, V. Antioxidant actvities of Vaccinium vitis-idaea L. leaves within cultivars and their phenolic compounds. Molecules 2019, 24, 844. [Google Scholar] [CrossRef]
  36. Vyas, P.; Kalidindi, S.; Chibrikova, L.; Igamberdiev, A.U.; Weber, J.T. Chemical analysis and effect of blueberry and lingonberry fruits and leaves against glutamate-mediated excitotoxicity. J. Agric. Food Chem. 2013, 61, 7769–7776. [Google Scholar] [CrossRef]
  37. Ren, G.; Yang, P.; Cui, J.; Gao, Y.; Yin, C.; Bai, Y.; Zhao, D.; Chang, J. Multiomics analyses of two sorghum cultivars reveal the molecular mechanism of salt tolerance. Front. Plant Sci. 2022, 13, 886805. [Google Scholar] [CrossRef]
  38. Ma, W.; Kim, J.K.; Jia, C.; Yin, F.; Kim, H.J.; Akram, W.; Hu, X.; Li, X. Comparative transcriptome and metabolic profiling analysis of buckwheat (Fagopyrum tataricum (L.) Gaertn.) under salinity stress. Metabolites 2019, 9, 225. [Google Scholar] [CrossRef]
  39. Abdallah, S.B.; Aung, B.; Amyot, L.; Lalin, I.; Lachal, M.; Karray-Bouraou, N.; Hannoufa, A. Salt stress (NaCl) affects plant growth and branch pathways of carotenoid and flavonoid biosyntheses in Solanum nigrum. Acta Physiol. Plant 2016, 38, 72. [Google Scholar] [CrossRef]
  40. Ma, S.; Lv, L.; Meng, C.; Zhang, C.; Li, Y. Integrative analysis of the metabolome and transcriptome of Sorghum bicolor reveals dynamic changes in flavonoids accumulation under saline-alkali stress. J. Agric. Food Chem. 2020, 68, 14781–14789. [Google Scholar] [CrossRef]
  41. Li, X.; Jin, L.; Pan, X.; Yang, L.; Guo, W. Proteins expression and metabolite profile insight into phenolic biosynthesis during highbush blueberry fruit maturation. Food Chem. 2019, 290, 216–228. [Google Scholar] [CrossRef] [PubMed]
  42. Yang, B.; Song, Y.; Li, Y.; Wang, X.; Guo, Q.; Zhou, L.; Zhang, Y.; Zhang, C. Key genes for phenylpropanoid metabolite biosynthesis during half-highbush blueberry (Vaccinium angustifolium × Vaccinium corymbosum) fruit development. J. Berry Res. 2022, 12, 297–311. [Google Scholar] [CrossRef]
  43. Pi, E.; Zhu, C.; Fan, W.; Huang, Y.; Qu, L.; Li, Y.; Zhao, Q.; Ding, F.; Qiu, L.; Wang, H.; et al. Quantitative phosphoproteomic and metabolomic analyses reveal GmMYB173 optimizes flavonoid metabolism in soybean under salt stress. Mol. Cell. Proteom. 2018, 17, 1209–1224. [Google Scholar] [CrossRef] [PubMed]
  44. Wang, F.; Zhu, H.; Kong, W.; Peng, R.; Liu, Q.; Yao, Q. The Antirrhinum AmDEL gene enhances flavonoids accumulation and salt and drought tolerance in transgenic Arabidopsis. Planta 2016, 244, 59–73. [Google Scholar] [CrossRef] [PubMed]
  45. Bunea, A.; Rugină, D.; Sconţa, Z.; Pop, R.M.; Pintea, A.; Socaciu, C.; Tăbăran, F.; Grootaert, C.; Struijs, K.; VanCamp, J. Anthocyanin determination in blueberry extracts from various cultivars and their antiproliferative and apoptotic properties in B16-F10 metastatic murine melanoma cells. Phytochemistry 2013, 95, 436–444. [Google Scholar] [CrossRef]
  46. Müller, D.; Schantz, M.; Richling, E. High performance liquid chromatography analysis of anthocyanins in bilberries (Vaccinium myrtillus L.), blueberries (Vaccinium corymbosum L.), and corresponding juices. J. Food Sci. 2012, 77, C340–C345. [Google Scholar] [CrossRef]
  47. Gavrilova, V.; Kajdzanoska, M.; Gjamovski, V.; Stefova, M. Separation, characterization and quantification of phenolic compounds in blueberries and red and black currants by HPLC-DAD-ESI-MSn. J. Agric. Food Chem. 2011, 59, 4009–4018. [Google Scholar] [CrossRef]
  48. Naing, A.H.; Kim, C.K. Abiotic stress-induced anthocyanins in plants: Their role in tolerance to abiotic stresses. Physiol. Plant 2021, 172, 1711–1723. [Google Scholar] [CrossRef]
  49. Sun, M.; Feng, X.; Gao, J.; Peng, R.; Yao, Q.; Wang, L. VvMYBA6 in the promotion of anthocyanin biosynthesis and salt tolerance in transgenic Arabidopsis. Plant Biotechnol. Rep. 2017, 11, 299–314. [Google Scholar] [CrossRef]
  50. Kim, J.; Lee, W.J.; Vu, T.T.; Jeong, C.Y.; Hong, S.W.; Lee, H. High accumulation of anthocyanins via the ectopic expression of AtDFR confers significant salt stress tolerance in Brassica napus L. Plant Cell Rep. 2017, 36, 1215–1224. [Google Scholar] [CrossRef]
  51. Jia, C.; Guo, B.; Wang, B.; Li, X.; Yang, T.; Li, N.; Wang, J.; Yu, Q. Integrated metabolomic and transcriptomic analysis reveals the role of phenylpropanoid biosynthesis pathway in tomato roots during salt stress. Front. Plant Sci. 2022, 13, 1023696. [Google Scholar] [CrossRef] [PubMed]
  52. Wang, A.; Wang, L.; Liu, K.; Liang, K.; Yang, S.; Cao, Y.; Zhang, L. Comparative transcriptome profiling reveals the defense pathways and mechanisms in the leaves and roots of blueberry to drought stress. Fruit Res. 2022, 2, 18. [Google Scholar] [CrossRef]
  53. Zhang, F.; Ji, S.; Wei, B.; Cheng, S.; Wang, Y.; Hao, J.; Wang, S.; Zhou, Q. Transcriptome analysis of postharvest blueberries (Vaccinium corymbosum ‘Duke’) in response to cold stress. BMC Plant Biol. 2020, 20, 80. [Google Scholar] [CrossRef] [PubMed]
  54. Li, C.; Qi, Y.; Zhao, C.; Wang, X.; Zhang, Q. Transcriptome profiling of the salt stress response in the leaves and roots of halophytic Eutrema salsugineum. Front. Genet. 2021, 12, 770742. [Google Scholar] [CrossRef]
  55. Lavhale, S.G.; Kalunke, R.M.; Giri, A.P. Structural, functional and evolutionary diversity of 4-coumarate-CoA ligase in plants. Planta. 2018, 248, 1063–1078. [Google Scholar] [CrossRef]
  56. Lavhale, S.G.; Joshi, R.S.; Kumar, Y.; Giri, A.P. Functional insights into two Ocimum kilimandscharicum 4-coumarate-CoA ligases involved in phenylpropanoid biosynthesis. Int. J. Biol. Macromol. 2021, 181, 202–210. [Google Scholar] [CrossRef]
  57. Gao, S.; Liu, X.; Ni, R.; Fu, J.; Tan, H.; Cheng, A.; Lou, H. Molecular cloning and functional analysis of 4-coumarate: CoA ligases from Marchantia paleacea and their roles in lignin and flavanone biosynthesis. PLoS ONE 2024, 19, e0296079. [Google Scholar] [CrossRef]
  58. Ma, J.; Zuo, D.; Zhang, X.; Li, H.; Ye, H.; Zhang, N.; Li, M.; Dang, M.; Geng, F.; Zhou, H.; et al. Genome-wide identification analysis of the 4-Coumarate: CoA ligase (4CL) gene family expression profiles in Juglans regia and its wild relatives J. Mandshurica resistance and salt stress. BMC Plant Biol. 2024, 24, 211. [Google Scholar] [CrossRef]
  59. Zhang, C.; Ma, T.; Luo, W.; Xu, J.; Liu, J.; Wan, D. Identification of 4CL genes in desert poplars and their changes in expression in response to salt stress. Genes 2015, 6, 901–917. [Google Scholar] [CrossRef]
  60. Wang, J.; Wang, X.; Zhao, S.; Xi, X.; Feng, J.; Han, R. Brachypodium BdCHS is a homolog of Arabidopsis AtCHS involved in the synthesis of flavonoids and lateral root development. Protoplasma 2023, 260, 999–1003. [Google Scholar] [CrossRef]
  61. Huang, H.; Hu, K.; Han, K.; Xiang, Q.; Dai, S. Flower colour modification of chrysanthemum by suppression of F3′H and overexpression of the exogenous Senecio cruentus F3′5′H gene. PLoS ONE 2013, 8, e74395. [Google Scholar] [CrossRef]
  62. Baba, S.A.; Ashraf, N. Functional characterization of flavonoid 3′-hydroxylase, CsF3′H, from Crocus sativus L: Insights into substrate specificity and role in abiotic stress. Arch. Biochem. Biophys. 2019, 667, 70–78. [Google Scholar] [CrossRef] [PubMed]
  63. Ma, L.; Jia, W.; Duan, Q.; Du, W.; Li, X.; Cui, G.; Wang, X.; Wang, J. Heterologous expression of Platycodon grandiflorus PgF3′5′H modifies flower color pigmentation in tobacco. Genes 2023, 14, 1920. [Google Scholar] [CrossRef] [PubMed]
  64. Isıyel, M.; İlhan, E.; Kasapoğlu, A.G.; Muslu, S.; Öner, B.M.; Aygören, A.S.; Yiğider, E.; Aydın, M.; Yıldırım, E. Identification and characterization of Phaseolus vulgaris CHS genes in response to salt and drought stress. Genet. Resour. Crop Evol. 2024, 9, 189. [Google Scholar] [CrossRef]
  65. Wang, J.; Lan, Z.; Wang, H.; Xu, C.; Zhou, Z.; Cao, J.; Liu, Y.; Sun, Z.; Mu, D.; Han, J.; et al. Genome-wide identification of chalcone synthase (CHS) family members and their expression patterns at the sprouting stage of common bean (Phaseolus vulgaris) under abiotic stress. Sci. Hortic. 2024, 334, 113309. [Google Scholar] [CrossRef]
  66. Martinez, V.; Mestre, T.C.; Rubio, F.; Girones-Vilaplana, A.; Moreno, D.A.; Mittler, R.; Rivero, R.M. Accumulation of flavonols over hydroxycinnamic acids favors oxidative damage protection under abiotic stress. Front. Plant Sci. 2016, 7, 838. [Google Scholar] [CrossRef]
  67. Wang, Y.; Jiang, W.; Li, C.; Wang, Z.; Lu, C.; Cheng, J.; Wei, S.; Yang, J.; Yang, Q. Integrated transcriptomic and metabolomic analyses elucidate the mechanism of flavonoid biosynthesis in the regulation of mulberry seed germination under salt stress. BMC Plant Biol. 2024, 24, 132. [Google Scholar] [CrossRef]
  68. Sui, D.; Wang, B.; El-Kassaby, Y.A.; Wang, L. Integration of physiological, transcriptomic, and metabolomic analyses reveal molecular mechanisms of salt stress in Maclura tricuspidata. Plants 2024, 13, 397. [Google Scholar] [CrossRef]
  69. Saad, K.R.; Kumar, G.; Mudliar, S.N.; Giridhar, P.; Shetty, N.P. Salt stress-induced anthocyanin biosynthesis genes and MATE transporter involved in anthocyanin accumulation in Daucus carota cell culture. ACS Omega 2021, 6, 24502–24514. [Google Scholar] [CrossRef]
  70. Li, P.; Li, Y.; Zhang, F.; Zhang, G.; Jiang, X.; Yu, H.; Hou, B. The Arabidopsis UDP-glycosyltransferases UGT79B2 and UGT79B3, contribute to cold, salt and drought stress tolerance via modulating anthocyanin accumulation. Plant J. 2017, 89, 85–103. [Google Scholar] [CrossRef]
  71. Singh, K.B.; Foley, R.C.; Oñate-Sánchez, L. Transcription factors in plant defense and stress responses. Curr. Opin. Plant Biol. 2002, 5, 430–436. [Google Scholar] [CrossRef] [PubMed]
  72. Bokolia, M.; Kumar, A.; Singh, B. Plant tolerance to salinity stress: Regulating transcription factors and their functional role in the cellular transcriptional network. Gene Rep. 2024, 34, 101873. [Google Scholar] [CrossRef]
  73. Golldack, D.; Lüking, I.; Yang, O. Plant tolerance to drought and salinity: Stress regulating transcription factors and their functional significance in the cellular transcriptional network. Plant Cell Rep. 2021, 30, 1383–1391. [Google Scholar] [CrossRef] [PubMed]
  74. Wang, Y.; Xia, D.; Li, W.; Cao, X.; Ma, F.; Wang, Q.; Zhan, X.; Hu, T. Overexpression of a tomato AP2/ERF transcription factor SlERF.B1 increases sensitivity to salt and drought stresses. Sci. Hortic. 2022, 304, 111332. [Google Scholar] [CrossRef]
  75. Pan, Y.; Seymour, G.B.; Lu, C.; Hu, Z.; Chen, X.; Chen, G. An ethylene response factor (ERF5) promoting adaptation to drought and salt tolerance in tomato. Plant Cell Rep. 2012, 31, 349–360. [Google Scholar] [CrossRef]
  76. Schmidt, R.; Mieulet, D.; Hubberten, H.M.; Obata, T.; Hoefgen, R.; Fernie, A.R.; Fisahn, J.; San Segundo, B.; Guiderdoni, E.; Schippers, J.H.; et al. Salt-responsive ERF1 regulates reactive oxygen species-dependent signaling during the initial response to salt stress in rice. Plant Cell 2013, 25, 2115–2131. [Google Scholar] [CrossRef]
  77. Guo, T.; Wang, S.; Fan, B.; Zou, S.; Chen, S.; Liu, W.; Wang, S.; Ai, L.; Han, L. Overexpression of the Zoysia japonica ZjABR1/ERF10 regulates plant growth and salt tolerance in transgenic Oryza sativa. Environ. Exp. Bot. 2023, 206, 105117. [Google Scholar] [CrossRef]
  78. Zhang, Z.; Fang, J.; Zhang, L.; Jin, H.; Fang, S. Genome-wide identification of bHLH transcription factors and their response to salt stress in Cyclocarya paliurus. Front. Plant Sci. 2023, 14, 1117246. [Google Scholar] [CrossRef]
  79. Ye, D.; Liu, J.; Tian, X.; Wen, X.; Zhang, Y.; Zhang, X.; Sun, G.; Xia, H.; Liang, D. Genome-wide identification of bHLH gene family and screening of candidate gene in response to salt stress in kiwifruit. Environ. Exp. Bot. 2024, 222, 105774. [Google Scholar] [CrossRef]
  80. Wang, X.; Niu, Y.; Zheng, Y. Multiple functions of MYB transcription factors in abiotic stress responses. Int. J. Mol. Sci. 2021, 22, 6125. [Google Scholar] [CrossRef]
  81. Jiang, L.; Tian, X.; Li, S.; Fu, Y.; Xu, J.; Wang, G. The AabHLH35 transcription factor identified from Anthurium andraeanum is involved in cold and drought tolerance. Plants 2019, 8, 216. [Google Scholar] [CrossRef] [PubMed]
  82. Liu, D.; Li, Y.; Zhou, Z.; Xiang, X.; Liu, X.; Wang, J.; Hu, Z.; Xiang, S.; Li, W.; Xiao, Q.; et al. Tobacco transcription factor bHLH123 improves salt tolerance by activating NADPH oxidase NtRbohE expression. Plant Physiol. 2021, 186, 1706–1720. [Google Scholar] [CrossRef] [PubMed]
  83. Zhao, X.; Wang, Q.; Yan, C.; Sun, Q.; Wang, J.; Li, C.; Yuan, C.; Mou, Y.; Shan, S. The bHLH transcription factor AhbHLH121 improves salt tolerance in peanut. Int. J. Biol. Macromol. 2024, 256, 128492. [Google Scholar] [CrossRef]
  84. Fang, L.; Wang, Z.; Su, L.; Gong, L.; Xin, H. Vitis Myb14 confer cold and drought tolerance by activating lipid transfer protein genes expression and reactive oxygen species scavenge. Gene 2024, 890, 147792. [Google Scholar] [CrossRef] [PubMed]
  85. Denekamp, M.; Smeekens, S.C. Integration of wounding and osmotic stress signals determines the expression of the AtMYB102 transcription factor gene. Plant Physiol. 2003, 132, 1415–1423. [Google Scholar] [CrossRef] [PubMed]
  86. Laity, J.H.; Lee, B.M.; Wright, P.E. Zinc finger proteins: New insights into structural and functional diversity. Curr. Opin. Struct. Biol. 2001, 11, 39–46. [Google Scholar] [CrossRef]
  87. Hagymasi, A.T.; Dempsey, J.P.; Srivastava, P.K. Heat-shock proteins. Curr. Protoc. 2022, 2, e592. [Google Scholar] [CrossRef]
  88. Guo, L.; Li, J.; He, J.; Liu, H.; Zhang, H. A class I cytosolic HSP20 of rice enhances heat and salt tolerance in different organisms. Sci. Rep. 2020, 10, 1383. [Google Scholar] [CrossRef]
  89. Vogel, J.T.; Zarka, D.G.; Van Buskirk, H.A.; Fowler, S.G.; Thomashow, M.F. Roles of the CBF2 and ZAT12 transcription factors in configuring the low temperature transcriptome of Arabidopsis. Plant J. 2005, 41, 195–211. [Google Scholar] [CrossRef]
  90. Rizhsky, L.; Davletova, S.; Liang, H.; Mittler, R. The zinc-finger protein Zat12 is required for cytosolic ascorbate peroxidase 1 expression during oxidative stress in Arabidopsis. J. Biol. Chem. 2004, 279, 11736–11743. [Google Scholar] [CrossRef]
  91. Davletova, S.; Schlauch, K.; Coutu, J.; Mittler, R. The zinc-finger Protein Zat12 plays a central role in reactive oxygen and abiotic stress signaling in Arabidopsis. Plant Physiol. 2005, 139, 847–856. [Google Scholar] [CrossRef] [PubMed]
  92. Toda, K.; Yang, D.; Yamanaka, N.; Watanabe, S.; Harada, K.; Takahashi, R. A single-base deletion in soybean flavonoid 3′-hydroxylase gene is associated with gray pubescence color. Plant Mol. Biol. 2002, 50, 187–196. [Google Scholar] [CrossRef] [PubMed]
  93. Zhang, C.; Guo, Q.; Liu, Y.; Liu, H.; Wang, F.; Jia, C. Molecular cloning and functional analysis of a flavanone 3-hydroxylase gene from blueberry. J. Hortic. Sci. Biotechnol. 2017, 92, 57–64. [Google Scholar] [CrossRef]
  94. Sun, W.; Zhou, N.; Feng, C.; Sun, S.; Tang, M.; Tang, X.; Ju, Z.; Yi, Y. Functional analysis of a dihydroflavonol 4-reductase gene in Ophiorrhiza japonica (OjDFR1) reveals its role in the regulation of anthocyanin. PeerJ 2021, 9, e12323. [Google Scholar] [CrossRef] [PubMed]
  95. Vainio, J.; Mattila, S.; Abdou, S.M.; Sipari, N.; Teeri, T.H. Petunia dihydroflavonol 4-reductase is only a few amino acids away from producing orange pelargonidin-based anthocyanins. Front. Plant Sci. 2023, 14, 1227219. [Google Scholar] [CrossRef] [PubMed]
  96. Nguyen, H.M.; Putterill, J.; Dare, A.P.; Plunkett, B.J.; Cooney, J.; Peng, Y.; Souleyre, E.J.F.; Albert, N.W.; Espley, R.V.; Günther, C.S. Two genes, ANS and UFGT2, from Vaccinium spp. are key steps for modulating anthocyanin production. Front. Plant Sci. 2023, 14, 1082246. [Google Scholar] [CrossRef]
  97. Zhang, C.; Liu, H.; Jia, C.; Liu, Y.; Wang, F.; Wang, J. Cloning, characterization and functional analysis of a flavonol synthase from Vaccinium corymbosum. Trees-Struct. Funct. 2016, 30, 1595–1605. [Google Scholar] [CrossRef]
  98. Vu, T.T.; Jeong, C.Y.; Nguyen, H.N.; Lee, D.; Lee, S.A.; Kim, J.H.; Hong, S.W.; Lee, H. Characterization of Brassica napus Flavonol Synthase Involved in Flavonol Biosynthesis in Brassica napus L. J. Agric. Food Chem. 2015, 63, 7819–7829. [Google Scholar] [CrossRef]
  99. Wang, P.; Zhang, L.; Jiang, X.; Dai, X.; Xu, L.; Li, T.; Xing, D.; Li, Y.; Li, M.; Gao, L.; et al. Evolutionary and functional characterization of leucoanthocyanidin reductases from Camellia sinensis. Planta 2018, 247, 139–154. [Google Scholar] [CrossRef]
Figure 1. Metabolomic substances in blueberry leaves in response to salt stress identified by non-targeted metabolomic profiling in positive and negative ion mode. (a) Number of metabolomic substances in positive (Pos) and negative (Neg) ion modes. (b) Classification of the detected metabolomic substances.
Horticulturae 10 01084 g001
Figure 2. Differentially accumulated metabolites (DAMs) in blueberry leaves in response to salt stress identified by non-targeted metabolomic profiling in positive and negative ion mode. (a) Number of DAMs detected in positive (Pos) and negative (Neg) ion mode and total number of DAMs. (b) Venn diagram showing the extent of overlap between DAMs across pairwise comparisons. Pink, DAMs for 6 h vs. 0 h; yellow, DAMs for 12 h vs. 0 h; green, DAMs for 24 h vs. 0 h; blue, DAMs for 48 h vs. 0 h. (c) Classification of the DAMs.
Horticulturae 10 01084 g002
Figure 3. Enriched KEGG pathways of differentially accumulated metabolites (DAMs) in blueberry leaves in response to salt stress revealed by non-targeted metabolomic profiling. (a) Venn diagram of significantly enriched KEGG pathways of the DAMs. Pink, DAMs for 0 h vs. 6 h; yellow, DAMs for 0 h vs. 12 h; green, DAMs for 0 h vs. 24 h; blue, DAMs for 0 h vs. 48 h. (b) The number of significantly enriched KEGG pathways among the DAMs. (c) The top 20 enriched KEGG pathways among the DAMs, and rich factors in different comparison groups.
Horticulturae 10 01084 g003aHorticulturae 10 01084 g003b
Figure 4. Differentially expressed genes (DEGs) in blueberry leaves in response to salt stress identified by transcriptome deep sequencing (RNA-seq). (a) Number of DEGs in response to salt stress. Up-regulated, upregulated DEGs; Down-regulated, downregulated DEGs; Total, total DEGs. (b) Venn diagram showing the extent of overlap between DEGs across pairwise comparisons. Pink, DEGs for 0 h vs. 6 h; yellow, DEGs for 0 h vs. 12 h; green, DEGs for 0 h vs. 24 h; blue, DEGs for 0 h vs. 48 h.
Horticulturae 10 01084 g004
Figure 5. GO and KEGG pathway enrichment analysis of differentially expressed genes (DEGs) in blueberry leaves in response to salt stress identified by transcriptome deep sequencing (RNA-seq). (a) Venn diagrams of GO terms and significantly enriched KEGG pathways among the DEGs. Pink, DEGs for 0 h vs. 6 h; yellow, DEGs for 0 h vs. 12 h; green, DEGs for 0 h vs. 24 h; blue, DEGs for 0 h vs. 48 h. (b) GO terms of DEGs in different comparison groups. Green bar, biological process; blue bar, molecular function; red bar, cellular component. (c) The top 20 enriched KEGG pathways of DEGs in different comparison groups.
Horticulturae 10 01084 g005aHorticulturae 10 01084 g005b
Figure 6. Differentially expressed transcription factors (TF) in blueberry leaves in response to salt stress identified by transcriptome deep sequencing (RNA-seq).
Horticulturae 10 01084 g006
Figure 7. Phenylpropanoid and flavonoid KEGG biosynthetic pathways in blueberry leaves under salt stress. Red and magenta fonts indicate upregulated and downregulated metabolites or genes, respectively; blue fonts indicate both upregulated and downregulated metabolites or genes; and black fonts indicate no significant changes in response to salt stress. Heatmaps show the expression of DEGs or the accumulation of DAMs. Colored bars on the upper right indicate low expression (pink) or high expression (blue) of differentially accumulated metabolites (DAM) based on log10 (peak intensity). Colored bars on the right indicate low expression (green) or high expression (red) of differentially expressed genes (DEGs) based on scale normalized log10 (FPKM). PAL, phenylalanine ammonia-lyase; C4H, cinnamate 4-hydroxylase; 4CL, 4-coumarate CoA ligase; HCT, shikimate O-hydroxycinnamoyltransferase; CSE, caffeoyl shikimate esterase; COMT, caffeic acid 3-O-methyltransferase; CHS, chalcone synthase; CHI, chalcone isomerase; F3H, flavanone 3-hydroxylase; F3′H, flavonoid 3′-hydroxylase; F3′5′H, flavonoid 3′5′-hydroxylase; FLS, flavonol synthase; DFR, dihydroflavonol 4-reductase; ANS, anthocyanidin synthase; ANR, anthocyanidin reductase; LAR, leucoanthocyanidin reductase; UFGT, UDP-glucose flavonoid 3-O-glucosyl transferase; UGT, UDP-glycosyltransferase.
Horticulturae 10 01084 g007
Table 1. The upregulated transcription factors according to fold change ≥4 and p-value <0.05 during salt stress compared to the 0 h control samples.
Gene IDFold Change
Gene NameS6_vs_S0S12_vs_S0S24_vs_S0S48_vs_S0
VaccDscaff3-augustus-gene-84.42ERF1144.9249.8329.96411.758
VaccDscaff13-augustus-gene-7.21ABR15.8427.9669.1827.754
VaccDscaff39-processed-gene-249.7ERF46.94211.2689.9210.268
VaccDscaff38-augustus-gene-106.21ERF1106.9869.47610.99410.43
VaccDscaff21-processed-gene-16.2ERF0115.7149.8025.0246.278
VaccDscaff30-processed-gene-33.28HSP206.7369.2586.1828.018
VaccDscaff99-augustus-gene-4.57bHLH354.9307.9464.8684.190
VaccDscaff10-augustus-gene-14.13bHLH1239.7568.9867.57810.622
VaccDscaff9-augustus-gene-346.25bHLH1625.1089.736.7687.444
VaccDscaff9-augustus-gene-136.29MYB1026.4527.5466.2767.056
VaccDscaff3-augustus-gene-219.29MYB136.26210.0388.4126.076
VaccDscaff43-augustus-gene-40.46MYB145.0665.7007.136.102
VaccDscaff21-processed-gene-155.6ZAT127.0629.6606.6328.080
Table 2. Pearson’s correlation coefficients (r) between differentially accumulated metabolites (DAMs) and differentially expressed genes (DEGs) from the flavonoid metabolite pathway in response to salt stress.
FlavonolFlavonol GlycosidesFlavanProanthocyanidinAnthocyanindinAnthocyanin
QuePinMyr-GalKae-AraKae-XylQue-Neo-RhaNicEpiPro C2CyaCya-AraCya-SamCya-GluCya-a-AraDel-Glu-ChlCya-Rha
PAL-3----------−0.895 *--------------------
PAL-4----------−0.902 *--------−0.899 *----------
PAL-5----------−0.886 *--------−0.894 *----------
C4H----------−0.878 *------−0.912 *−0.967 **--0.944 *------
4CL1----------−0.989 **--0.909 *0.907 *--−0.928 *----------
4CL50.932 *0.930 *----------------------------
4CL7------------------−0.949 *−0.903 *--−0.942 *------
4CL9----------0.954 *----−0.893 *--------------
CHS-2----------−0.911 *------−0.885 *−0.898 *----------
F3′5′H-1------------------−0.898 *----0.879 *------
F3′5′H-2----------------------------0.890 *--
F3′5′H-3--------−0.947 *0.982 **−0.947 *−0.894 *--------------−0.892 *
F3′5′H-4----−0.919 *--−0.928 *0.965 **−0.941 *------0.893 *----------
F3′5′H-5--------−0.892 *0.942 *−0.921 *------0.900 *0.936 *--------
F3′5′H-7--------------0.884 *----------------
FLS-1----−0.942 *--------------------------
FLS-2------−0.892 *−0.944 *0.907 *−0.921 *−0.946 *−0.881 *------------−0.909 *
FLS-3−0.923 *−0.929 *----−0.895 *0.906 *−0.938 *------------------
ANR-1----−0.904 *--------------0.900 *----------
ANR-2--−0.903 *----−0.960 **0.909 *−0.985 **−0.885 *--------------−0.899 *
ANR-3------−0.934 *−0.979 **--−0.983 **−0.943 *------−0.915 *------−0.949 *
LAR-1----−0.973 **------−0.883 *------------------
LAR-3------0.971 **0.984 *−0.946 *0.946 *0.990 **0.969 **----0.882 *------0.978 *
DFR--0.954 *--------0.895 *------------------
UFGT-1--------------------------0.879 *----
UFGT-3------−0.977 *−0.996 **0.936 *0.979 **−0.968 **−0.945 *----−0.880 *------−0.985 **
UGT75C1----0.990 **--------------------------
Que, quercetin; Pin, pinoquercetin; Myr-Gal, myricetin-3-o-galactoside; Kae-Ara, kaempferol 3-O-arabinoside; Kae-Xyl, kaempferol 3-O -beta-D -xyloside; Que-Neo-Rha, quercetin-3-neohesperidoside-7-rhamnoside; Nic, nicotiflorin; Epi, epicatechin; Pro C2, prodelphinidin C2; Cya, cyanidin; Cya-Ara, Cyanidin 3-arabinoside; Cya-Sam, cyanidin 3-O-beta-D-sambubioside; Cya-Glu, cyanidin 3-O-glucoside; Cya-a-Ara, cyanidin-3-O-alpha-arabinoside; Del-Glu-Chl, delphinidin-3-O-glucoside chloride, Cya-Rha, and cyanidin-3-o-rhamnoside. * Correlation significant at the 0.05 level; ** Correlation significant at the 0.01 level; -- The correlation is not significant.
Disclaimer/Publisher’s Note: The statements, opinions and data contained in all publications are solely those of the individual author(s) and contributor(s) and not of MDPI and/or the editor(s). MDPI and/or the editor(s) disclaim responsibility for any injury to people or property resulting from any ideas, methods, instructions or products referred to in the content.

